Article

Study of Defect-Induced Chemical Modifications in Spinel Zinc-Ferrites Nanostructures by In-Depth XPS Investigation

by
Promod Kumar
1,*,
Mohan Chandra Mathpal
2,
Gajendra Kumar Inwati
1,
Sanjay Kumar
3,
Mart-Mari Duvenhage
1,
Wiets Daniel Roos
1 and
Hendrik C. Swart
1,*
1
Department of Physics, University of the Free State, Bloemfontein 9300, South Africa
2
Instituto de Física, Pontificia Universidad Católica de Chile, Santiago 7820436, Chile
3
Department of Physics and Materials Science, Jaypee University of Information Technology, Waknaghat, Solan 173234, Himachal Pradesh, India
*
Authors to whom correspondence should be addressed.
Magnetochemistry 2023, 9(1), 20; https://doi.org/10.3390/magnetochemistry9010020
Submission received: 25 November 2022 / Revised: 14 December 2022 / Accepted: 30 December 2022 / Published: 3 January 2023
(This article belongs to the Special Issue New Advances in Magnetic–Plasmonic Nanostructured Materials)

Abstract

:
Spinel zinc ferrite nanomaterials with exceptional physiochemical properties are potential candidates for various applications in the energy and environmental fields. Their properties can be tailored using several methods to widen their applications. The chemical combustion approach was followed to prepare the spinel zinc ferrite nanomaterials, which were then subjected to thermal treatment at a fixed temperature. Thermal heat treatment at a fixed temperature was used to evaluate the phase and morphological characteristics of the prepared spinel zinc−ferrite nanocomposites. Various techniques were employed to examine the samples, including X-ray diffraction (XRD), scanning electron microscopy (SEM), transmission electron microscopy (TEM), Raman spectroscopy, and X-ray photoelectron spectroscopy (XPS). XPS and X-ray−induced Auger electron spectroscopy were used to extensively examine the surface characteristics of the zinc−ferrite. To study the actual chemical states of the synthesized spinel zinc ferrite nanomaterials and the defects created during the thermal treatment, an extensive investigation of the kinetic energy of the X-ray−induced Zn L3M45M45 and Fe L3M45M45 was conducted. Finally, a detailed analysis of the Wagner plot using the modified Auger parameter was performed to verify the exact chemical states of Zn and Fe. Thus, the findings of the investigation show that XPS is a promising and powerful technique to study the composition and chemical states of spinel zinc ferrites, providing an understanding of changes in their properties for functional applications.

1. Introduction

Nanoscopic spinel ferrites are some of the most significant catalysts among the magnetic substances studied, due to their unique magnetic, magneto−optical, and magneto-resistive characteristics in the fields of material science and nanotechnology [1,2]. Ferrites (magnetic nanoparticles (NPs)) possess distinct superparamagnetic, higher coercivity, and magnetic susceptibility values, with a lower Curie temperature. Therefore, the construction of modified ferrite nanostructures has been actively promoted in the fields of catalysis, spintronic devices, magnetic fluids, magneto−optical and biomedical applications due to their adjustable physical and chemical properties [2,3]. It is well reported that the pure ferrites (Iron oxide, Fe2O3) have several crystalline configurations, such as α−Fe2O3 (Hematite), β−Fe2O3, epsilon−Fe2O3 and Ƴ−Fe2O3 (maghemite) [1,4]. These ferrite structures were broadly explored for optoelectronic, photovoltaic, supercapacitor, and biomedical applications due to their exceptional catalytic, non−toxic, chemically stable, and eco−friendly behavior among transitional metal−oxides. However, modified metal−doped ferrites (Mn+F3O4/Fe2O4, M = Zn2+, Co2+, Ni2+, Mn2+, etc.) spinels were discovered as an extraordinary magnetic nanocatalyst for boosting the catalytic and physicochemical performances by changing the electronic band structures and surface sites [2,5,6]. Ferrites with a chemical composition of M2+Fe3O4/Fe2O3 were widely engineered at the nanoscale in order to tune their bandgap energies and surface morphologies via the stoichiometric doping of transitional metal ions. Several studies have demonstrated that the microstructures and crystal anisotropy can be altered by the doping of divalent or trivalent ions in the form of bulk and/or surface imperfections [7,8]. Defect−induced morphological research, especially in the ferrites domain has a large interest in achieving large magnetorheological functionalities [9,10]. To improve the chemical and magnetic potential of the ferrites, divalent cations such as Zn2+ were introduced for tuning the electronic bands and surface sites by creating multiple defects level and bulk imperfections into the Fe3O4/Fe2O3 crystalline lattices. The Zn2+ ion was studied as the most suitable dopant to alter the electrochemical properties of the ferrite materials because of its electronic configuration and less toxic nature compared to other divalent atoms, such as Co2+, Ni2+, and Mn2+ [2,6]. It is well accepted that experimental conditions have an important impact on defects formations/concentrations and growth rate inside the host nanostructures, which affect the structural, optical, and spectral characteristics [7,9]. Crystalline ferromagnetic materials at a nanoscale regime can be manufactured using a variety of techniques, including solution chemical reactions such as co−precipitation [11], hydrothermal [4], sol–gel [12], and combustion techniques. However, the essential benefit of the combustion −technique is that it produces nano−ranged crystalline powder, defects as oxygen vacancies (Vo), interstitial metal ions, and a higher yield of the product at a shorter chemical reaction time [10,13]. For example, the size of the crystallites steadily increased from 12.6 nm for pure ZnFe2O4 to 21.17 nm and for 75% Mg−doped ZnFe2O4 using the temperature−induced combustion method [14]. The magnetic quality, saturation magnetization (Ms), and remanent magnetization (Mr) increased from 19 and 8 emu/g for pure ZnFe2O4 to 45 to and emu/g, for 50% Mg−doped ZnFe2O4 prepared by a combustion technique. The magnetic features of the doped ferrites were found to be changed by the insertion of the dopant into the octahedral and tetrahedral sites according to their crystal site preferences. Nanostructured Zn−Fe mixed oxides were reported by Gajendra Kumar Pradhan and a co−worker using a simple solution−combustion method [15]. The mixed phase of Fe2O4, ZnO, and ZnFe2O4 were formed with the increased level of Fe and Zn contents during combustion. Subsequently, a dopant mixed phase and metal−oxides/hydroxides form during the chemical synthesis. For morphological and spectral analysis, the fundamental techniques were used [16,17].
Over the past years, advanced characterization techniques such as X-ray diffraction (XRD), scanning electron microscopy (SEM), transmission electron microscopy (TEM), X-ray photoelectron spectroscopy (XPS), and scanning probe microscopy (SPM) were widely used to determine the structural, morphological, and surface characteristics of the metamaterials in the fields of nanoscience and materials engineering [17,18]. It is well studied that the Fe2+/Fe3+ ionic state has a crucial impact on the catalytic functions when it is employed as a host, as do pure ferrite materials. Among these, XPS and TOF−SIMS are largely applied to determine the chemical composition, oxidation states, and growth mechanism on the surface [18].
In this regard, Auger electron spectroscopy (AES) is considered one of the most reliable surface techniques to study the elemental confirmations and chemical states of the nanomaterials up to a few nm depth resolution [19]. In the present work, we prepared pure ferrite (iron−oxides) and Zn−doped ferrites using a simple combustion technique. The impact of heat treatments on the crystal phase of the doped ferrites, defects growth in bulk, and surface were characterized using various techniques. It is very difficult to recognize the multivalent Fe ions in the case of Zn−doped ferrite nanocomposites, which generally occur due to mixed Fe2O3: Zn, ZnFe2O4, ZnO, and hydroxide forms.
Therefore, the chemical states of the undoped and doped Fe2O3 with Zn content were evaluated using XPS. Specifically, the Fe2p3/2 and Fe1/2 photoelectron binding energy and Fe L3M45M45 Auger electron kinetic energies were assigned to the chemical states of the prepared Fe2O3 sample. Similarly, the Zn2p3/2 and Zn1/2 photoelectron binding energy and Zn L3M45M45 Auger electron kinetic energies were assigned to the chemical states of the Zn. The Auger parameters and the binding energies of the prepared samples were calculated and used to generate Wagner plots using modified auger parameters (MAP) that were subsequently used to evaluate the precise chemical states of the prepared samples. MAP is defined as the sum of the binding energy of the photoemitted electron and the kinetic energy of the Auger electron, in other words, it is the energy difference between the photoemitted and auger electrons. Even though there is a limited report on the Wagner plot for the Fe2O3 phase of Fe. A detailed analysis based on the Fe L3M45M45 and Zn L3M45M45 spectral energy dispersion was employed [20]. The FeL3M45M45 and ZnL3M45M45 Auger lines were fitted by applying Gaussian fits for particular elements in their existing magnetite and hematite phases along with the mixed ZnFe2O3. Furthermore, an advanced effort was utilised to evaluate the Wagner plots for the possible Fe3O4:Zn, pure Fe3O4/Fe2O4, and ZnO with their possible hydroxide derivatives. A Wagner profile measured the kinetic energies of a quantified Auger peak with the binding energies of a particular photoelectron peak for analysed nanocomposites having similar chemical elements/compositions [20]. Wagner plots are discussed in depth via calculating the modified Auger parameter (MAP) values, which are a diagonal sum of the binding and kinetic energies of the respective Fe3O4:Zn, pure Fe3O4, and ZnO. In the present study, a Wagner Plot provides clear evidence of pure ferrites and Zn−doped ferrites. Additionally, the defect formation in the form of oxygen vacancies (Vo), and Zn interstitial (Zni) on the bulk and surface (formed during combustion and heat treatments) was precisely studied with the help of the AES spectra and the Wagner plots, which are an advanced chemical and spectral finding for the Zn−doped ferrites as compared to reported studies. Furthermore, the relative concentration area of the oxygen could also be helpful to obtain an idea about the surface and bulk defect formation during doping of Zn into the ferrites host. The study also revealed the relative concentration of oxygen to investigate the impurities in terms of oxides and hydroxide formation on the surfaces and the bulk of the ferrites crystals.

2. Experimental Method

2.1. Synthesis of Fe2O3 and Fe2O3:Zn Nanostructures

Reagents

Salt Iron (III) nitrate nanohydrate (Fe (NO3)3·9H2O, 99.99%), urea (CO (NH2)2, 99%), and zinc nitrate hexahydrate (Zn (NO3)2·6H2O). All chemicals used in the present experiment were of analytical grade purchased from Sigma Aldrich and used without further purification.

2.2. Synthesis of Pure Fe2O3 NPs

The combustion method was used for the preparation of the pure Fe2O3 NPs and Fe2O3 NPs doped with different concentration of Zn (1 mol% to 7 mol%). The main advantage of this technique is that it is very fast, requires typically economical equipment, and produces the formation of high−purity products of any size and shape [21,22]. Compared to other methods such as hydrothermal, sol–gel method etc., the disadvantage of this method is the uncontrolled morphology [21].
The synthesis of pure Fe2O3 NPs were carried out by using the precursor salt Iron (III) nitrate nanohydrate (Fe (NO3)3·9H2O, 99.99%) and urea (CO (NH2)2, 99%) as a fuel. The mixture of Iron (III) nitrate nanohydrate and urea salts in a 1:3 stochiometric ratio was dissolved in 20 mL distilled water for the synthesis of the Fe2O3 NPs. The ultrasonication of the resulting solution was subsequently performed for 20 min at room temperature (RT–25 °C) to homogenise the mixture. Thereafter, the prepared solution was sintered at 500 °C for 15 min using a combustion furnace in an open atmosphere. A powder sample of Fe2O3 was obtained in this process, which was further allowed to cool down at RT. The Fe2O3 NPs were finally annealed at 500 °C for 5 h to get rid of any unwanted impurities.

2.3. Synthesis of Fe2O3:Zn NPs

The Fe2O3:Zn NPs were formed using a simple and inexpensive combustion reaction by incorporating zinc nitrate (Zn(NO3)2·6H2O) at the concentrations of 1, 3, 5, and 7 mol%. The stoichiometric mixture of Fe(NO3)3·9H2O, Zn(NO3)2·6H2O, and NH2CONH2 was first dissolved in 20 mL distilled water and kept for stirring for 20 min at RT−25 °C to make a clear homogenized solution at RT. After being poured into the alumina boat, the mixed solution was heated to 500 °C in an open setting (See Figure 1). The ionic Zn was introduced into the iron−oxide host by evaporating the hydrous half of the precursor salt and lighting the gas. The precursor salt was employed to breakdown during thermal treatment. After the chemical combustion was finished, a solid phase of Zn−doped iron oxides powder (red−brown) was produced. Using a molten piston, the produced powder was cooled to room temperature and transformed into a fine nanopowder. The final crushed sample was subjected to a 5−h annealing process at 500 °C before being used for morphological and crystallographic analysis.

2.4. Material Testing Procedure

Using a D8−Advance X-ray diffractometer (Bruker, Germany) and CuK α radiation (λ = 0.15408 nm) between 10° and 90° scan range with a voltage of 40 kV and a current of 40 mA, respectively, the phase identification of the produced samples was investigated. The samples’ crystallinity was evaluated against information from the Joint Committee for Powder Diffraction Standards (JCPDS) files. Field emission scanning electron microscopy (FE−SEM) and TEM were used to conduct morphological investigations and particle size examinations on the generated samples. Raman analysis was performed to study the defects−related information of the synthesized samples. The electrical structures and chemical states of the produced samples were studied quantitatively using XPS. In the current work, the PHI 5400 XPS spectrometer with a monochromatic Mg K α X-ray source (1253.6 eV, 15 kV, 200 W) was used. The binding energy (BE) of the Au 4f7/2 peak at 83.96 eV was used to measure the work function of the XPS instrument, and the Cu 2p3/2 peak with a BE of 932.67 eV was used to achieve linearity of the energy scale. Throughout the XPS tests, the photoelectron take−off angle was held constant at 45°. With a pass energy of 178.95 eV and a dwell time of 100 ms, survey scans were performed. High−resolution scans with a step energy of 0.125 eV were conducted using the pass energy of 44.75 eV. Using C−1 s at a standard value of 284.8 eV, the binding energy calibration for charge correction in high−resolution spectra was carried out [16,21,22].

3. Results and Discussion

3.1. Crystallographic Structure & Phase Identification: X-ray Diffraction (XRD)

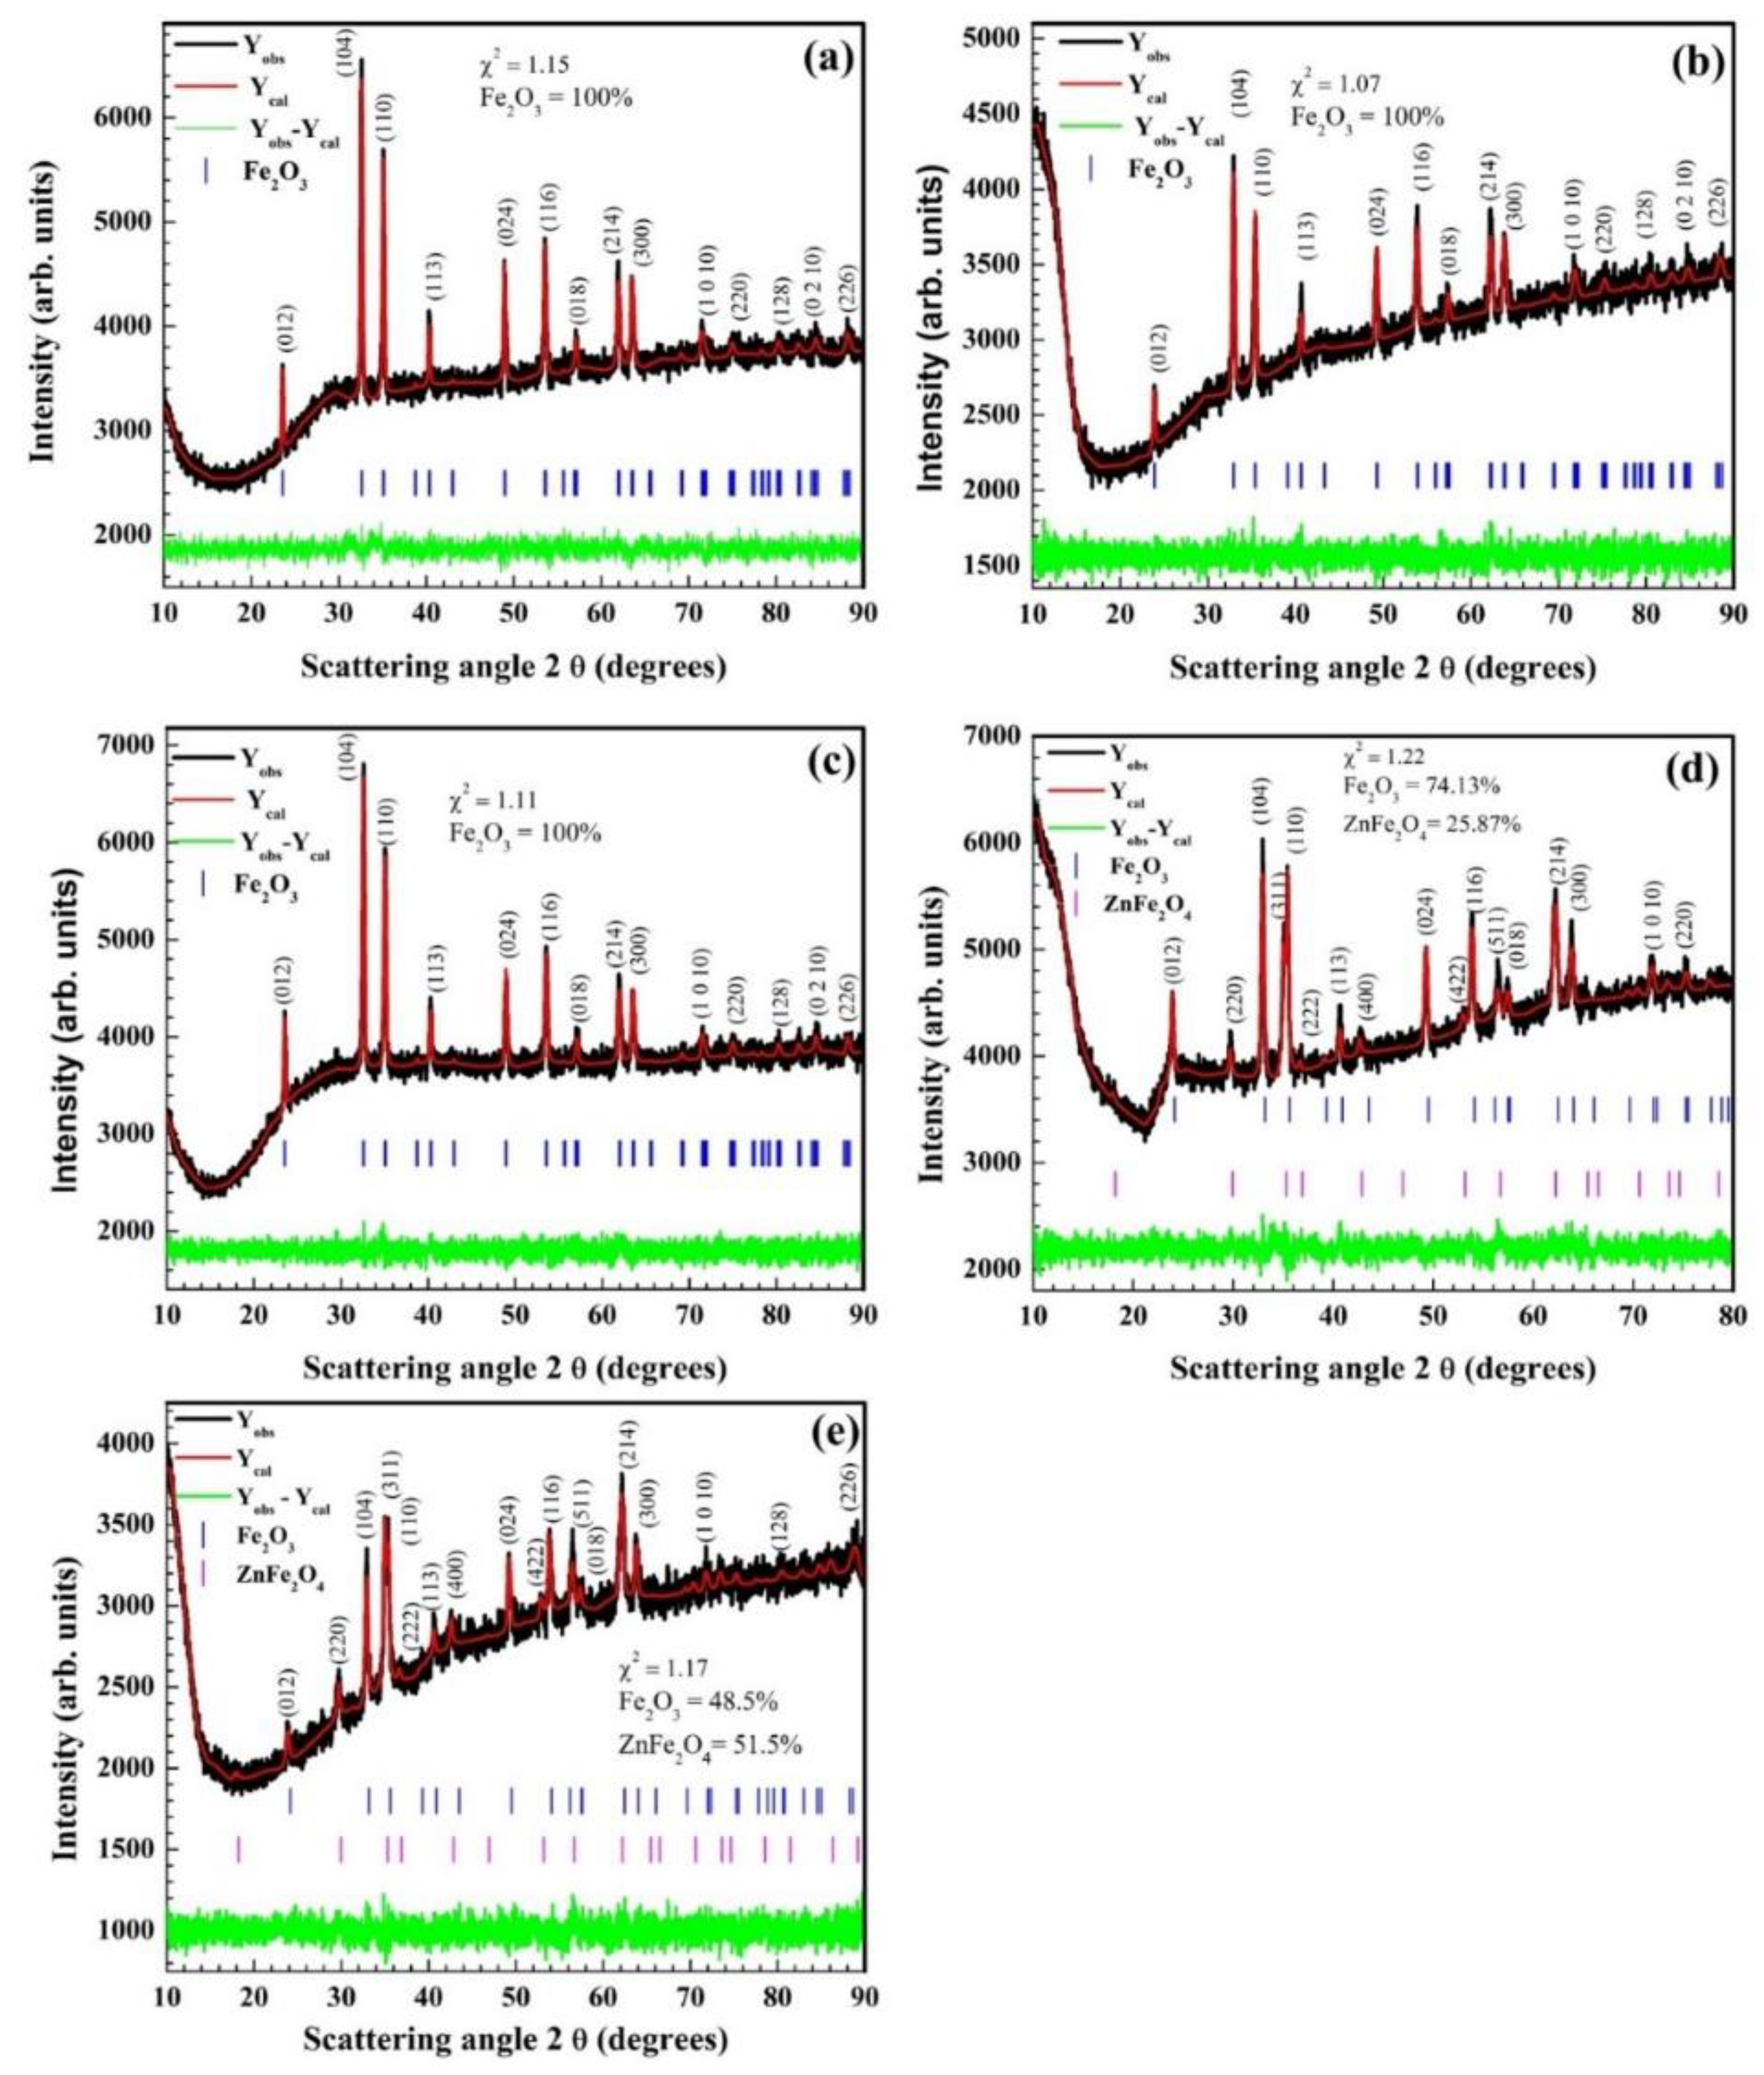
Figure 2a–e shows the XRD patterns of pure and Zn−doped Fe2O3 nanoparticles. The phase quantification of the XRD results of the Zn−doped and pure Fe2O3 nanoparticles was performed using Rietveld refinement analysis, using FullProf software. The presence of a hematite α–Fe2O3 phase in the pure and the Zn−doped samples was analysed through the presence of the reflection peaks indexed as (012), (104), (110), (113), (024), (116), (018), (214), (300), (1010), (220), (128), (0210), (134) and (226) of the space group R−3c with lattice parameters a = 5.03Å and c = 13.7Å [23]. The value of χ2 for all the samples lies very close to one, which confirmed the accuracy of the refined patterns. The XRD results showed that there was no significant change in the lattice parameters of the α–Fe2O3 phase with the incorporation of the Zn (Table 1). The absence of any additional phase in the XRD spectra of the samples doped with 1% and 3% Zn suggested the substitution of the Zn2+ ions either in the vacancy sites or in Fe3+ cationic sites. The slight increase in the density values calculated through the Rietveld refinement from 4.94 g/cm3 for pure Fe2O3 to 4.99 g/cm3 and 5.1 g/cm3 for Fe2O3 nanostructures doped 1% and 3% Zn, respectively, can be the consequence of the substitution of the Zn2+ ions in the interstitial or vacancy sites (Table 1). The appearance of additional peaks of the Fd−3m space group of the ZnFe2O4 phase in the XRD spectra of the Fe2O3 samples doped with 5% and 7% Zn was observed.
The crystallographic information files (CIF) was obtained from the crystallographic open database (COD) for the α–Fe2O3 hematite phase with COD ID− 2101167 and Inorganic Crystal Structure Database (ICSD) for the ZnFe2O4 phase with ICSD data entry code 91829, which was used as initially estimated for the multiphase Rietveld refinements of the XRD patterns of the pure and the Zn−doped Fe2O3 NPs [23,24]. Table 1 summarizes the values of the phase fraction obtained using the Rietveld refinement and illustrates the increase in the ZnFe2O4 phase and a decrease in the hematite α–Fe2O3 phase with an increase in the Zn concentration from 33% to 44%. The density of the ZnFe2O4 phase has also been observed to increase with the Zn concentration, which leads to the decrease in vacancy or interstitial defects [25,26]. The average value of the crystallite size of the Zn−doped Fe2O3 was calculated by using the Scherer formula, which was observed to reduce monotonically from 44.5 nm to 24 nm with the increase in the Zn concentration. The decrease in crystallite size can be the consequence of grain boundary suppression of the crystal growth of Fe2O3 as a result of the removal of the vacancy defects or Zn interstitials on the Zn doping [25,26].

3.2. Surface Morphology & Elemental Analysis

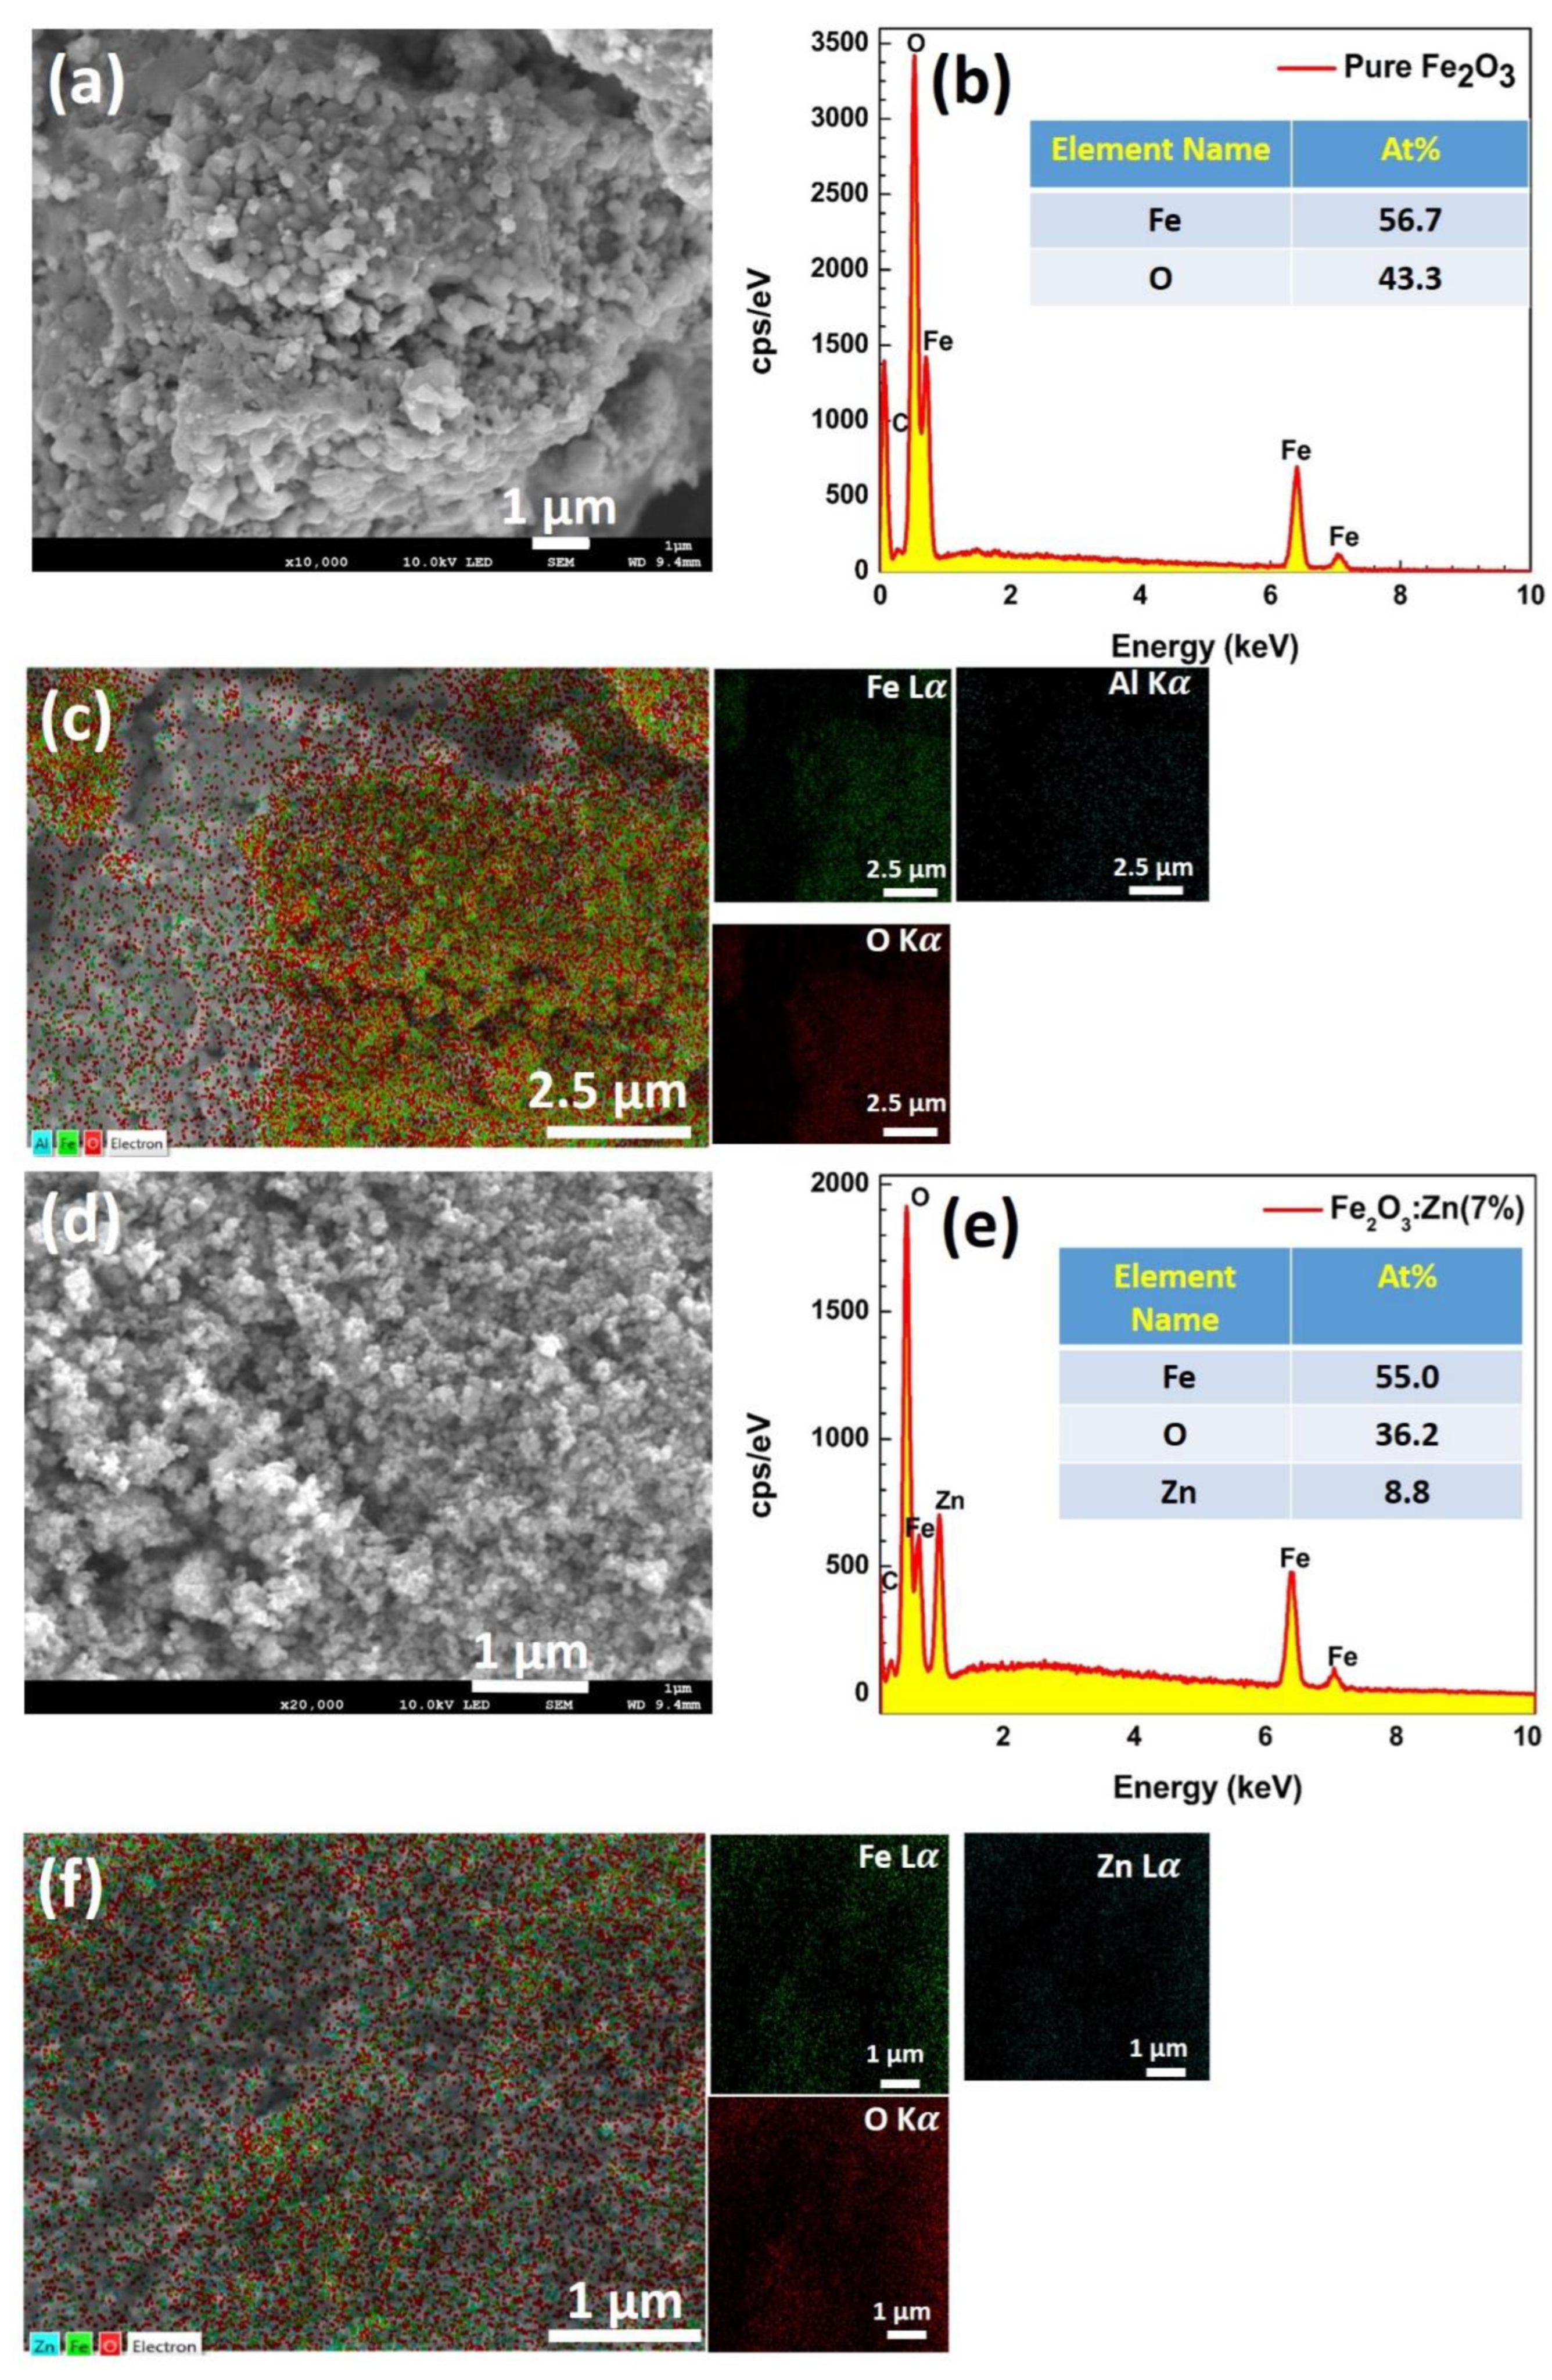
FESEM was used to examine the surface morphologies of the pure and Zn−doped Fe2O3 samples. Figure 3a shows how the pure ferrites sample formed an agglomerated, almost spherical structure, while Figure 3d shows how the Zn−doped ferrites materials took on a fine spherical shape. Each magnetized particle prefers to aggregate with the doped or nearby particles since it has been demonstrated that the pure ferrite particles have a more compact distribution than the doped ones [7]. This may be because of the presence of permanent magnetic moments. The synthesis procedure linked to the heat treatments, which causes defects/imperfections on the surface as well as in the bulk lattices of the host ferrites, also had an impact on the shape of the particles and their distribution. Therefore, both doped and undoped ferrite samples showed a clear surface morphology. To support the elemental composition of ferrites formations, the EDS spectra were also obtained. Fe, O, and Zn, respectively, were validated by the EDS analysis of the produced samples (see Figure 3c–f). While the lack of a second EDS signal suggests that the Fe2O3 and Fe2O3:Zn NPs generated were devoid of impurities. For the undoped Fe2O3, the atomic percentages for Fe and O were found to be 57.7 and 43.3%, respectively, however, for the Fe2O3:Zn NPs nanopowders, 8.8% of the atomic Zn was recorded along with the lower 55 and 36.2% atomic percentages for Fe and O.

3.3. Morphological Studies of Fe2O3:Zn: TEM

At higher resolutions and magnifications, TEM analysis is frequently used to distinguish between the morphological findings of individual and coupled nanostructures. The pure and doped Fe2O3 samples’ temperature−induced changes in particle size and distribution are depicted in Figure 4. Using ImageJ software, different Fe2O3 and Fe2O3:Zn particle sizes were estimated. While a Lognormal function was used to suit the histogram’s mean diameter. The almost spherical nanoparticles with an average range of 25 nm were visible in the pure Fe2O3 NPs (see Figure 4a). Additionally, it was noted that for the doped Fe2O3:Zn samples, the size of the particles of the Fe2O3:Zn samples grew larger with rising Zn concentrations (see Figure 4b–d)). The temperature−mediated combustion approach used to manufacture the ferrite particles resulted in a variety of groups of coalescing nanoclusters, which may be the cause of the different groups in the Fe2O3:Zn micrographs [7].
The Zn−doped Fe2O3 NPs showed an average size of 29.3 to 34.3 nm with increasing the Zn concentrations as shown in Figure 4a–d. The size distribution histogram clearly indicates an enhanced order of the particle’s size for Fe2O3 samples doped with Zn. Such variation in the morphology (size and shape) of the prepared samples can be observed by substitution of the Zn2+ ions either in the vacancy sites or in Fe3+ cationic sites.

3.4. Surface Analysis Studies of Fe2O3:Zn: XPS

XPS analyses were used to study a quantitative investigation of the electronic structures and chemical states of the Fe2O3 samples doped with Zn. The XPS survey confirmed the presence of C, O, Fe, and Zn peaks, as shown in Figure 5a. The binding energy calibration for charge correction in high−resolution spectra was performed by using C−1 s at a standard value of 284.8 eV [27,28]. The high−resolution spectrum of the C−1s for the pure Fe2O3 sample, is shown in Figure 5b. This region was resolved into six Gaussian fits for the various chemical states of carbon The peaks are assigned to metal carbide (283.7eV), C−C (284.8 eV), C−sp3/C−N/defects (285.5 eV), C−O (286 eV), C−HO (287,3 eV) and C = O/CO3 (289 eV). Figure 5c shows the dual characterization of the Fe 2p3/2 and Fe 2p1/2 peaks for the pure Fe2O3 sample. The Fe 2p region can be resolved into three peaks. The main prominent peak at 710.5 eV is assigned to a Fe3+, where a broader peak found at 717.8 eV is a shake−up satellite peak [29]. These results are consistent with published Fe 2p XPS spectra of Fe2O3 [30]. S. Wang et al. in their research findings observed the shake−up satellite peak of Fe at 718 eV confirming the presence of maghemite or hematite (Fe3+) [30]. The other fits corresponding to the Fe 2p3/2 for the Fe2O3:Zn(7%) is shown in Figure 5d. These fits clearly indicate that the Fe mainly exist in Fe3+ and in an additional peak found at 712.3 eV, indicating ZnFe2O4, [31].
These observations are well persistent with the XRD based research findings. The oxdidation state of Fe in the Fe2O3:Zn sample was further investigated using the XPS Fe L3M45M45 peaks. The Fe L3M45M45 peak of the pure Fe2O3 sample was fitted into six peaks. The first prominent peak observed at a kinetic energy of 702.2 eV, was assign to Fe2O3 and then another peak at 699.6 eV to ZnFe2O4. Similar observations for the chemical state of Fe was made for Zn(7%) (see Figure 6d). Other fits related to the Fe LMM peaks with different concentrations of Zn were also done but are not shown. The Auger peak of Fe3+ is persistent with those reported in the literature [29,30]. It was also observed that the binding energies corresponding to the chemical states of Fe were very close [29,30].
Wagner plots were employed to confirm the oxidation state of the Fe. The modified Auger parameter α [32,33] is given by:
α = K.E. (Fe L3M45M45) + B.E. (Fe 2p3/2).
where K.E. (Fe L3M45M45) is the kinetic energy of the Auger transition and B.E. (Fe 2p3/2) is the binding energy of the electron in the Fe 2p3/2 core level.
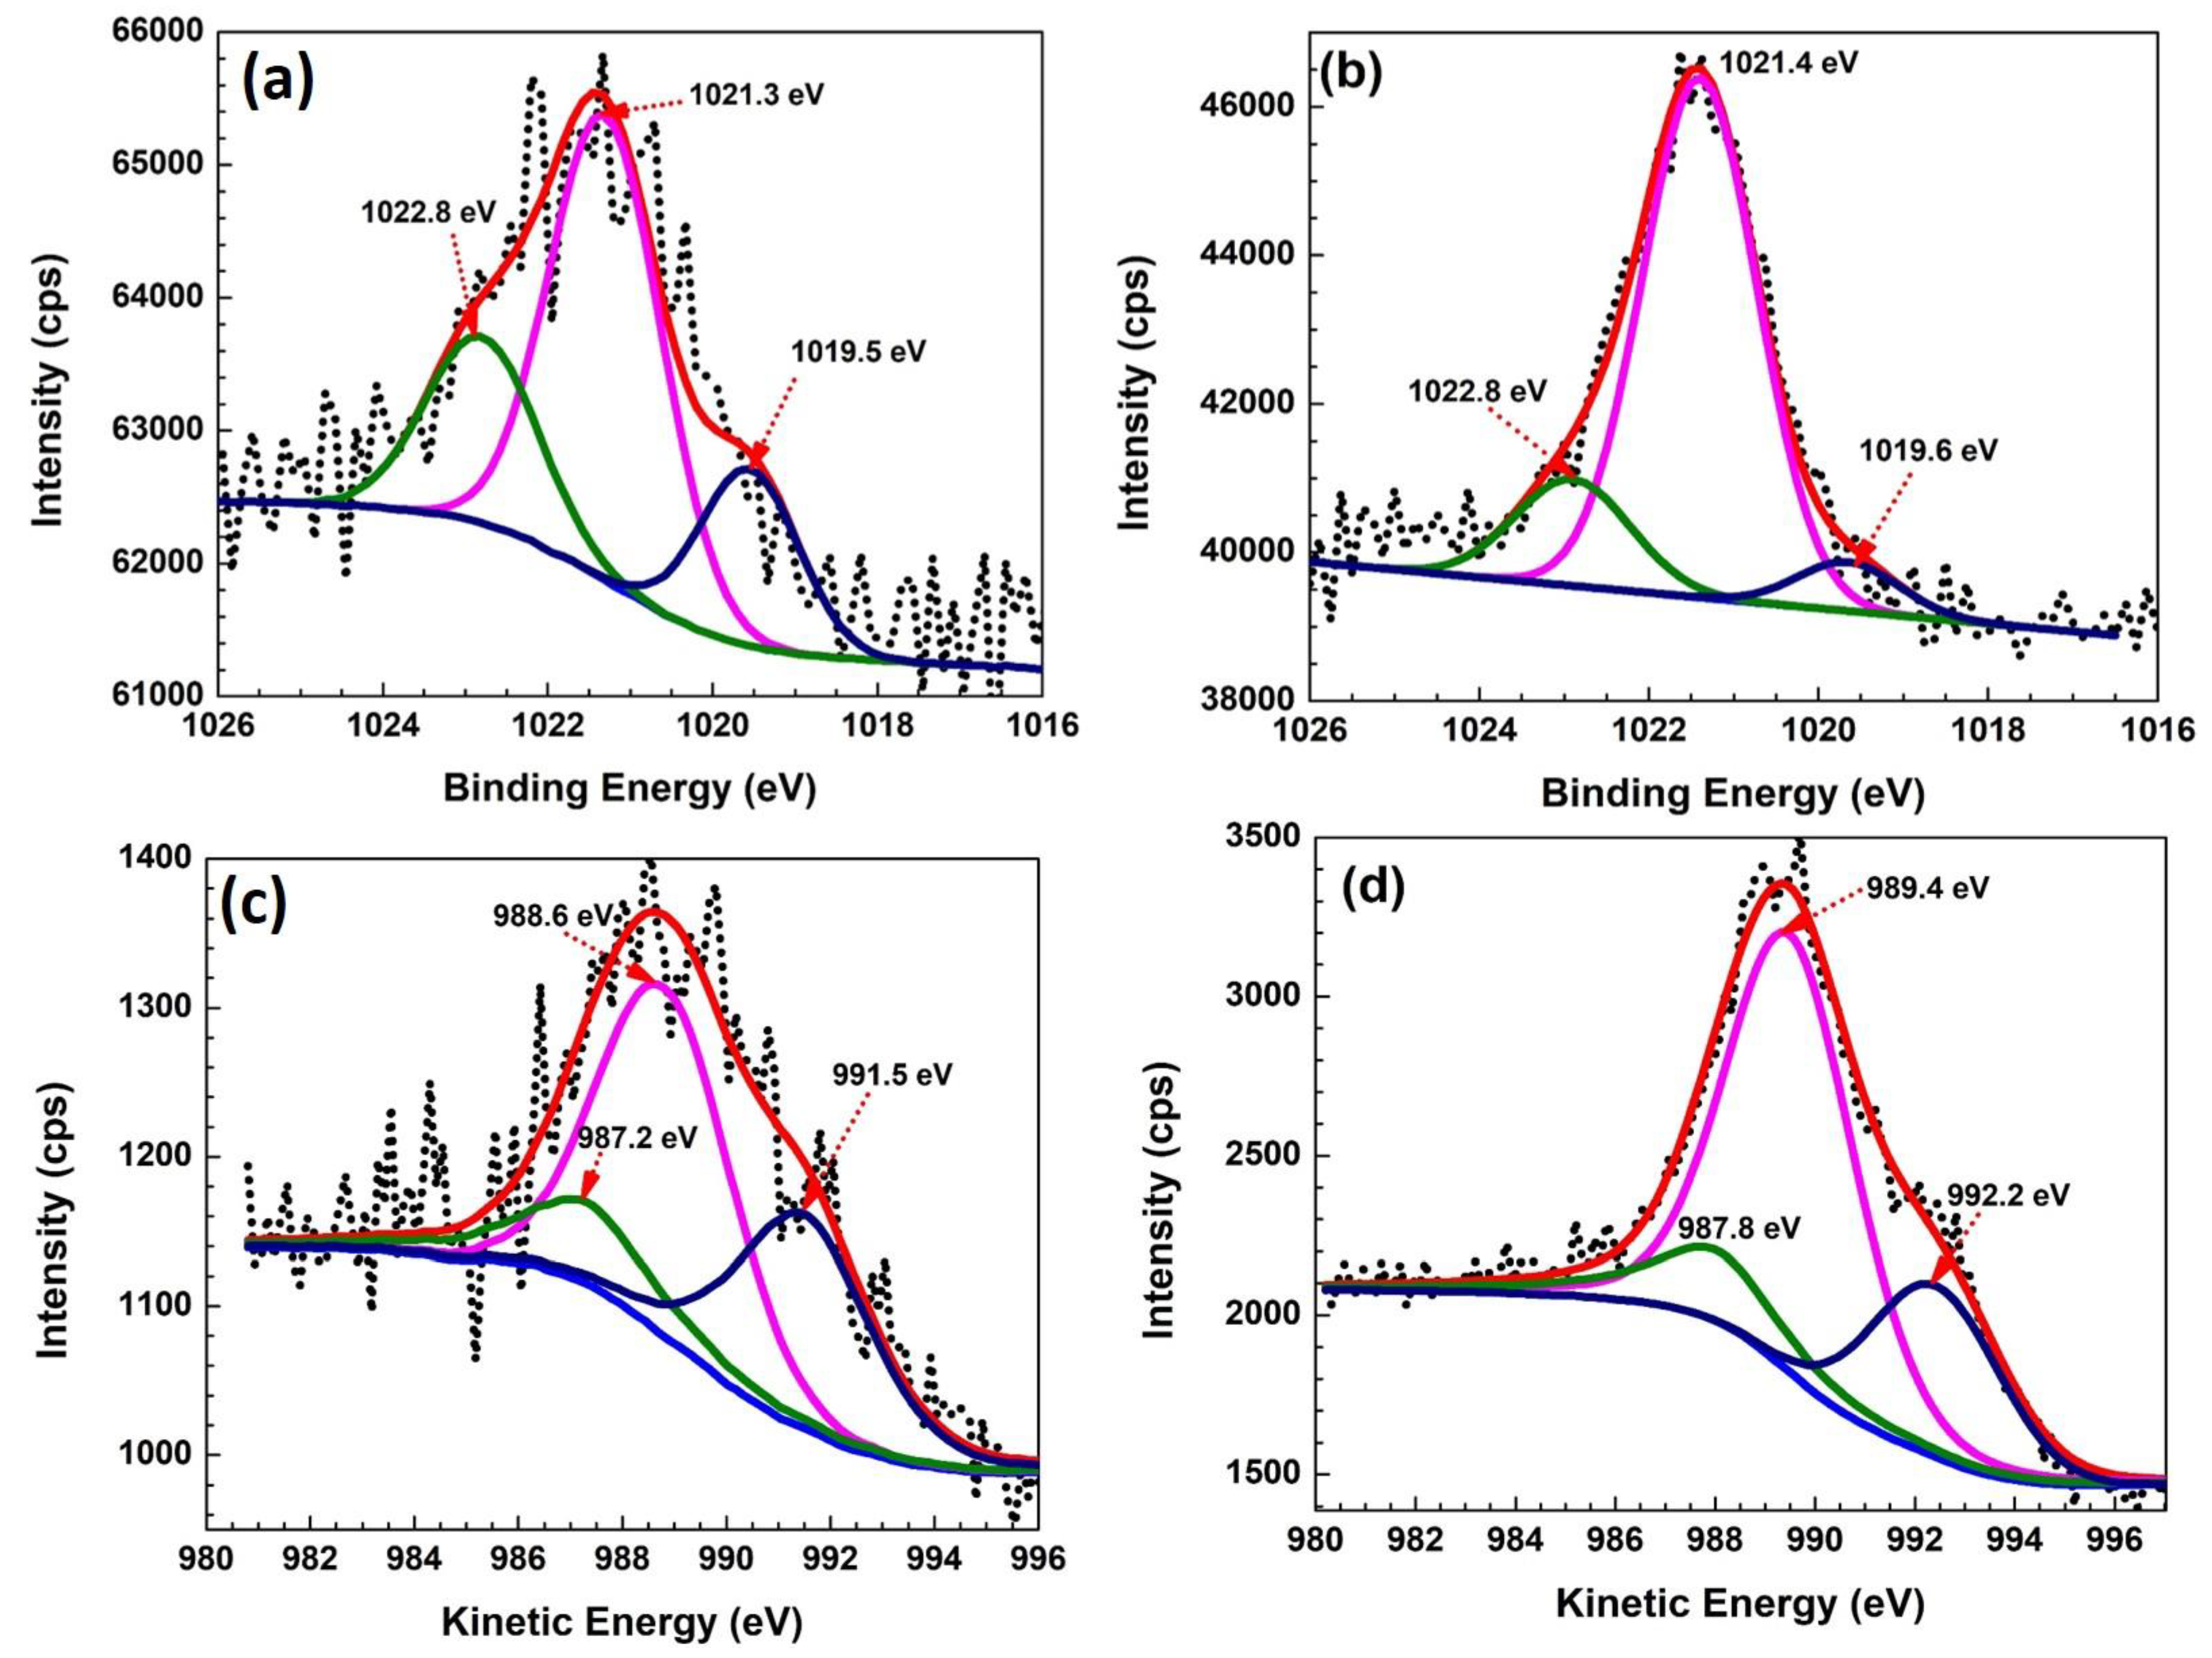
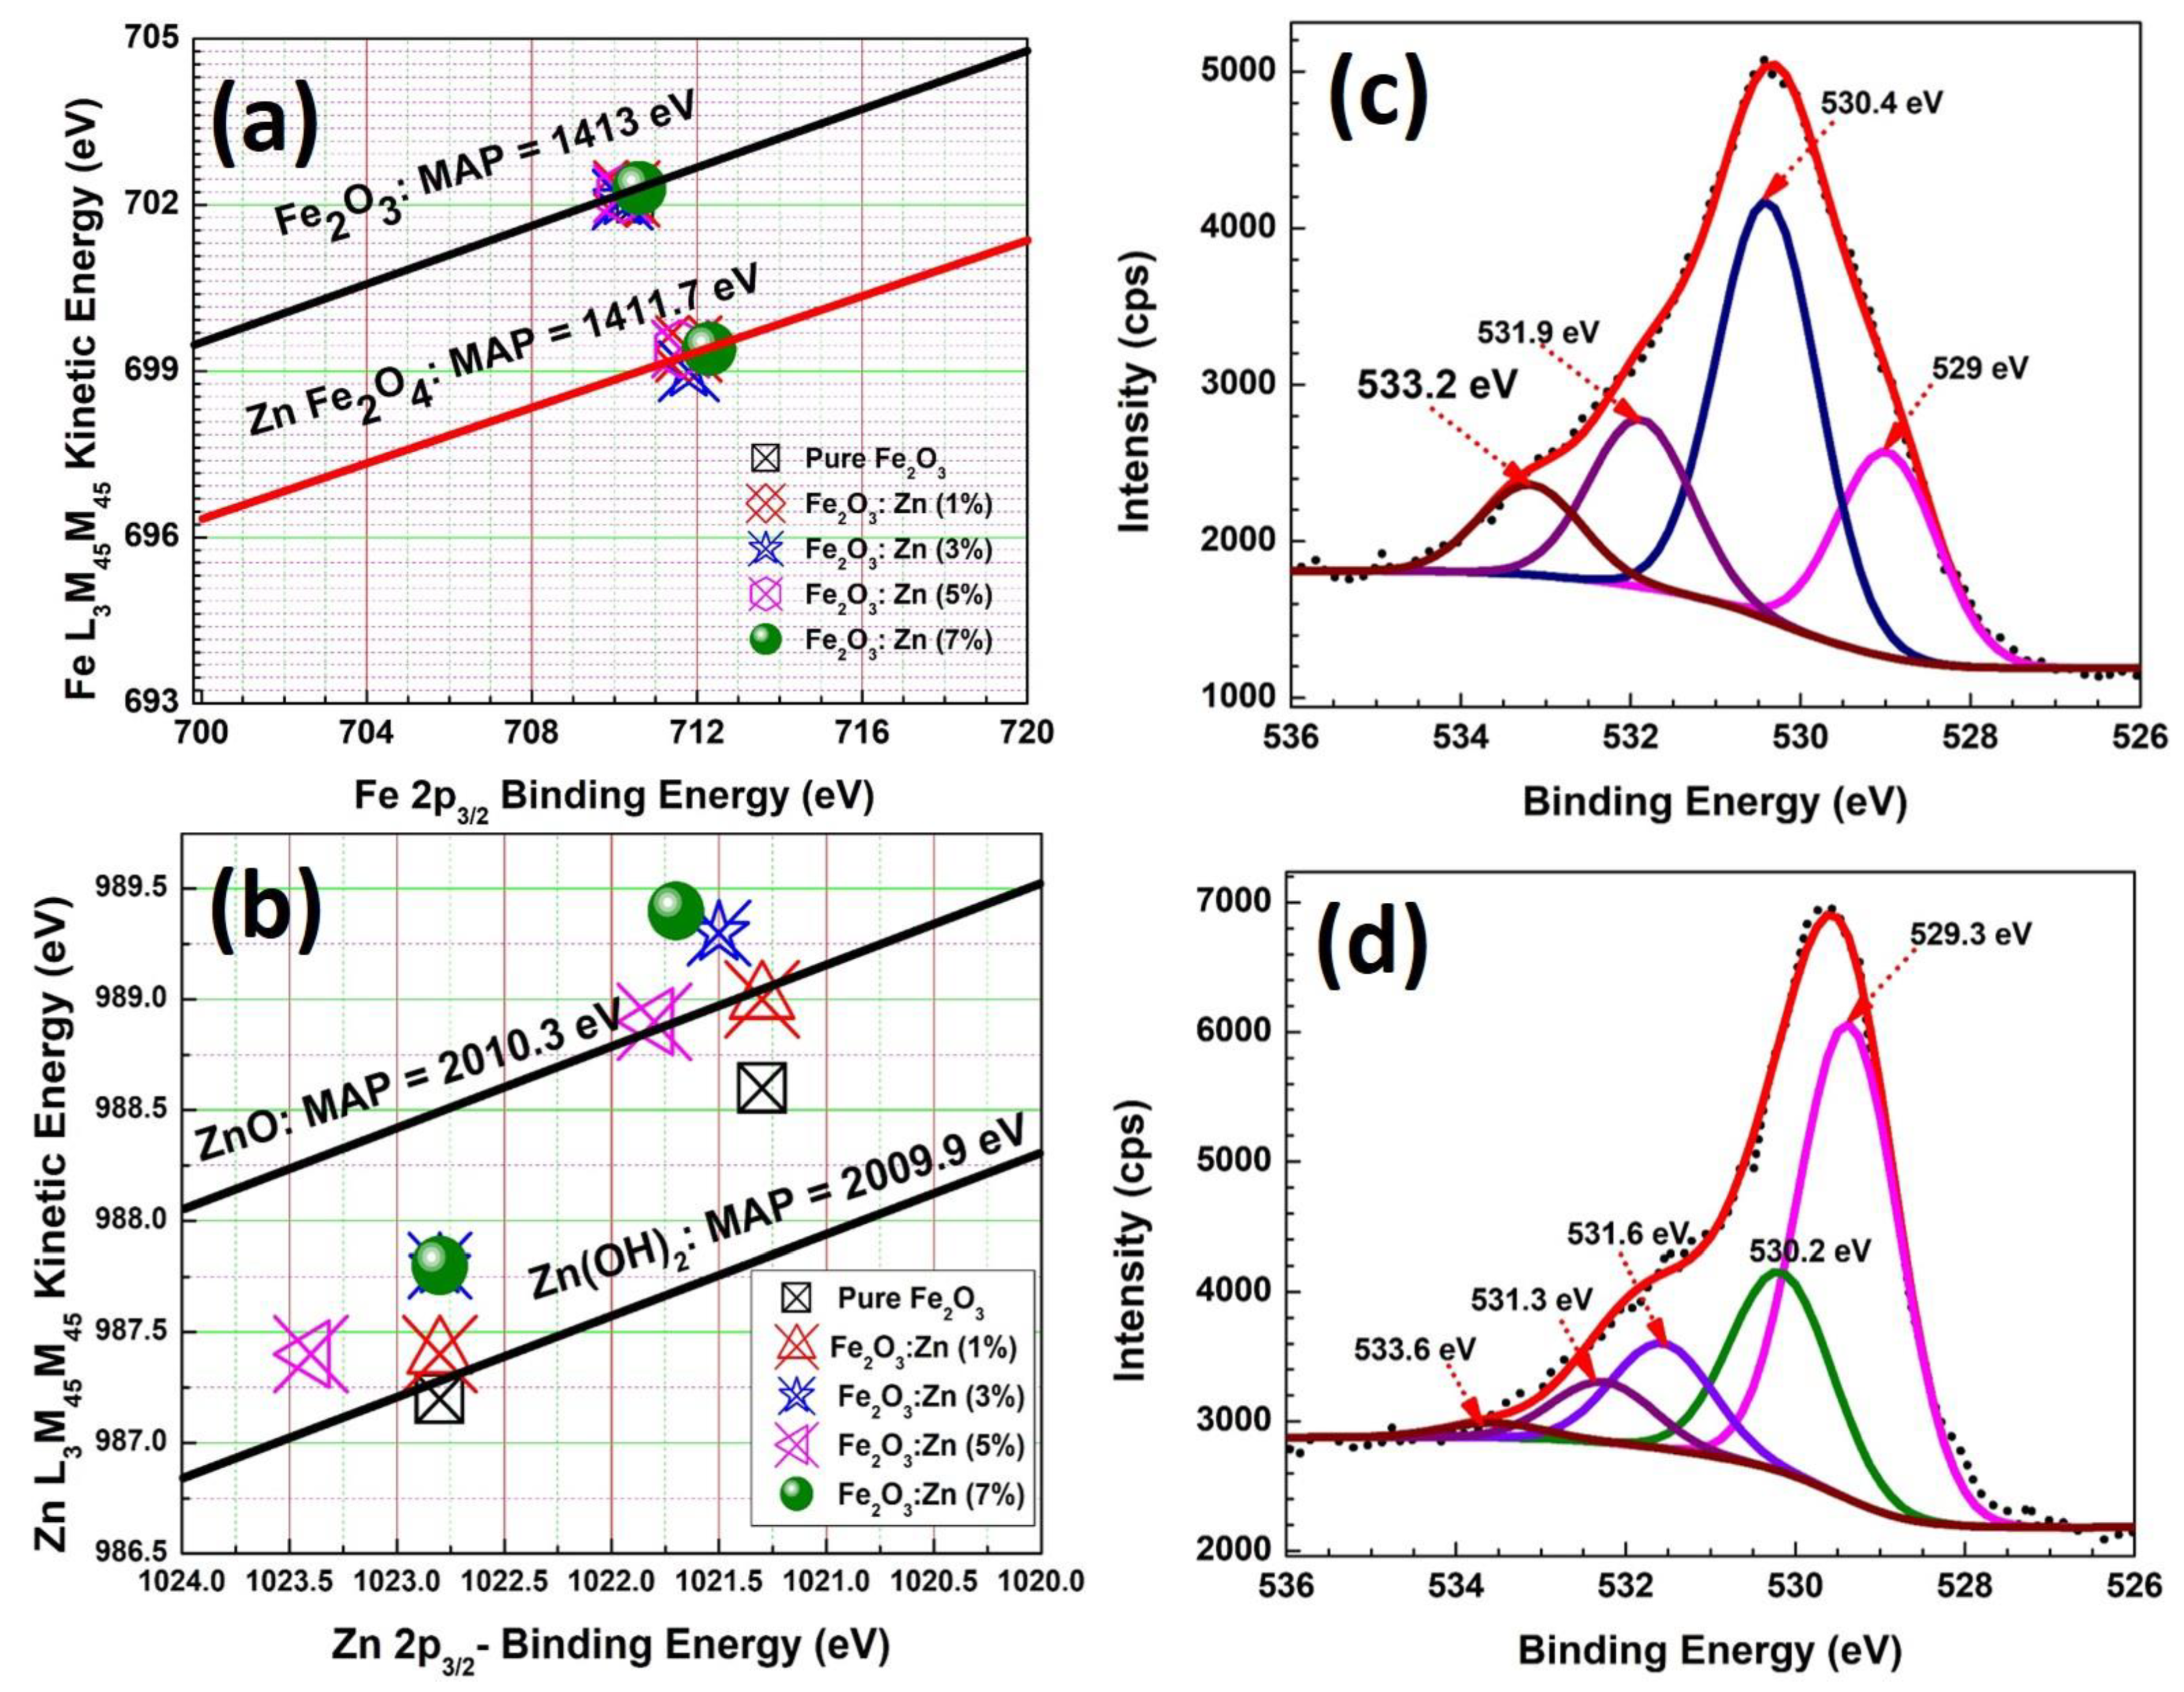
The modified Auger parameters (MAPs) were obtained at α = 1413   eV for Fe2O3 [34] and α = 1411.7 eV for ZnFe2O4. The plots confirmed the chemical states of Fe2O3 and ZnFe2O4 in the samples doped with various concentration of Zn (see Figure 7a). Figure 6a shows the Zn2p3/2 and Zn 2p1/2 for Fe2O3:Zn(7%) sample. The Zn 2p3/2 envelope can be decomposed into three peaks to specify the chemical states of the Zn. The primary peak at 1021.3 eV is referred to the stochiometric ZnO, the another prominent peak observed at 1022.8 eV is assigned to Zn(OH)2, and the third additional peak observed at 1019.5 eV is referred to Zn Fe2O4, [27]. Although, there is a small variation in the binding energy when Fe2O3 is doped with Zn (see Figure 6b). Other fits corresponding to the Zn 2p3/2 for Fe2O3 doped with different concentrations of Zn was also done but are not shown. These peak positions were consistent with those reported in the literature [27].
The oxidation state of Zn in the Fe2O3:Zn sample was further determined using the Zn LMM peaks. The Zn L3M45M45 peak of the Fe2O3 samples doped with Zn (1%) was decomposed into three peaks (see Figure 6c). The main peak at 988.6 eV, is referred to as Zn in ZnO. Another prominent peak at 987.2 eV, referred to Zn(OH)2 and the third additional peak at 991.5 eV, to Zn interstitials. The main peak observed at 988.6 eV was associated with Zn2+ in the Fe2O3. A similar observation for the oxidation state of the Zn in the ZnO was also observed for the higher concentration of Zn (7%), as shown in Figure 6d. There is a small variation in the binding energy after Fe2O3 was doped with a higher concentration of Zn. These Auger peaks of Zn are consistent with those reported in the previous published research findings [27]. It was also observed that the binding energies corresponding to the oxidation states of Zn were very close. Therefore, Wagner plots were investigated to confirm the exact chemical state of the Zn.
The modified Auger parameters (MAPs) were obtained at α = 2010.3   eV for ZnO and α = 2009.9 eV for Zn(OH)2 [27]. These parameters confirmed that both the oxidation states of ZnO and Zn(OH)2 were observed for the Fe2O3 sample doped with Zn concentrations (see Figure 7b).
Figure 7c,d depicts the O−1s spectra for the bare and Fe2O3 doped with Zn(7%). The O−1s spectrum for pure Fe2O3 can be decomposed into four peaks. The main peak located at 529 eV is due to O in the Fe2O3 lattice, the peak at 530.4 eV because of O−H and/or O−C bonds, the third peak at 531.9 eV assigned to O−deficiencies, and the last peak at 532.2 eV due to H2O. It was further noticed that for the Fe2O3 sample doped with Zn, a small variation in the O 1s binding energies occurred, and the peak intensities changed with an increasing Zn content. The results indicate that the defects increased with an increasing concentration of the Zn content in the Fe2O3 matrix.

3.5. Bonding of Fe2O3:Zn Nanostructures: Raman Studies

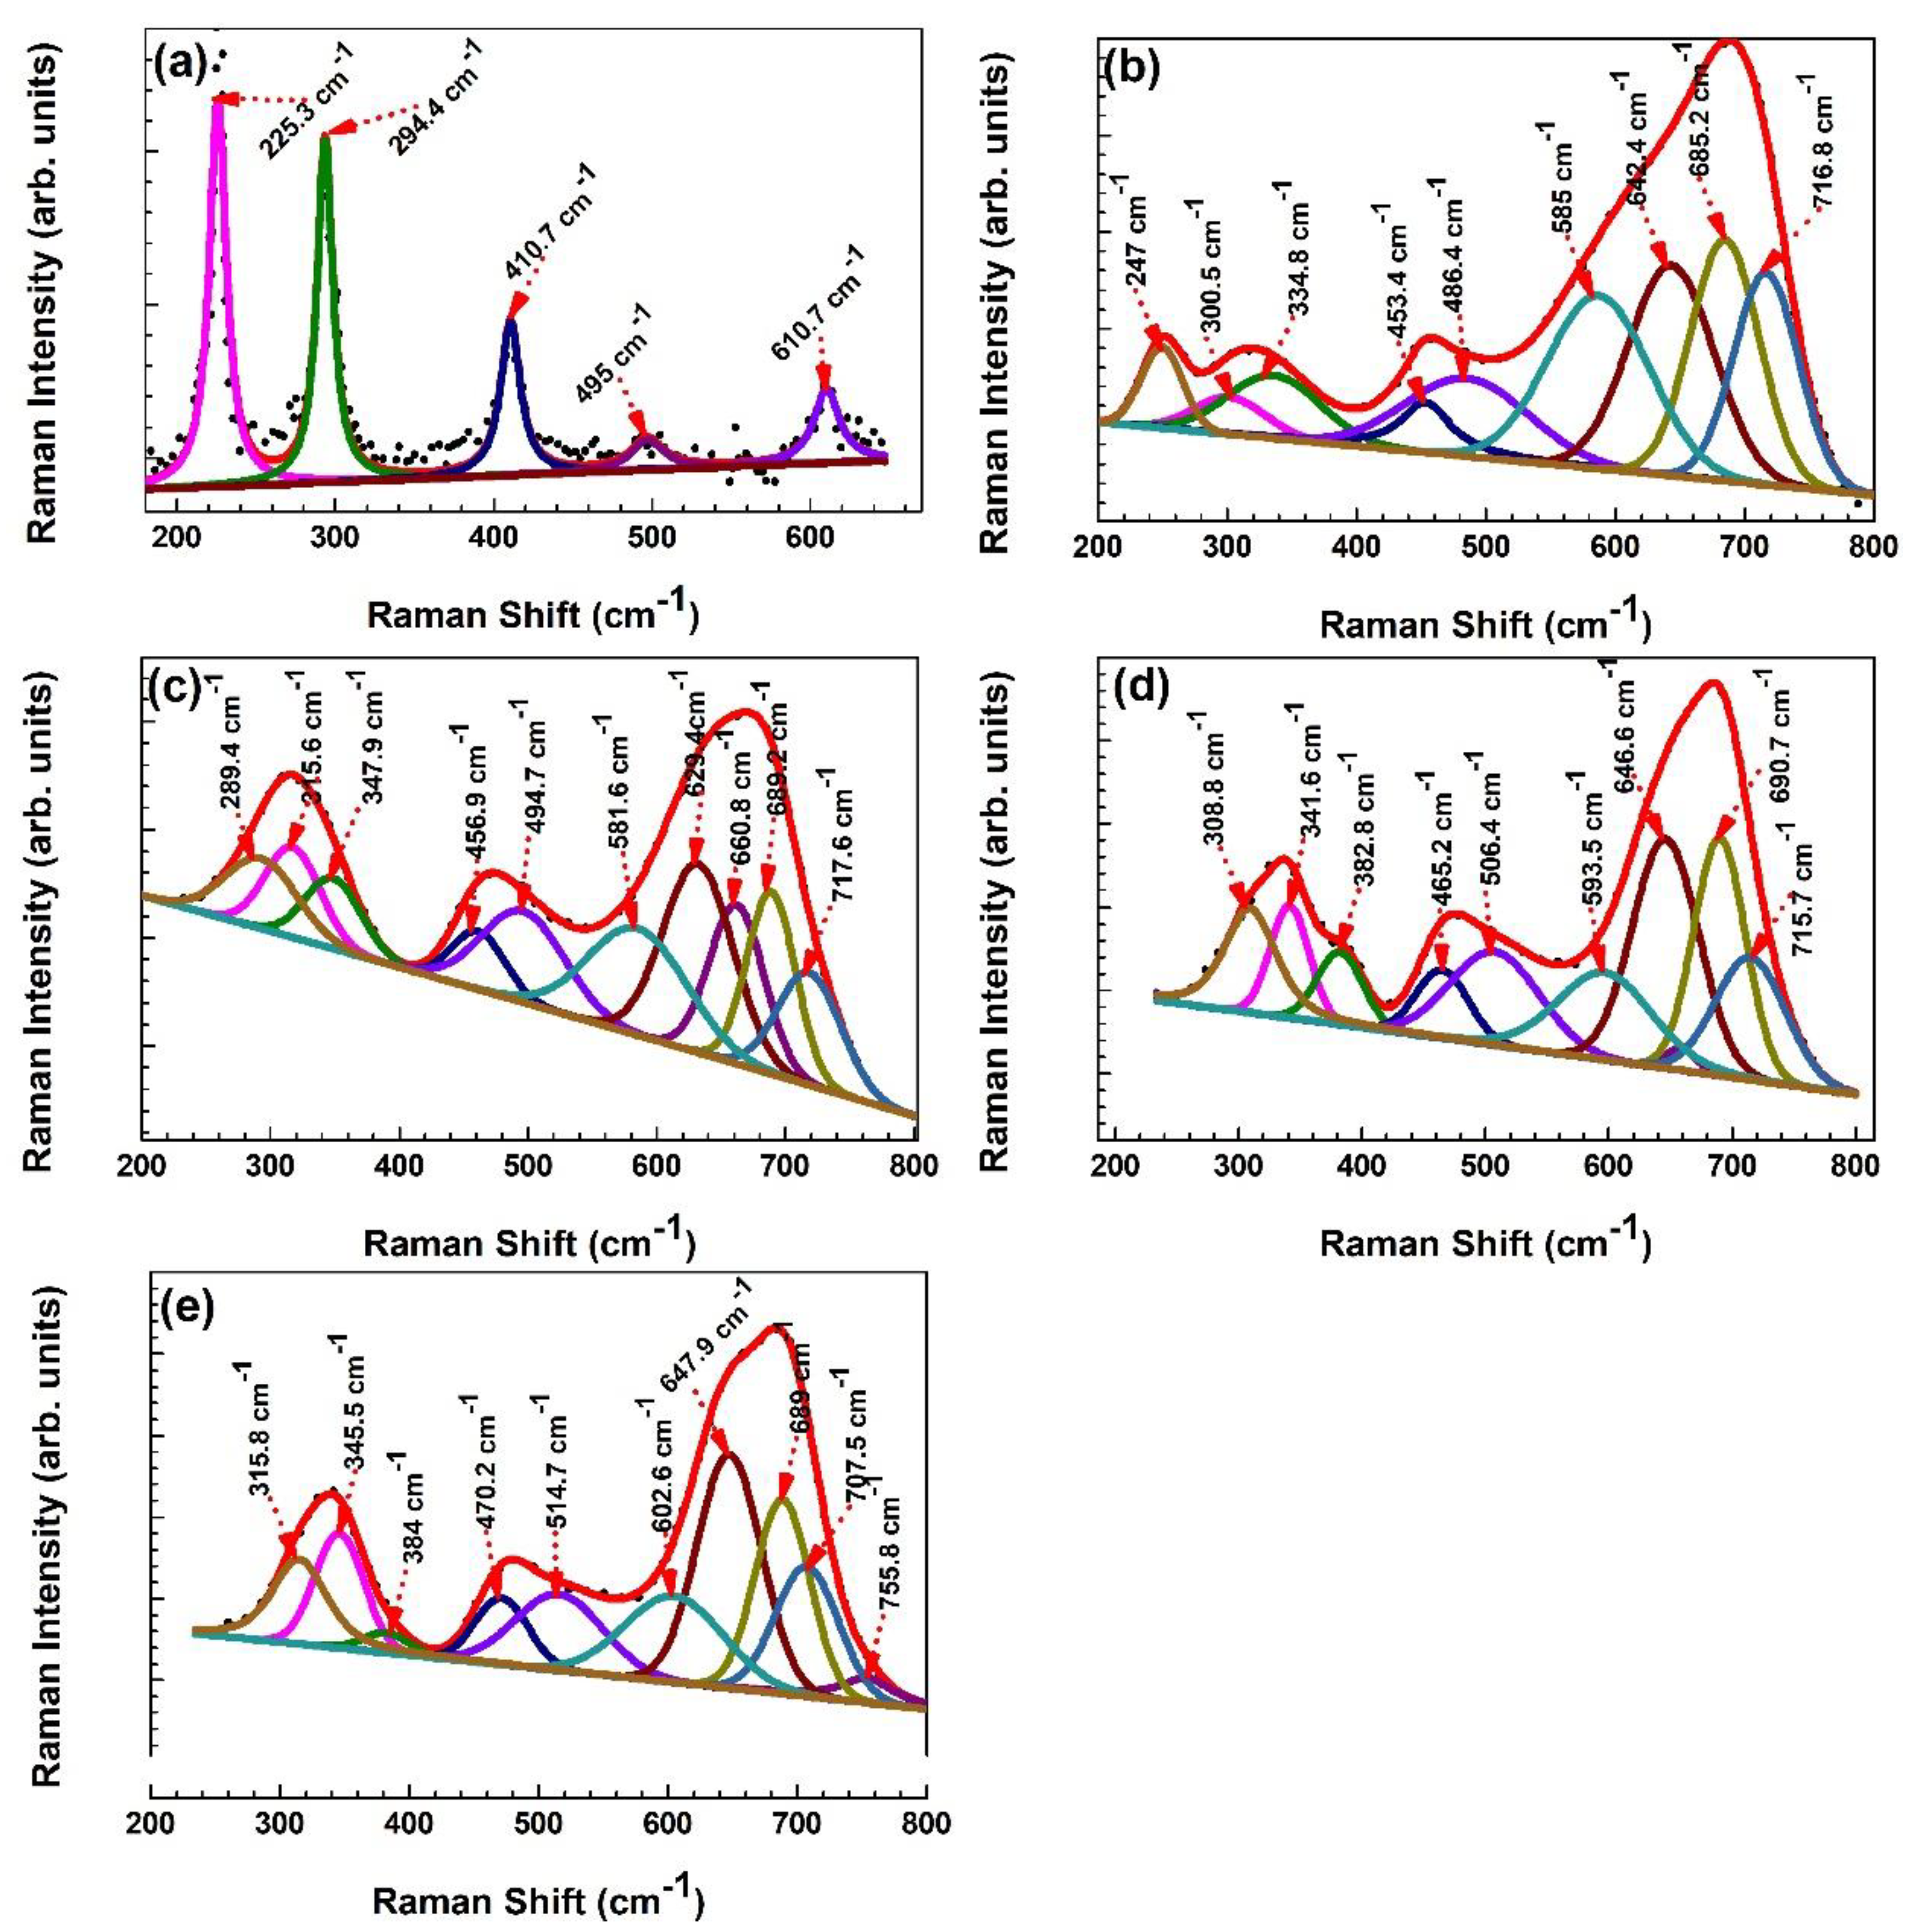
Raman spectra was recorded for these samples to corroborate the findings of defects and different phase formation obtained from XPS, Auger spectroscopy and XRD. The Raman spectra as shown in the Figure 8 were fitted with several Gaussian−like peaks.
The main Raman peaks in the pure iron oxide sample have prominent signatures of the α−Fe2O3 phase, which had five different vibrational modes at 225.3 cm−1 (A1g), 294.4 cm−1 (Eg), 410.7 cm−1 (A1g), 495 cm−1 (Eg) and 610.7 cm−1 (Eg), respectively [25,35]. With 1 % of Zn doping a drastic change in the peak position and relative intensity of different vibration modes is clearly depicted, which is an indication of the change in the host matrix of α−Fe2O3 nanoparticles [25]. The identified peak positions corresponding to the presence of different vibrational modes associated with different phase in the materials are presented in the Table 2. In the doped samples, the broadening of the peaks is mainly associated with the nanocrystalline nature, large phonon−electron coupling and also due to the coexistence of different phase of the materials such as α−Fe2O3 phase, γ−Fe2O3 phase and ZnFe2O4 phase [25,36,37,38,39].
The shifting in the peak positions to a higher wave number side may be attributed to distortion of the lattice that might be caused by lattice expansion after Zn doping and also due the occurrence of ZnFe2O4 phase, whose presence was confirmed with A1g mode of vibration at 685.2 cm−1 in the 1% Zn−doped Fe2O3 sample. The peak intensity of this A1g mode is relatively high as compared to other peaks indicates the sample microstructure is dominated by ZnFe2O4 phase in all the Zn−doped Fe2O3 samples. A shoulder at 334.8 cm−1 and 716.8 cm−1 in 1% Zn−doped Fe2O3 sample is believed to be due to the natural oxidation forming a small fraction of γ−Fe2O3 phase in the samples which consistently appeared in Zn−doped Fe2O3 samples. The Gaussian fittings shows there are some phonon modes and IR−actives peaks, which are a possible indication of the presence of defects, breakage of crystal symmetry and the presence of partially or un−reacted chemical species causing the localized change in the stoichiometry of the samples [37,38]. A low intensity peak at 755.8 cm−1 in the 7% Zn−doped Fe2O3 sample still remains unidentified. The Raman spectra reported herein are in good agreement with the observations recorded by other surface characterization and diffraction techniques, as discussed before.

4. Conclusions

A simple and cost−effective combustion method was used to synthesize the pure and Fe2O3:Zn NPs. XRD confirmed the Fe2O3 phase in the pure and the Zn−doped samples. The results showed that there is no significant change in the α–Fe2O3 phase with an increase in the Zn concentrations up to 3% due to the substitution of the Zn2+ ions, either in the vacancy sites or in the Fe3+ cationic site. The appearance of an additional peak of the Fd−3m space group of the ZnFe2O4 phase in the XRD spectra of the Fe2O3 samples doped with 5% and 7% Zn was observed. The average crystallite size of Zn−doped Fe2O3 reduced from 44.5 nm to 24 nm with the increasing Zn concentration. The decrease in the crystallite size was observed because of grain boundary suppression of the crystal growth of the Fe2O3 as a result of the removal of the vacancy defects or Zn interstitials on Zn doping. The Raman study confirmed the defects−related information of the synthesized samples, which was consistent with the XRD, and XPS−based results. TEM confirmed the increase of the spherical NPs’ size with an increase in Zn concentrations. The surface characteristics of the zinc−ferrite were examined using XPS and X-ray−induced Auger electron spectroscopy. A Wagner plot using MAP confirmed the presence of Fe2O3, ZnFe2O4, and ZnO. XPS is a promising and powerful technique to study the composition and chemical states of spinel zinc ferrites, and provides an understanding of the changes in their properties for functional applications.

Author Contributions

P.K.: Conceptualization, methodology, formal analysis, software, writing—original draft preparation, M.C.M.: data curation, G.K.I.: data curation, S.K.: data curation, M.-M.D.: data curation, visualization, W.D.R.: supervision, H.C.S.: supervision, investigation, project administration, funding acquisition. All authors have read and agreed to the published version of the manuscript.

Funding

This research received no external funding.

Institutional Review Board Statement

Not applicable.

Informed Consent Statement

Not applicable.

Data Availability Statement

Data may be available on reasonable request from the authors.

Acknowledgments

The authors are highly thankful for the support provided by the South Africa Research Chair Initiative of the Department of Science and Technology (No. 84415), extending financial support from the University of the Free State to carry out the research work. Mohan C. Mathpal greatly appreciates the FONDECYT program (No 3190316) to support the research activity.

Conflicts of Interest

The authors declare no conflict of interest.

References

  1. Ali, A.; Zafar, H.; Zia, M.; ul Haq, I.; Phull, A.R.; Ali, J.S.; Hussain, A. Synthesis, characterization, applications, and challenges of iron oxide nanoparticles. Nanotechnol. Sci. Appl. 2016, 9, 49–67. [Google Scholar] [CrossRef] [PubMed] [Green Version]
  2. Saha, P.; Rakshit, R.; Alam, M.; Mandal, K. Magnetic and Electronic Properties of Zn -Doped Fe3O4 Hollow Nanospheres. Phys. Rev. Appl. 2019, 11, 024059. [Google Scholar] [CrossRef]
  3. Mondal, D.; Phukan, G.; Paul, N.; Borah, J. Improved self heating and optical properties of bifunctional Fe3O4/ZnS nanocomposites for magnetic hyperthermia application. J. Magn. Magn. Mater. 2021, 528, 167809. [Google Scholar] [CrossRef]
  4. Ge, S.; Shi, X.; Sun, K.; Li, C.; Uher, C.; Baker, J.R., Jr.; Banaszak Holl, M.M.; Orr, B.G. Facile Hydrothermal Synthesis of Iron Oxide Nanoparticles with Tunable Magnetic Properties. J. Phys. Chem. C 2009, 113, 13593–13599. [Google Scholar] [CrossRef] [Green Version]
  5. Pu, Y.; Tao, X.; Zeng, X.; Le, Y.; Chen, J.-F. Synthesis of Co–Cu–Zn doped Fe3O4 nanoparticles with tunable morphology and magnetic properties. J. Magn. Magn. Mater. 2010, 322, 1985–1990. [Google Scholar] [CrossRef]
  6. Bram, S.; Gordon, M.N.; Carbonell, M.A.; Pink, M.; Stein, B.D.; Morgan, D.G.; Aguilà, D.; Aromí, G.; Skrabalak, S.E.; Losovyj, Y.; et al. Zn2+ Ion Surface Enrichment in Doped Iron Oxide Nanoparticles Leads to Charge Carrier Density Enhancement. ACS Omega 2018, 3, 16328–16337. [Google Scholar] [CrossRef] [PubMed] [Green Version]
  7. Priya, R.S.; Kumar, E.R.; Balamurugan, A.; Srinivas, C. Green synthesized MgFe2O4 ferrites nanoparticles for biomedical applications. Appl. Phys. A 2021, 127, 538. [Google Scholar] [CrossRef]
  8. Wu, W.; He, Q.; Jiang, C. Magnetic Iron Oxide Nanoparticles: Synthesis and Surface Functionalization Strategies. Nanoscale Res. Lett. 2008, 3, 397–415. [Google Scholar] [CrossRef] [Green Version]
  9. Agrawal, S.; Parveen, A.; Azam, A. Structural, electrical, and optomagnetic tweaking of Zn doped CoFe2−ZnO4− nanoparticles. J. Magn. Magn. Mater. 2016, 414, 144–152. [Google Scholar] [CrossRef]
  10. Dantas, J.; Leal, E.; Mapossa, A.; Cornejo, D.; Costa, A. Magnetic nanocatalysts of Ni0.5Zn0.5Fe2O4 doped with Cu and performance evaluation in transesterification reaction for biodiesel production. Fuel 2017, 191, 463–471. [Google Scholar] [CrossRef]
  11. Besenhard, M.O.; LaGrow, A.P.; Hodzic, A.; Kriechbaum, M.; Panariello, L.; Bais, G.; Loizou, K.; Damilos, S.; Cruz, M.M.; Thanh, N.T.K.; et al. Co-precipitation synthesis of stable iron oxide nanoparticles with NaOH: New insights and continuous production via flow chemistry. Chem. Eng. J. 2020, 399, 125740. [Google Scholar] [CrossRef]
  12. Su, X.; Chen, S.; Zhou, Z. Synthesis and characterization of monodisperse porous α-Al2O3 nanoparticles. Appl. Surf. Sci. 2012, 258, 5712–5715. [Google Scholar] [CrossRef]
  13. Joseph, J.A.; Nair, S.B.; John, S.S.; Remillard, S.K.; Shaji, S.; Philip, R.R. Zinc-doped iron oxide nanostructures for enhanced photocatalytic and antimicrobial applications. J. Appl. Electrochem. 2021, 51, 521–538. [Google Scholar] [CrossRef]
  14. Choodamani, C.; Nagabhushana, G.; Ashoka, S.; Prasad, B.D.; Rudraswamy, B.; Chandrappa, G. Structural and magnetic studies of Mg(1−x)ZnxFe2O4 nanoparticles prepared by a solution combustion method. J. Alloys Compd. 2013, 578, 103–109. [Google Scholar] [CrossRef] [Green Version]
  15. Pradhan, G.K.; Martha, S.; Parida, K.M. Synthesis of Multifunctional Nanostructured Zinc–Iron Mixed Oxide Photocatalyst by a Simple Solution-Combustion Technique. ACS Appl. Mater. Interfaces 2011, 4, 707–713. [Google Scholar] [CrossRef]
  16. Kumar, P.; Inwati, G.K.; Mathpal, M.C.; Ghosh, S.; Roos, W.; Swart, H. Defects induced enhancement of antifungal activities of Zn doped CuO nanostructures. Appl. Surf. Sci. 2021, 560, 150026. [Google Scholar] [CrossRef]
  17. Kumar, P.; Mathpal, M.C.; Ghosh, S.; Inwati, G.K.; Maze, J.R.; Duvenhage, M.-M.; Roos, W.; Swart, H. Plasmonic Au nanoparticles embedded in glass: Study of TOF-SIMS, XPS and its enhanced antimicrobial activities. J. Alloys Compd. 2022, 909, 164789. [Google Scholar] [CrossRef]
  18. Leveneur, J.; Waterhouse, G.I.N.; Kennedy, J.; Metson, J.B.; Mitchell, D.R.G. Nucleation and Growth of Fe Nanoparticles in SiO2: A TEM, XPS, and Fe L-Edge XANES Investigation. J. Phys. Chem. C 2011, 115, 20978–20985. [Google Scholar] [CrossRef]
  19. McLoughlin, T.; Babbitt, W.R.; Himmer, P.A.; Nakagawa, W. Auger electron spectroscopy for surface ferroelectric domain differentiation in selectively poled MgO:LiNbO3. Opt. Mater. Express 2020, 10, 2379–2393. [Google Scholar] [CrossRef]
  20. Mouder, J.F.; Stickle, W.F.; Sobol, P.E.; Bomben, K.D. Handbook of X-ray Photoelectron Spectroscopy; Chastain, J., Ed.; Perkin-Elmer Coporation: Waltham, MA, USA, 1992. [Google Scholar]
  21. Varma, A.; Mukasyan, A.S.; Rogachev, A.S.; Manukyan, K.V. Solution Combustion Synthesis of Nanoscale Materials. Chem. Rev. 2016, 116, 14493–14586. [Google Scholar] [CrossRef]
  22. Pramila, S.; Ranganatha, V.L.; Nagaraju, G.; Mallikarjunaswamy, C. Microwave and combustion methods: A comparative study of synthesis, characterization, and applications of NiO nanoparticles. Inorg. Nano-Metal Chem. 2022, 1–12. [Google Scholar] [CrossRef]
  23. Maslen, E.N.; Streltsov, V.A.; Streltsova, N.R.; Ishizawa, N. Synchrotron X-ray study of the electron density in α-Fe2O3. Acta Crystallogr. Sect. B Struct. Sci. 1994, 50, 435–441. [Google Scholar] [CrossRef]
  24. Schäfer, W.; Kockelmann, W.A.; Kirfel, A.; Potzel, W.; Burghart, F.; Kalvius, G.; Martin, A.; Kaczmarek, W.; Campbell, S. Structural and Magnetic Variations of ZnFe2O4 Spinels-Neutron Powder Diffraction Studies. Mater. Sci. Forum 2000, 321–324, 802–807. [Google Scholar] [CrossRef]
  25. Kumar, P.; Sharma, V.; Singh, J.P.; Kumar, A.; Chahal, S.; Sachdev, K.; Chae, K.; Kumar, A.; Asokan, K.; Kanjilal, D. Investigations on magnetic and electrical properties of Zn doped Fe2O3 nanoparticles and their correlation with local electronic structures. J. Magn. Magn. Mater. 2019, 489, 165398. [Google Scholar] [CrossRef]
  26. Chahal, S.; Kumar, A.; Kumar, P. Zn Doped α-Fe2O3: An Efficient Material for UV Driven Photocatalysis and Electrical Conductivity Suman. Crystals 2020, 10, 273. [Google Scholar]
  27. Kumar, P.; Kumar, A.; Rizvi, M.A.; Moosvi, S.K.; Krishnan, V.; Duvenhage, M.; Roos, W.; Swart, H. Surface, optical and photocatalytic properties of Rb doped ZnO nanoparticles. Appl. Surf. Sci. 2020, 514, 145930. [Google Scholar] [CrossRef]
  28. Kumar, P.; Mathpal, M.C.; Jagannath, G.; Prakash, J.; Maze, J.; Roos, W.D.; Swart, H.C. Optical limiting applications of resonating plasmonic Au nanoparticles in a dielectric glass medium. Nanotechnology 2021, 32, 345709. [Google Scholar] [CrossRef]
  29. Yamashita, T.; Hayes, P. Analysis of XPS spectra of Fe2+ and Fe3+ ions in oxide materials. Appl. Surf. Sci. 2008, 254, 2441–2449. [Google Scholar] [CrossRef]
  30. Wang, S.; Meng, C.; Bai, Y.; Wang, Y.; Liu, P.; Pan, L.; Zhang, L.; Yin, Z.; Tang, N. Synergy Promotion of Elemental Doping and Oxygen Vacancies in Fe2O3 Nanorods for Photoelectrochemical Water Splitting. ACS Appl. Nano Mater. 2022, 5, 6781–6791. [Google Scholar] [CrossRef]
  31. Al Khabouri, S.; Al Harthi, S.; Maekawa, T.; Nagaoka, Y.; Elzain, M.E.; Al Hinai, A.; Al-Rawas, A.D.; Gismelseed, A.M.; Yousif, A.A. Composition, Electronic and Magnetic Investigation of the Encapsulated ZnFe2O4 Nanoparticles in Multiwall Carbon Nanotubes Containing Ni Residuals. Nanoscale Res. Lett. 2015, 10, 262. [Google Scholar] [CrossRef] [Green Version]
  32. Fu, B.; Hower, J.C.; Dai, S.; Mardon, S.M.; Liu, G. Determination of Chemical Speciation of Arsenic and Selenium in High-As Coal Combustion Ash by X-ray Photoelectron Spectroscopy: Examples from a Kentucky Stoker Ash. ACS Omega 2018, 3, 17637–17645. [Google Scholar] [CrossRef] [PubMed]
  33. Beisinger, M.C.; Lau, L.W.M.; Gerson, A.R.; Smart, R.S.C. The role of the Auger parameter in XPS studies of nickel metal, halides and oxides. Phys. Chem. Chem. Phys. 2012, 14, 2434–2442. [Google Scholar] [CrossRef] [PubMed]
  34. Lesiak, B.; Rangam, N.; Jiricek, P.; Gordeev, I.; Tóth, J.; Kövér, L.; Mohai, M.; Borowicz, P. Surface Study of Fe3O4 Nanoparticles Functionalized With Biocompatible Adsorbed Molecules. Front. Chem. 2019, 7, 642. [Google Scholar] [CrossRef] [PubMed] [Green Version]
  35. Rivera, L.M.R.; Machado, J.G.; Mathpal, M.C.; Chaves, N.L.; Gregurec, D.; Báo, S.N.; Paterno, L.G.; Moya, S.E.; Azevedo, R.B.; Soler, M.A.G. Functional glucosamine-iron oxide nanocarriers. J. Mater. Res. 2020, 35, 1726–1737. [Google Scholar] [CrossRef]
  36. Mathpal, M.C.; Tripathi, A.K.; Singh, M.K.; Gairola, S.P.; Pandey, S.N.; Agarwal, A. Effect of annealing temperature on Raman spectra of TiO2 nanoparticles. Chem. Phys. Lett. 2013, 555, 182–186. [Google Scholar] [CrossRef]
  37. Gaur, L.K.; Mathpal, M.C.; Kumar, P.; Gairola, S.; Agrahari, V.; Martinez, M.; Aragon, F.; Soler, M.A.; Swart, H.; Agarwal, A. Observations of phonon anharmonicity and microstructure changes by the laser power dependent Raman spectra in Co doped SnO2 nanoparticles. J. Alloys Compd. 2020, 831, 154836. [Google Scholar] [CrossRef]
  38. Aquino, C.L.E.; Balela, M.D.L. Thermally grown Zn-doped hematite (α-Fe2O3) nanostructures for efficient adsorption of Cr(VI) and Fenton-assisted degradation of methyl orange. SN Appl. Sci. 2020, 2, 2099. [Google Scholar] [CrossRef]
  39. Jubb, A.; Allen, H.C. Vibrational Spectroscopic Characterization of Hematite, Maghemite, and Magnetite Thin Films Produced by Vapor Deposition. ACS Appl. Mater. Interfaces 2010, 2, 2804–2812. [Google Scholar] [CrossRef]
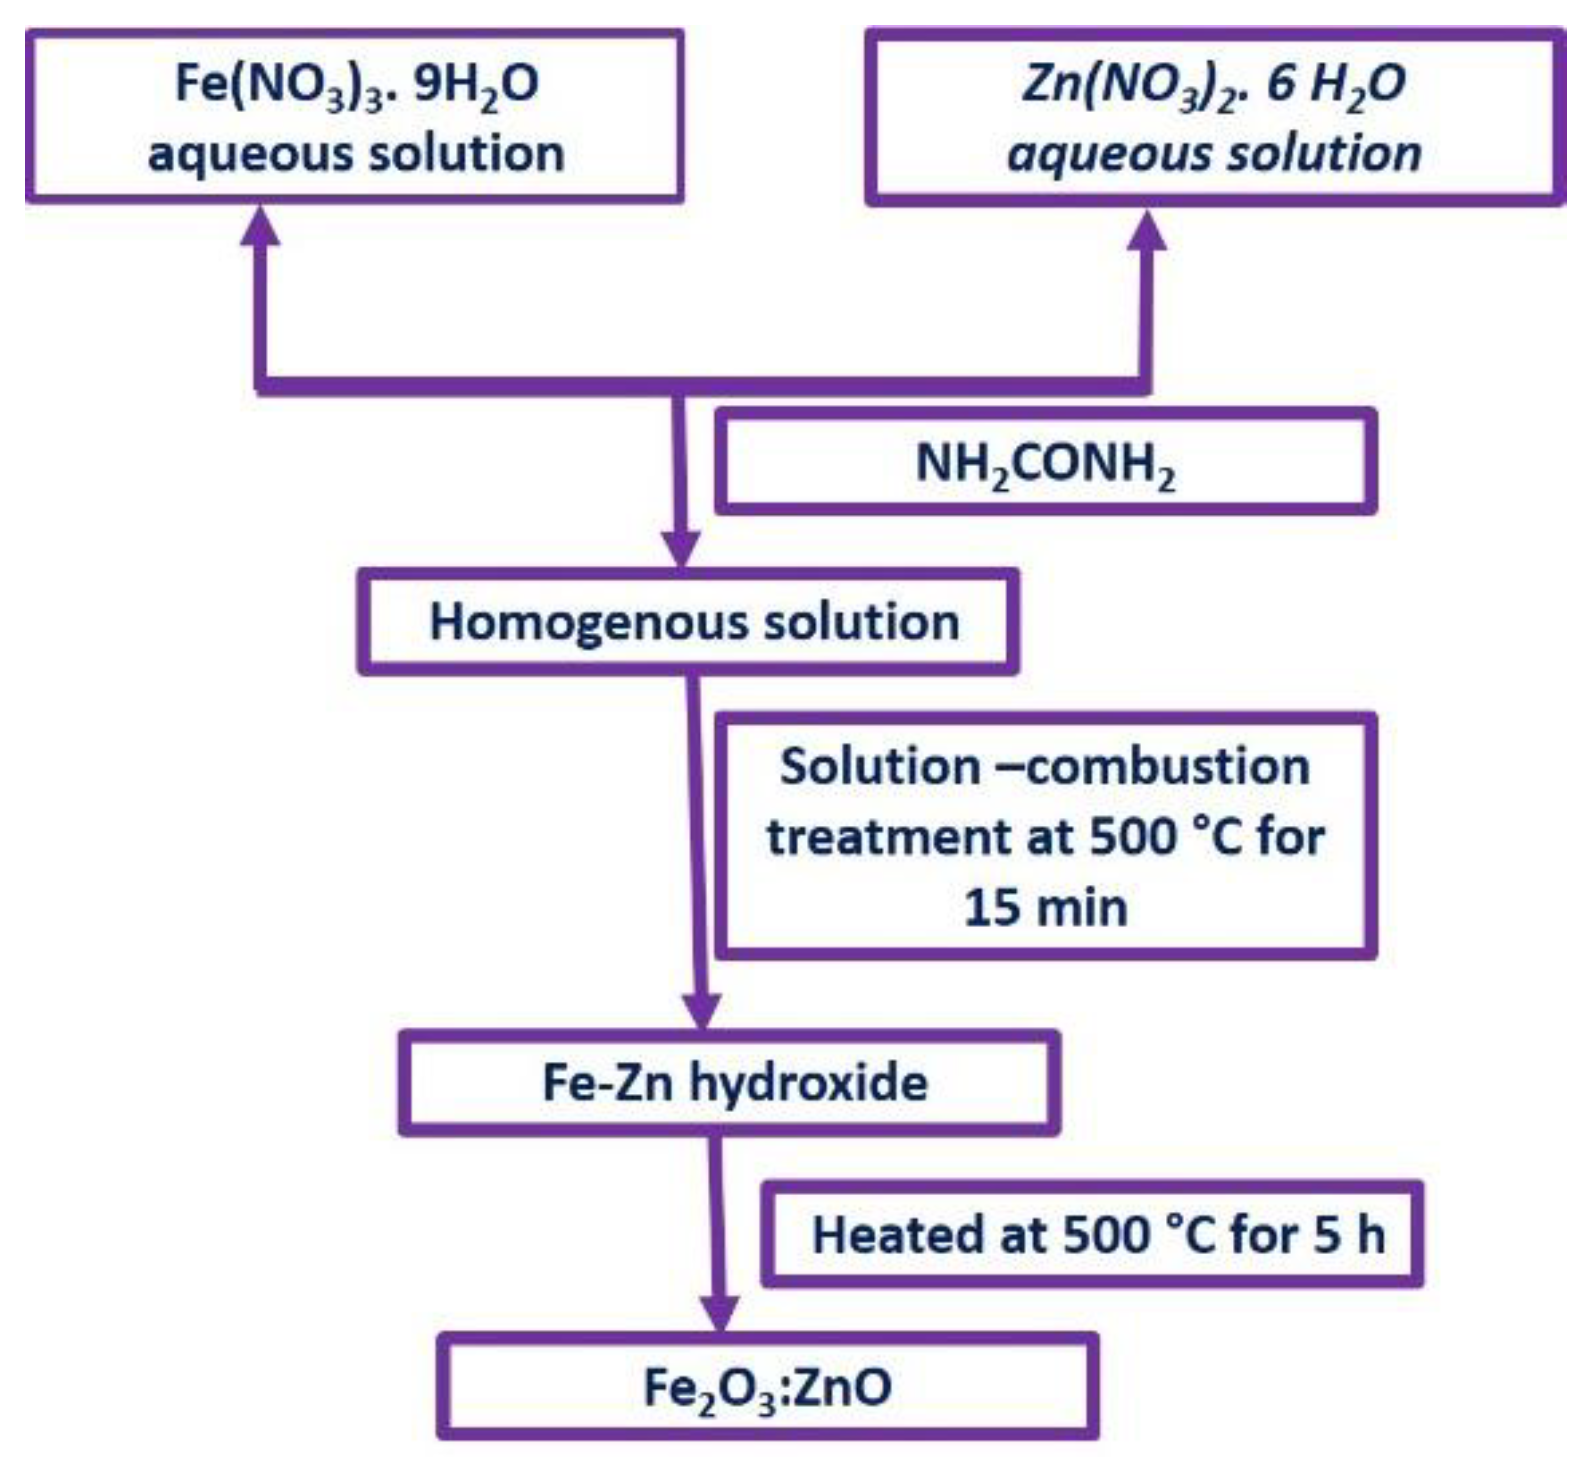
Figure 1. Schematic diagram depicting the formation of the Fe2O3:ZnO NPs using a combustion technique.
Magnetochemistry 09 00020 g001
Figure 2. (ae) XRD patterns of pure Fe2O3 and doped with 1%, 3%, 5% and 7% Zn, respectively.
Magnetochemistry 09 00020 g002
Figure 3. SEM micrograph: (a) pure Fe2O3 and (d) Zn 7 %: Fe2O3, respectively; (b,e) are their EDS spectra, respectively, while (c,f) represent their respective color − mapping for elemental detection.
Magnetochemistry 09 00020 g003
Figure 4. Micrographs recorded by TEM and their particle size distribution curve: (A,a) pure Fe2O3; (B,b) 3% Zn−doped Fe2O3; (C,c) 5% Zn−doped Fe2O3; and (D,d) 7% Zn−doped Fe2O3.
Magnetochemistry 09 00020 g004
Figure 5. XPS spectra: (a) general surveys; (b) C−1s; (c) Fe 2p for pure Fe2O3 sample; (d) Fe2p for Fe2O3 doped with Zn (7%); (e) FeLMM peak of pure Fe2O3; and (f) FeLMM for Fe2O3 doped with Zn (7%).
Magnetochemistry 09 00020 g005
Figure 6. XPS spectra: (a,c) Zn 2p and Zn LMM for pure Fe2O3 sample; and (b,d) Zn 2p and Zn LMM for Fe2O3 sample doped with Zn (7%).
Magnetochemistry 09 00020 g006
Figure 7. XPS spectra: (a) Wagner plots for Fe 2p; (b) Wagner plots for Zn 2p; (c) O−1s for pure Fe2O3; and (d) O−1s for Fe2O3 doped with Zn (7%).
Magnetochemistry 09 00020 g007
Figure 8. Raman spectra of: (a) pure Fe2O3 and doped with Zn; (b) 1%; (c) 3%; (d) 5%; and (e) 7%, respectively.
Magnetochemistry 09 00020 g008
Table 1. Lattice parameters and phase fraction for pure and Zn−doped Fe2O3 nanoparticles.
Zn (%)α–Fe2O3 Phase ZnFe2O4 Phase
a (Å)c (Å)Phase Fraction (%)Density (g/cm3)Crystallite Size (nm)a (Å)Phase Fraction (%)Density (g/cm3)
05.02613.7221004.9444.5--0--
15.03113.7261004.9926--0--
35.02413.7171005.0933--0--
55.03213.73174.135.07278.42925.875.02
75.03213.73848.505.08248.45851.505.17
Table 2. Raman vibrational modes in pure Fe2O3 and 1 to 7 % Zn−doped samples respectively.
Name of Phase of the NanomaterialsRaman Vibration Mode (in cm−1), [Reference in Bracket] Pure Fe2O3 1% Zn-doped 3% Zn-doped5% Zn-doped7% Zn-doped
Hematite (α−Fe2O3)A1g modes [25,26,39]225.3
495
486.4494.7506.4514.7
Hematite (α−Fe2O3)Eg modes [25,26,38] 294.4
410.7
610.7
247
300.5
585
289.4
315.6,
581.6,
629.4
308.8
593.5
315.8
602.6
Maghemite (γ−Fe2O3)Eg or T2g modes [34,38,39] 334.8347.9341.6345.5
Hematite (α−Fe2O3)A2u modes [39] 382.8384
Hematite (α−Fe2O3)Eu −one phonon mode [39] 453.4456.9465.2470.2
Hematite (α−Fe2O3)Eu −LO (longitudinal optical mode due to the defects) [38,39] 642.4660.8646.6647.9
Zinc Ferrite (ZnFe2O4)A1g modes [25,38,39] 685.2689.2690.7689
Maghemite (γ−Fe2O3)A1g modes [35,39] 716.8717.6715.7707.5
Disclaimer/Publisher’s Note: The statements, opinions and data contained in all publications are solely those of the individual author(s) and contributor(s) and not of MDPI and/or the editor(s). MDPI and/or the editor(s) disclaim responsibility for any injury to people or property resulting from any ideas, methods, instructions or products referred to in the content.