Article

Investigation of Heat Transfer Enhancement Techniques on a Scalable Novel Hybrid Thermal Management Strategy for Lithium-Ion Battery Packs

Faculty of Engineering and Applied Science, Ontario Tech University, 2000 Simcoe Street North, Oshawa, ON L1H 7K4, Canada
*
Author to whom correspondence should be addressed.
Batteries 2024, 10(1), 32; https://doi.org/10.3390/batteries10010032
Submission received: 1 December 2023 / Revised: 12 January 2024 / Accepted: 16 January 2024 / Published: 18 January 2024
(This article belongs to the Special Issue Thermal Management System for Lithium-Ion Batteries)

Abstract

:
This paper introduces a novel hybrid thermal management strategy, which uses secondary coolants (air and fluid) to extract heat from a phase change material (paraffin), resulting in an increase in the phase change material’s heat extraction capability and the battery module’s overall thermal performance. A novel cold plate design is developed and placed between the rows and columns of the cells. The cold plate contains a single fluid body to improve the thermal performance of the battery module. Experimental studies were conducted to obtain the temperature and heat flux profiles of the battery module. Moreover, a numerical model is developed and validated using the experimental data obtained. The numerical data stayed within ±2% of the experimental data. In addition, the ability of nanoparticles to increase the thermal conductivity of water is examined and it is found that the cooling from the liquid cooling component is not sensitive enough to capture the 0.32 W/m K increase in the thermal conductivity of the fluid. Furthermore, in order to enhance the air cooling, fins were added within the air duct to the cold plate. However, this is not feasible, as the pressure drop through the addition of the fins increased by ~245%, whereas the maximum temperature of the battery module reduced by only 0.6 K. Finally, when scaled up to an entire battery pack at a high discharge rate of 7 C, the numerical results showed that the overall temperature uniformity across the pack was 1.14 K, with a maximum temperature of 302.6 K, which was within the optimal operating temperature and uniformity ranges. Therefore, the developed thermal management strategy eliminates the requirement of a pump and reservoir and can be scaled up or down according to the energy and power requirements.

1. Introduction

A major issue encountered by the transportation industry is the reduction in greenhouse gas emissions, as they are responsible for 29% of the overall emissions [1]. To overcome this issue, transportation electrification was introduced, and lithium-ion (Li-ion) batteries are currently being used to develop electric vehicle (EV) packs. This is mainly due to the low rate of the self-discharge of the Li-ion cells, the high energy density, the extended lifecycle, and the high power density [2,3,4]. However, thermal issues related to Li-ion batteries need resolution, as they require a narrow operating temperature range for effective performance [5].
The strategies developed for thermal management (TMS) are based on the primary strategies that include air, fluid, and phase change material (PCM). The most cost-effective is the air-based TMS; however, air has limited cooling capabilities due to its low thermal properties [6]. Fluids generally have higher cooling capacities compared to air; therefore, they are capable of improved cooling and can effectively maintain the required thermal environment for the operation of the Li-ion cells [7]. The simplest form of liquid-based TMS is designed using electrically insulating fluids. These fluids extract heat from the cell’s surface through direct contact [8,9,10]. Usually, there is an increased viscosity associated with these fluids, which results in the requirement of a large pumping capacity. Moreover, in large battery packs, there is an increased risk of the leakage of the fluid that can cause unfavorable effects on the electrical battery pack [11]. To counter these issues, electrically noninsulating fluids are utilized. They have lower viscosities compared to insulating fluids; therefore, they require less pumping power. In order to incorporate them into the battery pack, cold plates are used that contain these fluids. The cold plates are connected to the cells’ surface to extract heat. However, the application of the cold plates is restricted to rectangular cell geometries because the degree of manufacturing difficulty for cylindrical cells is higher [12,13,14]. An alternative to a cold plate is to use serpentine liquid channels developed to run through the cylindrical cell rows. These liquid channels contain electrically noninsulating fluids. In these cases, the part of the cell in contact with the channels cools at a higher rate than the part not in contact, causing temperature nonuniformity. Zhao et al. [15] developed multiple configurations of serpentine channels, and temperature uniformity occurred incrementally in the streamwise direction of the contact surface area with the liquid channels. Furthermore, to eliminate the restrictions of using cold plates for cylindrical cells, Rao et al. [16] used variable-sized blocks of aluminum placed in contact with the cylindrical cells, and the length of the block was varied to achieve uniform cooling through the battery pack. Liquid channels ran within these aluminum blocks to extract heat from the blocks. Liquid cooling is effective at extracting heat from the cells; however, the high pumping power causes a hindrance in its application within the battery packs [17].
PCMs are also effective in extracting heat through latent heat capacity. Initially, its use was suggested by Al-Hallaj and Selman [18], and later on, Javani et al. [19] showed that a high thermal uniformity is achievable in battery packs. Jiang et al. [20] applied a composite phase change material (CPCM), and maximum temperatures were limited to 44 °C. This CPCM was developed by combining a paraffin base with expanded graphite (EG) to increase the thermal conductivity. In comparison, through a 1 m/s airflow, the temperature reached 72 °C. He et al. [21] conducted an investigation with the EG/paraffin CPCM, and the results concluded with a 2.82 °C of temperature uniformity with 7% of EG. This was considered as the optimum EG proportion within the CPCM. Furthermore, a novel CPCM composition was investigated by Hussain et al. [22]. For the CPCM, the nickel foam was coated with saturated paraffin and graphene. Based on the results, when compared to pure paraffin, the thermal conductivity of the CPCM increased 23-fold. A novel CPCM consisting of dual regions of two different phase change temperatures was designed by Ye et al. [23]. The lower temperature region was activated at regular ambient temperatures. This enabled the TMS to maintain the battery module temperature between 25.9 and 34.9 °C. Similarly, at high ambient temperatures, the higher temperature region was activated. Through this, the battery module temperature was kept below 49.2 °C. In addition to dual phase change temperature regions, EG was added to the CPCM, and 1.98 W/m K of thermal conductivity was achieved. Additionally, a flexible CPCM was studied by Wu et al. [24]. The flexibility of the CPCM allowed it to encase the cylindrical geometry of the cell completely, which increased the surface area in contact with the cell, resulting in increased heat transfer. The novel CPCM had a thermal conductivity of 1.64 W/m K and exhibited better flexibility between −5 and 20 °C. Compared to a rigid CPCM, the results concluded a 4 °C reduction in the maximum temperature. Furthermore, Faraji et al. [25] developed a CPCM by adding hybrid nanoparticles, and the results concluded a safe operation of the electronic components with a significantly high temperature uniformity. Arshad et al. [26] added copper nanoparticles to the PCM and the results showed that the heat transfer rates were increased by ~2.9%, which resulted in a reduction in the melting time of the PCM by ~2.6%. Faraji et al. [27] also studied the insertion of nanoparticles in the PCM by adding SiO2–MWCNT hybrid nanoparticles, and it was found that the melting time of the PCM increased by 92% compared to pure PCM, and the maximum temperature was reduced by 11 °C on the electronic components. The PCM application in the TMS exhibits promising results. However, its low overall heat transfer coefficient results in a hindrance to its mass adoption. When the PCM is utilized and completely melted, a secondary TMS is needed to charge the PCM.
Since there are a few drawbacks to using the cooling mediums individually in a TMS, hybrid TMSs are introduced that combine two or more cooling mediums. A simple hybrid system combines air and liquid cooling by incorporating mist into the airflow. This was investigated by Saw et al. [4], and it was concluded that 3% of vapors within 5 g/s of airflow is required to maintain the temperatures below 40 °C. Moreover, the natural evaporation of water was utilized by Wei and Agelin-Chaab [6,28]. Water channel strips within the battery pack were exposed to airflow. Through this, the water vapors were formed using natural evaporation and were incorporated into the airflow stream. Additionally, the air particles regained their heat capacity once they interacted with the water strips. This resulted in an improvement of 56% in the uniformity and 20% in temperature reduction. Wang et al. [29] studied a combination of cold plates and airflow. The cold plates were stationed below the cells, and the airflow circulated through cold plate surfaces to extract heat from the cold plates. Multiple strategies and concepts were tested. The temperature uniformity increased 2.42 times, and a further 3.45 °C maximum temperature reduction was achieved. In the authors’ previous study [30], a novel design was developed by attaching liquid jackets to cylindrical cells. The liquid jackets contained fluid, and since it was isolated to each cell, the design was capable of employing direct cooling by using electrically noninsulating fluids.
In this paper, a novel hybrid thermal management strategy is developed by incorporating air, liquid, and PCM cooling, and analyzed experimentally and numerically. In this strategy, the PCM is the primary coolant, which is in direct contact with the cells, whereas the liquid and air are secondary coolants, which extract the heat simultaneously from the PCM, resulting in the increased heat extraction capability of the PCM and the improved thermal performance of the battery module. In order to eliminate the fluid pumping power requirements, a novel cold plate is designed which houses a single body of stationary fluid and can be placed between the cell rows and columns to improve the thermal performance of the battery module. Additionally, a novel modular battery pack design is developed which is capable of scalability in power and energy. The principal objective of this paper is to maintain the maximum temperature of the battery module within the optimal ranges of 25–45 °C and attain high thermal uniformity within 5 °C. Moreover, secondary objectives are to eliminate the pumping power for the fluids and reduce the airflow velocity, which reduces the power requirements of the TMS.

2. Description of the Proposed Hybrid Strategy

2.1. Battery Module Configuration

Based on the objectives, novel hybrid thermal management strategy is designed and developed. The strategy consists of a combination of air cooling, liquid cooling, and PCM cooling systems. In order to develop the strategy, the following designs are considered:
  • The battery module should have a high temperature uniformity.
  • The fluid pumping power should be eliminated.
  • It should have modularity for scalability.
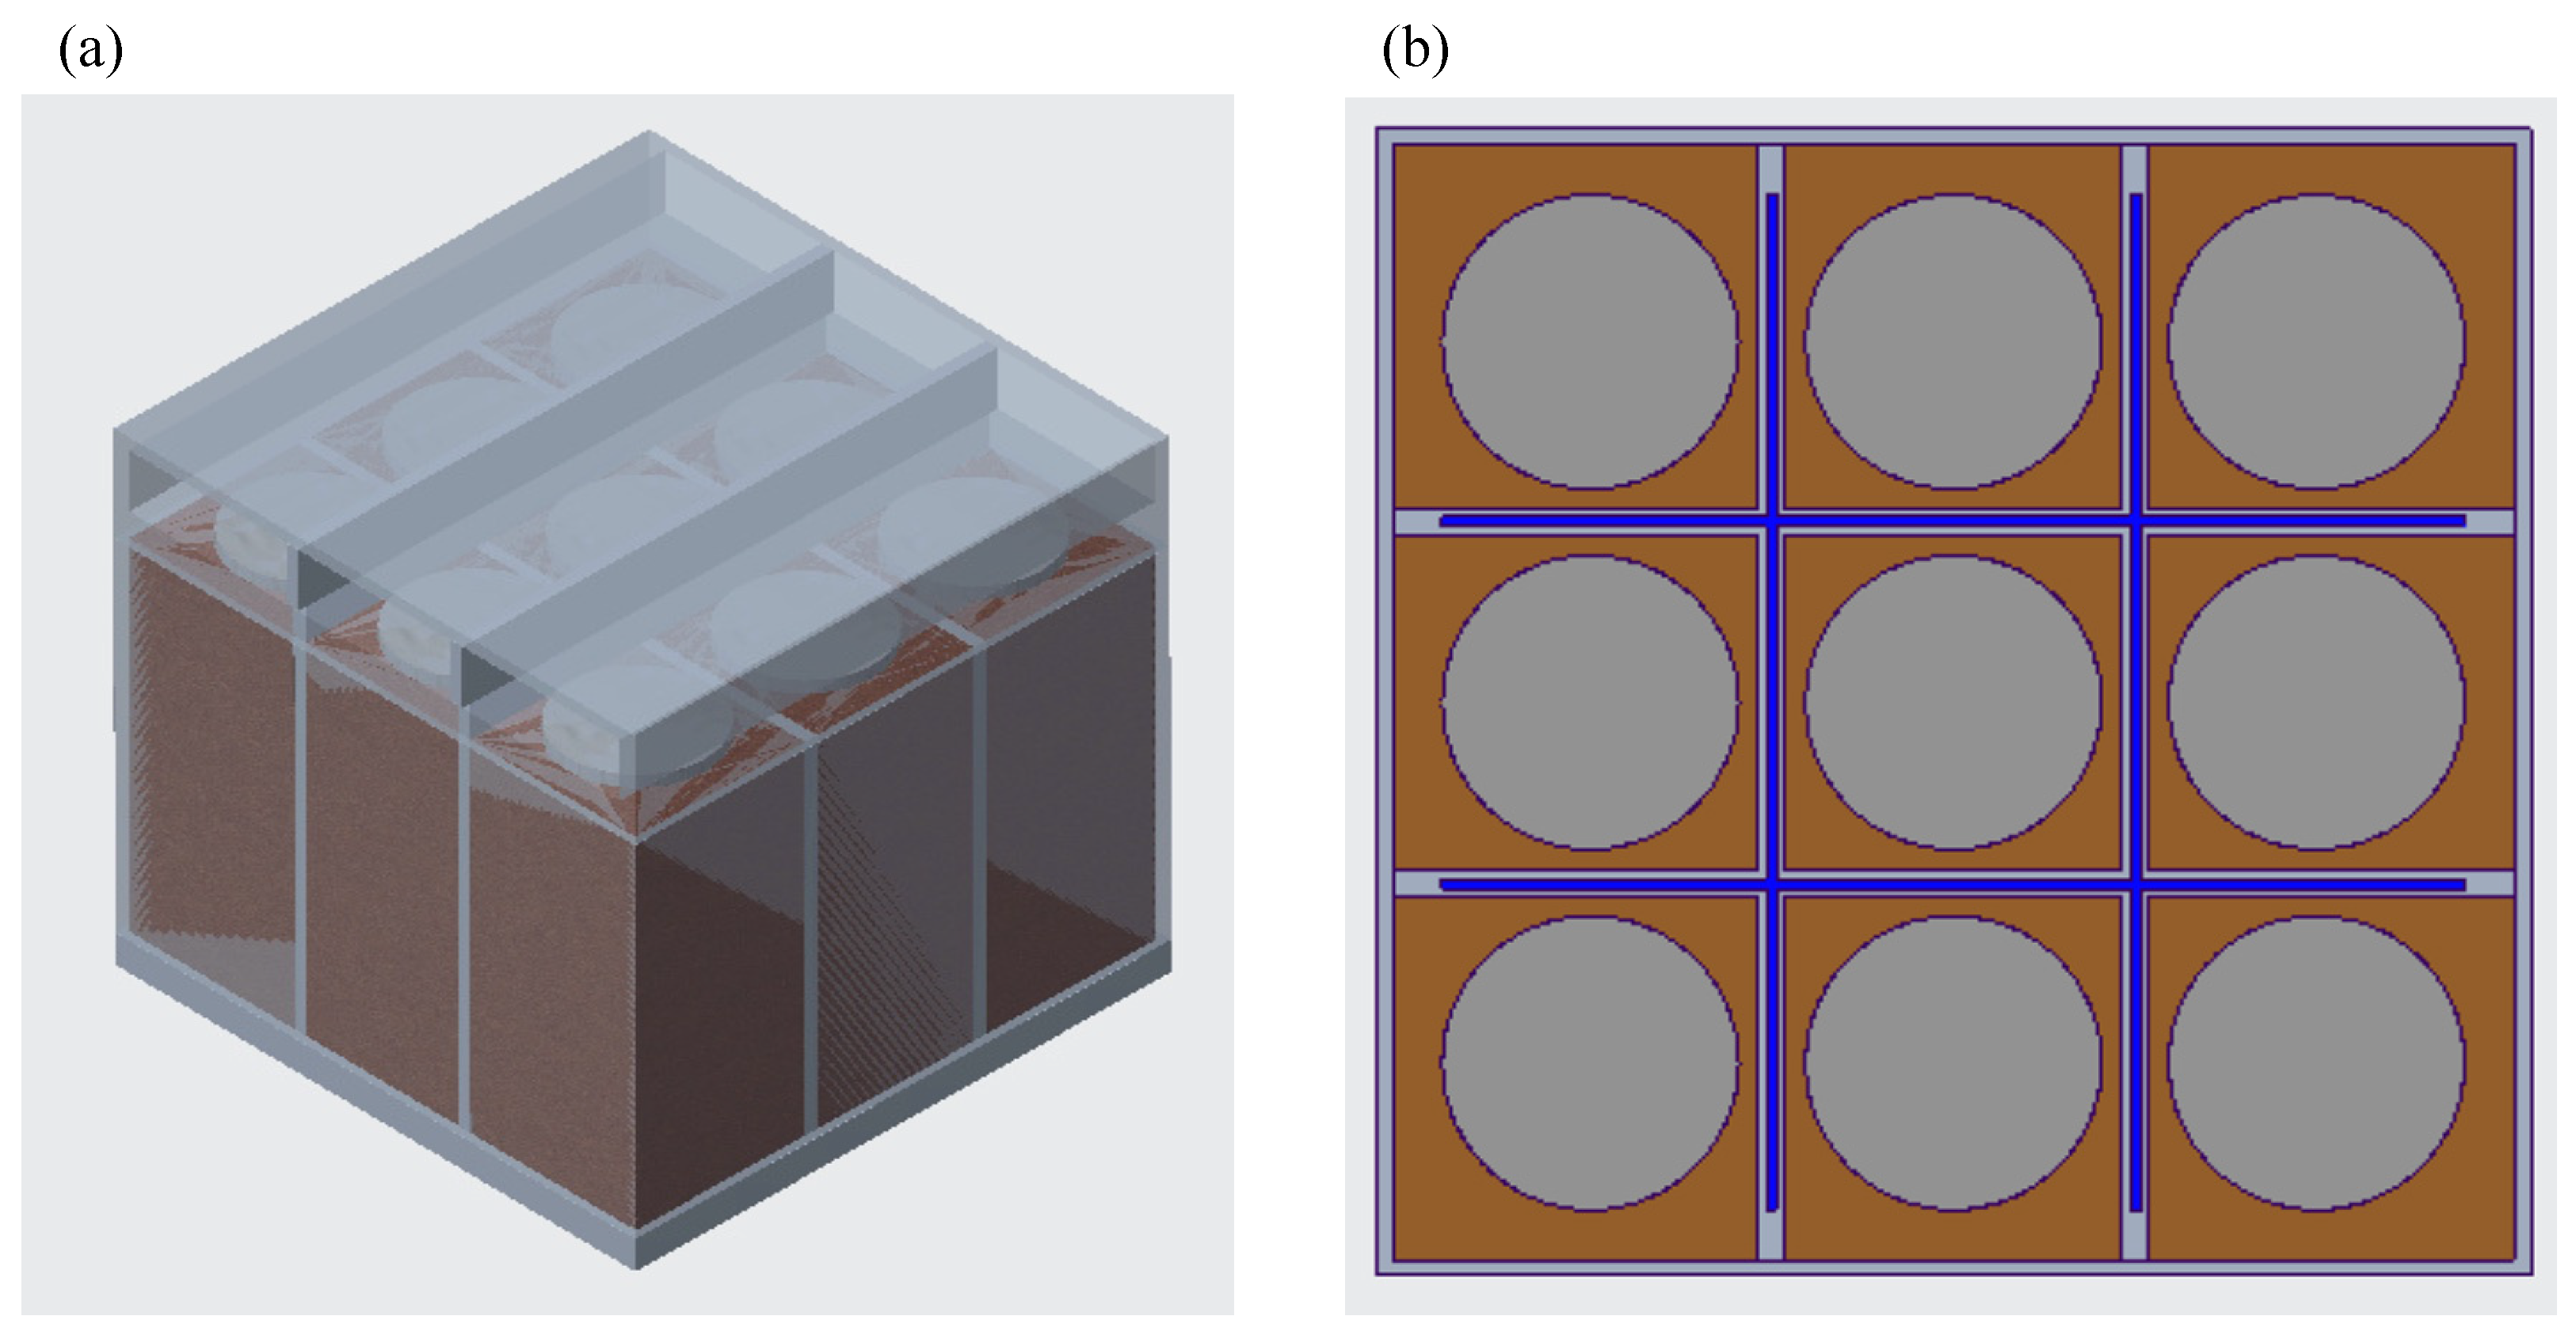
In the proposed hybrid strategy, PCM (paraffin) is used for direct cooling and airflow within the air duct and water in the cold plates is used for indirect cooling, as shown in Figure 1.
Rectangular cold plates of a 1.5 mm width and 0.5 mm wall thickness were added in between each cell’s rows and columns, which were completely filled with fluid, and which protrudes in the air duct. This cold plate was sealed and closed from all sides so that there was no leakage of fluid. The cold plates were all connected to each other, and the fluid within this was considered a single body of fluid. The working principle behind this is divided into three stages. In the initial stage, the heat will be extracted using the PCM through direct contact. In the intermediary stage, the fluid within the cold plates will extract heat simultaneously from the PCM. In the final stage, the air flows over the protruded cold plate and will be used to cool the fluid within it. Due to a single fluid body, the protrusion of the cold plate will allow the fluid in between the columns to cool as well. Since the fluid in this strategy is sealed, the requirement for a fluid pump and reservoir is eliminated, as shown in Figure 2.
Moreover, for the experimental and numerical validation, the module housing was made of wood, and paraffin was used as the PCM. Once the model was validated, for all the numerical studies, an all-aluminum housing was used, and a CPCM with a higher thermal conductivity was used.
Pure paraffin usually has a low thermal conductivity. In order to improve the cooling of the Li-ion batteries, researchers have worked on increasing the various properties of paraffin, including the thermal conductivity, using different types of property-enhancing materials (PEMs), such as expanded vermiculite, graphene oxide, carbon foam, copper foam, porous graphite foam, and expanded graphite. A review study by Mishra et al. [31] reviewed a paraffin-based PCM equipped with various PEMs for the past 17 years that were developed by researchers. For this study, a paraffin base combined with copper foam was selected as the CPCM, as it has a higher thermal conductivity of 3.11 W/m K and has a feasible phase change temperature range for Li-ion batteries. The material details are provided in Table 1.

2.2. Increasing the Thermal Conductivity of Water through Nanoparticles

The fluid within the cold plate is required to remove heat from the CPCM. Hence, thermal conductivity is one of the defining factors for heat removal. A high thermal conductivity will result in increased heat removal from the CPCM. To study this, the fluid within the cold plates was changed from pure water to water combined with nanoparticles. In order to select the nanoparticles, recent studies in open literature were reviewed [34,35,36,37,38,39], and it was found that 0.04% of silver and 0.16% multiwalled carbon nanotubes combined with a water base (H2O–AG–MWCNT) provided the highest thermal conductivity of 0.92 W/m K at 42.24 °C [36]. The temperature of 42.24 °C was selected, as it is the phase change temperature of the CPCM (the paraffin base with copper foam).

2.3. Addition of Fins in the Battery Module to Improve Heat Transfer

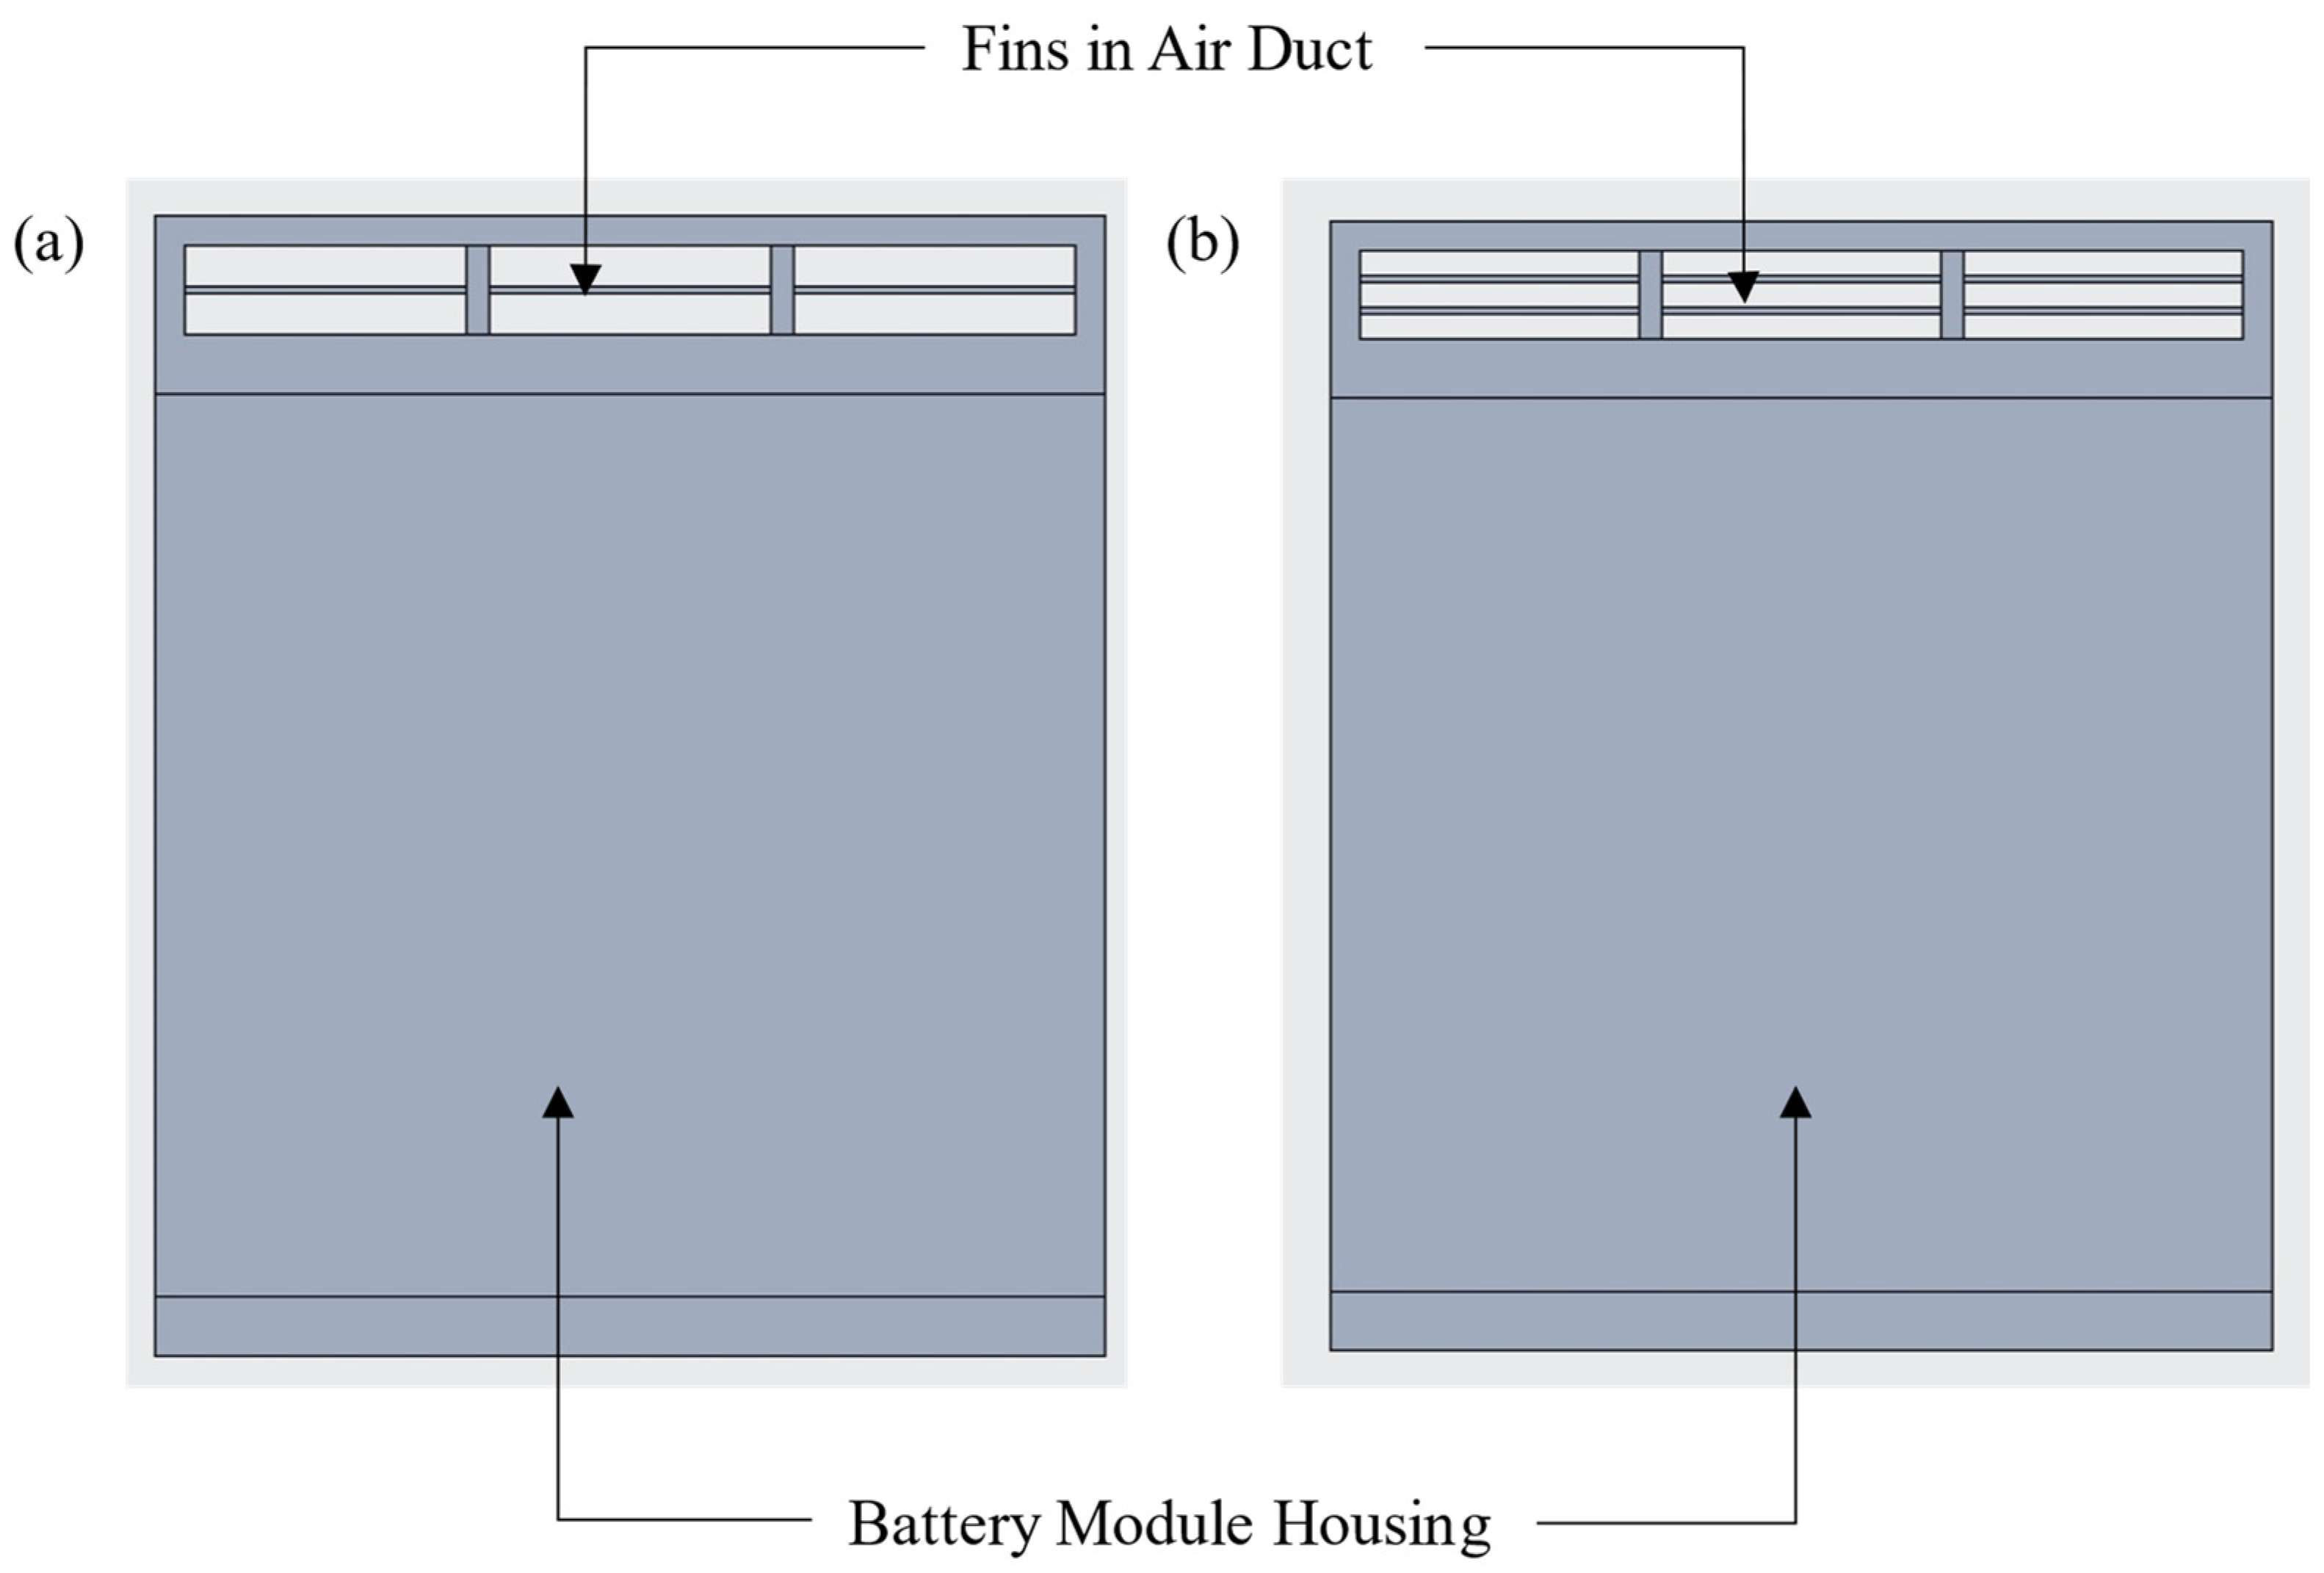
This study attempts to further improve cooling by increasing the heat transfer from the fluid in the cold plate to the airflow. This was done by adding fins to the cold plate region within the air duct. Two separate configurations were developed. In the first configuration, one fin of a thickness of 0.5 mm was added parallel to the airflow in the middle of the air duct, as shown in Figure 3a. In the second configuration, two fins were added parallel to the airflow, as shown in Figure 3b. In order to keep the same Reynolds number of 1950, the velocity increased at the inlet, and the details for the two configurations are provided in Table 2. The Reynolds nummber is calculated using the following equation:
R e = ρ v D μ

2.4. Scalability of the Battery Module

The battery module with no fins and water as the fluid was used to scale it to the entire battery pack. For reference, a Tesla 75 kWh battery pack with the dimensions of ~1660 mm in length, ~964 mm in width, and 174 mm in height and a total of 5880 cylindrical cells was used [40]. To accommodate the battery modules within the exact dimensions, 25 modules were connected in a series (in terms of the airflow), which amounted to 1600 mm of length, as shown in Figure 4a. Each series setup of modules (BMA) was connected 15 times in parallel (in terms of the airflow), which amounted to a width of 960 mm, as shown in Figure 4b.
Finally, two arrays of series and parallel modules were placed vertically on each other to amount to a height of 154 mm. Therefore, the total number of battery modules in the battery pack is 750, which contains a total of 6750 cylindrical cells. The modules in the width and height directions are in a parallel airflow; therefore, one series configuration of 25 modules, as shown in Figure 4a, was used for the evaluation of the scalability of the module. Since the spacing between the cells and cold plate is compact, it was not feasible to conduct the simulation for all 25 modules at once due to the high computational requirements. Therefore, the results were obtained for 2, 3, and 4 modules in a series, and the maximum temperature of the airflow and the battery modules was extrapolated. Moreover, a simulation was conducted for the airflow only across the 25 battery modules to obtain the pressure drop through the air duct. The schematic for the airflow domain is shown in Figure 5. The domain is based on a single airflow channel within the air duct.

3. Experimental Setup and Procedure

In this study, two separate experiments were conducted. In Experiment I, the heat flux profiles were obtained at the surface of a Samsung INR18650-25R cell. The heat flux profile was obtained as a boundary condition in the numerical modeling. In Experiment II, the battery module was manufactured, and the temperature measurements were obtained. The detailed experimental setup and procedure are described in the subsections below.

3.1. Experiment I—Heat Flux Measurement

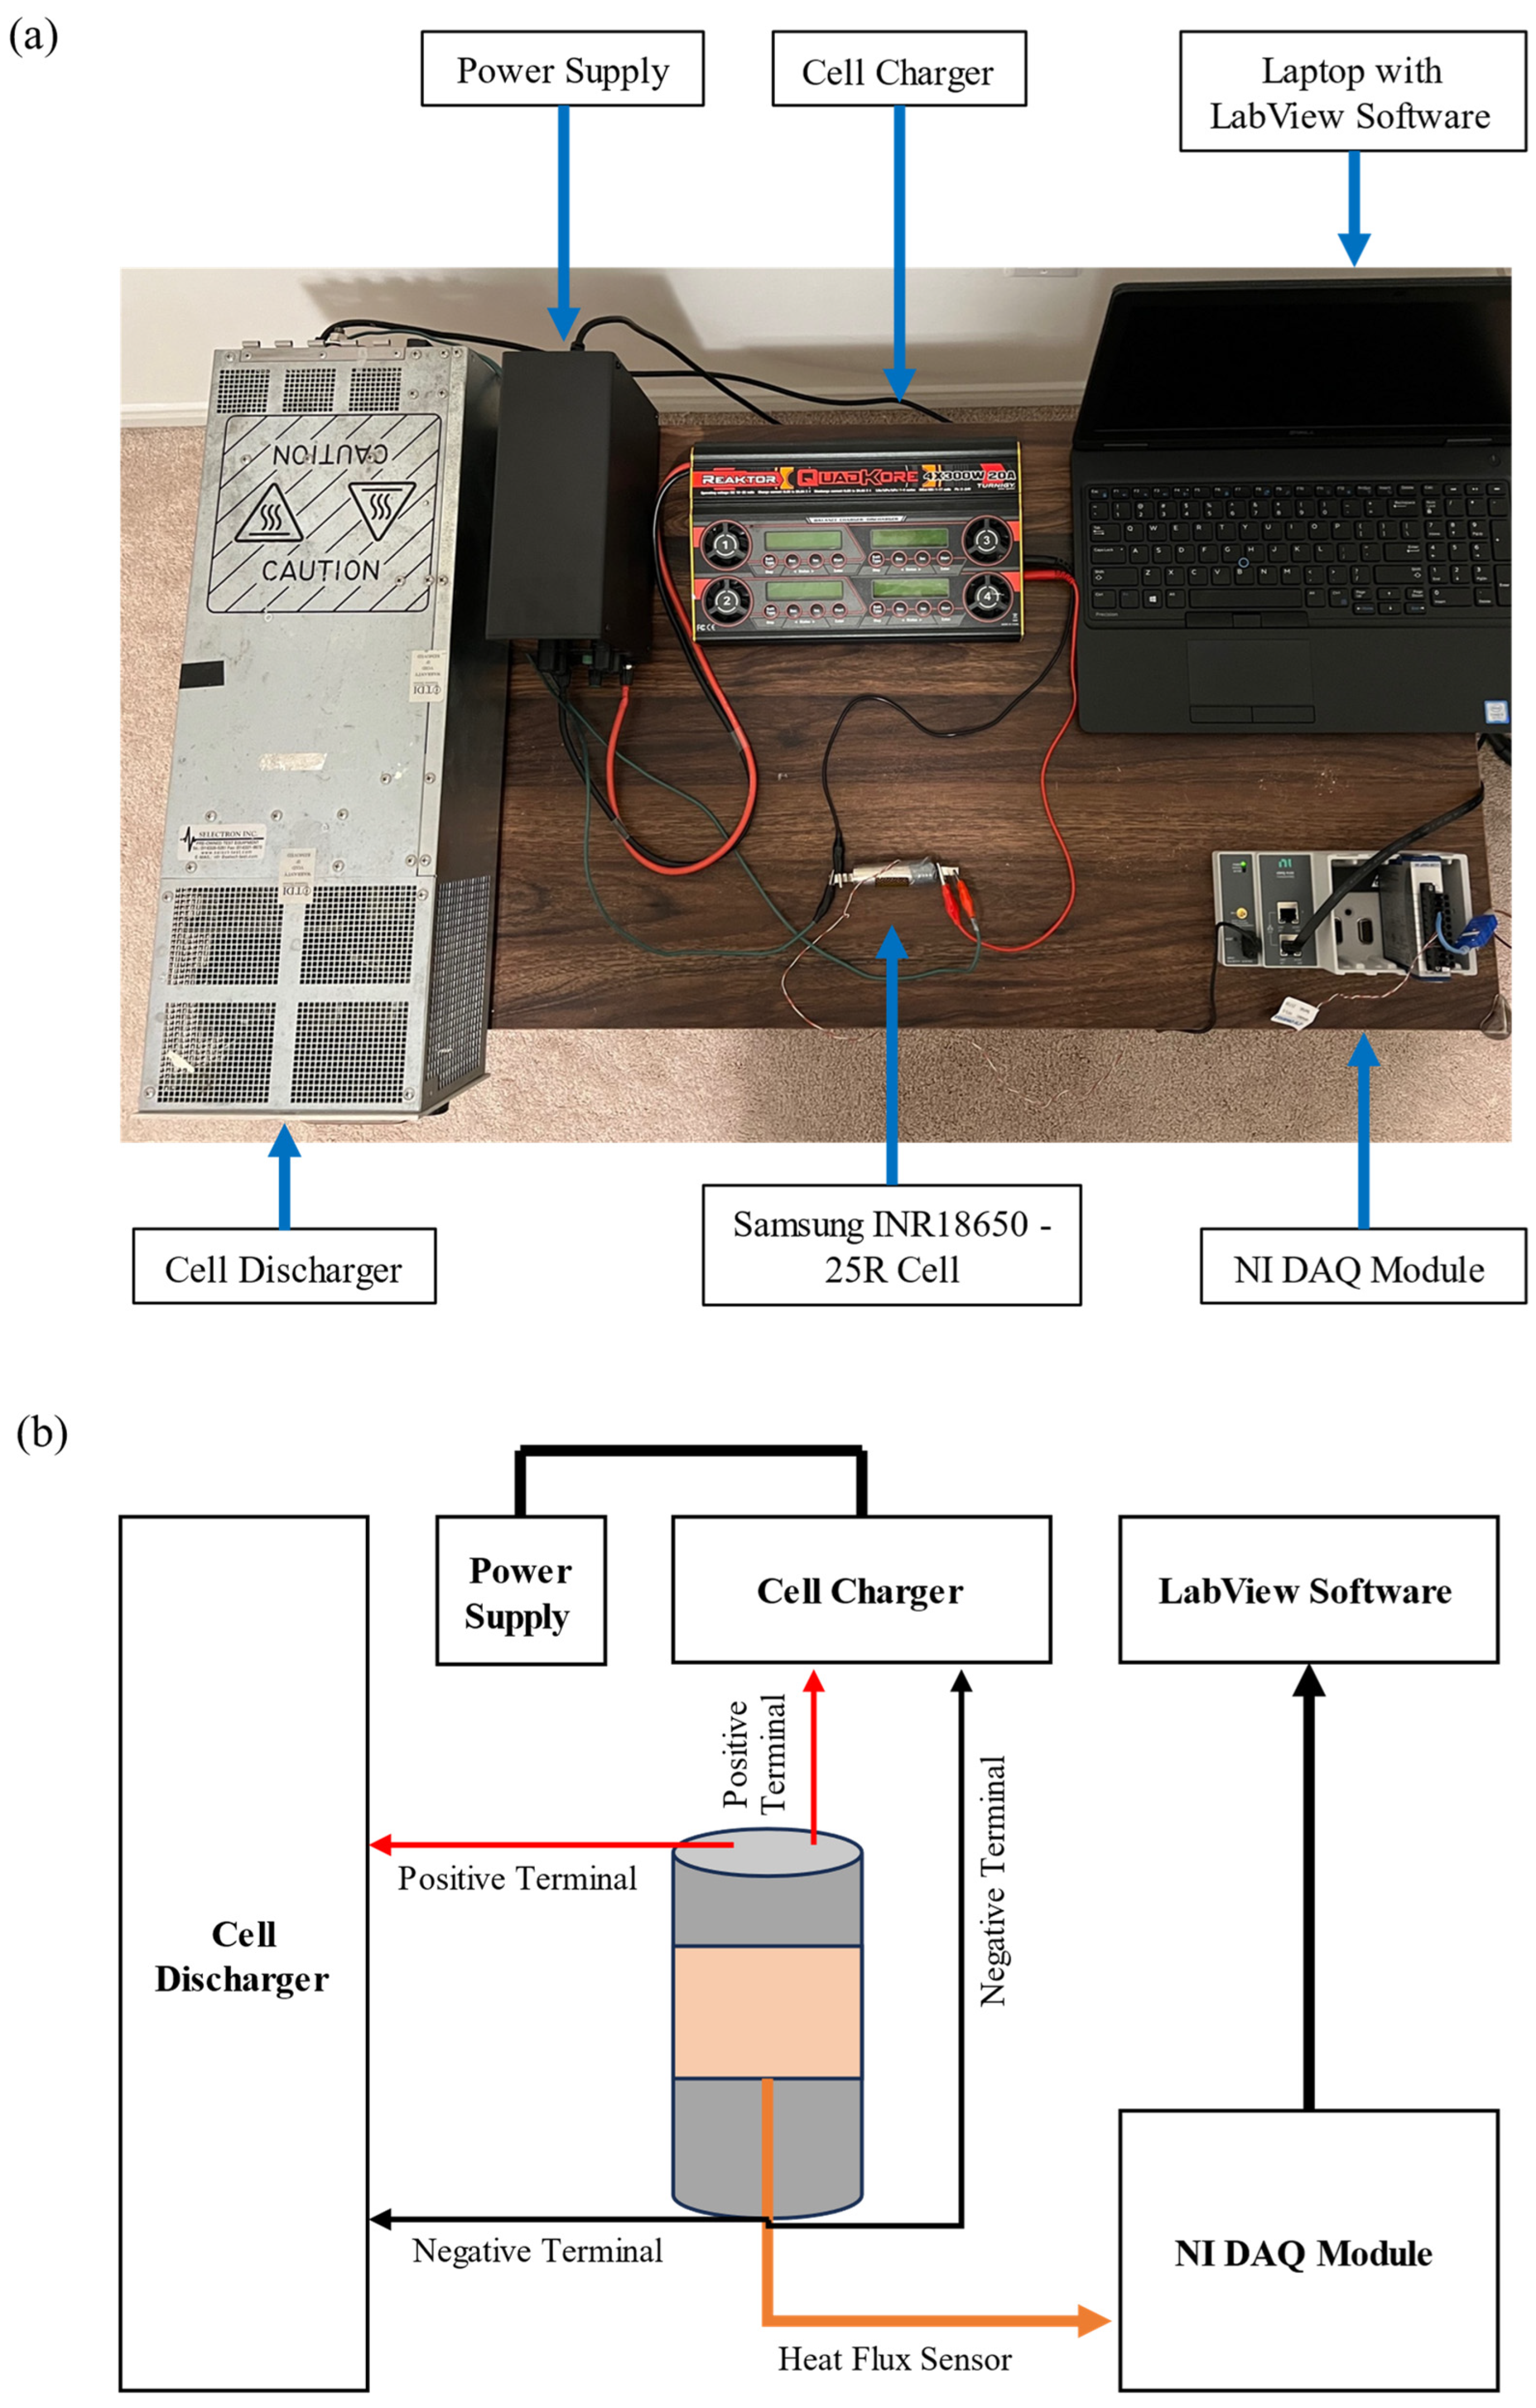
Experiment I was performed to acquire the heat flux measurements. This will then be used in the numerical modeling as the transient boundary. The experimental setup is shown in Figure 6a, and the schematics are shown in Figure 6b. The Samsung INR18650-25R cell with aluminum tabs attached to the positive and negative terminals was used for this experiment. The length of the cell is 65 mm, and the diameter is 18 mm. The nominal discharge capacity is 2.5 Ah and 3.6 V [41]. The electrical insulation at the surface of the cells was detached to obtain accurate measurements, as the noninsulated cells were used in the battery module. For the charging of the cells, a Turnigy charger was used. It can charge 4 cell groups simultaneously up to 300 W and 20 A. The charger was powered through a power supply (Jesverty SPS-3010N) which was sourced from Toronto, ON, Canada. To discharge the cells, a load discharger (TDI RBL488) was used. It has high power draining load capacities of up to 800 W and 120 A. It incorporates variable-speed forced-air cooling to ensure a quiet environment. To measure the heat flux profiles, the Omega HFS-5 was used. In order to measure the readings from the HFS-5 sensor, the data acquisition device (DAQ) NI-9211 was used.
As shown in Figure 6a, alligator clips were connected to the electrode tabs of the Li-ion cell. The cell was charged in two stages. The first stage of the charging process comprised a constant current (CC) charge at 1 A. During this stage, the voltage of the cell increased gradually. Once the voltage reached 4.2 V, it was charged at constant voltage (CV) of 4.2 V, and the charging current was reduced from 1 A to 0 A. Once the cell was completely charged, it was kept at an ambient environment of 25 °C for 1 h. The discharge cycle of 2.5 A CC discharge was then initiated (which corresponds to 1 C) until the voltage reached the cut-off voltage. During the discharge process, the data were logged using the LabView.
The experiment was repeated three times for a 1 C discharge rate, and the error analysis was conducted using the technique recommended by Moffat [42]. The details are tabulated in Table 3. The average percentage uncertainty in the heat flux measurements is ±3.59%.

3.2. Experiment II—Temperature Measurement

Experiment II was performed to attain the battery module’s temperature profiles. The setup is shown in Figure 7a, and the schematics are shown in Figure 7b. The specifics of the equipment are already provided in the previous section. For this experiment, the module was manufactured. The outer casing was made from wood. The cells were placed within the battery module with a series connection. Aluminum liquid channels were filled with water and placed between the PCM material. An axial fan was used to force air through the air duct in the battery module, and the velocity of the airflow was measured using the Proster Anemometer (sourced from Toronto, ON, Canada. Finally, one T-type thermocouple was attached to each cell and the temperature was measured.
To manufacture the battery module, the panels of the wooden housing were laser cut, including the holes in the bottom and the top plates to hold the cells and liquid channels in place. The wooden panels were then glued together. All nine cells were then placed inside the housing. Four aluminum liquid channels were placed inside the housing and filled with water. Thermocouples were then attached to each cell using adhesive tape. Then, the PCM blocks (paraffin wax) were melted using a wax melt warmer, and the melted PCM was then poured into the battery pack. The wires were then connected to the tabs of the cells to connect them all in a series. Finally, the air duct was placed on the module.
The procedure for Experiment II consisted of charging the cells using the Turnigy charger. The cells were charged with the CC-CV process. The total voltage at the end of charge was 37.8 V (the voltage of each cell was 4.2 V). The cells were discharged at the CC once the measurements from the thermocouples reached 25 °C. The readings were logged using LabView. Once the voltage of the battery module reached the cut-off voltage of 22.5 V, the discharge process was terminated.
The experiment was repeated three times for a 1 C discharge rate, and the error analysis was conducted using the technique recommended by Moffat [42]. The details are tabulated in Table 4. The average percentage uncertainty in the temperature measurements is ±3.59%.

4. Numerical Modeling

4.1. Governing Equations

The numerical model was conducted using ANSYS Fluent. The solidification/melting, energy, and flow models in Fluent were coupled to achieve the numerical model for this concept. The following assumptions were considered for the development of the numerical model:
  • Airflow through the duct is incompressible and the temperature of the air at the battery module inlet is at an ambient temperature.
  • The fluid in the liquid cooling is incompressible and the temperature of the fluid at the start of the discharge process is at an ambient temperature.
  • There is no leakage of fluid from the liquid cooling components.
  • The battery module is kept at an atmospheric pressure.
The governing equations for the energy and fluid flow models are as follows [32].
Energy Equation
t ρ E + · v ρ E + P = · ( k T T j h j J j + τ ̿ e f f · v ) + S h
Momentum Conservation Equation
t ρ v + · ρ v v = P + · τ ̿ + ρ g + F
where:
τ ̿ = μ v + v T 2 3 · v U
Continuity Equation
ρ t + · ρ v = S m
The solidification/melting model was only applied to the PCM region. The enthalpy–porosity technique was used to model the phase change process. In this technique, the interfaces where the solid melts are not explicitly tracked. Instead, a liquid fraction ( β ) quantity is introduced, which provides the fraction of each cell volume that is in a liquid form. This liquid fraction is based on the enthalpy balance [32]. The enthalpy of the PCM is based on the latent heat and sensible enthalpy, as shown below [32].
H = h + H
where:
h = h r e f + T r e f T c p d T
The liquid fraction is 0 if the temperature (T) is less than the solidification temperature (Tsolidus) of the PCM. Additionally, the liquid fraction is 1 if the temperature (T) is more than the melting temperature (Tliquidus) of the PCM. The equation for the liquid fraction during the change in the phase is provided below [32].
β = T T s o l i d u s T l i q u i d u s T s o l i d u s
The latent heat equation in terms of the liquid fraction and latent heat of the material (L) is shown below [32].
H = β L
Therefore, the energy equation is as follows [32].
T ρ H + · ρ v H = · k T + S
The enthalpy–porosity technique considers the partially solidified region (the mushy zone) as the porous medium. In regions that are completely solid, the porosity is equal to zero. The momentum sink due to the reduced porosity in the mushy zone is provided in Equation (11) and is utilized in the term F in the momentum conservation equation (Equation (3)) [32].
S = ( 1 β ) 2 β 3 + ϵ A m u s h v v p

4.2. Mesh-Independence and Time-Independence Studies

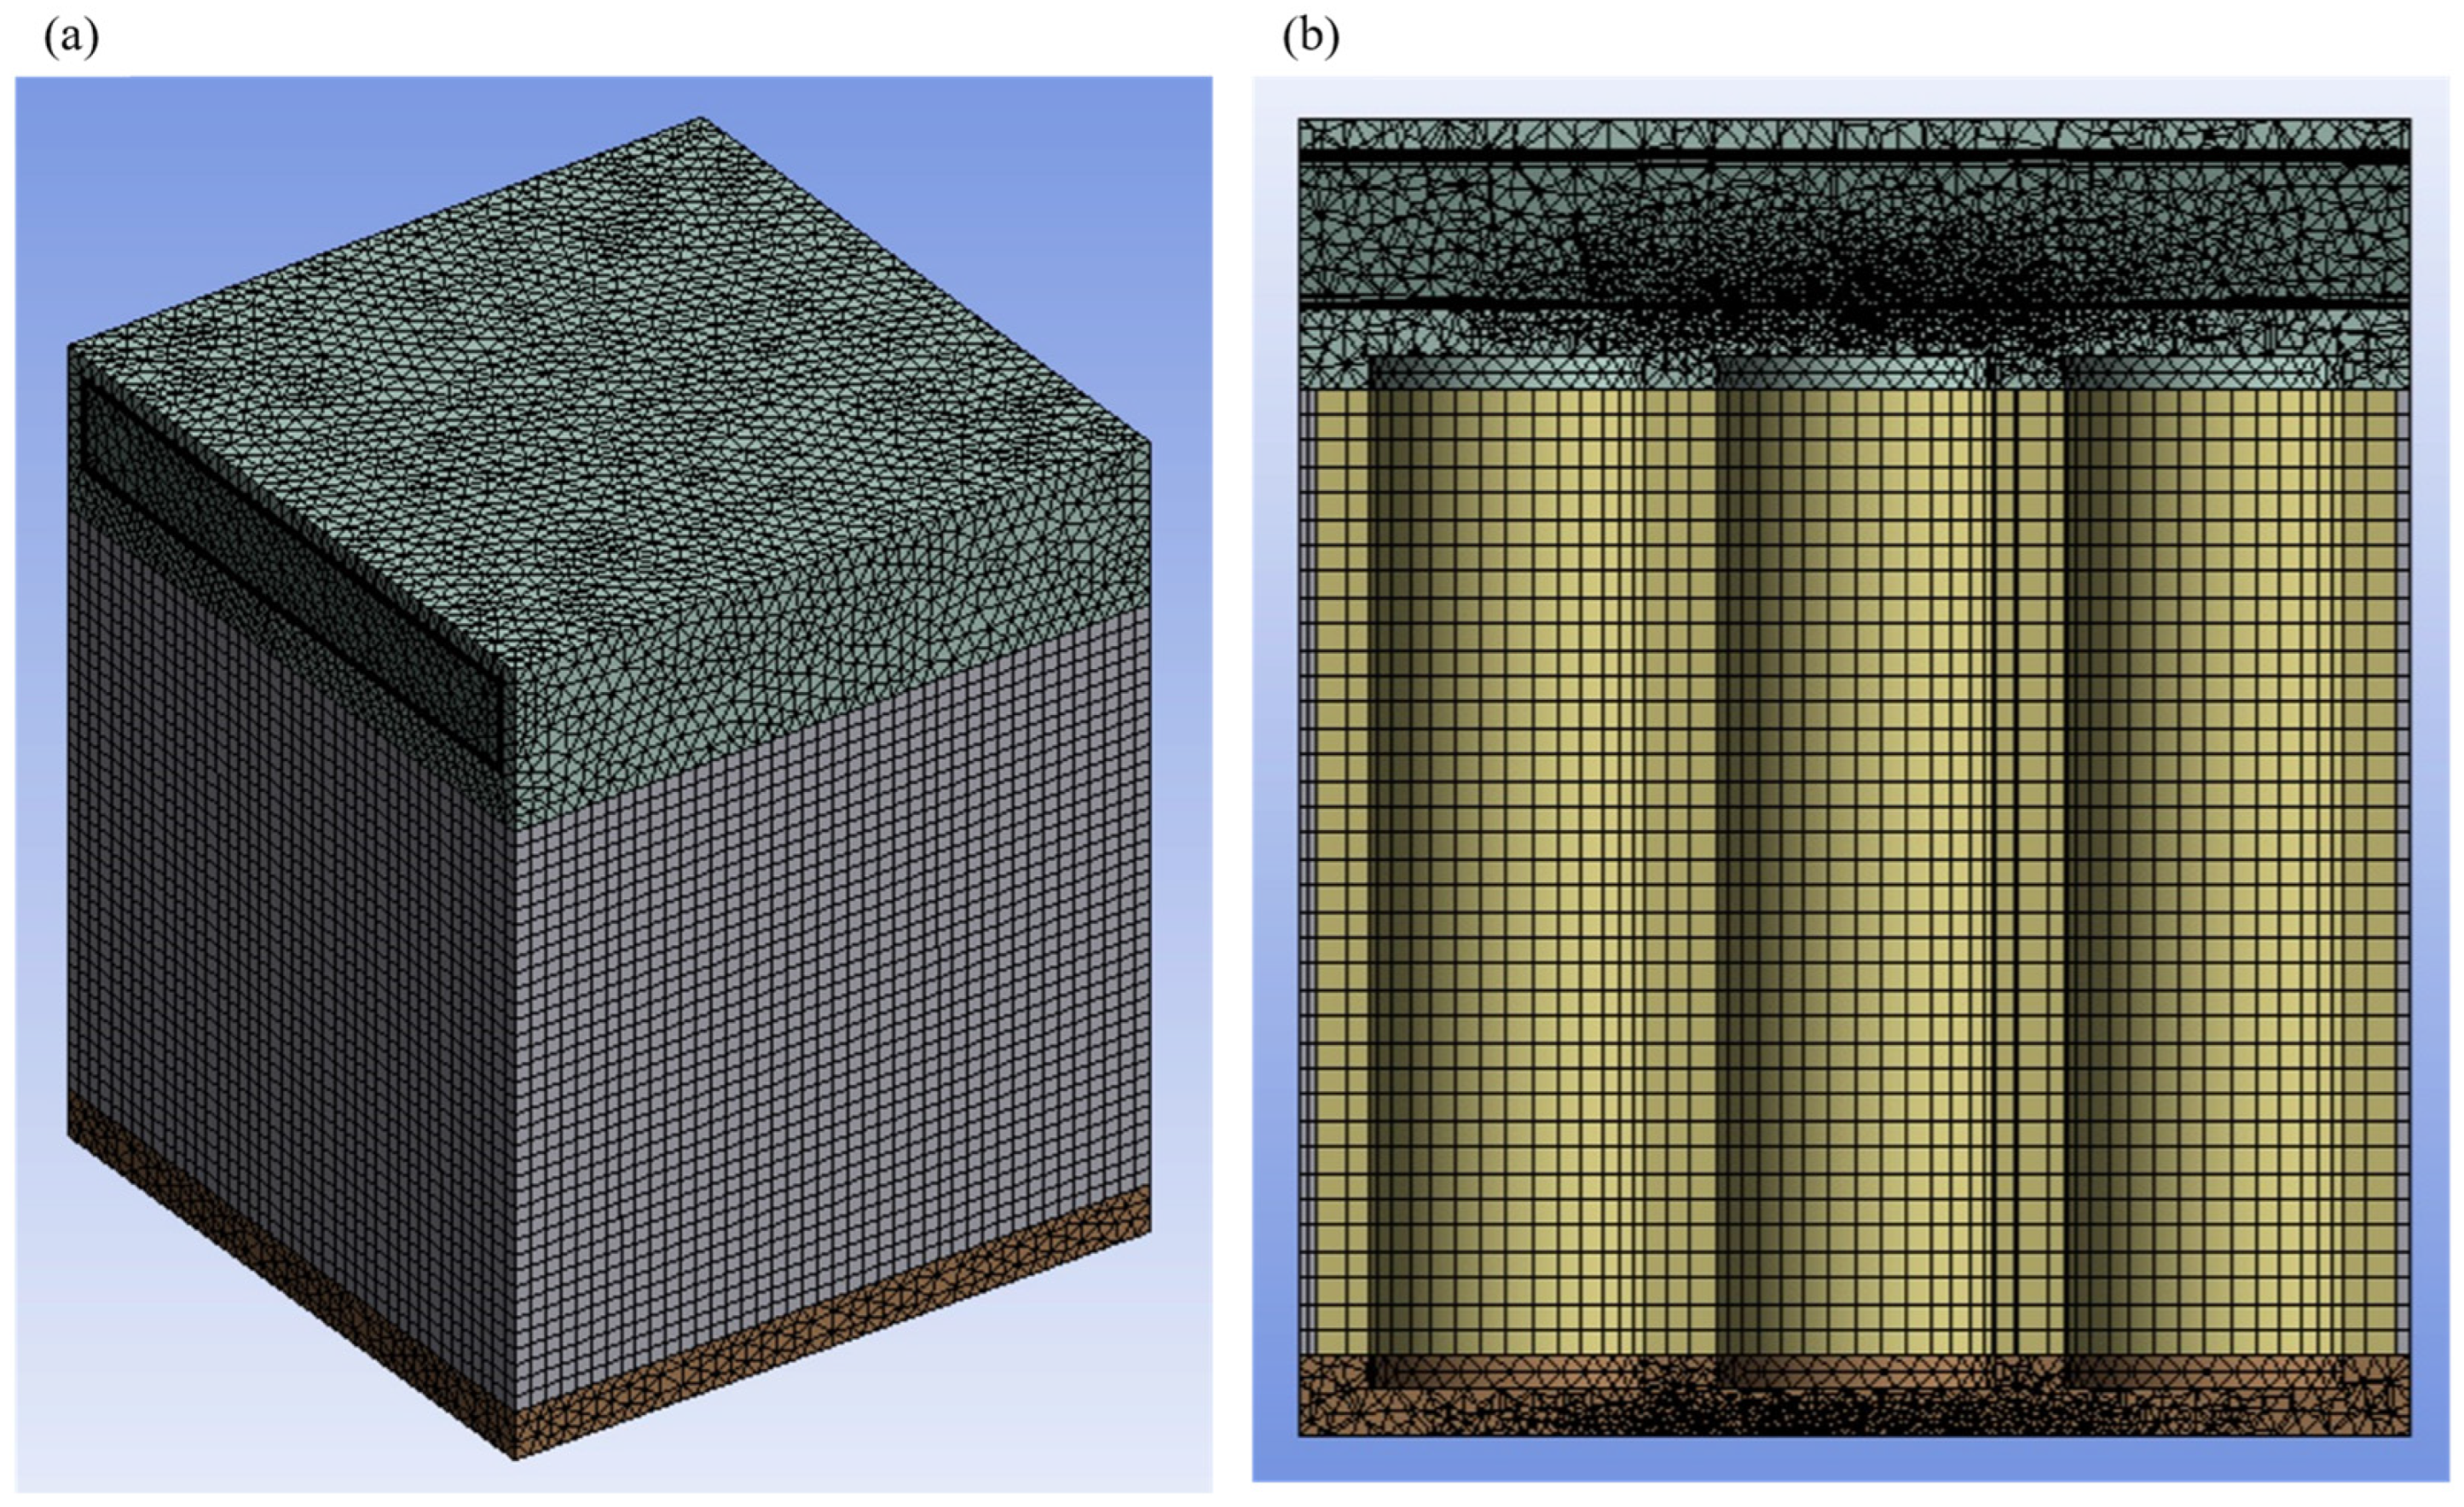
The cross-section of the developed mesh is shown in Figure 8. Since the air flows within the duct region only, the inflation layers were added to the walls in this region to capture the boundary layer.
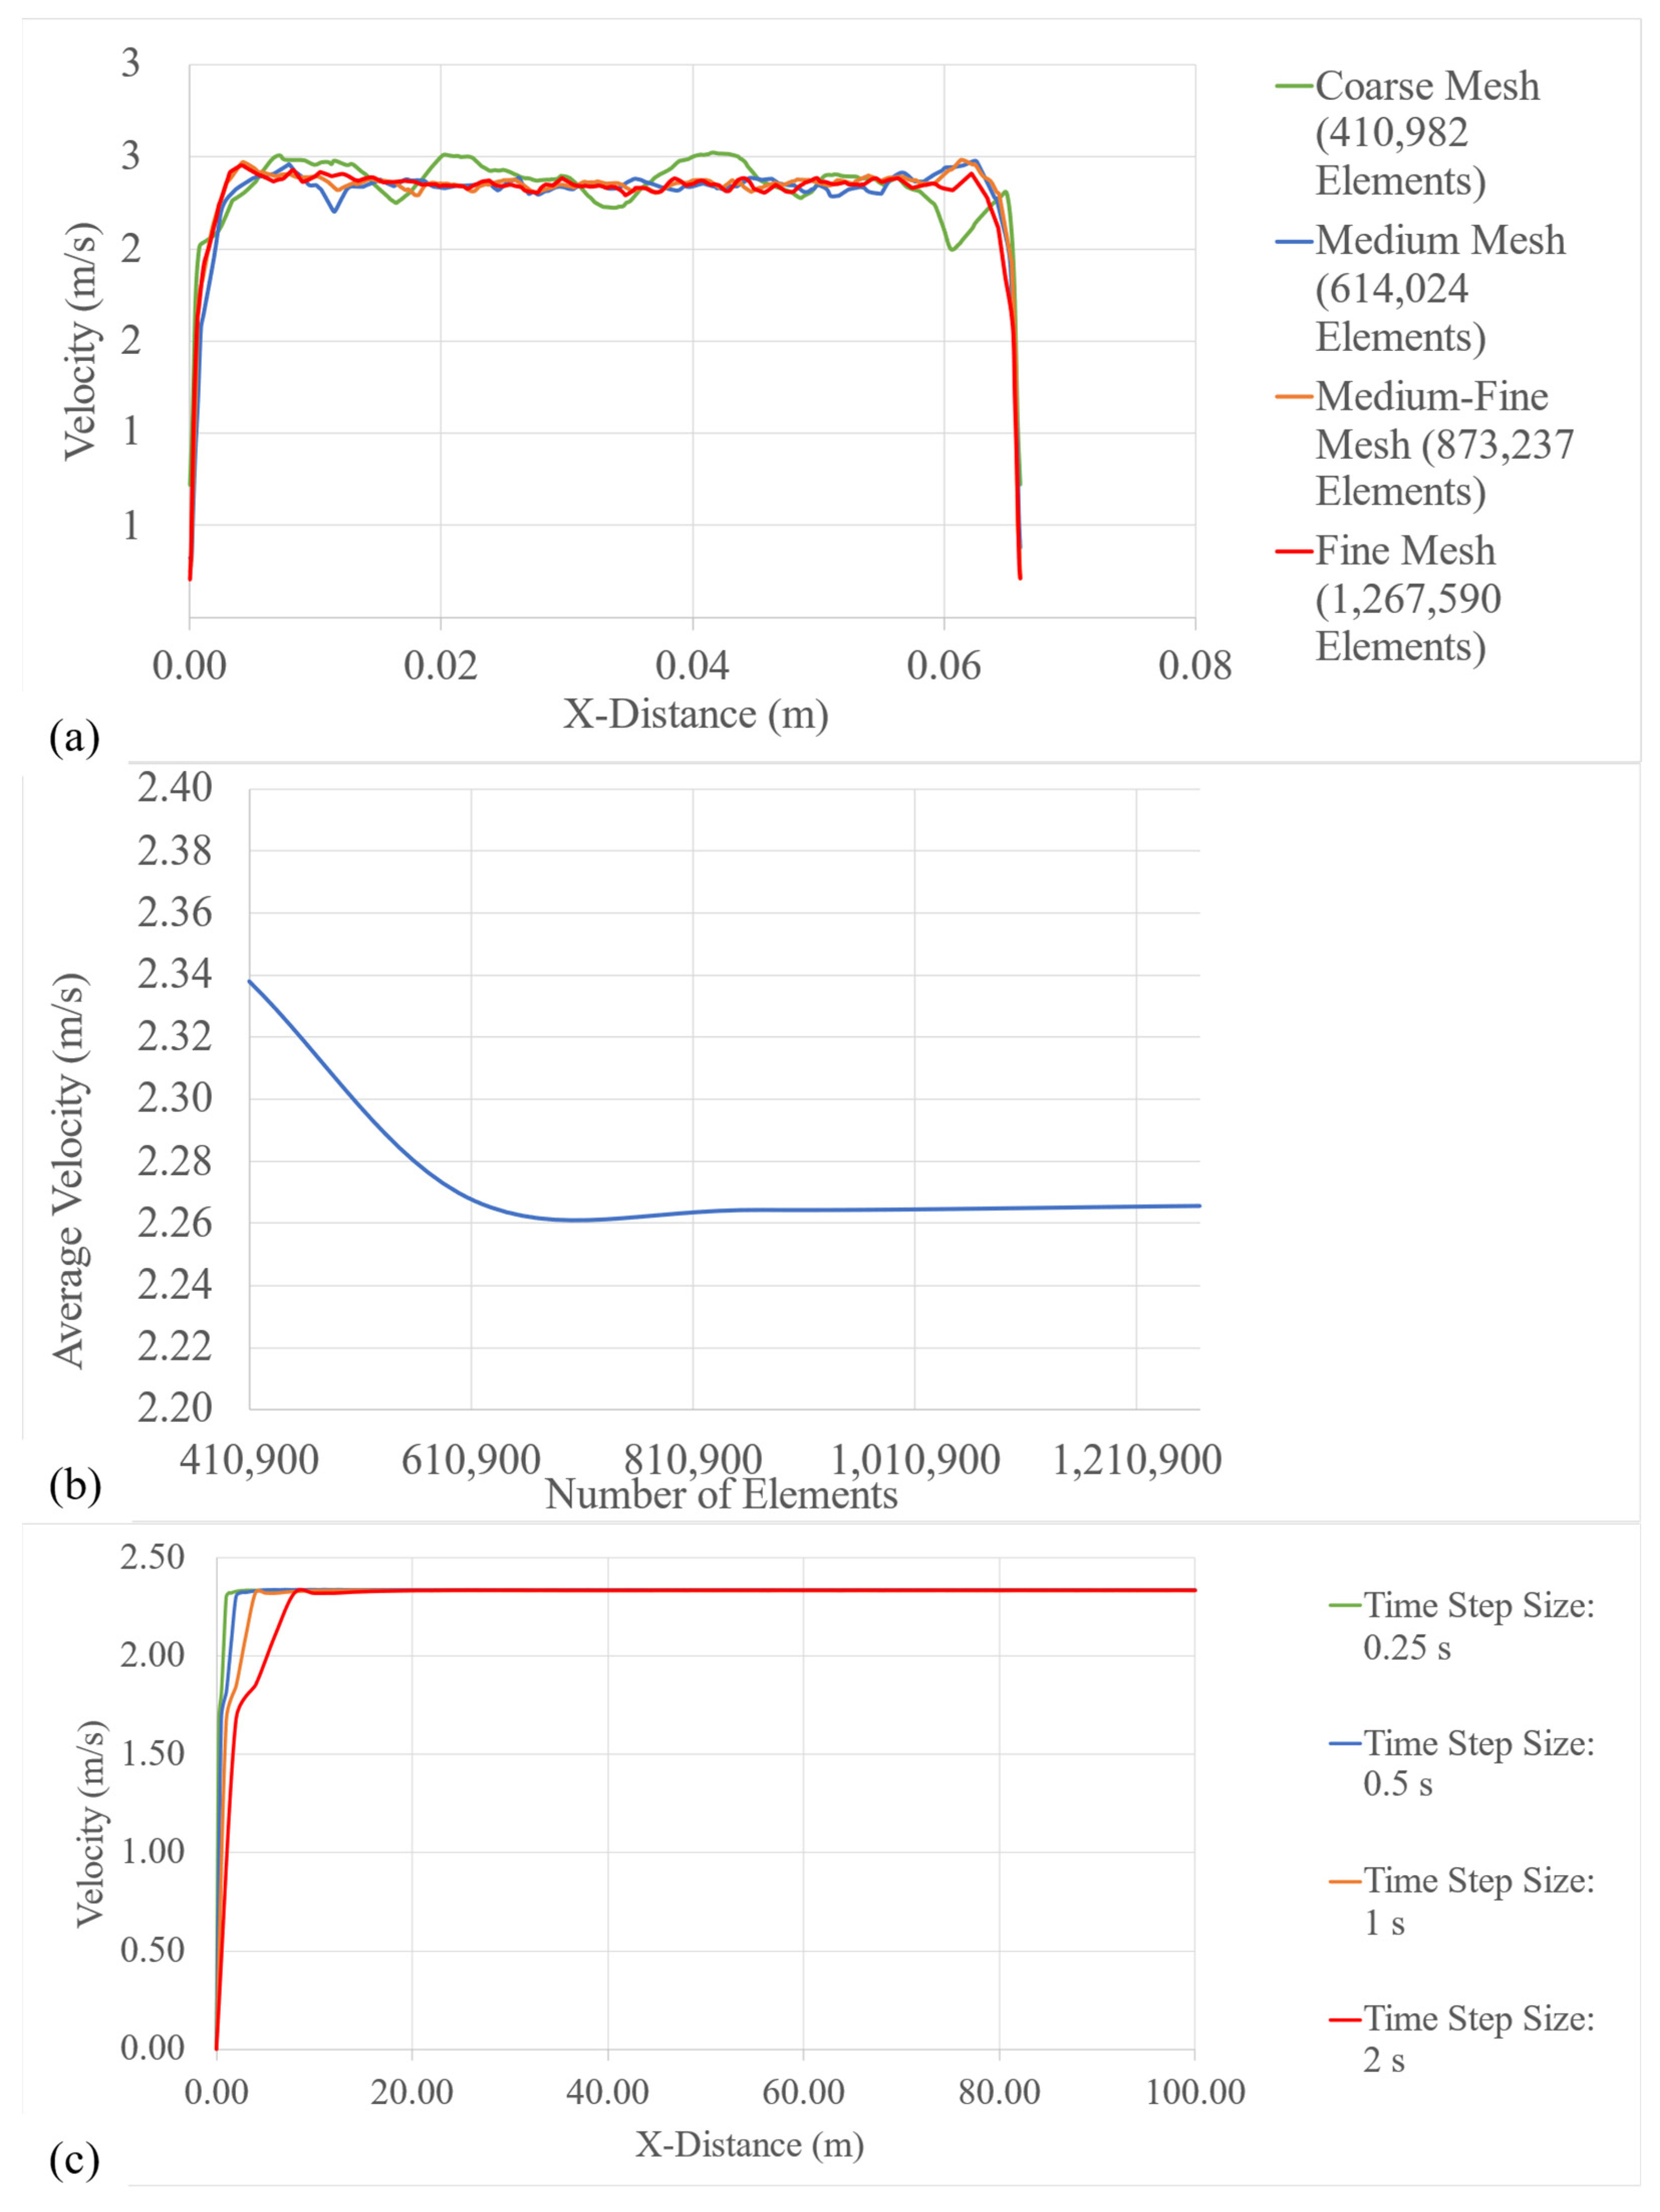
In order to verify that the results are not dependent on the size of the elements in the mesh, a mesh-independence study was performed. A coarse mesh, medium mesh, medium-fine mesh, and fine mesh were developed. In each subsequent mesh, the total elements were increased by approximately 50%. To compare the results, the airflow velocity profiles are provided in Figure 9a. In addition, the average velocity is provided in Figure 9b. According to the results, the medium mesh was selected.
Moreover, a time-independence study (TIS) was conducted to make sure that the results are not dependent on the time step. An optimum time-step size is required, as a large time step will produce inaccurate results and a small time step will increase the computational time significantly. The results are provided in Figure 9c for the TIS and a time step of 0.5 s was chosen based on the results.

4.3. Boundary Conditions and Simulation Procedure

In order to assess the impact of the nanofluids, the ambient temperature was set to 42.24 °C to evaluate and compare the phase change in the CPCM with different fluid thermal conductivities. This is the temperature at which the CPCM will start to change its phase. The CPCM was solid at the beginning of the discharge cycle, and once the discharge process started, the CPCM started to melt due the heat absorption from the cells. The inlet velocity of the airflow was based on the Reynolds number of 1950. The heat flux boundary condition at the 7 C discharge rate was applied at the surface of the cells. Additionally, the configurations were also simulated at an ambient temperature of 25 °C to evaluate the reduction in the maximum temperature by the two configurations.
In order to evaluate the impact of the addition of fins, the ambient temperature was set to 25 °C. The heat flux boundary condition at the 7 C discharge rate was applied at the surface of the cells. The inlet velocity was changed for the three configurations, as per Table 2.
For the scalability analysis, the inlet air velocity was based on the Reynolds number of 1950. The heat flux boundary condition at the 7 C discharge rate was applied at the surface of the cells. The ambient temperature was set to 25 °C.
Moreover, a transient simulation was conducted using a pressure-based solver. The SIMPLE scheme was used for the pressure–velocity coupling. The convergence criterion was set to 0.000001 for the residuals of the continuity, velocities, and energy. Finally, a fixed time advancement of a 0.5 s time-step size was used.

5. Results and Discussion

5.1. Heat Flux Profile and Numerical Model Validation

The heat flux profiles were obtained at various discharge rates ranging from 1 C to 7 C, and are provided in Figure 10a. In comparison, the highest heat flux throughout the experiment was obtained for the 7 C discharge rate with 584 W/m2; hence, 7 C was considered as the worst-case scenario, and the numerical simulations for all the strategies were conducted at this discharge rate.
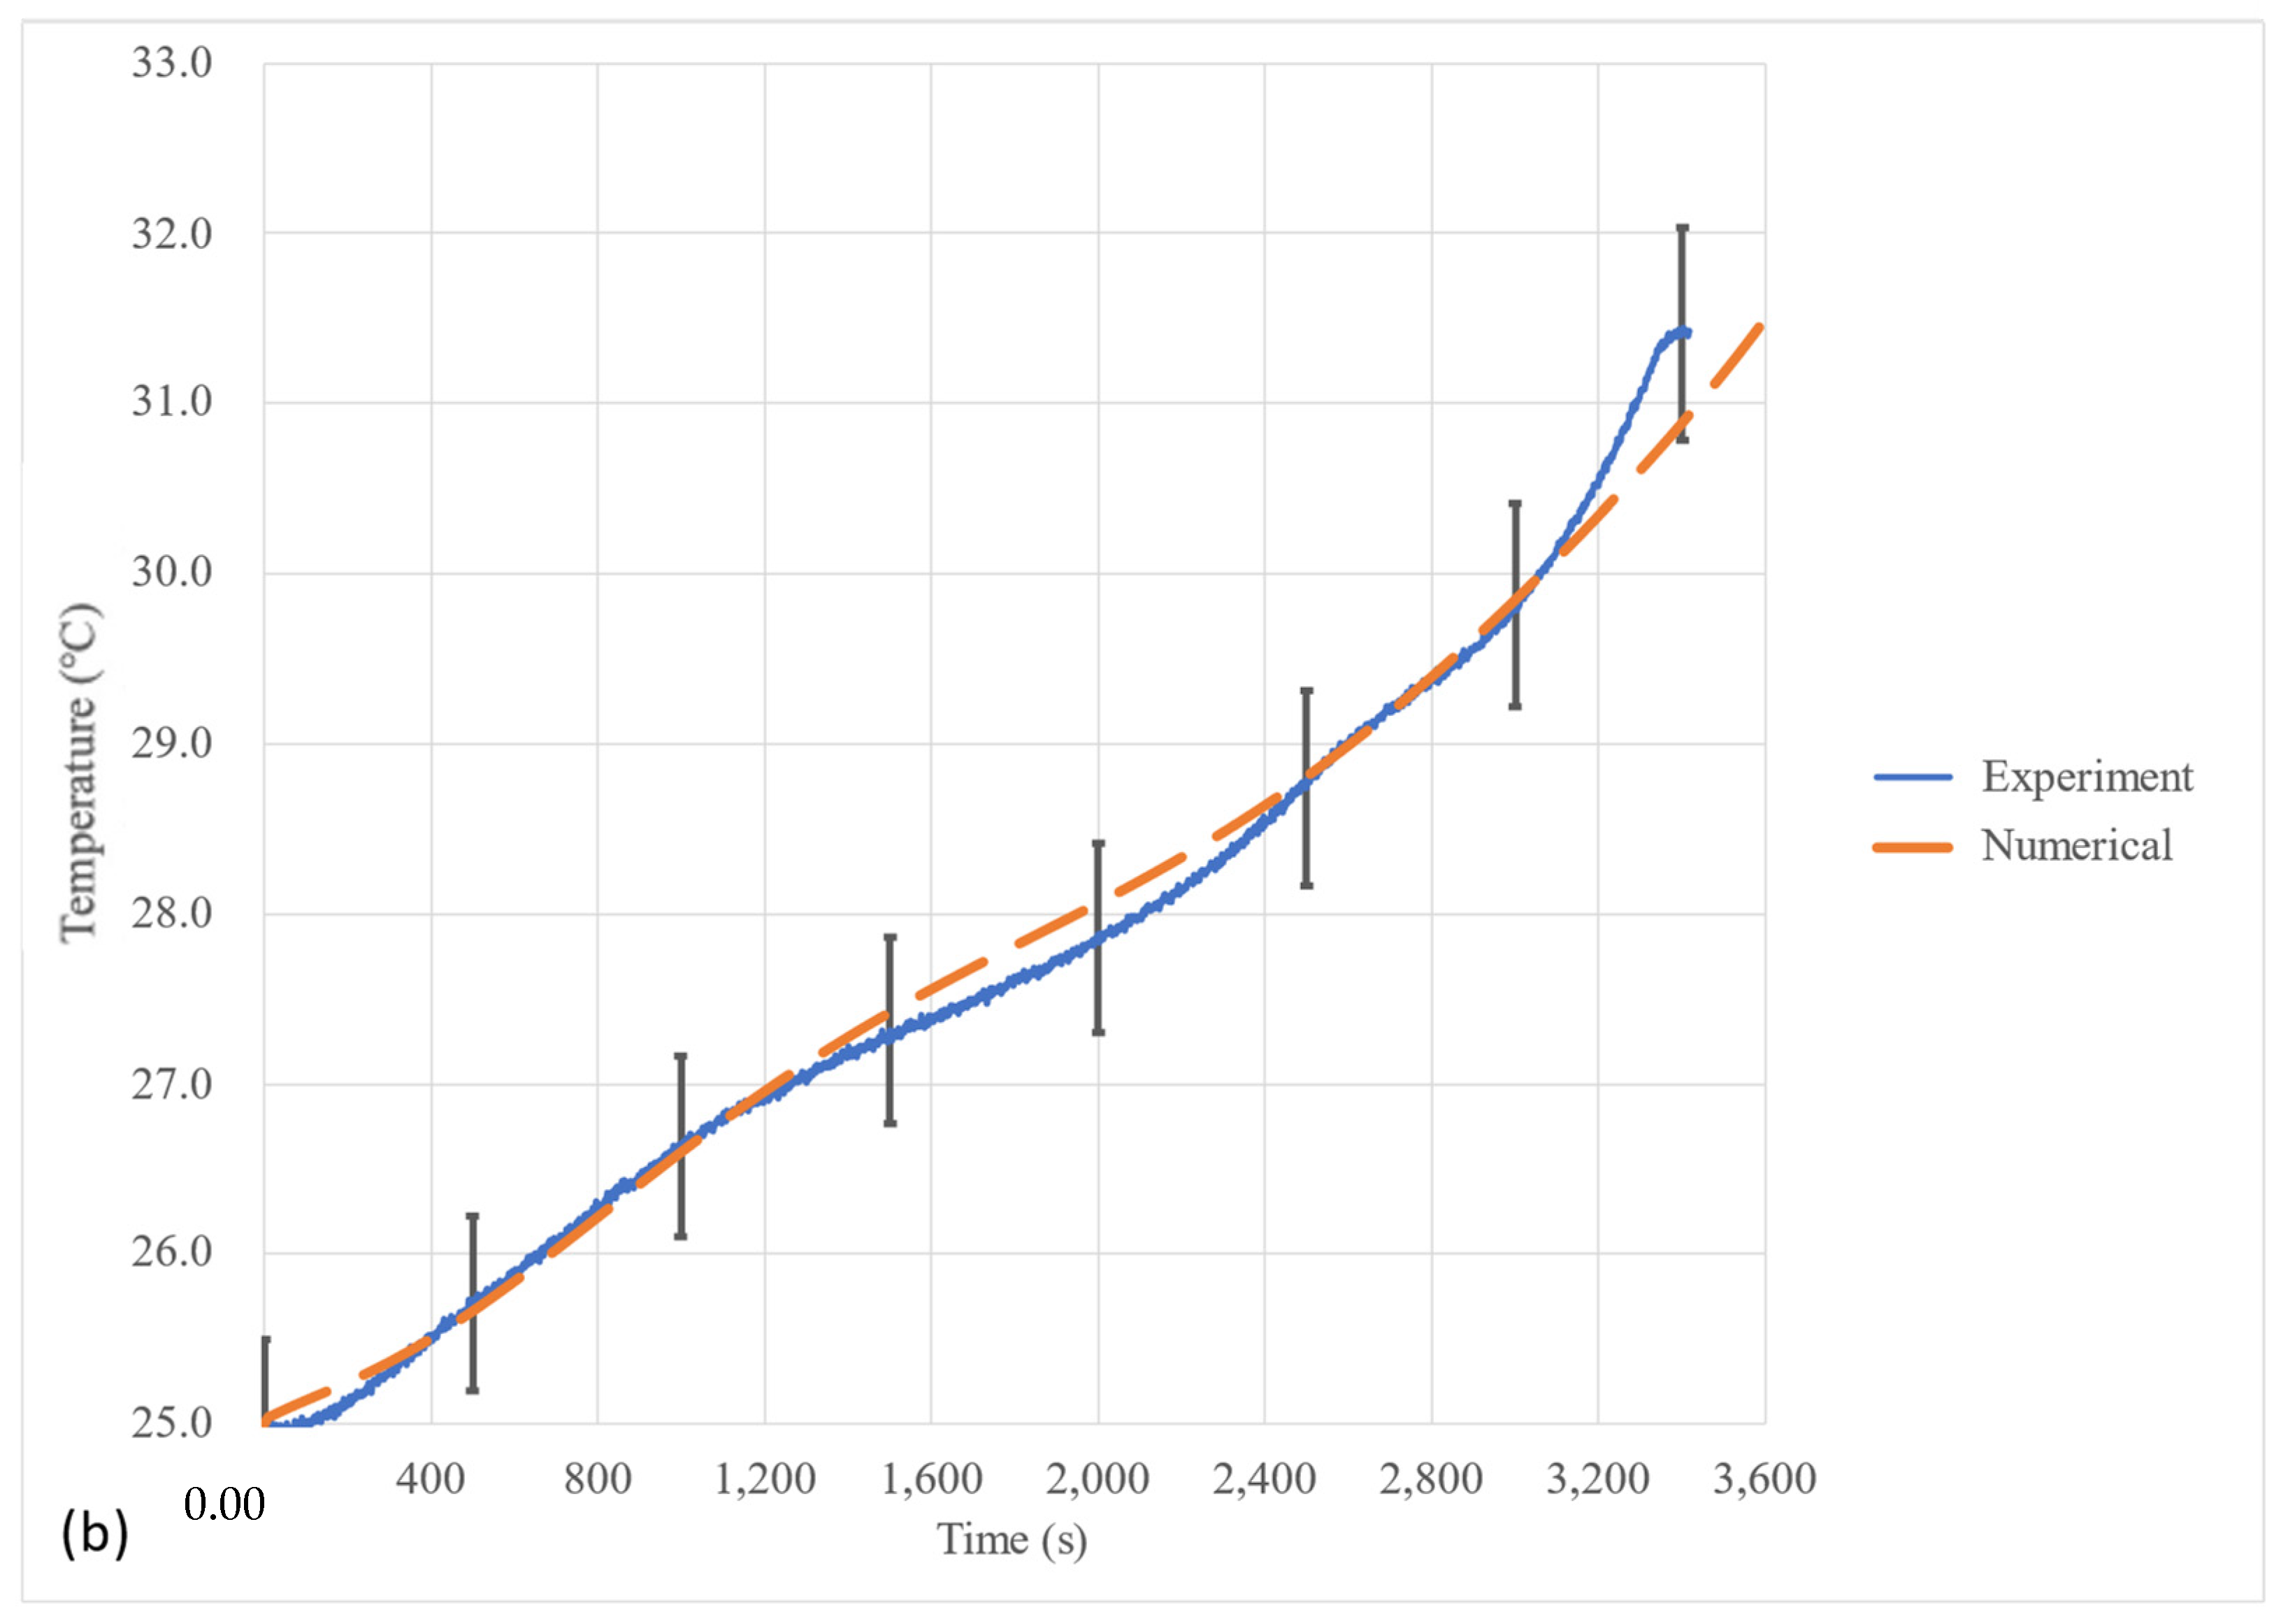
The numerical simulations provide effective results; however, it is important to validate the results of the numerical model with the experimental results. Since the numerical model is based on the battery module developed for Experiment II, the results of Experiment II were used for validation. The validation results are shown in Figure 10b. It can be seen that the numerical results are within the ±2% temperature error bars, which falls within the ±3.59% experimental uncertainty. Therefore, the numerical model is considered completely validated.

5.2. Thermal Analysis of the Proposed Hybrid Strategy

In order to comprehend the cooling phenomenon of the proposed hybrid strategy with the CPCM (the paraffin with copper foam), the contours for the temperature are provided in Figure 11. To evaluate the thermal performance, two separate simulations were conducted. The first simulation was conducted at a 25 °C ambient temperature, and the second simulation was conducted at the phase change temperature of the CPCM, which is 42.24 °C in this case. The temperature contours for the 25 °C ambient temperature are provided in Figure 11a–c, and the temperature contours for the 42.24 °C ambient temperature are provided in Figure 11d–f.
It can be seen that, due to the presence of the cold plates, a high amount of cooling was achieved. The lower-temperature surfaces are the ones that are in front of the cold plates, whereas the higher-temperature surfaces are the ones that are facing the module housing. Since the housing of the module is cooled through the ambient environment and the airflow only, as compared to the liquid cooling effect for the other cell surfaces, these temperatures were higher. This shows the effectiveness and importance of the presence of liquid cooling within the proposed strategy.
Moreover, according to Figure 11b, the cold plates also act as a heat sink for the CPCM. Adding a cold plate eliminates the high-temperature region within the composite PCM between the neighboring cells as the fluid removes heat from the CPCM. Since the high-temperature regions are eliminated, the temperature of the cells does not reach the phase change temperature of the CPCM, and the melting does not occur.
Additionally, according to Figure 11c, the lower portion of the fluid has the highest temperature, and it gradually reduces to the minimum towards the top portion of the fluid. This is because of the air-cooling effect on the cold-plate region that is protruding within the air duct. Additionally, the lowest temperature of the fluid is exhibited near the inlet of the air duct, and as the air flows through the cold plate, its heat extraction capacity reduces, and the temperature of the fluid increases towards the outlet of the air duct. The impact of the single fluid body can be seen in Figure 11c, as the same airflow allows the fluid to cool between the cell columns.
Finally, at the ambient temperature of 42.24 °C, the phase change in the composite PCM begins. It can be seen from Figure 11d–f that all temperatures for the entire battery pack are within the range of 42.2 to 42.3 °C, as the phase change in the composite PCM limits the temperature of the cells, and the PCM and the airflow at the same temperature limits the cooling of the fluid to the ambient temperature of 42.24 °C.

5.3. Increasing the Thermal Conductivity of Water through Nanoparticles

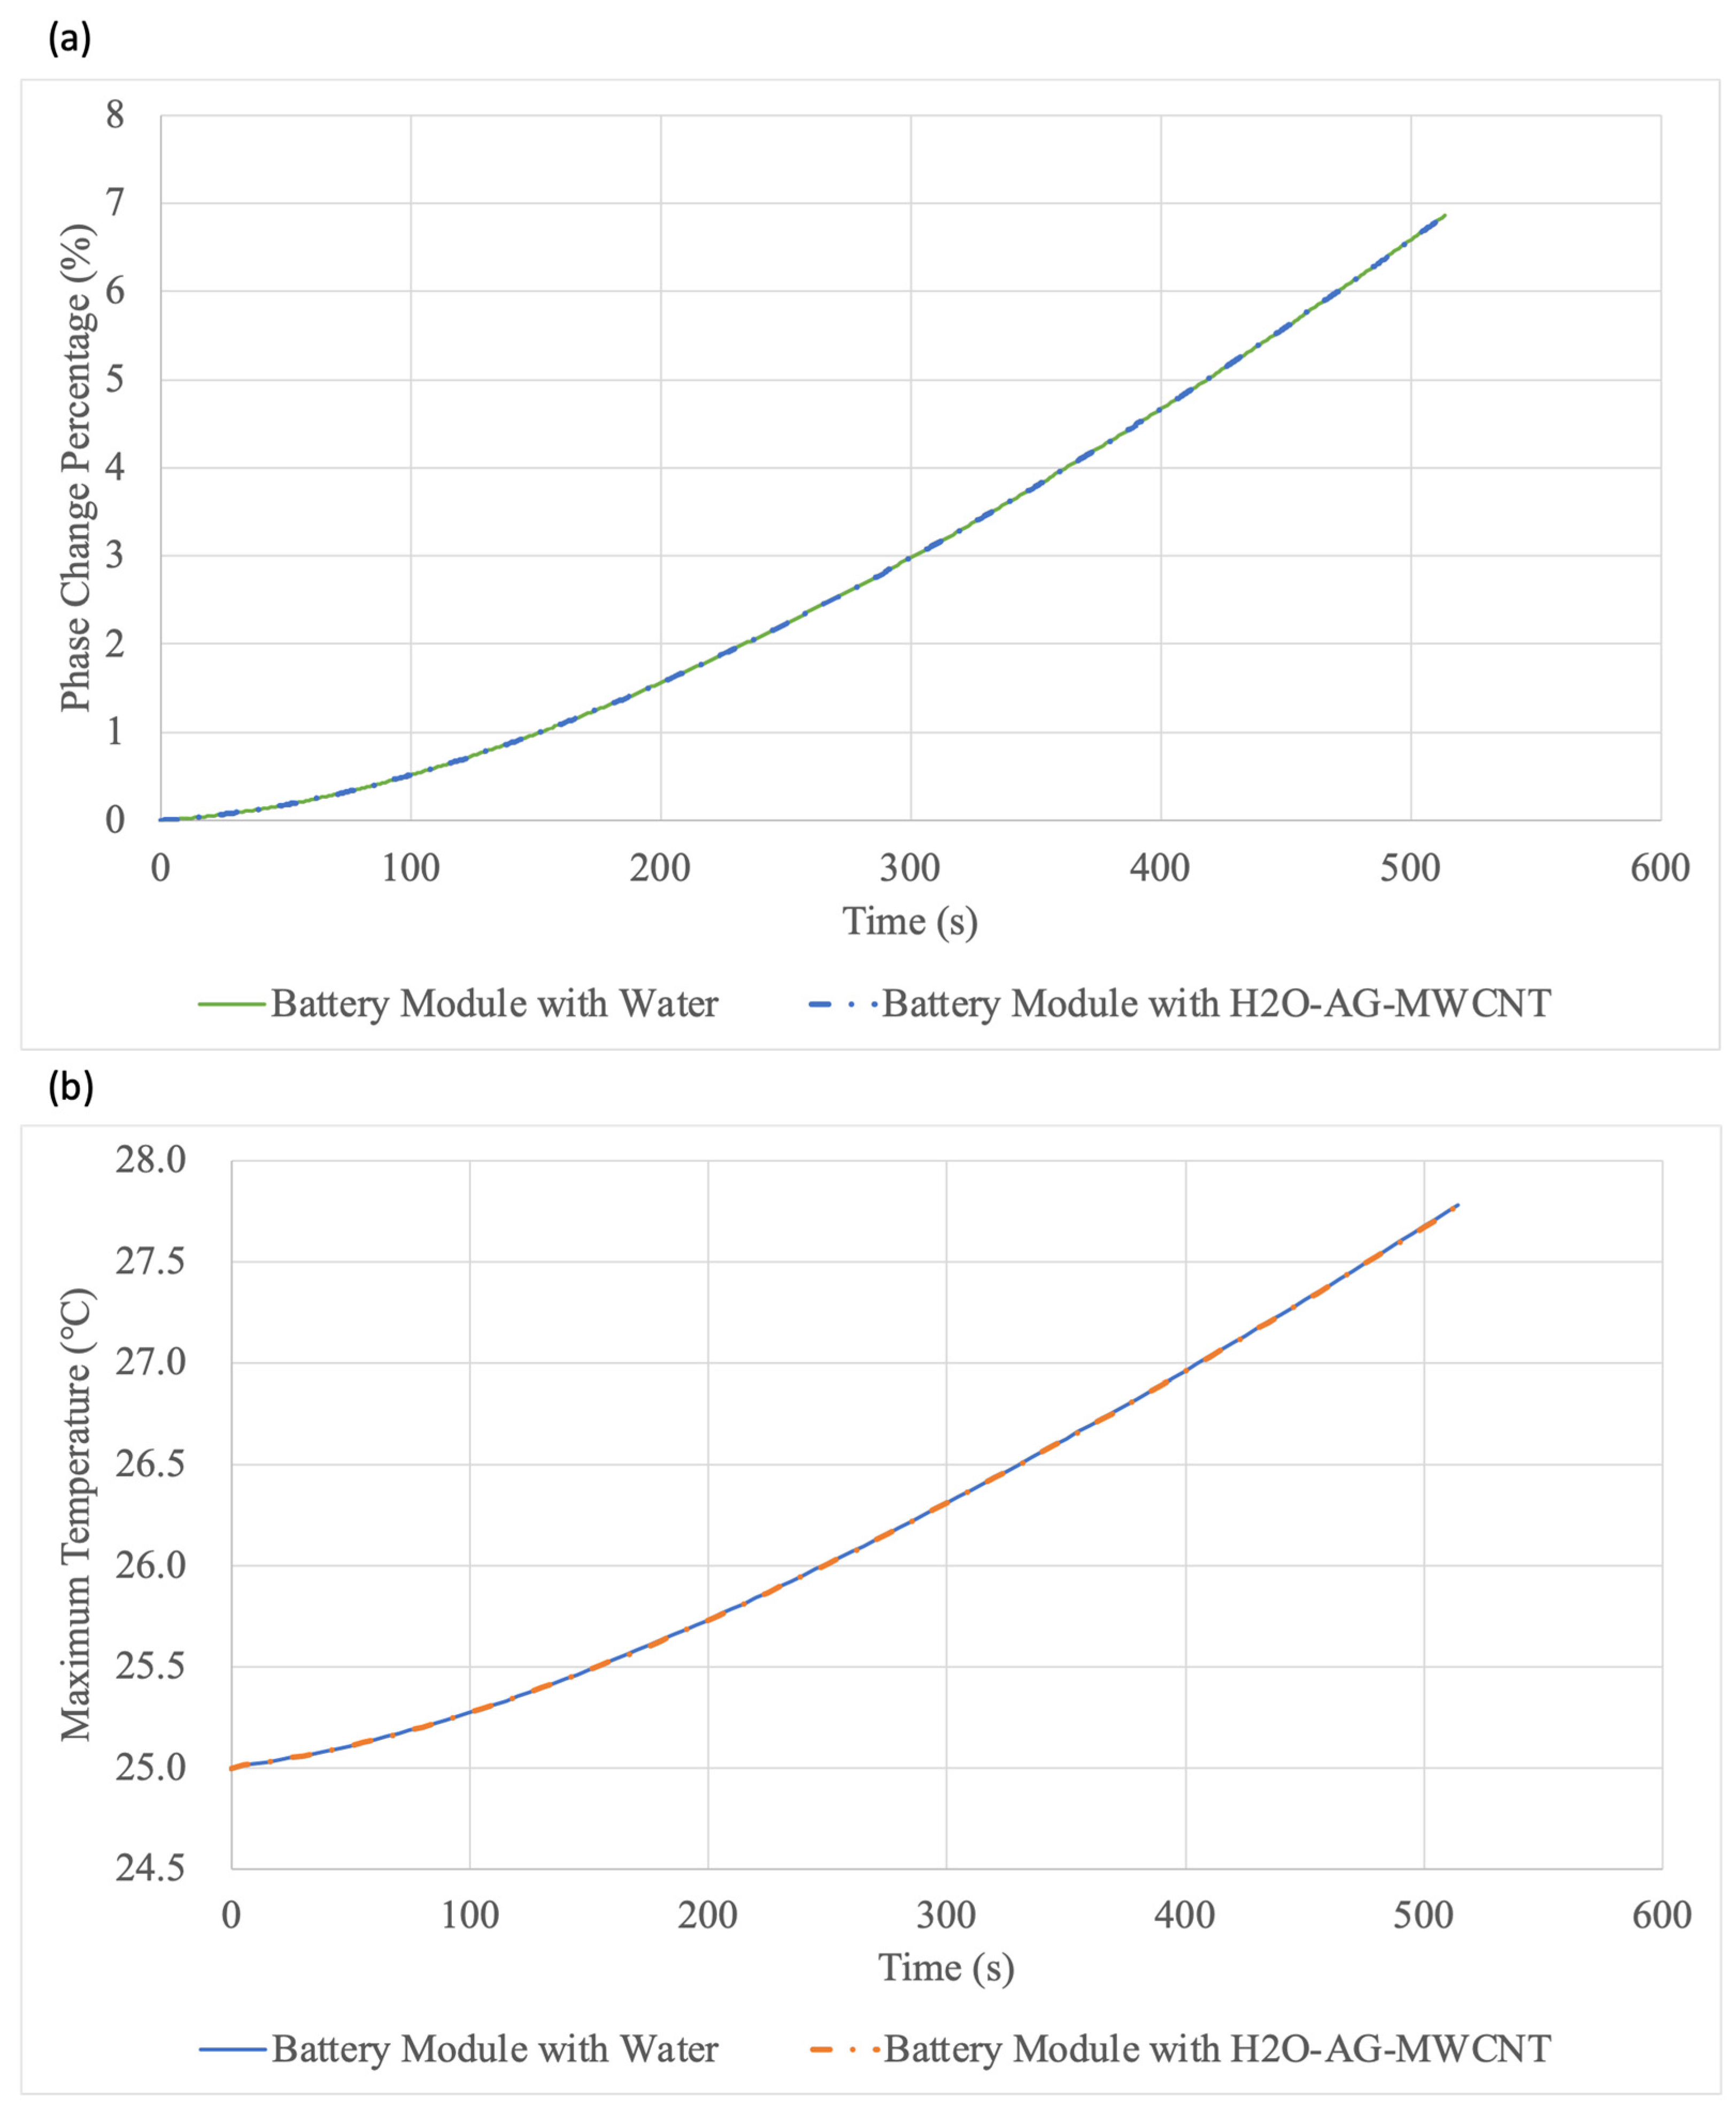
As discussed in Section 2.2, the thermal conductivity of the fluid is increased to 0.92 W/m K using H2O–AG–MWCNT from 0.6 W/m K of water. To compare the effect of increased fluid thermal conductivity using nanoparticles, two different sets of numerical simulations were conducted. In the first simulation, the amount of CPCM usage through the phase change was investigated. Since the phase temperature of the CPCM was 42.24 °C, the simulation was conducted at an ambient temperature of 42.24 °C. Moreover, in the second simulation, the increase in the maximum temperature was investigated, and for this, the ambient temperature was set to 25 °C. The result of the phase change evaluation is provided in Figure 12a. It can be seen that approximately 7% of the CPCM changed its phase using both fluids, and the graphs completely overlap each other. Additionally, the result for the maximum temperature increase is shown in Figure 12b. It can be seen that the maximum temperature in both instances increases to 27.8 °C, and there is no difference in the results, as the graphs completely overlap each other. This shows that the cooling from the fluid is not sensitive enough to capture the change of 0.32 W/m K thermal conductivity in the fluid.

5.4. Addition of Fins in the Battery Module to Improve the Heat Transfer

As discussed in Section 2.3, in the first configuration, one fin was added to the cold plate within the air duct, and in the second configuration, two fins were added. The fins were incorporated to assist in improving the heat transfer to the airflow, as, through the fins, the contact area with the airflow increases. However, this increase in the heat transfer will come at the cost of a higher pressure drop. The results of this study are shown in Figure 13. It can be seen from the results that the cooling achieved is not significant enough when compared to the pressure drop increase. With one fin, the pressure drop increases from ~11 Pa to ~38 Pa, whereas the maximum temperature reduces by only ~0.6 °C. Similarly, with two fins, the pressure drop increases by ~70 Pa, and the maximum temperature reduces by ~0.5 °C when compared to the results of the one-fin configuration. Therefore, the addition of fins does assist in improving the cooling. However, the pressure drop increase is much higher, which will result in higher fan power requirements.

5.5. Scalability of the Battery Module

In order to evaluate the scalability of the battery module, four different numerical simulations were performed. The first simulation consisted of one battery module only, the second consisted of two battery modules in a series, the third consisted of three battery modules in a series, and the fourth consisted of four battery modules in a series. The maximum temperature of the airflow and battery modules was obtained and is provided in Figure 14. As expected, it can be seen that the temperature of the airflow and modules increases as the number of the modules increases in a series. This is because the air extracts a higher amount of heat from the initial battery modules, and, as it moves along in a series, its heat extraction capacity reduces, which results in an increase in the temperature. However, due to the hybrid design of the developed battery module, the impact of this phenomenon has been significantly reduced, as the temperature difference for the battery modules is approximately 0.31 °C across the four battery modules. This is mainly because the CPCM is used as the primary coolant, and it extracts the heat and maintains the uniformity. This can also be seen in the temperature contours provided in Figure 15.
In order to extrapolate the results over the 25 battery modules in a series, the equations obtained from the trendlines for both the airflow and cell temperature were used and are provided below. The R2 value for the airflow trendline is 0.9953 and the battery module trendline is 0.9963.
A i r   F l o w   T e m p e r a t u r e = 0.293122289793738 ln B + 28.3571103960402
B a t t e r y   M o d u l e   T e m p e r a t u r e = 0.226234840293359 ln B + 28.725253374811  
where B is the number of modules attached in a series.
The result of this extrapolation is provided in Figure 16. It can be seen that the temperature difference between the maximum temperature of the final module and the initial module is 0.72 °C, whereas the difference in the airflow is 0.94 °C. Moreover, the overall temperature uniformity across the entire battery pack is 1.14 °C. This shows that, even with 25 modules stacked in a series, the temperature uniformity is still high. Therefore, the developed thermal management strategy can be scaled up or down according to the vehicle requirements.
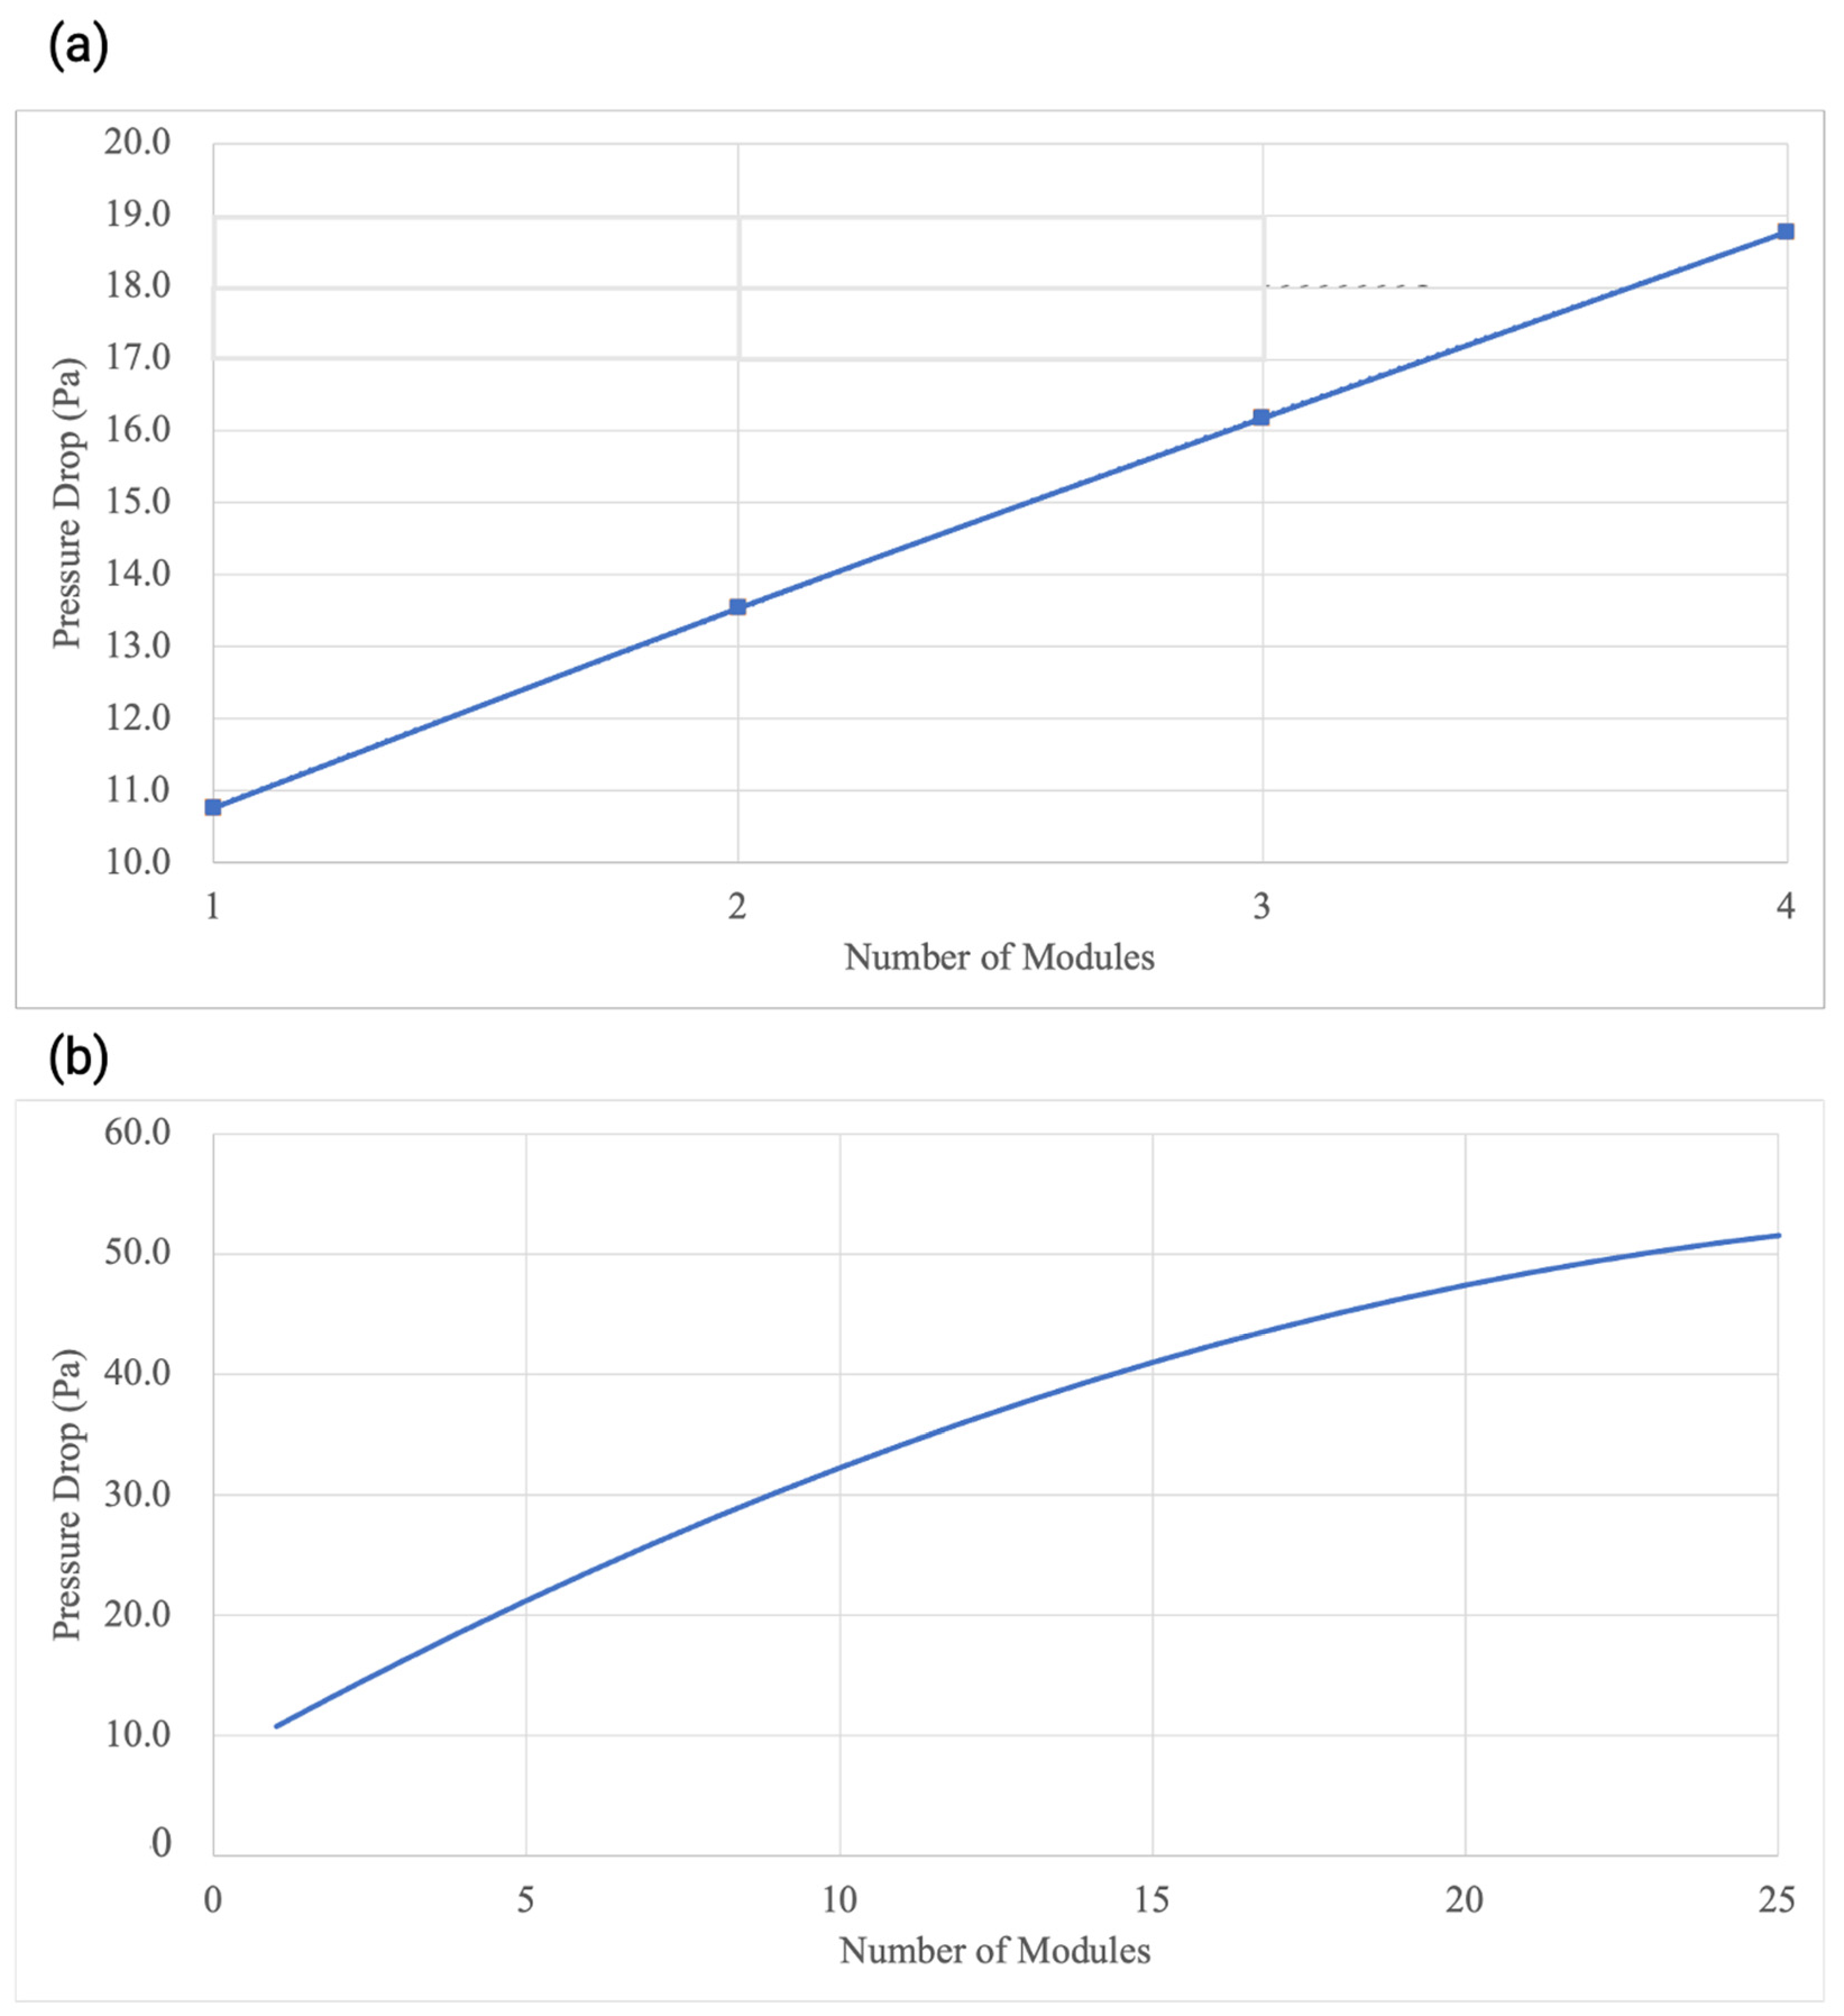
Similarly, the pressure drop was also obtained using the numerical simulations, and the results for up to four battery modules are provided in Figure 17a. A trendline was obtained, and the results were extrapolated for the entire 25 battery modules in a series, as shown in Figure 17b. The trendline equation is provided below.
P r e s s u r e   D r o p = 0.0459999999999923 B 2 + 2.89520000000002 ( B ) + 7.92099999999991
Furthermore, for the verification, a numerical simulation was conducted over the entire 25 battery modules in a series, and the pressure contours for the single air duct channel are provided in Figure 18. For a single battery module, the maximum pressure drop was ~11 Pa (Figure 13), whereas, for the 25 battery modules, the maximum pressure drop increased to ~51 Pa. Additionally, for a single channel of 19 mm in width and 6 mm in height, the airflow in terms of the cubic feet per minute (CFM) amounted to ~0.75 CFM. Hence, for the complete battery pack, the total CFM requirement will be ~68 CFM.

5.6. Comparison with the Open Literature

The results obtained from the scalability study were compared with the maximum temperature and temperature uniformity of various thermal management strategies developed by researchers in the open literature. The comparison is provided in Figure 19. Zeng et al. [43] developed a hybrid strategy by combining liquid cooling and microheat pipe arrays. Liu et al. [44] developed a hybrid strategy by combining a CPCM and copper tube liquid cooling. Xu et al. [45] developed a liquid cooling strategy using a wrench-shaped cold plate with a bifurcation structure. Xiong et al. [46] developed a novel liquid-cooling bionic flow channel in the shape of a spider web, and the results were compared with honeycomb and helical flow channels. Ling et al. [47] designed various configurations of minichannel cold plates and optimized the designs.
It can be seen from Figure 19 that the maximum temperature of the scaled battery pack at a 7 C discharge rate is similar to the results obtained in the studies in the open literature with a smaller battery module and discharge rates up to 3 C. Moreover, the temperature uniformity of 1.14 °C of the scaled battery pack is higher compared to the studies in the open literature. Additionally, the open literature studies require flowing fluid through the entire battery modules, which results in power consumption. However, the improved thermal performance obtained from the strategy developed in the present study is achieved without the flow of fluid and pumping power requirements.

6. Conclusions

This paper proposed a hybrid thermal management strategy for electric battery modules and conducted experimental and numerical studies to evaluate the strategy. At the core of the proposed strategy are cylindrical lithium-ion cells in direct contact with the composite phase change material. An air duct was added to the top of the cells to allow airflow. Rectangular cold plates were added between each cell’s rows and columns, filled with fluid and protruding in the air duct. The cold plates were all connected, and the fluid within this was considered a single body of fluid. Due to a single fluid body, the protrusion of the cold plate within the air duct allowed the fluid in between the columns to cool as well. Two experimental studies were conducted. In the first experimental study, the heat flux profiles were recorded, and in the second study, the battery module was developed, and temperature profiles of all the cells were obtained at a 1 C discharge rate. A numerical model was also developed based on the proposed strategy and validated using the second experimental study. The numerical data stayed within ±2% of the experimental data. The numerical results showed that the maximum temperature was limited to 300.95 K, and a high temperature uniformity of 0.4 K was obtained. Additionally, when comparing the addition of nanoparticles to increase the thermal conductivity of water, the results concluded that the cooling from the fluid was not sensitive enough to capture the increase of 0.32 W/m K thermal conductivity through the use of nanoparticles. Furthermore, to enhance the airflow’s cooling, the proposed strategy was modified by adding fins to the protruded cold plate section in the air duct. The results showed that the pressure drop through the addition of fins increased by ~245%, which will result in higher fan power requirements, whereas the maximum temperature of the battery module reduced by only 0.6 K. Additionally, when scaled up to an entire battery pack, the overall temperature uniformity across the pack was 1.14 K, with a maximum temperature of 302.6 K, which was within the optimal operating temperature and uniformity ranges. In terms of the airflow requirements for the 25 battery modules, the maximum pressure drop was ~51 Pa, which amounted to ~0.75 cubic feet per minute (CFM) of airflow. Hence, for the complete battery pack, the total CFM requirement was ~68 CFM. Finally, when compared to data in the open literature, the temperature uniformity of 1.14 K of the scaled battery pack at the 7 C discharge rate was higher compared to the smaller battery modules with discharge rates of 3 C. Therefore, the developed thermal management strategy provides significant cooling and temperature uniformity, eliminates the requirement of a pump and reservoir, and can be scaled up or down according to the energy and power requirements.

7. Limitations and Future Research Outlook

As concluded above, the hybrid thermal management strategy is capable of maintaining the battery module temperatures within the feasible operating range while significantly reducing the energy requirements for the operation of the thermal management system. However, gaps still remain which require further investigation and research in order to apply this strategy to practical applications.
The limitations of the research performed in this thesis are as follows:
  • The research was conducted on 18650 Li-ion cells and it is not applicable to larger cells without further investigation.
  • The research was conducted on cylindrical Li-ion cells and it is not applicable to different cell geometries without further investigation.
  • The research is not applicable to discharge rates higher than 7 C without further investigation.
  • The structural integrity of various developed components has not been investigated.
Furthermore, several recommendations can be made for future research, as listed below:
  • Experiments should be conducted to obtain heat flux profiles of lithium-ion cells at high charging rates and at various drive cycles, and used to obtain and improve the thermal performance of the hybrid battery module.
  • Experiments should be conducted by developing a prototype of the scaled-up battery pack to improve the numerical simulations for the scaled battery pack and further validate it.
  • A study should be conducted for the developed hybrid battery module with larger lithium-ion cells, such as the 26650 and 42120 cylindrical cells.
  • An experimental and numerical study should be conducted to evaluate the performance of the developed hybrid thermal management strategies and battery module in instances of thermal runaway.

Author Contributions

Conceptualization, S.S. and M.A.-C.; methodology, S.S. and M.A.-C.; software, S.S.; validation, S.S.; formal analysis, S.S.; investigation, S.S.; resources, M.A.-C.; data curation, S.S.; writing—original draft preparation, S.S.; writing—review and editing, M.A.-C.; visualization, S.S. and M.A.-C.; supervision, M.A.-C.; project administration, M.A.-C.; funding acquisition, M.A.-C. All authors have read and agreed to the published version of the manuscript.

Funding

This research received no external funding.

Data Availability Statement

The raw data supporting the conclusions of this article will be made available by the authors on request.

Conflicts of Interest

The authors declare no conflict of interest.

Nomenclature

ρ density (kg m−3)
ttime (s)
v velocity (m s−1)
ϵis a small number (0.001) to prevent division by zero
D characteristic length (m)
S m user-defined function for the continuity equation
Ppressure (Pa)
τ ̿ stress tensor
Amushis the mushy zone constant
g gravitational acceleration (9.81 m s−2)
F external forces, porous-media source terms, and user-defined sources
μ dynamic viscosity (Pa s)
Ttemperature (K)
U unit tensor
E energy (J)
k T effective thermal conductivity (W m−1 K−1)
Henthalpy (J)
hsensible enthalpy (J)
Hlatent heat (J)
β liquid fraction
c p specific heat capacity (J kg−1 K−1)
mmass (kg)
Qheat generation (W)
ReReynolds number (dimensionless)
vvolume (m3)

References

  1. US EPA. Fast Facts on Transportation Greenhouse Gas Emission. Available online: https://www.epa.gov/greenvehicles/fast-facts-transportation-greenhouse-gas-emissions (accessed on 4 August 2023).
  2. Omar, N.; Monem, M.A.; Firouz, Y.; Salminen, J.; Smekens, J.; Hegazy, O.; Gaulous, H.; Mulder, G.; Bossche, P.V.D.; Coosemans, T.; et al. Lithium iron phosphate based battery—Assessment of the aging parameters and development of cycle life model. Appl. Energy 2014, 113, 1575–1585. [Google Scholar] [CrossRef]
  3. Sefidan, A.M.; Sojoudi, A.; Saha, S.C. Nanofluid-based cooling of cylindrical lithium-ion battery packs employing forced air flow. Int. J. Therm. Sci. 2017, 117, 44–58. [Google Scholar] [CrossRef]
  4. Saw, L.H.; Poon, H.M.; Thiam, H.S.; Cai, Z.; Chong, W.T.; Pambudi, N.A.; King, Y.J. Novel thermal management system using mist cooling for lithium-ion battery packs. Appl. Energy 2018, 223, 146–158. [Google Scholar] [CrossRef]
  5. Rao, Z.; Wang, S.; Zhang, G. Simulation and experiment of thermal energy management with phase change material for ageing LiFePO4 power battery. Energy Convers. Manag. 2011, 52, 3408–3414. [Google Scholar] [CrossRef]
  6. Wei, Y.; Agelin-Chaab, M. Development and experimental analysis of a hybrid cooling concept for electric vehicle battery packs. J. Energy Storage 2019, 25, 100906. [Google Scholar] [CrossRef]
  7. Shahid, S.; Chea, B.; Agelin-Chaab, M. Development of a hybrid cooling concept for cylindrical li-ion cells. J. Energy Storage 2022, 50, 104214. [Google Scholar] [CrossRef]
  8. Park, S.; Jung, D. Battery cell arrangement and heat transfer fluid effects on the parasitic power consumption and the cell temperature distribution in a hybrid electric vehicle. J. Power Sources 2013, 227, 191–198. [Google Scholar] [CrossRef]
  9. Patil, M.S.; Seo, J.-H.; Lee, M.-Y. A novel dielectric fluid immersion cooling technology for Li-ion battery thermal management. Energy Convers. Manag. 2020, 229, 113715. [Google Scholar] [CrossRef]
  10. Dubey, P.; Pulugundla, G.; Srouji, A.K. Direct Comparison of Immersion and Cold-Plate Based Cooling for Automotive Li-Ion Battery Modules. Energies 2021, 14, 1259. [Google Scholar] [CrossRef]
  11. Shahid, S.; Agelin-Chaab, M. A review of thermal runaway prevention and mitigation strategies for lithium-ion batteries. Energy Convers. Manag. X 2022, 16, 100310. [Google Scholar] [CrossRef]
  12. Panchal, S.; Khasow, R.; Dincer, I.; Agelin-Chaab, M.; Fraser, R.; Fowler, M. Thermal design and simulation of mini-channel cold plate for water cooled large sized prismatic lithium-ion battery. Appl. Therm. Eng. 2017, 122, 80–90. [Google Scholar] [CrossRef]
  13. Panchal, S.; Mathewson, S.; Fraser, R.; Culham, R.; Fowler, M. Thermal Management of Lithium-Ion Pouch Cell with Indirect Liquid Cooling using Dual Cold Plates Approach. SAE Int. J. Altern. Powertrains 2015, 4, 1184. [Google Scholar] [CrossRef]
  14. Zhao, J.; Rao, Z.; Li, Y. Thermal performance of mini-channel liquid cooled cylinder based battery thermal management for cylindrical lithium-ion power battery. Energy Convers. Manag. 2015, 103, 157–165. [Google Scholar] [CrossRef]
  15. Zhao, C.; Sousa, A.C.M.; Jiang, F. Minimization of thermal non-uniformity in lithium-ion battery pack cooled by channeled liquid flow. Int. J. Heat Mass. Transf. 2019, 129, 660–670. [Google Scholar] [CrossRef]
  16. Rao, Z.; Qian, Z.; Kuang, Y.; Li, Y. Thermal performance of liquid cooling based thermal management system for cylindrical lithium-ion battery module with variable contact surface. Appl. Therm. Eng. 2017, 123, 1514–1522. [Google Scholar] [CrossRef]
  17. He, F.; Ams, A.A.; Roosien, Y.; Tao, W.; Geist, B.; Singh, K. Reduced-order thermal modeling of liquid-cooled lithium-ion battery pack for EVs and HEVs. In Proceedings of the IEEE Transportation and Electrification Conference and Expo, Chicago, IL, USA, 14 June 2017. [Google Scholar] [CrossRef]
  18. Al-Hallaj, S.; Selman, J.R. A Novel Thermal Management System for Electric Vehicle Batteries Using Phase-Change Material. J. Electrochem. Soc. 2000, 147, 3231. [Google Scholar] [CrossRef]
  19. Javani, N.; Dincer, I.; Naterer, G.F. Numerical Modeling of Submodule Heat Transfer with Phase Change Material for Thermal Management of Electric Vehicle Battery Packs. J. Therm. Sci. Eng. Appl. 2015, 7, 031005. [Google Scholar] [CrossRef]
  20. Jiang, G.; Huang, J.; Liu, M.; Cao, M. Experiment and simulation of thermal management for a tube-shell Li-ion battery pack with composite phase change material. Appl. Therm. Eng. 2017, 120, 1–9. [Google Scholar] [CrossRef]
  21. He, F.; Li, X.; Zhang, G.; Zhong, G.; He, J. Experimental investigation of thermal management system for lithium ion batteries module with coupling effect by heat sheets and phase change materials. Int. J. Energy Res. 2018, 42, 3279–3288. [Google Scholar] [CrossRef]
  22. Hussain, A.; Abidi, I.H.; Tso, C.Y.; Chan, K.C.; Luo, Z.; Chao, C.Y.H. Thermal management of lithium ion batteries using graphene coated nickel foam saturated with phase change materials. Int. J. Therm. Sci. 2018, 124, 23–35. [Google Scholar] [CrossRef]
  23. Ye, G.; Zhang, G.; Jiang, L.; Yang, X. Temperature control of battery modules through composite phase change materials with dual operating temperature regions. Chem. Eng. J. 2022, 449, 137733. [Google Scholar] [CrossRef]
  24. Wu, W.; Ye, G.; Zhang, G.; Yang, X. Composite phase change material with room-temperature-flexibility for battery thermal management. Chem. Eng. J. 2022, 428, 131116. [Google Scholar] [CrossRef]
  25. Faraji, H.; El-Alami, M.; Arshad, A.; Hariti, Y. Numerical Survey on Performance of Hybrid NePCM for Cooling of Electronics: Effect of Heat Source Position and Heat Sink Inclination. J. Therm. Sci. Eng. Appl. 2021, 13, 051010. [Google Scholar] [CrossRef]
  26. Arshad, A.; Jabbal, M.; Faraji, H.; Talebizadehsardari, P.; Bashir, M.A.; Yan, Y. Numerical study of nanocomposite phase change material-based heat sink for the passive cooling of electronic components. Heat Mass. Transf. 2021, 1–15. [Google Scholar] [CrossRef]
  27. Faraji, H.; Yıldız, Ç.; Arshad, A.; Arıcı, M.; Choukairy, K.; El-Alami, M. Passive thermal management strategy for cooling multiple portable electronic components: Hybrid nanoparticles enhanced phase change materials as an innovative solution. J. Energy Storage 2023, 70, 108087. [Google Scholar] [CrossRef]
  28. Wei, Y.; Agelin-Chaab, M. Experimental investigation of a novel hybrid cooling method for lithium-ion batteries. Appl. Therm. Eng. 2018, 136, 375–387. [Google Scholar] [CrossRef]
  29. Wang, S.; Li, Y.; Li, Y.Z.; Mao, Y.; Zhang, Y.; Guo, W.; Zhong, M. A forced gas cooling circle packaging with liquid cooling plate for the thermal management of Li-ion batteries under space environment. Appl. Therm. Eng. 2017, 123, 929–939. [Google Scholar] [CrossRef]
  30. Shahid, S.; Agelin-Chaab, M. Development of hybrid thermal management techniques for battery packs. Appl. Therm. Eng. 2021, 186, 116542. [Google Scholar] [CrossRef]
  31. Kumar, M.D.; Bhowmik, C.; Bhowmik, S.; Murari, P.K. Property-enhanced paraffin-based composite phase change material for thermal energy storage: A review. Environ. Sci. Pollut. Res. 2022, 29, 43556–43587. [Google Scholar] [CrossRef]
  32. ANSYS. ANSYS Fluent Theory Guide; ANSYS, Inc.: Canonsburg, PA, USA, 2020. [Google Scholar]
  33. Paraffin 42-44, in Block Form 8002-74-2. Available online: https://www.sigmaaldrich.com/CA/en/product/mm/107150 (accessed on 24 August 2023).
  34. Amburi, P.K.; Senthilkumar, G.; Nithya, A. Novel use of CuO nanoparticles additive for improving thermal conductivity of MgO/water and MWCNT/water nanofluids. J. Therm. Anal. Calorim. 2023, 148, 10389–10398. [Google Scholar] [CrossRef]
  35. Bioucas, F.E.B.; Köhn, C.; Jean-Fulcrand, A.; Garnweitner, G.; Koller, T.M.; Fröba, A.P. Effective Thermal Conductivity of Nanofluids Containing Silicon Dioxide or Zirconium Dioxide Nanoparticles Dispersed in a Mixture of Water and Glycerol. Int. J. Thermophys. 2022, 43, 167. [Google Scholar] [CrossRef]
  36. Pourrajab, R.; Noghrehabadi, A.; Behbahani, M.; Hajidavalloo, E. An efficient enhancement in thermal conductivity of water-based hybrid nanofluid containing MWCNTs-COOH and Ag nanoparticles: Experimental study. J. Therm. Analy Calorim. 2021, 143, 3331–3343. [Google Scholar] [CrossRef]
  37. Corasaniti, S.; Bovesecchi, G.; Gori, F. Experimental Thermal Conductivity of Alumina Nanoparticles in Water with and without Sonication. Int. J. Thermophys. 2021, 42, 23. [Google Scholar] [CrossRef]
  38. Jabbari, F.; Rajabpour, A.; Saedodin, S. Thermal conductivity of CNT–water nanofluid at different temperatures, volume fractions, and diameters: Experimental investigation and molecular dynamics simulations. Microfluid. Nanofluidics 2021, 25, 102. [Google Scholar] [CrossRef]
  39. Ghasemi, M.; Niknejadi, M.; Toghraie, D. Direct effect of nanoparticles on the thermal conductivity of CuO-water nanofluid in a phase transition phenomenon using molecular dynamics simulation. J. Therm. Analy Calorim. 2021, 144, 2483–2495. [Google Scholar] [CrossRef]
  40. Tesla Model S/X Pack—75 kWh/214 Ah/350 V. Available online: https://www.secondlife-evbatteries.com/products/tesla-75kw-pack (accessed on 27 September 2023).
  41. Introduction of INR18650-25R. Available online: https://www.powerstream.com/p/INR18650-25R-datasheet.pdf (accessed on 17 November 2023).
  42. Moffat, R.J. Describing the uncertainties in experimental results. Exp. Therm. Fluid. Sci. 1988, 1, 3–17. [Google Scholar] [CrossRef]
  43. Zeng, W.; Niu, Y.; Li, S.; Hu, S.; Mao, B.; Zhang, Y. Cooling performance and optimization of a new hybrid thermal management system of cylindrical battery. Appl. Therm. Eng. 2022, 217, 119171. [Google Scholar] [CrossRef]
  44. Liu, Z.; Cao, M.; Zhang, Y.; Li, J.; Jiang, G.; Shi, H. Thermal management of cylindrical battery pack based on a combination of silica gel composite phase change material and copper tube liquid cooling. J. Energy Storage 2023, 71, 108205. [Google Scholar] [CrossRef]
  45. Xu, Q.; Xie, Y.; Huang, Y.; Li, X.; Huang, H.; Bei, S.; Wang, H.; Zheng, K.; Wang, X.; Li, L. Enhancement of thermal management for cylindrical battery module based on a novel wrench-shaped design for the cold plate. Sust. Energy Technol. Assess. 2023, 59, 103421. [Google Scholar] [CrossRef]
  46. Xiong, X.; Wang, Z.; Fan, Y.; Wang, H. Numerical analysis of cylindrical lithium-ion battery thermal management system based on bionic flow channel structure. Therm. Sci. Eng. Prog. 2023, 42, 101879. [Google Scholar] [CrossRef]
  47. Ling, L.; Li, L.; Xie, Y.; Wang, T.; Zheng, K.; Shan, S.; Zhang, L.; Bei, S.; Xu, Q. Optimal Design of Minichannel Cold Plate for the Thermal Management of Cylindrical Battery Modules. Energy Technol. 2023, 11, 2201484. [Google Scholar] [CrossRef]
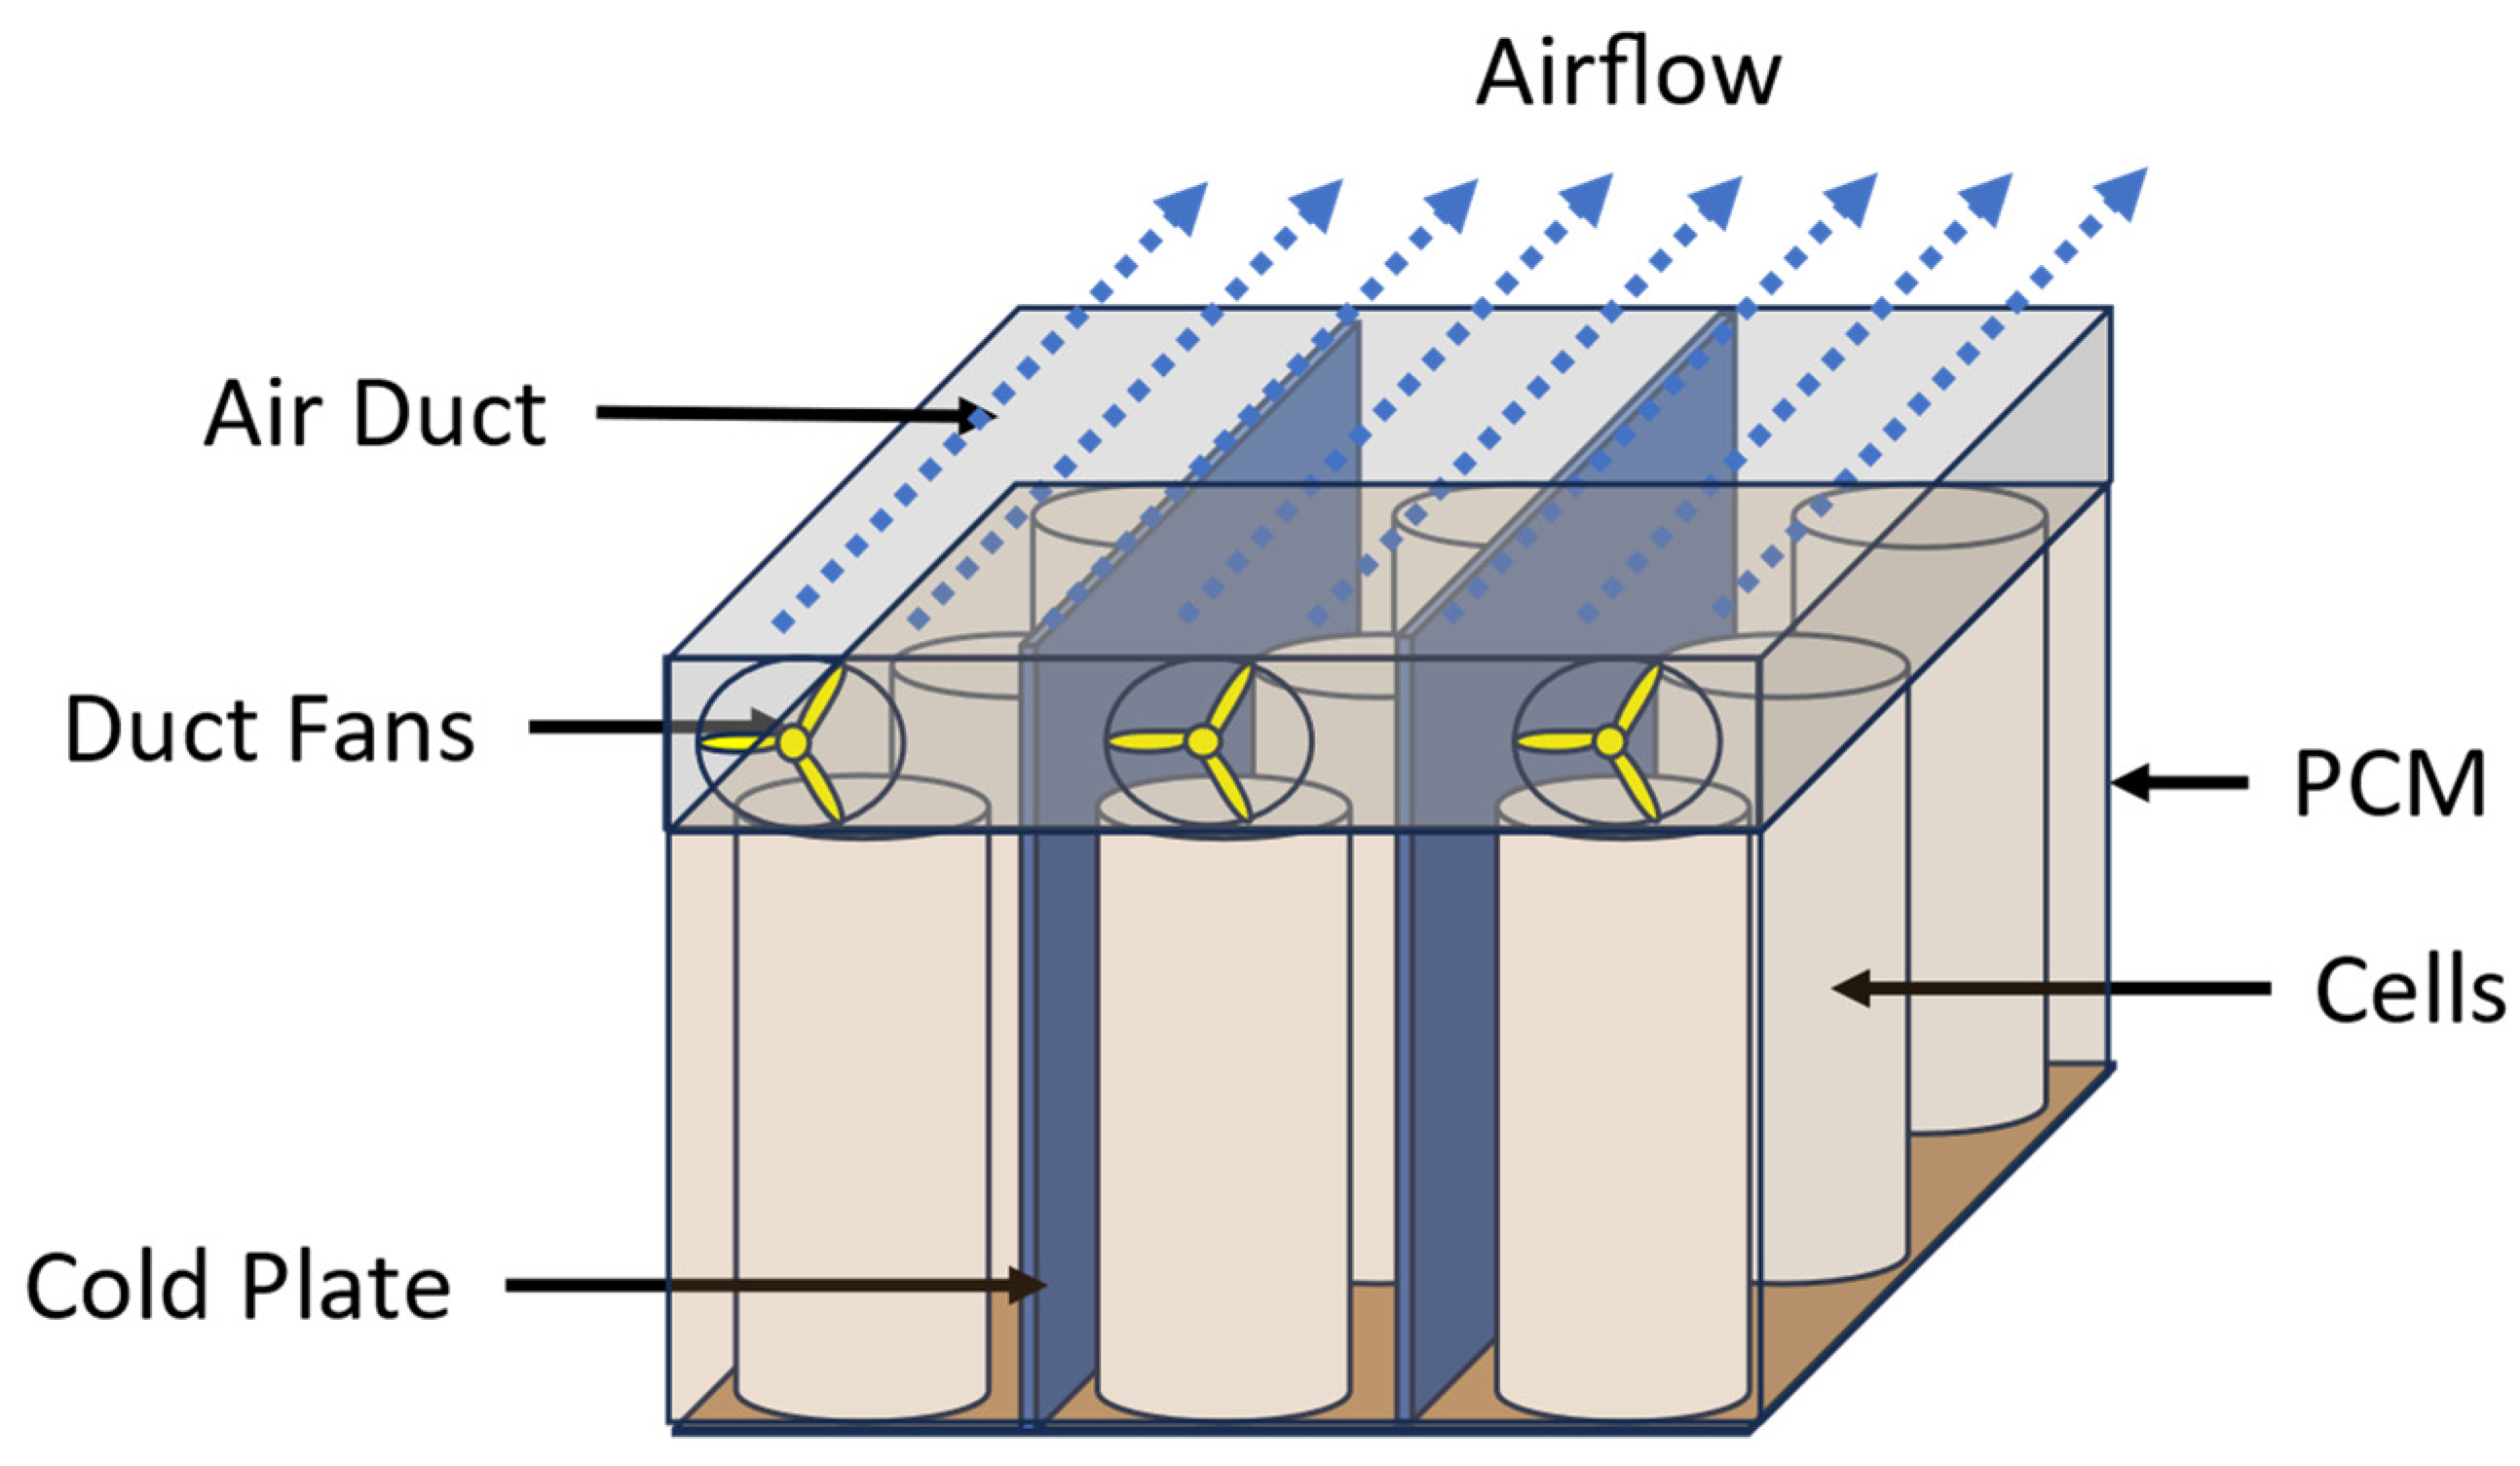
Figure 1. Three-dimensional schematic of the proposed strategy.
Batteries 10 00032 g001
Figure 2. (a) Isometric view and (b) top cross-section view of the proposed strategy.
Batteries 10 00032 g002
Figure 3. Schematic of the front view of (a) configuration 1 and (b) configuration 2.
Batteries 10 00032 g003
Figure 4. (a) Schematic of the battery module assembly (BMA) in the series; (b) schematic of the BMA connections in parallel.
Batteries 10 00032 g004
Figure 5. Airflow domain for a single series air duct channel of the battery pack.
Batteries 10 00032 g005
Figure 6. Experiment I—(a) setup and (b) experimental schematics.
Batteries 10 00032 g006
Figure 7. Experiment II—(a) setup and (b) experimental schematics.
Batteries 10 00032 g007
Figure 8. (a) Isometric view and (b) cross-section view of the developed mesh.
Batteries 10 00032 g008
Figure 9. (a) Velocity profiles, (b) average velocity based on a number of elements, and (c) temporal velocity profiles for the different time-step sizes.
Batteries 10 00032 g009
Figure 10. (a) Heat flux profiles and (b) numerical model validation results.
Batteries 10 00032 g010aBatteries 10 00032 g010b
Figure 11. Temperature contours of the (a) cells, (b) composite PCM, and (c) fluid at the 25 °C ambient temperature; temperature contours of the (d) cells, (e) composite PCM, and (f) fluid at 42.24 °C.
Batteries 10 00032 g011
Figure 12. (a) CPCM phase change comparison and (b) maximum temperature increase comparison of the battery module with water and H2O–AG–MWCNT.
Batteries 10 00032 g012
Figure 13. Variation in the maximum and minimum temperatures with the maximum pressure drop for the proposed configurations.
Batteries 10 00032 g013
Figure 14. Maximum temperature with the increasing battery modules for the (a) airflow and (b) cells.
Batteries 10 00032 g014
Figure 15. Temperature contours of the cells in four battery modules connected in a series.
Batteries 10 00032 g015
Figure 16. Maximum temperature across 25 battery modules for the (a) airflow and (b) cells.
Batteries 10 00032 g016
Figure 17. Pressure drop across the increasing battery modules (a) through numerical simulations and (b) through extrapolation.
Batteries 10 00032 g017
Figure 18. Pressure contours for the air duct channel for 25 battery modules in a series.
Batteries 10 00032 g018
Figure 19. Comparison of results with the thermal management results in the open literature [43,44,45,46,47].
Batteries 10 00032 g019
Table 1. Physical properties of the materials used [31,32,33].
MaterialsDensity (kg/m3)Specific Heat (J/kg K)Thermal Conductivity (W/m K)Melting Heat Capacity
(J/kg)
Phase Change Temperature (°C)
Aluminum2719871202.4--
Wood70023100.173--
Air1.22510060.0242--
Water998.241820.6334,000100
Paraffin88021500.21245,00042–44
Paraffin with Copper Foam88021503.11170,40042–43
Table 2. Number of fins and corresponding inlet velocity for the developed configurations.
Battery Module ConfigurationNumber of FinsInlet Velocity (m/s)
Configuration 115.93
Configuration 229.28
Table 3. Calculated values of the relative bias and precision errors and total uncertainty of the heat flux measurement.
ParametersReference Value (W/m2)Absolute Bias Error (W/m2)Relative Bias Error (%)Relative Precision Error (%)Total Uncertainty (%)
Min. Heat Flux18.991.276.691.906.95
Max. Heat Flux584.161.270.220.050.22
Table 4. Calculated values of the relative bias and precision errors and the total uncertainty of the temperature measurement.
ParametersReference Value (°C)Absolute Bias Error (°C)Relative Bias Error (%)Relative Precision Error (%)Total Uncertainty (%)
Min. Temp.25142.224.57
Max. Temp.4712.131.492.6
Disclaimer/Publisher’s Note: The statements, opinions and data contained in all publications are solely those of the individual author(s) and contributor(s) and not of MDPI and/or the editor(s). MDPI and/or the editor(s) disclaim responsibility for any injury to people or property resulting from any ideas, methods, instructions or products referred to in the content.