Review

Synthesis Methods of Si/C Composite Materials for Lithium-Ion Batteries

School of Chemical, Biological and Battery Engineering, Gachon University, Seongnam-si 13120, Republic of Korea
*
Author to whom correspondence should be addressed.
Batteries 2024, 10(11), 381; https://doi.org/10.3390/batteries10110381
Submission received: 30 September 2024 / Revised: 22 October 2024 / Accepted: 23 October 2024 / Published: 28 October 2024

Abstract

:
Silicon anodes present a high theoretical capacity of 4200 mAh/g, positioning them as strong contenders for improving the performance of lithium-ion batteries. Despite their potential, the practical application of Si anodes is constrained by their significant volumetric expansion (up to 400%) during lithiation/delithiation, which leads to mechanical degradation and loss of electrical contact. This issue contributes to poor cycling stability and hinders their commercial viability, and various silicon–carbon composite fabrication methods have been explored to mitigate these challenges. This review covers key techniques, including ball milling, spray drying, pyrolysis, chemical vapor deposition (CVD), and mechanofusion. Each method has unique benefits; ball milling and spray drying are effective for creating homogeneous composites, whereas pyrolysis and CVD offer high-quality coatings that enhance the mechanical stability of silicon anodes. Mechanofusion has been highlighted for its ability to integrate silicon with carbon materials, showing the potential for further optimization. In light of these advancements, future research should focus on refining these techniques to enhance the stability and performance of Si-based anodes. The optimization of the compounding process has the potential to enhance the performance of silicon anodes by addressing the significant volume change and low conductivity, while simultaneously addressing cost-related concerns.

1. Introduction

Amid growing concerns regarding environmental pollution and global warming, efforts to reduce CO2 emissions have driven the development of the electric vehicle (EV) market as an alternative to internal combustion engines [1,2,3,4]. Currently, lithium-ion batteries are predominantly used in these electric vehicles and are also widely employed in portable electronic devices [5,6,7,8,9,10,11,12]. Lithium-ion batteries are composed of a cathode, an anode, a separator, and an electrolyte. The cathode and anode store electrical energy in the form of chemical energy. When charging a battery, the key considerations include stability, energy density, and cycle life [13,14,15]. However, lithium-ion batteries currently do not deliver the desired amount of energy, which is increasingly demanded by users [16]. To overcome this challenge, it is necessary to enhance both the energy density and capacity of lithium-ion batteries [17]. Consequently, significant research has been conducted to improve these aspects [3,18,19,20,21,22]. Graphite is currently used as the anode material in lithium-ion batteries [23,24]. The theoretical capacity of this anode material is 372 mAh/g [25,26,27], which contributes approximately 150 Wh/kg of energy. However, this is insufficient to satisfy the energy demands of electric vehicles [28,29]. Therefore, there is a need to develop alternative anode materials to replace graphite [30,31,32]. Si-based anode materials are an alternative to graphite anodes [33]. This is because, while graphite can accommodate one lithium ion for every six carbon atoms, silicon can host up to fifteen lithium ions for every four silicon atoms [34,35]. Silicon has a theoretical capacity of approximately 4200 mAh/g, which is about ten times higher than that of graphite, and its operating voltage is approximately 0.4 V versus Li/Li⁺ [36,37,38]. In addition, Si is environment-friendly and abundant, making it a promising candidate for next-generation anode materials [39]. However, the primary reason for the limited application of Si anodes is the significant volumetric expansion (approximately 400%) that occurs during electrochemical reactions, leading to particle cracking [20,40,41]. As a result, direct contact occurs between the electrolyte and silicon particles, leading to undesirable side reactions. Continuous charge and discharge cycles cause repeated breakdown and formation of a solid electrolyte interphase (SEI) layer, which in turn depletes the amount of active lithium [42]. Finally, the low electrical and ionic conductivities of Si are also important issues [43]. This results in slower charge and discharge rates and increased resistance within the electrode [44]. To address these issues, ongoing research has focused on several approaches, including nanostructuring [45,46,47,48,49], composite materials, electrolyte optimization [50,51,52,53,54,55], binder improvements [56,57,58,59,60], and interface engineering [61,62,63,64,65]. Among these approaches, this study aims to examine silicon–carbon composites. The rationale for this choice is that the use of Si alone has limitations in effectively addressing these issues [66]. Therefore, utilizing Si and carbon composite anode materials is a promising approach [67,68]. The silicon–carbon composites are advantageous because they leverage the high theoretical capacity of silicon while utilizing carbon to provide electrical conductivity and act as a buffer for volumetric expansion. Carbon-based materials possess structural flexibility, which enables them to alleviate the effects of volumetric expansion [69]. This review introduces ball milling, pyrolysis, spray drying, chemical vapor deposition (CVD), and mechanofusion processes for composite formation.

2. Synthesis Methods

2.1. Ball Milling

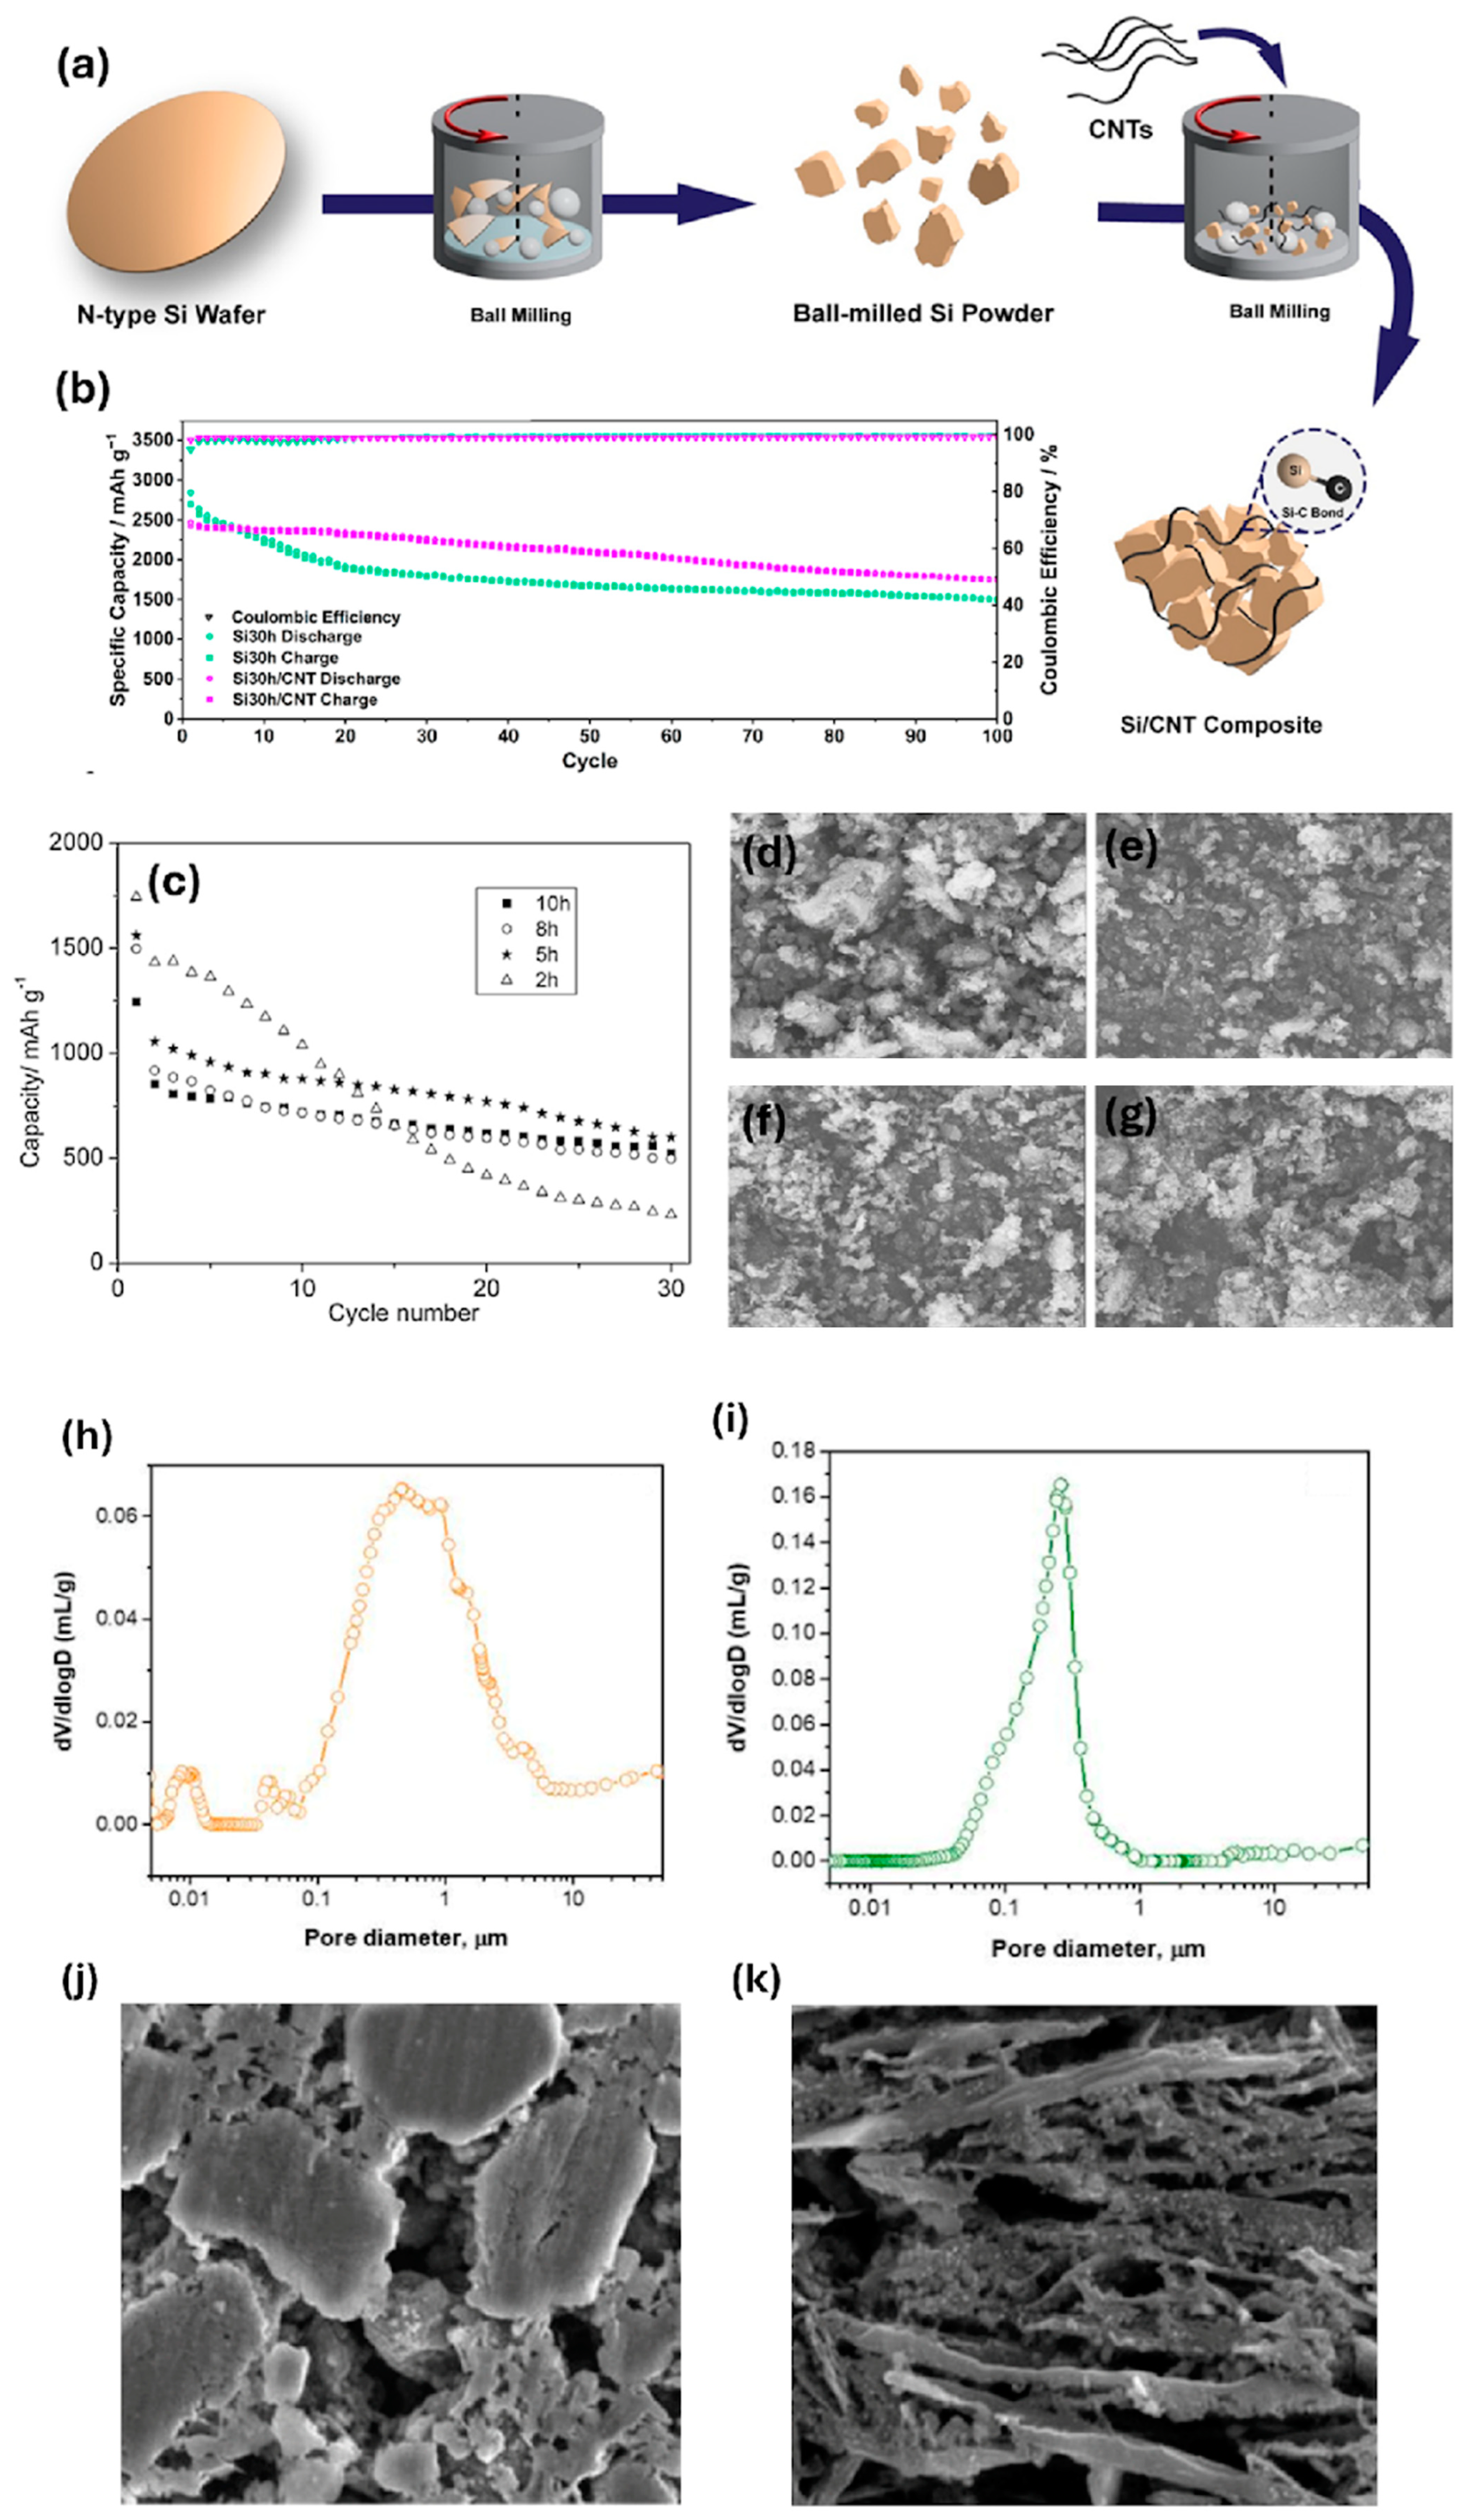
Figure 1 illustrates the appearance of balls and particles inside the chamber during ball milling. Ball milling is a complex process used to obtain nanostructured materials in powder form with an average particle size of less than 100 nm [70]. In addition, ball milling is a suitable method for large-scale production. This involves the high-speed collision of stainless steel or zirconia balls, which reduces larger particles to finer ones and promotes the formation of new bonds [71]. A ball mill consists of a cylindrical chamber that rotates around the horizontal axis. Generally, ball milling is used by filling the chamber with small balls made of materials such as iron or zirconia. The inside of the chamber is made of materials such as iron and rubber to prevent wear. Ball milling can be performed for approximately 100 to 150 h and can yield sized fine powders. It is characterized by the ability to maintain a vacuum or a specific gas atmosphere within the chamber. In addition, it offers the advantage of enabling ceramic nano-reinforcement [72]. This section presents the formation and analysis of silicon–carbon composites via ball milling, as investigated in a previous study [73,74,75].
Korrg et al. [76] synthesized silicon–carbon nanotube (Si/CNT) composites using silicon wafers and carbon nanotubes as precursors through high-energy ball milling (Figure 2a). The ball milling process was conducted for durations of 10, 20, and 30 h. The silicon particles milled for 10–20 h remained in the micrometer range. However, after 30 h of milling, all particles exhibited sizes of hundreds of nanometers. The performance of the Si30h/CNT composite with particles in the nanometer range was compared with that of a Si electrode subjected to 30 h of ball milling (Figure 2b). The Si30h/CNT electrode cell demonstrated initial coulombic efficiency (ICE) of 98.06% and discharge capacity of 2470 mAh/g. After 100 cycles, the Si30h/CNT electrode showed a capacity retention of 71.28. This is a significant improvement over the Si30h electrode, which showed 52.96%. This performance improvement was able to mitigate the volume change in Si particles due to the strong Si–C bond between CNT and Si. Furthermore, the exceptional mechanical properties of CNTs help maintain particle cohesion, reducing the likelihood of particle disintegration and disruption of the SEI, thereby improving the cycle stability of the Si/CNT electrode. Gu et al. [77] used coarse silicon and citric acid as carbon sources to form a silicon–carbon composite (Si/C) through ball milling. Ball milling was performed for 2, 5, 8, and 10 h to analyze the cycle performance. The discharge capacities of the composites were 232.4, 626.7, 496.6, and 524.4 mAh/g, respectively. Composites ball-milled for 5 h showed the best capacity retention (Figure 2c). Figure 2d–g shows the SEM images of the samples milled for 2, 5, 8, and 10 h, respectively. As shown by the SEM images, the duration of ball milling significantly affected the particle size of the composite. The composite synthesized without ball milling exhibited a greater tendency toward agglomeration than the composite produced from the ball-milled precursors. Ball milling for 5 h resulted in fewer agglomerates and smaller particle sizes. Ball milling for longer than 5 h increased the tendency for agglomeration. The Cabello et al. [78] Si/C composites were prepared by each method using wet and dry ball milling and their particle and electrochemical properties were compared. The pore size distribution of the dry ball-milled material ranges from 6 to 0.5 µm, 0.3 to 0.07 µm, and 0.015 to 0.008 µm (Figure 2h). The broad range of pore size distribution increases exposure to the electrolyte, which may result in continuous SEI formation and subsequent lithium loss. The pore size distribution resulting from wet ball milling (Figure 2i) ranges from 1 to 0.25 µm. This narrow range of pore sizes indicates a more uniform distribution of particles. Figure 2j,k shows SEM images of the composite obtained using the dry and wet ball milling process.
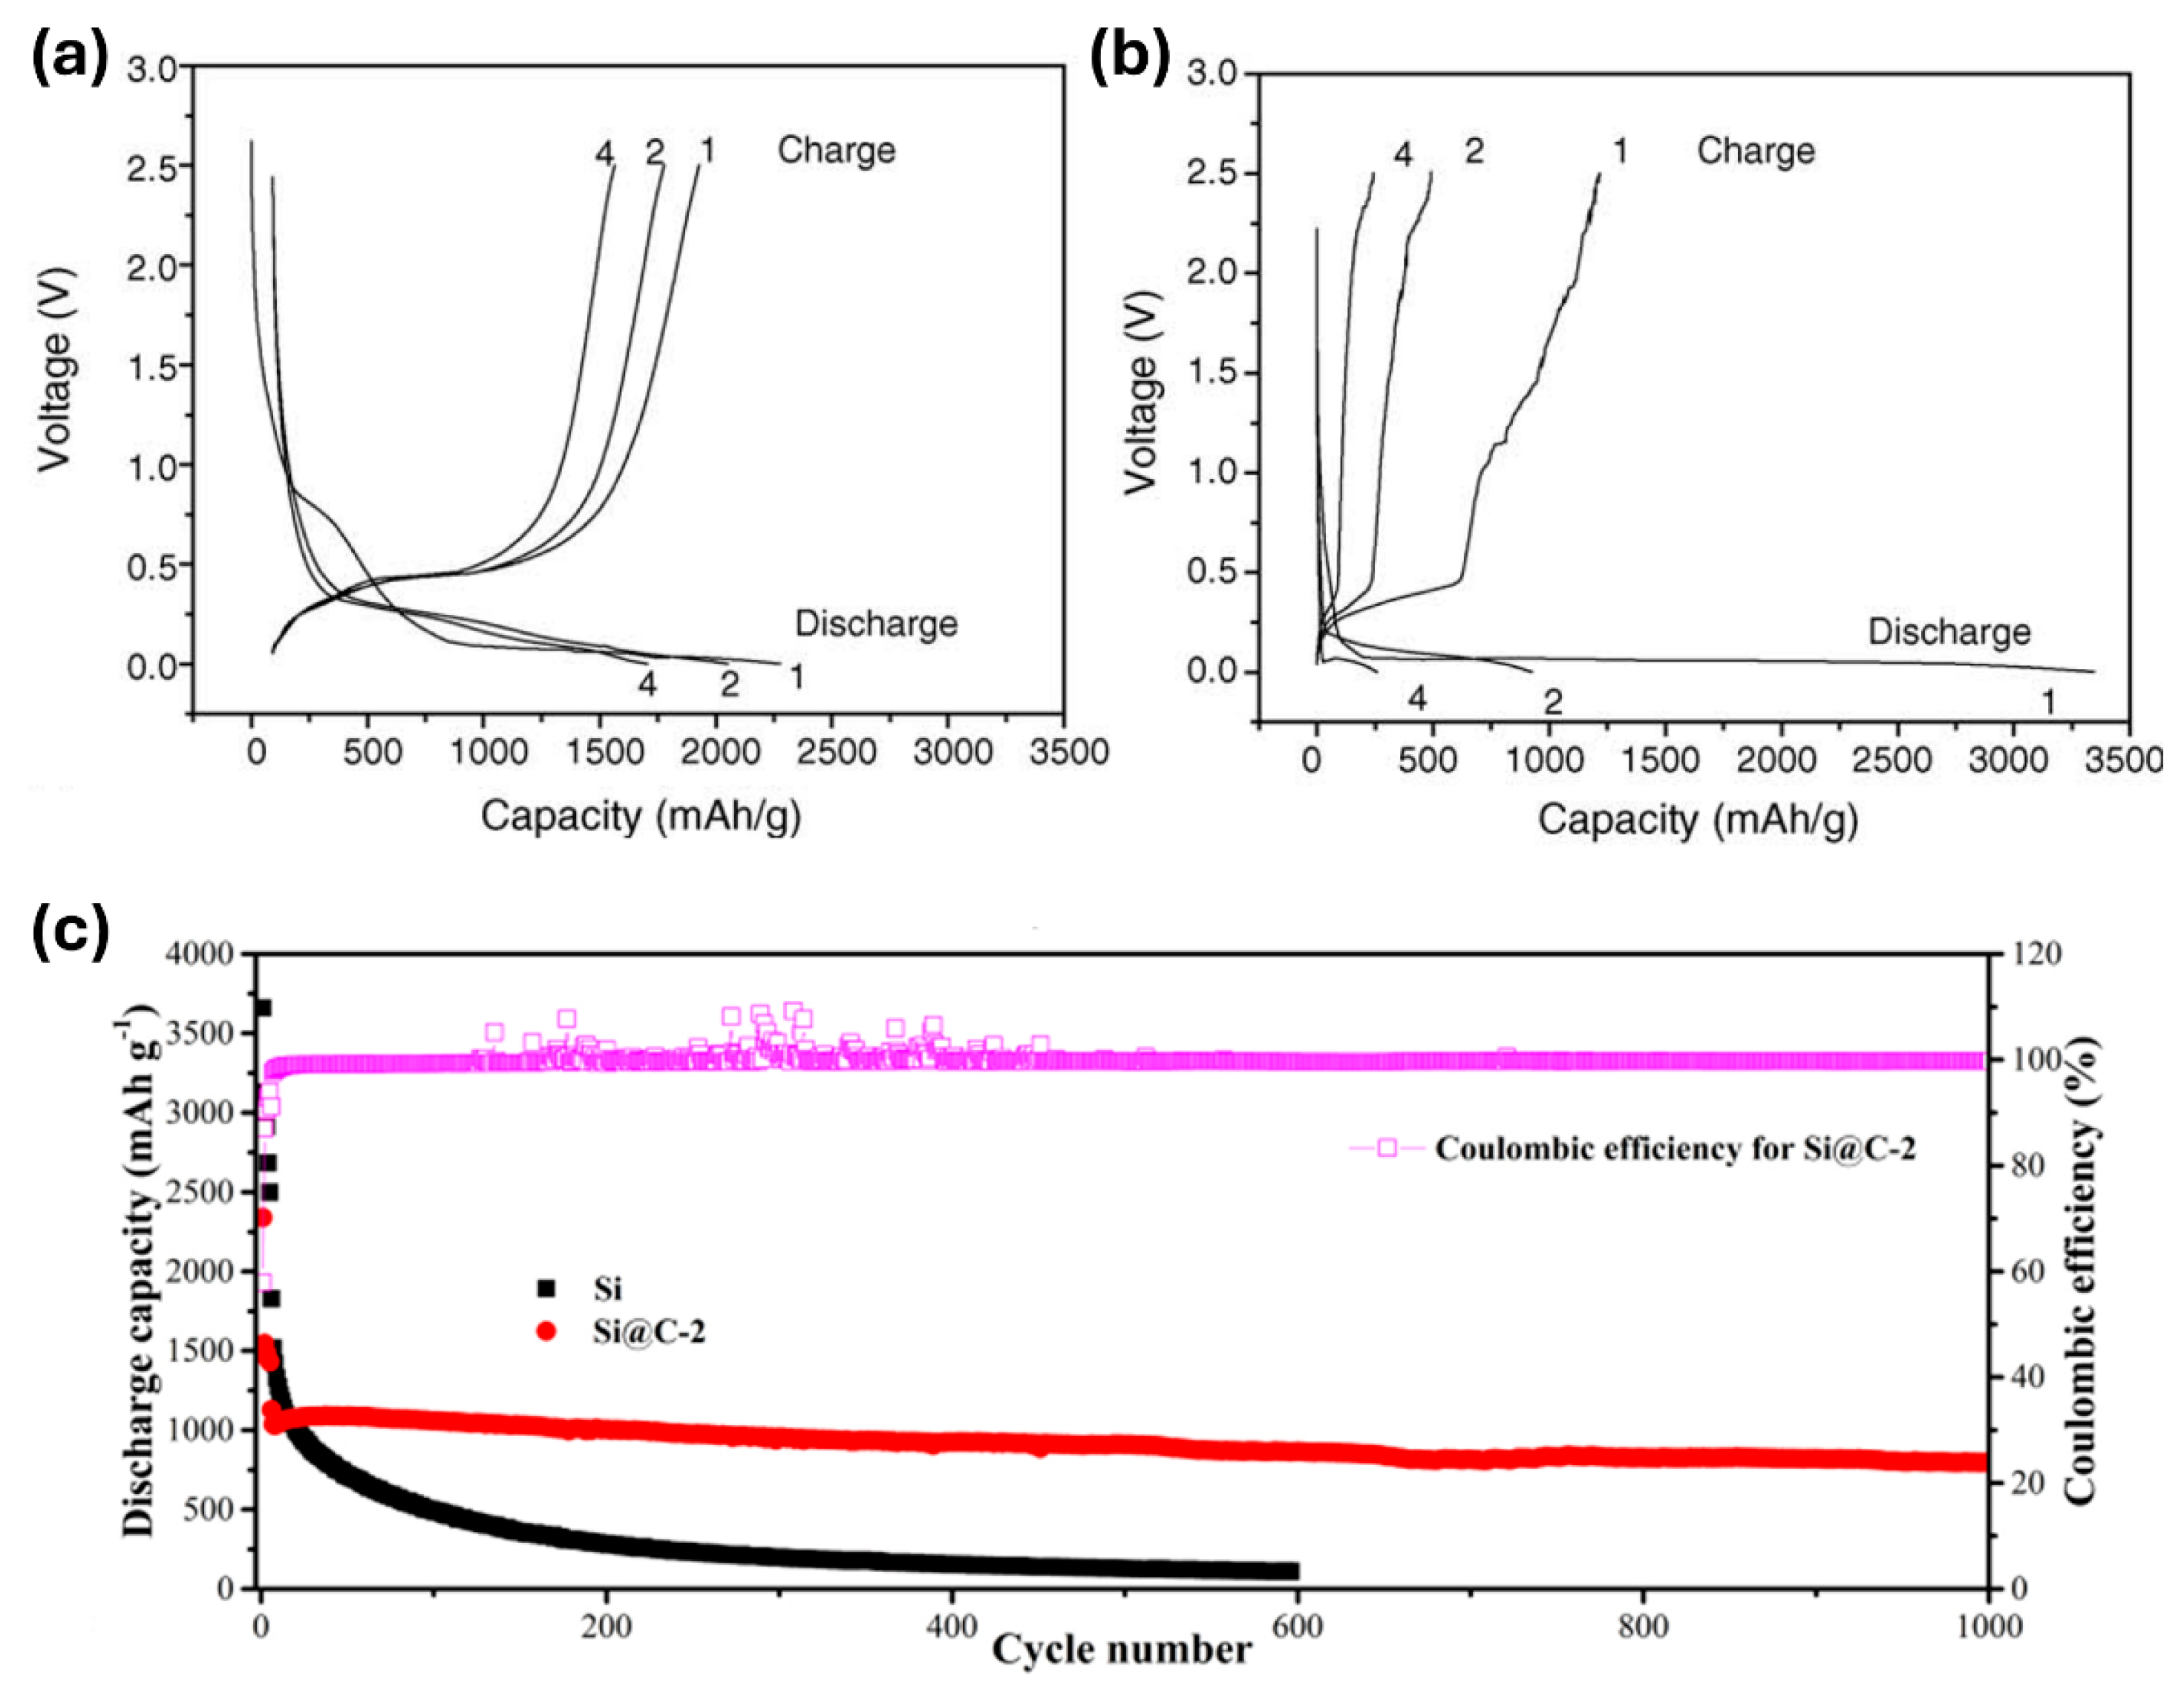
Zhang et al. [79] fabricated Si/graphite/multi-walled carbon nanotube (MWNT) composite anodes using ball milling and evaluated their electrochemical performance. This study compared pure silicon (Si) with silicon/graphite/multiwalled carbon nanotube (SGM) composites. The cycling performance of the SGM composite (Figure 3a) observed a plateau at approximately 0.4 V, indicating the integrity of the SGM electrode. Figure 3b shows a plateau at 0.1–0.2 V during lithiation, which corresponds to the electrochemical reaction of lithium and silicon. During delithiation, a plateau is observed at 0.4 V. Also, the initial discharge capacity was found to be 3343 mAh/g. However, after just four charge/discharge cycles, the discharge capacity dropped significantly to 256 mAh/g. This seems to be due to a large volume change in the Si. On the other hand, SGM exhibited an initial discharge capacity of about 2270 mAh/g, and after four charge/discharge cycles, the capacity decreased to about 1750 mAh/g with capacity retention of about 77.1%. Han et al. [80] prepared nitrogen-doped carbon and Si composites by ball milling using a carbon source containing nitrogen-doped carbon, specifically polyvinylpyrrolidone (PVP). PVP, a polymeric surfactant, is widely used in the chemical industry as a dispersant, emulsifier, and antiprecipitant. In addition to acting as a nitrogen-doped carbon source, PVP promotes the dispersion of Si particles during ball milling, thereby facilitating the formation of the Si/PVP precursor. The sample with a PVP content of 1.0 g was labeled as Si@C-2. The cycling performance of the Si and Si@C-2 electrodes was analyzed at a current density of 1000 mA/g (Figure 3c). A significant decrease in capacity was observed for the Si electrode, indicating poor cycling performance. In contrast, Si@C-2 exhibited improved charging/discharging cycle safety with a capacity of 797.7 mAh/g at the 1000th cycle, thus demonstrating superior long-term performance. The Si@C-2 composite showed advantages in lithium capture due to their Si-O-C chemical bonding and the presence of N-doped carbon. In addition, the ball milling process further tightened the bond between the silicon particles and PVP.

2.2. Pyrolysis

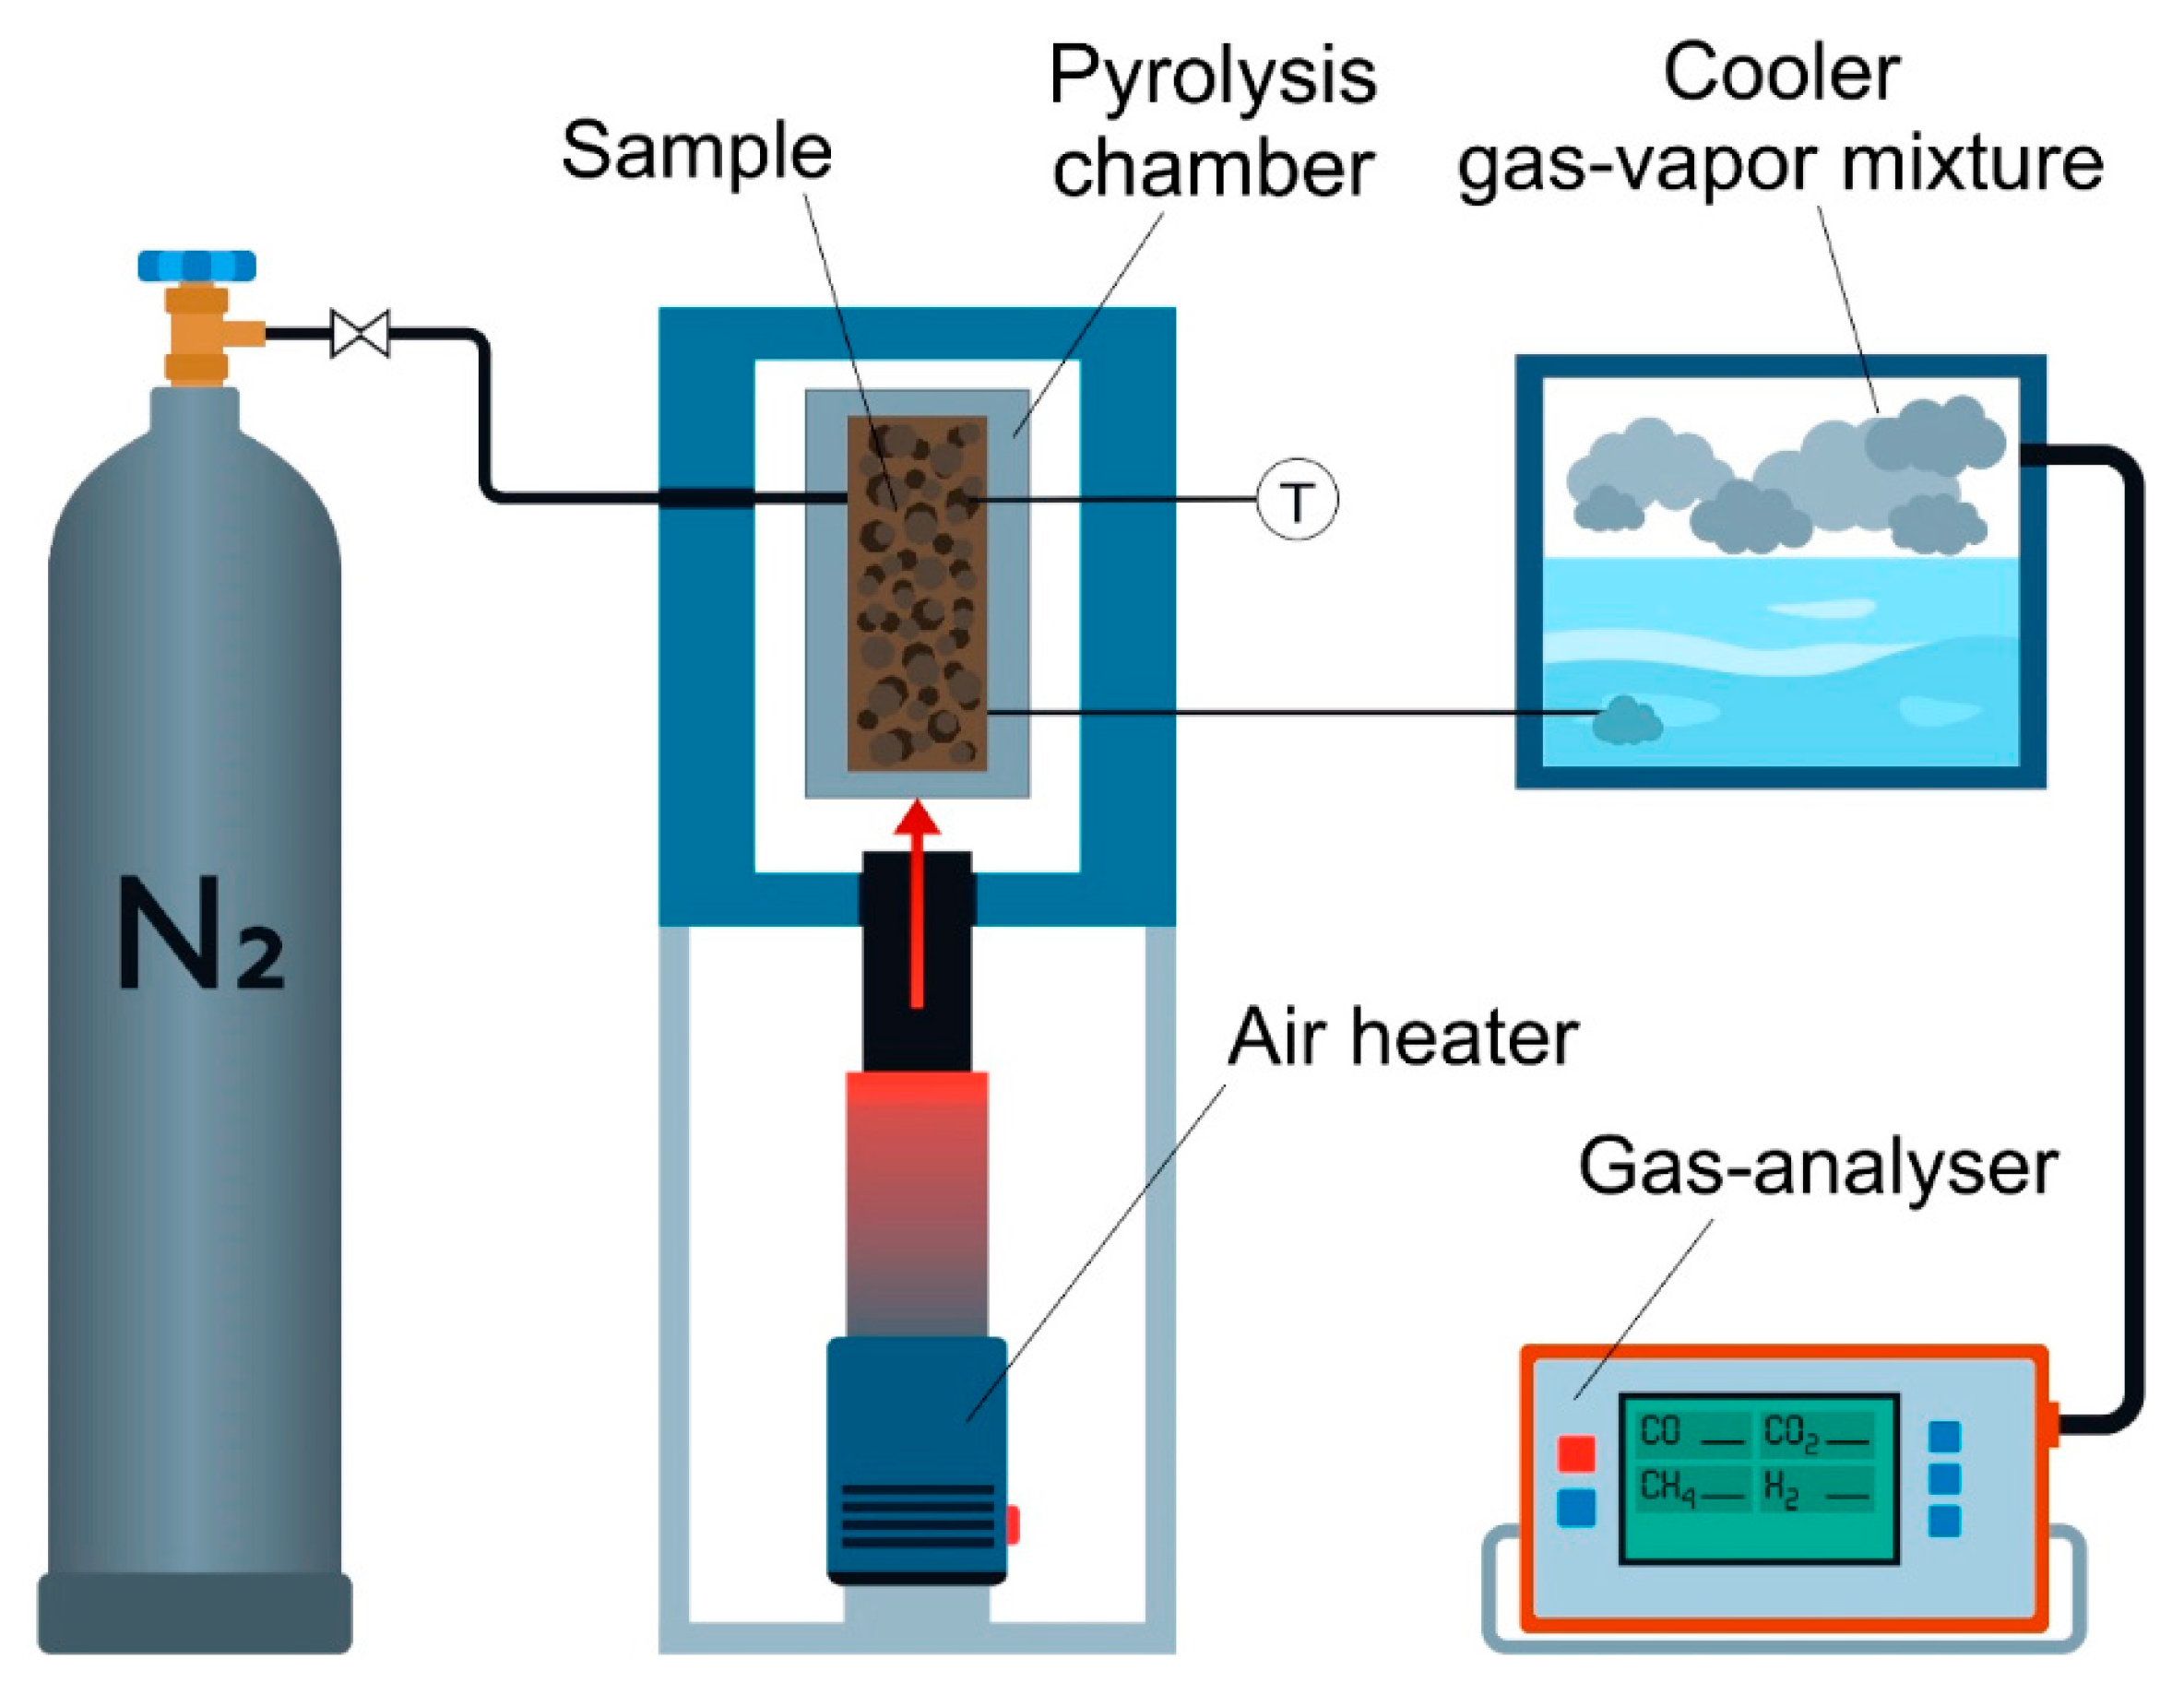
Figure 4 shows the pyrolysis process [81]. Pyrolysis is a fundamental chemical reaction that occurs when heat is applied to a material in the absence of oxygen and serves as an essential step prior to the vaporization and combustion of solid fuels. Pyrolysis can be classified into several types based on the process conditions, parameters (such as residence time, temperature, and heating rate), and products. The major pyrolysis methods include carbonization, conventional pyrolysis, rapid pyrolysis, flash pyrolysis (both liquid and gas), ultrapyrolysis, vacuum pyrolysis, sequential pyrolysis, and methanation pyrolysis. The reactor configuration includes a fluidized bed, rotary kiln, auger, vacuum, and a controlled-atmosphere pyrolysis reactor [82]. The gaseous pyrolysis products are removed from the tube by nitrogen flow, after which they are condensed to collect the polymeric organics. Low-molecular-weight organic gases are processed using a gas treatment system [83]. This section discusses the production of silicon–carbon composites through pyrolysis and analyzes the composites.
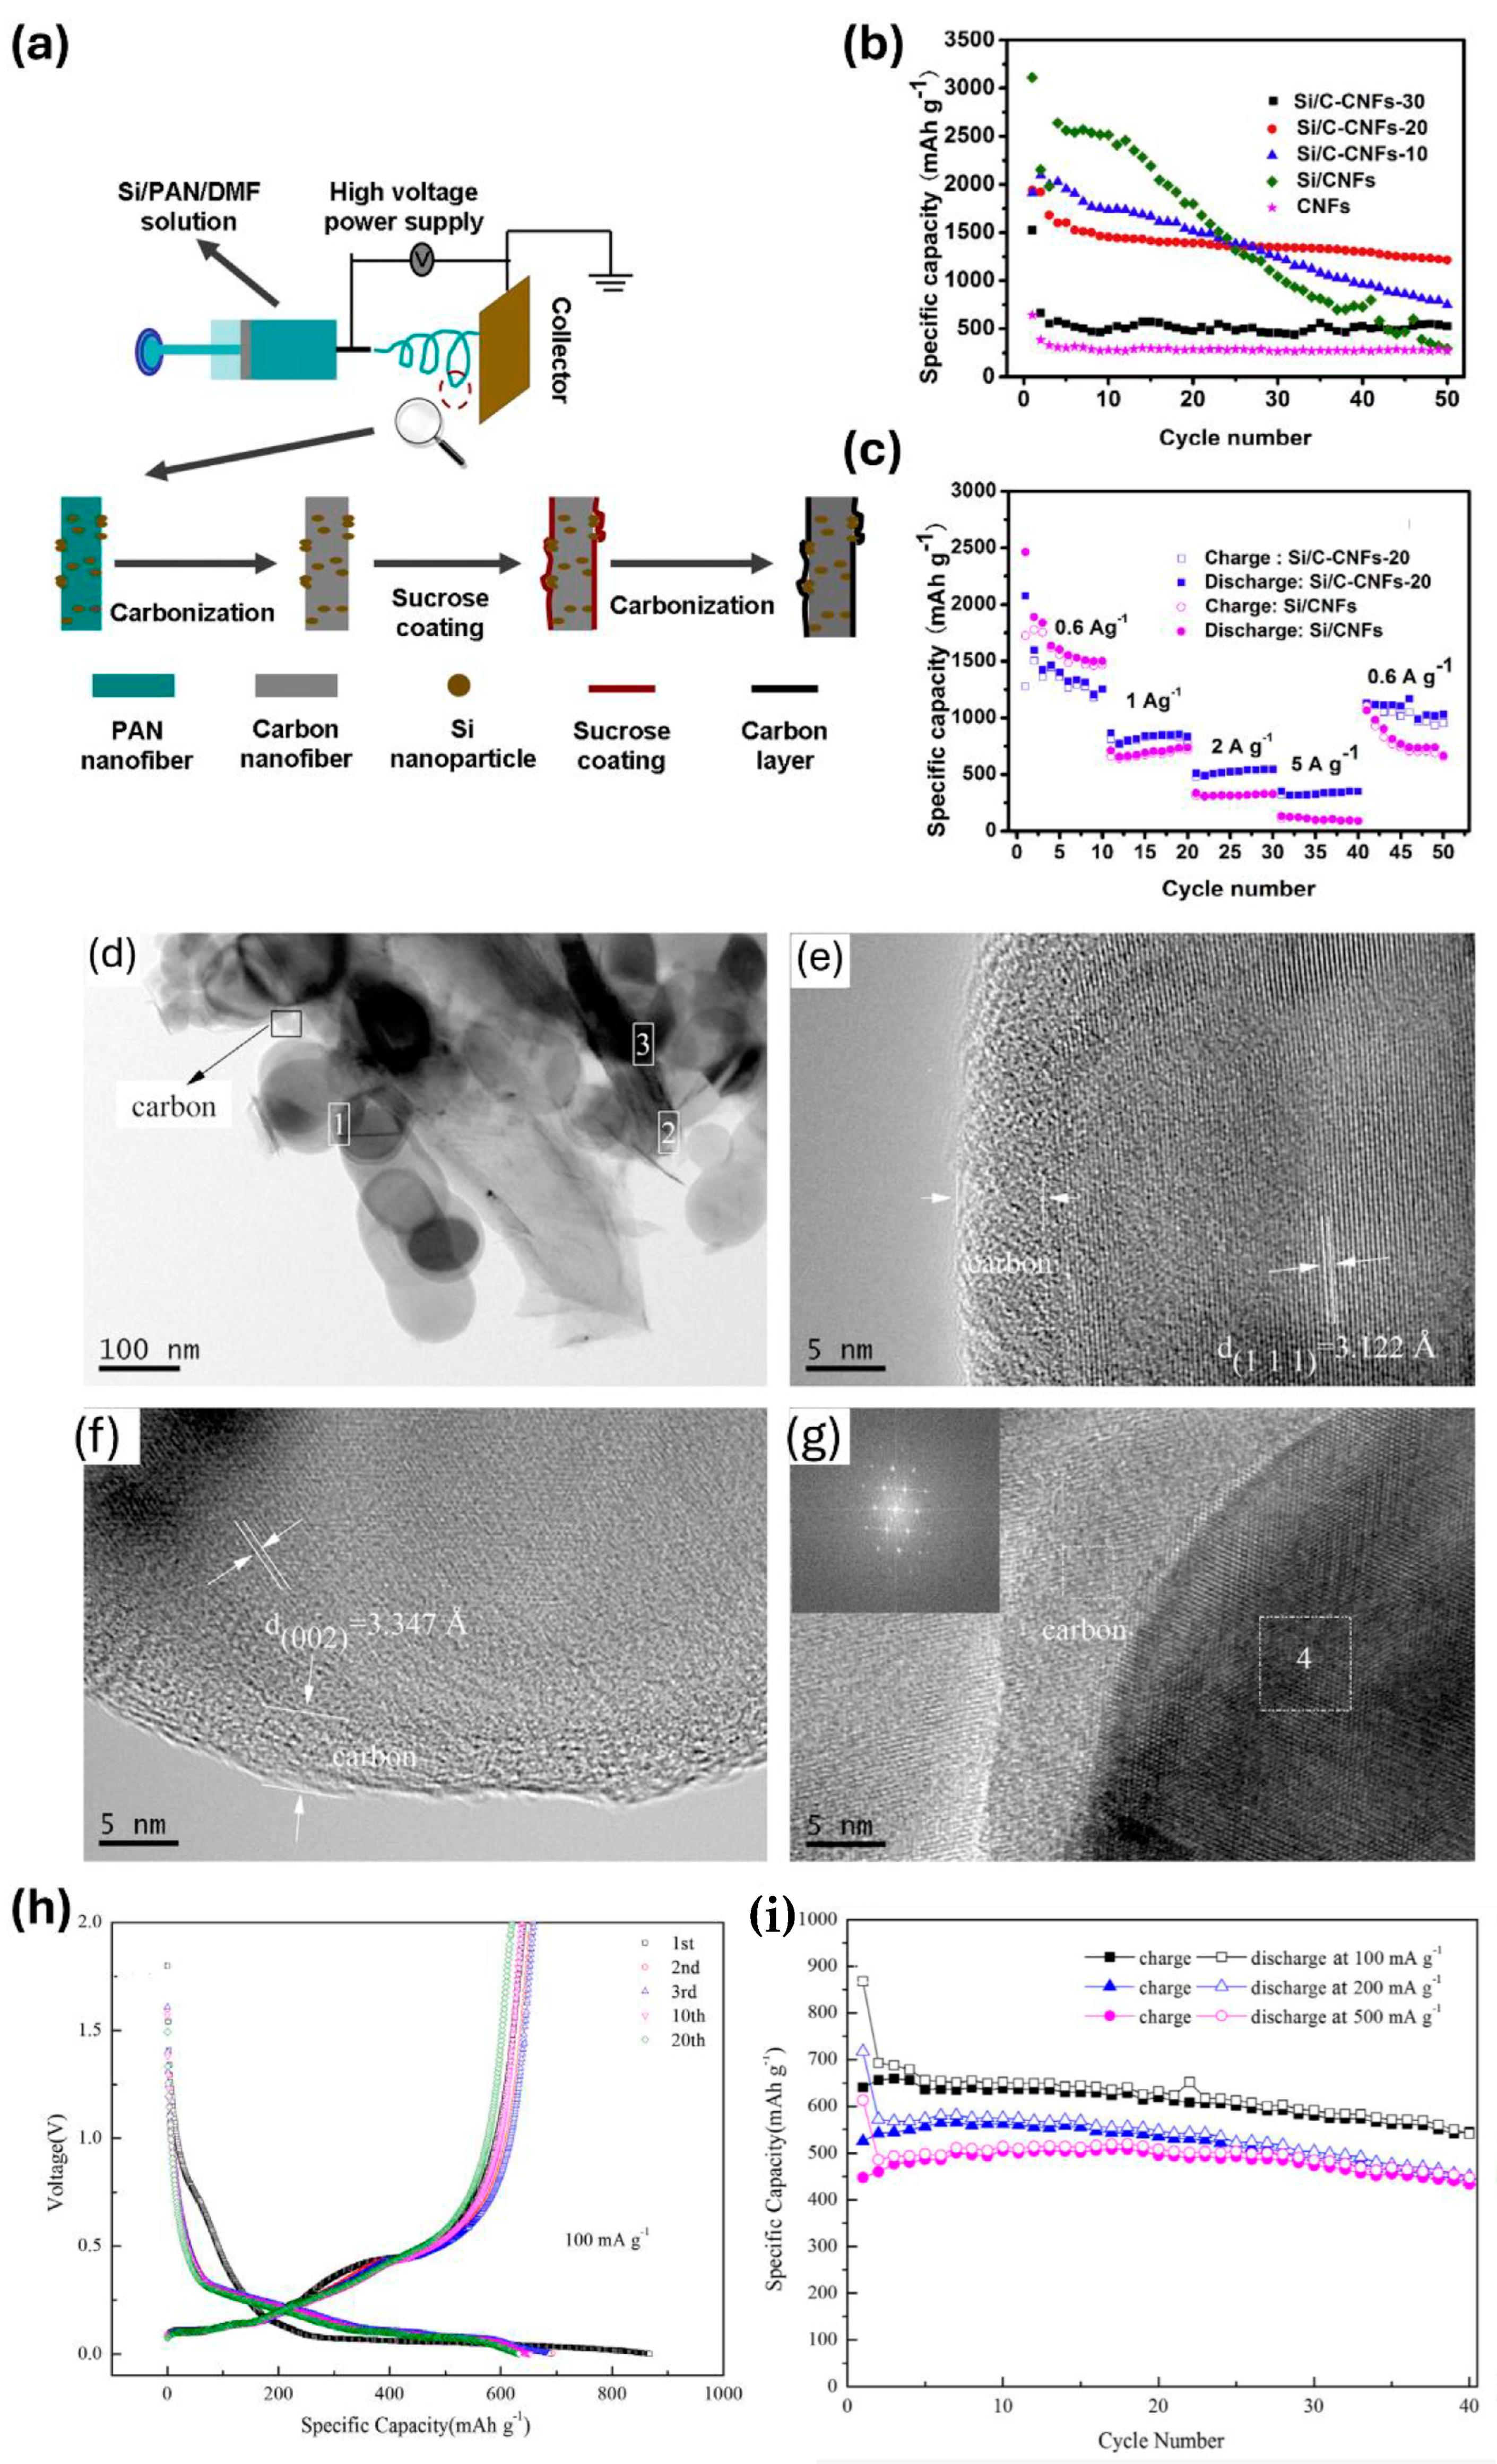
Chen et al. [84] produced carbon nanofibers (CNFs) through pyrolysis using polyacrylonitrile (PAN). Silicon and carbon nanofibers (CNFs) were used to produce Si/CNFs, which were heat-treated with sucrose to produce Si/C-CNFs (Figure 5a). The samples were designated as Si/C-CNFs-10, 20, and 30 based on the amount of sucrose used. Figure 5b shows the cycling performances of CNFs, Si/CNFs, Si/C-CNFs-10, 20, and 30 at a current density of 600 mA/g. The discharge capacity of the Si/CNF composite rapidly decreased to 293.8 mAh/g after 50 cycles. This decrease was due to the volume change in the Si particles, which crack and fracture and loses electrical contact with the CNF. Consequently, the capacity decreased as many Si particles became unavailable for lithium-ion interactions during the lithiation and delithiation. In contrast, the Si/C-CNFs composite exhibited enhanced cycling stability compared to the Si/CNFs composite. Specifically, Si/C-CNFs-20 maintained a discharge capacity of 1215.2 mAh/g even after 50 cycles, thereby minimizing the capacity loss. This improvement is attributed to the carbon coating, which mitigates the volume expansion of Si and maintains the structural stability of the electrode. The Si/C-CNFs-30 composite showed stable performance in the second cycle, but the overall capacity was relatively low at 500 mAh/g compared to the other composites. The reason for the decreased capacity is that the excessively thick coating layer allows fewer silicon particles to react with the lithium during the lithium-silicon alloying/dealloying process. Nevertheless, the carbon coating helps establish pathways between the nanofibers for lithium-ion transport, thereby enhancing the rate of performance. Consequently, the Si/C-CNFs-20 electrode demonstrates markedly improved rate capability compared to the Si/CNFs electrode (Figure 5c). Si/C-CNFs-20 had a capacity of approximately 350 mAh/g at a current density of 5000 mA/g. When the current density was decreased to 600 mA/g, the capacity was recovered to approximately 1200 mAh/g. The cycling performance of the CNF anode at 600 mA/g revealed a capacity of below 300 mAh/g. Yang et al. [85] utilized nano-Si, graphite, and coal tar pitch as precursors to form Si/C composites in two stages: heat treatment and pyrolysis. A comparative analysis was conducted based on the primary pyrolysis temperature. Heat treatment was conducted at temperatures of 0 °C (no treatment), 120 °C, 180 °C, and 200 °C. The S180 composite, treated at 180 °C, displayed an irregular morphology with silicon and carbon elements evenly distributed across the particle surfaces, suggesting that all raw materials were well-dispersed within the composite carbon layers, graphite, and silicon, all of which were observed as amorphous. This was because the pitch filled these voids at temperatures exceeding the glass transition temperature (Tg). Hu et al. [86] used nanosilicon and PAN to synthesize silicon–carbon composites via oxidative pyrolysis. The process was carried out at temperatures of 250, 300, 350, and 400 °C for 30 min. It is important to note that temperatures above 350 °C pose a risk of oxidation of the copper current collector, potentially leading to the formation of Cu2O, which would contribute to the capacity but is not desirable for accurate electrochemical analysis. The electrode treated at 250 °C showed a discharge capacity of 630 mAh/g at the 10th cycle, which dropped to nearly 0 after the 60th cycle. Increasing the processing temperature to 300 °C significantly enhanced performance, yielding a discharge capacity of 1415 mAh/g at the 10th cycle and maintaining a capacity of 1132 mAh/g after 100 cycles. This represents a marked improvement compared to the electrode processed at 250 °C. The Si/C composite thermally treated at 400 °C had a capacity of more than 2000 mAh/g up to 60 cycles and a capacity of 1555 mAh/g up to 100 cycles. It has a retention rate of approximately 78%. This improved performance is due to the high amount of silicon and high current density. The Si/C composite fabricated at high temperatures exhibited superior rate capability. The composite annealed at 250 °C performed the worst among the other composites, while the composite exhibited at 400 °C performed the best. Under 3C cycling conditions, the sample that was treated at 400 °C showed an impressive discharge capacity of approximately 500 mAh/g, whereas the other samples exhibited negligible capacity. When the C-rate was returned to C/10, most of the composites achieved a capacity of 3000 mAh/g, demonstrating that the electrodes could recover their original capacity after cycling at a high C-rate. Su et al. [87] synthesized Si/C composites by pyrolyzing nanosilicon and flake graphite phenolic resins. Figure 5d shows that the synthesized Si/C composite particles were notably small. 1, 2 and 3 in Figure 5d are shown in Figure 5e, Figure 5f and Figure 5g, respectively. Figure 5d–g presents a detailed examination of the particle structure of the Si/C composite. Nanosilicon was uniformly distributed within the graphite matrix, whereas the carbon derived from phenolic resin pyrolysis coated the surface of the Si/graphite structure. This carbon coating effectively alleviated the volumetric expansion of Si. The electronic conductivity of the anode was also improved by coating it with carbon. Figure 5g shows a Fourier transformation of Region 4 from a High-Resolution Transmission Electron Microscopy (HRTEM) image, which indicates that lattice distances in both directions are well in agreement with interlayer distances of Si and lamellar graphite. This showed that the graphite and nanoscale Si powders were thoroughly dispersed. Figure 5h shows the capacity according to the cycle of the Si/C composite at 100 mA/g. The initial capacities were 867.6 and 640.5 mAh/g, respectively, with an ICE of 73.82%. In the early stages of insertion, the observed plateaus are mainly due to Li-alloying of the composite and Li-ion insertion into the carbon matrix. This behavior was evident for the Si/C composites in the voltage area of approximately 0–0.20 V. Reflecting their superior cycling performance, the Si/C composites exhibited capacity retention rates of 96.72%, 100.94% and 110.64% after 20 cycles, as shown in Figure 5i. Even after 40 cycles, all samples exhibited capacity retention rates above these values. This improvement is due to the partial consumption of the composite during the initial cycles, which remains inactive until the subsequent charging and discharging processes. As the active material was activated later, it facilitated a wider diffusion path for Li+ ions, thereby improving the overall capacity of the material. This outstanding cycle performance was primarily due to the superior structuring characteristics of the composite. The uniform electronic conduction network created by amorphous carbon, along with the enhanced adhesion between the binder and current collector, significantly contributes to the long cycle stability and effectiveness of the material.
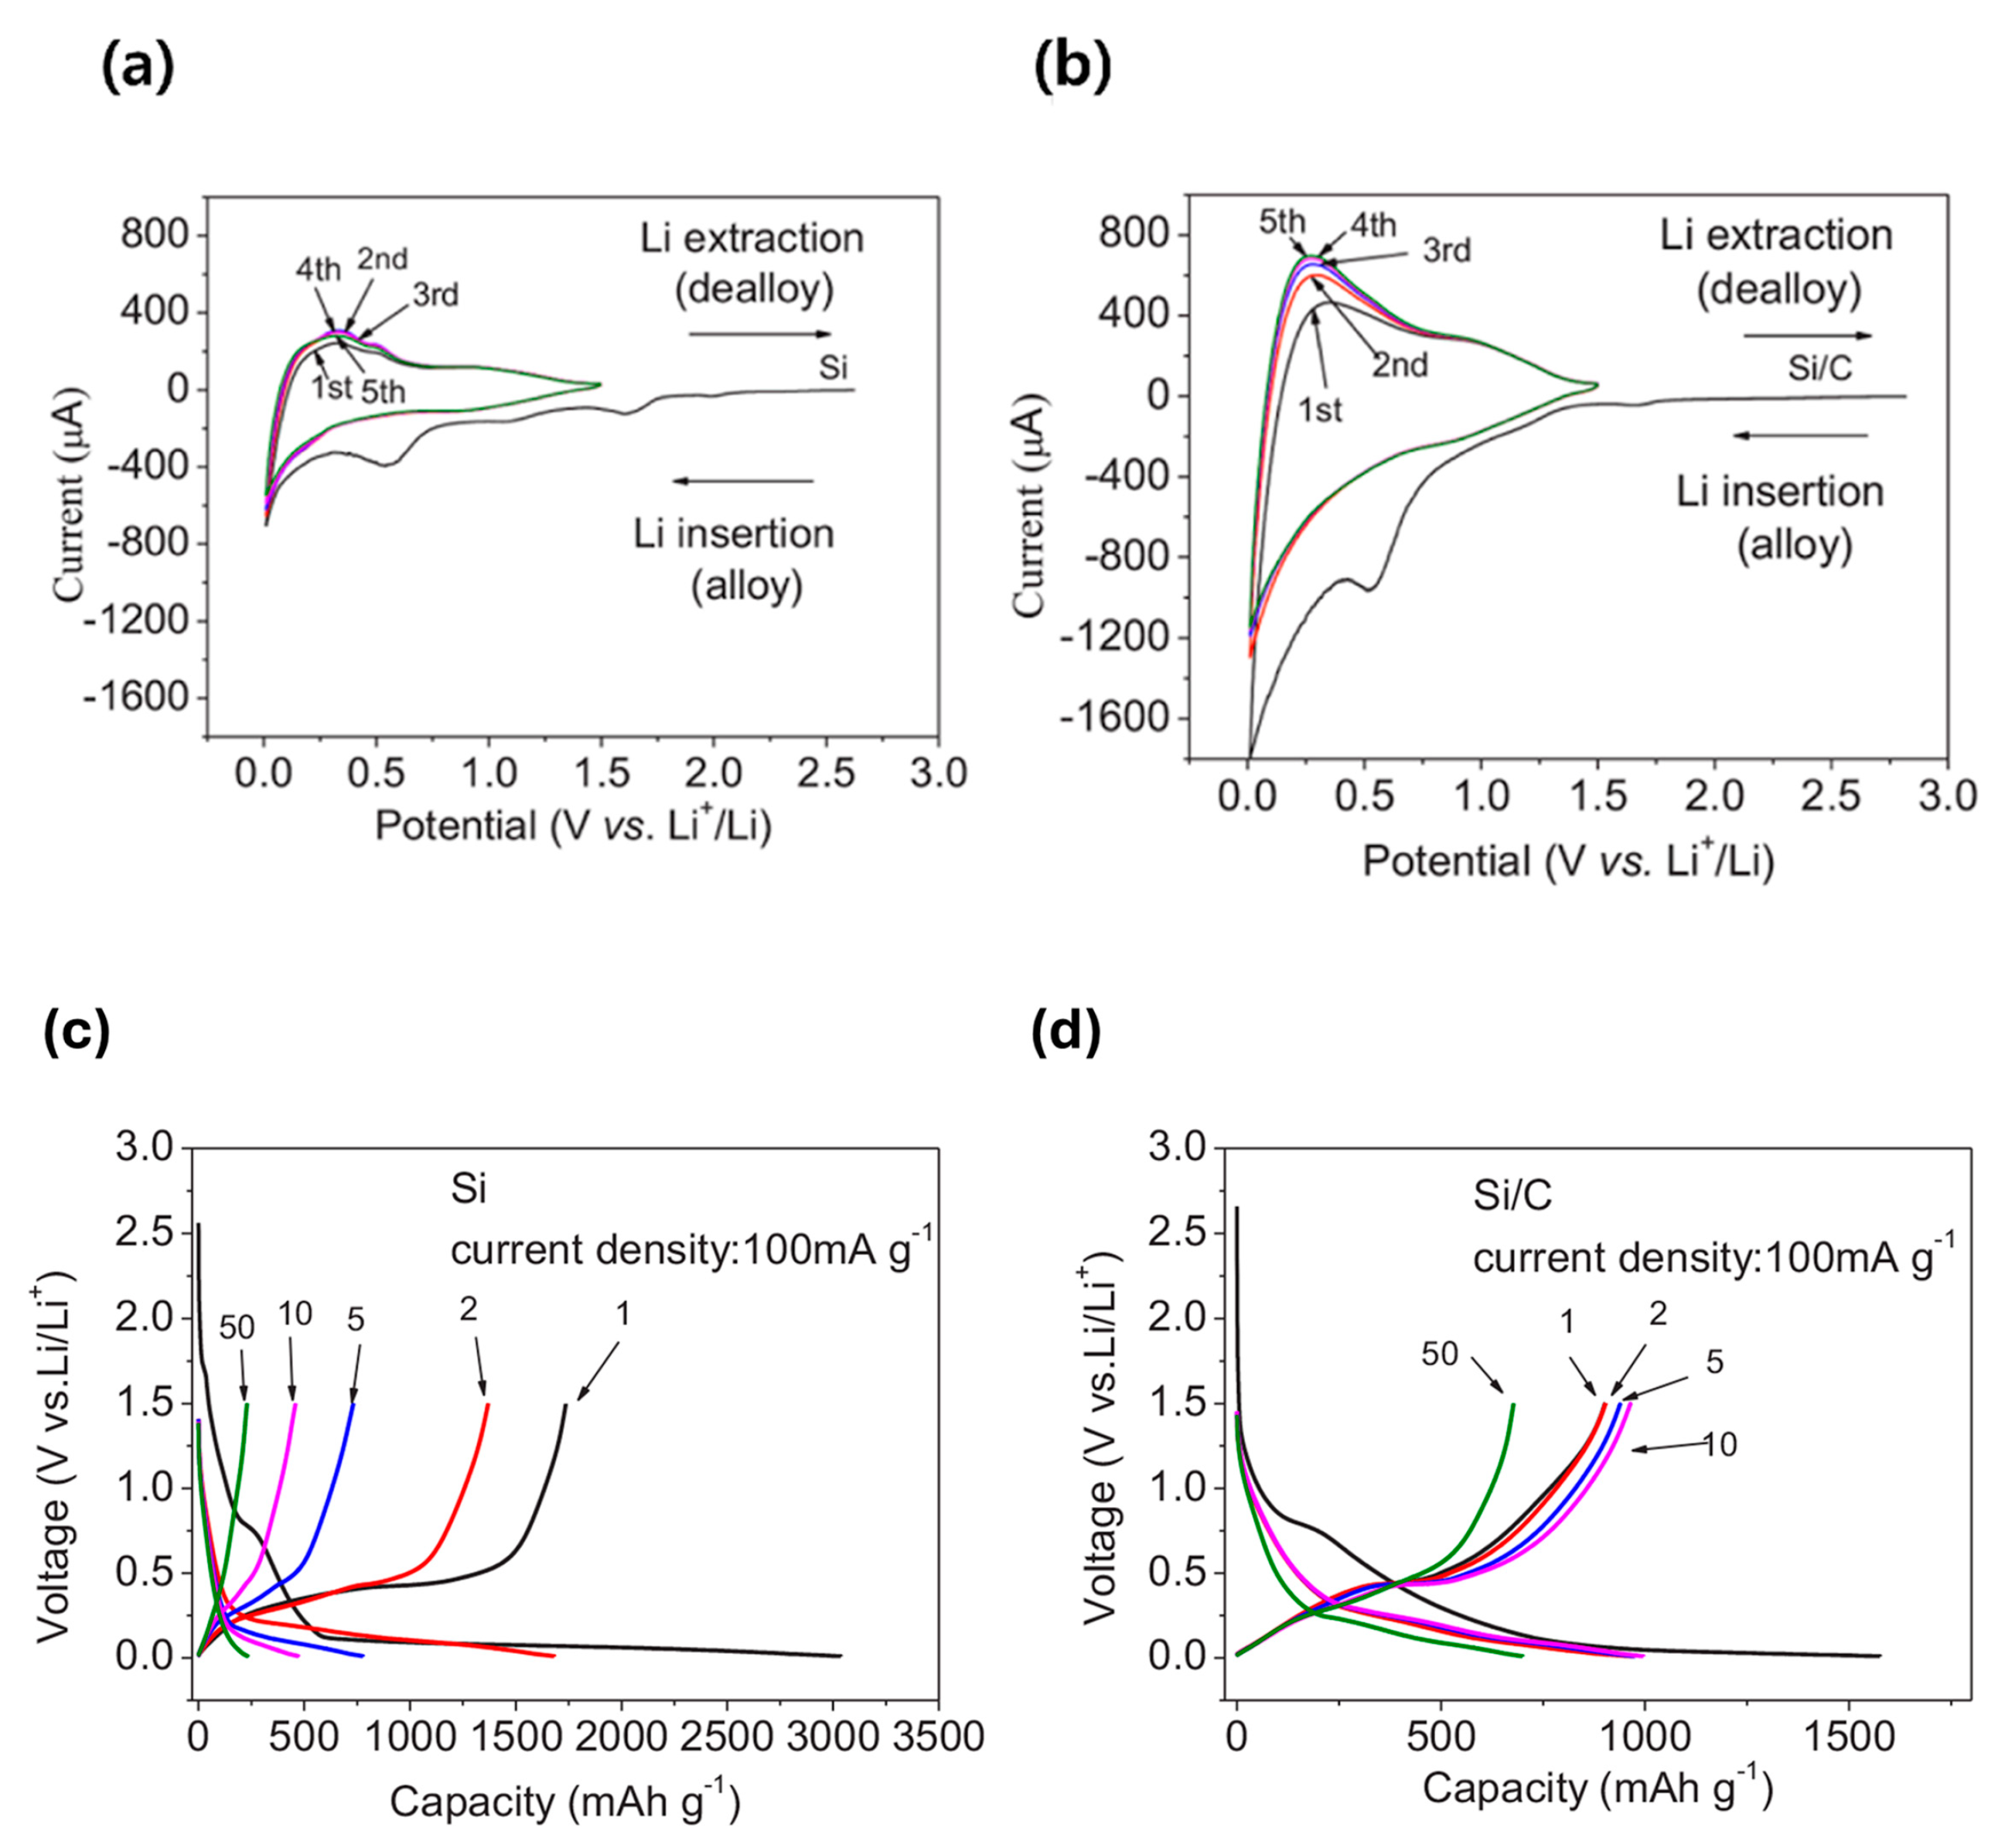
Wang et al. [88] employed nanosilicon and phenolic resin to fabricate Si/C composites via pyrolysis. Due to the desirable electrochemical properties of pyrolyzed carbon, phenolic resin was selected as the carbon source, which exhibits a reversible capacity of approximately 400 mAh/g and exhibits outstanding cycle performance. Cyclic voltammetry (CV) curves of the synthesized composites were analyzed to assess their electrochemical behavior. The cyclic voltammetry (CV) curves of pure Si and the Si/C composite are shown in Figure 6a,b, respectively. In the early phase cathodic scans of both materials, a distinct reduction peak was observed in the range of 0 to 0.2 V, which likely indicates the transformation of silicon from a crystalline to an amorphous phase. Additionally, the formation of an SEI layer on the electrode surface was indicated by an irreversible cathodic peak observed in the range of 0.5 to 0.75 V. This peak disappeared after the first cycle. For Si nanoparticles, two peaks were observed at approximately 0.32 V and 0.54 V during the first anodic scan, which are associated with the dealloying of Li-Si. Conversely, for the Si/C nanocomposite, the observed anodic peak at approximately 0.25 V suggests that a significant portion of the silicon transitioned to an amorphous LixSi phase. Additionally, the Si/C nanocomposite exhibited significantly larger current peaks than the Si nanoparticles, indicating that the lithium ions migrated more effectively into the silicon within the Si/C composite than in the pure Si. Figure 6c,d shows the voltage profiles of pure Si and the Si/C composite, which align with the CV results. In the delithiation process of pure Si, distinct plateaus are observed at 0.32 V and 0.54 V (Figure 6c). In contrast, the Si/C composite exhibits a voltage slope at approximately 0.25 V (Figure 6d), indicating that a greater portion of Si has transitioned to the amorphous LixSi phase compared to pure Si. Additionally, while pure Si shows a dramatic capacity decrease with a large overpotential, the Si/C composite demonstrates better capacity retention and similar voltage profiles over 50 cycles.

2.3. Spray Drying

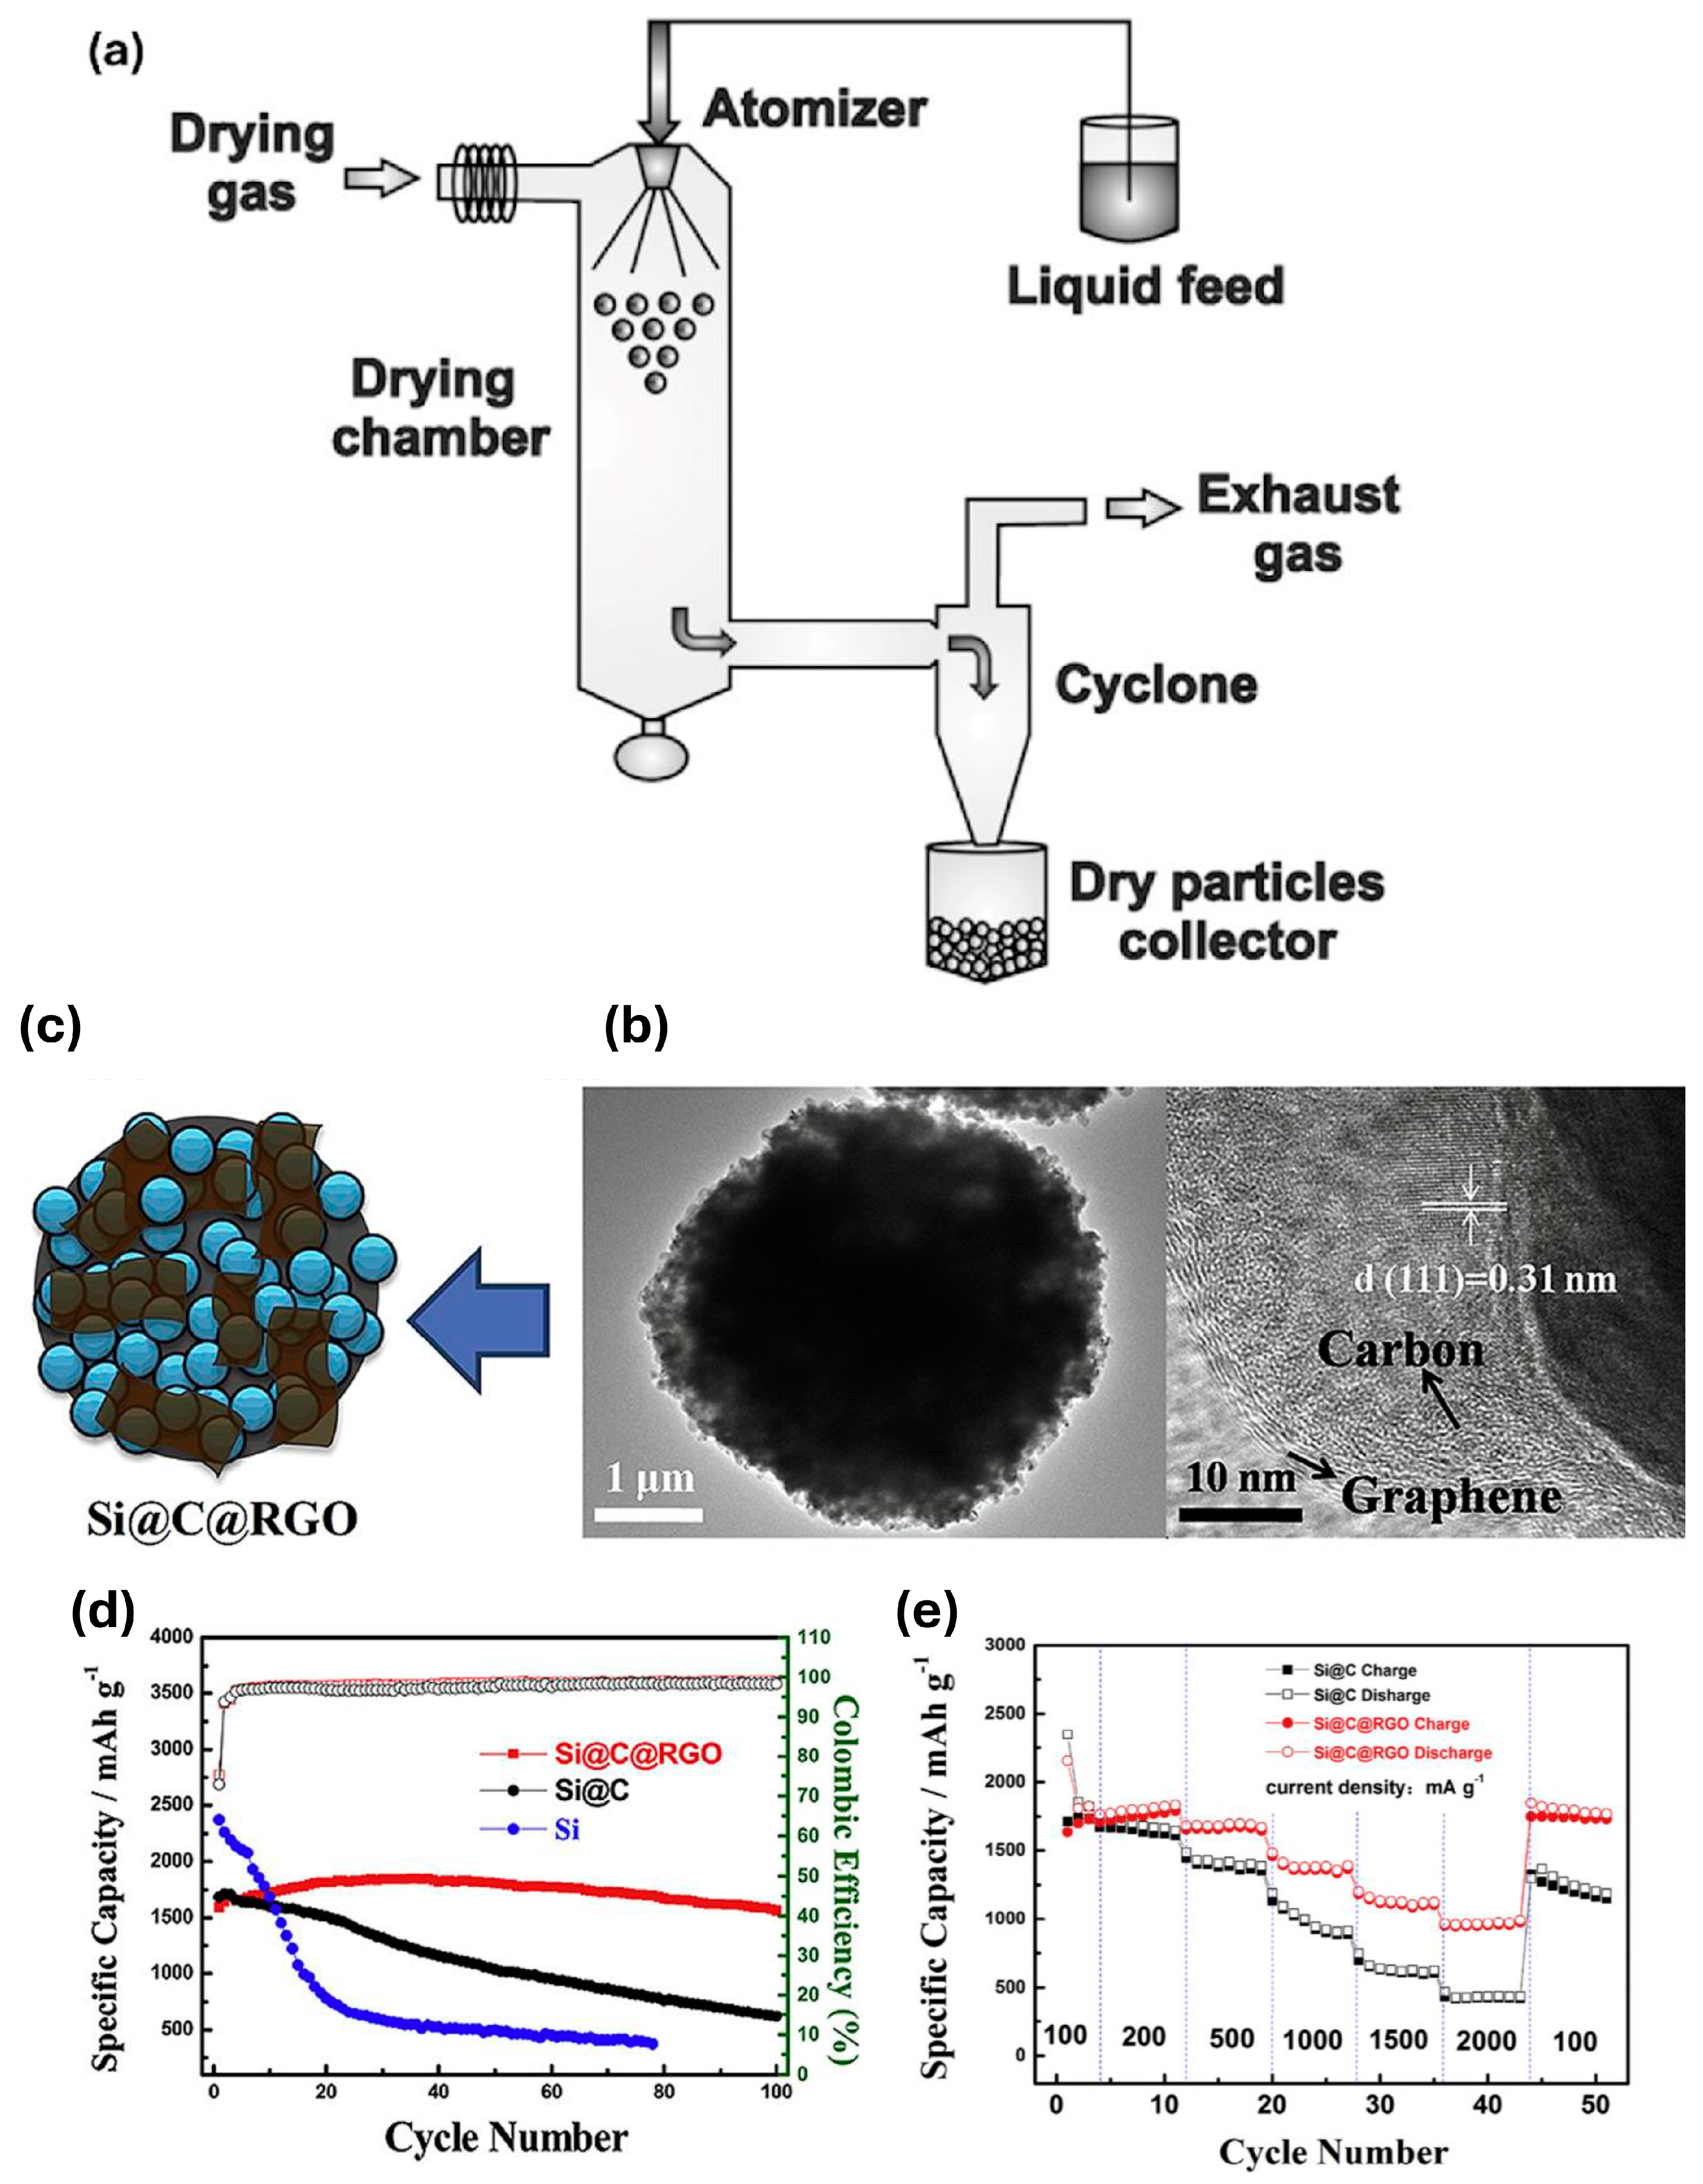
Spray drying produces a dry powder by rapidly evaporating a liquid solution using a high-temperature gas. This method includes a heat treatment method and forms uniform and spherical particles. The heated drying medium is typically air; however, nitrogen is employed when the liquid contains flammable solvents, such as ethanol, or when the product is sensitive to oxygen. During the spray drying process, spherical particles are formed because of the surface tension acting on the liquid or slurry during the spraying stage [89]. Figure 7a shows the spray drying equipment. The spray process is transmitted to the chamber to dry through the nozzle. Types of nozzles include nozzles that rotate and spray and two-fluid nozzles that are supplied to the pump. The atomization of a fluid is achieved through centrifugation, pressure, or kinetic energy, depending on the type of nozzle used. Droplets formed by injection are separated by a cyclone that releases gas to be dried. This is to quickly evaporate the solvent and accumulate the dried droplets in the glass collector. The resulting solid product exhibits superior chemical and physical stability compared to the liquid. Spray drying is broadly used in various industries, such as pharmaceutical, chemical, materials, cosmetics, and food. Generally, this technique is efficient owing to its ability to rapidly and continuously produce results in a single step, with minimal modifications required for scaling up [90]. The electrochemical performance and particle shape of Si/C composite materials manufactured using this method were analyzed. Through spray drying. Pan et al. [91] synthesized a Si, carbon, and graphene oxide composite, Si@C@RGO, to achieve both composite formation and spheronization. The TEM images in Figure 7b show the carbon surrounding silicon nanoparticles (SiNPs) and also show the (111) plane corresponding to the lattice of Si. Synthesis of additional graphene from Si/C composite did not change the carbon coating on SiNPs. Figure 7c shows that carbon surrounds the nanosilicon particle and graphene is adhered to it. Although the first cycle of pure Si showed a capacity of 2368 mAh/g. After 50 cycles, it decreased significantly to 500 mAh/g, and the capacity retention rate was only 21%. On the other hand, Si@C shows a capacity of 1041 mAh/g even after 50 cycles, which shows better performance than pure silicon due to improved effective carbon coating and conductive networks. In addition, based on 100 cycles, the CE of Si@C was about 15%, and Si@C@RGO composites were 40%, which seems that the additional synthesis of graphene alleviated the volume expansion of Si (Figure 7d). The rate capability characteristics of Si@C@RGO composites achieved a capacity retention rate of 94.9% up to 100 cycles and showed excellent cycle performance. On the other hand, Si@C composites continuously appear to have lower specific capacity than Si@C@RGO composites. This can be seen as proving the effectiveness of the graphene addition synthesis mentioned in Figure 7d (Figure 7e).
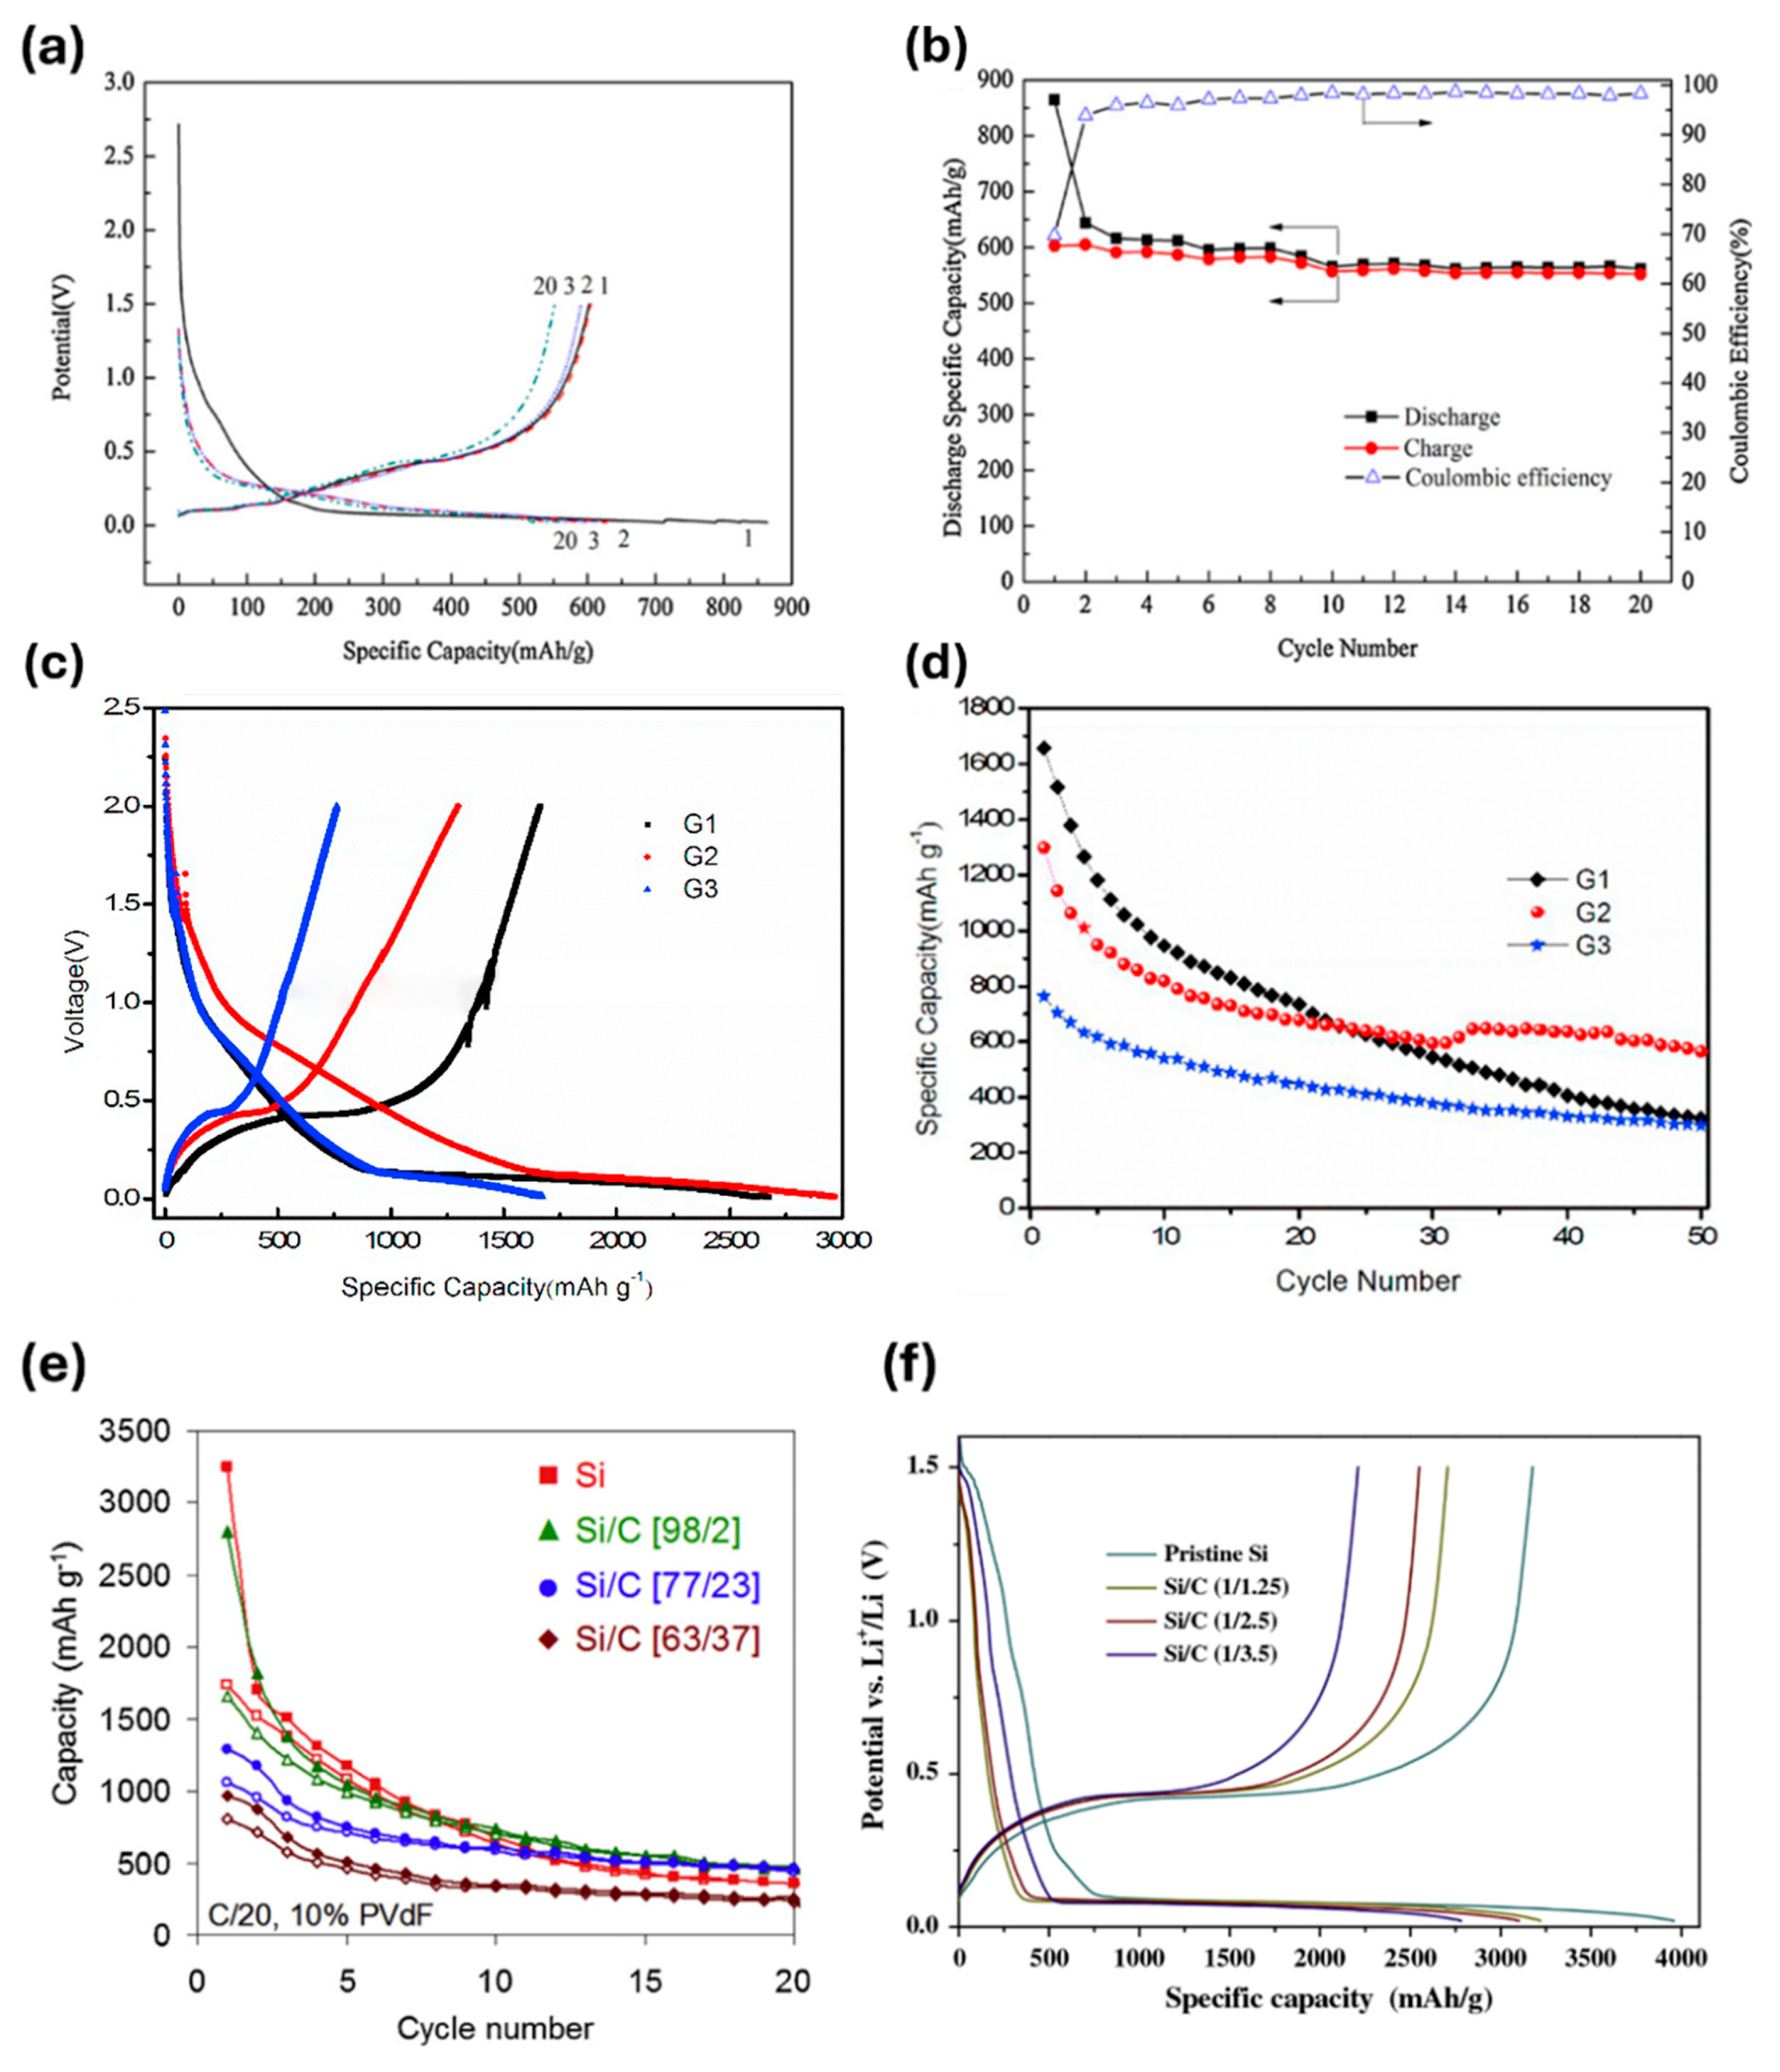
Lai et al. [92] adopted graphite and glucose as the carbon sources of silicon–carbon composites. They employed spray drying to produce spherical Si/C composites. Figure 8a,b illustrates the electrochemical performance according to the cycle of the previously prepared Si/C composite. The characteristics of this composite material showed a high initial CE of 69.71%. As the SEI layer is formed in the initial cycle, irreversible capacity occurs at about 0.8 V due to lithium consumption. After that, it showed a CE of 96% and an excellent performance with a capacity of 552 mAh/g in the 20th cycle. Su et al. [93] used spray drying of silicon and graphene to synthesize Si/C composites. The composites prepared with silicon and graphene in ratios of 1:2, 1:4, and 1:6 were labeled G1, G2, and G3, respectively. Figure 8c,d shows the performance of composite materials synthesized with different ratios of silicon and graphene. Figure 8c presents the voltage profile of the initial cycles of the Si/C composites with different proportions at a current density of 100 mA/g. Like the previous group, this group’s study also showed a significant slope due to the formation of the SEI layer at 0.6~0.8 V. The Si/C composite showed a plateau of about 0.1 V. This is because the SEI layer was formed in the initial discharge stage, a stable film was formed and operated. The plateau of about 0.45 V on the charging curve is the release of some silicon. The charge–discharge curves of different proportions of silicon–carbon composites show similar curves. In the initial cycle, the capacity values of each Si/C composite were 2662.4, 2869.9, and 1671.5 mAh/g. This means that the inclusion of graphene improves the capacity. Figure 8d illustrates the cycle performance of Si/C composites at a current density of 100 mA/g. The capacity of the Si/C composite cell decreased as the cycle progressed. Among the composite materials, the capacities of the composite material with a graphene ratio of 2 times and 6 times greater than silicon were 323.2 mAh/g and 298.6 mAh/g, respectively, and the composite material with a capacity of 4 times greater than silicon showed the best performance with a capacity of more than 600 mAh/g. Carbon with a relatively low carbon content does not seem to be able to improve the conductivity and volume of silicon; on the contrary, the composite material with a high carbon content does not seem to be able to use a high capacity of silicon due to a lot of carbon but rather to increase the resistance. Paireau et al. [94] used silicon and polyvinyl alcohol (PVA) to produce Si/C composites via spray drying. PVA was chosen as the carbon source because of its water solubility, which makes it an environmentally friendly option. After manufacturing the Si/C composites with the selected materials, different Si/C ratios were used for the charging–discharging cycle tests. Figure 8e shows the results for pristine silicon and Si/carbon composites with Si/C ratios of 98:2, 77:23, and 63:37. The low irreversible capacity, an initial problem with silicon–carbon composites, decreased as the carbon content increased. As a result, ICE increased. Although the carbon addition was improved over pure Si, no significant cycle performance improvement was observed. Each Si/C composite material decreased dramatically in capacity during the initial cycle and then stabilized. This decrease in capacity became less pronounced as the carbon content increased. However, even when the carbon content increased to 37 wt%, a significant capacity loss still occurred. The carbon content increased to 37 wt%, but as a result, it performed worse than expected. This suggests that the excess carbon did not improve the low conductivity of the silicon particles, but rather served as a resistive layer. Wang et al. [95] manufactured Si/C composites by spray drying, and citric acid was adopted as the carbon source. Citric acid was used at concentrations of 1.25, 2.5, and 3.5% by weight to produce different Si/C composites. Figure 8f displays the voltage profiles for pristine Si and Si/C composites with different amounts of carbon. Pristine Si has an ICE of 80%, and the initial reversible capacity is 3960 mAh/g and 3180 mAh/g. Si/C composites ranged from 2210 to 2710 mAh/g, but a composite with a carbon content of 1.25% among the prepared Si/C composite showed 84% with higher ICE values than pristine Si. This is because carbon is dispersed between Si particles, improving the low conductivity of silicon and increasing the stable SEI layer.

2.4. Chemical Vapor Deposition

Chemical vapor deposition (CVD) equipment is shown in Figure 9. CVD is a technique that is widely used for the growth of materials that are used in a variety of electronic and optoelectronic devices, chemical sensors, nanocomposites, and energy storage systems. In CVD, gaseous reactants are transported through a tube furnace where they decompose to generate atomic or molecular species. These species are then deposited on the surface of the substrate. CVD is primarily employed to produce graphite carbon-coated silicon and carbon nanotubes. Moreover, it can be used to deposit silicon onto substrates using precursors such as SiH4 or SiHCl3 [96]. The composite structure produced by CVD varies with changes in temperature and gas flow rate. As the temperature increases in CVD, the deposition yield also rises. This occurs because higher deposition temperatures enhance chemical kinetics and lead to a more structured atomic arrangement during crystal growth. As the gas flow rate increases, the amount of deposition also rises. However, as deposition increases, resistance also escalates, leading to a deterioration in performance. Therefore, it is essential to adjust the gas flow rate to an appropriate level [97,98]. Based on this principle, the CVD method was used to synthesize Si/C composites, followed by a comprehensive evaluation of their performance.
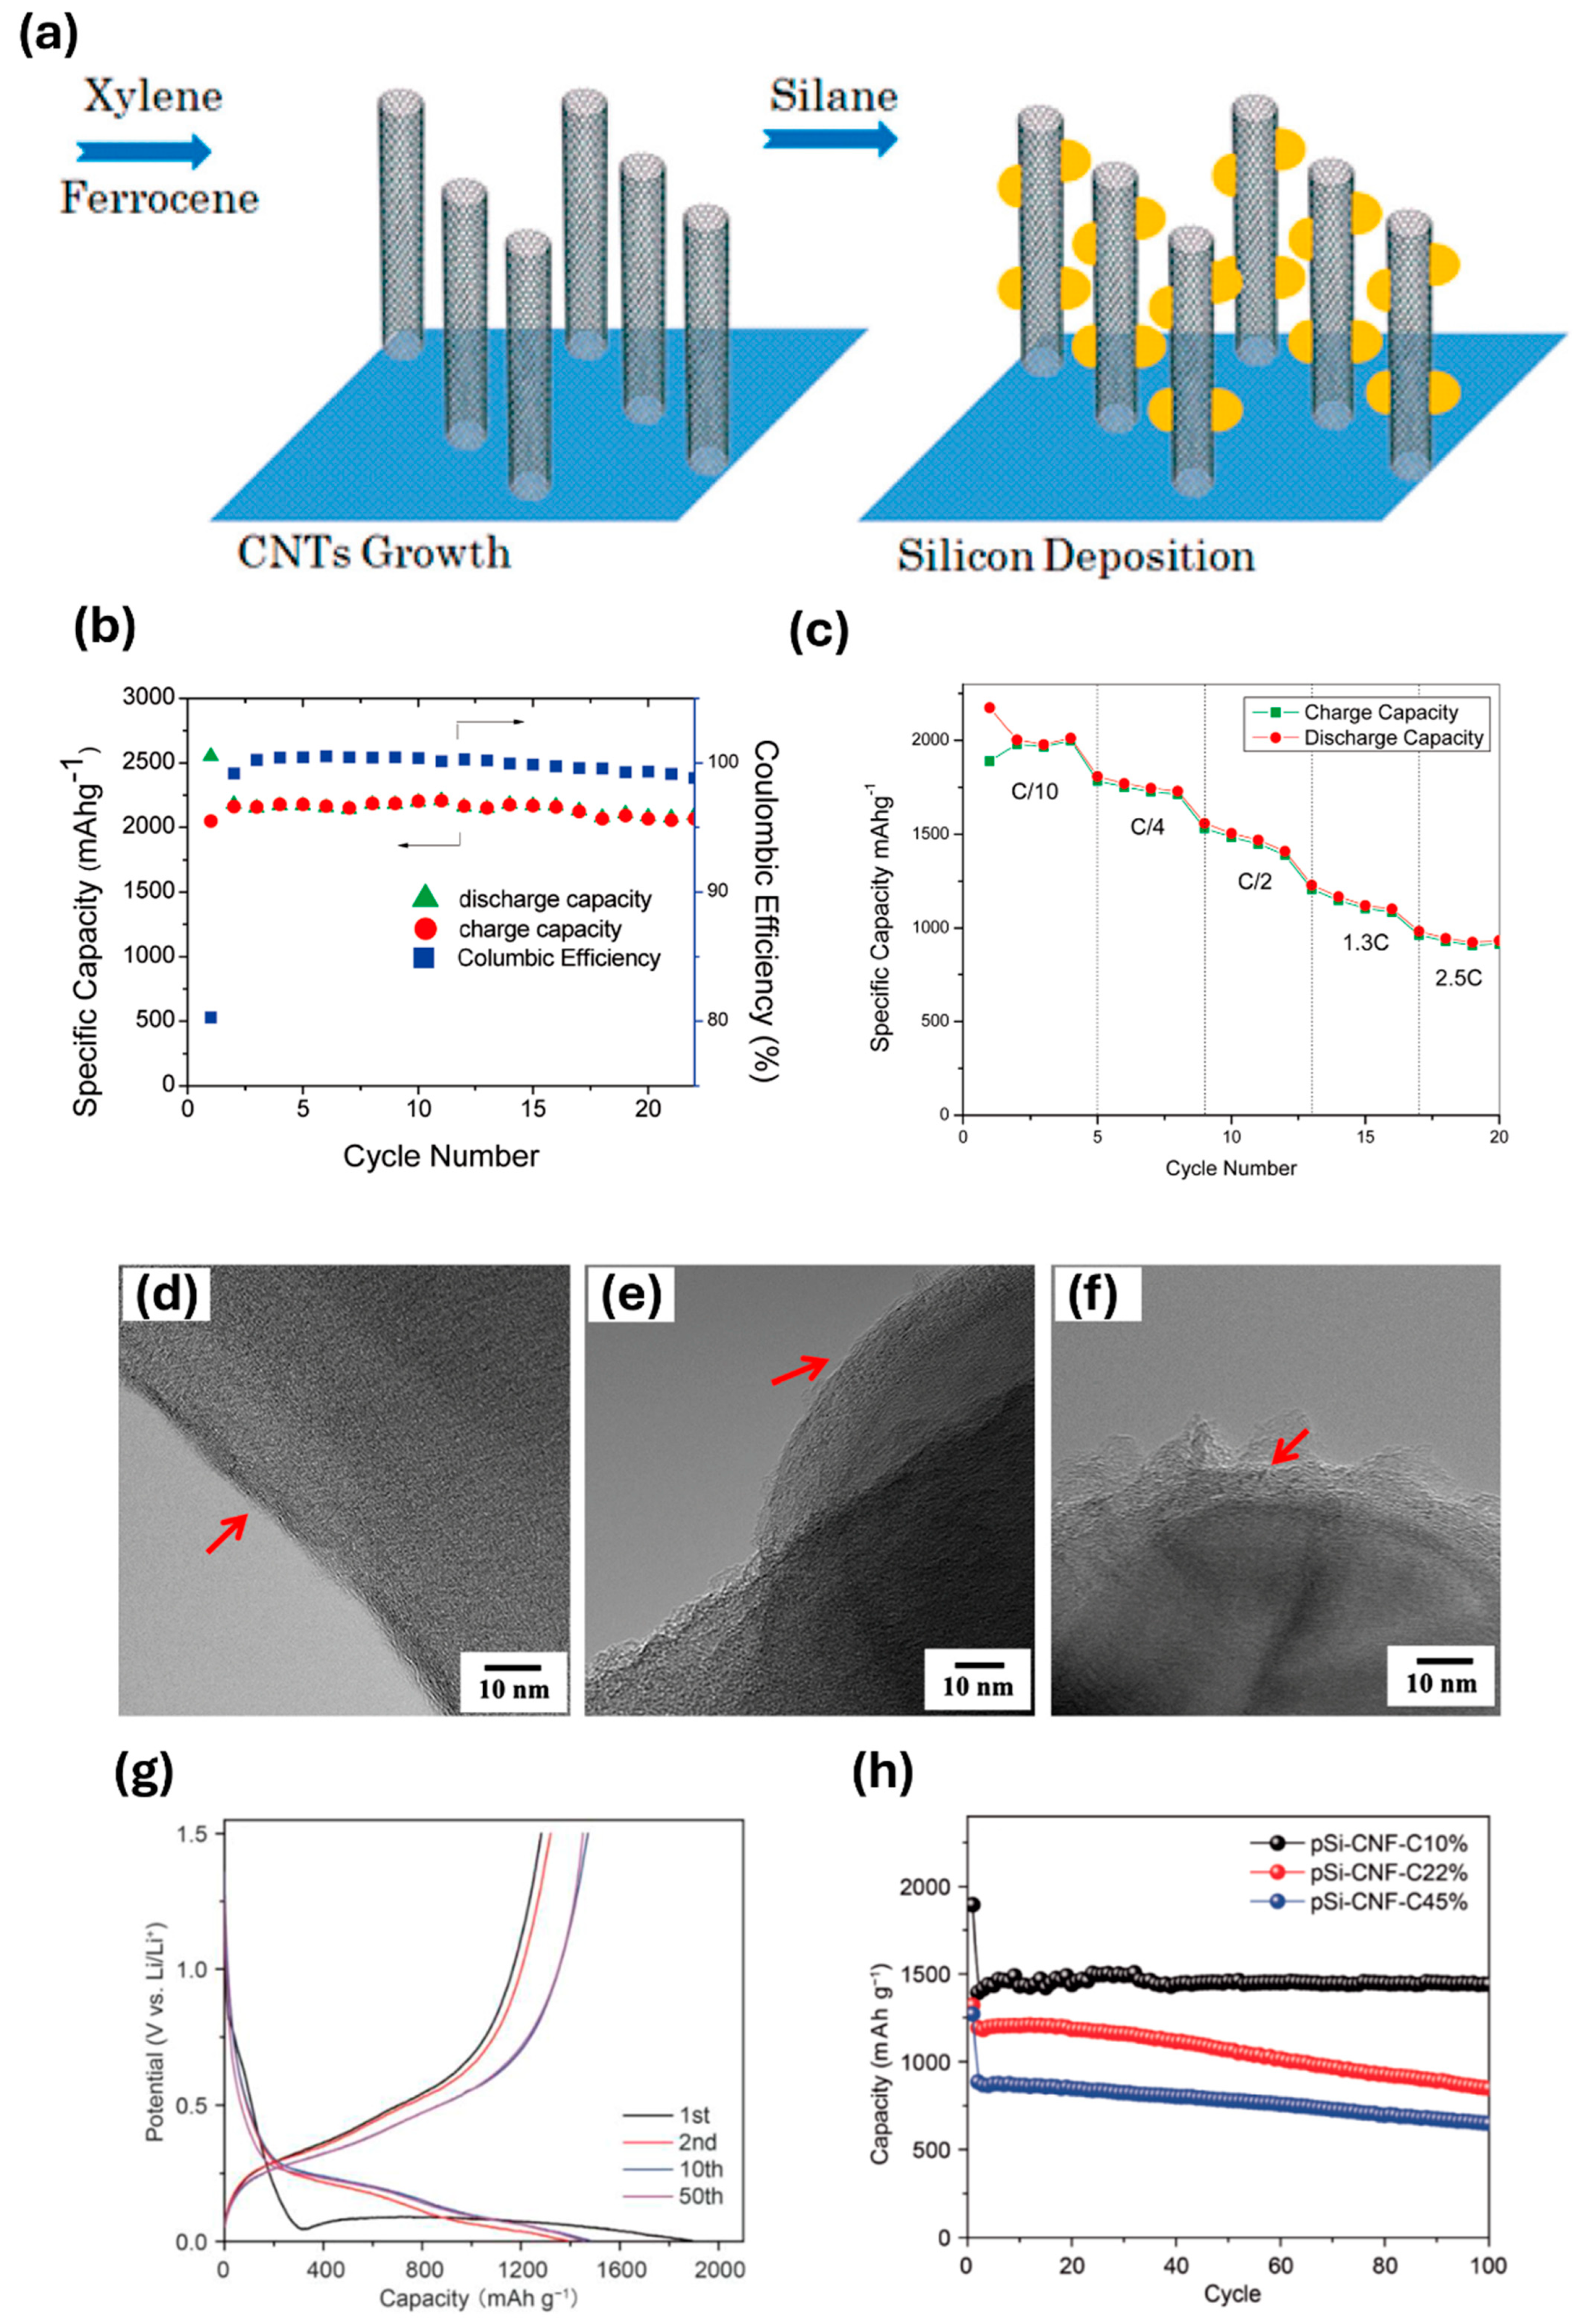
Wang et al. [99] developed nanoscale Si/C composites utilizing a dual-step CVD process. Following the procedure depicted in Figure 10a, xylene (C8H10) was employed as the source of hydrocarbons and iron produced by decomposition at high temperatures using ferrocene (Fe(C5H5)2) as a catalyst to promote the production of multi-walled carbon nanotubes (MWNTs). Subsequently, silane gas was introduced to deposit Si on the MWNTs, completing the fabrication process. The Si/C ratio was determined after calculating by measuring the substrate by adjusting the parameters. The cycling performance of Si/CNT is shown in Figure 10b. The initial reversible capacities were 2552 and 2049 mAh/g, showing an ICE of 80.3%. It shows a capacity loss of 19.7%. In the subsequent cycle, the reversible capacity increased due to the activation of additional silicon atoms, and the CE was improved to 99%. It is shown that the electrode is stabilized by the formation of a stable SEI. Figure 10c shows the charge/discharge capacity at various current densities. As can be seen in the figure, this composite material showed higher capacity and stable performance with a capacity of about 1000 mAh/g at a C-rate of 2.5C than graphite, which is a commonly used cathode material. This performance is a result of the effect of the silicon/CNT nanostructure to reduce particle aggregation and manage volume change. In addition, the improved electronic conductivity and mechanical strength provided by the CNTs contributed to these results. Fu et al. [100] used nanostructured Si and carbon nanofibers (CNFs) to form Si/C composites. PAN was employed as the carbon precursor, and CVD was employed to deposit a carbon coating on the silicon surface, resulting in a Si/CNF-C composite. During the process, acetylene (C2H2) was used as the carbon source for deposition. In order to prevent detachment between the nanofiber surface and silicon, Si@CNF composite material manufacturing adopts CVD technology. The Si@CNF-C composites were analyzed by varying the CVD coating time. Figure 10d–f shows high-magnification TEM images of composites with different CVD treatment times. In the figure, a red arrow indicates the carbon coating layer formed during the CVD. The SEI layer depends on the type of carbon coating of the particles. Si/CNF-C composites were effective in forming an SEI layer with a stable carbon coating layer. As a result, ICE was improved positively. In addition, the electrochemical performance of the composite material coated with CVD for 90 min was remarkably improved. Si/CNF composites and Si/CNF-C composites were compared to confirm the effect with or without additional carbon coating. Si/CNF without carbon coating showed a capacity retention rate of 65% after the 30th cycle and the charging capacity decreased to 570 mAh/g. In contrast, all Si/CNF-C composites demonstrated improved performance, retaining approximately 76% of their capacity and achieving approximately 700 mAh/g after 30 cycles. This result is the exfoliation of Si attached to carbon nanofibers due to the volume change in Si in the Si/CNF composite. In contrast, the CVD-coated Si/CNF-C composite effectively mitigated the volumetric changes in Si, thereby improving the structural integrity and performance of the composite. Jin et al. [101] adopted porous silicon (pSi) and carbon nanofibers (CNFs) and synthesized Si/C composites through CVD using Fe-Ni as a catalyst. Consequently, the Si/C composite particle size of the composite ranged from 5 to 20 μm, and the CNFs were uniformly coated. Figure 10g shows the voltage profile curve for each cycle of the composite. The porous silicon–carbon nanofiber (pSi-CNF) electrode showed capacities of 1895 mAh/g and 1282 mAh/g in the first cycle, indicating an ICE of 67.7%. The use of silicon-based anode materials has been observed to result in an almost low ICE. This is primarily due to its high reactivity with Li+, which results in an electrochemical side reaction, such as the formation of Li2O or Li4SiO4. In this process, the electrolyte is decomposed, and Li+ is consumed. This phenomenon is commonly observed during the initial cycle. In the initial lithiation of pSi-CNF, a voltage plateau was observed at 0.1 V, indicating that lithium had alloyed with silicon. During the initial charging phase, a plateau was observed at 0.5 V. The conversion of the material into amorphous Si is achieved through dealloying of the Si component, which occurs subsequent to its alloying with Li ions. In the subsequent cycle, a capacity of approximately 1300–1400 mAh/g was observed, accompanied by stable performance. Figure 10h shows the electrochemical behavior of Si/C composites with varying carbon contents. The initial capacities of each pSi-CNF-C composite material with CNF contents of 10, 22, and 45% were 1971, 1321, and 1270 mAh/g, respectively. The ICE values were 67.1, 65.0, and 60.3%. Furthermore, the capacity based on 100 cycles exhibited a tendency to decrease, reaching 1441, 848, and 648 mAh/g. This is attributed to the fact that an elevated CNF content results in a greater resistance layer, leading to an increased consumption of Li+ during the SEI formation process. This contrasts with the desired outcome of establishing a conductive network.
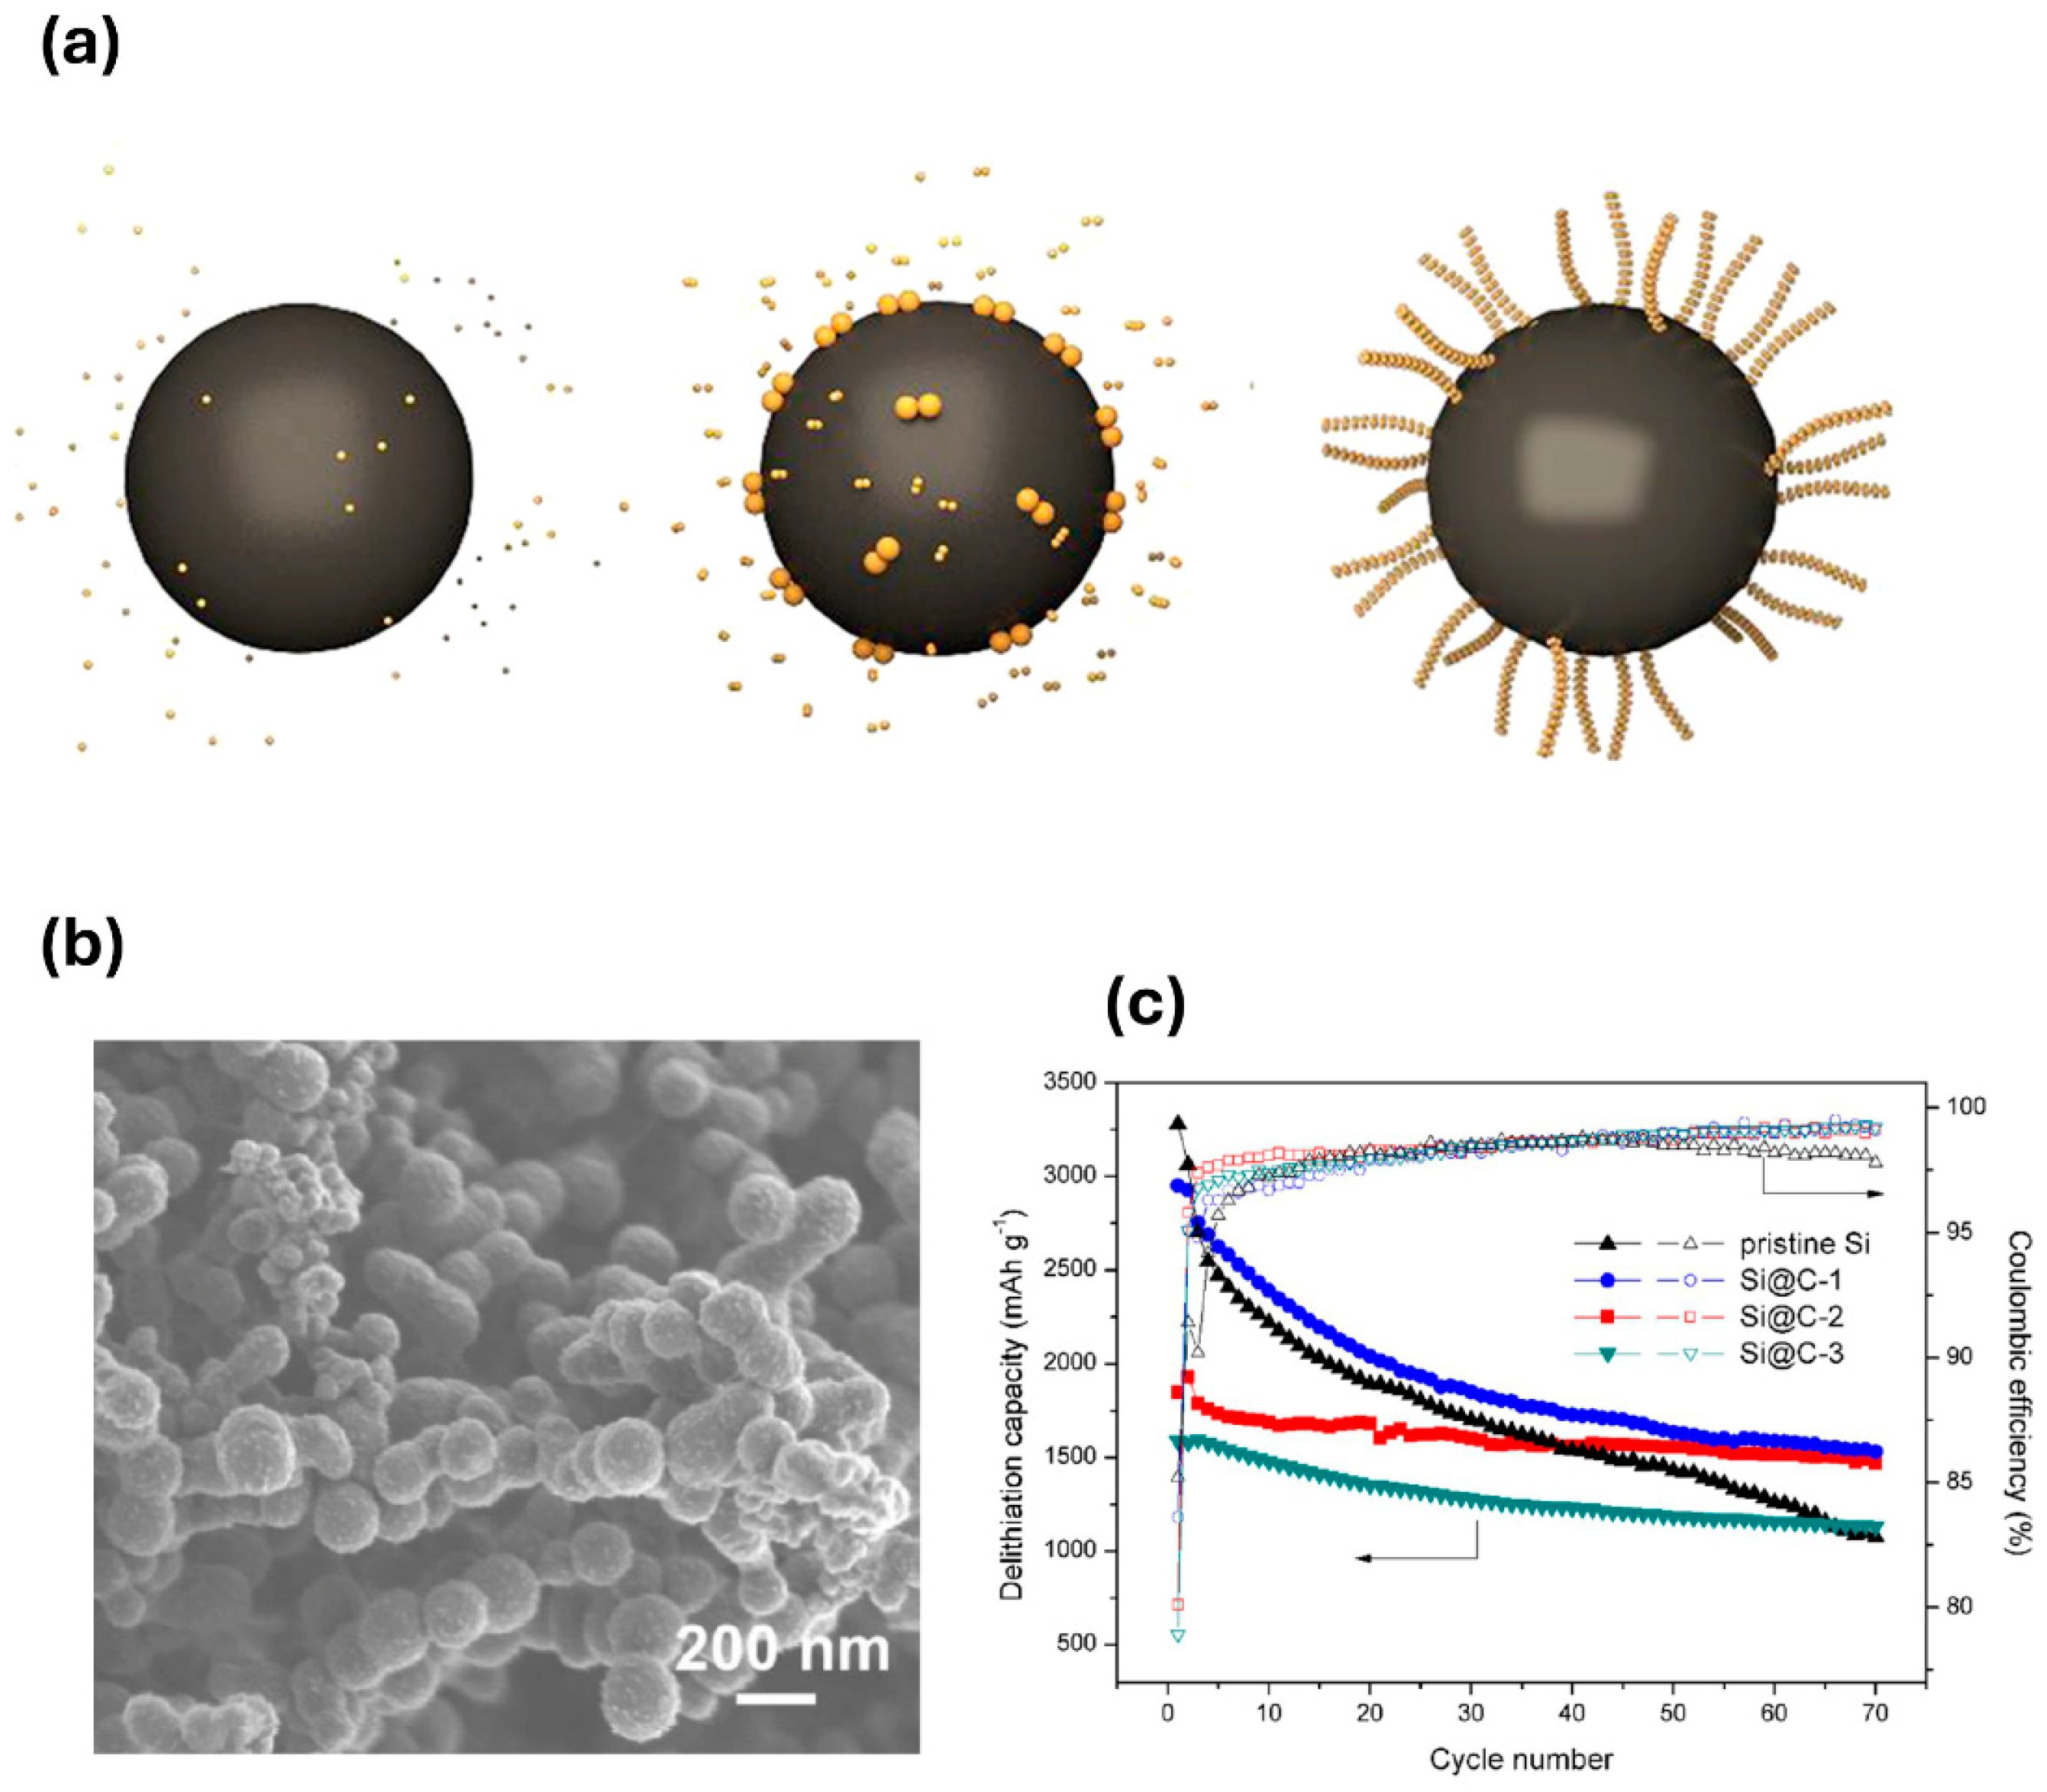
Liu et al. [102] synthesized a silicon nanowire (SiNW)/spherical graphite (GM) composite (C@SiNW@GM) in which silicon was deposited on spherical microsized graphite using CVD and an additional carbon layer was formed using acetylene. Figure 11a illustrates the process of gas-phase Si deposition onto micro-sized spherical graphite, which subsequently transforms into SiNWs. As the CVD processing time increased, the silicon transitioned into silicon nanowires. Nucleation of silicon was formed by flowing SiH₄ or SiHCl₃ into the gas phase. According to the C@SiNW@GM composite electrochemical behavior reported at a current density of 0.2C, the section decreasing from 1.0 V to 0.5 V during the first discharge shows a reduced slope due to the formation of SEI. Subsequently, a stable plateau was observed during the subsequent cycle, which can be attributed to the electrochemical reaction of graphite and Si. Jinglu et al. [103] carbonized toluene at 800 °C to coat the surface of silicon particles with carbonized carbon through a CVD process. Toluene was chosen because of its ability to decompose at this temperature and form a coating on the surface of the silicon particles. The composites were prepared by performing CVD treatments at 800 °C for durations of 1, 2, and 3 h. These composites were labeled Si@C-1, 2, and 3, respectively. Figure 11b shows the structure of the Si@C-2 composite, which exhibited the most stable performance among the various composites. The particle distribution of the pristine Si was primarily in the range of 50–200 nm. The particle sizes of Si@C-1, 2, and 3 exhibited an increase of 7 nm, 12 nm, and 15 nm, respectively, which can be attributed to the carbon deposition process through CVD, resulting in an enlargement of the composite particle size. Additionally, the results of electrochemical behavior for pristine Si, Si@C-1, 2, and 3 indicate the polarization increased with higher carbon content. Consequently, the resistance rises in conjunction with the expansion of the carbon layer, which functions as a resistance layer in itself. Figure 11c shows the cycling performance analysis of each composite electrode, along with that of the pristine Si electrode. Initially, Si@C-1 exhibited a rapid decrease in capacity. This was likely due to its lower carbon coating content, which provided insufficient mitigation of the volumetric expansion. In contrast, composites with high carbon coating contents had relatively low cycle performance due to increased voltage polarization during charging/discharging. The ICE values of the Si@C-1, 2, and 3 composites were found to be 83.6%, 80.1% and 78.9%, as indicated in the results. This indicates that the carbon content affects the CE, with a higher carbon content leading to a lower efficiency. This is because the amorphous carbon structure tends to trap the inserted lithium, thereby consuming more lithium and reducing the overall CE.

2.5. Mechanofusion

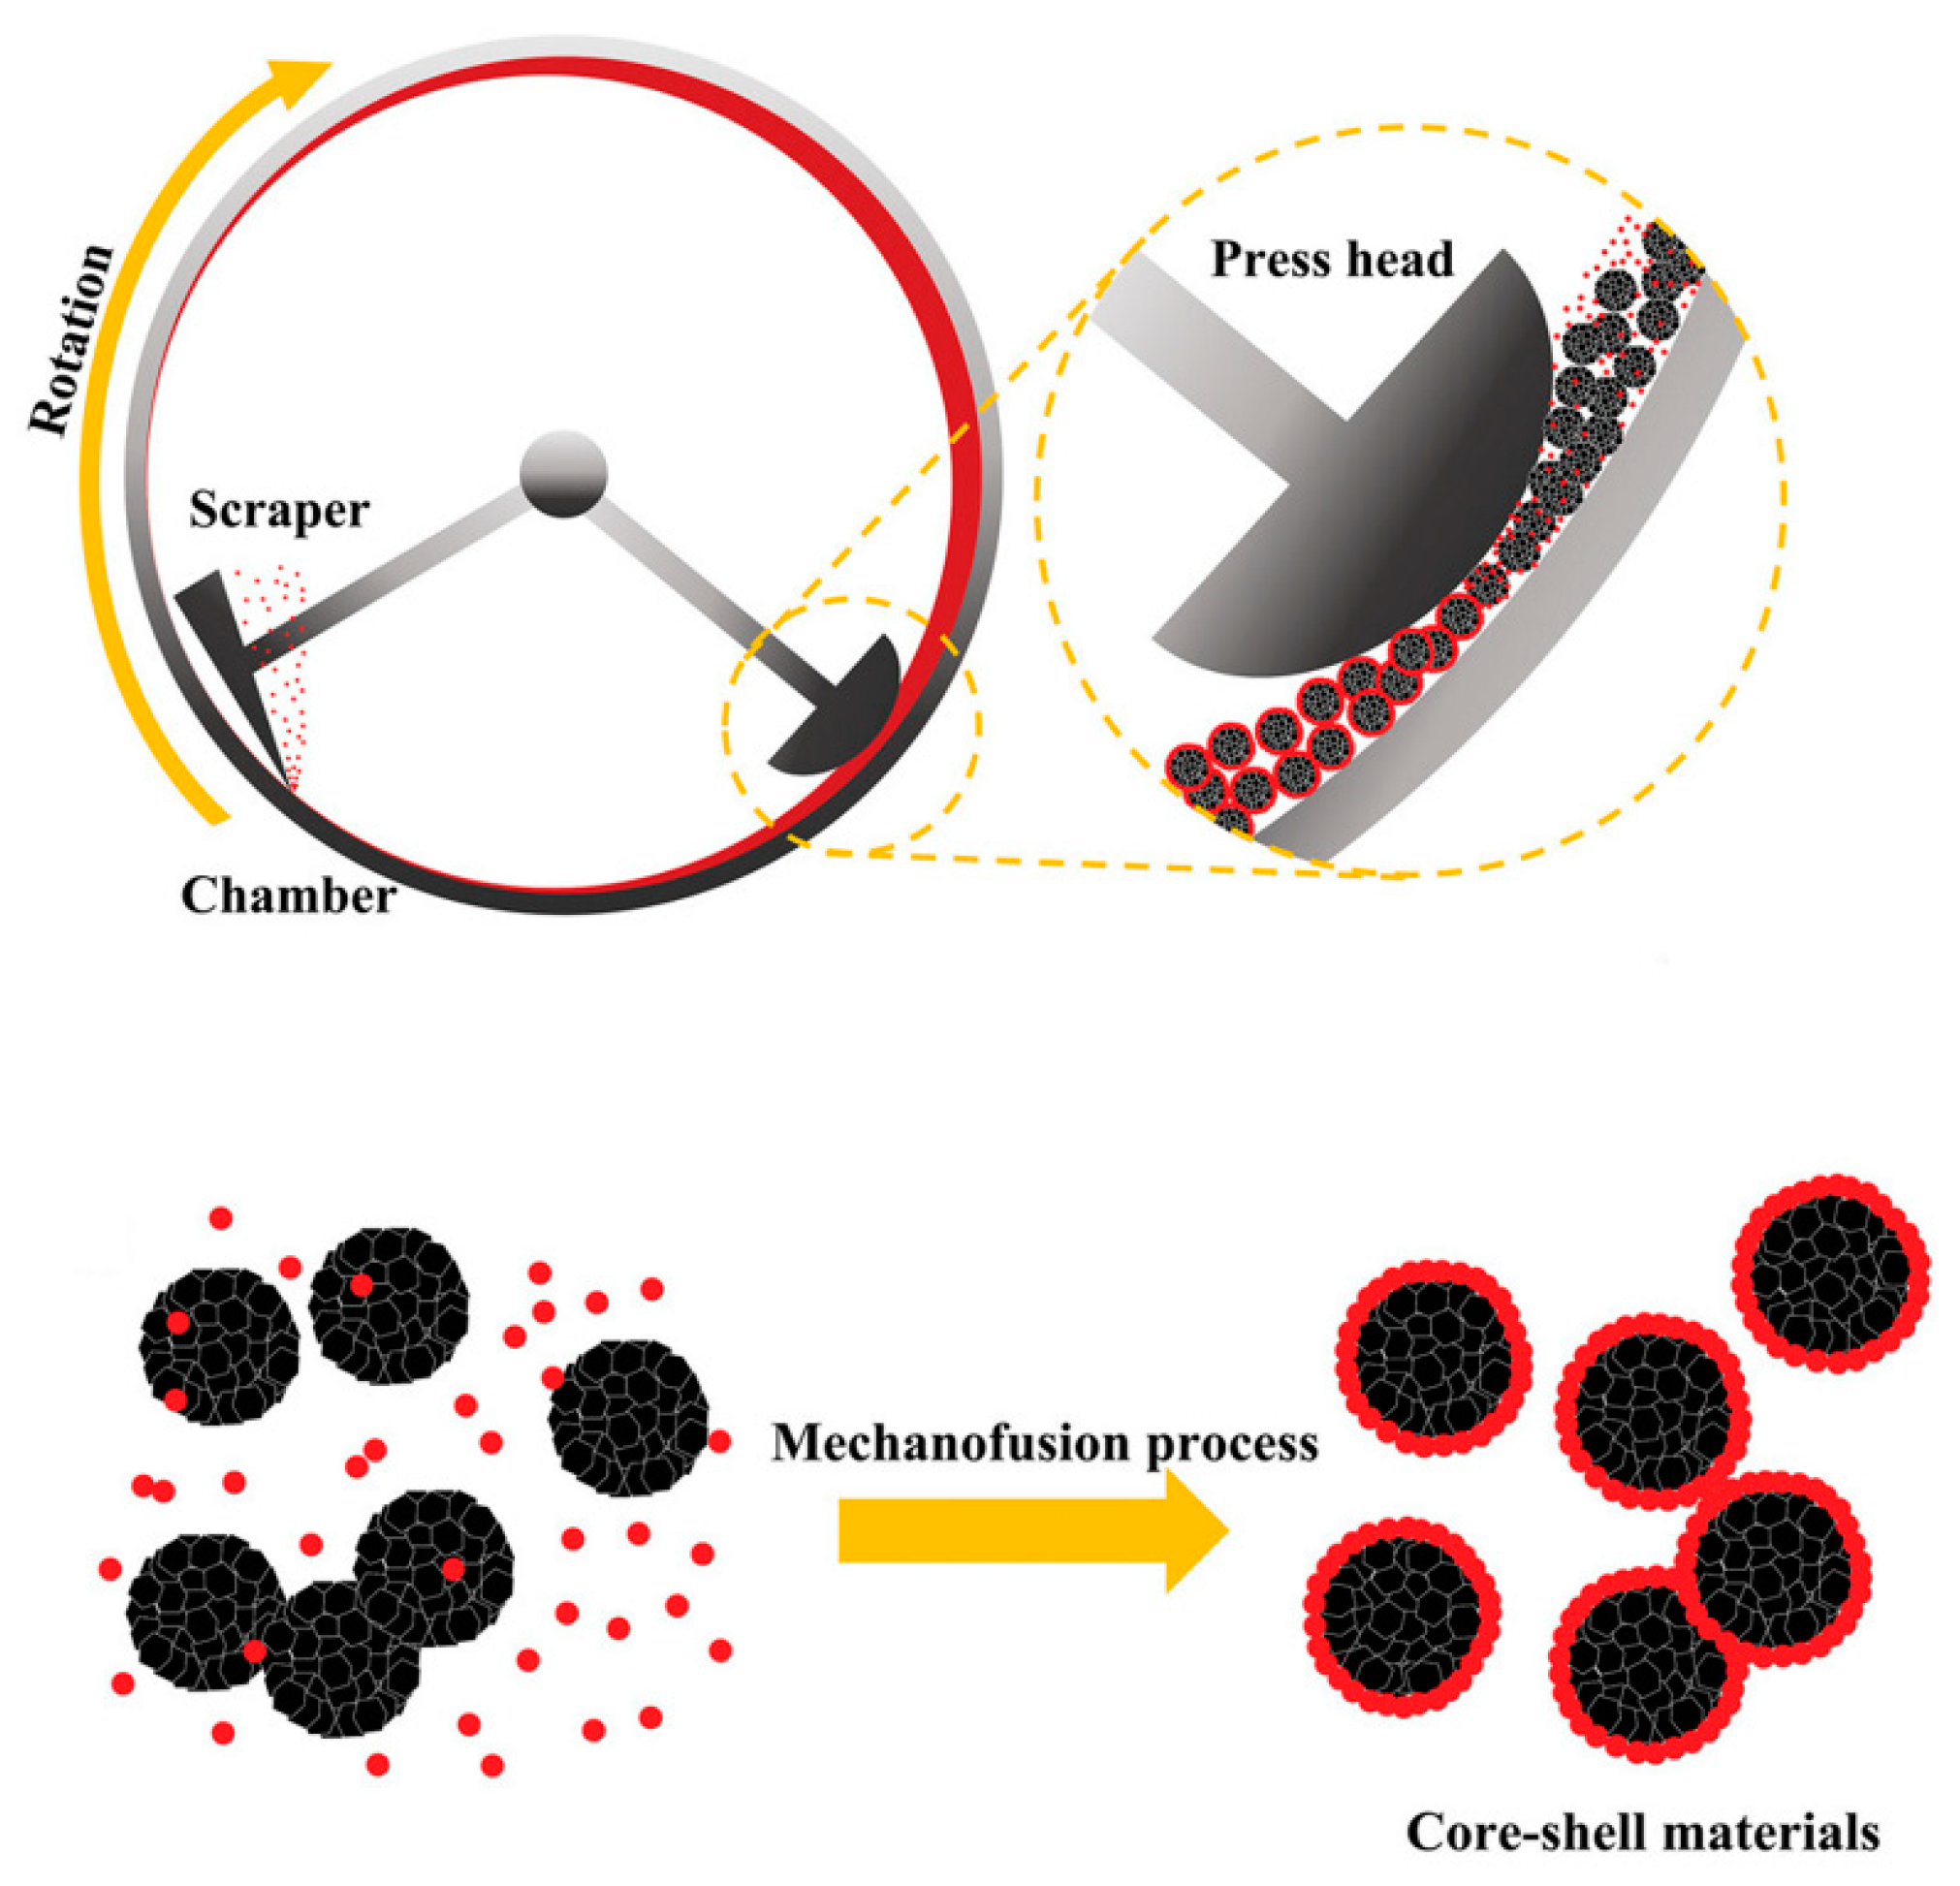
Figure 12 illustrates the configuration and interparticle interactions involved in the mechanofusion process. The configuration includes a press head, scraper, and chamber. In a mechanofusion system, the chamber rotates to generate a centrifugal force [104]. This centrifugal force causes the powders to converge and move between the press head and the inner wall of the chamber. Through this process, the powders experience friction and collisions between particles, causing small particles to stick to the surface of the large particles and disperse them [105]. To produce core-shell structured particles using mechanofusion, it is essential to use particles of different sizes: larger particles for the core and smaller particles for the shell. Owing to the continuous application of the centrifugal force, the powders adhere to the chamber walls. The scraper is responsible for removing the powder attached to the inner wall of the chamber due to centrifugal force. The mechanical composite formation was achieved by continuously repeating this process. Mechanofusion offers the advantage of coating particles without the need for solvents or other substances [106].
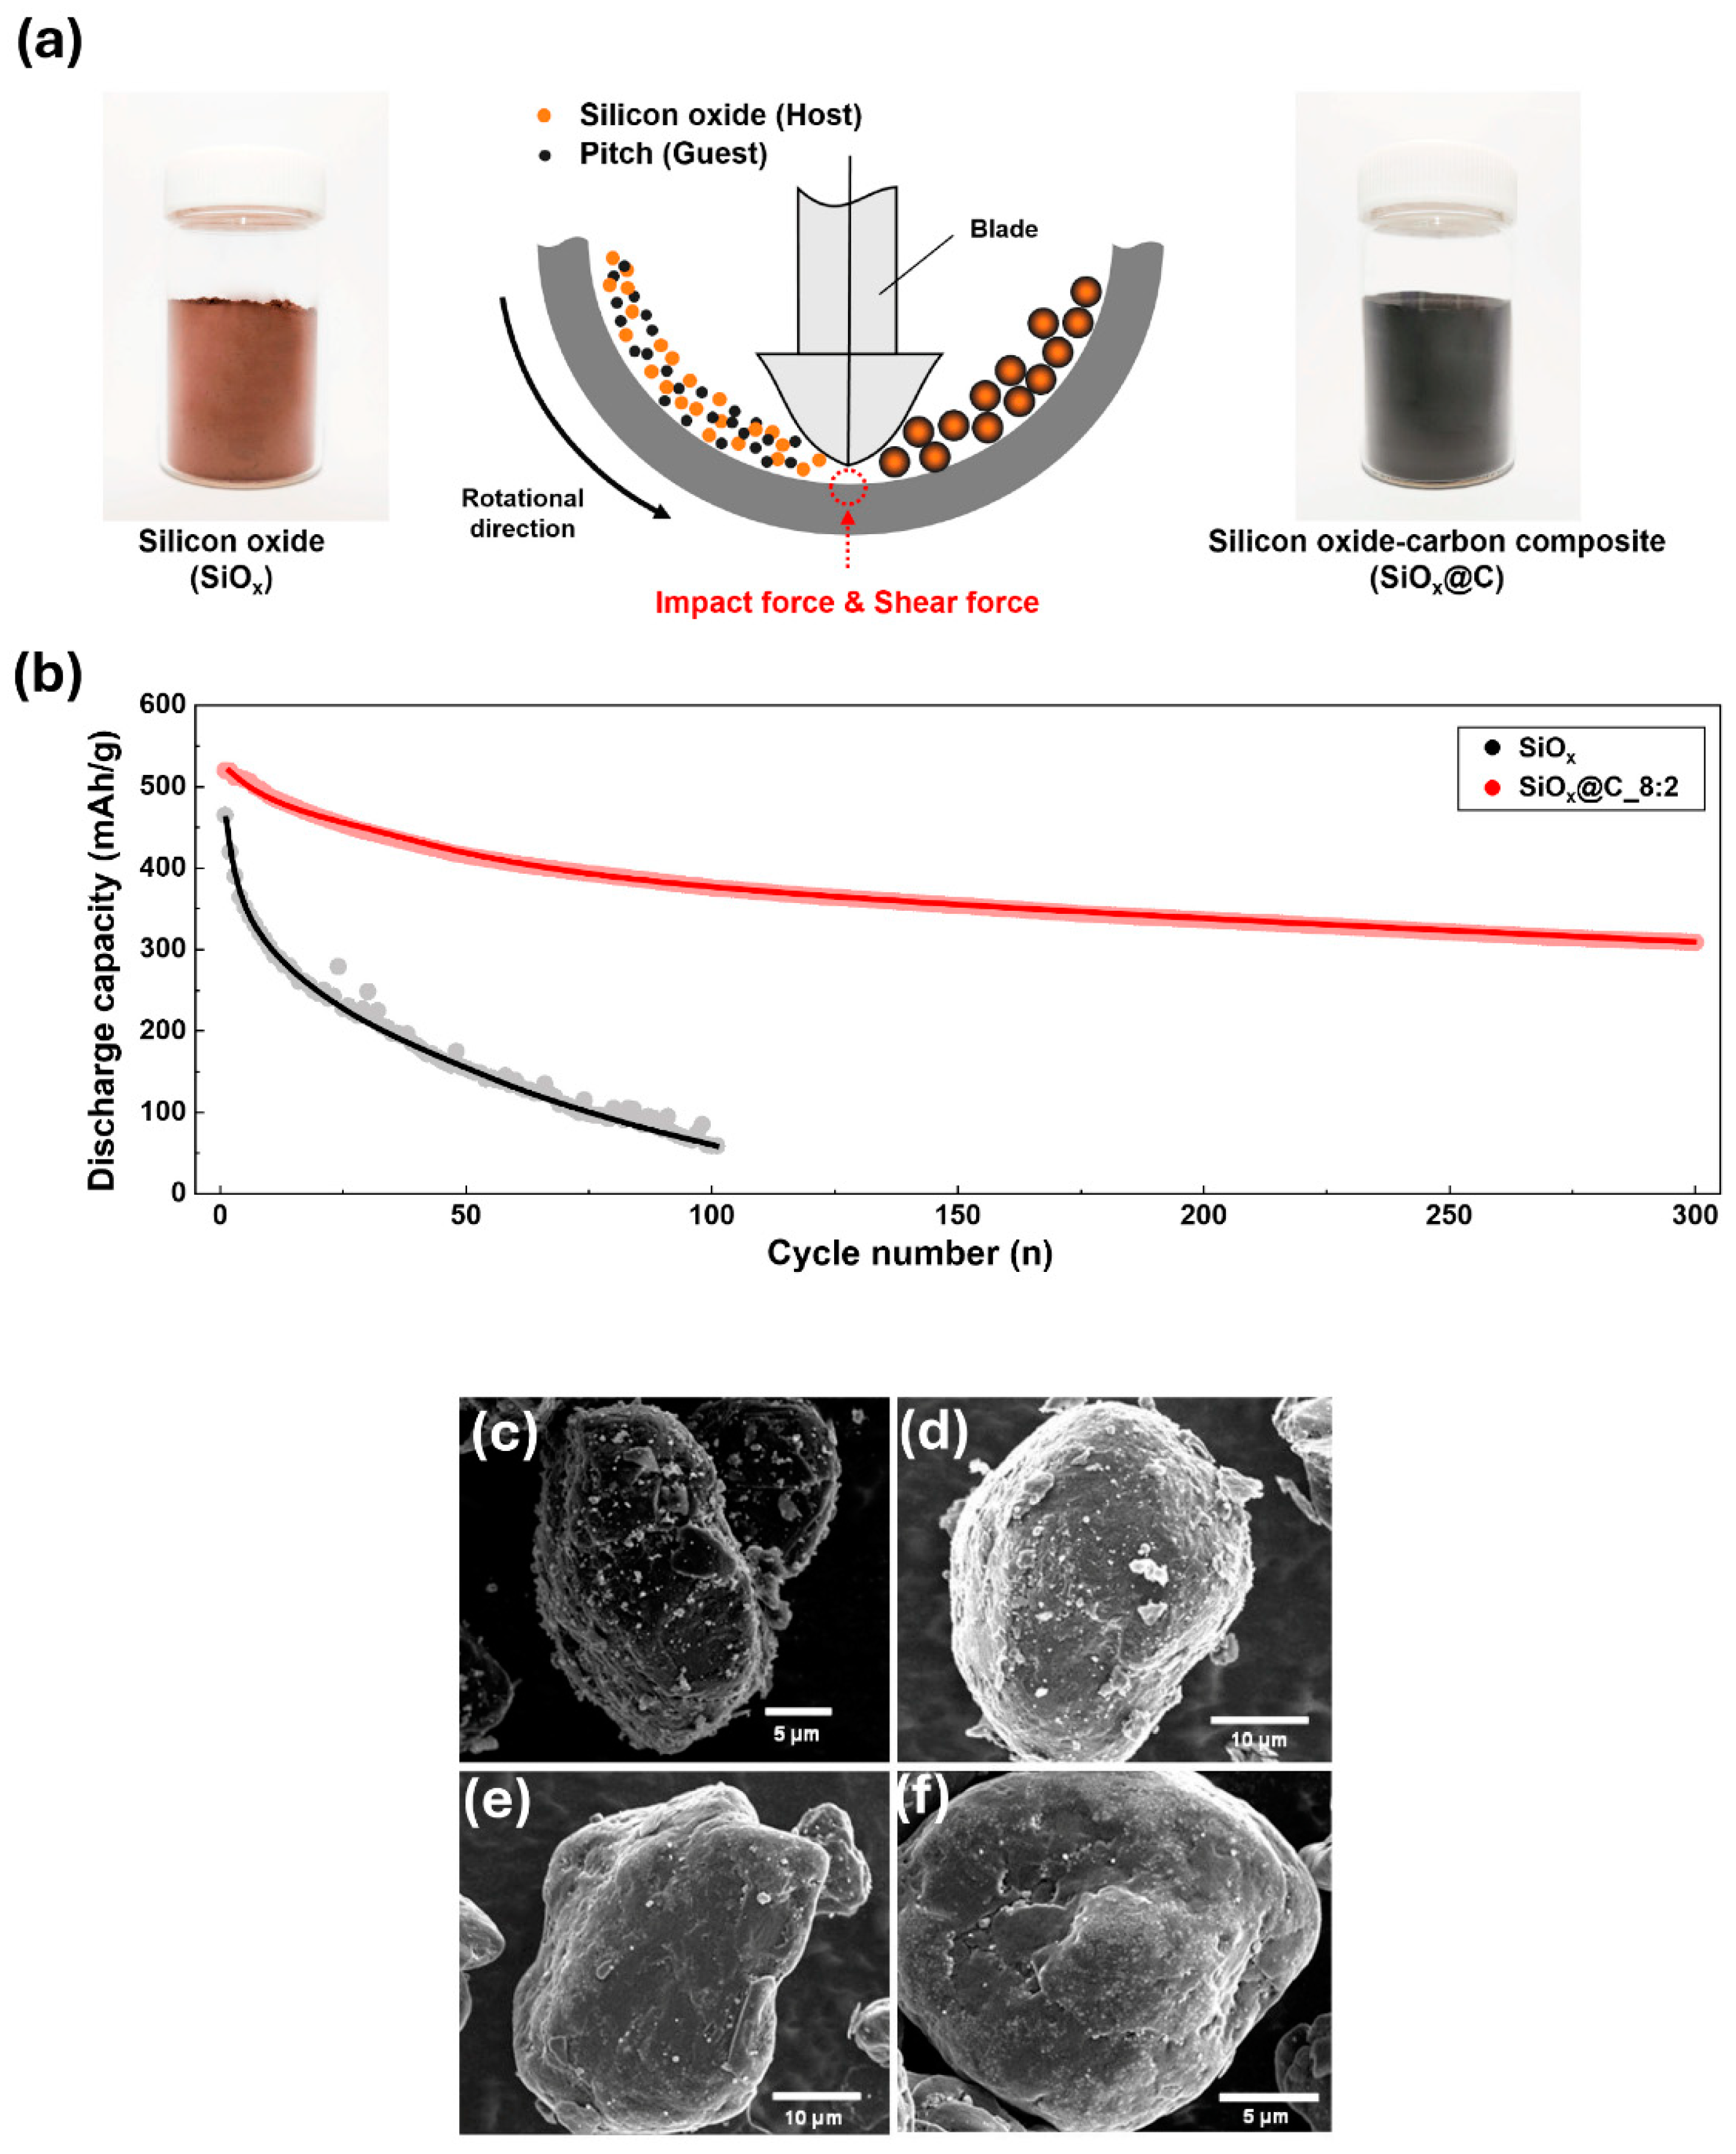
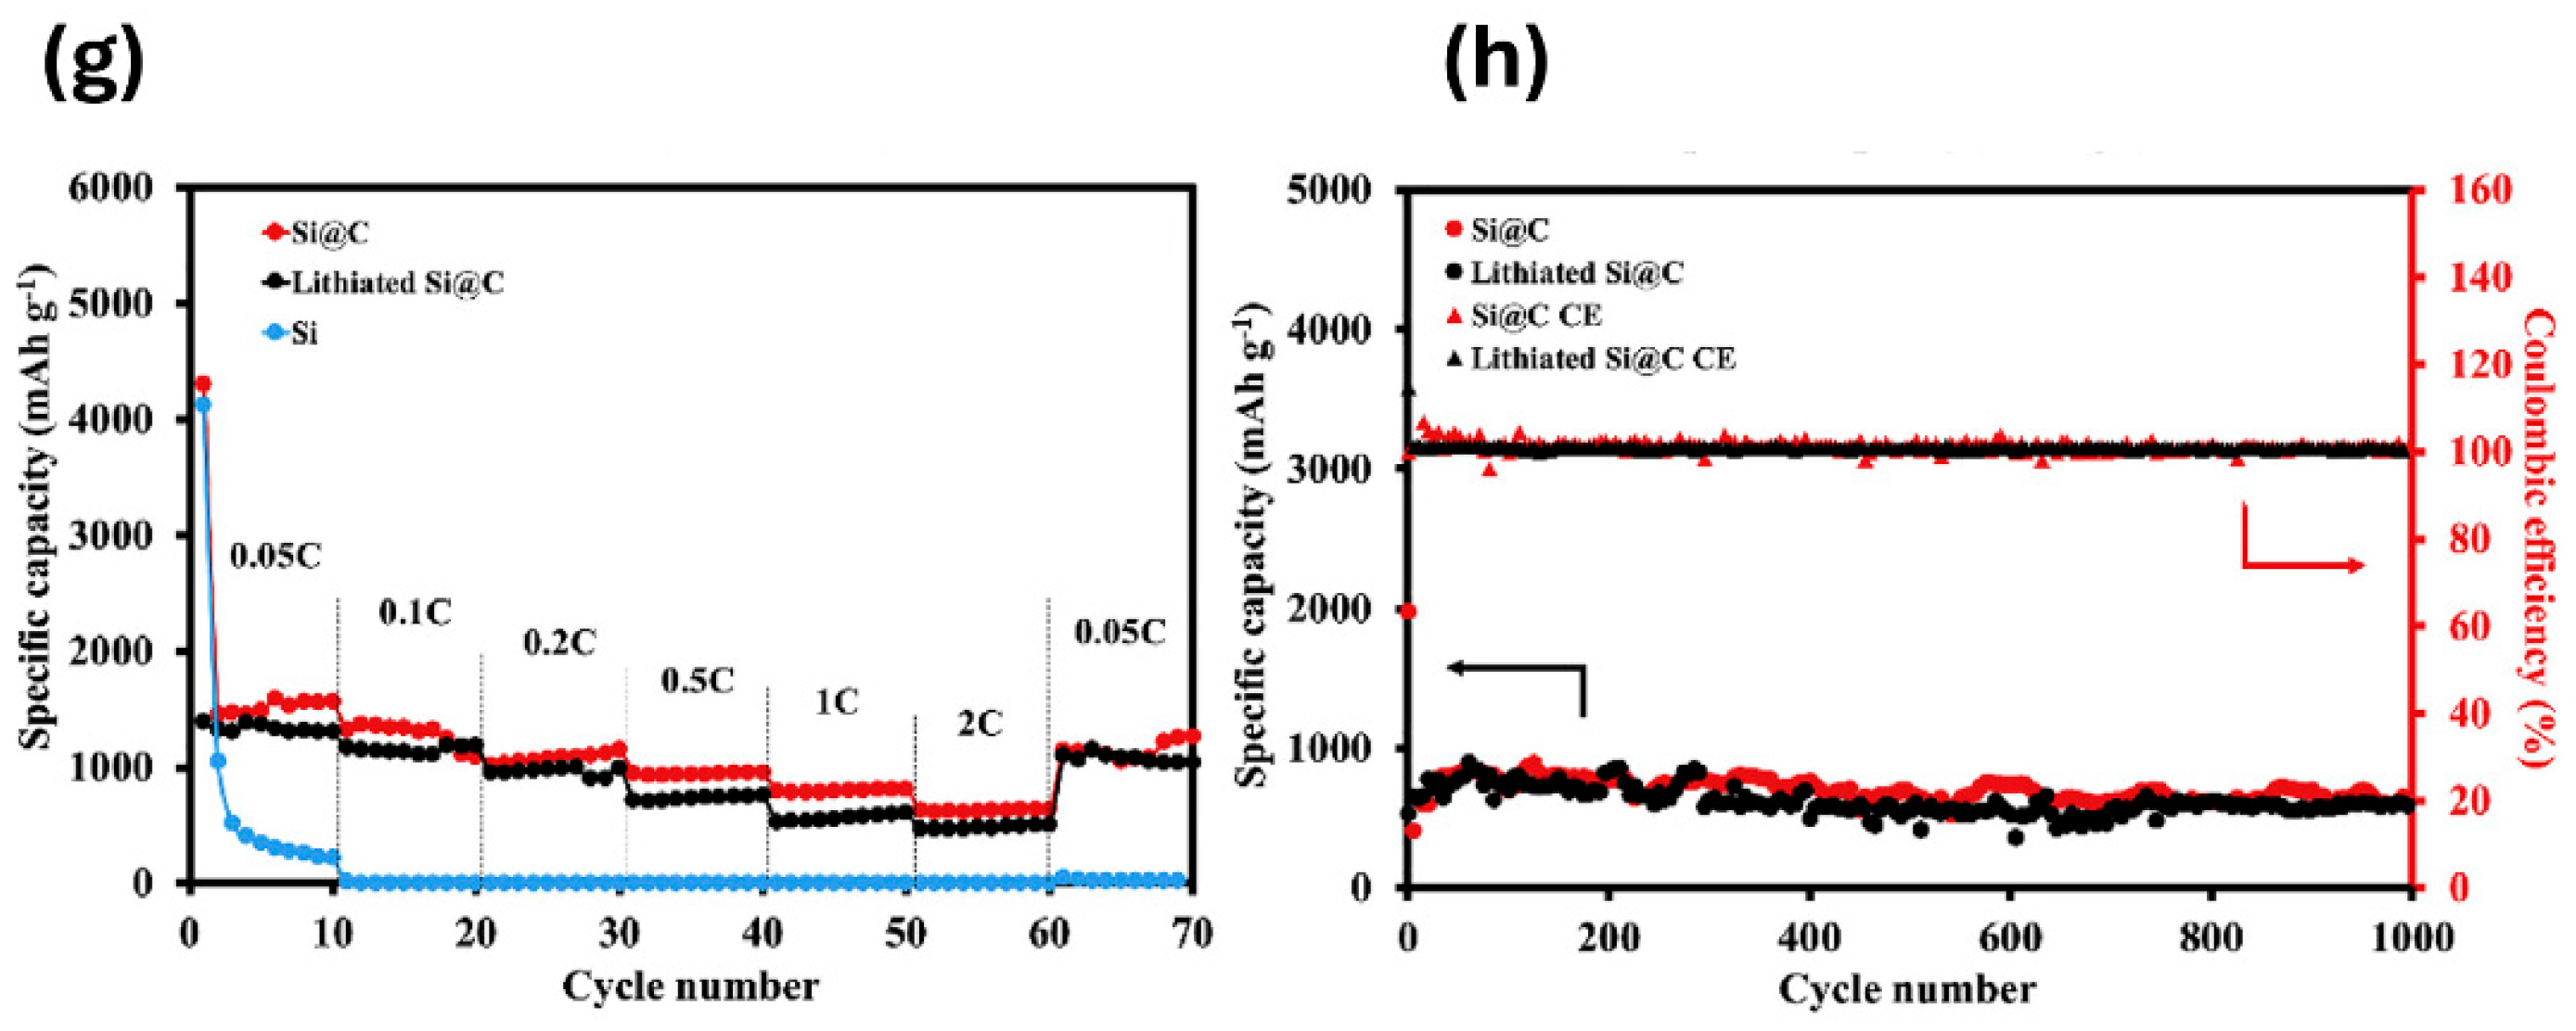
Kim et al. [107] fabricated SiOx@C composites via mechanofusion with silicon oxide and pitch, as shown in Figure 13a. In this process, the silicon oxide (SiOx) that has relatively large particles was structured as a core, while the pitch, which is a smaller particle, forms a shell structure. During the manufacturing process, the rotation of the chamber generated high temperatures that surpassed the softening point of the pitch, allowing for an effective coating. In order to confirm the effect of carbon coating, a performance evaluation was conducted, comparing the SiOx@C composite material with pure SiOx. The SiOx@C composite material demonstrated superior performance compared to the SiOx electrode, which was attributed to the carbon coating. Although the SiOx@C composite initially exhibited a CE of 60%, the SiOx electrode achieved a CE of only 12.6% after the 100th cycle. In addition, while the SiOx electrode reached a CE of 99% by the 10th cycle, the SiOx@C composite achieved the same efficiency by the 4th cycle. As a result of further evaluating the rate capability, the SiOx@C composite material showed a capacity retention rate of 77.2% at 0.5C and a lower capacity retention rate of 47.8% for the SiOx electrode. It was found that the carbon coating at the SiOx@C composite site contributed to the mitigation against volume change in Si and the formation of a stable SEI layer. Cao et al. [108] used mechanofusion to fabricate Si-alloy/graphite composites. The composite is distinguished by the silicon alloy embedded within the layered structure of graphite. The capacity exhibited at a high C-rate was approximately 900 mAh/g to 950 mAh/g. Consequently, it was established that the graphite layer facilitated the mitigation of the volume change in the silicon alloy. Jiang et al. [109] used mechanofusion to incorporate nanosilicon into graphite pores, followed by carbon coating to create a nanosilicon/graphite composite (n-Si/graphite). In this structure, Si served as the guest particle, whereas graphite acted as the host matrix. Figure 13c–f shows the SEM images of the mechanofusion process conducted on the composite for 1, 2, 3, and 5 h, respectively. These images illustrate the morphological changes in the particles over time. After 1 h (Figure 13c), the large particle was graphite and the small particle was n-Si. It has been established that the smaller particles are capable of adhering to the surface of the larger particles. After 2 h (Figure 13d), the n-Si particles became less discernible, and the graphite particles began to adopt a more spherical shape. After 3 h (Figure 13e), the graphite surface became smoother. Finally, after 5 h (Figure 13f), the bright spots in the image represent n-Si particles, and no further changes were observed in graphite particles. Wutthiprom et al. [110] used SiO2 and carbon nanospheres to create a SiO2@C composite through mechanofusion. Subsequently, a reduction process was employed to introduce porosity into the composite, thereby obtaining Si@C composite. The choice of SiO2 as the precursor for silicon was motivated by its cost-effectiveness, being approximately 3000 times cheaper than nanosilicon. This renders the process economically advantageous. The electrochemical behavior of the Si@C composite material prepared by this method was confirmed. Regarding the C-rate performance (Figure 13g) of the Si@C composite material, the ICE was 33.8% and the discharge capacity was 4308 mAh/g. Subsequent increases in the C-rate resulted in a decreasing trend in performance. However, the capacity recovered to 1259 mAh/g at 0.05C. This was initially unstable due to the formation of the SEI layer at the beginning. In comparison, pure Si demonstrated 25.5% ICE. These low ICE lack a stable carbon layer, resulting in the formation of an unstable SEI layer. The pre-lithiated Si@C composite electrode (Figure 13h) exhibited 98.8% ICE due to the stable SEI layer.

3. Conclusions

Si anode material is regarded as a promising candidate for next-generation lithium-ion batteries due to its high theoretical capacity and natural abundance. Si is one of the most plentiful and environmentally friendly resources on Earth. However, its practical application is hindered by significant challenges, including substantial volume expansion and low electrical conductivity during lithium insertion and extraction processes. These issues lead to rapid capacity fading and mechanical degradation, preventing silicon from reaching the stage of widespread commercialization. This review systematically explores various methods for manufacturing silicon–carbon composite anodes, including ball milling, spray drying, pyrolysis, CVD, and mechanofusion. These methods were employed to enhance the structural stability and electrochemical performance of the silicon–carbon composite, providing a pathway toward overcoming the limitations of pure silicon anodes. Ball milling is an effective method for large-scale production. Nevertheless, it faces the limitation of producing non-uniform particle sizes. Pyrolysis offers high yields, but it requires substantial high-temperature energy inputs. Spray drying is a simple method that promotes the formation of spherical particles; still, the size of the equipment requires considerable factory space. CVD stands out for its ability to create diverse particle designs and uniform particles yet, the high costs associated with this method have hindered its commercialization. Lastly, mechanofusion can produce spherical particles. However, its high cost has posed challenges for commercialization. The advantages, disadvantages, and ICE of each synthesis method, along with a comparative analysis, are summarized in Table 1.
Both cycle performance and coulombic efficiency (CE) remain insufficient, presenting challenges for applications in battery-dependent devices, such as electric vehicles (EVs) and IT systems. Future research should prioritize addressing the limitations of the presented processes and enhancing material performance. Process optimization is critical to minimize costs and ensure uniform product output. Rather than adopting a single process, employing a combination of approaches may further improve overall performance. A key step toward commercialization is the establishment of a pilot-scale production facility to validate these processes and support further investigation. By resolving key challenges, such as volume expansion and conductivity limitations, it will become feasible to develop batteries with enhanced capabilities. For example, a single charge could enable EVs to achieve significantly longer driving ranges, while emerging technologies like robotics and urban air mobility (UAM) systems would benefit from more efficient power storage. Overcoming these technological hurdles will be essential in accelerating the path toward successful commercialization.

Author Contributions

Conceptualization, I.P., H.L. and O.B.C.; writing—original draft preparation, I.P.; writing—review and editing, I.P., H.L. and O.B.C.; supervision, O.B.C. All authors have read and agreed to the published version of the manuscript.

Funding

This work was supported by the Gachon University research fund of 2023 (GCU-202400930001).

Conflicts of Interest

The authors declare no conflicts of interest.

References

  1. Dou, F.; Shi, L.Y.; Chen, G.R.; Zhang, D.S. Silicon/Carbon Composite Anode Materials for Lithium-Ion Batteries. Electrochem. Energy Rev. 2019, 2, 149–198. [Google Scholar] [CrossRef]
  2. Li, M.; Lu, J.; Chen, Z.W.; Amine, K. 30 Years of Lithium-Ion Batteries. Adv. Mater. 2018, 30, 1800561. [Google Scholar] [CrossRef] [PubMed]
  3. Lee, D.; Lee, S.; Jung, D.S.; Roh, K.C.; Seo, J.; Kim, J.; Kim, K.; Kim, P.J.; Choi, J. Synergistically enhanced LiF-rich protective layer for highly stable silicon anodes. Appl. Surf. Sci. 2024, 661, 160023. [Google Scholar] [CrossRef]
  4. Lee, H.; Yoon, T.; Chae, O. Strategies for Enhancing the Stability of Lithium Metal Anodes in Solid-State Electrolytes. Micromachines 2024, 15, 453. [Google Scholar] [CrossRef]
  5. Su, H.P.; Barragan, A.A.; Geng, L.X.; Long, D.H.; Ling, L.C.; Bozhilov, K.N.; Mangolini, L.; Guo, J.C. Colloidal Synthesis of Silicon-Carbon Composite Material for Lithium-Ion Batteries. Angew. Chem. Int. Ed. 2017, 56, 10780–10785. [Google Scholar] [CrossRef]
  6. Nzereogu, P.U.; Omah, A.D.; Ezema, F.I.; Iwuoha, E.I.; Nwanya, A.C. Anode materials for lithium-ion batteries: A review. Appl. Surf. Sci. Adv. 2022, 9, 100233. [Google Scholar] [CrossRef]
  7. Ko, J.; So, S.; Kim, M.; Kim, I.; Ahn, Y.N.; Hur, J. Promoting Zn2+ migration through polar perovskite dielectric layer on Zn metal anode for the enhanced aqueous Zn-ion batteries. Chem. Eng. J. 2023, 462, 142308. [Google Scholar] [CrossRef]
  8. Nam, G.; Hwang, J.; Kang, D.H.; Oh, S.; Chae, S.; Yoon, M.; Ko, M.S. Mechanical densification synthesis of single-crystalline Ni-rich cathode for high-energy lithium-ion batteries. J. Energy Chem. 2023, 79, 562–568. [Google Scholar] [CrossRef]
  9. Song, W.; Chae, O.B.; Ryu, J.H. Surface Nitridation of Nano-sized Anatase TiO2 using Urea and Thiourea for Enhanced Electrochemical Performance in Lithium-ion Batteries. J. Electrochem. Sci. Technol. 2024, 15, 512–520. [Google Scholar] [CrossRef]
  10. Kim, J.; Yoon, T.; Chae, O.B. Behavior of NO3−-Based Electrolyte Additive in Lithium Metal Batteries. Batteries 2024, 10, 135. [Google Scholar] [CrossRef]
  11. Phan Nguyen, T.; Thi Giang, T.; Tae Kim, I. Restructuring NiO to LiNiO2: Ultrastable and reversible anodes for lithium-ion batteries. Chem. Eng. J. 2022, 437, 135292. [Google Scholar] [CrossRef]
  12. Sui, D.; Liu, J. Constriction-susceptible lithium support for fast cycling of solid-state lithium metal battery. Chin. Chem. Lett. 2024, 110417. [Google Scholar] [CrossRef]
  13. Goodenough, J.B.; Park, K.S. The Li-Ion Rechargeable Battery: A Perspective. J. Am. Chem. Soc. 2013, 135, 1167–1176. [Google Scholar] [CrossRef] [PubMed]
  14. Kim, J.Y.; Chae, O.B.; Kim, G.; Peterson, A.A.; Wu, M.; Jung, H.T. Long-Range Uniform Deposition of Ag Nanoseed on Cu Current Collector for High-Performance Lithium Metal Batteries. Small 2024, 20, e2307200. [Google Scholar] [CrossRef] [PubMed]
  15. Park, K.; Myeong, S.; Lee, D.; Yoo, H.E.; Kim, J.; Kim, C.; Kim, J.; Sun, S.; Kwon, J.; Kim, S.C.; et al. Improved Li-ion kinetics of the anode by kneading process of binder for lithium-ion batteries with high energy density. Electrochim. Acta 2023, 464, 142900. [Google Scholar] [CrossRef]
  16. de las Casas, C.; Li, W.Z. A review of application of carbon nanotubes for lithium ion battery anode material. J. Power Sources 2012, 208, 74–85. [Google Scholar] [CrossRef]
  17. Chan, C.K.; Peng, H.L.; Liu, G.; McIlwrath, K.; Zhang, X.F.; Huggins, R.A.; Cui, Y. High-performance lithium battery anodes using silicon nanowires. Nat. Nanotechnol. 2008, 3, 31–35. [Google Scholar] [CrossRef]
  18. Chae, O.B.; Rynearson, L.; Lucht, B.L. Distance-Dependent Solid Electrolyte Interphase Control by Electrochemical Pretreatment. ACS Energy Lett. 2022, 7, 3087–3094. [Google Scholar] [CrossRef]
  19. Nguyen, T.P.; Kim, I.T. Self-Assembled Few-Layered MoS on SnO Anode for Enhancing Lithium-Ion Storage. Nanomaterials 2020, 10, 2558. [Google Scholar] [CrossRef]
  20. Lee, G.; Kim, I.; Hur, J. Highly conductive and robust telluride-carbon hybrid matrix for enhanced copper diphosphide anode in Li-ion batteries. J. Alloys Compd. 2023, 950, 169914. [Google Scholar] [CrossRef]
  21. So, S.; Ko, J.; Ahn, Y.N.; Kim, I.; Hur, J. Unraveling improved electrochemical kinetics of In2Te3-based anodes embedded in hybrid matrix for Li-ion batteries. Chem. Eng. J. 2022, 429, 132395. [Google Scholar] [CrossRef]
  22. Feng, K.; Li, M.; Liu, W.W.; Kashkooli, A.G.; Xiao, X.C.; Cai, M.; Chen, Z.W. Silicon-Based Anodes for Lithium-Ion Batteries: From Fundamentals to Practical Applications. Small 2018, 14, 1702737. [Google Scholar] [CrossRef] [PubMed]
  23. Kim, B.C.; Uono, H.; Satou, T.; Fuse, T.; Ishihara, T.; Ue, M.; Senna, M. Cyclic properties of Si-Cu/carbon nanocomposite anodes for Li-ion secondary batteries. J. Electrochem. Soc. 2005, 152, A523–A526. [Google Scholar] [CrossRef]
  24. Zhang, Y.X.; Wu, B.R.; Mu, G.; Ma, C.W.; Mu, D.B.; Wu, F. Recent progress and perspectives on silicon anode: Synthesis and prelithiation for LIBs energy storage. J. Energy Chem. 2022, 64, 615–650. [Google Scholar] [CrossRef]
  25. Quilty, C.D.; Wu, D.R.; Li, W.Z.; Bock, D.C.; Wang, L.; Housel, L.M.; Abraham, A.; Takeuchi, K.J.; Marschilok, A.C.; Takeuchi, E.S. Electron and Ion Transport in Lithium and Lithium-Ion Battery Negative and Positive Composite Electrodes. Chem. Rev. 2023, 123, 1327–1363. [Google Scholar] [CrossRef]
  26. Choi, W.S.; Kim, M.; Kim, I.T. Te-rP-C Anodes Prepared Using a Scalable Milling Process for High-Performance Lithium-Ion Batteries. Micromachines 2023, 14, 2156. [Google Scholar] [CrossRef]
  27. Kidanu, W.G.; Hur, J.; Kim, I.T. Gallium-Indium-Tin Eutectic as a Self-Healing Room-Temperature Liquid Metal Anode for High-Capacity Lithium-Ion Batteries. Materials 2022, 15, 168. [Google Scholar] [CrossRef]
  28. Luo, F.; Liu, B.N.; Zheng, J.Y.; Chu, G.; Zhong, K.F.; Li, H.; Huang, X.J.; Chen, L.Q. Review-Nano-Silicon/Carbon Composite Anode Materials Towards Practical Application for Next Generation Li-Ion Batteries. J. Electrochem. Soc. 2015, 162, A2509–A2528. [Google Scholar] [CrossRef]
  29. Roy, P.; Srivastava, S.K. Nanostructured anode materials for lithium ion batteries. J. Mater. Chem. A 2015, 3, 2454–2484. [Google Scholar] [CrossRef]
  30. Bärmann, P.; Diehl, M.; Göbel, L.; Ruttert, M.; Nowak, S.; Winter, M.; Placke, T. Impact of the silicon particle size on the pre-lithiation behavior of silicon/carbon composite materials for lithium ion batteries. J. Power Sources 2020, 464, 228224. [Google Scholar] [CrossRef]
  31. Shi, C.; Wang, T.; Liao, X.; Qie, B.; Yang, P.; Chen, M.; Wang, X.; Srinivasan, A.; Cheng, Q.; Ye, Q.; et al. Accordion-like stretchable Li-ion batteries with high energy density. Energy Storage Mater. 2019, 17, 136–142. [Google Scholar] [CrossRef]
  32. Zhang, H.; Yang, Y.; Ren, D.; Wang, L.; He, X. Graphite as anode materials: Fundamental mechanism, recent progress and advances. Energy Storage Mater. 2021, 36, 147–170. [Google Scholar] [CrossRef]
  33. Li, P.; Kim, H.; Myung, S.T.; Sun, Y.K. Diverting Exploration of Silicon Anode into Practical Way: A Review Focused on Silicon-Graphite Composite for Lithium Ion Batteries. Energy Storage Mater. 2021, 35, 550–576. [Google Scholar] [CrossRef]
  34. Gonzalez, A.F.; Yang, N.H.; Liu, R.S. Silicon Anode Design for Lithium-Ion Batteries: Progress and Perspectives. J. Phys. Chem. C 2017, 121, 27775–27787. [Google Scholar] [CrossRef]
  35. Yoshio, M.; Wang, H.Y.; Fukuda, K.; Umeno, T.; Dimov, N.; Ogumi, Z. Carbon-coated Si as a lithium-ion battery anode material. J. Electrochem. Soc. 2002, 149, A1598–A1603. [Google Scholar] [CrossRef]
  36. Sun, L.; Liu, Y.X.; Shao, R.; Wu, J.; Jiang, R.Y.; Jin, Z. Recent progress and future perspective on practical silicon anode-based lithium ion batteries. Energy Storage Mater. 2022, 46, 482–502. [Google Scholar] [CrossRef]
  37. Preman, A.N.; Vo, T.N.; Choi, S.; Lee, H.; Lim, Y.E.; Kim, I.; Ahn, S.K. Self-Healable Poly(Acrylic Acid) Binder toward Optimized Electrochemical Performance for Silicon Anodes: Importance of Balanced Properties. ACS Appl. Energy Mater. 2024, 7, 749–759. [Google Scholar] [CrossRef]
  38. Gu, M.; He, Y.; Zheng, J.M.; Wang, C.M. Nanoscale silicon as anode for Li-ion batteries: The fundamentals, promises, and challenges. Nano Energy 2015, 17, 366–383. [Google Scholar] [CrossRef]
  39. Chen, X.; Li, H.X.; Yan, Z.H.; Cheng, F.Y.; Chen, J. Structure design and mechanism analysis of silicon anode for lithium-ion batteries. Sci. China Mater. 2019, 62, 1515–1536. [Google Scholar] [CrossRef]
  40. Liu, X.Y.; Zhu, X.J.; Pan, D. Solutions for the problems of silicon-carbon anode materials for lithium-ion batteries. R. Soc. Open Sci. 2018, 5, 172370. [Google Scholar] [CrossRef]
  41. Park, E.; So, S.; Hur, J. Carbon-free hydrated cobalt vanadium oxide as a promising anode for lithium-ion batteries. Appl. Surf. Sci. 2022, 579, 152182. [Google Scholar] [CrossRef]
  42. Li, P.; Zhao, G.Q.; Zheng, X.B.; Xu, X.; Yao, C.H.; Sun, W.P.; Dou, S.X. Recent progress on silicon-based anode materials for practical lithium-ion battery applications. Energy Storage Mater. 2018, 15, 422–446. [Google Scholar] [CrossRef]
  43. Ozanam, F.; Rosso, M. Silicon as anode material for Li-ion batteries. Mater. Sci. Eng. B-Adv. 2016, 213, 2–11. [Google Scholar] [CrossRef]
  44. Jin, Y.; Zhu, B.; Lu, Z.D.; Liu, N.; Zhu, J. Challenges and Recent Progress in the Development of Si Anodes for Lithium-Ion Battery. Adv. Energy Mater. 2017, 7, 1700715. [Google Scholar] [CrossRef]
  45. Shen, T.; Yao, Z.J.; Xia, X.H.; Wang, X.L.; Gu, C.D.; Tu, J.P. Rationally Designed Silicon Nanostructures as Anode Material for Lithium-Ion Batteries. Adv. Eng. Mater. 2018, 20, 1700591. [Google Scholar] [CrossRef]
  46. Szczech, J.R.; Jin, S. Nanostructured silicon for high capacity lithium battery anodes. Energy Environ. Sci. 2011, 4, 56–72. [Google Scholar] [CrossRef]
  47. Wu, H.; Cui, Y. Designing nanostructured Si anodes for high energy lithium ion batteries. Nano Today 2012, 7, 414–429. [Google Scholar] [CrossRef]
  48. Rahman, M.A.; Song, G.S.; Bhatt, A.I.; Wong, Y.C.; Wen, C.E. Nanostructured Silicon Anodes for High-Performance Lithium-Ion Batteries. Adv. Funct. Mater. 2016, 26, 647–678. [Google Scholar] [CrossRef]
  49. Teki, R.; Datta, M.K.; Krishnan, R.; Parker, T.C.; Lu, T.M.; Kumta, P.N.; Koratkar, N. Nanostructured Silicon Anodes for Lithium Ion Rechargeable Batteries. Small 2009, 5, 2236–2242. [Google Scholar] [CrossRef]
  50. Cao, Z.; Zheng, X.Y.; Qu, Q.T.; Huang, Y.H.; Zheng, H.H. Electrolyte Design Enabling a High-Safety and High-Performance Si Anode with a Tailored Electrode-Electrolyte Interphase. Adv. Mater. 2021, 33, 2103178. [Google Scholar] [CrossRef]
  51. Zhang, S.; He, M.N.; Su, C.C.; Zhang, Z.C. Advanced electrolyte/additive for lithium-ion batteries with silicon anode. Curr. Opin. Chem. Eng. 2016, 13, 24–35. [Google Scholar] [CrossRef]
  52. Xu, C.; Lindgren, F.; Philippe, B.; Gorgoi, M.; Björefors, F.; Edström, K.; Gustafsson, T. Improved Performance of the Silicon Anode for Li-Ion Batteries: Understanding the Surface Modification Mechanism of Fluoroethylene Carbonate as an Effective Electrolyte Additive. Chem. Mat. 2015, 27, 2591–2599. [Google Scholar] [CrossRef]
  53. Liu, H.B.; Sun, Q.; Zhang, H.Q.; Cheng, J.; Li, Y.Y.; Zeng, Z.; Zhang, S.; Xu, X.; Ji, F.J.; Li, D.P.; et al. The application road of silicon-based anode in lithium-ion batteries: From liquid electrolyte to solid-state electrolyte. Energy Storage Mater. 2023, 55, 244–263. [Google Scholar] [CrossRef]
  54. He, Y.; Jiang, L.; Chen, T.W.; Xu, Y.B.; Jia, H.P.; Yi, R.; Xue, D.C.; Song, M.; Genc, A.; Bouchet-Marquis, C.; et al. Progressive growth of the solid-electrolyte interphase towards the Si anode interior causes capacity fading. Nat. Nanotechnol. 2021, 16, 1113–1120. [Google Scholar] [CrossRef]
  55. Xu, Z.X.; Yang, J.; Li, H.P.; Nuli, Y.N.; Wang, J.L. Electrolytes for advanced lithium ion batteries using silicon-based anodes. J. Mater. Chem. A 2019, 7, 9432–9446. [Google Scholar] [CrossRef]
  56. Li, Z.H.; Zhang, Y.P.; Liu, T.F.; Gao, X.H.; Li, S.Y.; Ling, M.; Liang, C.D.; Zheng, J.C.; Lin, Z. Silicon Anode with High Initial Coulombic Efficiency by Modulated Trifunctional Binder for High-Areal-Capacity Lithium-Ion Batteries. Adv. Energy Mater. 2020, 10, 1903110. [Google Scholar] [CrossRef]
  57. Gao, S.L.; Sun, F.Y.; Brady, A.; Pan, Y.Y.; Erwin, A.; Yang, D.D.; Tsukruk, V.; Stack, A.G.; Saito, T.; Yang, H.B.; et al. Ultra-efficient polymer binder for silicon anode in high-capacity lithium-ion batteries. Nano Energy 2020, 73, 104804. [Google Scholar] [CrossRef]
  58. Magasinski, A.; Zdyrko, B.; Kovalenko, I.; Hertzberg, B.; Burtovyy, R.; Huebner, C.F.; Fuller, T.F.; Luzinov, I.; Yushin, G. Toward Efficient Binders for Li-Ion Battery Si-Based Anodes: Polyacrylic Acid. ACS Appl. Mater. Interfaces 2010, 2, 3004–3010. [Google Scholar] [CrossRef]
  59. Liu, D.; Zhao, Y.; Tan, R.; Tian, L.L.; Liu, Y.D.; Chen, H.B.; Pan, F. Novel conductive binder for high-performance silicon anodes in lithium ion batteries. Nano Energy 2017, 36, 206–212. [Google Scholar] [CrossRef]
  60. Preman, A.N.; Lee, H.; Yoo, J.; Kim, I.; Saito, T.; Ahn, S.K. Progress of 3D network binders in silicon anodes for lithium ion batteries. J. Mater. Chem. A 2020, 8, 25548–25570. [Google Scholar] [CrossRef]
  61. Luo, W.; Chen, X.Q.; Xia, Y.; Chen, M.; Wang, L.J.; Wang, Q.Q.; Li, W.; Yang, J.P. Surface and Interface Engineering of Silicon-Based Anode Materials for Lithium-Ion Batteries. Adv. Energy Mater. 2017, 7, 1701083. [Google Scholar] [CrossRef]
  62. Jiang, C.L.; Xiang, L.; Miao, S.J.; Shi, L.; Xie, D.H.; Yan, J.X.; Zheng, Z.J.; Zhang, X.M.; Tang, Y.B. Flexible Interface Design for Stress Regulation of a Silicon Anode toward Highly Stable Dual-Ion Batteries. Adv. Mater. 2020, 32, e1908470. [Google Scholar] [CrossRef]
  63. Lv, Y.Y.; Han, Z.B.; Jia, R.R.; Shi, L.Y.; Yuan, S. Porous interface for fast charging silicon anode. Battery Energy 2022, 1, 20220009. [Google Scholar] [CrossRef]
  64. Wang, L.; Lu, J.J.; Li, S.Y.; Xi, F.S.; Tong, Z.Q.; Chen, X.H.; Wei, K.X.; Ma, W.H. Controllable Interface Engineering for the Preparation of High Rate Silicon Anode. Adv. Funct. Mater. 2024, 34, 2403574. [Google Scholar] [CrossRef]
  65. Wang, L.; Yu, J.; Li, S.Y.; Xi, F.S.; Ma, W.H.; Wei, K.X.; Lu, J.J.; Tong, Z.Q.; Liu, B.; Luo, B. Recent advances in interface engineering of silicon anodes for enhanced lithium-ion battery performance. Energy Storage Mater. 2024, 66, 103243. [Google Scholar] [CrossRef]
  66. Zuo, X.X.; Zhu, J.; Müller-Buschbaum, P.; Cheng, Y.J. Silicon based lithium-ion battery anodes: A chronicle perspective review. Nano Energy 2017, 31, 113–143. [Google Scholar] [CrossRef]
  67. Andersen, H.F.; Foss, C.E.L.; Voje, J.; Tronstad, R.; Mokkelbost, T.; ErikVullum, P.; Ulvestad, A.; Kirkengen, M.; Mæhlen, J.P. Silicon-Carbon composite anodes from industrial battery grade silicon. Sci. Rep. 2019, 9, 14814. [Google Scholar] [CrossRef]
  68. Liu, Y.; Hanai, K.; Yang, J.; Imanishi, N.; Hirano, A.; Takeda, Y. Silicon/carbon composites as anode materials for Li-ion batteries. Electrochem. Solid-State Lett. 2004, 7, A369–A372. [Google Scholar] [CrossRef]
  69. Wang, J.Z.; Zhong, C.; Chou, S.L.; Liu, H.K. Flexible free-standing graphene-silicon composite film for lithium-ion batteries. Electrochem. Commun. 2010, 12, 1467–1470. [Google Scholar] [CrossRef]
  70. Mhadhbi, M. Modelling of the High-Energy Ball Milling Process. Adv. Mat. Phys. Chem. 2021, 11, 31–44. [Google Scholar] [CrossRef]
  71. Yu, S.X.; Guo, B.B.; Zeng, T.B.; Qu, H.Q.; Yang, J.L.; Bai, J.M. Graphene-based lithium-ion battery anode materials manufactured by mechanochemical ball milling process: A review and perspective. Compos. Pt. B-Eng. 2022, 246, 110232. [Google Scholar] [CrossRef]
  72. Bhagyaraj, S.M.; Oluwafemi, O.S.; Kalarikkal, N.; Thomas, S. Synthesis of Inorganic Nanomaterials: Advances and Key Technologies; Woodhead Publishing: Duxford, UK; Cambridge, MA, USA, 2018; p. 12. 300p. [Google Scholar]
  73. Zhang, Y.; Cheng, Y.; Song, J.; Zhang, Y.; Shi, Q.; Wang, J.; Tian, F.; Yuan, S.; Su, Z.; Zhou, C.; et al. Functionalization-assistant ball milling towards Si/graphene anodes in high performance Li-ion batteries. Carbon 2021, 181, 300–309. [Google Scholar] [CrossRef]
  74. Wang, D.; Gao, M.; Pan, H.; Wang, J.; Liu, Y. High performance amorphous-Si@SiOx/C composite anode materials for Li-ion batteries derived from ball-milling and in situ carbonization. J. Power Sources 2014, 256, 190–199. [Google Scholar] [CrossRef]
  75. Qian, L.; Lan, J.-L.; Xue, M.; Yu, Y.; Yang, X. Two-step ball-milling synthesis of a Si/SiOx/C composite electrode for lithium ion batteries with excellent long-term cycling stability. RSC Adv. 2017, 7, 36697–36704. [Google Scholar] [CrossRef]
  76. Koraag, P.Y.E.; Firdaus, A.M.; Hawari, N.H.; Refino, A.D.; Dempwolf, W.; Iskandar, F.; Peiner, E.; Wasisto, H.S.; Sumboja, A. Covalently Bonded Ball-Milled Silicon/CNT Nanocomposite as Lithium-Ion Battery Anode Material. Batteries 2022, 8, 165. [Google Scholar] [CrossRef]
  77. Cu, P.; Cai, R.; Zhou, Y.K.; Shao, Z.P. Si/C composite lithium-ion battery anodes synthesized from coarse silicon and citric acid through combined ball milling and thermal pyrolysis. Electrochim. Acta 2010, 55, 3876–3883. [Google Scholar]
  78. Cabello, M.; Gucciardi, E.; Herrán, A.; Carriazo, D.; Villaverde, A.; Rojo, T. Towards a High-Power Si@graphite Anode for Lithium Ion Batteries through a Wet Ball Milling Process. Molecules 2020, 25, 2494. [Google Scholar] [CrossRef]
  79. Zhang, Y.; Zhang, X.G.; Zhang, H.L.; Zhao, Z.G.; Li, F.; Liu, C.; Cheng, H.M. Composite anode material of silicon/graphite/carbon nanotubes for Li-ion batteries. Electrochim. Acta 2006, 51, 4994–5000. [Google Scholar] [CrossRef]
  80. Han, J.; Zhao, C.C.; Wang, L.; Song, J.; Yang, D.; Tian, Q.H. Simple ball milling-assisted method enabling N-doped carbon embedded Si for high performance lithium-ion battery anode. J. Alloys Compd. 2023, 966, 171668. [Google Scholar] [CrossRef]
  81. Gorshkov, A.; Berezikov, N.; Kaltaev, A.; Yankovsky, S.; Slyusarsky, K.; Tabakaev, R.; Larionov, K. Analysis of the Physicochemical Characteristics of Biochar Obtained by Slow Pyrolysis of Nut Shells in a Nitrogen Atmosphere. Energies 2021, 14, 8075. [Google Scholar] [CrossRef]
  82. Kaur, R.; Gera, P.; Jha, M.K.; Bhaskar, T. Chapter 8—Thermochemical Route for Biohydrogen Production. In Biohydrogen, 2nd ed.; Pandey, A., Mohan, S.V., Chang, J.-S., Hallenbeck, P.C., Larroche, C., Eds.; Elsevier: Amsterdam, The Netherlands, 2019; pp. 187–218. [Google Scholar]
  83. Zhang, G.W.; He, Y.Q.; Feng, Y.; Wang, H.F.; Zhang, T.; Xie, W.N.; Zhu, X.N. Enhancement in liberation of electrode materials derived from spent lithium-ion battery by pyrolysis. J. Clean. Prod. 2018, 199, 62–68. [Google Scholar] [CrossRef]
  84. Chen, Y.L.; Hu, Y.; Shao, J.Z.; Shen, Z.; Chen, R.Z.; Zhang, X.W.; He, X.; Song, Y.Z.; Xing, X.L. Pyrolytic carbon-coated silicon/carbon nanofiber composite anodes for high-performance lithium-ion batteries. J. Power Sources 2015, 298, 130–137. [Google Scholar] [CrossRef]
  85. Yang, Z.W.; Yang, Y.; Guo, H.J.; Wang, Z.X.; Li, X.H.; Zhou, Y.; Wang, J.X. Compact structured silicon/carbon composites as high-performance anodes for lithium ion batteries. Ionics 2018, 24, 3405–3411. [Google Scholar] [CrossRef]
  86. Hu, J.Z.; Wang, M.; Meyer, A.W.; Huang, X.S.; Cheng, Y.T. Oxidative Pyrolysis of Si/Polyacrylonitrile Composites as an Unconventional Approach to Fabricate High Performance Lithium Ion Battery Negative Electrodes. J. Electrochem. Soc. 2019, 166, A3716–A3722. [Google Scholar] [CrossRef]
  87. Su, M.R.; Wang, Z.X.; Guo, H.J.; Li, X.H.; Huang, S.L.; Gan, L. Silicon, flake graphite and phenolic resin-pyrolyzed carbon based Si/C composites as anode material for lithium-ion batteries. Adv. Powder Technol. 2013, 24, 921–925. [Google Scholar] [CrossRef]
  88. Wang, M.S.; Fan, L.Z. Silicon/carbon nanocomposite pyrolyzed from phenolic resin as anode materials for lithium-ion batteries. J. Power Sources 2013, 244, 570–574. [Google Scholar] [CrossRef]
  89. Campbell, H.R.; Alsharif, F.M.; Marsac, P.J.; Lodder, R.A. The Development of a Novel Pharmaceutical Formulation of D-Tagatose for Spray-Drying. J. Pharm. Innov. 2022, 17, 194–206. [Google Scholar] [CrossRef]
  90. Sosnik, A.; Seremeta, K.P. Advantages and challenges of the spray-drying technology for the production of pure drug particles and drug-loaded polymeric carriers. Adv. Colloid Interface Sci. 2015, 223, 40–54. [Google Scholar] [CrossRef]
  91. Pan, Q.R.; Zuo, P.J.; Lou, S.F.; Mu, T.S.; Du, C.Y.; Cheng, X.Q.; Ma, Y.L.; Gao, Y.Z.; Yin, G.P. Micro-sized spherical silicon@carbon@graphene prepared by spray drying as anode material for lithium-ion batteries. J. Alloys Compd. 2017, 723, 434–440. [Google Scholar] [CrossRef]
  92. Lai, J.; Guo, H.J.; Wang, Z.X.; Li, X.H.; Zhang, X.P.; Wu, F.X.; Yue, P. Preparation and characterization of flake graphite/silicon/carbon spherical composite as anode materials for lithium-ion batteries. J. Alloys Compd. 2012, 530, 30–35. [Google Scholar] [CrossRef]
  93. Su, M.R.; Liu, S.; Tao, L.; Tang, Y.P.; Dou, A.C.; Lv, J.; Liu, Y.J. Silicon@graphene composite prepared by spray-drying method as anode for lithium ion batteries. J. Electroanal. Chem. 2019, 844, 86–90. [Google Scholar] [CrossRef]
  94. Paireau, C.; Jouanneau, S.; Ammar, M.R.; Simon, P.; Béguin, F.; Raymundo-Piñero, E. Si/C composites prepared by spray drying from cross-linked polyvinyl alcohol as Li-ion batteries anodes. Electrochim. Acta 2015, 174, 361–368. [Google Scholar] [CrossRef]
  95. Wang, D.S.; Gao, M.X.; Pan, H.G.; Liu, Y.F.; Wang, J.H.; Li, S.Q.; Ge, H.W. Enhanced cycle stability of micro-sized Si/C anode material with low carbon content fabricated via spray drying and in situ carbonization. J. Alloys Compd. 2014, 604, 130–136. [Google Scholar] [CrossRef]
  96. Shi, Q.T.; Zhou, J.H.; Ullah, S.; Yang, X.Q.; Tokarska, K.; Trzebicka, B.; Ta, H.Q.; Rümmeli, M.H. A review of recent developments in Si/C composite materials for Li-ion batteries. Energy Storage Mater. 2021, 34, 735–754. [Google Scholar] [CrossRef]
  97. Ren, J.; Zhang, Y.; Li, J.; Tian, S.; Fei, T.; Li, H. Effects of deposition temperature and time on HfC nanowires synthesized by CVD on SiC-coated C/C composites. Ceram. Int. 2016, 42, 5623–5628. [Google Scholar] [CrossRef]
  98. Shukrullah, S.; Mohamed, N.; Shaharun, M.; Saheed, M.; Irshad, M. Effect of CVD process temperature on activation energy and structural growth of MWCNTs. Metall. Mater. Trans. A 2016, 47, 1413–1424. [Google Scholar] [CrossRef]
  99. Wang, W.; Kumta, P.N. Nanostructured Hybrid Silicon/Carbon Nanotube Heterostructures: Reversible High-Capacity Lithium-Ion Anodes. ACS Nano 2010, 4, 2233–2241. [Google Scholar] [CrossRef]
  100. Fu, K.; Xue, L.G.; Yildiz, O.; Li, S.L.; Lee, H.; Li, Y.; Xu, G.J.; Zhou, L.; Bradford, P.D.; Zhang, X.W. Effect of CVD carbon coatings on Si@CNF composite as anode for lithium-ion batteries. Nano Energy 2013, 2, 976–986. [Google Scholar] [CrossRef]
  101. Jin, H.C.; Sun, Q.; Wang, J.T.; Ma, C.; Ling, L.C.; Qiao, W.M. Preparation and electrochemical properties of novel silicon-carbon composite anode materials with a core-shell structure. New Carbon Mater. 2021, 36, 390–398. [Google Scholar] [CrossRef]
  102. Liu, B.; Huang, P.; Xie, Z.Y.; Huang, Q.Z. Large-Scale Production of a Silicon Nanowire/Graphite Composites Anode via the CVD Method for High-Performance Lithium-Ion Batteries. Energy Fuels 2021, 35, 2758–2765. [Google Scholar] [CrossRef]
  103. Yu, J.L.; Yang, J.; Feng, X.J.; Jia, H.; Wang, J.L.; Lu, W. Uniform Carbon Coating on Silicon Nanoparticles by Dynamic CVD Process for Electrochemical Lithium Storage. Ind. Eng. Chem. Res. 2014, 53, 12697–12704. [Google Scholar] [CrossRef]
  104. Chen, W.L.; Dave, R.N.; Pfeffer, R.; Walton, O. Numerical simulation of Mechanofusion system. Powder Technol. 2004, 146, 121–136. [Google Scholar] [CrossRef]
  105. Alonso, M.; Satoh, M.; Miyanami, K. Mechanism of the combined coating-mechanofusion processing of powders. Powder Technol. 1989, 59, 45–52. [Google Scholar] [CrossRef]
  106. Tubtimkuna, S.; Danilov, D.L.; Sawangphruk, M.; Notten, P.H.L. Review of the Scalable Core-Shell Synthesis Methods: The Improvements of Li-Ion Battery Electrochemistry and Cycling Stability. Small Methods 2023, 7, e2300345. [Google Scholar] [CrossRef]
  107. Kim, S.J.; Ha, S.J.; Lee, J.U.; Jeon, Y.P.; Hong, J.Y.; Bedia, J.; Vedyagin, A.A. Preparation of Silicon Oxide-Carbon Composite with Tailored Electrochemical Properties for Anode in Lithium-Ion Batteries. C-J. Carbon Res. 2023, 9, 114. [Google Scholar] [CrossRef]
  108. Cao, Y.D.; Hatchard, T.D.; Dunlap, R.A.; Obrovac, M.N. Mechanofusion-derived Si-alloy/graphite composite electrode materials for Li-ion batteries. J. Mater. Chem. A 2019, 7, 8335–8343. [Google Scholar] [CrossRef]
  109. Jiang, H.R.; Salehabadi, M.; Yasmin, S.; Wang, J.; Obrovac, M.N. Nano-Si Filled Graphite Anode Particles by Mechanofusion. J. Electrochem. Soc. 2023, 170, 120511. [Google Scholar] [CrossRef]
  110. Wutthiprom, J.; Phattharasupakun, N.; Tomon, C.; Sawangphruk, M. Scalable solvent-free mechanofusion and magnesiothermic reduction processes for obtaining carbon nanospheres-encapsulated crystalline silicon anode for Li-ion batteries. Electrochim. Acta 2020, 352, 136457. [Google Scholar] [CrossRef]
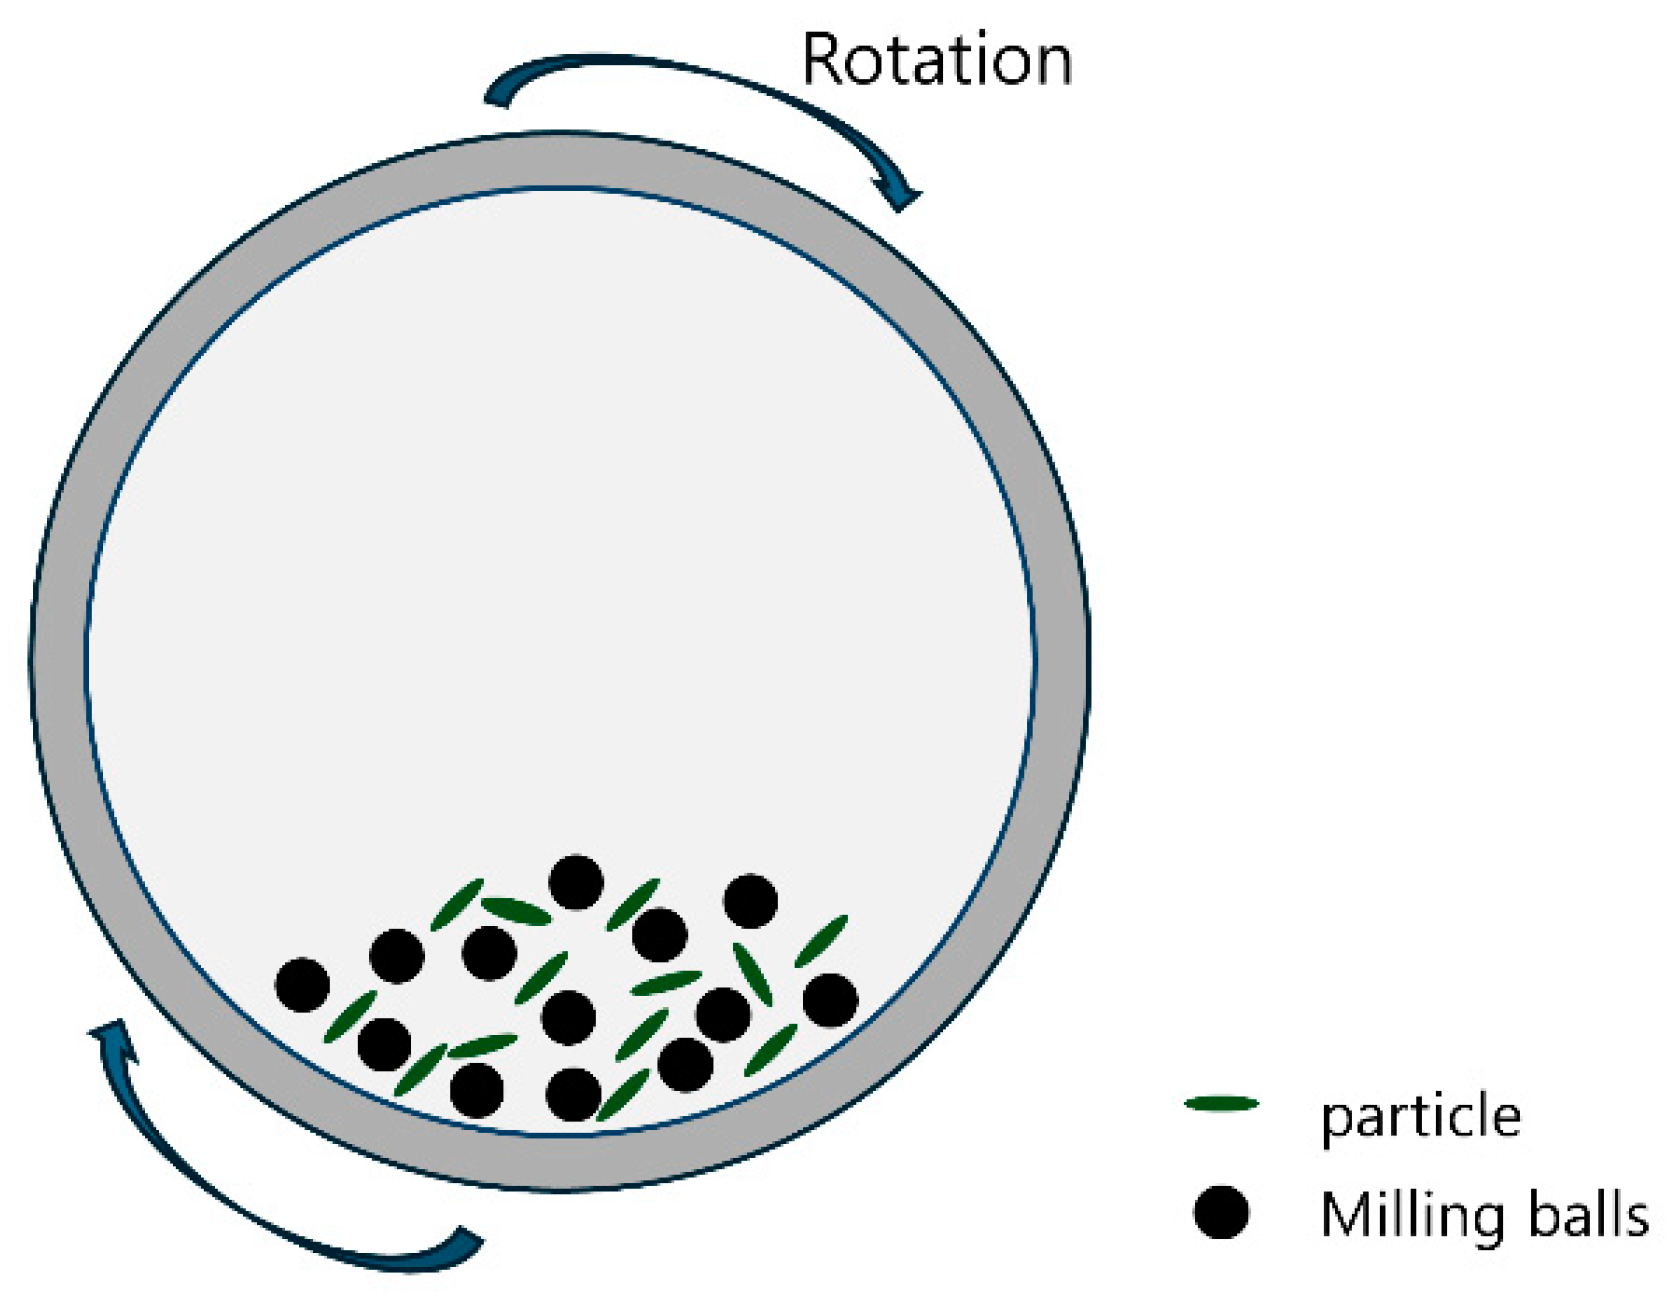
Figure 1. Schematic of the ball milling process.
Batteries 10 00381 g001
Figure 2. (a) Synthesis of Si/CNT; (b) cycle performance of Si/CNT [76] Reprinted with permission from Ref. [76]. Copyright © 2022 MDPI). (c) Ball milling of Si/C for (d) 2 h, (e) 5 h, (f) 8 h, and (g) 10 h [77] Reprinted with permission from Ref. [77]. Copyright © 2010 Elsevier. Pore distribution in (h) dry ball milling and (i) wet ball milling and SEM images of Si/C produced by (j) dry ball milling and (k) wet ball milling [78]. Reprinted with permission from Ref. [78]. Copyright © 2020 MDPI.
Batteries 10 00381 g002
Figure 3. Voltage profiles of (a) Silicon/graphite/multi-walled carbon nanotubes and (b) pure Si [79] Reprinted with permission from Ref. [79]. Copyright © 2006 Elsevier. (c) Cycle performance of silicon and silicon–carbon composites [80] Reprinted with permission from Ref. [80]. Copyright © 2023 Elsevier.
Batteries 10 00381 g003
Figure 4. Schematic of pyrolysis [81] Reprinted with permission from Ref. [75]. Copyright © 2021 MDPI.
Batteries 10 00381 g004
Figure 5. (a) Schematic of the manufacturing process of Si/C-CNF by pyrolysis. (b) Cycle performance of Si/C-CNF and CNF. (c) C-rate capability of Si/CNFs and Si/C-CNFs [84] Reprinted with permission from Ref. [84]. Copyright © 2015 Elsevier. (d) TEM of Si/C. (eg) HRTEM of Si/C. (h) Voltage profile at a current density of 100 mA/g. (i) Cycle performance of the Si/C composite [87] Reprinted with permission from Ref. [87]. Copyright © 2013 Elsevier.
Batteries 10 00381 g005
Figure 6. Cyclic voltammetry curves of (a) pure Si and (b) Si/C composite. Voltage profiles of (c) pure Si and (d) Si/C composite in 1, 2, 5, 10 and 50 cycles. [88] Reprinted with permission from Ref. [88]. Copyright © 2013 Elsevier.
Batteries 10 00381 g006
Figure 7. (a) Schematic of the spray drying process [90] Reprinted with permission from Ref. [90]. Copyright © 2015 Elsevier. (b) TEM of the Si@C@RGO composite. (c) Schematic of the Si@C@RGO composite, (d) cycle performance of the composites and pure Si, and (e) C-rate capability of the composites [91] Reprinted with permission from Ref. [91]. Copyright © 2017 Elsevier.
Batteries 10 00381 g007
Figure 8. (a) Voltage profile and (b) cycle performance of graphite@silicon@carbon [92] Reprinted with permission from Ref. [92]. Copyright © 2012 Elsevier. (c) Voltage profile and (d) cycle performance of silicon@graphene [93] Reprinted with permission from Ref. [93]. Copyright © 2019 Elsevier. (e) Cycle test of pure-Si and Si/C [94] Reprinted with permission from Ref. [94]. Copyright © 2015 Elsevier. (f) Voltage profile of Si/C [95] Reprinted with permission from Ref. [95]. Copyright © 2014 Elsevier.
Batteries 10 00381 g008
Figure 9. Schematic of the chemical vapor deposition process.
Batteries 10 00381 g009
Figure 10. (a) Schematic of Si/C composite produced using CVD. (b) Cycle performance of Si/CNT, (c) C-rate capability of Si/CNT [99] Reprinted with permission from Ref. [99]. Copyright © 2010 ACS Publications. (df) TEM images of composites CVD-treated for 30, 60, and 90 min [100] Reprinted with permission from Ref. [100]. Copyright © 2013 Elsevier. (g) Voltage profile of the pSi-CNF composite and its (h) cycle performance [101] Reprinted with permission from Ref. [101]. Copyright © 2021 Elsevier.
Batteries 10 00381 g010
Figure 11. (a) CVD deposition process of SiNW@GM [102] Reprinted with permission from Ref. [102]. Copyright © 2021 ACS Publications. (b) SEM image of Si@C-2 composite and (c) cycle performance and CE of Si@C composite and pure Si [103] Reprinted with permission from Ref. [103]. Copyright © 2014 ACS Publications.
Batteries 10 00381 g011
Figure 12. Configuration and process of mechanofusion [106] Reprinted with permission from Ref. [106]. Copyright © 2023 Wiley-VCH.
Batteries 10 00381 g012
Figure 13. (a) Si@C manufacturing process by mechanofusion, (b) cycle performance of SiOx@C composite [107] Reprinted with permission from Ref. [107]. Copyright © 2023 MDPI. (cf) SEM images of composite treated with CVD for 1, 2, 3, and 5 h [109] Reprinted with permission from Ref. [109]. Copyright © 2023 iopscience. (g) C-rate performance of Si@C and Si, (h) cycle performance and CE [110] Reprinted with permission from Ref. [110]. Copyright © 2020 Elsevier.
Batteries 10 00381 g013aBatteries 10 00381 g013b
Table 1. Comparison of the advantages, disadvantages, and ICE of different processes.
Synthesis MethodAdvantagesDisadvantagesMaterialsCapacityRef.
Ball millingLarge-scale productionNon-uniform particlesSi/CNT1760 mAh/g after 100 cycles[76]
PyrolysisHigh yieldHigh energySi/C1555 mAh/g after 100 cycles[86]
Spray DryingSpherical particle, simple processBulky equipmentSi/C1041 mAh/g after 50 cycles[91]
CVDUniform particle, various particle designExpensive processpSi-CNF848 mAh/g after 100 cycles[101]
MechanofusionSpherical particleExpensive processSi/C600 mAh/g after 1000 cycles[109]
Disclaimer/Publisher’s Note: The statements, opinions and data contained in all publications are solely those of the individual author(s) and contributor(s) and not of MDPI and/or the editor(s). MDPI and/or the editor(s) disclaim responsibility for any injury to people or property resulting from any ideas, methods, instructions or products referred to in the content.