
Aging Mechanism of Mn-Based Prussian Blue Cathode Material by Synchrotron 2D X-ray Fluorescence

 , , and
Abstract

1. Introduction
2. Materials and Methods
2.1. Synthesis
2.2. Electrode Preparation
2.3. 2D-XRF and XANES Setup
2.4. PXRD Setup
3. Results and Discussion
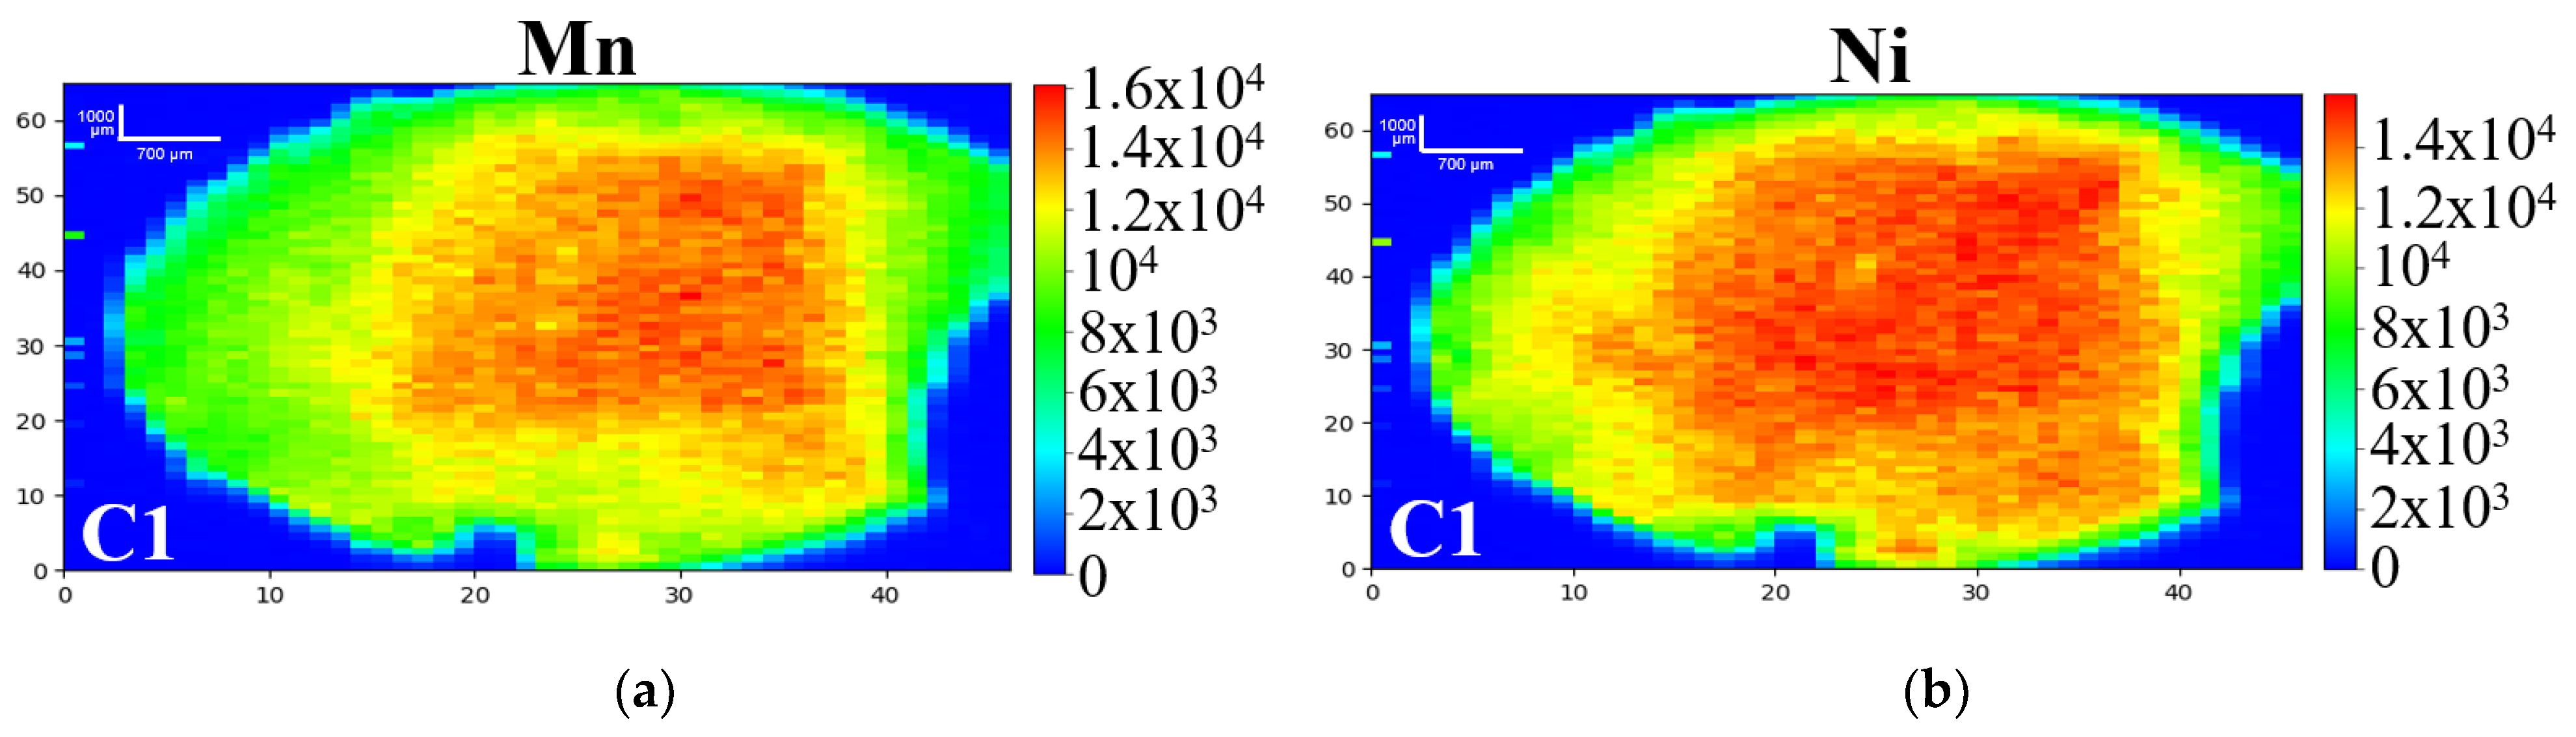
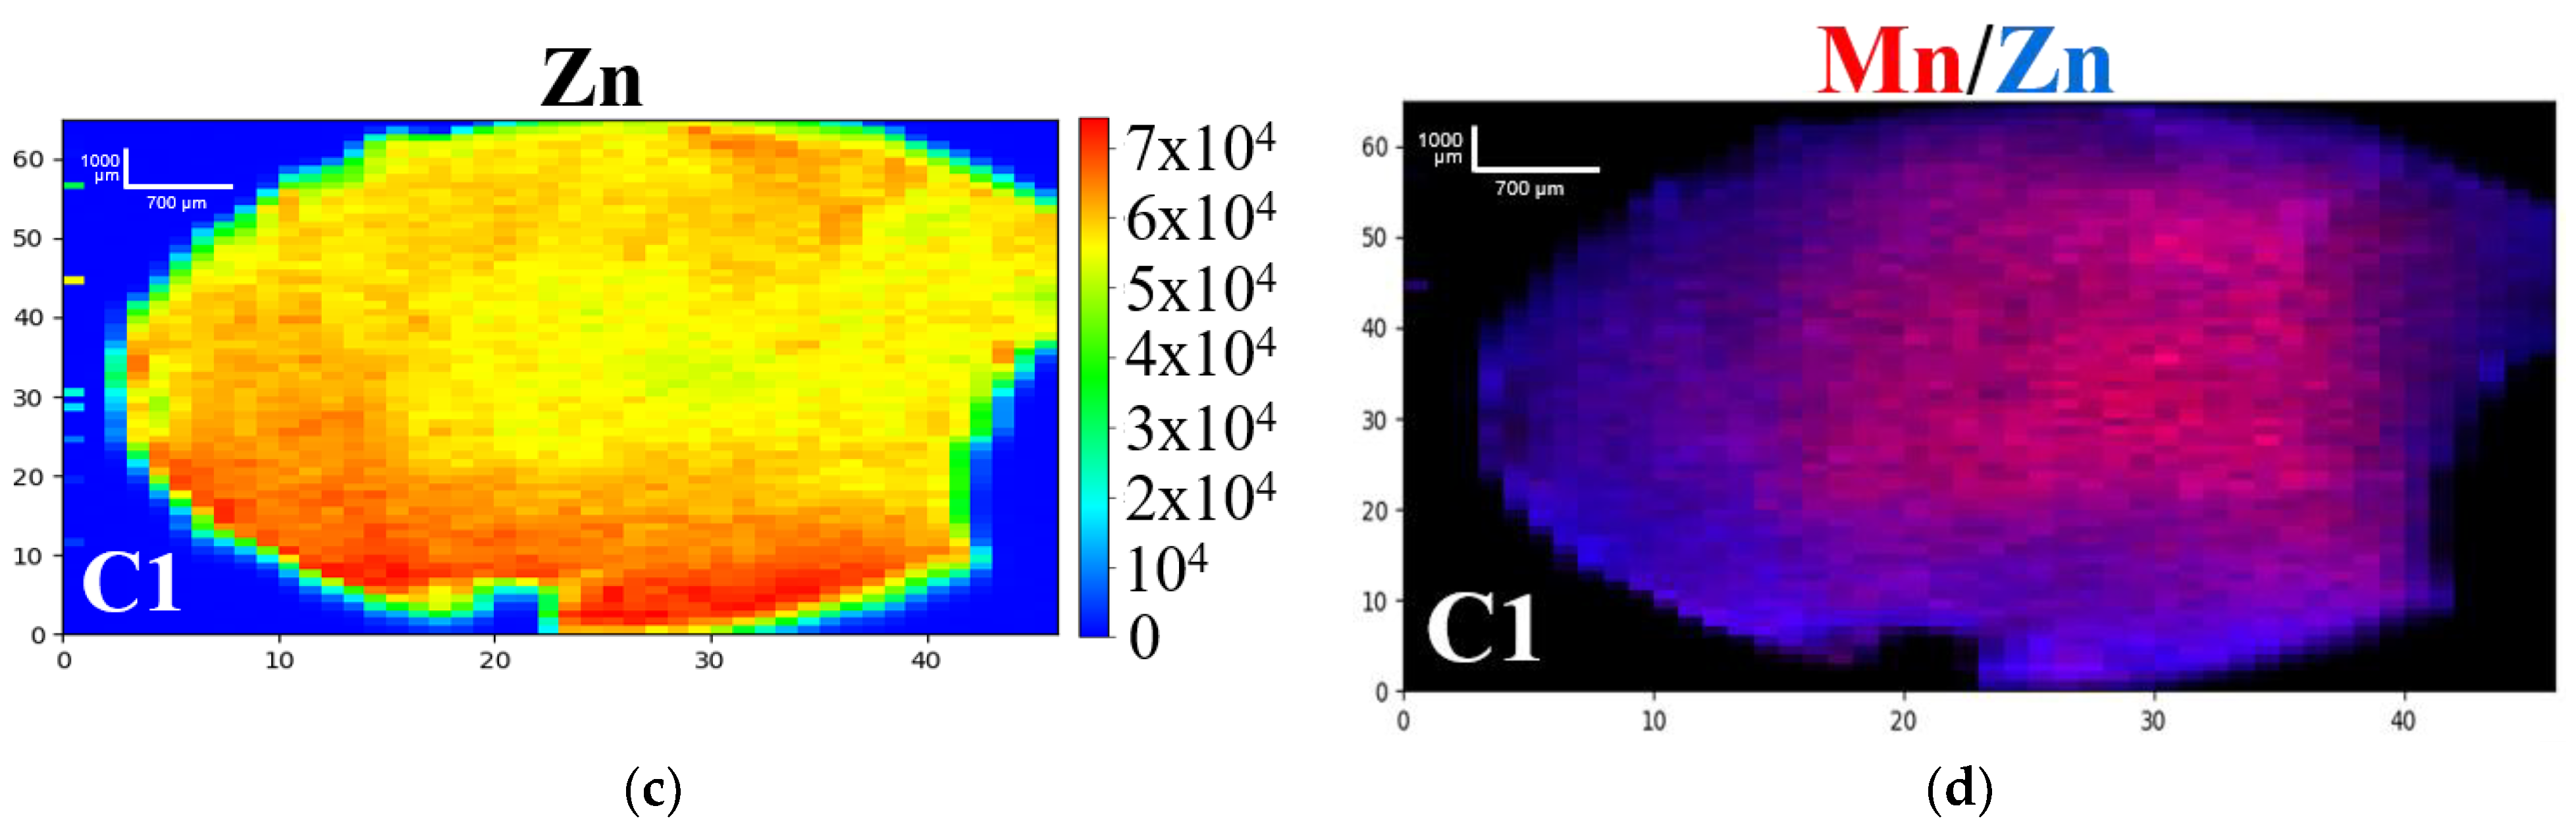
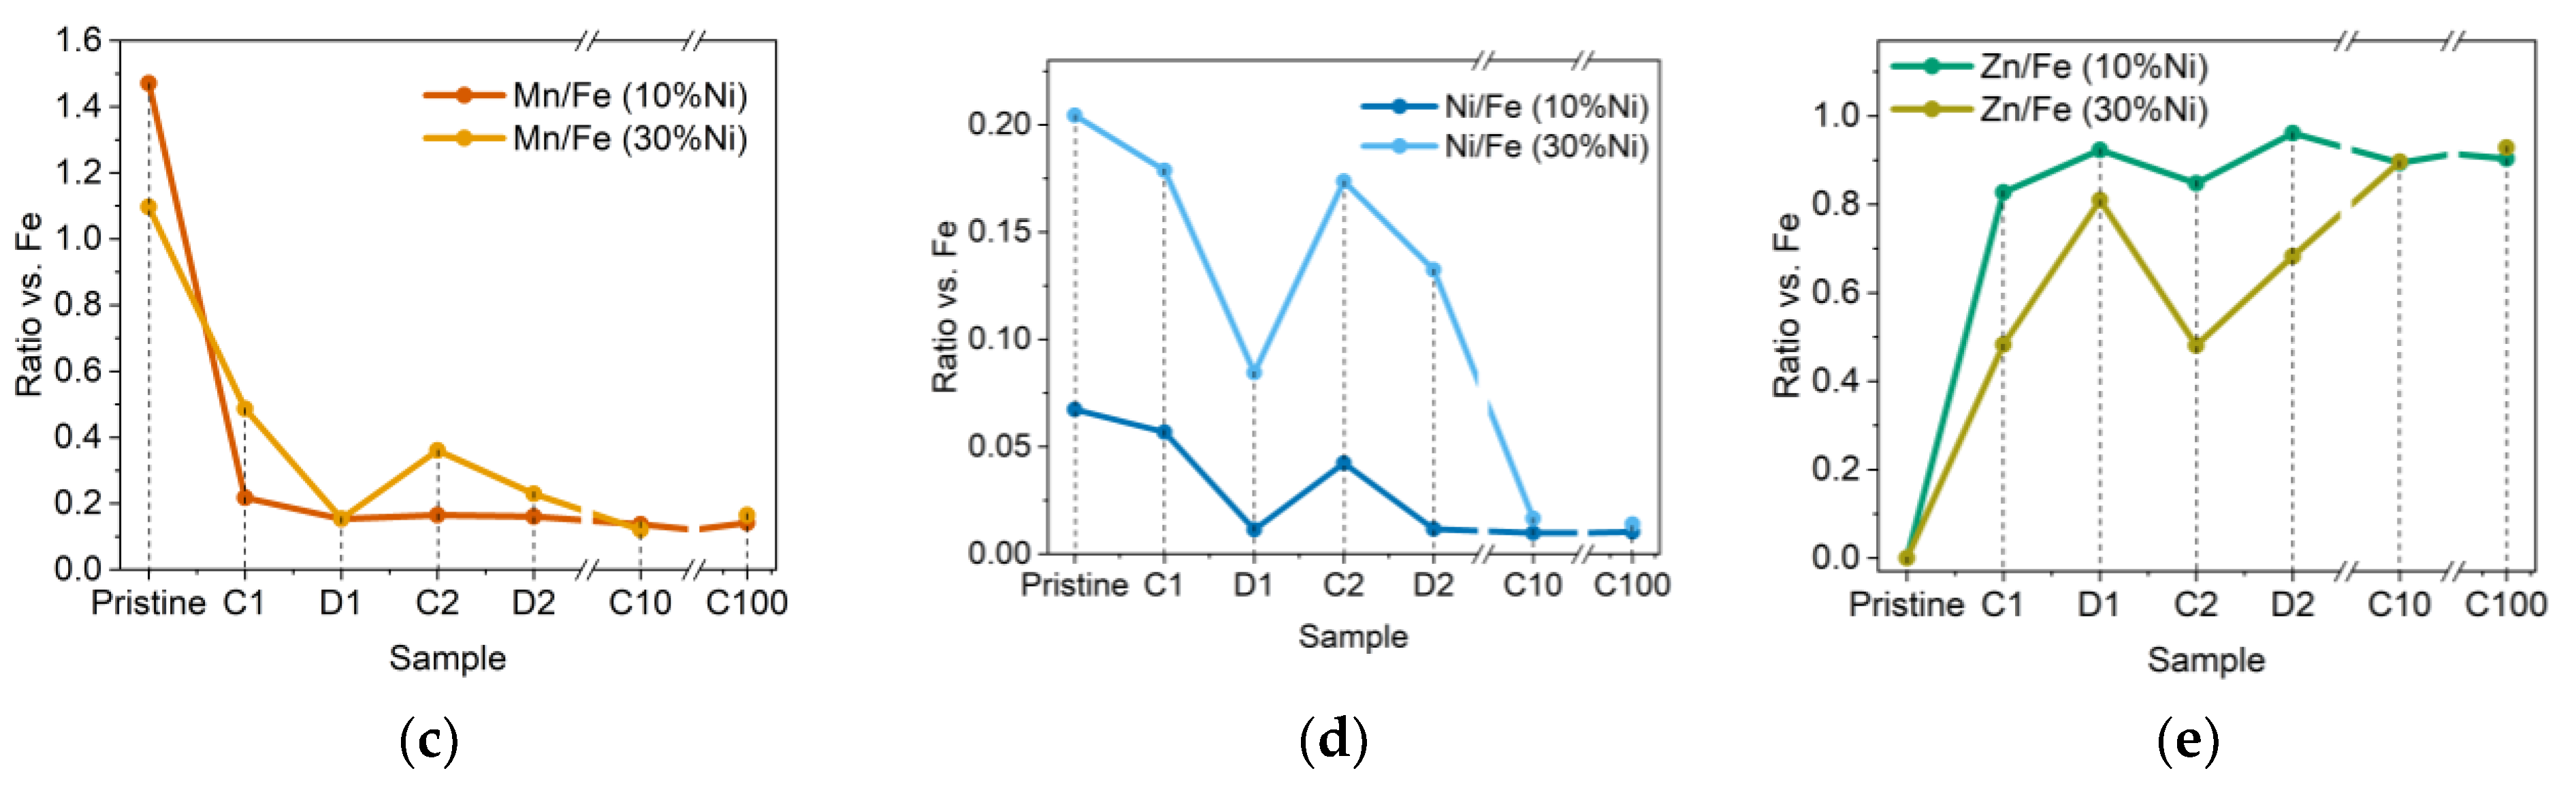
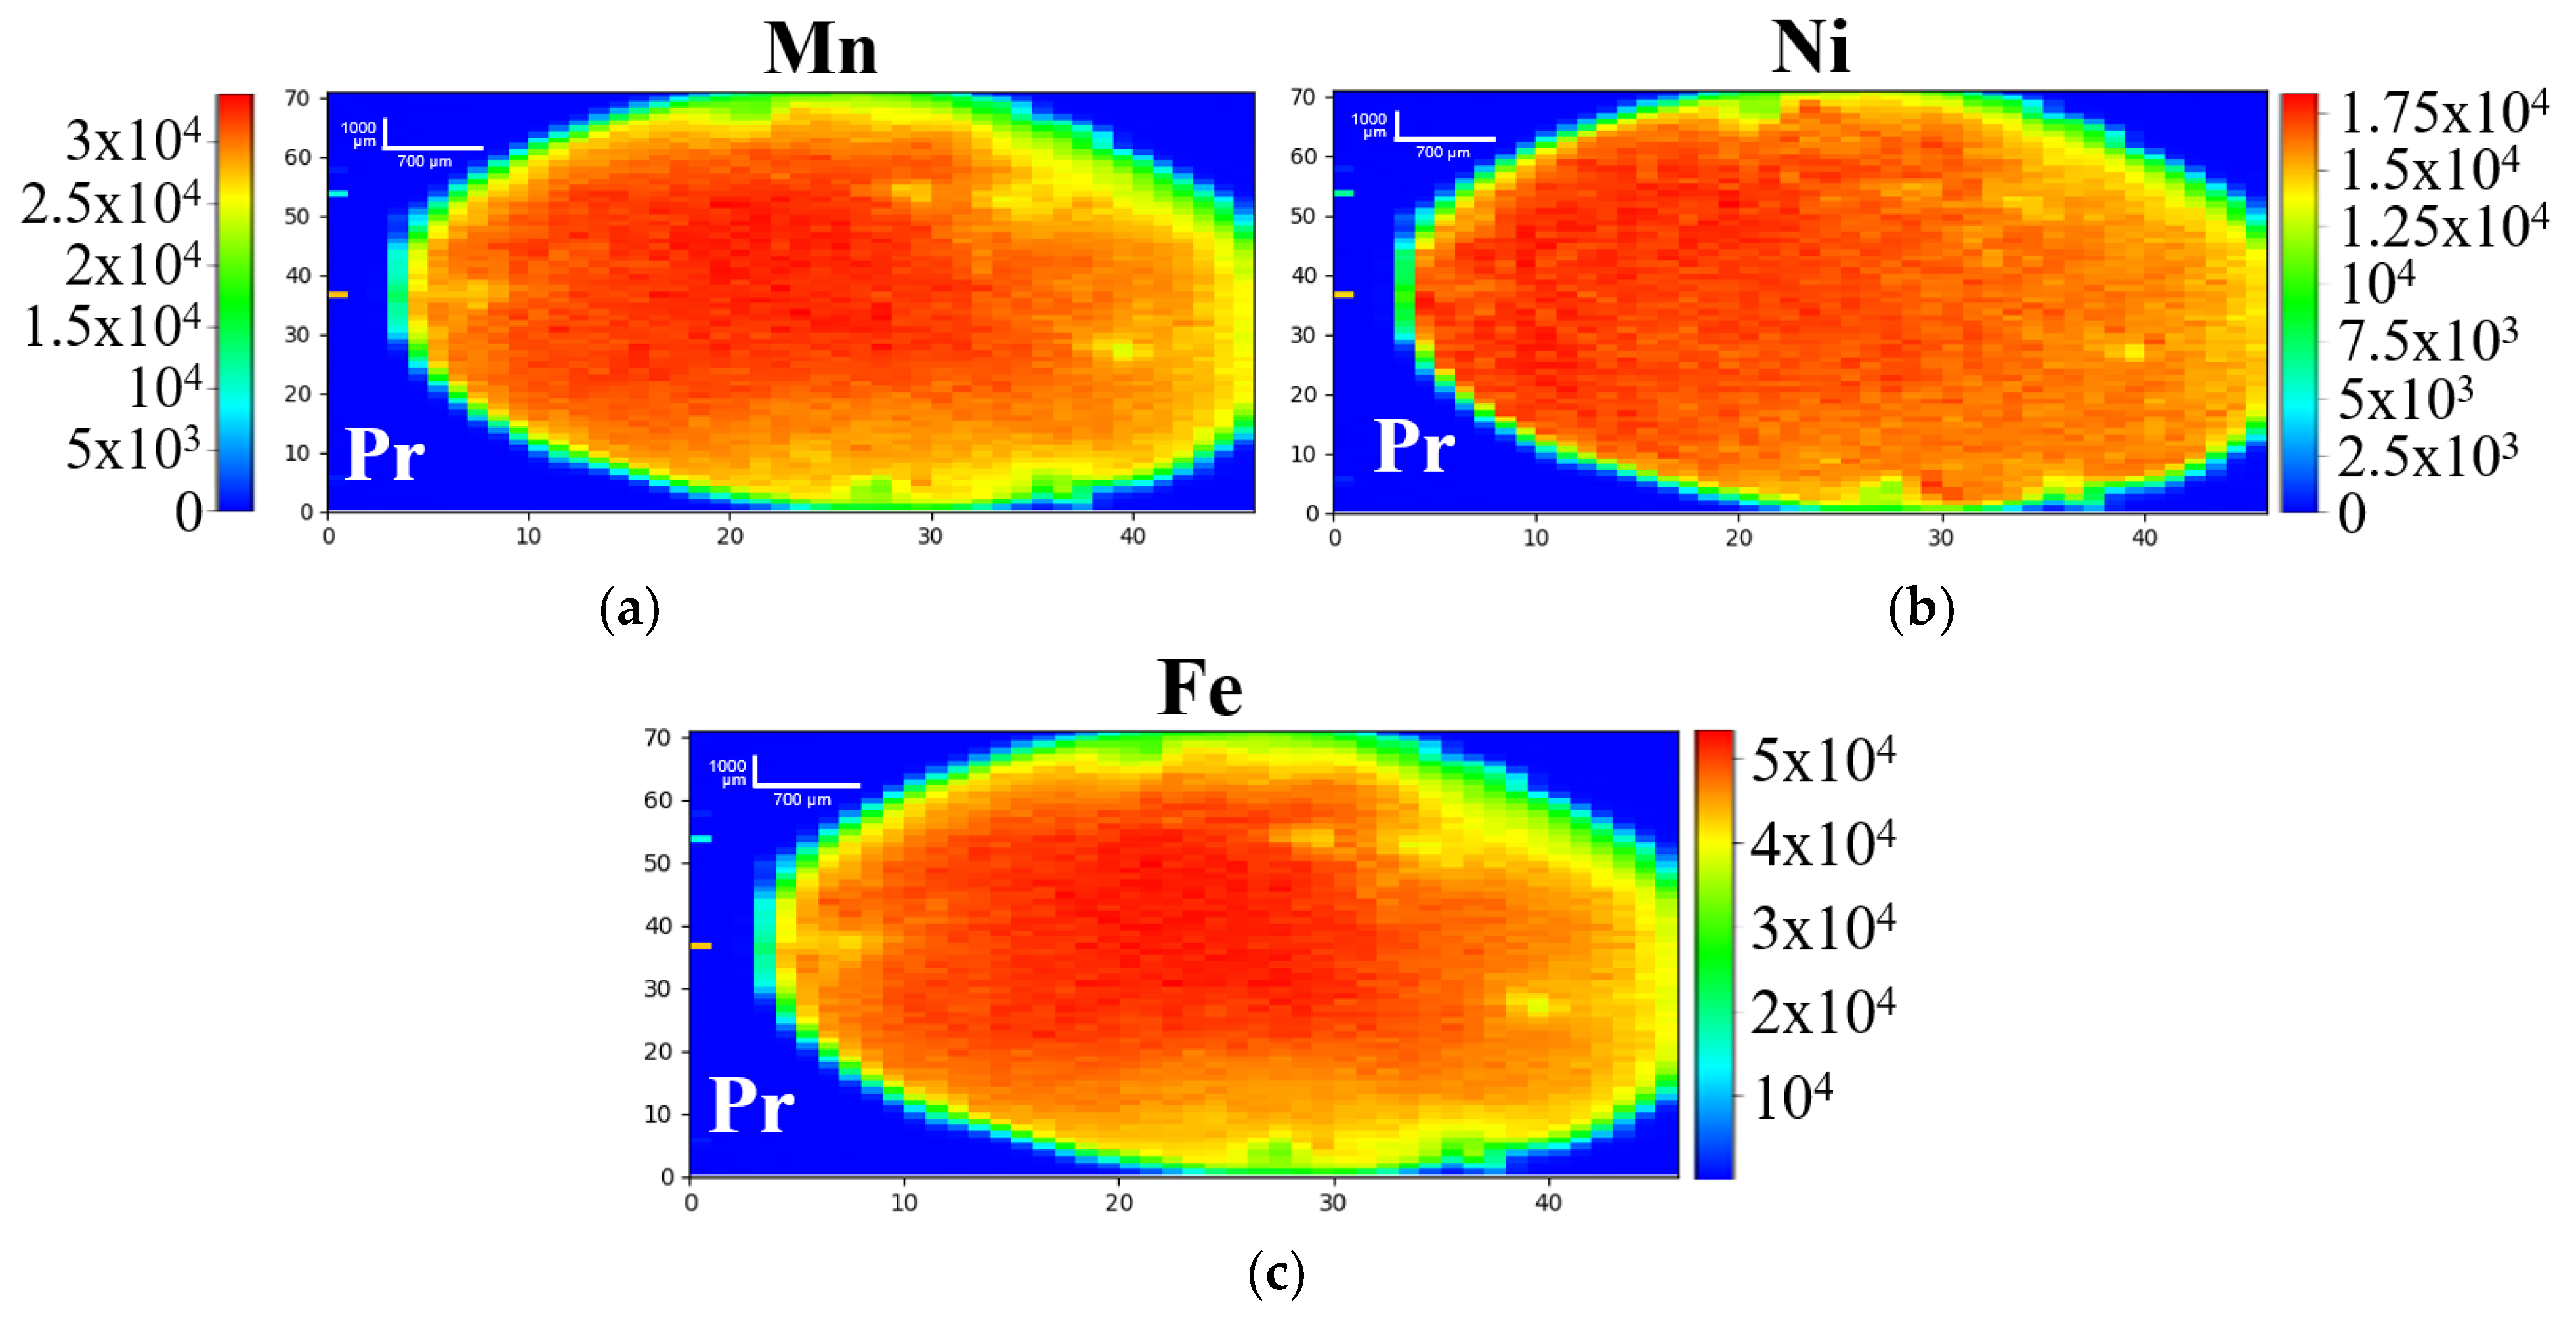
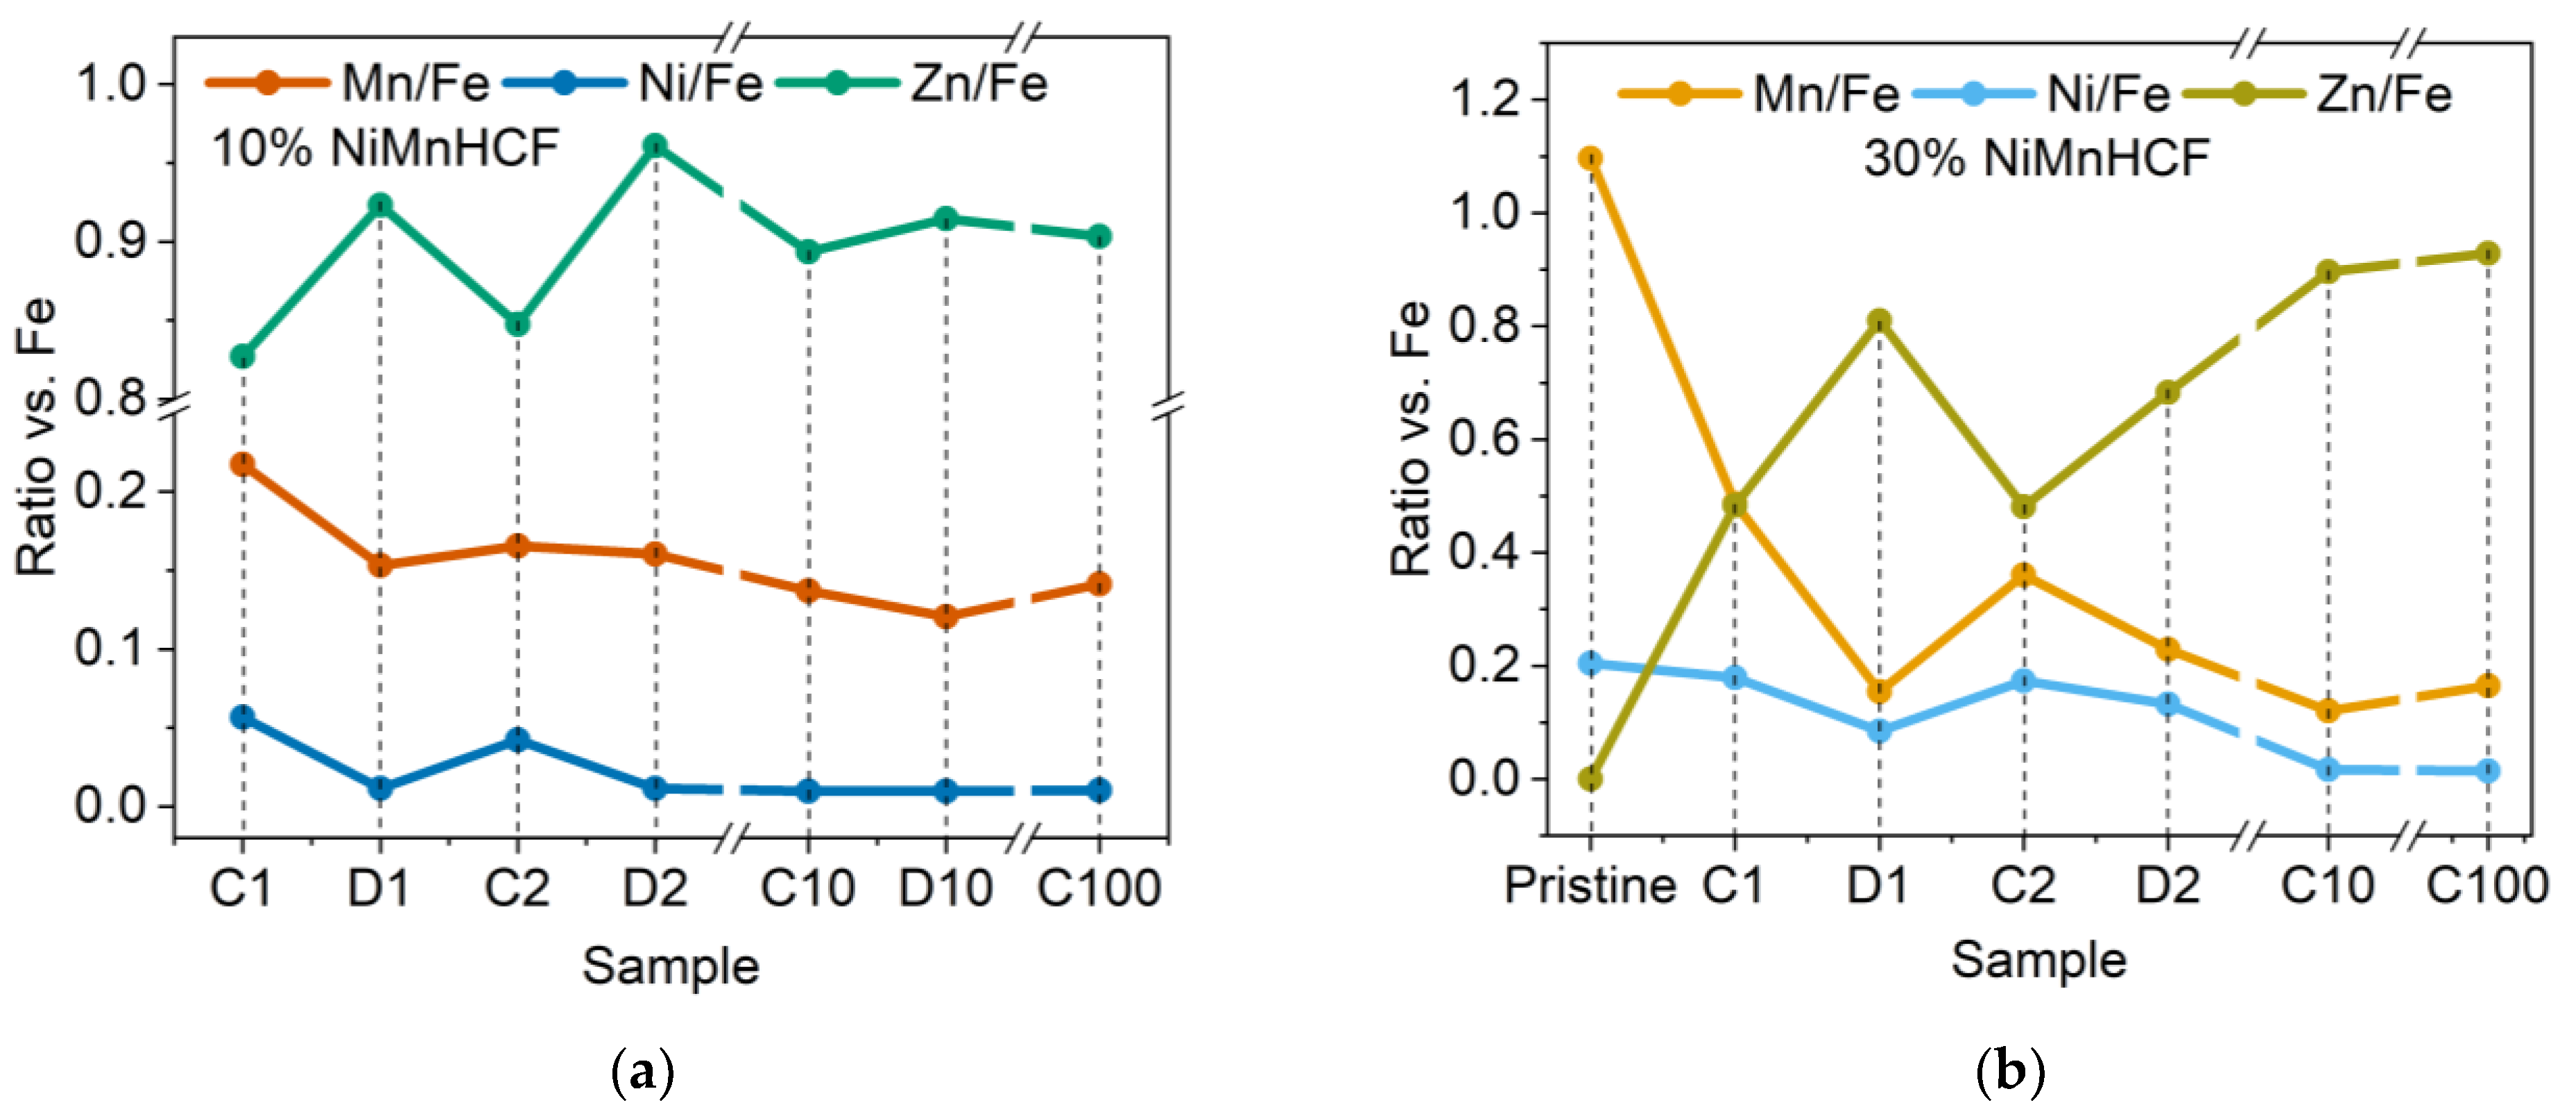
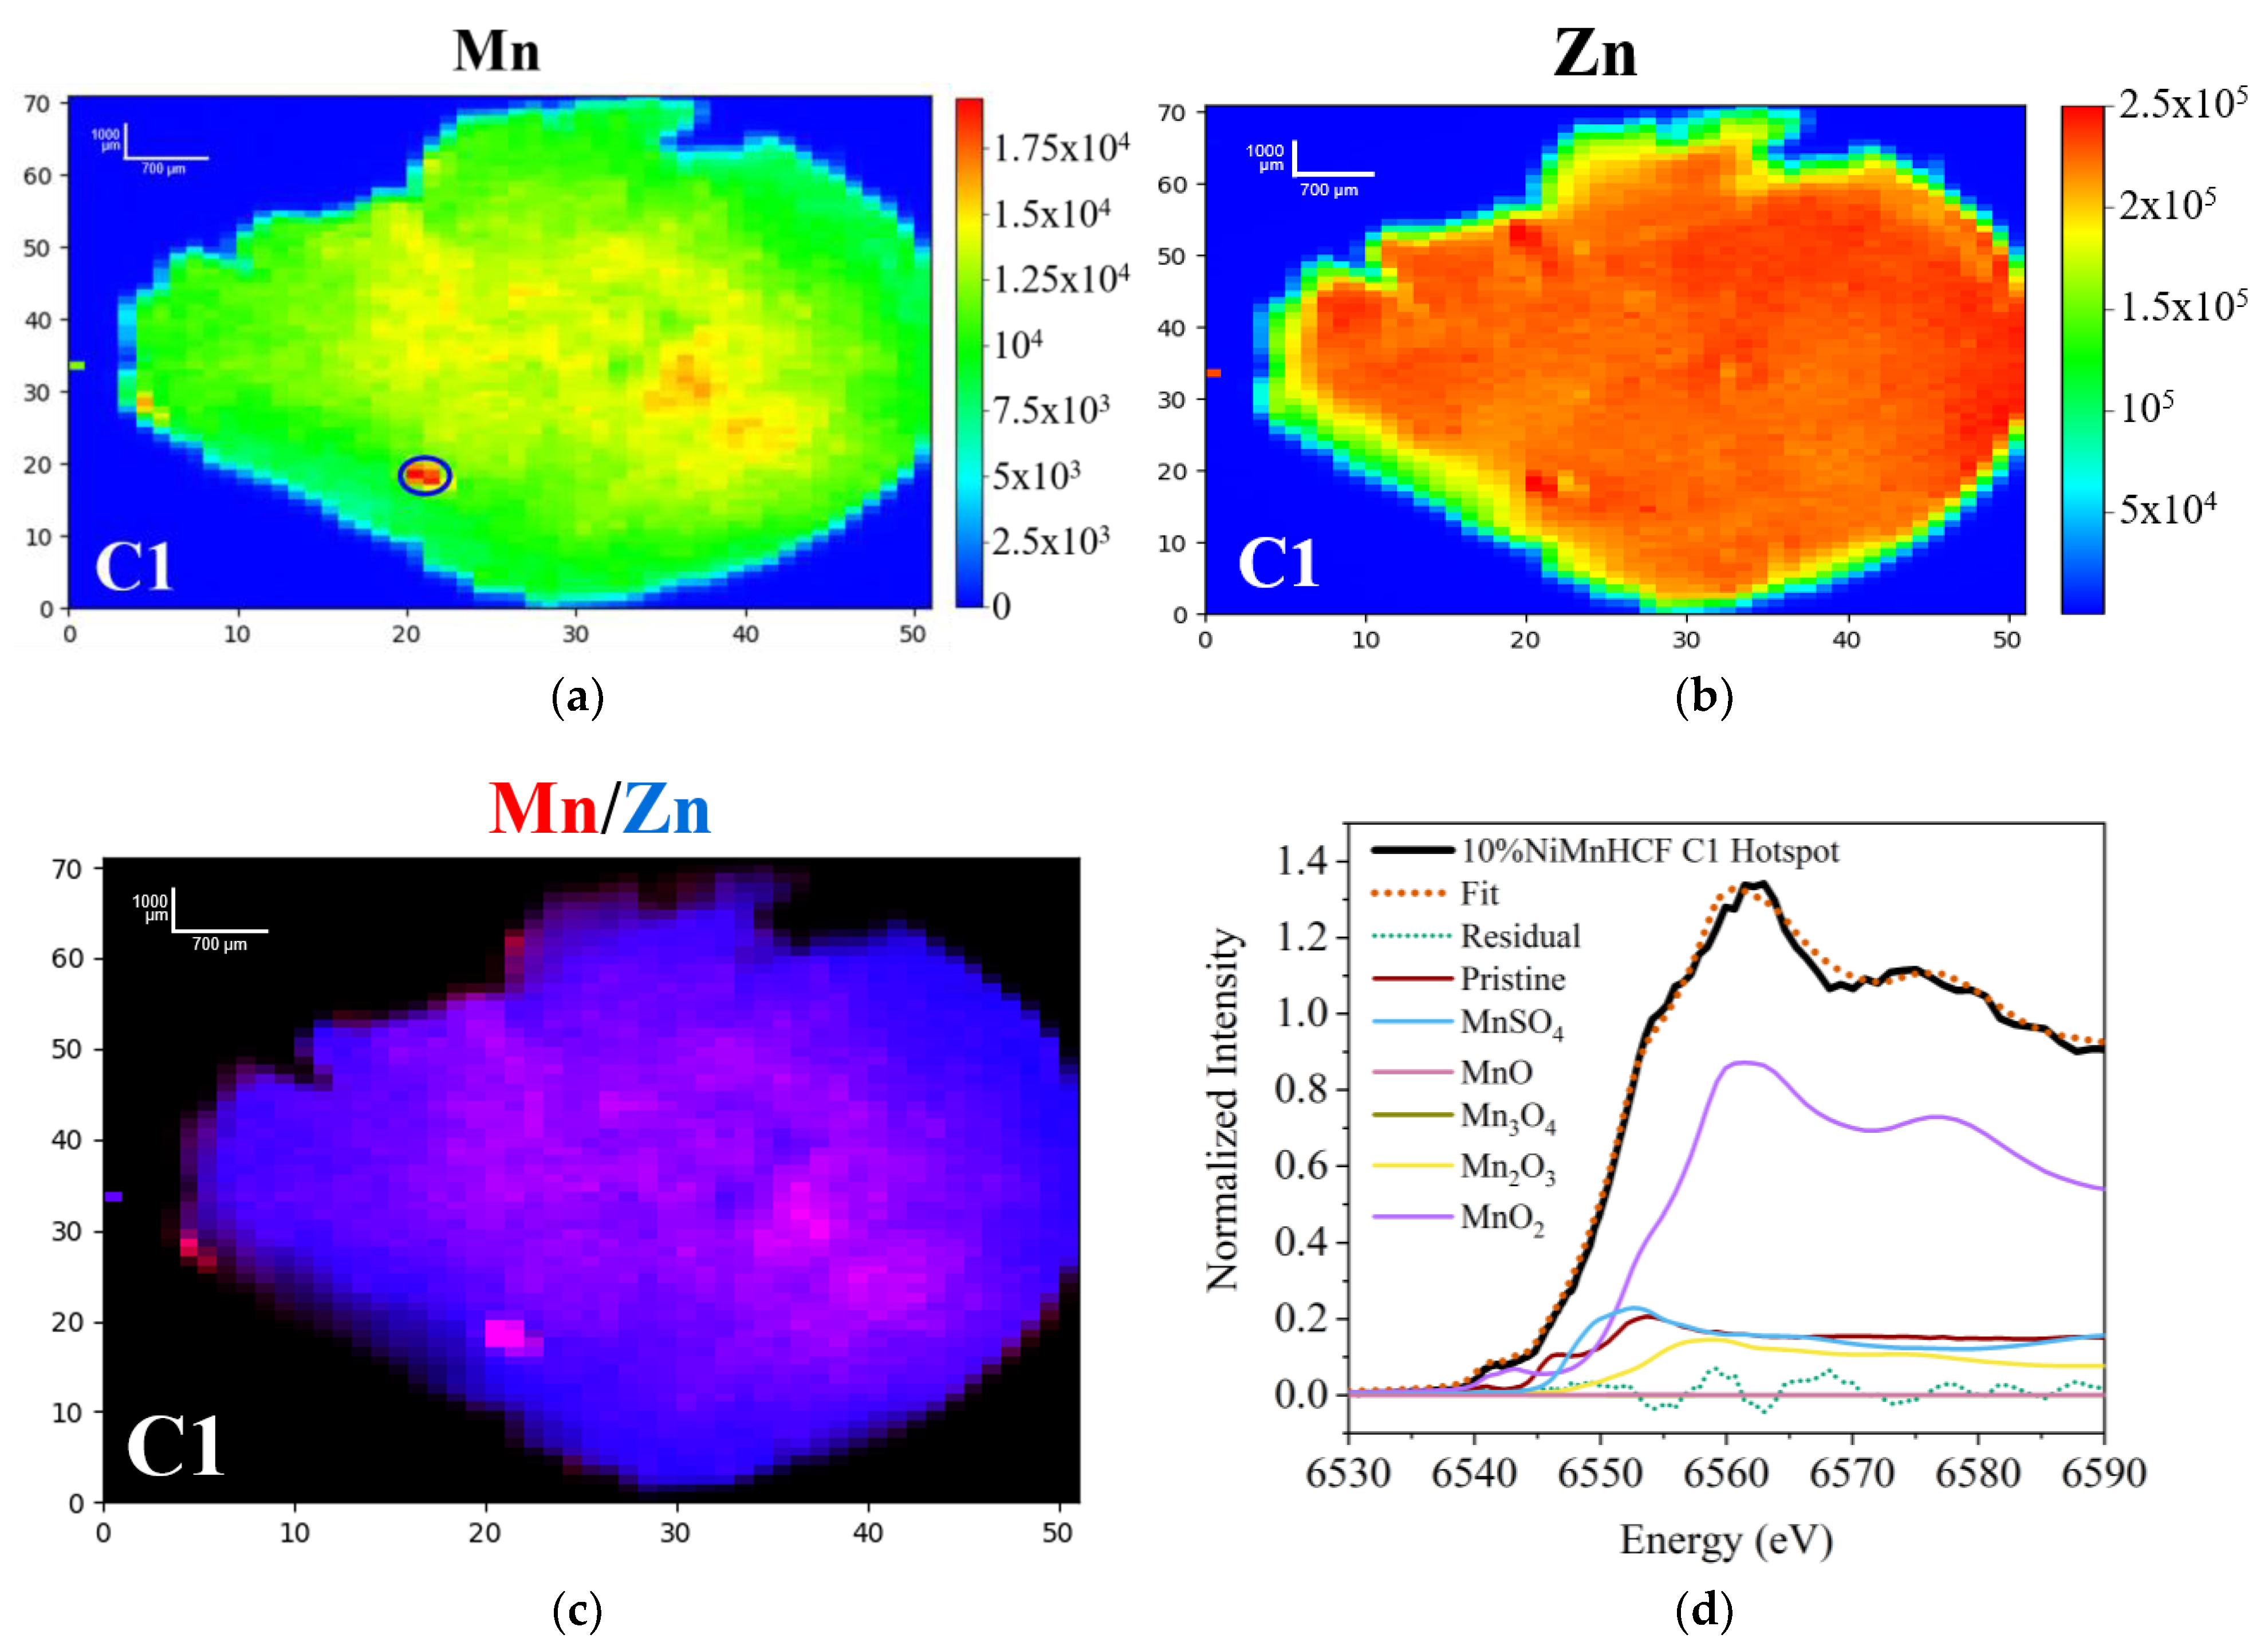
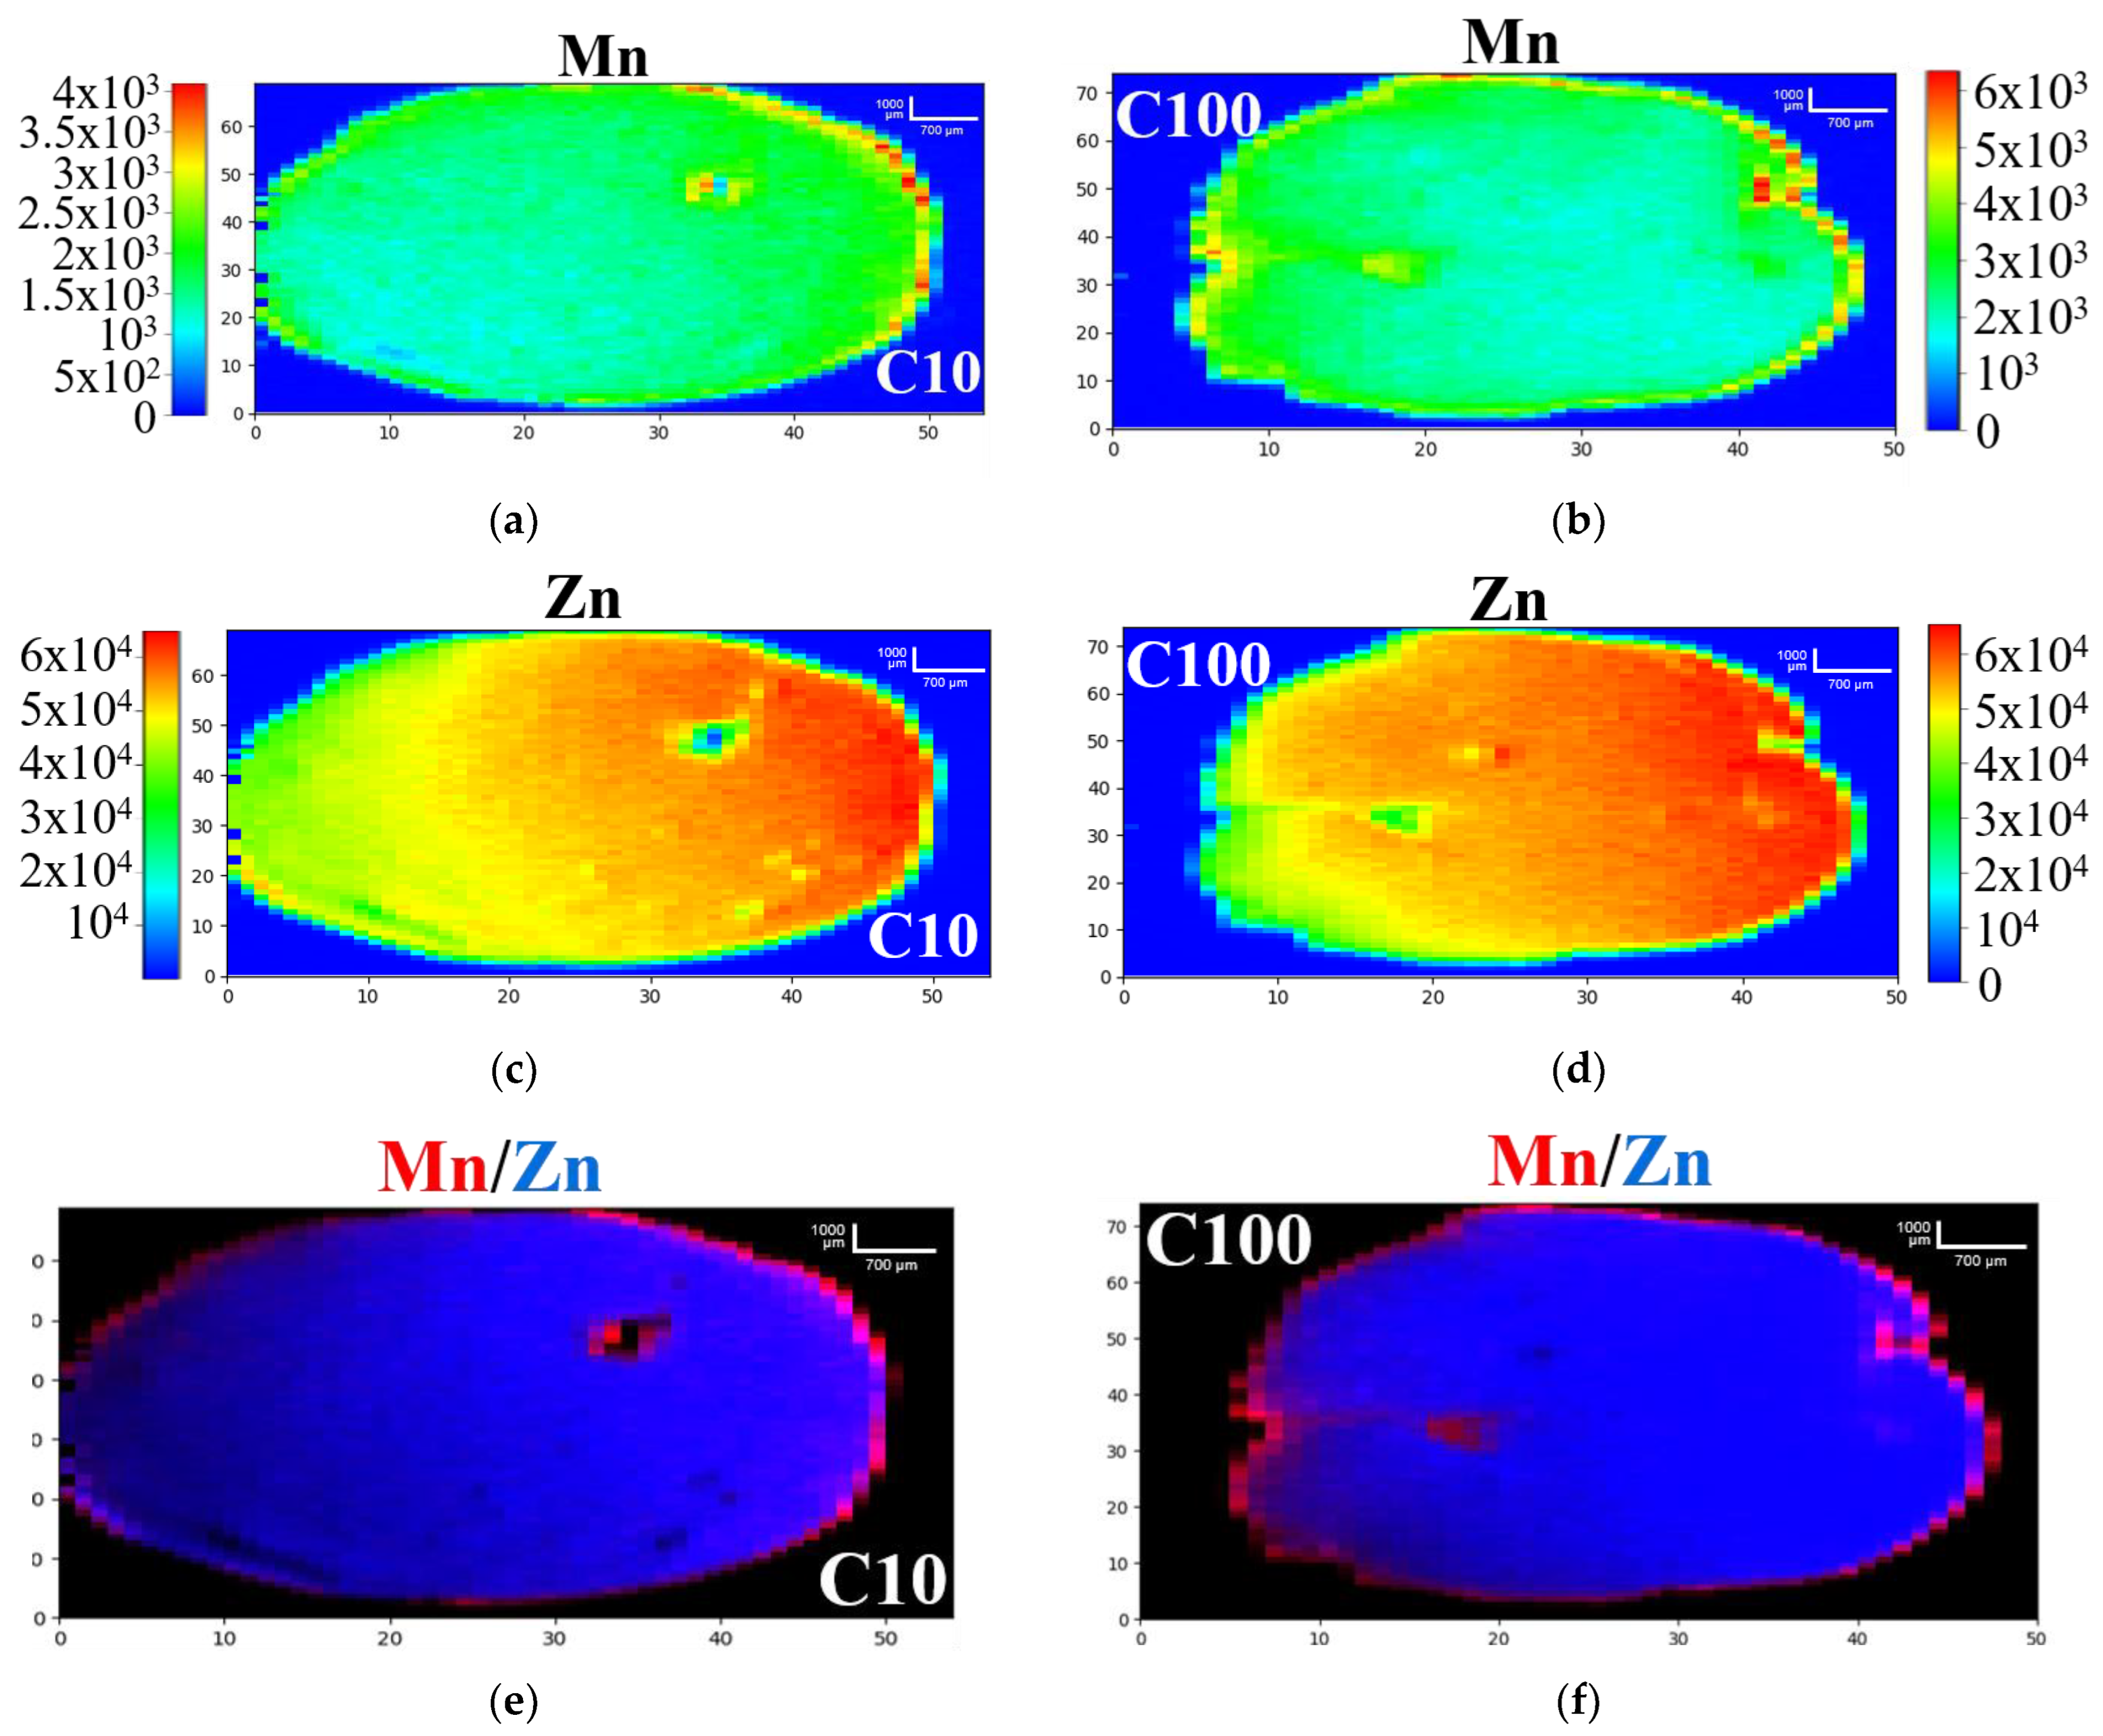
3.1. 2D-XRF and Micro-XANES Analysis
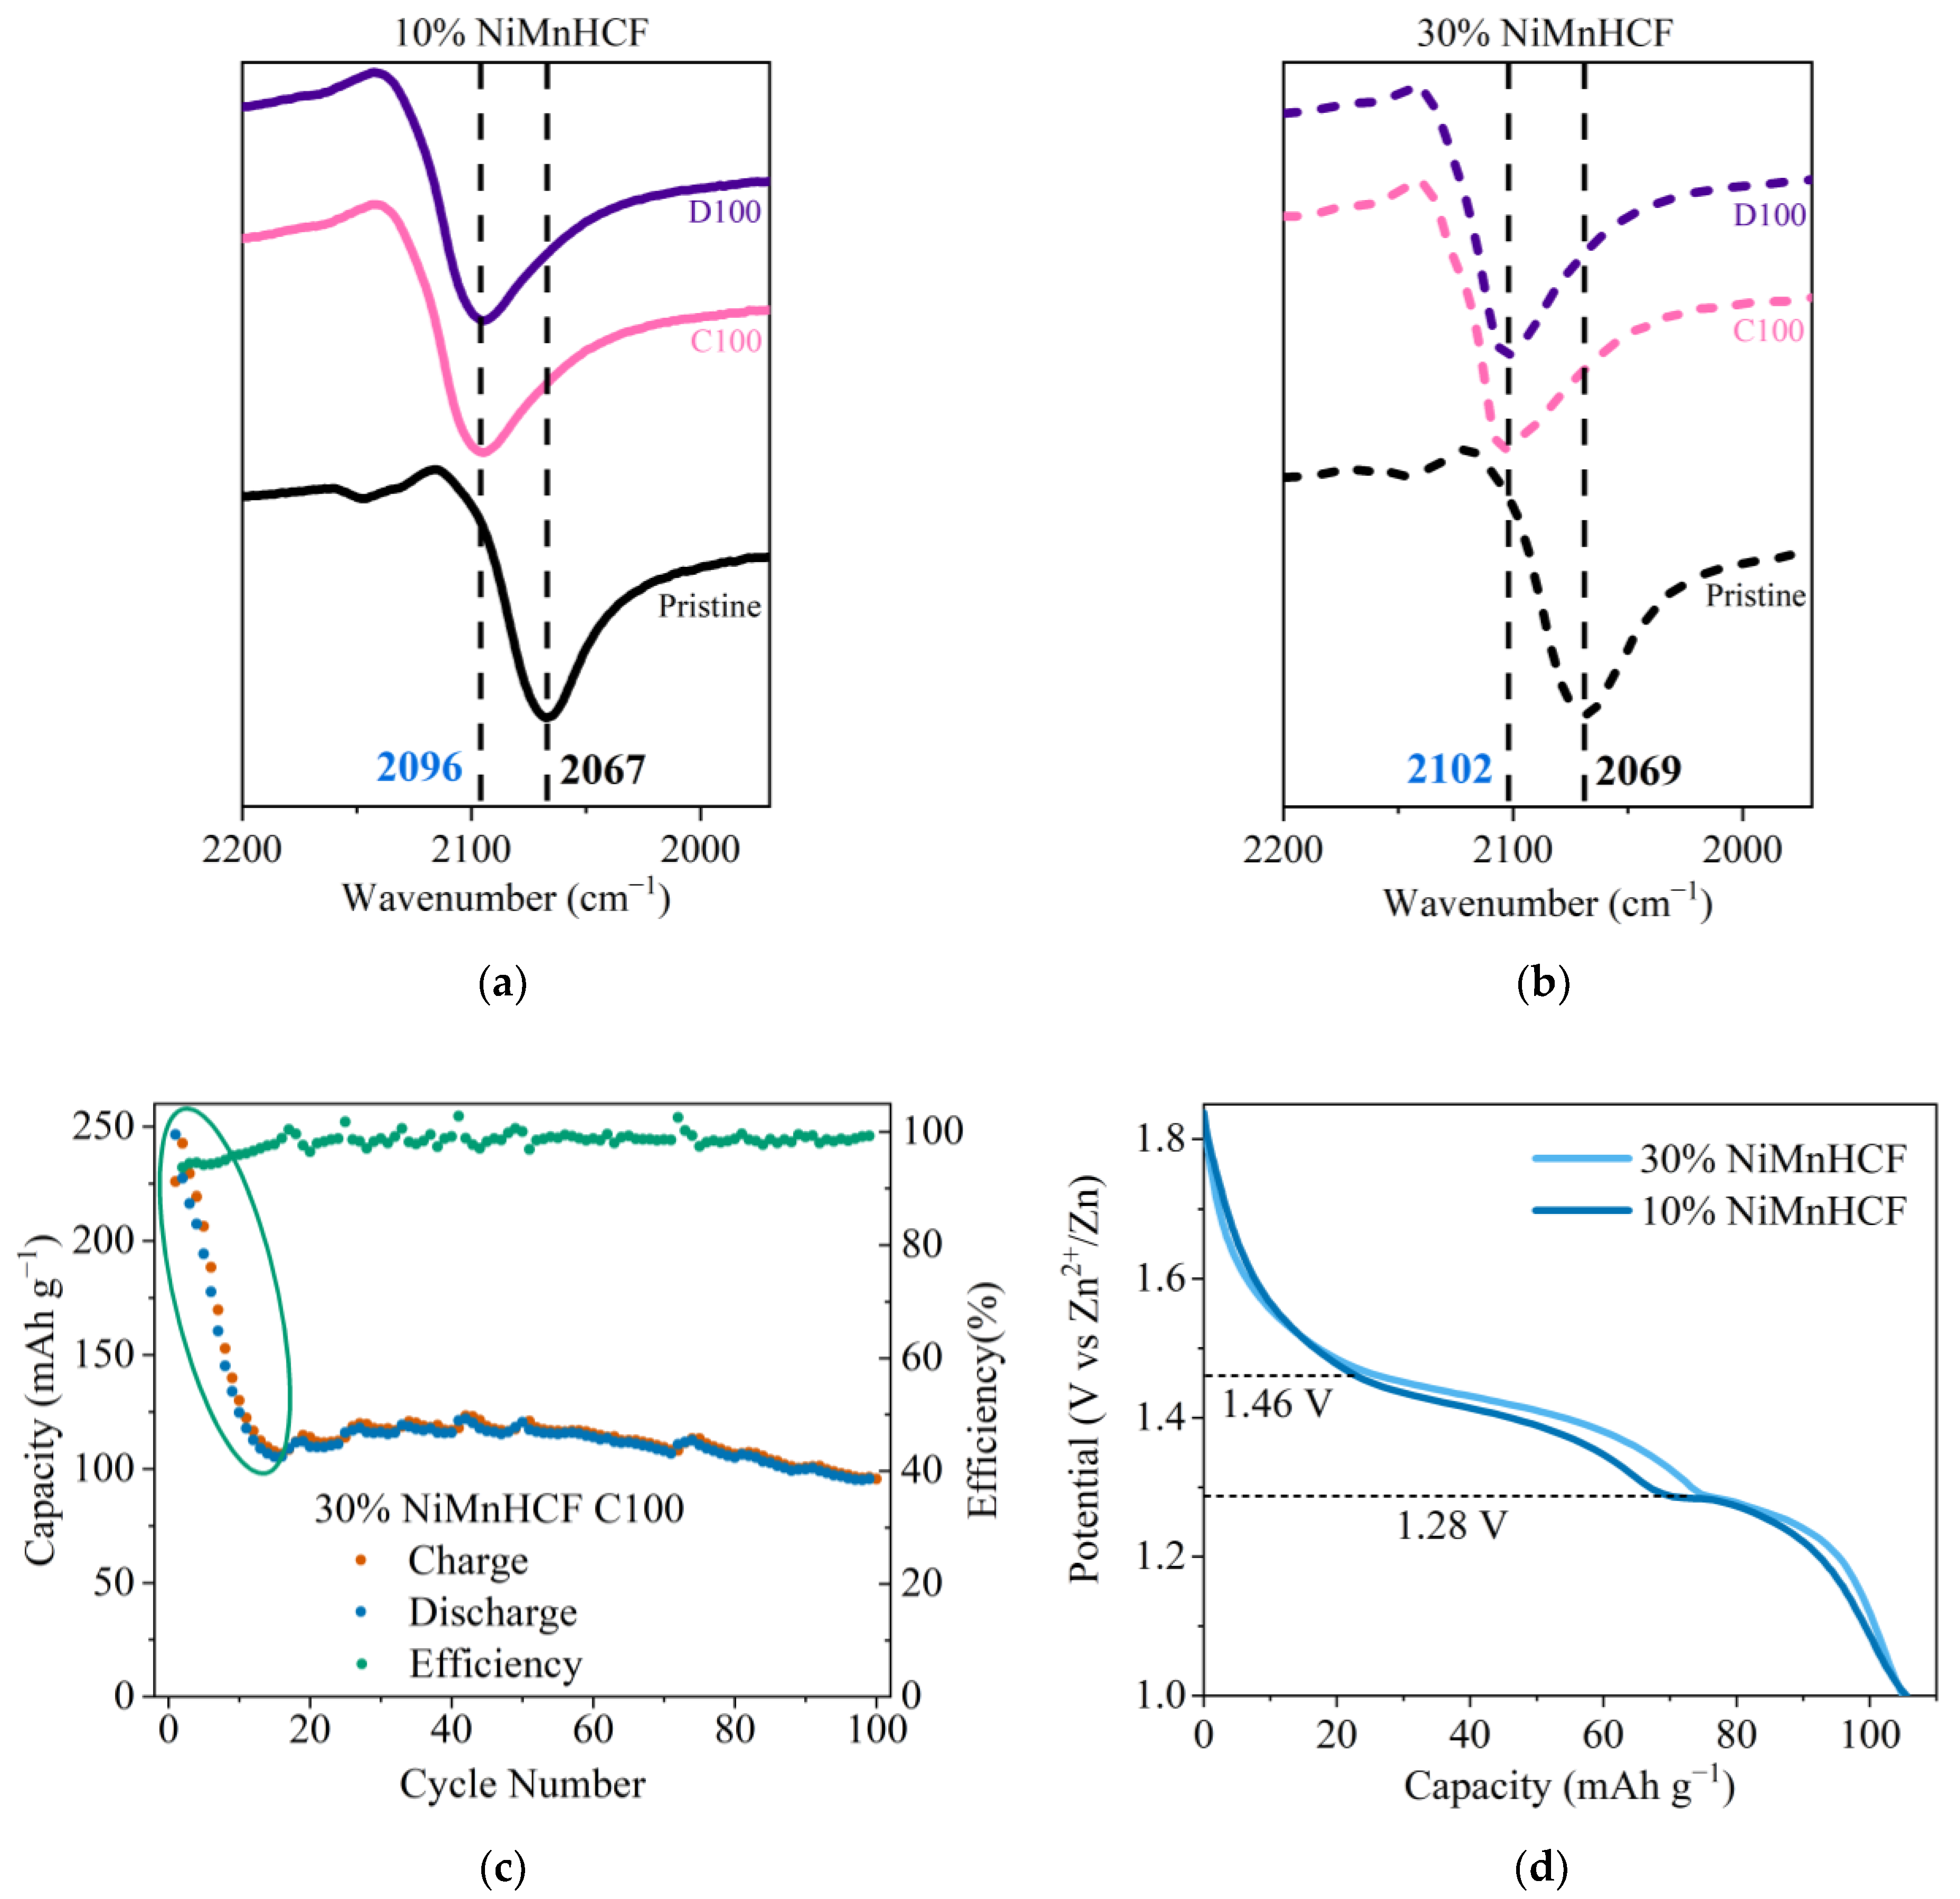
3.2. IR Analysis
3.3. GCPL Analysis
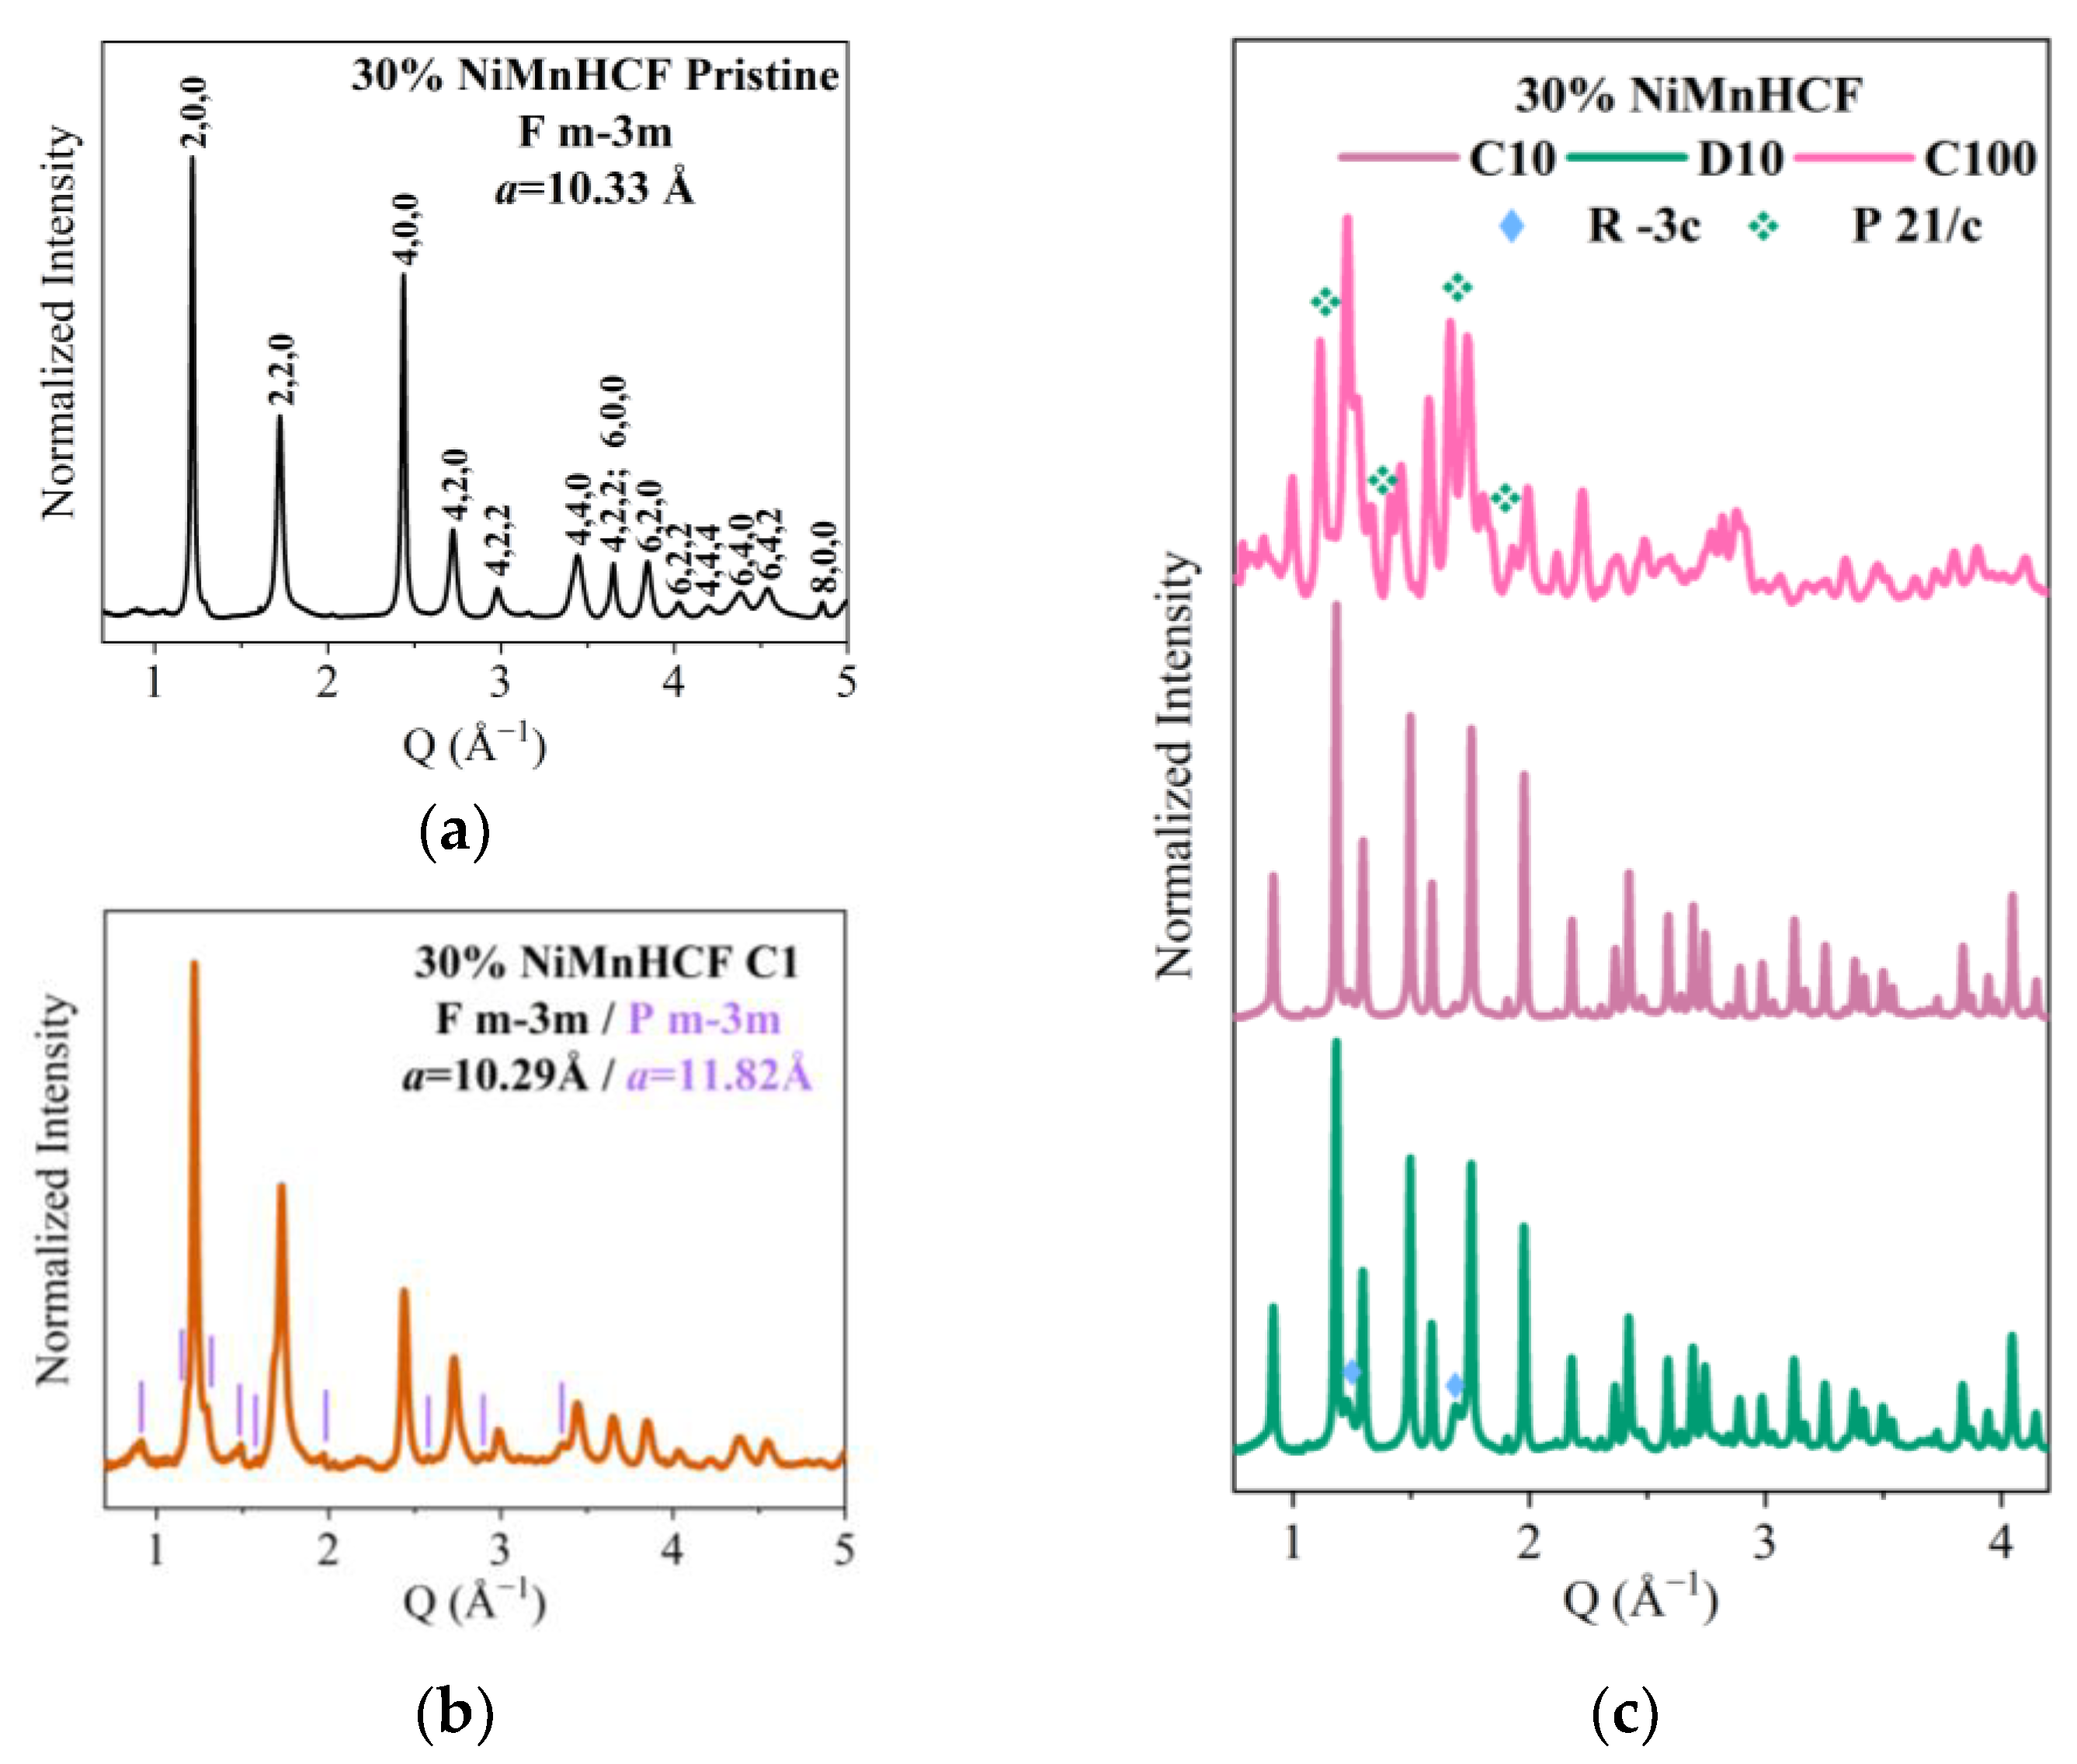
3.4. PXRD Analysis
4. Conclusions
Supplementary Materials
Author Contributions
Funding
Data Availability Statement
Conflicts of Interest
References
- EUR-Lex. Available online: https://eur-lex.europa.eu/summary/chapter/20.html#:~:text=The%20European%20climate%20law%20writes,2030%2C%20compared%20to%201990%20levels (accessed on 23 February 2024).
- Janssens, K.G. X-ray Fluorescence Analysis. In Handbook of Spectroscopy; Gauglitz, G., Vo-Dinh, T., Eds.; Wiley-VCH Verlag GmbH & Co. KGaA: Weinheim, Germany, 2003; Volume 11, pp. 363–419. [Google Scholar]
- Maisuradze, M.; Carlomagno, I.; Mullaliu, A.; Li, M.; Aquilanti, G.; Giorgetti, M. 2D X-ray fluorescence imaging as a probe for charge state distribution of manganese in aged MnHCF-based electrodes. J. Phys. Chem. C 2023, 127, 21498. [Google Scholar] [CrossRef]
- Booth, S.G.; Uehara, A.; Chang, S.Y.; Mosselmans, J.F.W.; Schroeder, S.L.M.; Dryfe, R.A.W. Gold Deposition at a Free-Standing Liquid/Liquid Interface: Evidence for the Formation of Au(I) by Microfocus X-ray Spectroscopy (μXRF and μXAFS) and Cyclic Voltammetry. J. Phys. Chem. C 2015, 119, 16785–16792. [Google Scholar] [CrossRef]
- Yu, X.; Pan, H.; Zhou, Y.; Northrup, P.; Xiao, J.; Bak, S.; Liu, M.; Nam, K.-W.; Qu, D.; Liu, J.; et al. Direct Observation of the Redistribution of Sulfur and Polysufides in Li–S Batteries During the First Cycle by In Situ X-Ray Fluorescence Microscopy. Adv. Energy Mater. 2015, 5, 1500072. [Google Scholar] [CrossRef]
- Li, M.; Gaboardi, M.; Mullaliu, A.; Maisuradze, M.; Xue, X.; Aquilanti, G.; Plaisier, J.R.; Passerini, S.; Giorgetti, M. Influence of Vacancies in Manganese Hexacyanoferrate Cathode for Organic Na-ion Batteries: A Structural Perspective. ChemSusChem 2023, 16, e202300201. [Google Scholar] [CrossRef] [PubMed]
- CATL. Available online: https://www.catl.com/en/news/665.html (accessed on 23 February 2024).
- Altris. Available online: https://www.altris.se/technology/ (accessed on 23 February 2024).
- Natron Energy. Available online: https://natron.energy/technology/ (accessed on 23 February 2024).
- Fang, G.; Zhou, J.; Pan, A.; Liang, S. Recent Advances in Aqueous Zinc-Ion Batteries. ACS Energy Lett. 2018, 3, 2480–2501. [Google Scholar] [CrossRef]
- Konarov, A.; Voronina, N.; Jo, J.H.; Bakenov, Z.; Sun, Y.-K.; Myung, S.-T. Present and Future Perspective on Electrode Materials for Rechargeable Zinc-Ion Batteries. ACS Energy Lett. 2018, 3, 2620–2640. [Google Scholar] [CrossRef]
- Grignon, E.; Battaglia, A.M.; Schon, T.B.; Seferos, D.S. Aqueous Zinc Batteries: Design Principles toward Organic Cathodes for Grid Applications. iScience 2022, 25, 104204. [Google Scholar] [CrossRef] [PubMed]
- Shibata, T.; Moritomo, Y. Ultrafast Cation Intercalation in Nanoporous Nickel Hexacyanoferrate. Chem. Commun. 2014, 50, 12941–12943. [Google Scholar] [CrossRef]
- Takachi, M.; Fukuzumi, Y.; Moritomo, Y. Na+ Diffusion Kinetics in Nanoporous Metal-Hexacyanoferrates. Dalton Trans. 2016, 45, 458–461. [Google Scholar] [CrossRef]
- You, Y.; Wu, X.-L.; Yin, Y.-X.; Guo, Y.-G. A Zero-Strain Insertion Cathode Material of Nickel Ferricyanide for Sodium-Ion Batteries. J. Mater. Chem. A Mater. 2013, 1, 14061. [Google Scholar] [CrossRef]
- Qian, J.; Wu, C.; Cao, Y.; Ma, Z.; Huang, Y.; Ai, X.; Yang, H. Prussian Blue Cathode Materials for Sodium-Ion Batteries and Other Ion Batteries. Adv. Energy Mater. 2018, 8, 1702619. [Google Scholar] [CrossRef]
- Wessells, C.D.; Peddada, S.V.; Huggins, R.A.; Cui, Y. Nickel Hexacyanoferrate Nanoparticle Electrodes for Aqueous Sodium and Potassium Ion Batteries. Nano Lett. 2011, 11, 5421–5425. [Google Scholar] [CrossRef] [PubMed]
- Imanishi, N.; Morikawa, T.; Kondo, J.; Takeda, Y.; Yamamoto, O.; Kinugasa, N.; Yamagishi, T. Lithium Intercalation Behavior into Iron Cyanide Complex as Positive Electrode of Lithium Secondary Battery. J. Power Sources 1999, 79, 215–219. [Google Scholar] [CrossRef]
- Eftekhari, A. Potassium Secondary Cell Based on Prussian Blue Cathode. J. Power Sources 2004, 126, 221–228. [Google Scholar] [CrossRef]
- Wessells, C.D.; Huggins, R.A.; Cui, Y. Copper Hexacyanoferrate Battery Electrodes with Long Cycle Life and High Power. Nat. Commun. 2011, 2, 550. [Google Scholar] [CrossRef]
- Wang, R.Y.; Shyam, B.; Stone, K.H.; Weker, J.N.; Pasta, M.; Lee, H.; Toney, M.F.; Cui, Y. Reversible Multivalent (Monovalent, Divalent, Trivalent) Ion Insertion in Open Framework Materials. Adv. Energy Mater. 2015, 5, 1401869. [Google Scholar] [CrossRef]
- Mizuno, Y.; Okubo, M.; Hosono, E.; Kudo, T.; Ohishi, K.; Okazawa, A.; Kojima, N.; Kurono, R.; Nishimura, S.; Yamada, A. Electrochemical Mg2+ Intercalation into a Bimetallic CuFe Prussian Blue Analog in Aqueous Electrolytes. J. Mater. Chem. A Mater. 2013, 1, 13055. [Google Scholar] [CrossRef]
- Park, H.; Lee, Y.; Ko, W.; Choi, M.; Ku, B.; Ahn, H.; Kim, J.; Kang, J.; Yoo, J.; Kim, J. Review on Cathode Materials for Sodium- and Potassium-Ion Batteries: Structural Design with Electrochemical Properties. Batter. Supercaps 2023, 6, e202200486. [Google Scholar] [CrossRef]
- Li, M.; Maisuradze, M.; Sciacca, R.; Hasa, I.; Giorgetti, M. A Structural Perspective on Prussian Blue Analogues for Aqueous Zinc-Ion Batteries. Batter. Supercaps 2023, 6, e202300340. [Google Scholar] [CrossRef]
- Lu, Y.; Wang, L.; Cheng, J.; Goodenough, J.B. Prussian Blue: A New Framework of Electrode Materials for Sodium Batteries. Chem. Commun. 2012, 48, 6544. [Google Scholar] [CrossRef]
- Mullaliu, A.; Asenbauer, J.; Aquilanti, G.; Passerini, S.; Giorgetti, M. Highlighting the Reversible Manganese Electroactivity in Na-Rich Manganese Hexacyanoferrate Material for Li- and Na-Ion Storage. Small Methods 2020, 4, 1900529. [Google Scholar] [CrossRef]
- Cao, T.; Zhang, F.; Chen, M.; Shao, T.; Li, Z.; Xu, Q.; Cheng, D.; Liu, H.; Xia, Y. Cubic Manganese Potassium Hexacyanoferrate Regulated by Controlling of the Water and Defects as a High-Capacity and Stable Cathode Material for Rechargeable Aqueous Zinc-Ion Batteries. ACS Appl. Mater. Interfaces 2021, 13, 26924–26935. [Google Scholar] [CrossRef]
- Deng, W.; Li, Z.; Ye, Y.; Zhou, Z.; Li, Y.; Zhang, M.; Yuan, X.; Hu, J.; Zhao, W.; Huang, Z.; et al. Zn 2+ Induced Phase Transformation of K2MnFe(CN)6 Boosts Highly Stable Zinc-Ion Storage. Adv. Energy Mater. 2021, 11, 2003639. [Google Scholar] [CrossRef]
- Ni, G.; Hao, Z.; Zou, G.; Xu, X.; Hu, B.; Cao, F.; Zhou, C. Potassium Manganese Hexacyanoferrate with Improved Lifespan in Zn(CF3SO3)2 Electrolyte for Aqueous Zinc-Ion Batteries. Sustain. Energy Fuels 2022, 6, 1353–1361. [Google Scholar] [CrossRef]
- Fu, H.; Liu, C.; Zhang, C.; Ma, W.; Wang, K.; Li, Z.; Lu, X.; Cao, G. Enhanced Storage of Sodium Ions in Prussian Blue Cathode Material through Nickel Doping. J. Mater. Chem. A Mater. 2017, 5, 9604–9610. [Google Scholar] [CrossRef]
- Yang, D.; Xu, J.; Liao, X.-Z.; He, Y.-S.; Liu, H.; Ma, Z.-F. Structure Optimization of Prussian Blue Analogue Cathode Materials for Advanced Sodium Ion Batteries. Chem. Commun. 2014, 50, 13377–13380. [Google Scholar] [CrossRef]
- Maisuradze, M.; Li, M.; Aquilanti, G.; Plaisier, J.; Giorgetti, M. Characterization of Partially Ni Substituted Manganese Hexacyanoferrate Cathode Material. Mater. Lett. 2023, 330, 133259. [Google Scholar] [CrossRef]
- Lim, J.; Kasiri, G.; Sahu, R.; Schweinar, K.; Hengge, K.; Raabe, D.; La Mantia, F.; Scheu, C. Irreversible Structural Changes of Copper Hexacyanoferrate Used as a Cathode in Zn-Ion Batteries. Chem. Eur. J. 2020, 26, 4917–4922. [Google Scholar] [CrossRef] [PubMed]
- Wang, K.; Guo, G.; Tan, X.; Zheng, L.; Zhang, H. Achieving high-energy and long-cycling aqueous zinc-metal batteries by highly reversible insertion mechanisms in Ti-substituted Na0.44MnO2 cathode. J. Chem. Eng. 2023, 451, 139059. [Google Scholar] [CrossRef]
- Karydas, A.G.; Czyzycki, M.; Leani, J.J.; Migliori, A.; Osan, J.; Bogovac, M.; Wrobel, P.; Vakula, N.; Padilla-Alvarez, R.; Menk, R.H.; et al. An IAEA Multi-Technique X-Ray Spectrometry Endstation at Elettra Sincrotrone Trieste: Benchmarking Results and Interdisciplinary Applications. J. Synchrotron. Radiat. 2018, 25, 189–203. [Google Scholar] [CrossRef]
- Jark, W.; Grenci, G. Focusing X-Rays in Two Dimensions upon Refraction in an Inclined Prism. In Proceedings of the SPIE Optical Engineering + Applications, Advances in X-ray/EUV Optics and Components IX, San Diego, CA, USA, 17–21 August 2014; Volume 9207, p. 92070A. [Google Scholar] [CrossRef]
- Solé, V.A.; Papillon, E.; Cotte, M.; Walter, P.; Susini, J. A Multiplatform Code for the Analysis of Energy-Dispersive X-ray Fluorescence Spectra. Spectrochim. Acta Part B Spectrosc. 2007, 62, 63–68. [Google Scholar] [CrossRef]
- Ravel, B.; Newville, M. ATHENA, ARTEMIS, HEPHAESTUS: Data analysis for X-ray absorption spectroscopy using IFEFFIT. J. Synchrotron Radiat. 2005, 12, 537–541. [Google Scholar] [CrossRef] [PubMed]
- Toby, B.H.; Von Dreele, R.B. GSAS-II: The genesis of a modern open-source all purpose crystallography software package. J. Appl. Crystallogr. 2013, 46, 544–549. [Google Scholar] [CrossRef]
- Li, M.; Sciacca, R.; Maisuradze, M.; Aquilanti, G.; Plaisier, J.; Berrettoni, M.; Giorgetti, M. Electrochemical Performance of Manganese Hexacyanoferrate Cathode Material in Aqueous Zn-Ion Battery. Electrochim. Acta 2021, 400, 139414. [Google Scholar] [CrossRef]
- Rodríguez-Hernández, J.; Reguera, E.; Lima, E.; Balmaseda, J.; Martínez-García, R.; Yee-Madeira, H. An Atypical Coordination in Hexacyanometallates: Structure and Properties of Hexagonal Zinc Phases. J. Phys. Chem. Solids 2007, 68, 1630–1642. [Google Scholar] [CrossRef]
- Alfaruqi, M.H.; Mathew, V.; Gim, J.; Kim, S.; Song, J.; Baboo, J.P.; Choi, S.H.; Kim, J. Electrochemically Induced Structural Transformation in a γ-MnO2 Cathode of a High Capacity Zinc-Ion Battery System. Chem. Mater. 2015, 27, 3609–3620. [Google Scholar] [CrossRef]
- Huang, C.; Wu, C.; Zhang, Z.; Xie, Y.; Li, Y.; Yang, C.; Wang, H. Crystalline and Amorphous MnO2 Cathodes with Open Framework Enable High-Performance Aqueous Zinc-Ion Batteries. Front Mater. Sci. 2021, 15, 202–215. [Google Scholar] [CrossRef]
- Li, Q.; Ma, K.; Yang, G.; Wang, C. High-voltage non-aqueous Zn/K1.6Mn1.2Fe(CN)6 batteries with zero capacity loss in extremely long working duration. Energy Storage Mater. 2020, 29, 246–253. [Google Scholar] [CrossRef]
- Li, W.; Xu, C.; Zhang, X.; Xia, M.; Yang, Z.; Yan, H.; Yu, H.; Zhang, L.; Shu, W.; Shu, J. Sodium manganese hexacyanoferrate as Zn ion host toward aqueous energy storage. J. Electroanal. Chem. 2021, 881, 114968. [Google Scholar] [CrossRef]
- Hou, Z.; Zhang, X.; Li, X.; Zhu, Y.; Liang, J.; Qian, Y. Surfactant widens the electrochemical window of an aqueous electrolyte for better rechargeable aqueous sodium/zinc battery. J. Mater. Chem. A Mater. 2017, 5, 730–738. [Google Scholar] [CrossRef]


| Samples | Description | 2D-XRF | XANES | ||
|---|---|---|---|---|---|
| 10%NiMnHCF | 30%NiMnHCF | 10%NiMnHCF | 30%NiMnHCF | ||
| Pristine | Fresh electrode | ✓ | ✓ | ✓ | ✓ |
| C1 | Charged after 1st cycle | ✓ | ✓ | ✓ | ✓ |
| D1 | Discharged after 1st cycle | ✓ | ✓ | ✓ | - |
| C2 | Charged after 2nd cycle | ✓ | ✓ | ✓ | - |
| D2 | Discharged after 2nd cycle | ✓ | ✓ | ✓ | - |
| C10 | Charged after 10th cycle | ✓ | ✓ | - | - |
| D10 | Discharged after 10th cycle | ✓ | - | - | - |
| C100 | Charged after 100th cycle | ✓ | ✓ | - | - |
| Pristine | MnSO4 | MnO | Mn3O4 | Mn2O3 | MnO2 | R-Factor | Reduced χ2 | |
|---|---|---|---|---|---|---|---|---|
| Ratio | 0.159 | 0.148 | 0.001 | 0 | 0.089 | 0.604 | 0.00255 | 0.00059 |
| Error | 0.028 | 0.017 | 0.024 | 0.032 | 0.068 | 0.028 |
| 30%NiMnHCF Samples | Cell Parameters | |||||||
|---|---|---|---|---|---|---|---|---|
| F m-3m | P m-3m | R -3c | P 21/c | |||||
| a (Å) | a (Å) | a (Å) | c (Å) | a (Å) | b (Å) | c (Å) | β (°) | |
| Pristine | 10.33 | - | - | - | - | - | - | - |
| C1 | 10.29 | 11.82 | - | - | - | - | - | - |
| D1 | 10.22 | 11.79 | - | - | - | - | - | - |
| C2 | 10.33 | 11.88 | - | - | - | - | - | - |
| D2 | 10.16 | 11.76 | - | - | - | - | - | - |
| C10 | - | 11.91 | - | - | - | - | - | - |
| D10 | - | 11.88 | 12.42 | 32.85 | - | - | - | - |
| C50 | - | 11.99 | 12.48 | 32.94 | - | - | - | - |
| D50 | - | 12.05 | 12.46 | 32.74 | - | - | - | - |
| C100 | - | 11.94 | 12.37 | 33.08 | 6.23 | 13.77 | 9.91 | 125.45 |
| D100 | - | 11.99 | 12.48 | 32.94 | 6.16 | 13.69 | 9.77 | 126.84 |
Disclaimer/Publisher’s Note: The statements, opinions and data contained in all publications are solely those of the individual author(s) and contributor(s) and not of MDPI and/or the editor(s). MDPI and/or the editor(s) disclaim responsibility for any injury to people or property resulting from any ideas, methods, instructions or products referred to in the content. |
© 2024 by the authors. Licensee MDPI, Basel, Switzerland. This article is an open access article distributed under the terms and conditions of the Creative Commons Attribution (CC BY) license (https://creativecommons.org/licenses/by/4.0/).
Share and Cite
Maisuradze, M.; Li, M.; Carlomagno, I.; Gaboardi, M.; Aquilanti, G.; Plaisier, J.R.; Giorgetti, M. Aging Mechanism of Mn-Based Prussian Blue Cathode Material by Synchrotron 2D X-ray Fluorescence. Batteries 2024, 10, 123. https://doi.org/10.3390/batteries10040123
Maisuradze M, Li M, Carlomagno I, Gaboardi M, Aquilanti G, Plaisier JR, Giorgetti M. Aging Mechanism of Mn-Based Prussian Blue Cathode Material by Synchrotron 2D X-ray Fluorescence. Batteries. 2024; 10(4):123. https://doi.org/10.3390/batteries10040123
Chicago/Turabian StyleMaisuradze, Mariam, Min Li, Ilaria Carlomagno, Mattia Gaboardi, Giuliana Aquilanti, Jasper Rikkert Plaisier, and Marco Giorgetti. 2024. "Aging Mechanism of Mn-Based Prussian Blue Cathode Material by Synchrotron 2D X-ray Fluorescence" Batteries 10, no. 4: 123. https://doi.org/10.3390/batteries10040123
APA StyleMaisuradze, M., Li, M., Carlomagno, I., Gaboardi, M., Aquilanti, G., Plaisier, J. R., & Giorgetti, M. (2024). Aging Mechanism of Mn-Based Prussian Blue Cathode Material by Synchrotron 2D X-ray Fluorescence. Batteries, 10(4), 123. https://doi.org/10.3390/batteries10040123