

Influence of Screw Design and Process Parameters on the Product Quality of PEO:LiTFSI Solid Electrolytes Using Solvent-Free Melt Extrusion

Abstract
:1. Introduction
2. Materials and Methods
2.1. Materials
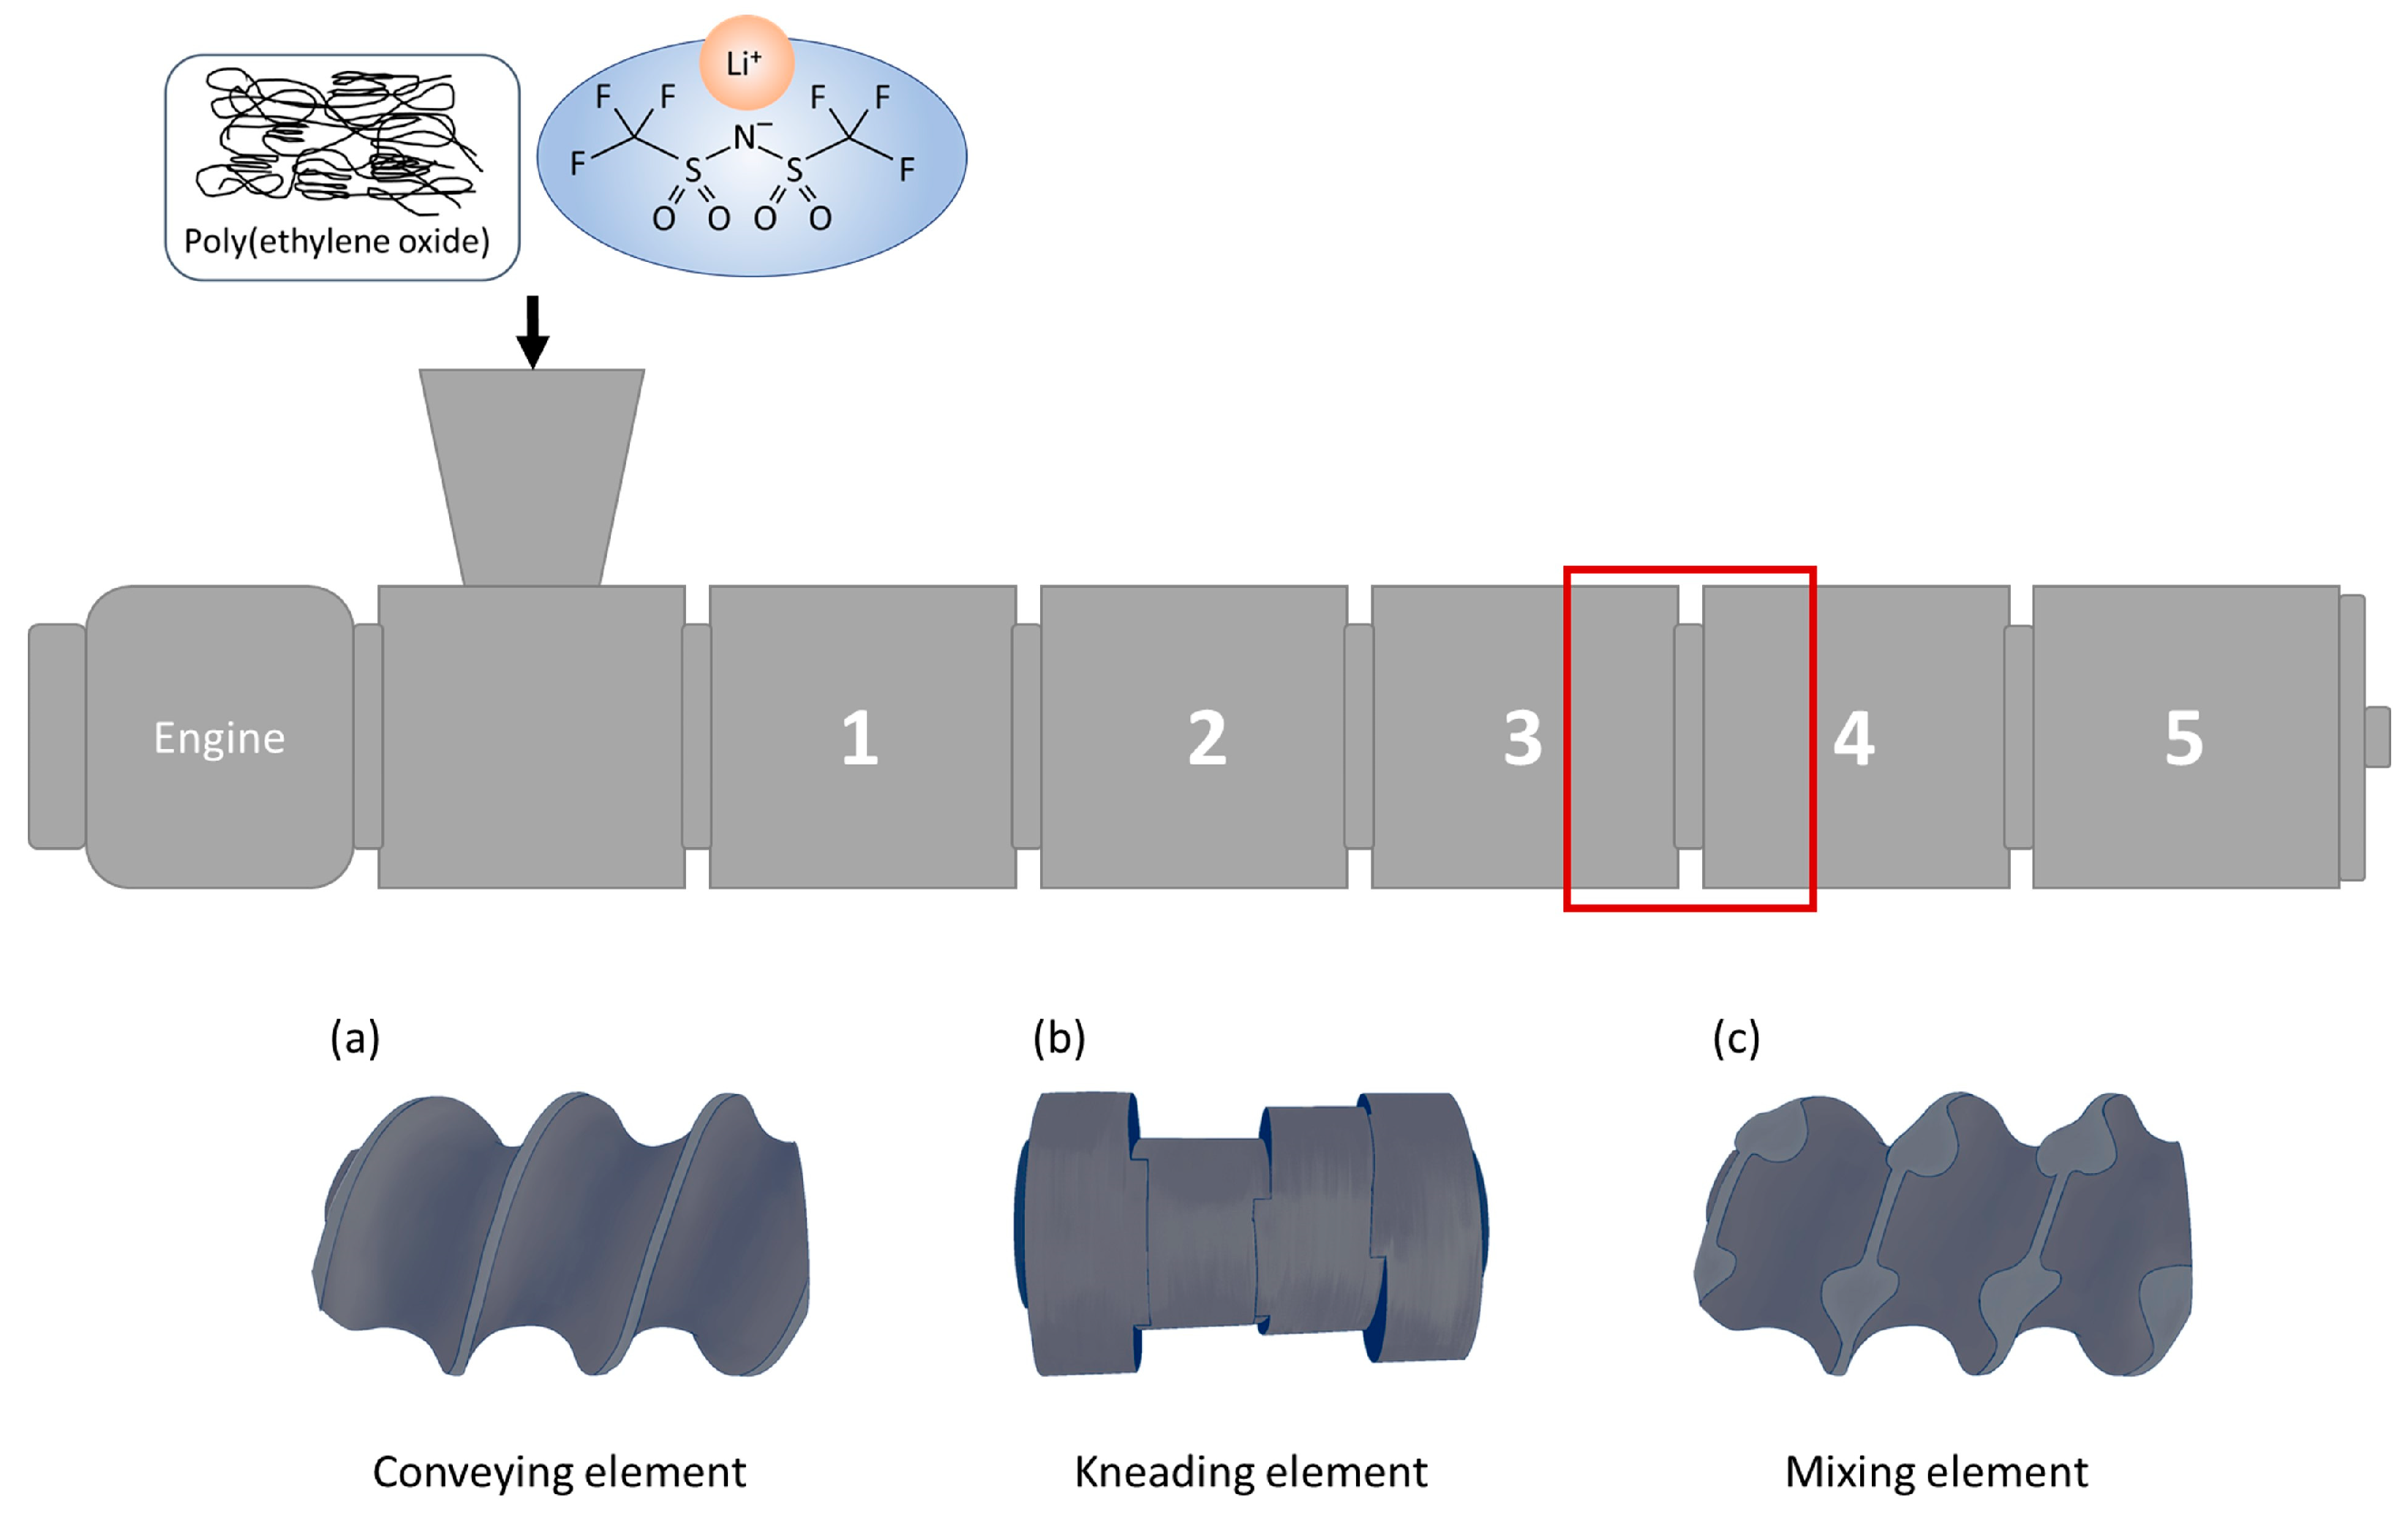
2.2. Extruder Setup
2.3. Digital Microscopy Observations
2.4. Rheology Measurements
2.5. Dynamic Mechanical Analysis
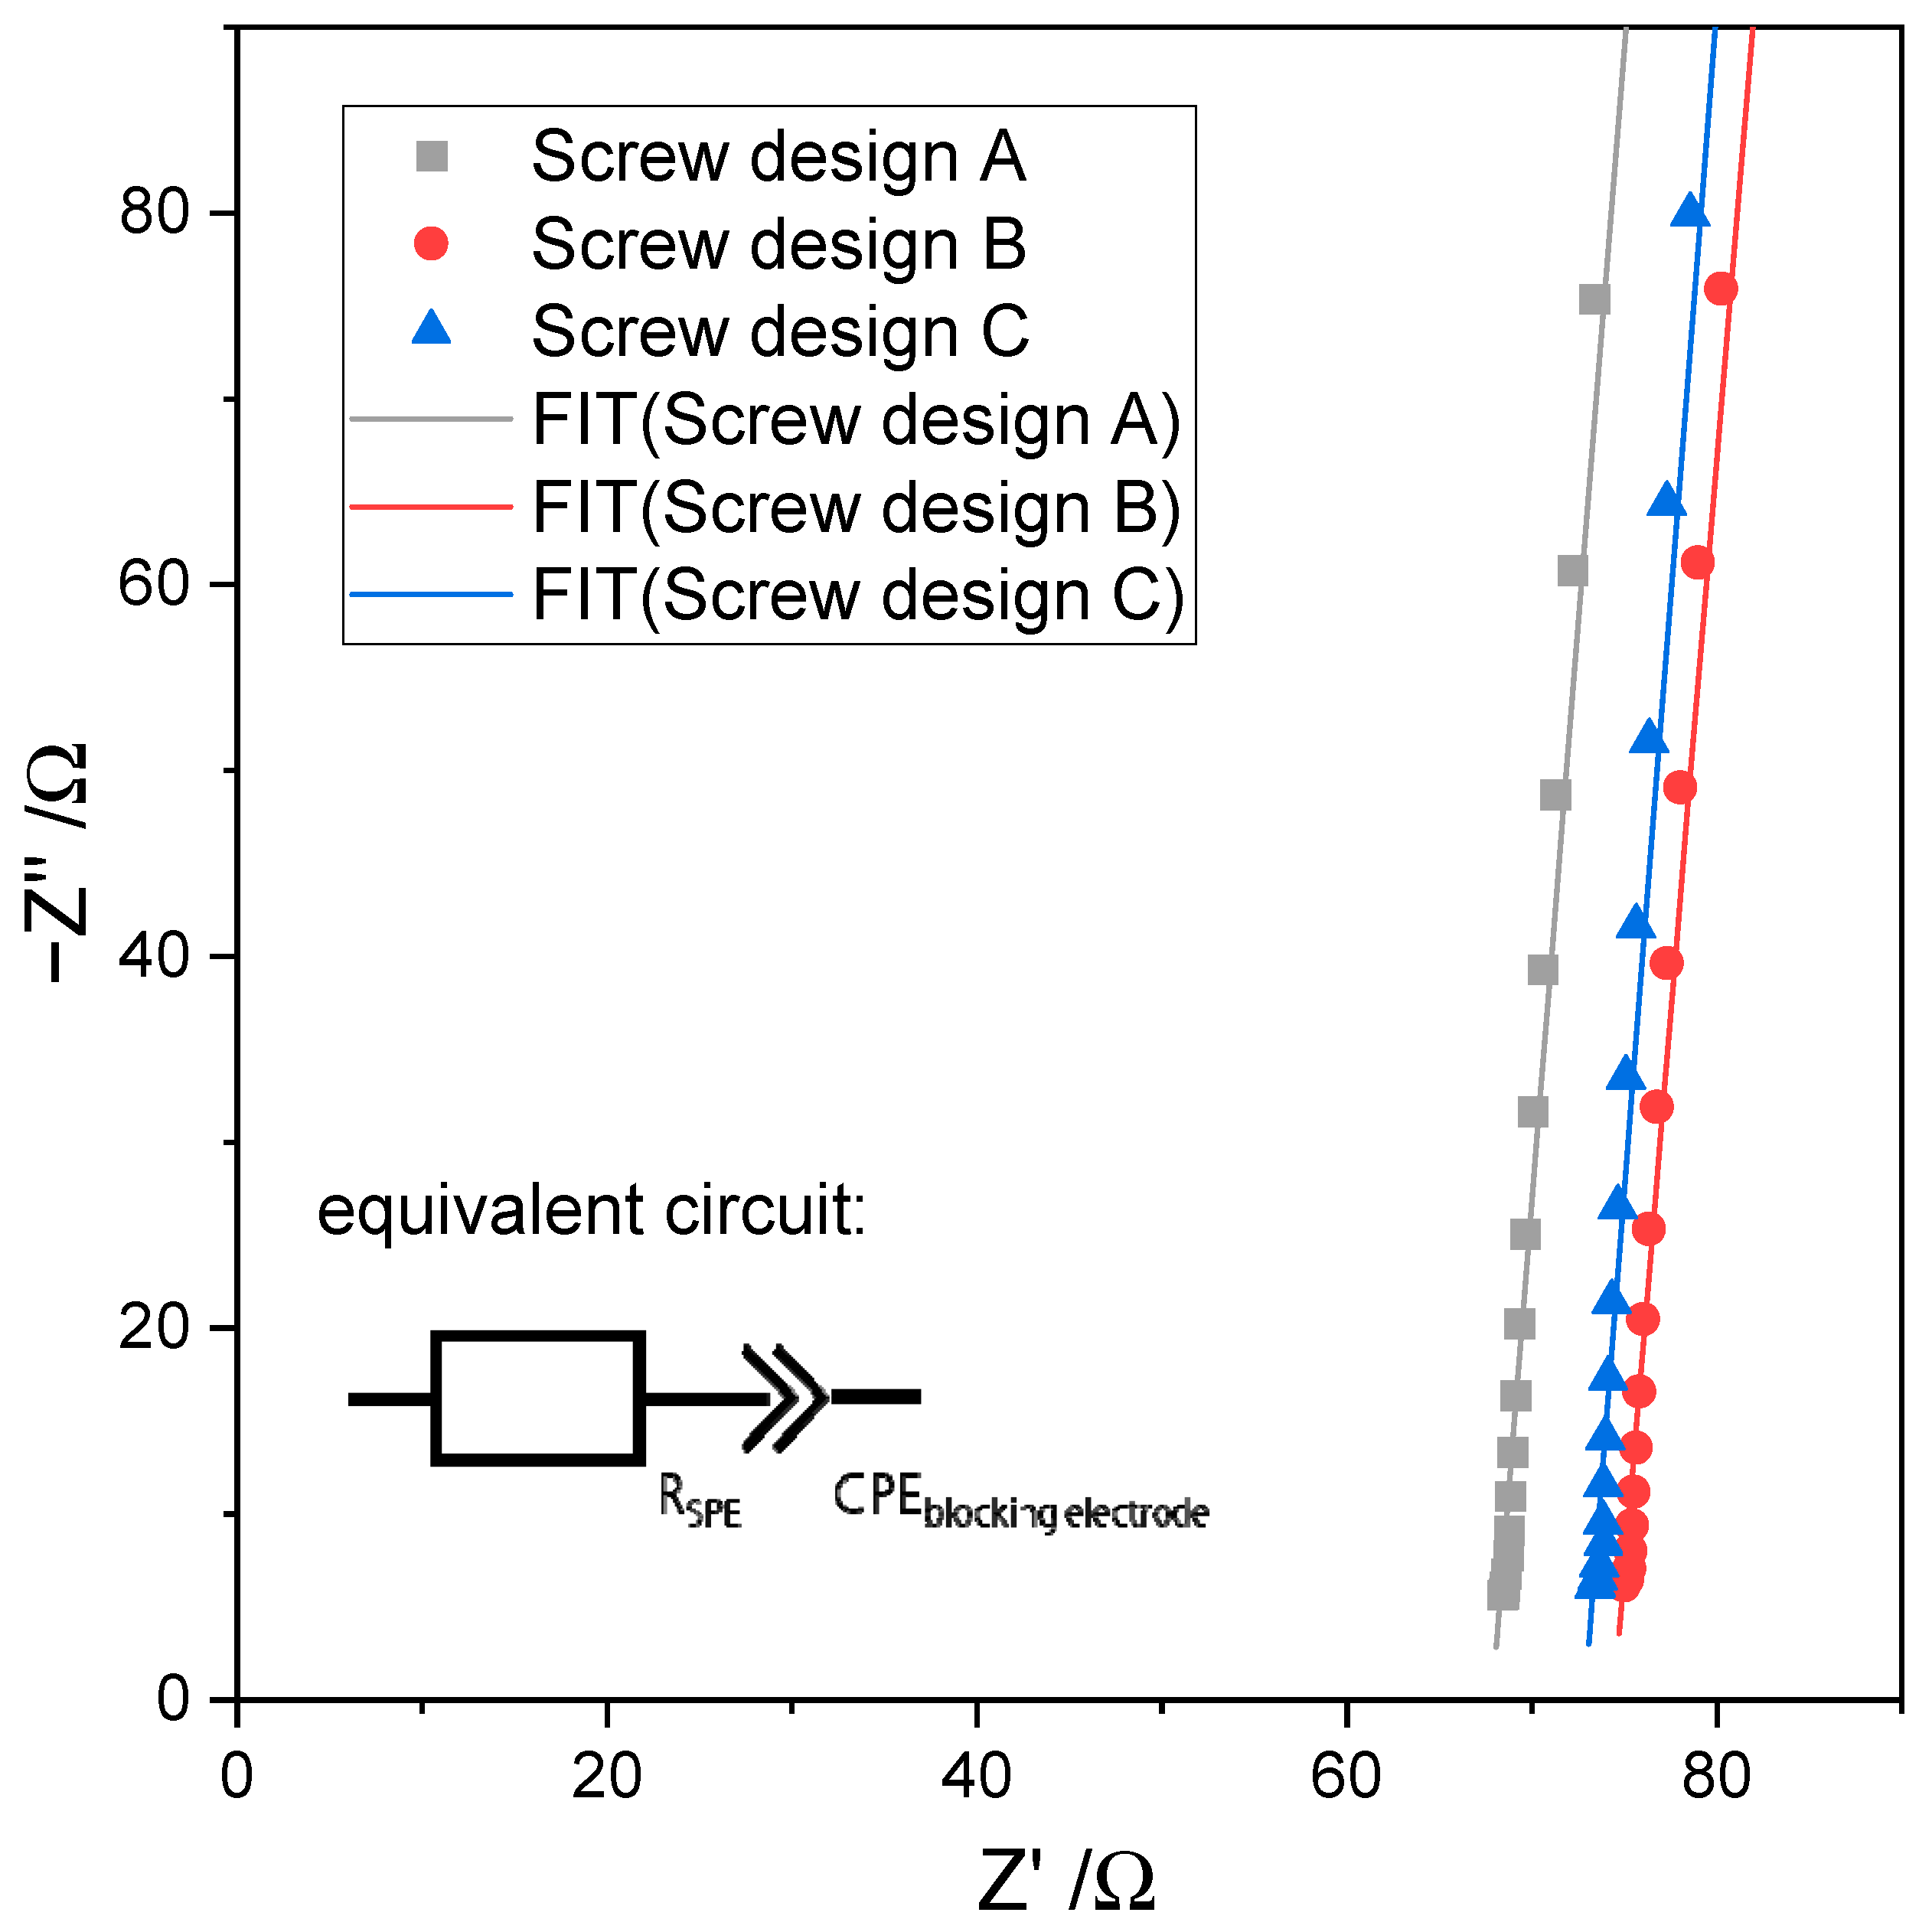
2.6. Electrochemical Impedance Spectroscopy
2.7. Electrochemical Cycling Experiments
3. Results and Discussion
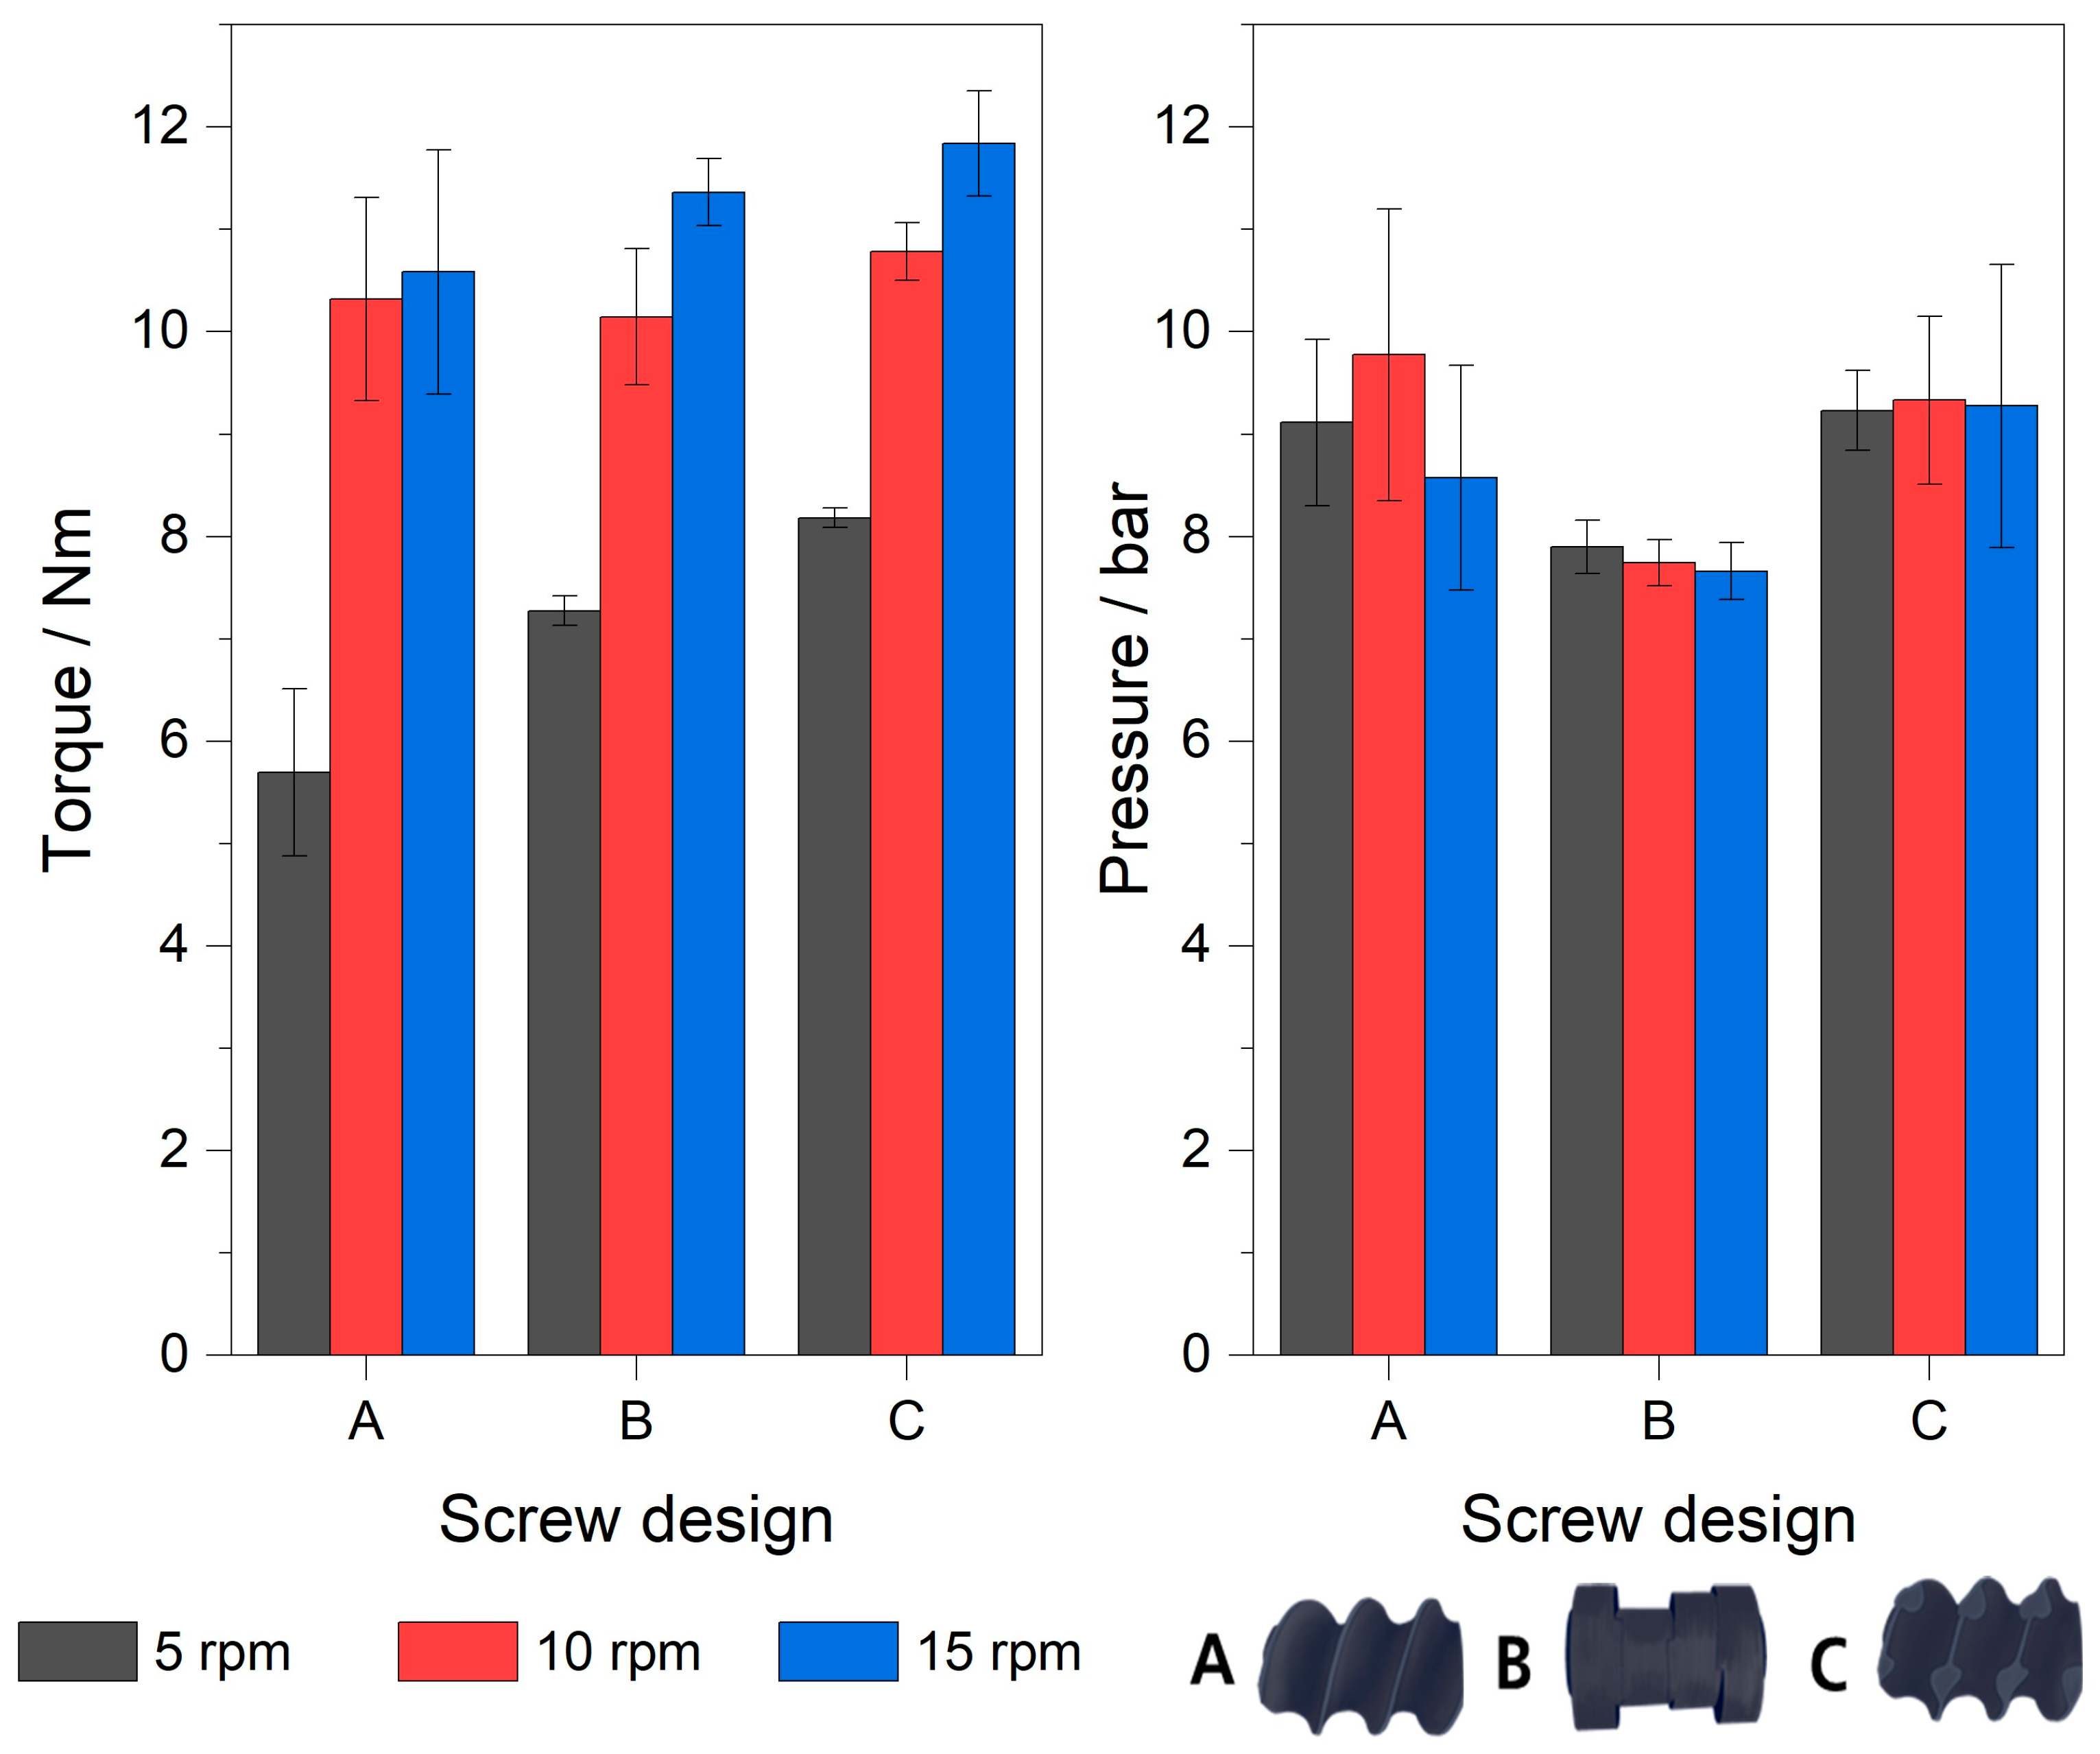
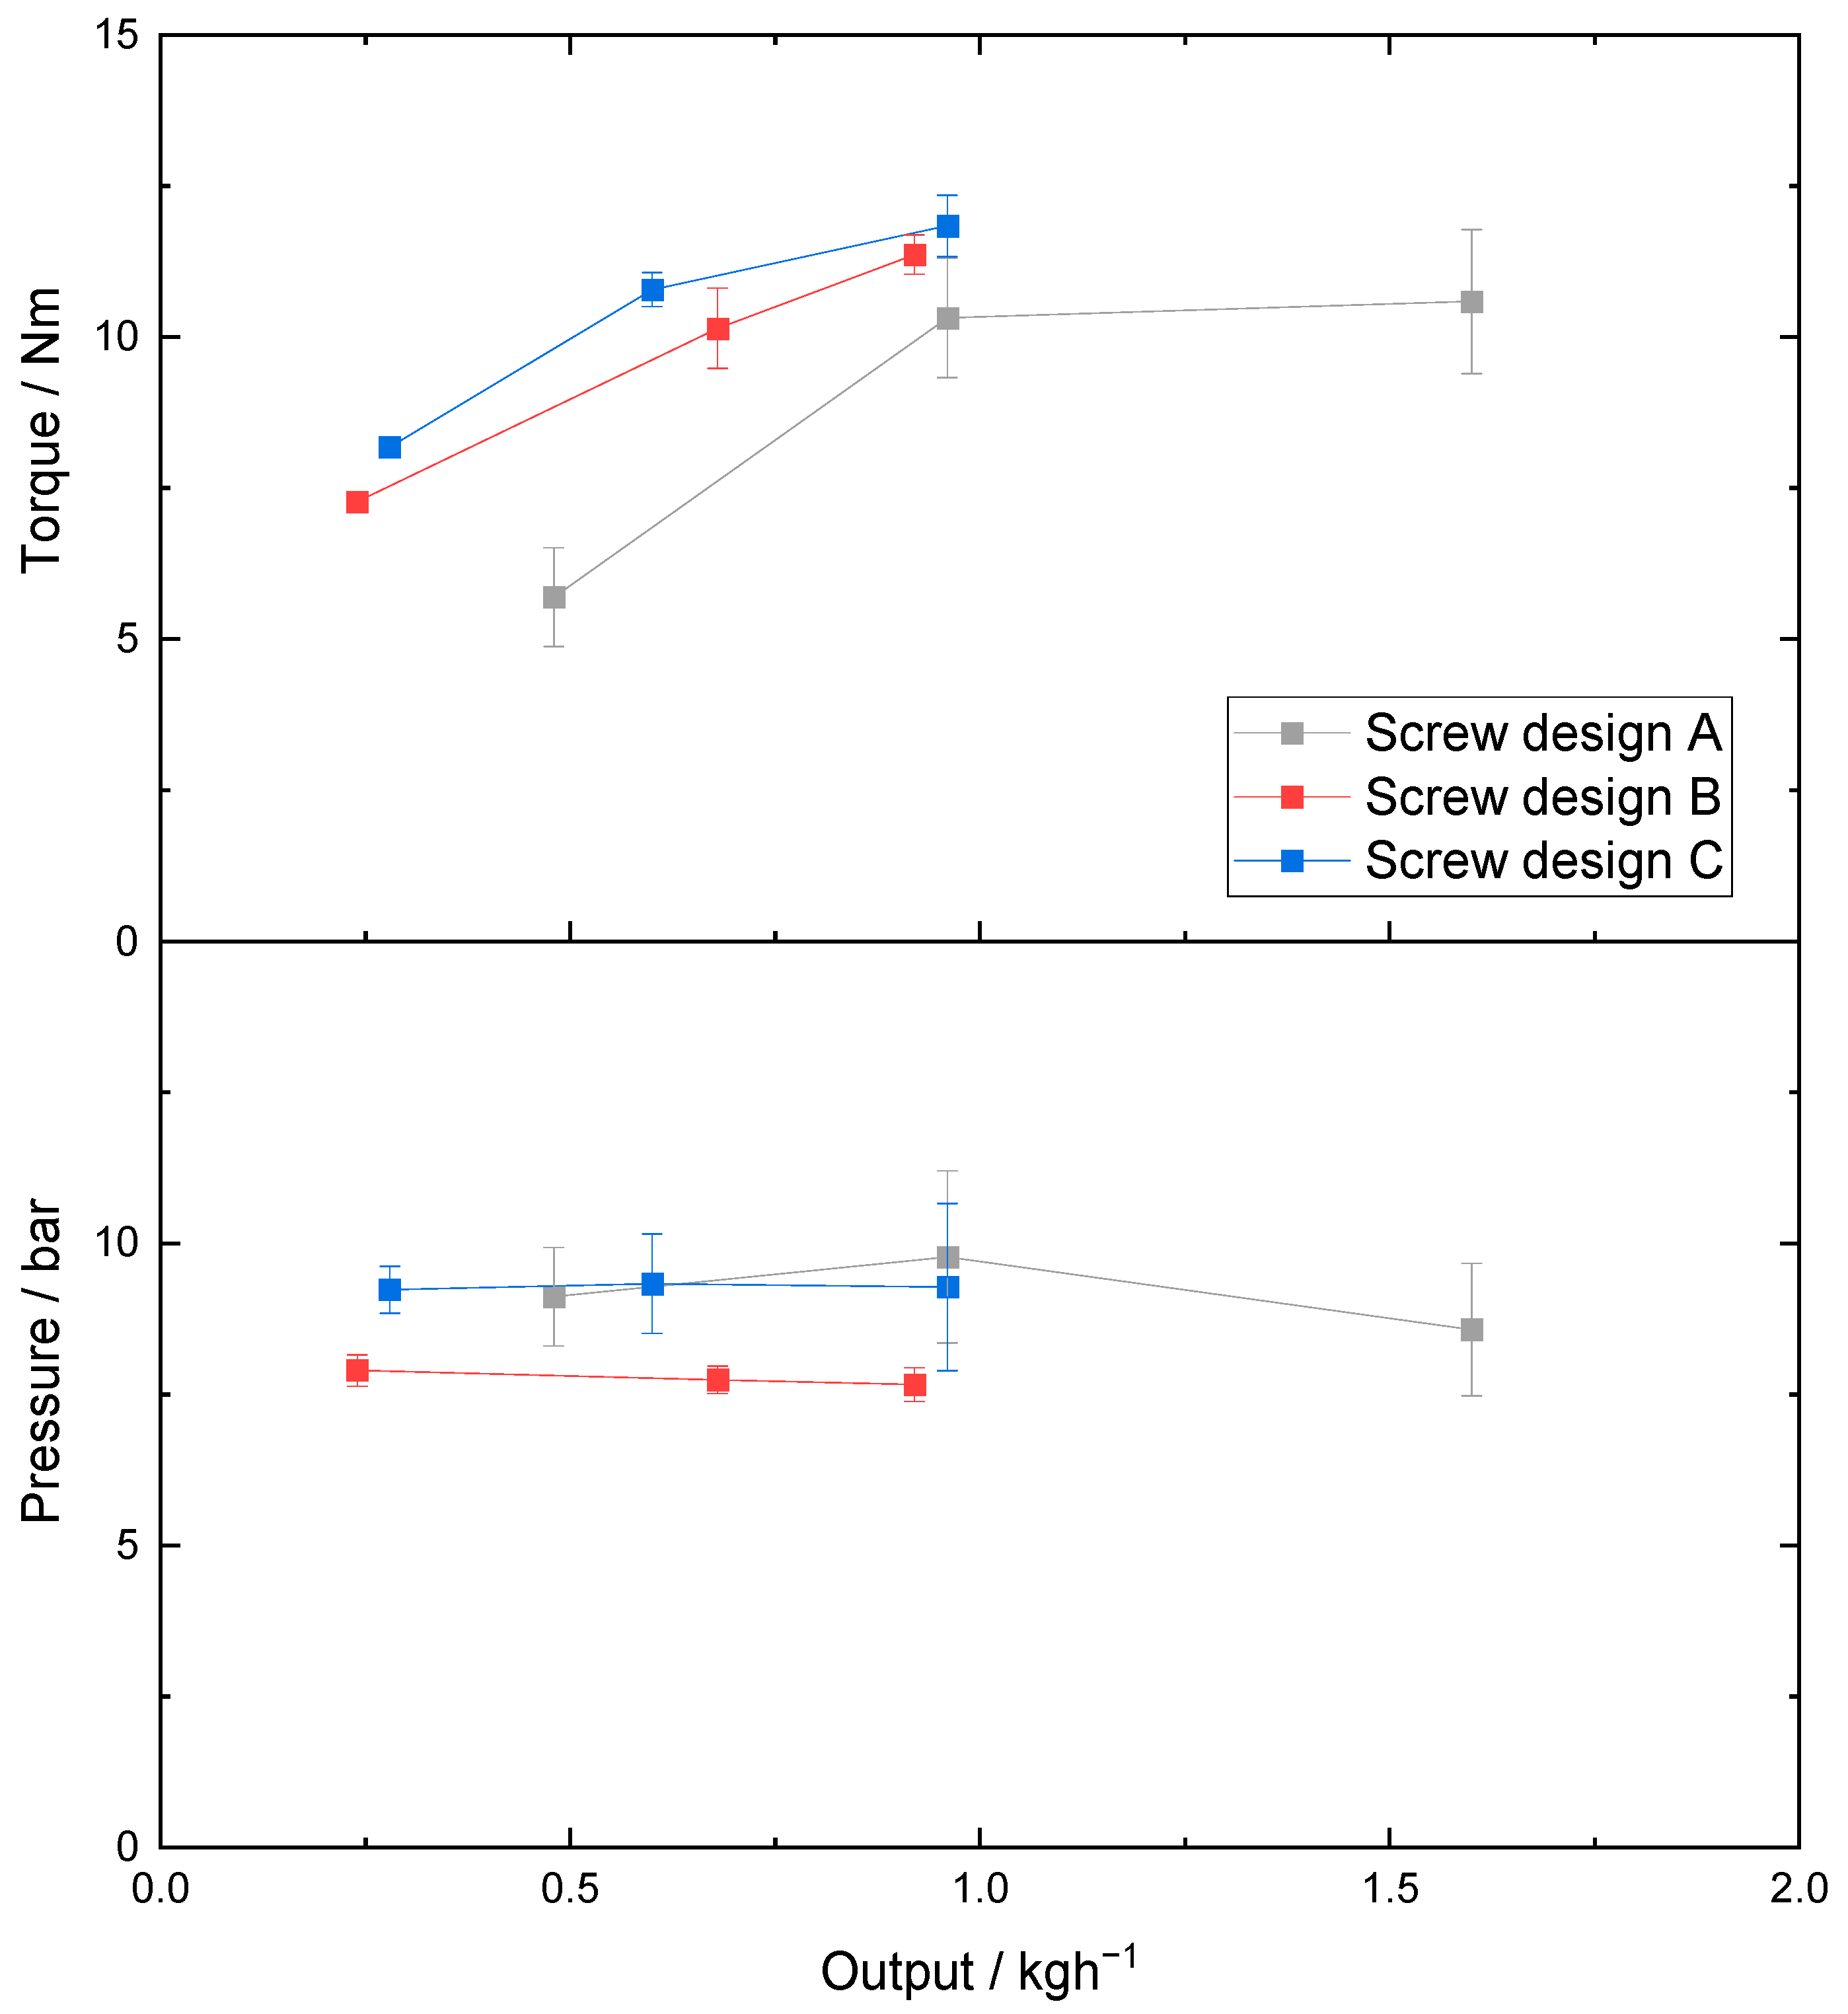
3.1. Extrusion of PEO20LiTFSI Electrolytes
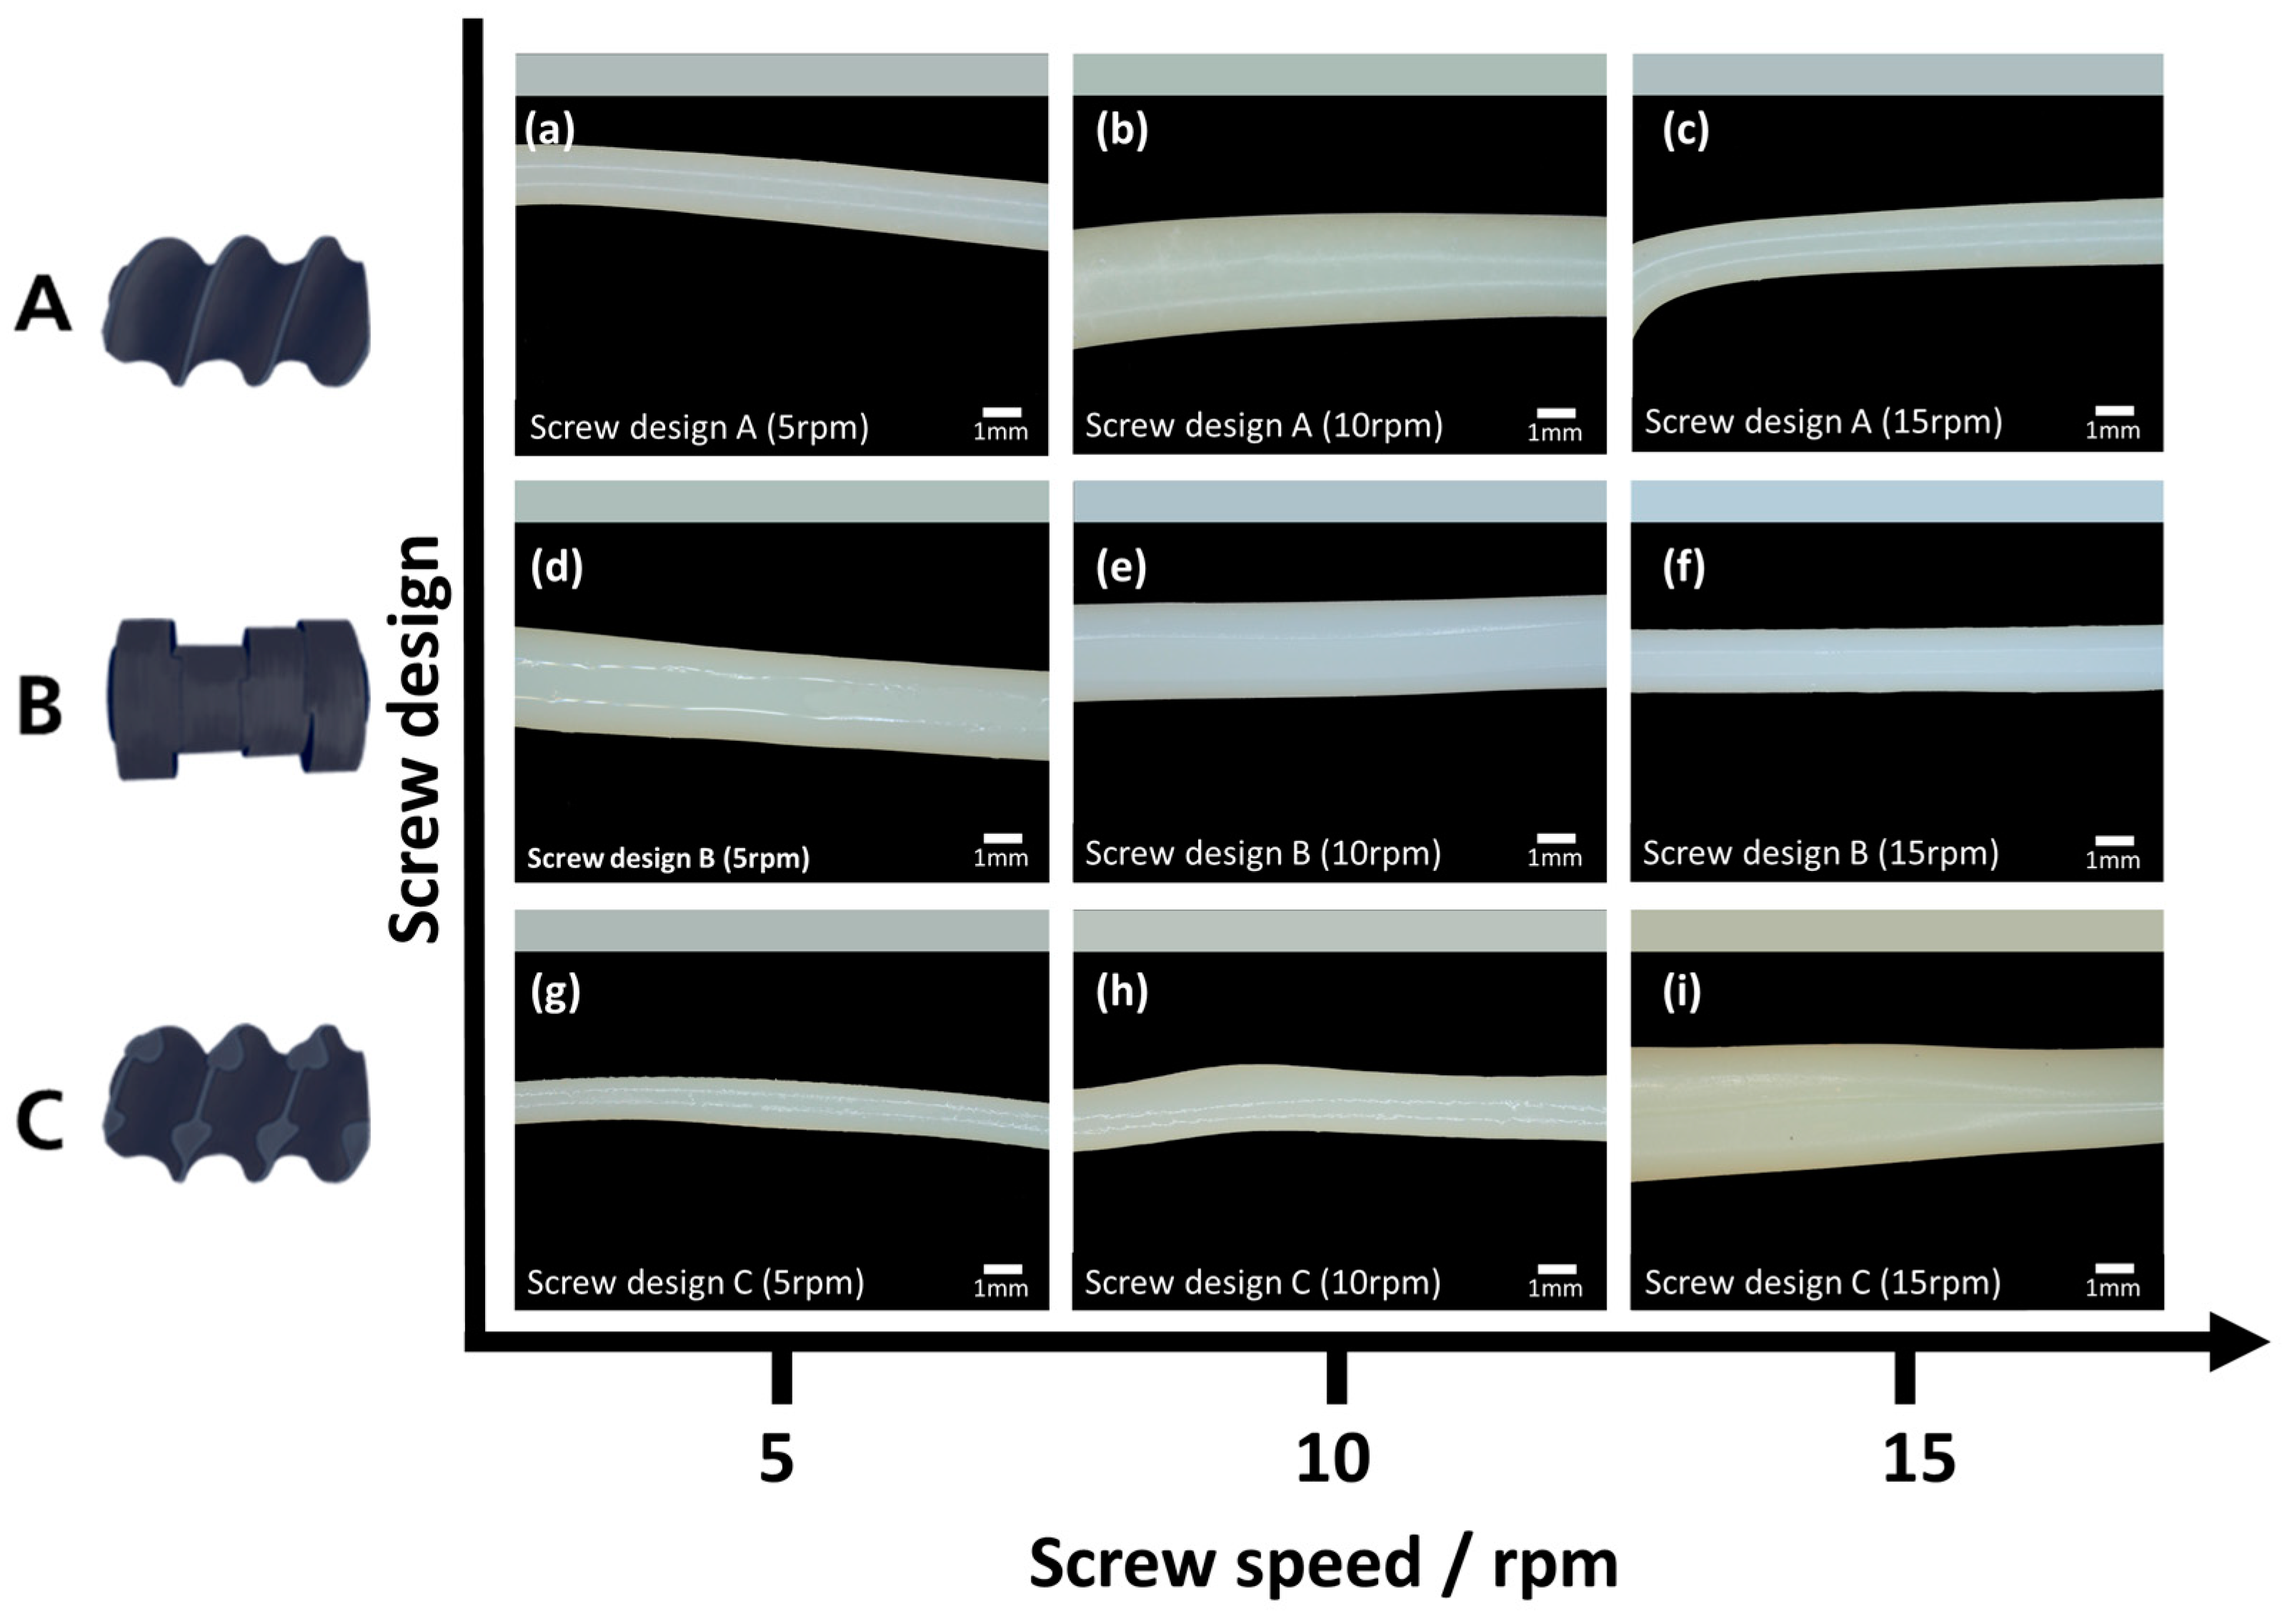
3.2. Microscopic Observation
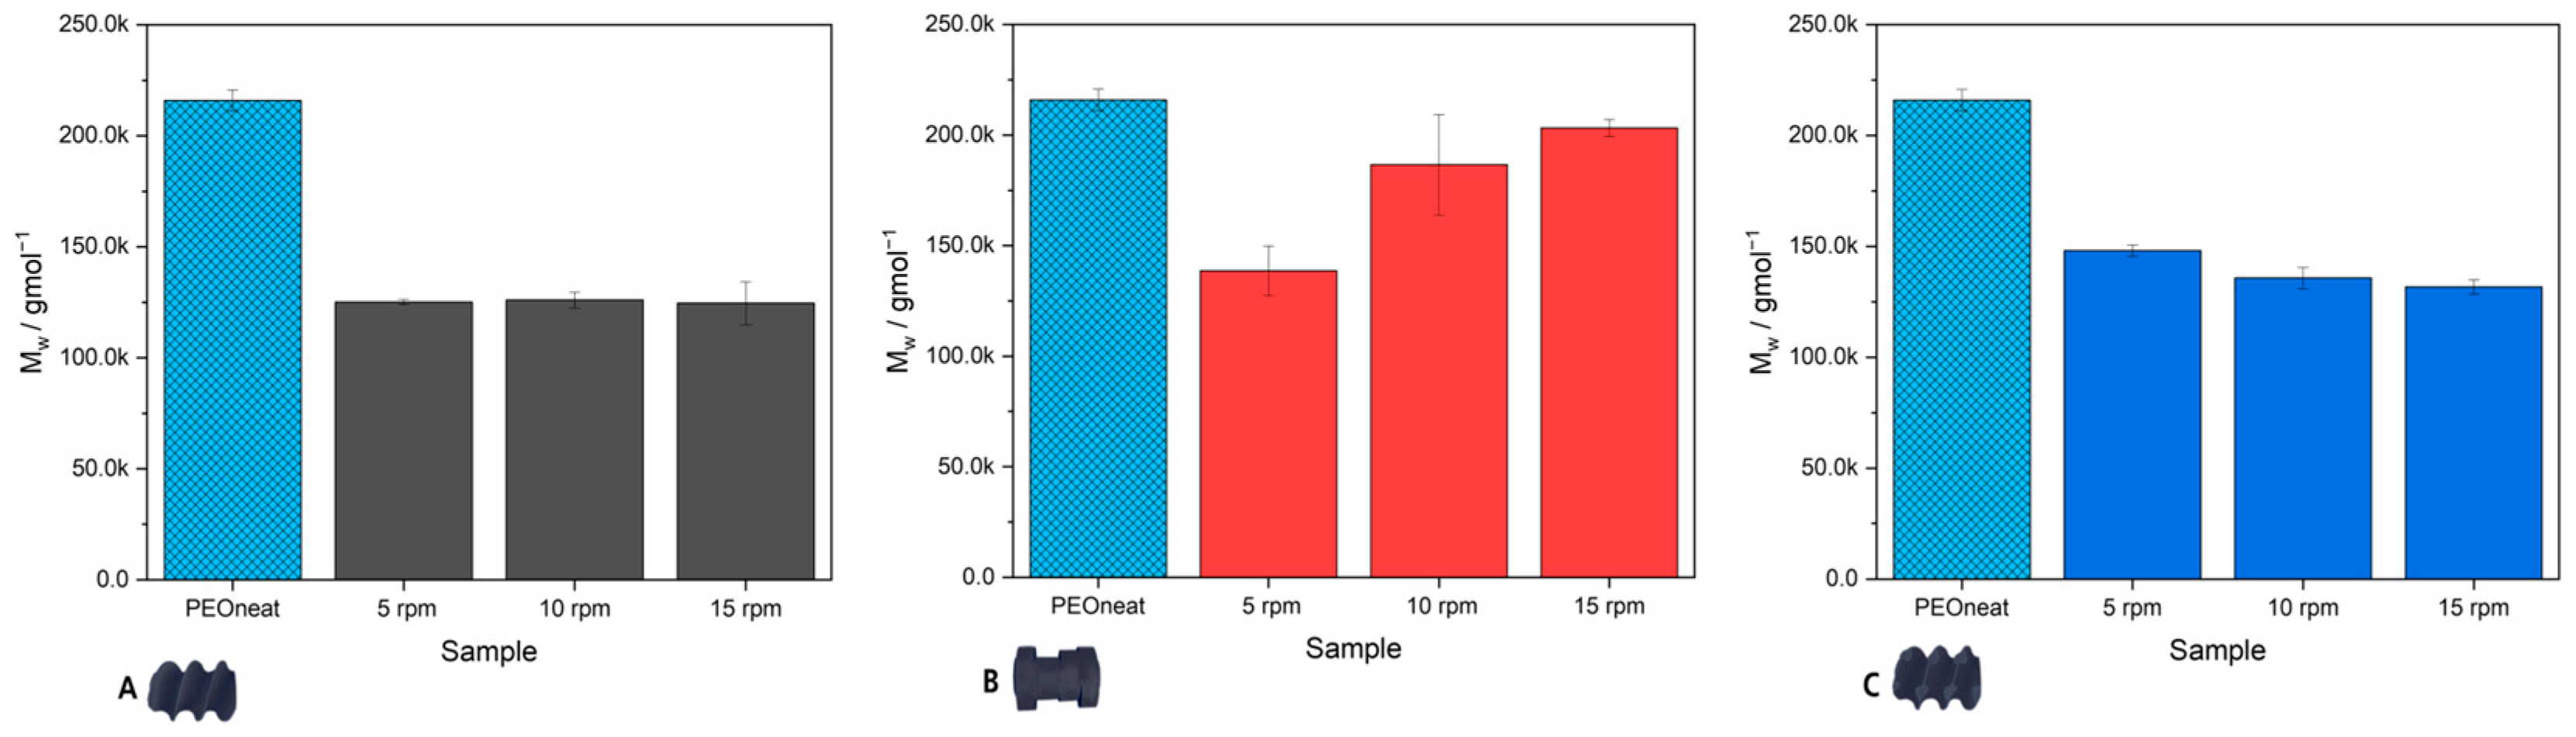
3.3. Determination of Molecular Weight
3.4. Dynamic Mechanical Analysis
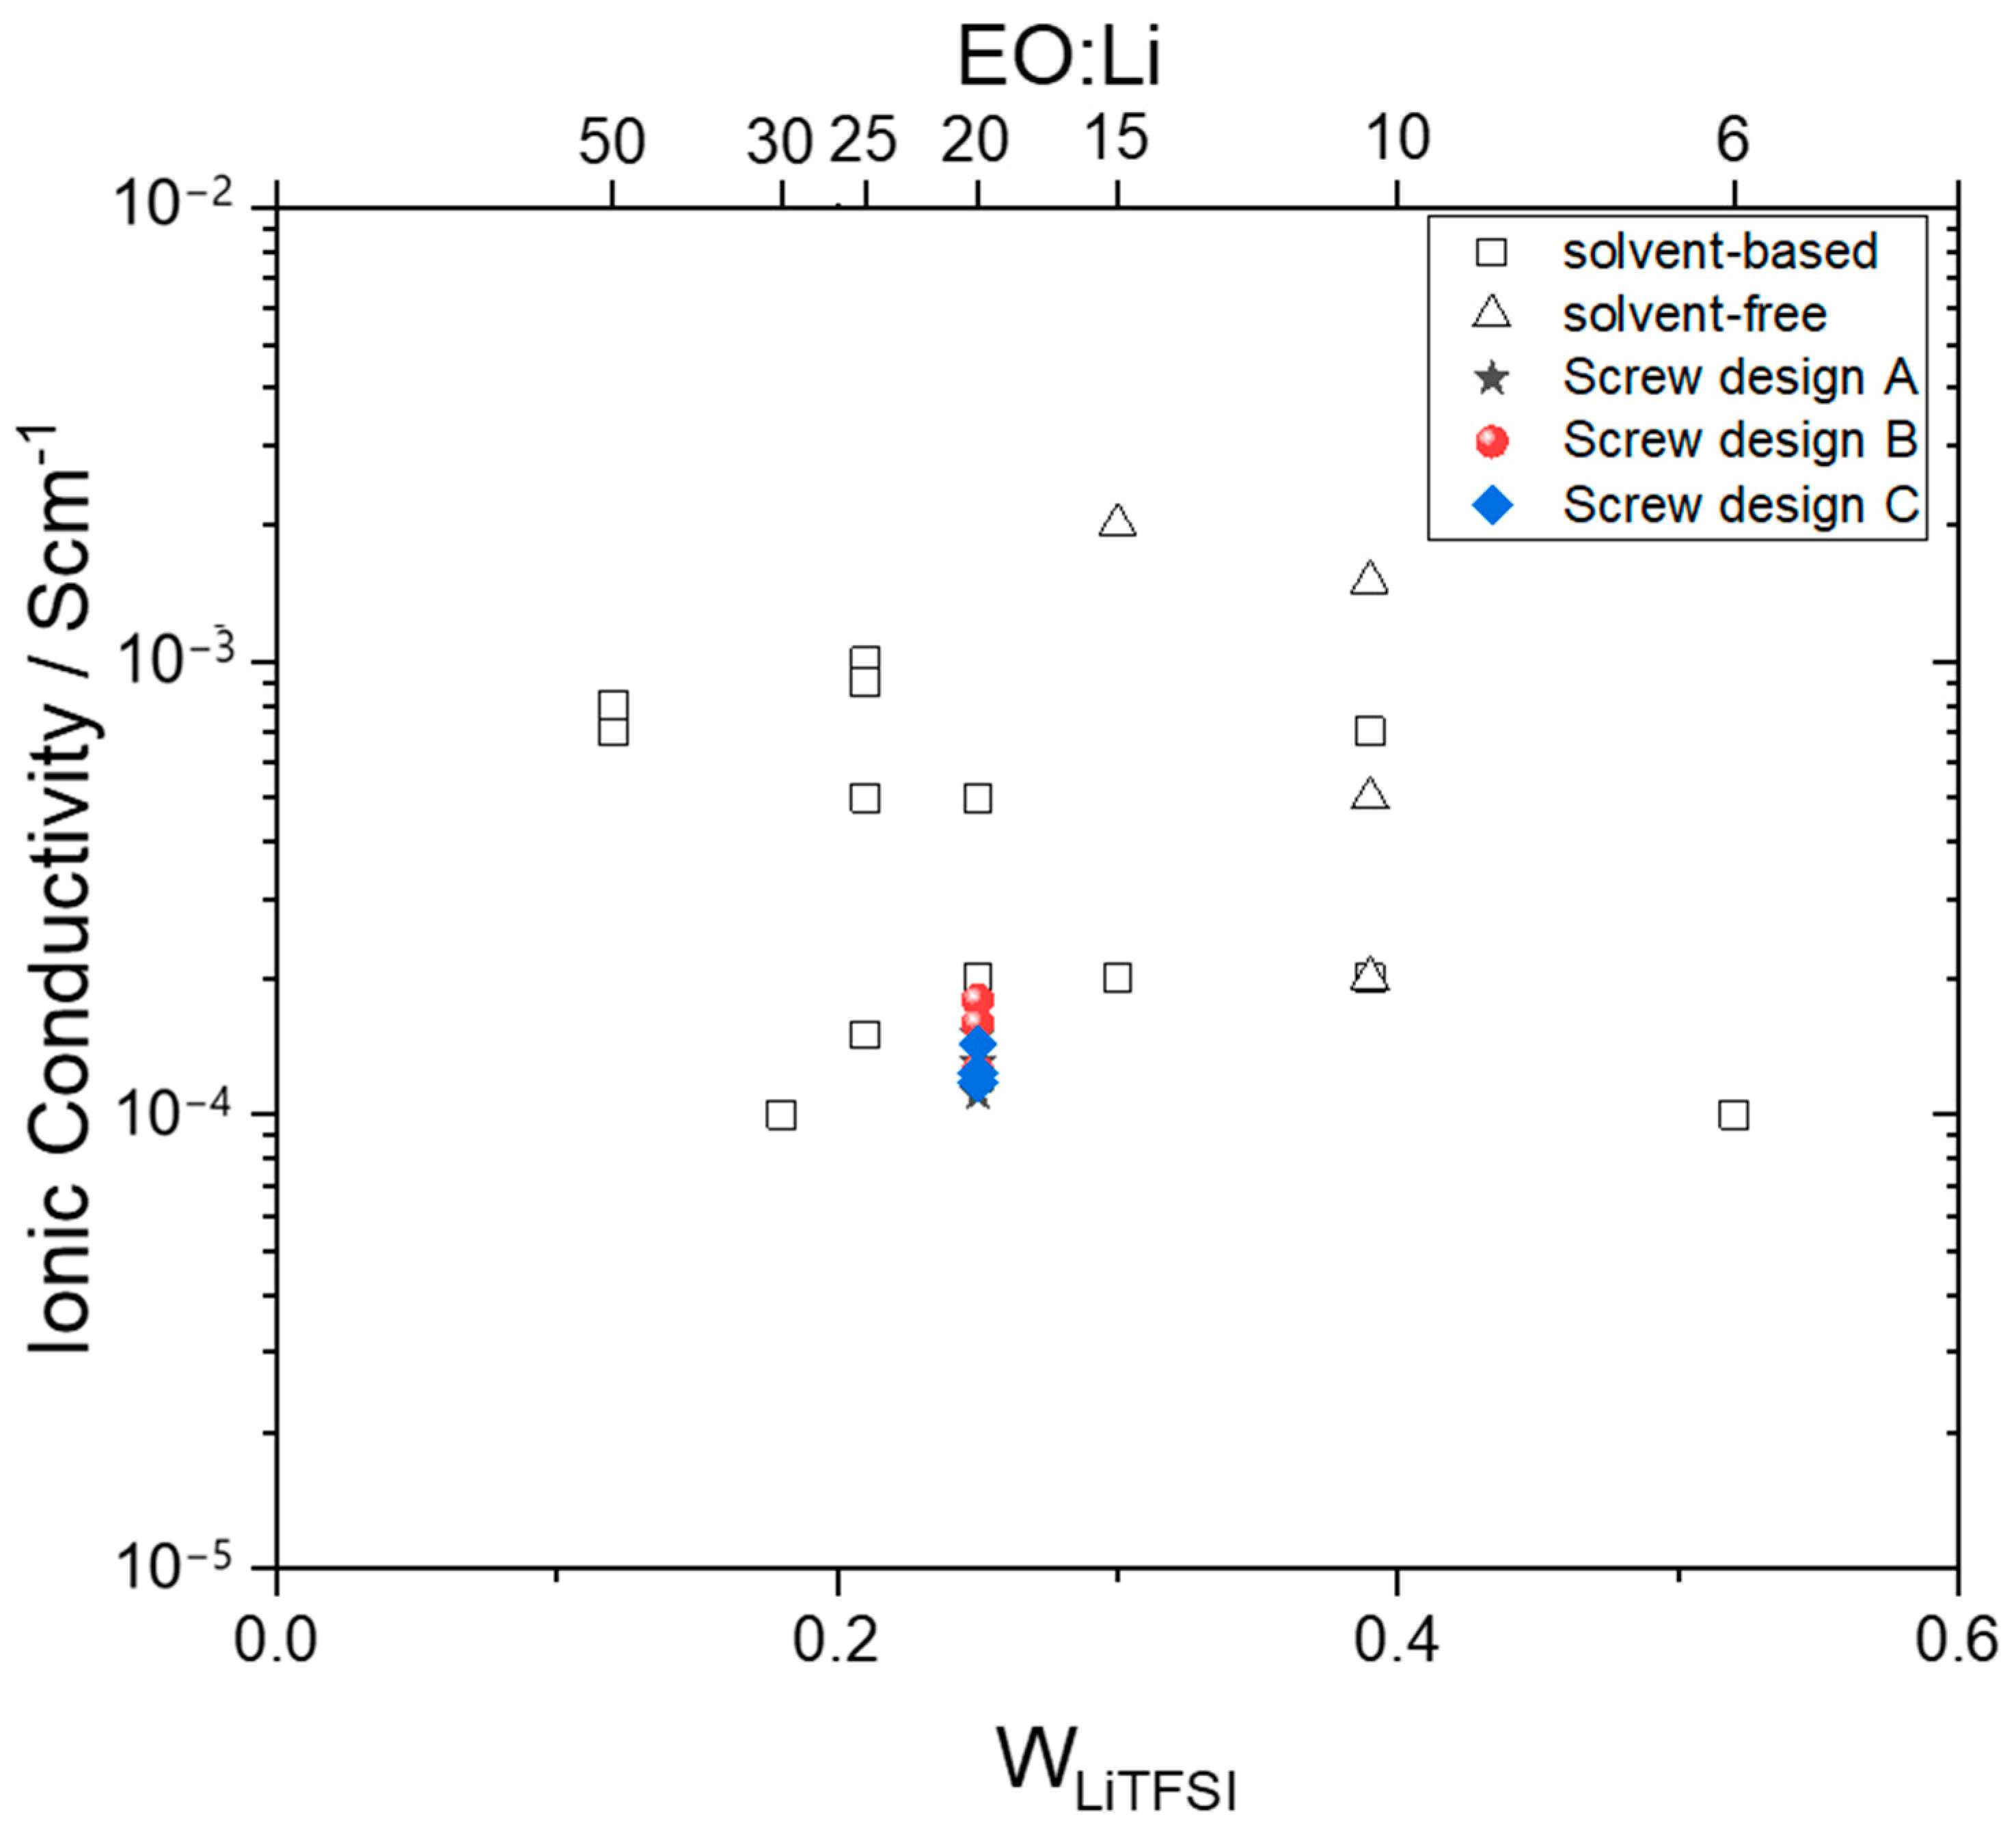
3.5. Electrochemical Characterization
4. Conclusions
Author Contributions
Funding
Data Availability Statement
Acknowledgments
Conflicts of Interest
Appendix A

| Processing Method | Mw of PEO [g mol−1] | EO:Li | wLiTFSI [%] | Ionic Conductivity [Scm−1] | Source |
|---|---|---|---|---|---|
| solvent-based | 5 × 10⁶ | 6:1 | 0.52 | 1.00 × 10⁻⁴ | [55] |
| solvent-based | 90 wt% 1 × 10⁵ + 10 wt% 5 × 10⁶ | 10:1 | 0.39 | 2.00 × 10⁻⁴ | [54] |
| solvent-based | 1 × 10⁵ | 10:1 | 0.39 | 7.00 × 10⁻⁴ | [56] |
| solvent-based | 90 wt% 1 × 10⁵ + 10 wt% 5 × 10⁶ | 15:1 | 0.3 | 2.00 × 10⁻⁴ | [54] |
| solvent-based | 90 wt% 1 × 10⁵ + 10 wt% 5 × 10⁶ | 20:1 | 0.25 | 2.00 × 10⁻⁴ | [54] |
| solvent-based | 1 × 10⁵ | 20:1 | 0.25 | 5.00 × 10⁻⁴ | [56] |
| solvent-based | 90 wt% 1 × 10⁵ + 10 wt% 5 × 10⁶ | 25:1 | 0.21 | 1.50 × 10⁻⁴ | [54] |
| solvent-based | 2 × 10² | 25:1 | 0.21 | 5.00 × 10⁻⁴ | [50] |
| solvent-based | 1 × 10³ | 25:1 | 0.21 | 1.00 × 10⁻³ | [50] |
| solvent-based | 3.5 × 10⁴ | 25:1 | 0.21 | 9.00 × 10⁻⁴ | [50] |
| solvent-based | 90 wt% 1 × 10⁵ + 10 wt% 5 × 10⁶ | 30:1 | 0.18 | 1.00 × 10⁻⁴ | [54] |
| solvent-based | 5 × 10⁶ | 50:1 | 0.12 | 7.00 × 10⁻⁴ | [13] |
| solvent-based | 5 × 10⁶ | 50:1 | 0.12 | 8.00 × 10⁻⁴ | [55] |
| solvent-free | 1 × 10⁶/1 × 105 | 10:1 | 0.39 | 2.00 × 10⁻⁴ | [33] |
| solvent-free | - | 10:1 | 0.39 | 5.00 × 10⁻⁴ | [53] |
| solvent-free | 4 × 10⁶ | 10:1 | 0.39 | 1.50 × 10⁻³ | [52] |
| solvent-free | 4 × 10⁶ | 15:1 | 0.3 | 2.00 × 10⁻³ | [51] |
References
- Chen, Y.; Kang, Y.; Zhao, Y.; Wang, L.; Liu, J.; Li, Y.; Liang, Z.; He, X.; Li, X.; Tavajohi, N.; et al. A review of lithium-ion battery safety concerns: The issues, strategies, and testing standards. J. Energy Chem. 2021, 59, 83–99. [Google Scholar] [CrossRef]
- Wu, X.; Song, K.; Zhang, X.; Hu, N.; Li, L.; Li, W.; Zhang, L.; Zhang, H. Safety Issues in Lithium Ion Batteries: Materials and Cell Design. Front. Energy Res. 2019, 7, 65. [Google Scholar] [CrossRef]
- Larsson, F.; Andersson, P.; Blomqvist, P.; Mellander, B.-E. Toxic fluoride gas emissions from lithium-ion battery fires. Sci. Rep. 2017, 7, 10018. [Google Scholar] [CrossRef] [PubMed]
- Lebedeva, N.P.; Boon-Brett, L. Considerations on the Chemical Toxicity of Contemporary Li-Ion Battery Electrolytes and Their Components. J. Electrochem. Soc. 2016, 163, A821–A830. [Google Scholar] [CrossRef]
- Nedjalkov, A.; Meyer, J.; Köhring, M.; Doering, A.; Angelmahr, M.; Dahle, S.; Sander, A.; Fischer, A.; Schade, W. Toxic Gas Emissions from Damaged Lithium Ion Batteries—Analysis and Safety Enhancement Solution. Batteries 2016, 2, 5. [Google Scholar] [CrossRef]
- Peng, Y.; Yang, L.; Ju, X.; Liao, B.; Ye, K.; Li, L.; Cao, B.; Ni, Y. A comprehensive investigation on the thermal and toxic hazards of large format lithium-ion batteries with LiFePO4 cathode. J. Hazard. Mater. 2020, 381, 120916. [Google Scholar] [CrossRef] [PubMed]
- Janek, J.; Zeier, W.G. A solid future for battery development. Nat. Energy 2016, 1, 16141. [Google Scholar] [CrossRef]
- Sun, C.; Liu, J.; Gong, Y.; Wilkinson, D.P.; Zhang, J. Recent advances in all-solid-state rechargeable lithium batteries. Nano Energy 2017, 33, 363–386. [Google Scholar] [CrossRef]
- Lau, J.; DeBlock, R.H.; Butts, D.M.; Ashby, D.S.; Choi, C.S.; Dunn, B.S. Sulfide Solid Electrolytes for Lithium Battery Applications. Adv. Energy Mater. 2018, 8, 1800933. [Google Scholar] [CrossRef]
- Ren, Y.; Chen, K.; Chen, R.; Liu, T.; Zhang, Y.; Nan, C.-W. Oxide Electrolytes for Lithium Batteries. J. Am. Ceram. Soc. 2015, 98, 3603–3623. [Google Scholar] [CrossRef]
- Mauger, A.; Armand, M.; Julien, C.M.; Zaghib, K. Challenges and issues facing lithium metal for solid-state rechargeable batteries. J. Power Sources 2017, 353, 333–342. [Google Scholar] [CrossRef]
- Wu, Y.; Wang, S.; Li, H.; Chen, L.; Wu, F. Progress in thermal stability of all-solid-state-Li-ion-batteries. InfoMat 2021, 3, 827–853. [Google Scholar] [CrossRef]
- Yue, L.; Ma, J.; Zhang, J.; Zhao, J.; Dong, S.; Liu, Z.; Cui, G.; Chen, L. All solid-state polymer electrolytes for high-performance lithium ion batteries. Energy Storage Mater. 2016, 5, 139–164. [Google Scholar] [CrossRef]
- Placke, T.; Kloepsch, R.; Dühnen, S.; Winter, M. Lithium ion, lithium metal, and alternative rechargeable battery technologies: The odyssey for high energy density. J. Solid. State Electrochem. 2017, 21, 1939–1964. [Google Scholar] [CrossRef]
- Ma, J.; Wang, Z.; Wu, J.; Gu, Z.; Xin, X.; Yao, X. In Situ Solidified Gel Polymer Electrolytes for Stable Solid−State Lithium Batteries at High Temperatures. Batteries 2023, 9, 28. [Google Scholar] [CrossRef]
- Tong, B.; Song, Z.; Wu, H.; Wang, X.; Feng, W.; Zhou, Z.; Zhang, H. Ion transport and structural design of lithium-ion conductive solid polymer electrolytes: A perspective. Mater. Futures 2022, 1, 42103. [Google Scholar] [CrossRef]
- Li, Z.; Liang, W.; Chen, J.; Song, L.; Xiong, T.; Xie, W.; Wu, S.; Hu, D.; Yao, X.; Peng, Z. In-depth Li+ transportation in three-dimensionalized nanodiamond network for improved liquid and solid lithium metal batteries. Nano Energy 2023, 110, 108370. [Google Scholar] [CrossRef]
- Wang, Z.; Shen, L.; Deng, S.; Cui, P.; Yao, X. 10 μm-Thick High-Strength Solid Polymer Electrolytes with Excellent Interface Compatibility for Flexible All-Solid-State Lithium-Metal Batteries. Adv. Mater. 2021, 33, e2100353. [Google Scholar] [CrossRef] [PubMed]
- Janek, J.; Zeier, W.G. Challenges in speeding up solid-state battery development. Nat. Energy 2023, 8, 230–240. [Google Scholar] [CrossRef]
- Arya, A.; Sharma, A.L. Polymer electrolytes for lithium ion batteries: A critical study. Ionics 2017, 23, 497–540. [Google Scholar] [CrossRef]
- Yang, J.; Wang, X.; Zhang, G.; Ma, A.; Chen, W.; Shao, L.; Shen, C.; Xie, K. High-Performance Solid Composite Polymer Electrolyte for all Solid-State Lithium Battery through Facile Microstructure Regulation. Front. Chem. 2019, 7, 388. [Google Scholar] [CrossRef] [PubMed]
- Jinisha, B.; Anilkumar, K.M.; Manoj, M.; Pradeep, V.S.; Jayalekshmi, S. Development of a novel type of solid polymer electrolyte for solid state lithium battery applications based on lithium enriched poly (ethylene oxide) (PEO)/poly (vinyl pyrrolidone) (PVP) blend polymer. Electrochim. Acta 2017, 235, 210–222. [Google Scholar] [CrossRef]
- Chen, F.; Yang, D.; Zha, W.; Zhu, B.; Zhang, Y.; Li, J.; Gu, Y.; Shen, Q.; Zhang, L.; Sadoway, D.R. Solid polymer electrolytes incorporating cubic Li7La3Zr2O12 for all-solid-state lithium rechargeable batteries. Electrochim. Acta 2017, 258, 1106–1114. [Google Scholar] [CrossRef]
- Kimura, K.; Yajima, M.; Tominaga, Y. A highly-concentrated Poly(ethylene carbonate)-based electrolyte for all-solid-state Li battery working at room temperature. Electrochem. Commun. 2016, 66, 46–48. [Google Scholar] [CrossRef]
- Polu, A.R.; Rhee, H.-W.; Kim, D.K. New solid polymer electrolytes (PEO20–LiTDI–SN) for lithium batteries: Structural, thermal and ionic conductivity studies. J. Mater. Sci. Mater. Electron. 2015, 26, 8548–8554. [Google Scholar] [CrossRef]
- Zhang, X.; Wang, S.; Xue, C.; Xin, C.; Lin, Y.; Shen, Y.; Li, L.; Nan, C.-W. Self-Suppression of Lithium Dendrite in All-Solid-State Lithium Metal Batteries with Poly(vinylidene difluoride)-Based Solid Electrolytes. Adv. Mater. 2019, 31, e1806082. [Google Scholar] [CrossRef]
- Miao, R.; Liu, B.; Zhu, Z.; Liu, Y.; Li, J.; Wang, X.; Li, Q. PVDF-HFP-based porous polymer electrolyte membranes for lithium-ion batteries. J. Power Sources 2008, 184, 420–426. [Google Scholar] [CrossRef]
- Foran, G.; Mankovsky, D.; Verdier, N.; Lepage, D.; Prébé, A.; Aymé-Perrot, D.; Dollé, M. The Impact of Absorbed Solvent on the Performance of Solid Polymer Electrolytes for Use in Solid-State Lithium Batteries. iScience 2020, 23, 101597. [Google Scholar] [CrossRef]
- Liu, Y.; Zhang, R.; Wang, J.; Wang, Y. Current and future lithium-ion battery manufacturing. iScience 2021, 24, 102332. [Google Scholar] [CrossRef] [PubMed]
- Schünemann, J.-H.; Dreger, H.; Bockholt, H.; Kwade, A. Smart Electrode Processing for Battery Cost Reduction. ECS Trans. 2016, 73, 153–159. [Google Scholar] [CrossRef]
- Schnell, J.; Günther, T.; Knoche, T.; Vieider, C.; Köhler, L.; Just, A.; Keller, M.; Passerini, S.; Reinhart, G. All-solid-state lithium-ion and lithium metal batteries—Paving the way to large-scale production. J. Power Sources 2018, 382, 160–175. [Google Scholar] [CrossRef]
- Appetecchi, G.B.; Hassoun, J.; Scrosati, B.; Croce, F.; Cassel, F.; Salomon, M. Hot-pressed, solvent-free, nanocomposite, PEO-based electrolyte membranes. J. Power Sources 2003, 124, 246–253. [Google Scholar] [CrossRef]
- Gray, F.M.; MacCallum, J.R.; Vincent, C.A. Poly(ethylene oxide)—LiCF3SO 3—polystyrene electrolyte systems. Solid. State Ion. 1986, 18, 282–286. [Google Scholar] [CrossRef]
- Wang, L.; Li, X.; Yang, W. Enhancement of electrochemical properties of hot-pressed Poly(ethylene oxide)-based nanocomposite polymer electrolyte films for all-solid-state lithium polymer batteries. Electrochim. Acta 2010, 55, 1895–1899. [Google Scholar] [CrossRef]
- Mejía, A.; Devaraj, S.; Guzmán, J.; Del Lopez Amo, J.M.; García, N.; Rojo, T.; Armand, M.; Tiemblo, P. Scalable plasticized polymer electrolytes reinforced with surface-modified sepiolite fillers—A feasibility study in lithium metal polymer batteries. J. Power Sources 2016, 306, 772–778. [Google Scholar] [CrossRef]
- Helmers, L.; Froböse, L.; Friedrich, K.; Steffens, M.; Kern, D.; Michalowski, P.; Kwade, A. Sustainable Solvent-Free Production and Resulting Performance of Polymer Electrolyte-Based All-Solid-State Battery Electrodes. Energy Technol. 2021, 9, 2000923. [Google Scholar] [CrossRef]
- Froboese, L.; Groffmann, L.; Monsees, F.; Helmers, L.; Loellhoeffel, T.; Kwade, A. Enhancing the Lithium Ion Conductivity of an All Solid-State Electrolyte via Dry and Solvent-Free Scalable Series Production Processes. J. Electrochem. Soc. 2020, 167, 20558. [Google Scholar] [CrossRef]
- Edman, L.; Ferry, A.; Doeff, M.M. Slow recrystallization in the polymer electrolyte system Poly(ethylene oxide)n–LiN(CF3SO2)2. J. Mater. Res. 2000, 15, 1950–1954. [Google Scholar] [CrossRef]
- Marzantowicz, M.; Dygas, J.R.; Krok, F.; Nowiński, J.L.; Tomaszewska, A.; Florjańczyk, Z.; Zygadło-Monikowska, E. Crystalline phases, morphology and conductivity of PEO:LiTFSI electrolytes in the eutectic region. J. Power Sources 2006, 159, 420–430. [Google Scholar] [CrossRef]
- Zhang, H.; Liu, C.; Zheng, L.; Xu, F.; Feng, W.; Li, H.; Huang, X.; Armand, M.; Nie, J.; Zhou, Z. Lithium bis(fluorosulfonyl)imide/poly(ethylene oxide) polymer electrolyte. Electrochim. Acta 2014, 133, 529–538. [Google Scholar] [CrossRef]
- Nair, J.R.; Imholt, L.; Brunklaus, G.; Winter, M. Lithium Metal Polymer Electrolyte Batteries: Opportunities and Challenges. Electrochem. Soc. Interface 2019, 28, 55–61. [Google Scholar] [CrossRef]
- Crowley, M.M. Physiochemical and Mechanical Characterization of Hot-Melt Extruded Dosage Forms. Ph.D. Thesis, The University of Texas at Austin ProQuest Dissertation & Theses, Austin, TX, USA, 2003. [Google Scholar]
- Crowley, M.M.; Zhang, F.; Koleng, J.J.; McGinity, J.W. Stability of polyethylene oxide in matrix tablets prepared by hot-melt extrusion. Biomaterials 2002, 23, 4241–4248. [Google Scholar] [CrossRef] [PubMed]
- Fenton, D.E.; Parker, J.M.; Wright, P.V. Complexes of alkali metal ions with Poly(ethylene oxide). Polymer 1973, 14, 589. [Google Scholar] [CrossRef]
- Platen, K.; Langer, F.; Bayer, R.; Hollmann, R.; Schwenzel, J.; Busse, M. Influence of Molecular Weight and Lithium Bis(trifluoromethanesulfonyl)imide on the Thermal Processability of Poly(ethylene oxide) for Solid-State Electrolytes. Polymers 2023, 15, 3375. [Google Scholar] [CrossRef] [PubMed]
- Borghini, M.C.; Mastragostino, M.; Passerini, S.; Scrosati, B. Electrochemical Properties of Polyethylene Oxide—Li [(CF3SO2)2 N]—Gamma—LiAlO2 Composite Polymer Electrolytes. J. Electrochem. Soc. 1995, 142, 2118–2121. [Google Scholar] [CrossRef]
- Mindemark, J.; Lacey, M.J.; Bowden, T.; Brandell, D. Beyond PEO—Alternative host materials for Li + -conducting solid polymer electrolytes. Prog. Polym. Sci. 2018, 81, 114–143. [Google Scholar] [CrossRef]
- Kohlgrüber, K. (Ed.) Co-Rotating Twin-Screw Extruders: Applications; Hanser Publications: Munich, Germany; Cincinnati, OH, USA, 2021; ISBN 978-1-56990-781-8. [Google Scholar]
- Marzantowicz, M.; Dygas, J.R.; Krok, F.; Florjańczyk, Z.; Zygadło-Monikowska, E. Influence of crystallization on dielectric properties of PEO:LiTFSI polymer electrolyte. J. Non-Cryst. Solids 2006, 352, 5216–5223. [Google Scholar] [CrossRef]
- Devaux, D.; Bouchet, R.; Glé, D.; Denoyel, R. Mechanism of ion transport in PEO/LiTFSI complexes: Effect of temperature, molecular weight and end groups. Solid. State Ion. 2012, 227, 119–127. [Google Scholar] [CrossRef]
- Kim, Y.-T.; Smotkin, E.S. The effect of plasticizers on transport and electrochemical properties of PEO-based electrolytes for lithium rechargeable batteries. Solid. State Ion. 2002, 149, 29–37. [Google Scholar] [CrossRef]
- Kim, G.T.; Appetecchi, G.B.; Carewska, M.; Joost, M.; Balducci, A.; Winter, M.; Passerini, S. UV cross-linked, lithium-conducting ternary polymer electrolytes containing ionic liquids. J. Power Sources 2010, 195, 6130–6137. [Google Scholar] [CrossRef]
- Graebe, H.; Netz, A.; Baesch, S.; Haerdtner, V.; Kwade, A. A Solvent-Free Electrode Coating Technique for All Solid State Lithium Ion Batteries. ECS Trans. 2017, 77, 393–401. [Google Scholar] [CrossRef]
- Maurel, A.; Armand, M.; Grugeon, S.; Fleutot, B.; Davoisne, C.; Tortajada, H.; Courty, M.; Panier, S.; Dupont, L. Poly(ethylene oxide)−LiTFSI Solid Polymer Electrolyte Filaments for Fused Deposition Modeling Three-Dimensional Printing. J. Electrochem. Soc. 2020, 167, 70536. [Google Scholar] [CrossRef]
- Marzantowicz, M.; Dygas, J.R.; Krok, F.; Łasińska, A.; Florjańczyk, Z.; Zygadło-Monikowska, E.; Affek, A. Crystallization and melting of PEO:LiTFSI polymer electrolytes investigated simultaneously by impedance spectroscopy and polarizing microscopy. Electrochim. Acta 2005, 50, 3969–3977. [Google Scholar] [CrossRef]
- Abels, G. Grenzschichtverhalten von Polymerelektrolyten Gegenüber Elektrodenmaterialien für Zukünftige Hochenergie-Lithium-Ionen Sekundärbatterien. Doctoral Dissertation, Universität Bremen, Bremen, Germany, 2022. [Google Scholar]
- Hallinan, D.T.; Balsara, N.P. Polymer Electrolytes. Annu. Rev. Mater. Res. 2013, 43, 503–525. [Google Scholar] [CrossRef]


Disclaimer/Publisher’s Note: The statements, opinions and data contained in all publications are solely those of the individual author(s) and contributor(s) and not of MDPI and/or the editor(s). MDPI and/or the editor(s) disclaim responsibility for any injury to people or property resulting from any ideas, methods, instructions or products referred to in the content. |
© 2024 by the authors. Licensee MDPI, Basel, Switzerland. This article is an open access article distributed under the terms and conditions of the Creative Commons Attribution (CC BY) license (https://creativecommons.org/licenses/by/4.0/).
Share and Cite
Platen, K.; Langer, F.; Schwenzel, J. Influence of Screw Design and Process Parameters on the Product Quality of PEO:LiTFSI Solid Electrolytes Using Solvent-Free Melt Extrusion. Batteries 2024, 10, 183. https://doi.org/10.3390/batteries10060183
Platen K, Langer F, Schwenzel J. Influence of Screw Design and Process Parameters on the Product Quality of PEO:LiTFSI Solid Electrolytes Using Solvent-Free Melt Extrusion. Batteries. 2024; 10(6):183. https://doi.org/10.3390/batteries10060183
Chicago/Turabian StylePlaten, Katharina, Frederieke Langer, and Julian Schwenzel. 2024. "Influence of Screw Design and Process Parameters on the Product Quality of PEO:LiTFSI Solid Electrolytes Using Solvent-Free Melt Extrusion" Batteries 10, no. 6: 183. https://doi.org/10.3390/batteries10060183