

Rapid Estimation of Static Capacity Based on Machine Learning: A Time-Efficient Approach


Abstract
:1. Introduction
1.1. A Review of SOH Estimation Method for Li-Ion Batteries
1.2. Structure of the Paper
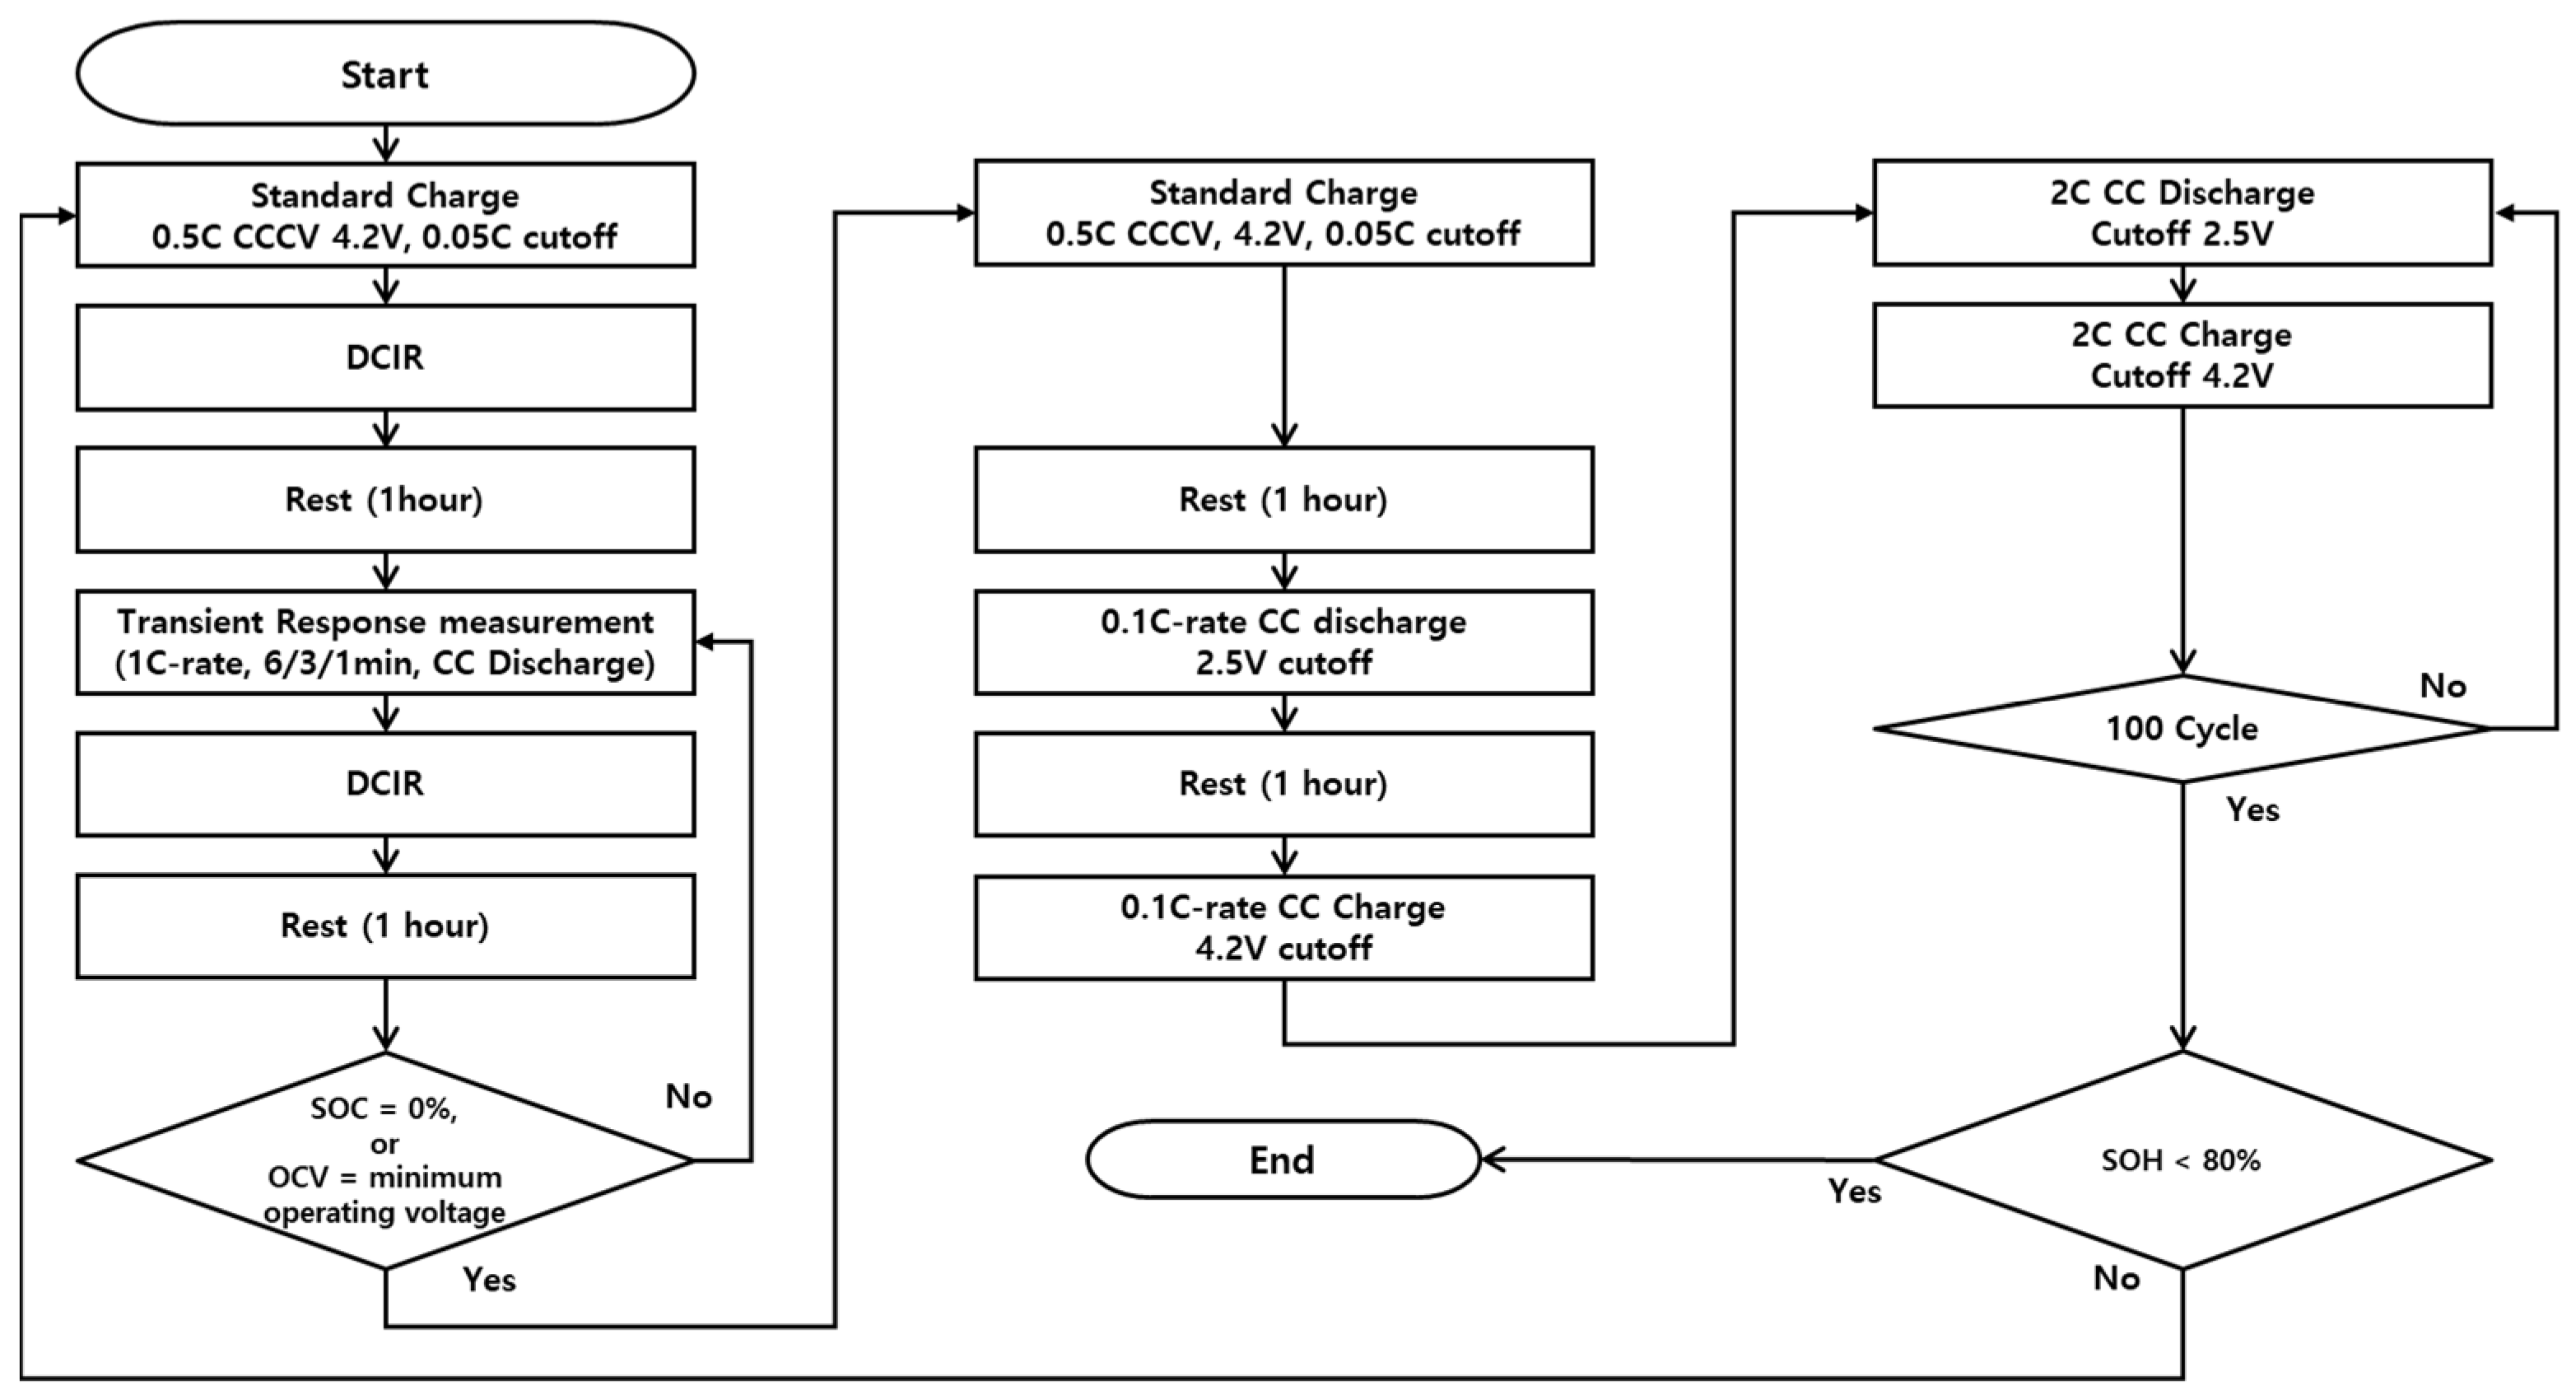
2. Experimental Setup and Methodology
2.1. Experimental Configuration
2.2. Data Analysis
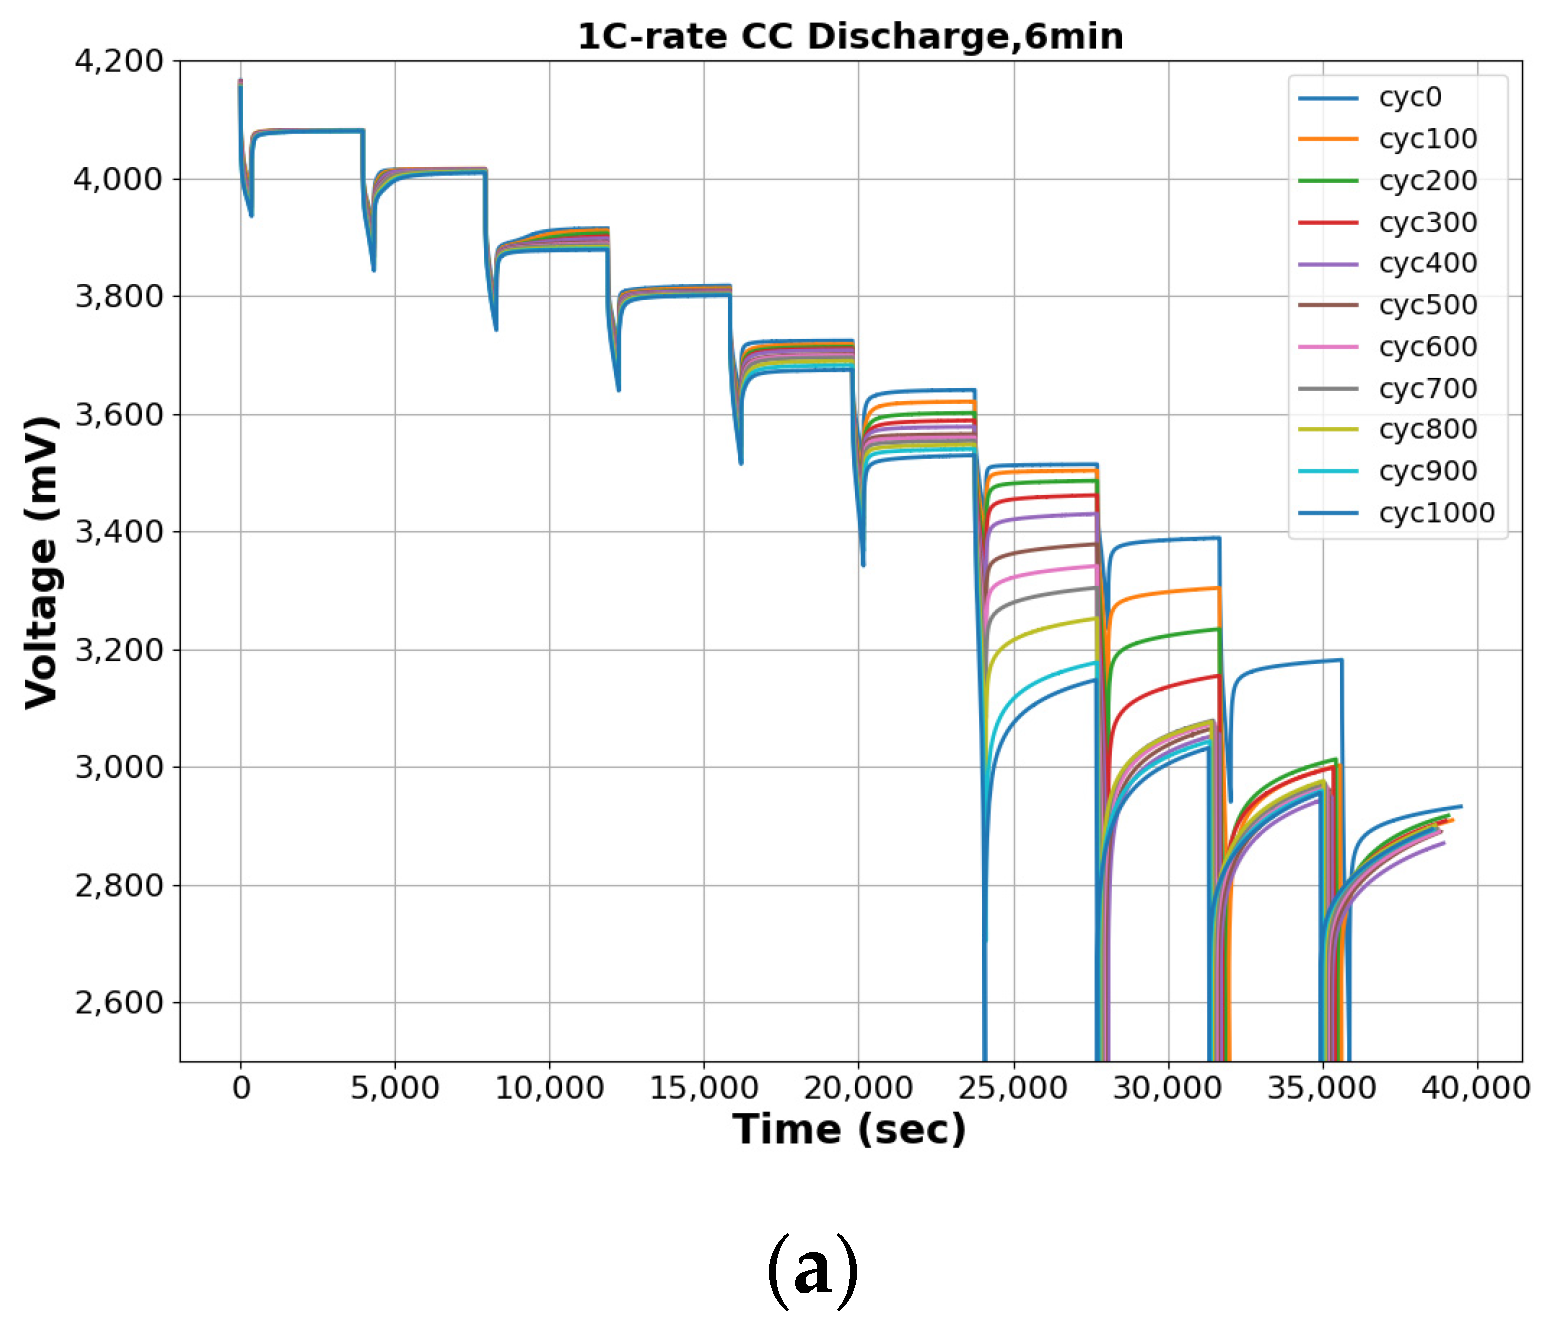
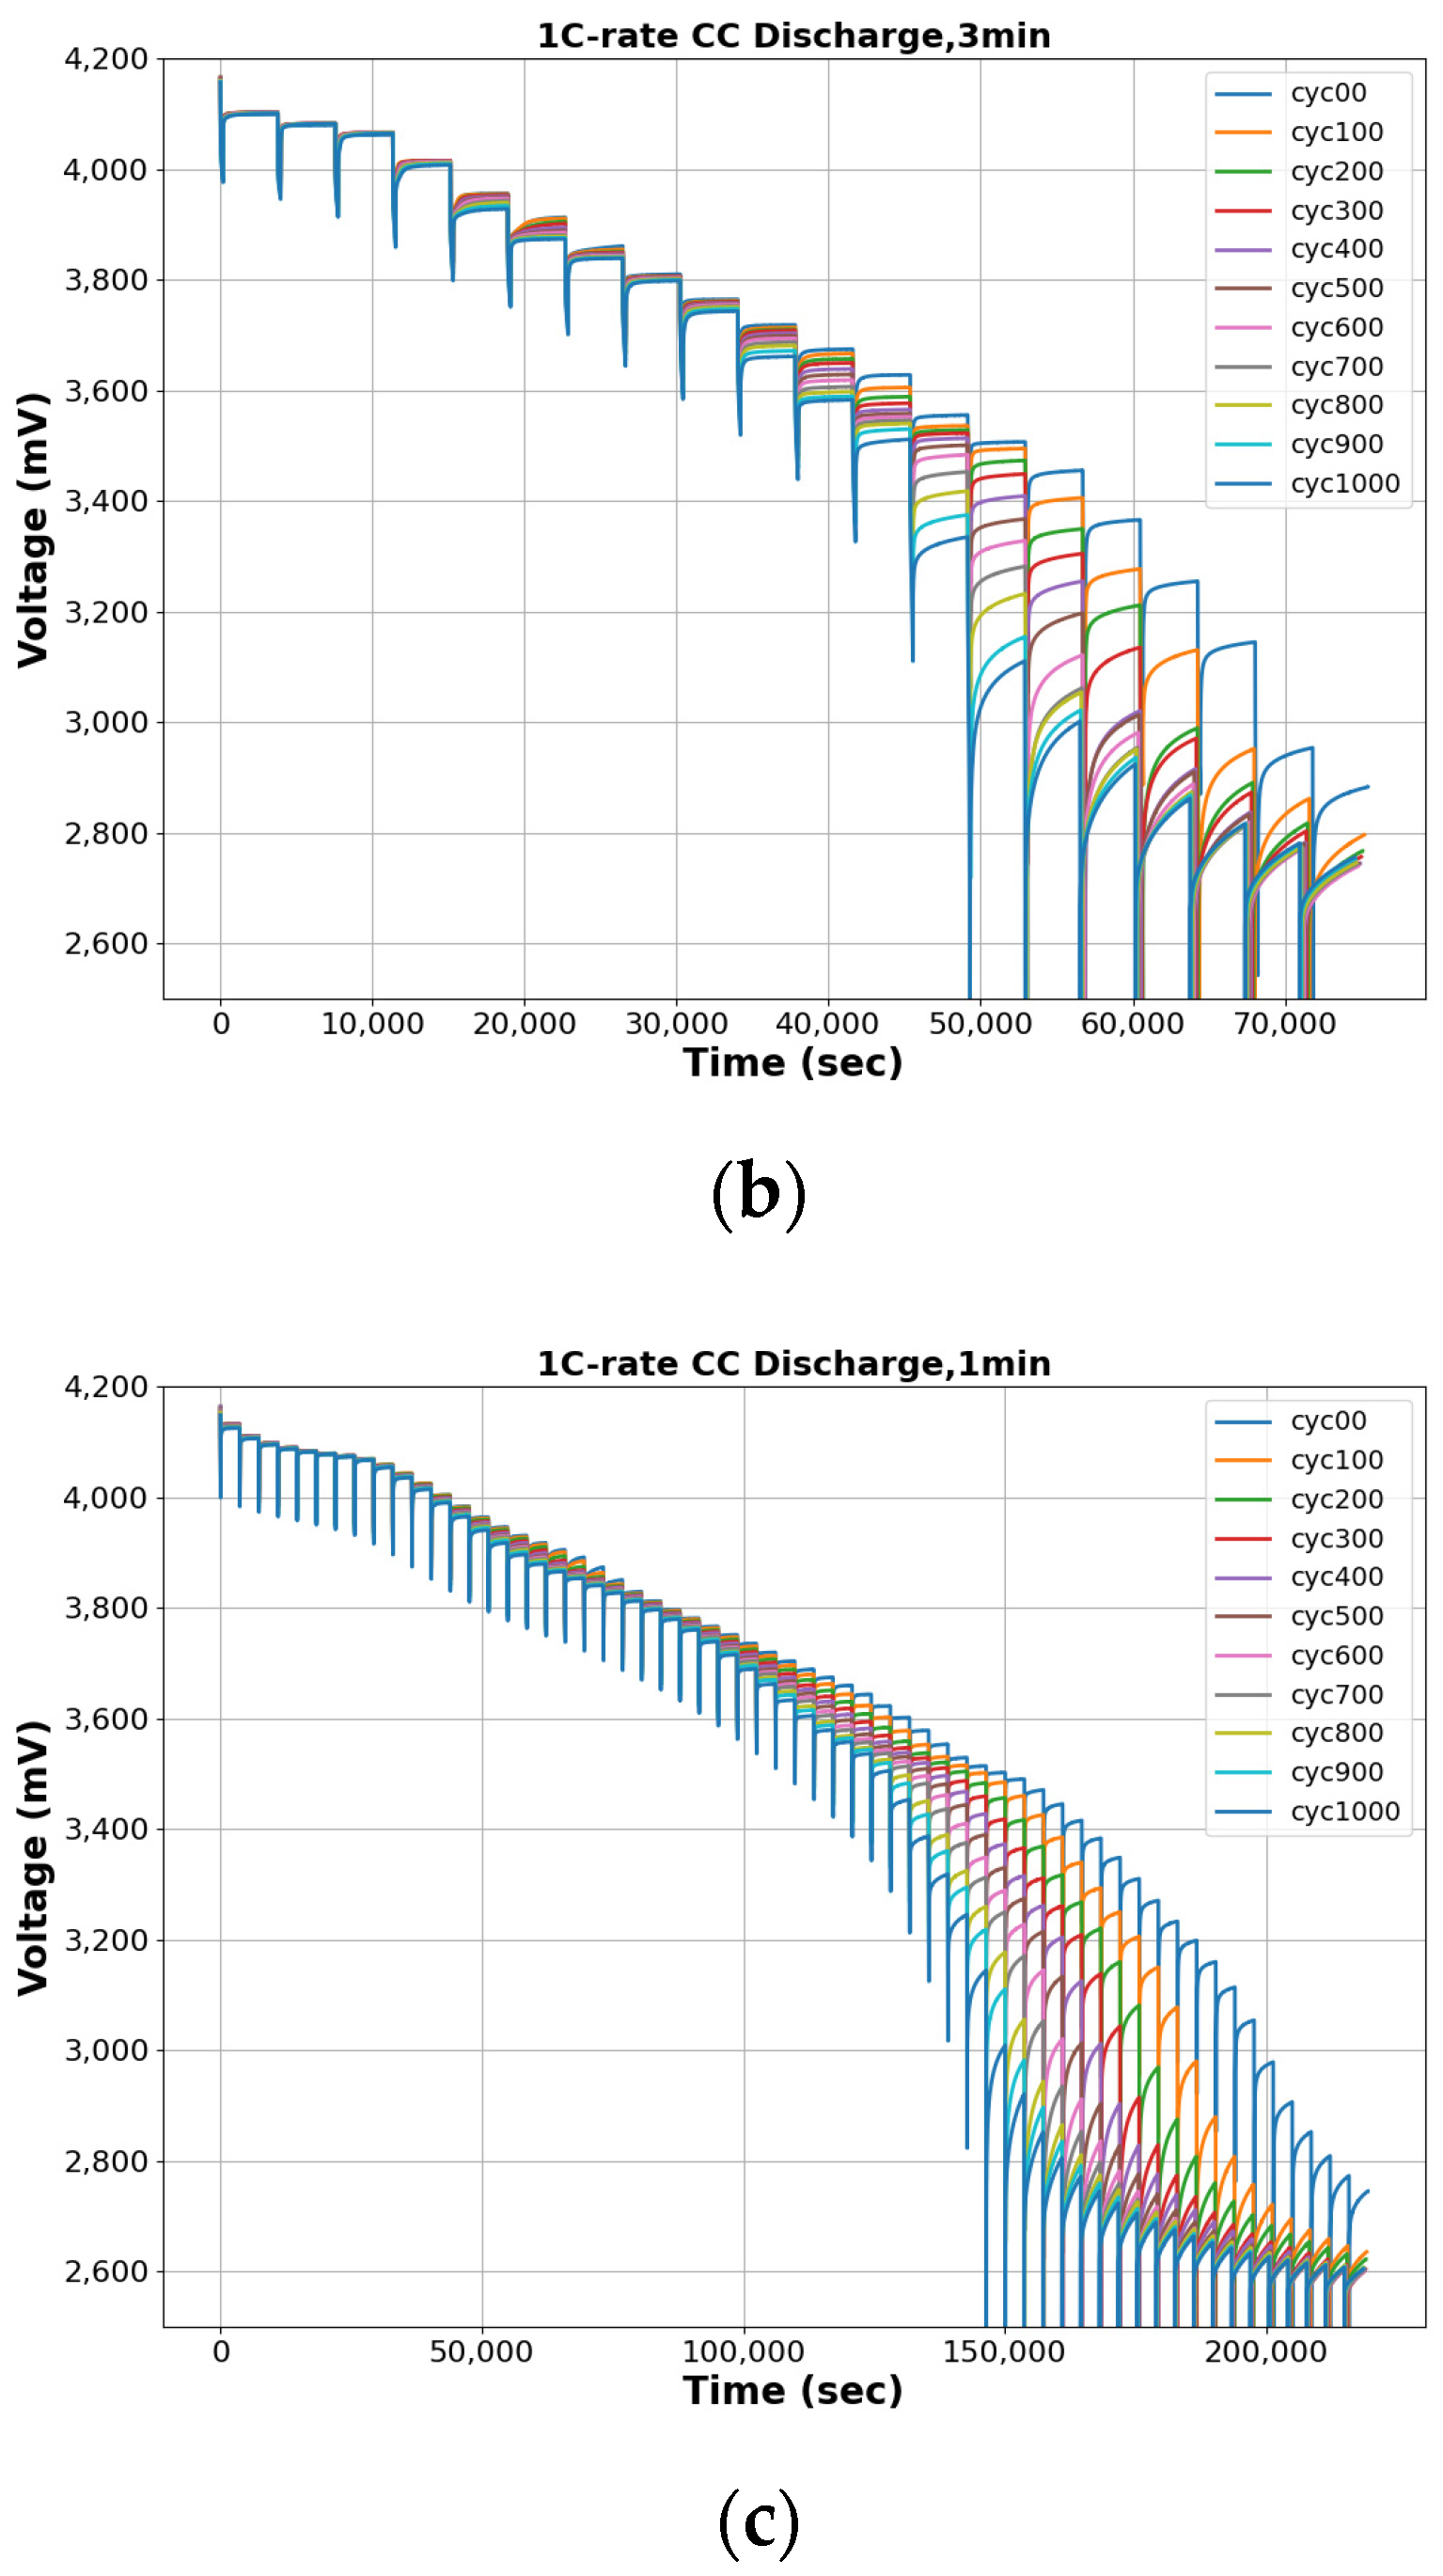
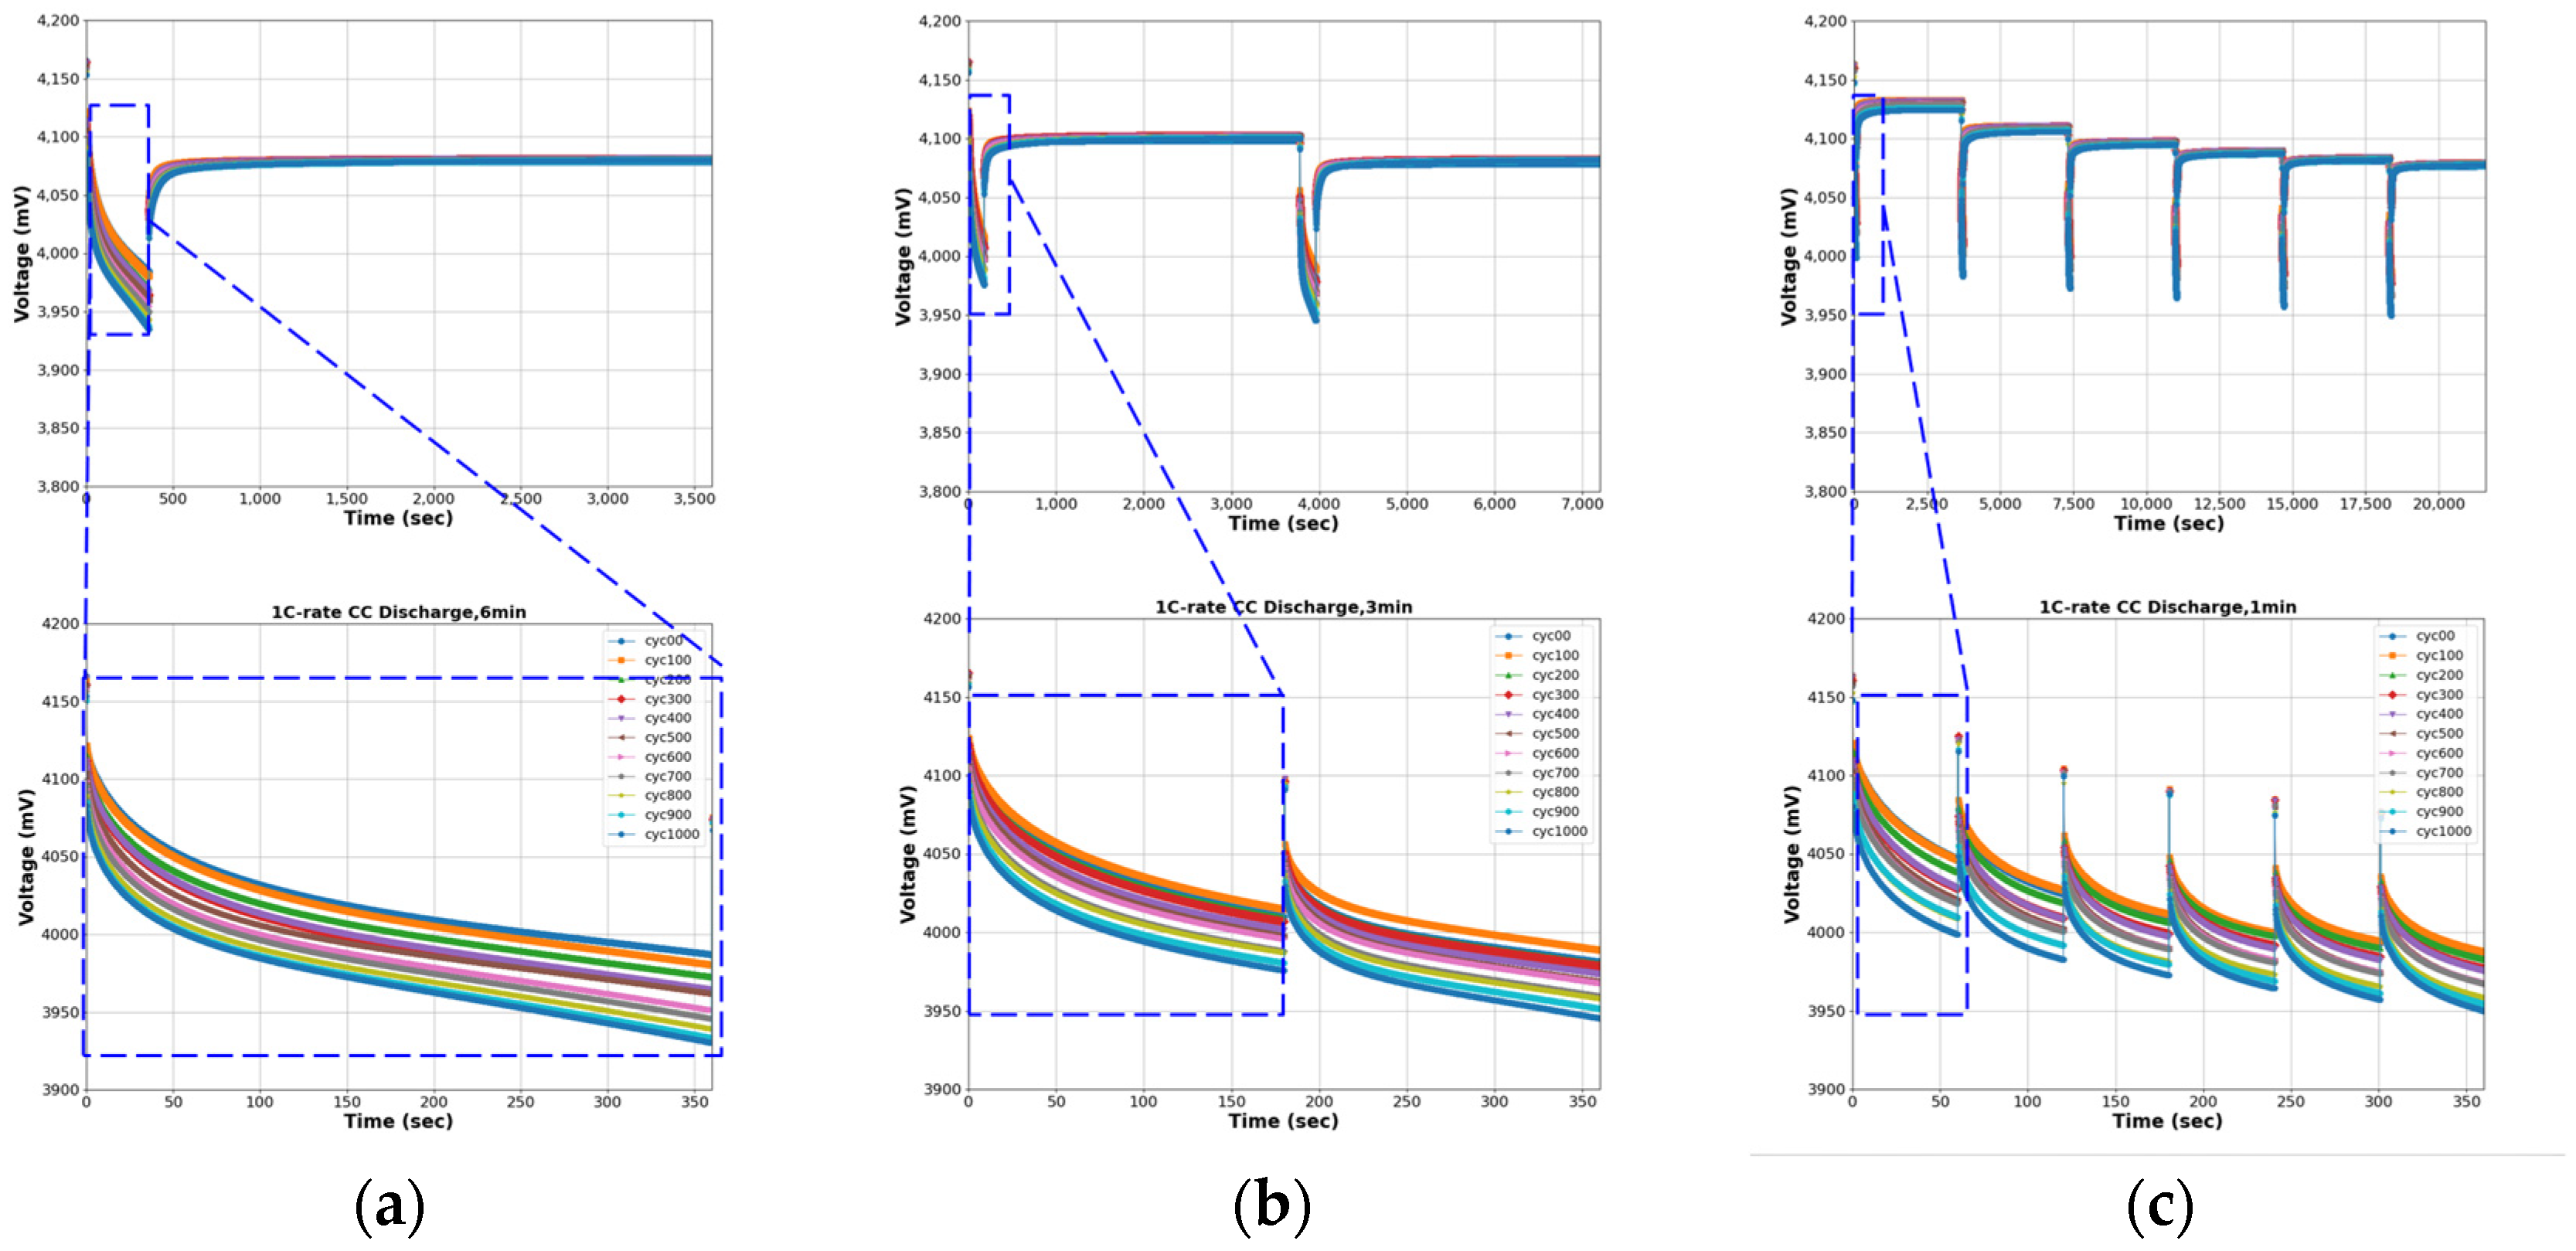
2.2.1. Transient Voltage Response Analysis
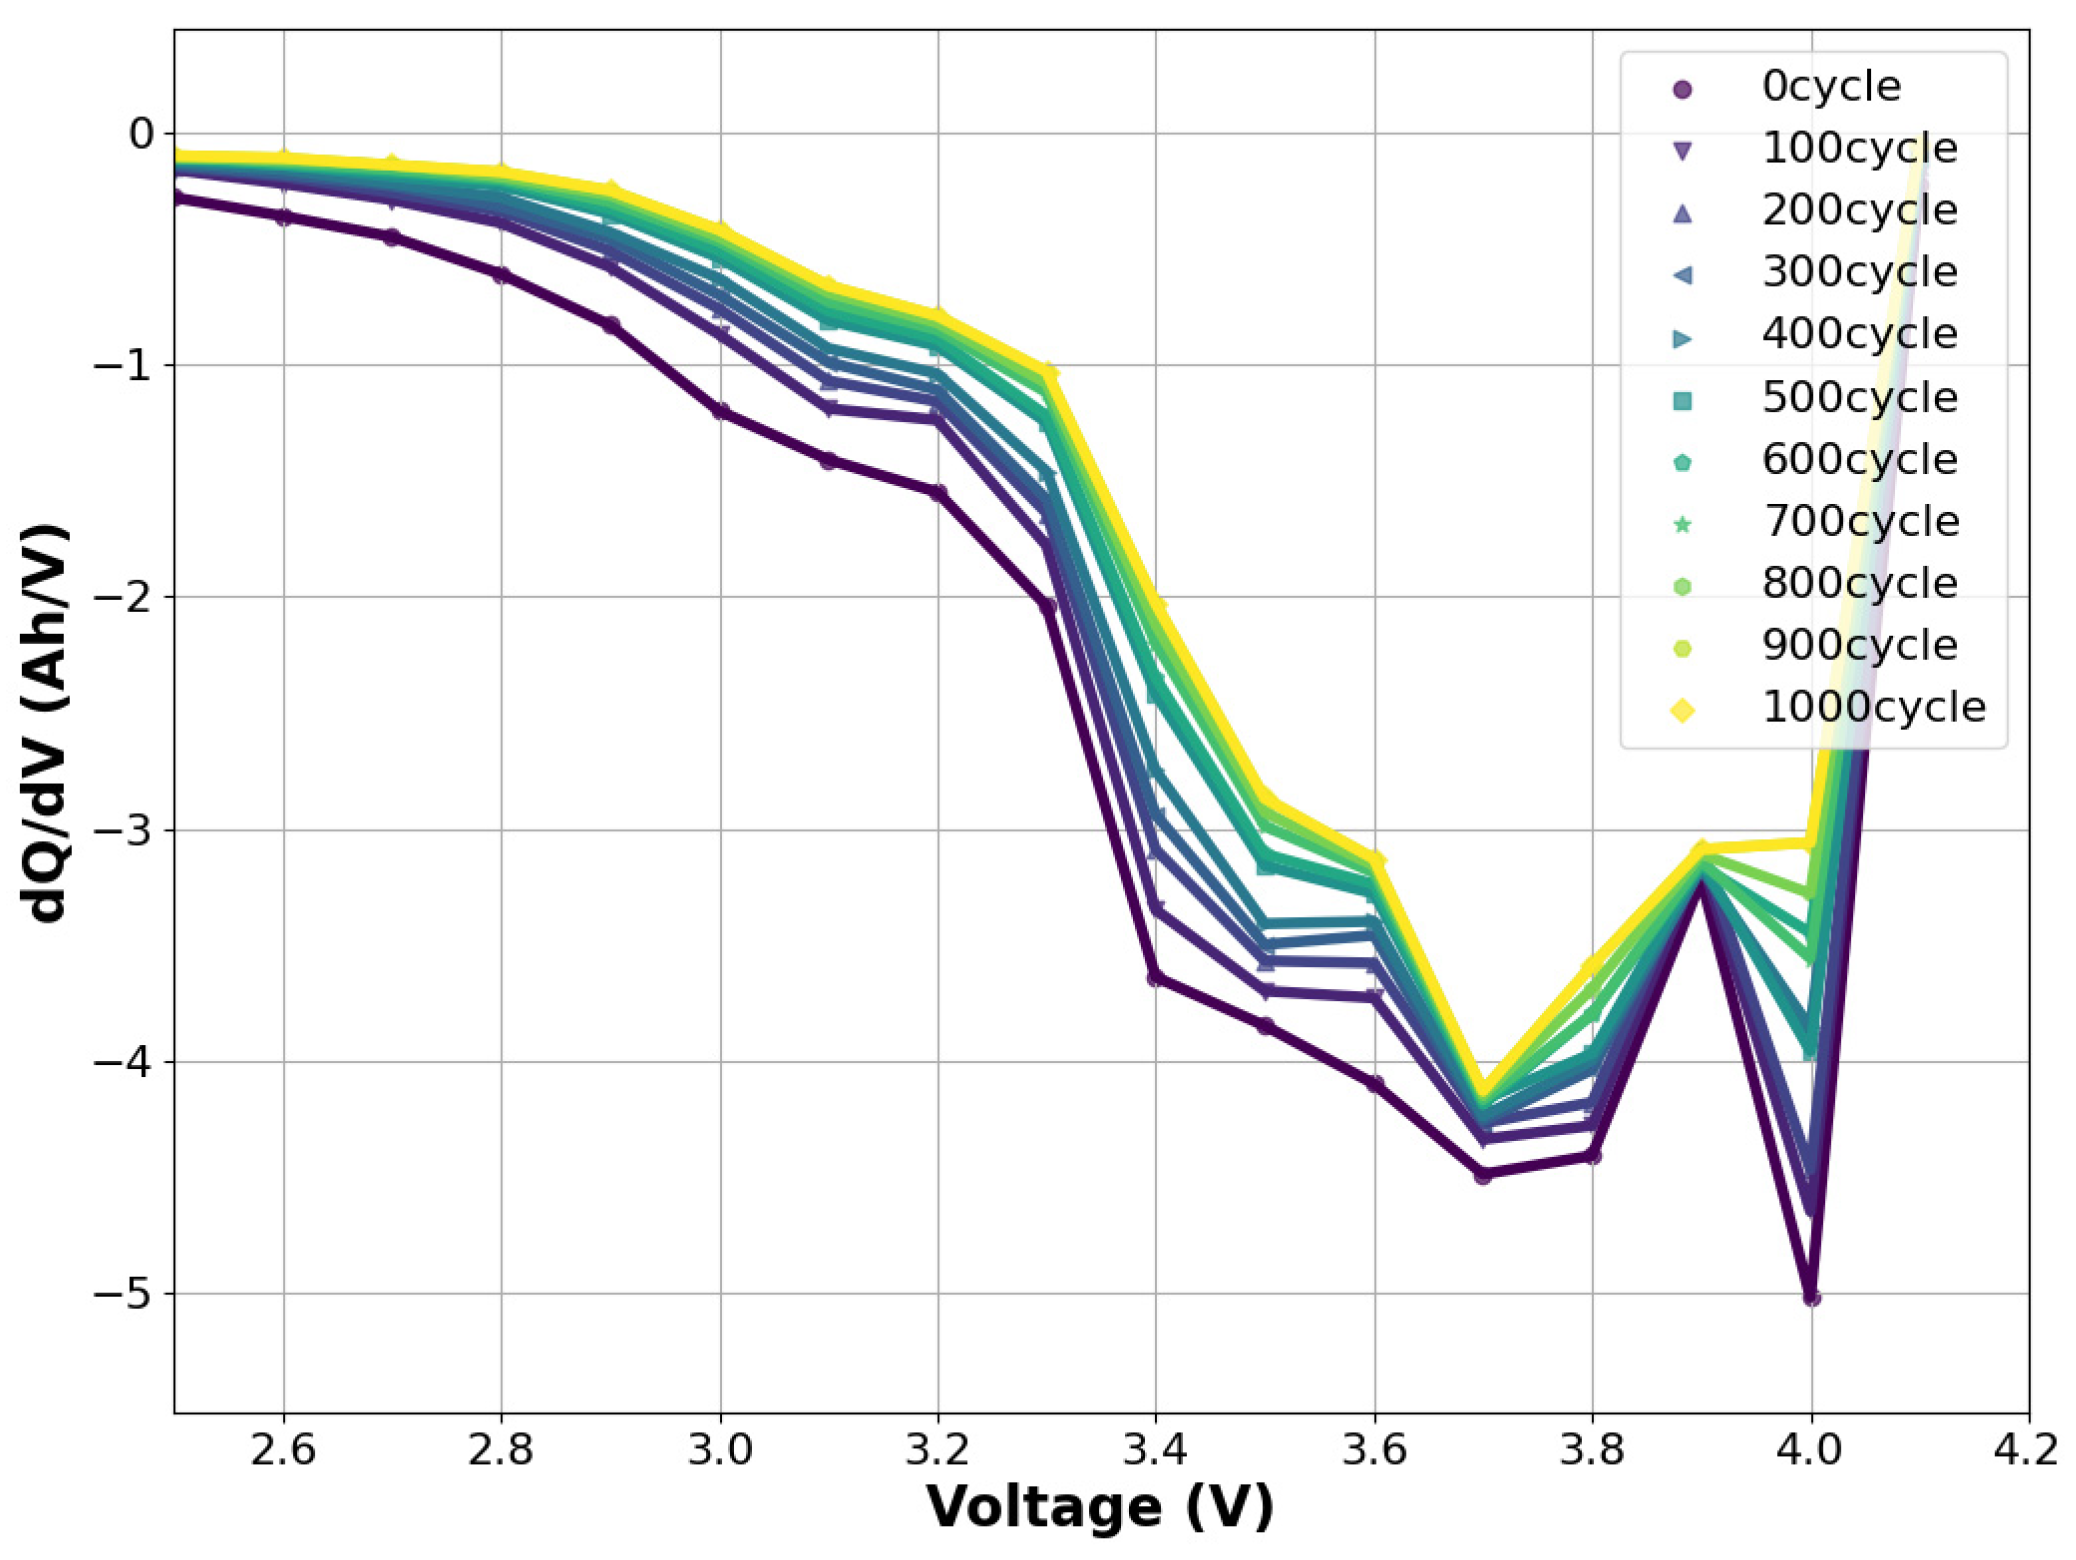
2.2.2. Incremental Capacity Analysis
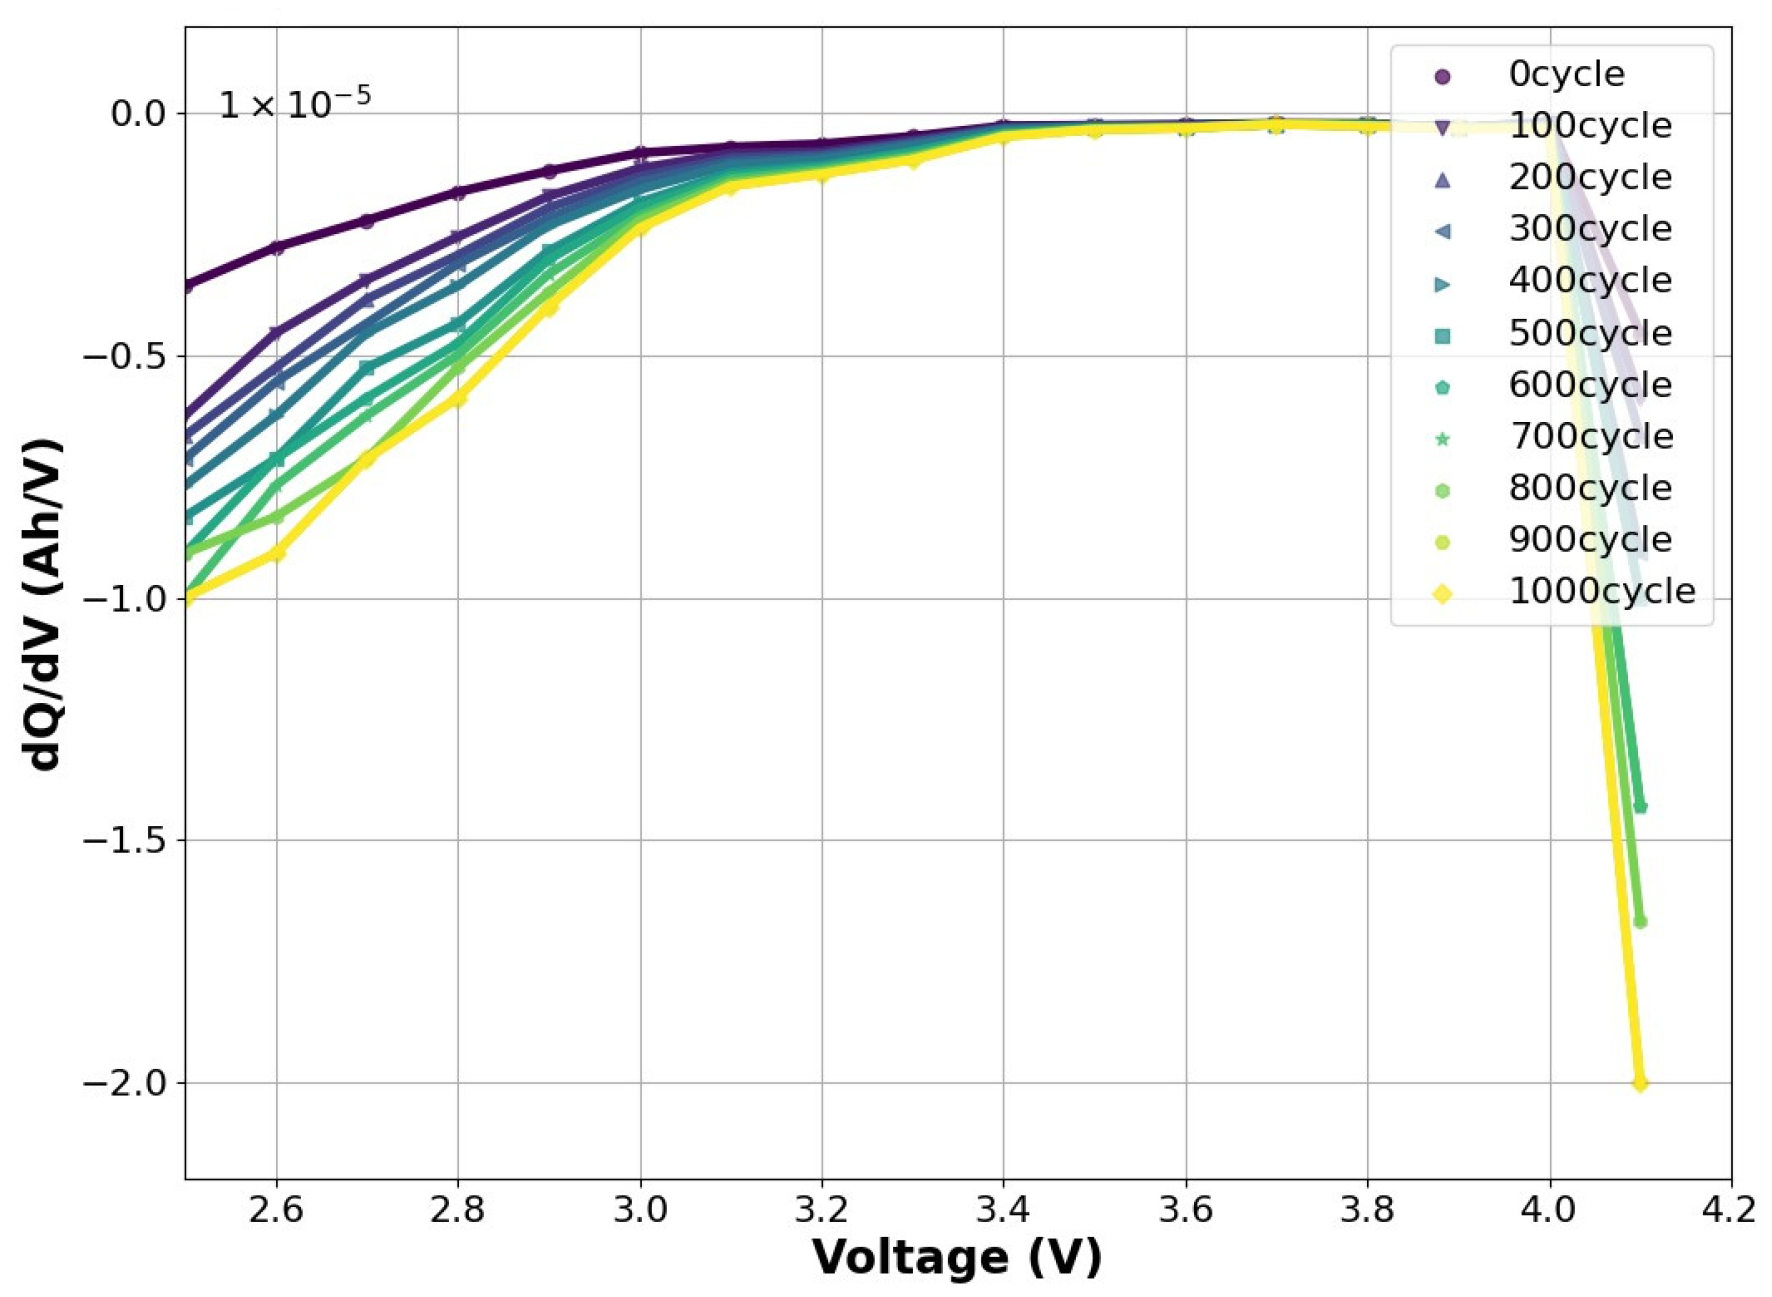
2.2.3. Differential Voltage Analysis
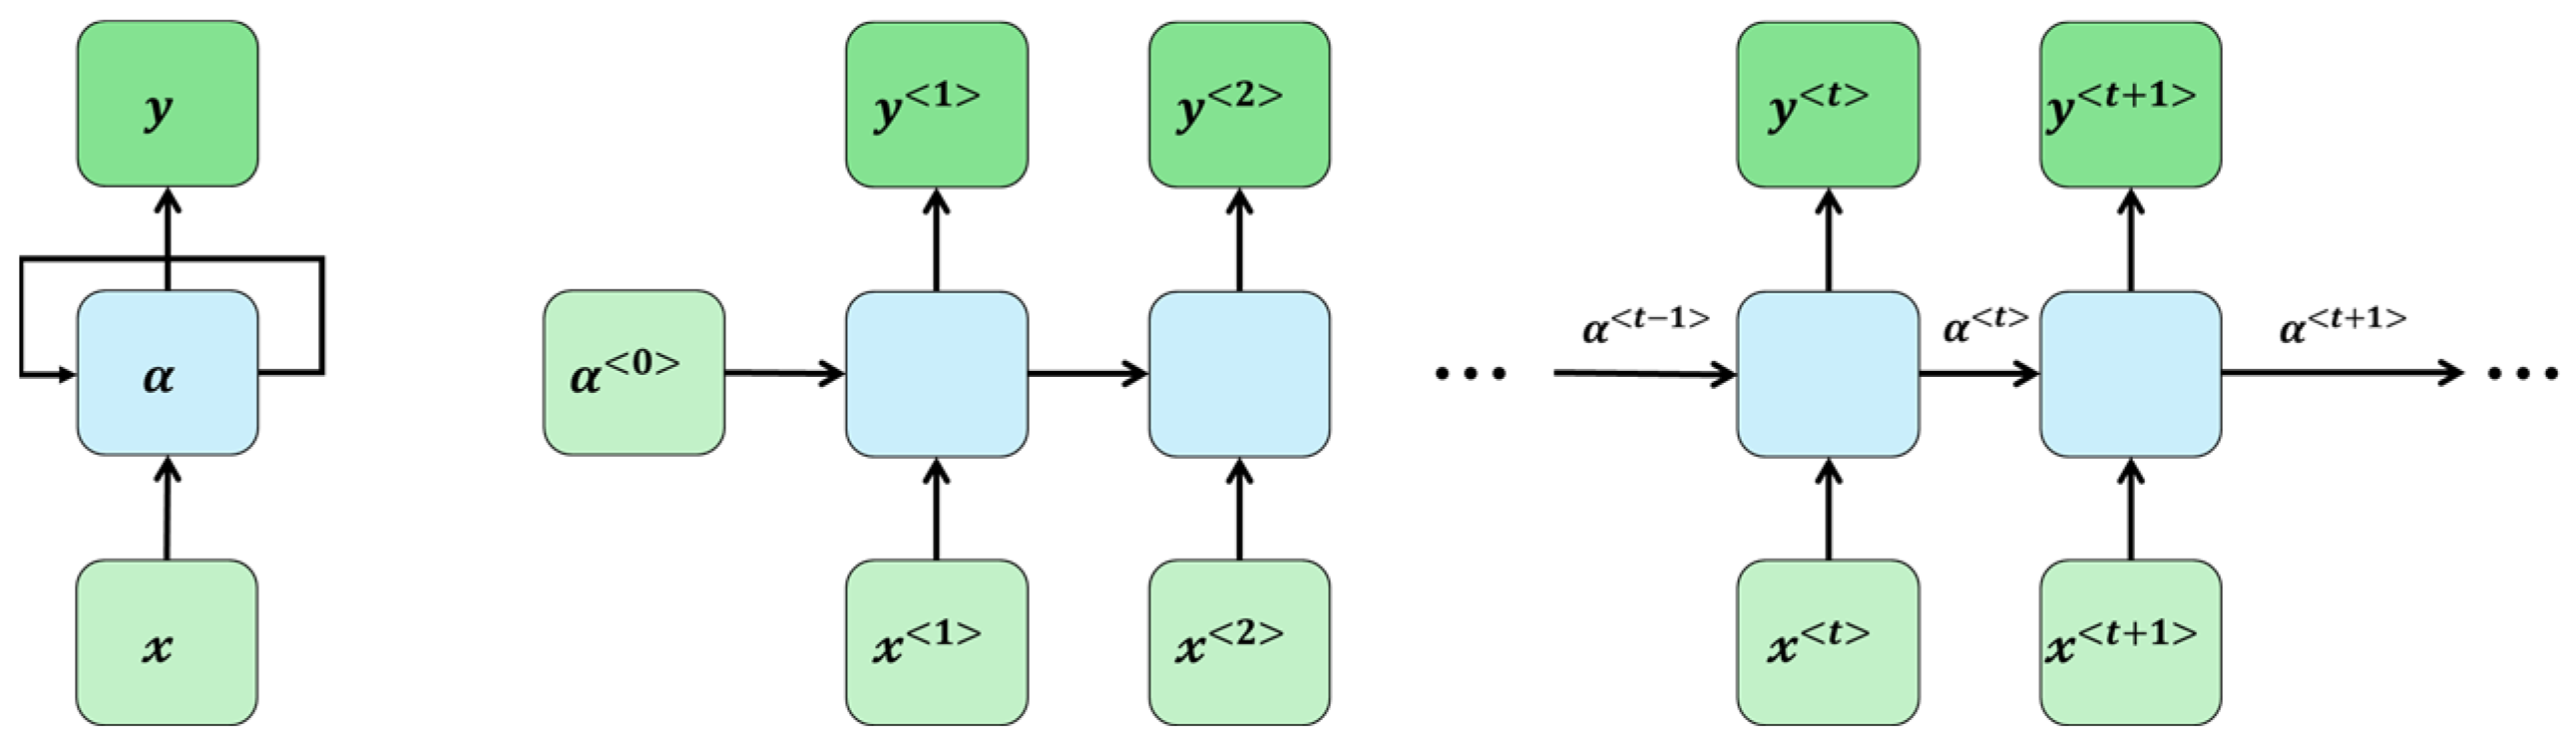
3. Deep Learning-Based Estimation Methodology
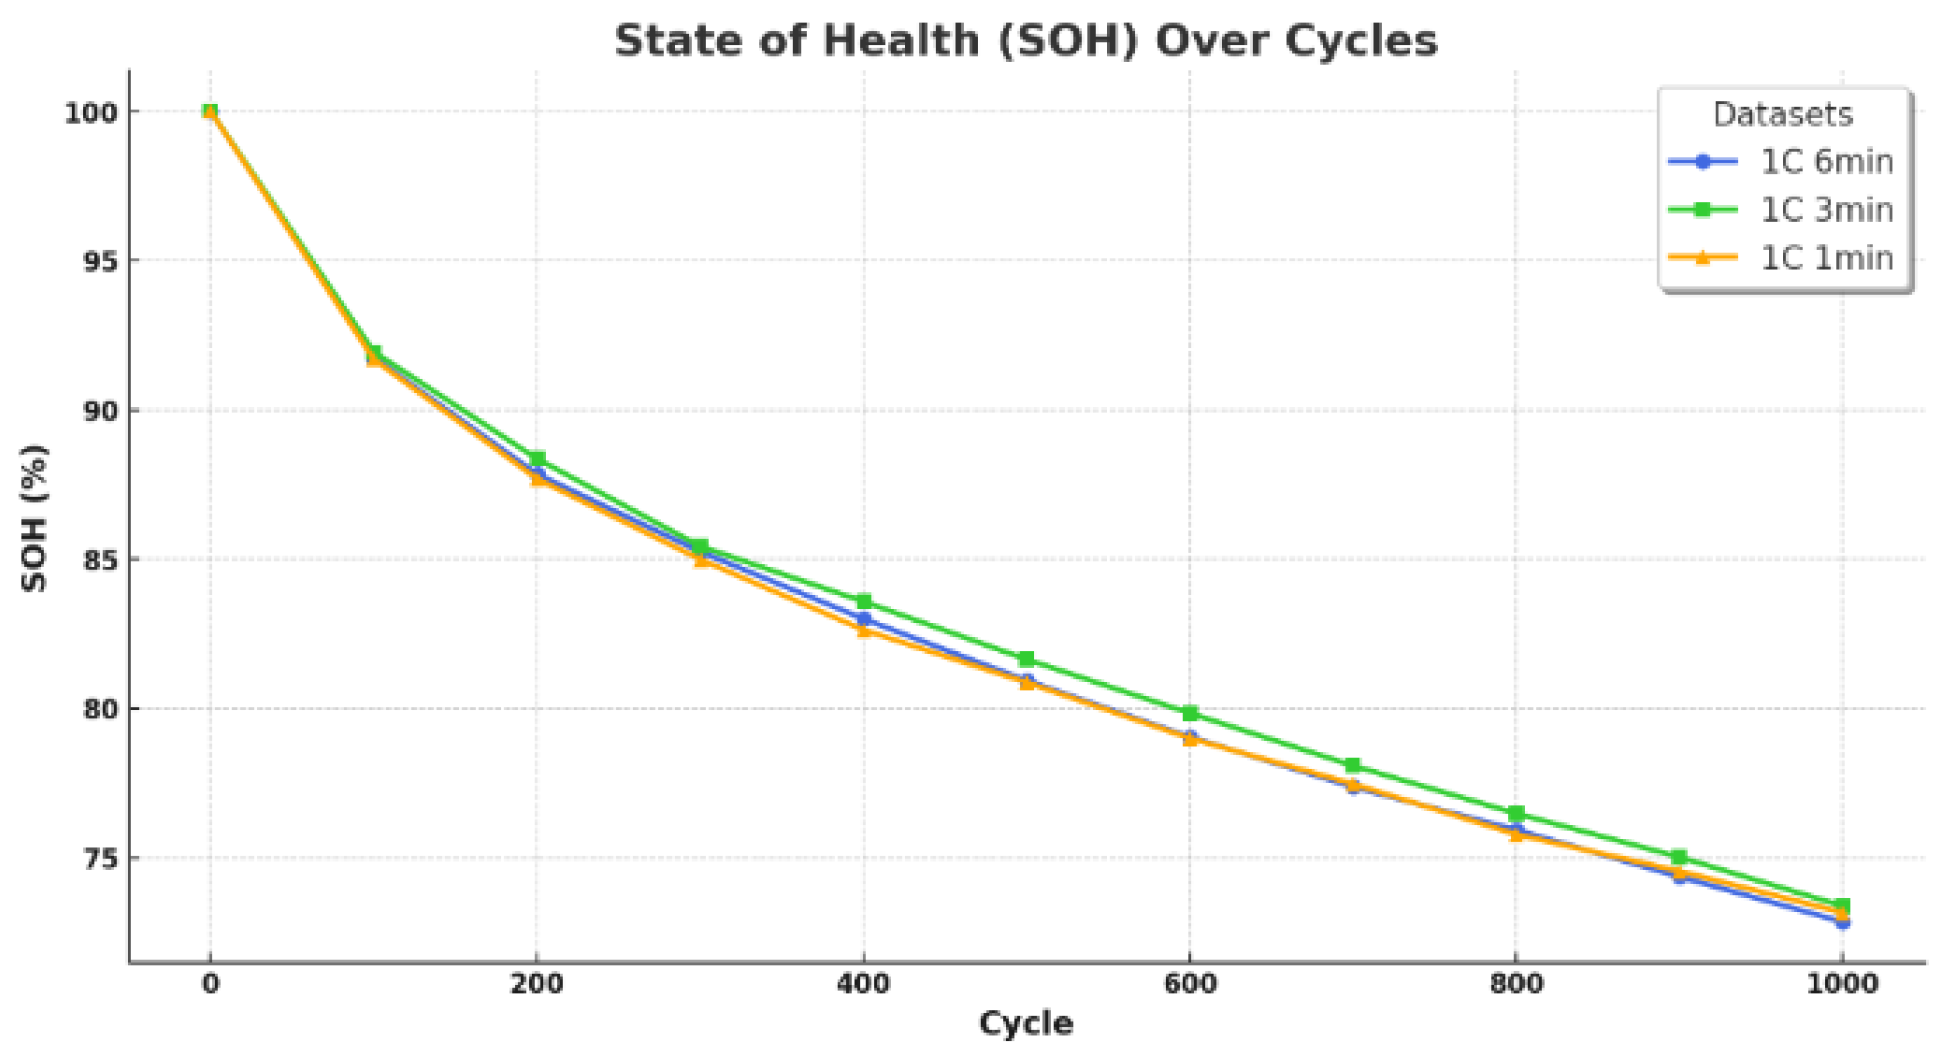
4. Analysis Results
5. Conclusions and Future Study
- (1)
- Exploration of the applicability of various cell compositions and shapes: Although this paper has focused on 21,700 cylindrical Li-ion batteries, it is necessary to extend the applicability of the proposed method to various shapes of battery cells, such as pouch, prismatic, etc., and cells with various cell performances. Furthermore, it would be interesting to evaluate the impact of different battery rheologies and chemical compositions on the model to expand its applicability at industrial sites.
- (2)
- Analysis of estimation precision under various temperature conditions considering the use environment of electric vehicles: In this study, experiments and data acquisition were conducted in a room-temperature environment, which is the setting for the actual retired battery treatment process. However, since the distribution and operating environment of electric vehicles represent different environments around the world and aged batteries may have different electrical and electrochemical characteristics under different temperature conditions, it is necessary to conduct experiments and verification considering aged batteries under different temperature conditions to expand and improve the proposed method.
- (3)
- Practical applications of the proposed method and strategy formulation: The objective of this study is to contribute to the optimization of the battery recycling process and the promotion of sustainable resource utilization. In future research, it is necessary to further investigate the applicability of the research results by formulating strategies for the commercial application of these models to promote practicality throughout the battery reuse industry.
Author Contributions
Funding
Data Availability Statement
Conflicts of Interest
References
- Mala, P.; Palanivel, M.; Priyan, S.; Anbazhagan, N.; Acharya, S.; Joshi, G.P.; Ryoo, J. Sustainable Decision-Making Approach for Dual-Channel Manufacturing Systems under Space Constraints. Sustainability 2021, 13, 11456. [Google Scholar] [CrossRef]
- Lee, H.D.; Lim, O.T. Policy Suggestion for Fostering the Industry of Using End of Life EV Batteries. Trans. Korean Hydrog. New Energy Soc. 2021, 32, 263–270. [Google Scholar] [CrossRef]
- Chen, M.; Ma, X.; Chen, B.; Arsenault, R.; Karlson, P.; Simon, N.; Wang, Y. Recycling end-of-life electric vehicle lithium-ion batteries. Joule 2019, 3, 2622–2646. [Google Scholar] [CrossRef]
- Yao, L.; Xu, S.; Tang, A.; Zhou, F.; Hou, J.; Xiao, Y.; Fu, Z. A review of lithium-ion battery state of health estimation and prediction methods. World Electr. Veh. J. 2021, 12, 113. [Google Scholar] [CrossRef]
- Harper, G.; Sommerville, R.; Kendrick, E.; Driscoll, L.; Slater, P.; Stolkin, R.; Walton, A.; Christensen, P.; Heidrich, O.; Lambert, S.; et al. Recycling lithium-ion batteries from electric vehicles. Nature 2019, 575, 75–86. [Google Scholar] [CrossRef] [PubMed]
- Meng, K.; Xu, G.; Peng, X.; Youcef-Toumi, K.; Li, J. Intelligent disassembly of electric-vehicle batteries: A forward-looking overview. Resour. Conserv. Recycl. 2022, 182, 106207. [Google Scholar] [CrossRef]
- Das, K.; Kumar, R. Electric vehicle battery capacity degradation and health estimation using machine-learning techniques: A review. Clean Energy 2023, 7, 1268–1281. [Google Scholar] [CrossRef]
- Basia, A.; Simeu-Abazi, Z.; Gascard, E.; Zwolinski, P. Review on State of Health estimation methodologies for lithium-ion batteries in the context of circular economy. CIRP J. Manuf. Sci. Technol. 2021, 32, 517–528. [Google Scholar] [CrossRef]
- Weng, C.; Cui, Y.; Sun, J.; Peng, H. On-board state of health monitoring of lithium-ion batteries using incremental capacity analysis with support vector regression. J. Power Sources 2013, 235, 36–44. [Google Scholar] [CrossRef]
- Anekal, L.; Samanta, A.; Williamson, S. Wide-ranging parameter extraction of Lithium-ion Batteries to Estimate State of Health using Electrochemical Impedance Spectroscopy. In Proceedings of the 2022 IEEE 1st Industrial Electronics Society Annual On-Line Conference (ONCON), Kharagpur, India, 9–11 December 2022; IEEE: Piscataway, NJ, USA, 2022. [Google Scholar]
- Zou, Y.; Hu, X.; Ma, H.; Li, S.E. Combined state of charge and state of health estimation over lithium-ion battery cell cycle lifespan for electric vehicles. J. Power Sources 2015, 273, 793–803. [Google Scholar] [CrossRef]
- Wang, Z.; Zhao, X.; Fu, L.; Zhen, D.; Gu, F.; Ball, A.D. A review on rapid state of health estimation of lithium-ion batteries in electric vehicles. Sustain. Energy Technol. Assess. 2023, 60, 103457. [Google Scholar] [CrossRef]
- Lin, C.; Tang, A.; Wang, W. A review of SOH estimation methods in Lithium-ion batteries for electric vehicle applications. Energy Procedia 2015, 75, 1920–1925. [Google Scholar] [CrossRef]
- Hong, S.; Kang, M.; Jeong, H.; Baek, J. State of health estimation for lithium-ion batteries using long-term recurrent convolutional network. In Proceedings of the IECON 2020 the 46th Annual Conference of the IEEE Industrial Electronics Society, Singapore, 18–21 October 2020; IEEE: Piscataway, NJ, USA, 2020. [Google Scholar]
- Tan, X.; Tan, Y.; Zhan, D.; Yu, Z.; Fan, Y.; Qiu, J.; Li, J. Real-time state-of-health estimation of lithium-ion batteries based on the equivalent internal resistance. IEEE Access 2020, 8, 56811–56822. [Google Scholar] [CrossRef]
- Cui, Z.; Hu, W.; Zhang, G.; Zhang, Z.; Chen, Z. An extended Kalman filter based SOC estimation method for Li-ion battery. Energy Rep. 2022, 8, 81–87. [Google Scholar] [CrossRef]
- Xie, J.; Wei, X.; Bo, X.; Zhang, P.; Chen, P.; Hao, W.; Yuan, M. State of charge estimation of lithium-ion battery based on extended Kalman filter algorithm. Front. Energy Res. 2023, 11, 1180881. [Google Scholar] [CrossRef]
- Fei, Z.; Zhang, Z.; Yang, F.; Tsui, K.-L. Deep learning powered rapid lifetime classification of lithium-ion batteries. eTransportation 2023, 18, 100286. [Google Scholar] [CrossRef]
- Lin, Y.H.; Ruan, S.J.; Chen, Y.X.; Li, Y.F. Physics-informed deep learning for lithium-ion battery diagnostics using electrochemical impedance spectroscopy. Renew. Sustain. Energy Rev. 2023, 188, 113807. [Google Scholar] [CrossRef]
- Chemali, E.; Kollmeyer, P.J.; Preindl, M.; Fahmy, Y.; Emadi, A. A convolutional neural network approach for estimation of li-ion battery state of health from charge profiles. Energies 2022, 15, 1185. [Google Scholar] [CrossRef]
- Shu, X.; Shen, S.; Shen, J.; Zhang, Y.; Li, G.; Chen, Z.; Liu, Y. State of health prediction of lithium-ion batteries based on machine learning: Advances and perspectives. iScience 2021, 24, 103265. [Google Scholar] [CrossRef]
- Tian, J.; Xiong, R.; Shen, W.; Lu, J.; Yang, X.-G. Deep neural network battery charging curve prediction using 30 points collected in 10 min. Joule 2021, 5, 1521–1534. [Google Scholar] [CrossRef]
- Guo, S.; Ma, L. A comparative study of different deep learning algorithms for lithium-ion batteries on state-of-charge estimation. Energy 2023, 263, 125872. [Google Scholar] [CrossRef]
- Gou, B.; Xu, Y.; Feng, X. An ensemble learning-based data-driven method for online state-of-health estimation of lithium-ion batteries. IEEE Trans. Transp. Electrif. 2020, 7, 422–436. [Google Scholar] [CrossRef]
- Mussi, M.; Pellegrino, L.; Restelli, M.; Trovò, F. An online state of health estimation method for lithium-ion batteries based on time partitioning and data-driven model identification. J. Energy Storage 2022, 55, 105467. [Google Scholar] [CrossRef]
- Berecibar, M.; Gandiaga, I.; Villarreal, I.; Omar, N.; Van Mierlo, J.; van den Bossche, P. Critical review of state of health estimation methods of Li-ion batteries for real applications. Renew. Sustain. Energy Rev. 2016, 56, 572–587. [Google Scholar] [CrossRef]
- Du, C.; Tian, J.; Xiong, R.; Wang, Y.; Zhang, Q.; Li, F. Research on state-of-health estimation for lithium-ion batteries based on the charging phase. Energies 2023, 16, 1420. [Google Scholar] [CrossRef]
- Huang, K.; Zhang, Z.; Li, M.; Wang, H.; Chen, X.; Zhang, Y. State of health estimation of lithium-ion batteries based on fine-tuning or rebuilding transfer learning strategies combined with new features mining. Energy 2023, 282, 128739. [Google Scholar] [CrossRef]
- Laschuk, N.O.; Easton, E.B.; Zenkina, O.V. Reducing the resistance for the use of electrochemical impedance spectroscopy analysis in materials chemistry. RSC Adv. 2021, 11, 27925–27936. [Google Scholar] [CrossRef] [PubMed]
- Jung, C.; Choi, W. Rapid Estimation of Battery Storage Capacity through Multiple Linear Regression. Batteries 2023, 9, 424. [Google Scholar] [CrossRef]
- Dubarry, M.; Anseán, D. Best practices for incremental capacity analysis. Front. Energy Res. 2022, 10, 1023555. [Google Scholar] [CrossRef]
- Kalogiannis, T.; Stroe, D.I.; Nyborg, J.; Nørregaard, K.; Christensen, A.E.; Schaltz, E. Incremental capacity analysis of a lithium-ion battery pack for different charging rates. ECS Trans. 2017, 77, 403. [Google Scholar] [CrossRef]
- Birkl, C.R.; Roberts, M.R.; McTurk, E.; Bruce, P.G.; Howey, D.A. Degradation diagnostics for lithium ion cells. J. Power Sources 2017, 341, 373–386. [Google Scholar] [CrossRef]
- Raman, M.; Champa, V.; Prema, V. State of health estimation of lithium ion batteries using recurrent neural network and its variants. In Proceedings of the 2021 IEEE International Conference on Electronics, Computing and Communication Technologies (CONECCT), Bangalore, India, 9–11 July 2021; IEEE: Piscataway, NJ, USA, 2021. [Google Scholar]
- Schmitt, J.; Horstkötter, I.; Bäker, B. Electrical lithium-ion battery models based on recurrent neural networks: A holistic approach. J. Energy Storage 2023, 58, 106461. [Google Scholar] [CrossRef]


| Parameter | Value | Unit |
|---|---|---|
| Nominal capacity | 4000 | mAh |
| Charging cut-off voltage | 4.2 ± 0.05 | V |
| Nominal voltage | 3.6 | V |
| Discharging cut-off voltage | 2.5 | V |
| Cell weight | 70.0 | g |
| Category | Specification | Unit |
|---|---|---|
| Rated voltage | 0~5 | V |
| Rated current | 20/each channel (40 CH) | A |
| Data processing | 10 | ms |
| Accuracy | Full Scale ± 0.05 | % |
| Voltage, Current | Full Scale ± 0.1 | |
| Power | Full Scale ± 0.2 |
| Experiment Step | 1 C 6 min | 1 C 3 min | 1 C 1 min | Unit | |
|---|---|---|---|---|---|
| Measurement Step | * TR + DCIR | 15 | 25 | 64 | Hour |
| Static Capacity | 25 | 25 | 25 | Hour | |
| Aging Step | 100 | 100 | 100 | Hour | |
| Total (100 cycle) | 140 | 150 | 189 | Hour | |
| Total (1000 cycle) | 1400 | 1500 | 1890 | Hour | |
| Parameter | Value Setting |
|---|---|
| Optimizer | Adam |
| Learning Rate | 0.01 |
| Mini Batch Size | 30 |
| Epochs | 1500 |
| Dropout Rate | 0.1 |
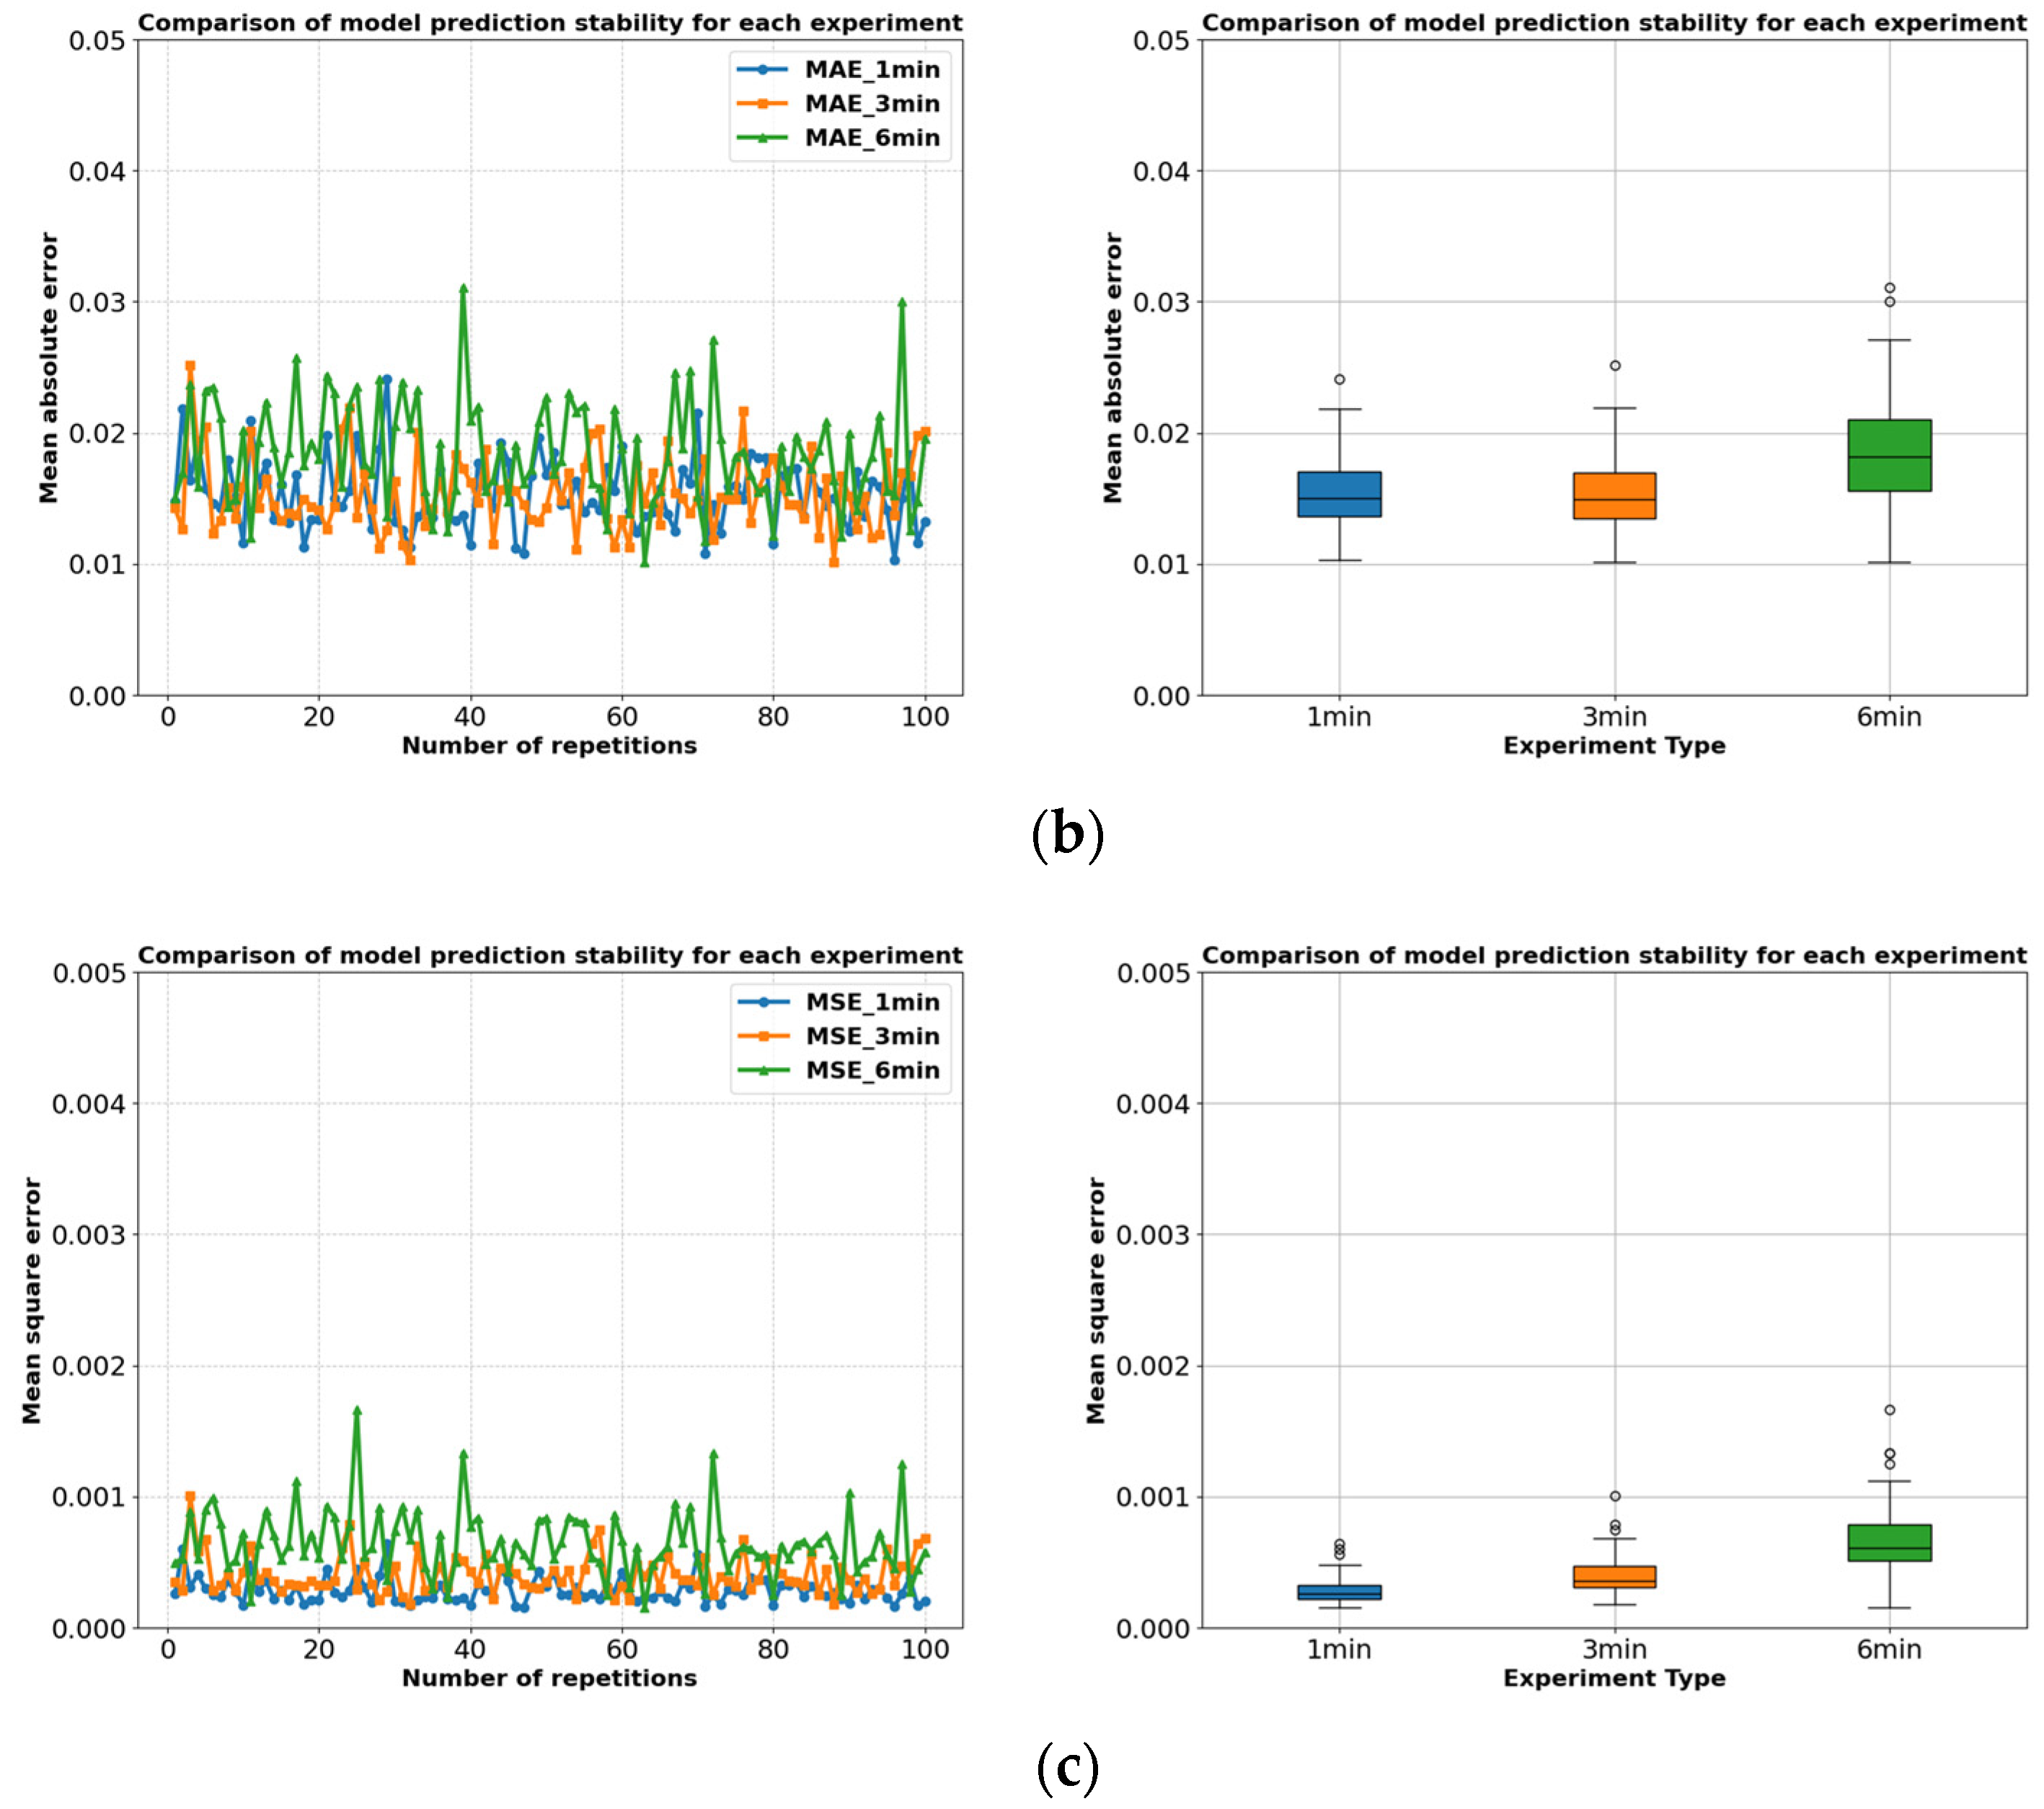
| Value | 6 min Data | 3 min Data | 1 min Data | Unit | |
|---|---|---|---|---|---|
| MAE | Max | 0.03109 | 0.025189 | 0.024069 | - |
| Min | 0.010126 | 0.010138 | 0.010316 | - | |
| Average | 0.018463 | 0.015386 | 0.0153181 | - | |
| MSE | Max | 0.001667 | 0.0001 | 0.000637 | - |
| Min | 0.000151 | 0.000178 | 0.000153 | - | |
| Average | 0.000644 | 0.000403 | 0.000283 | - | |
| RMSE | Max | 4.0816 | 3.1677 | 2.5255 | % |
| Min | 1.2289 | 1.3343 | 1.2385 | % | |
| Average | 2.4909 | 1.9805 | 1.6609 | % | |
Disclaimer/Publisher’s Note: The statements, opinions and data contained in all publications are solely those of the individual author(s) and contributor(s) and not of MDPI and/or the editor(s). MDPI and/or the editor(s) disclaim responsibility for any injury to people or property resulting from any ideas, methods, instructions or products referred to in the content. |
© 2024 by the authors. Licensee MDPI, Basel, Switzerland. This article is an open access article distributed under the terms and conditions of the Creative Commons Attribution (CC BY) license (https://creativecommons.org/licenses/by/4.0/).
Share and Cite
Son, Y.; Choi, W. Rapid Estimation of Static Capacity Based on Machine Learning: A Time-Efficient Approach. Batteries 2024, 10, 191. https://doi.org/10.3390/batteries10060191
Son Y, Choi W. Rapid Estimation of Static Capacity Based on Machine Learning: A Time-Efficient Approach. Batteries. 2024; 10(6):191. https://doi.org/10.3390/batteries10060191
Chicago/Turabian StyleSon, Younggill, and Woongchul Choi. 2024. "Rapid Estimation of Static Capacity Based on Machine Learning: A Time-Efficient Approach" Batteries 10, no. 6: 191. https://doi.org/10.3390/batteries10060191