
Improved Thermal Management of Li-Ion Batteries with Phase-Change Materials and Metal Fins


Abstract
1. Introduction
2. Material and Methods
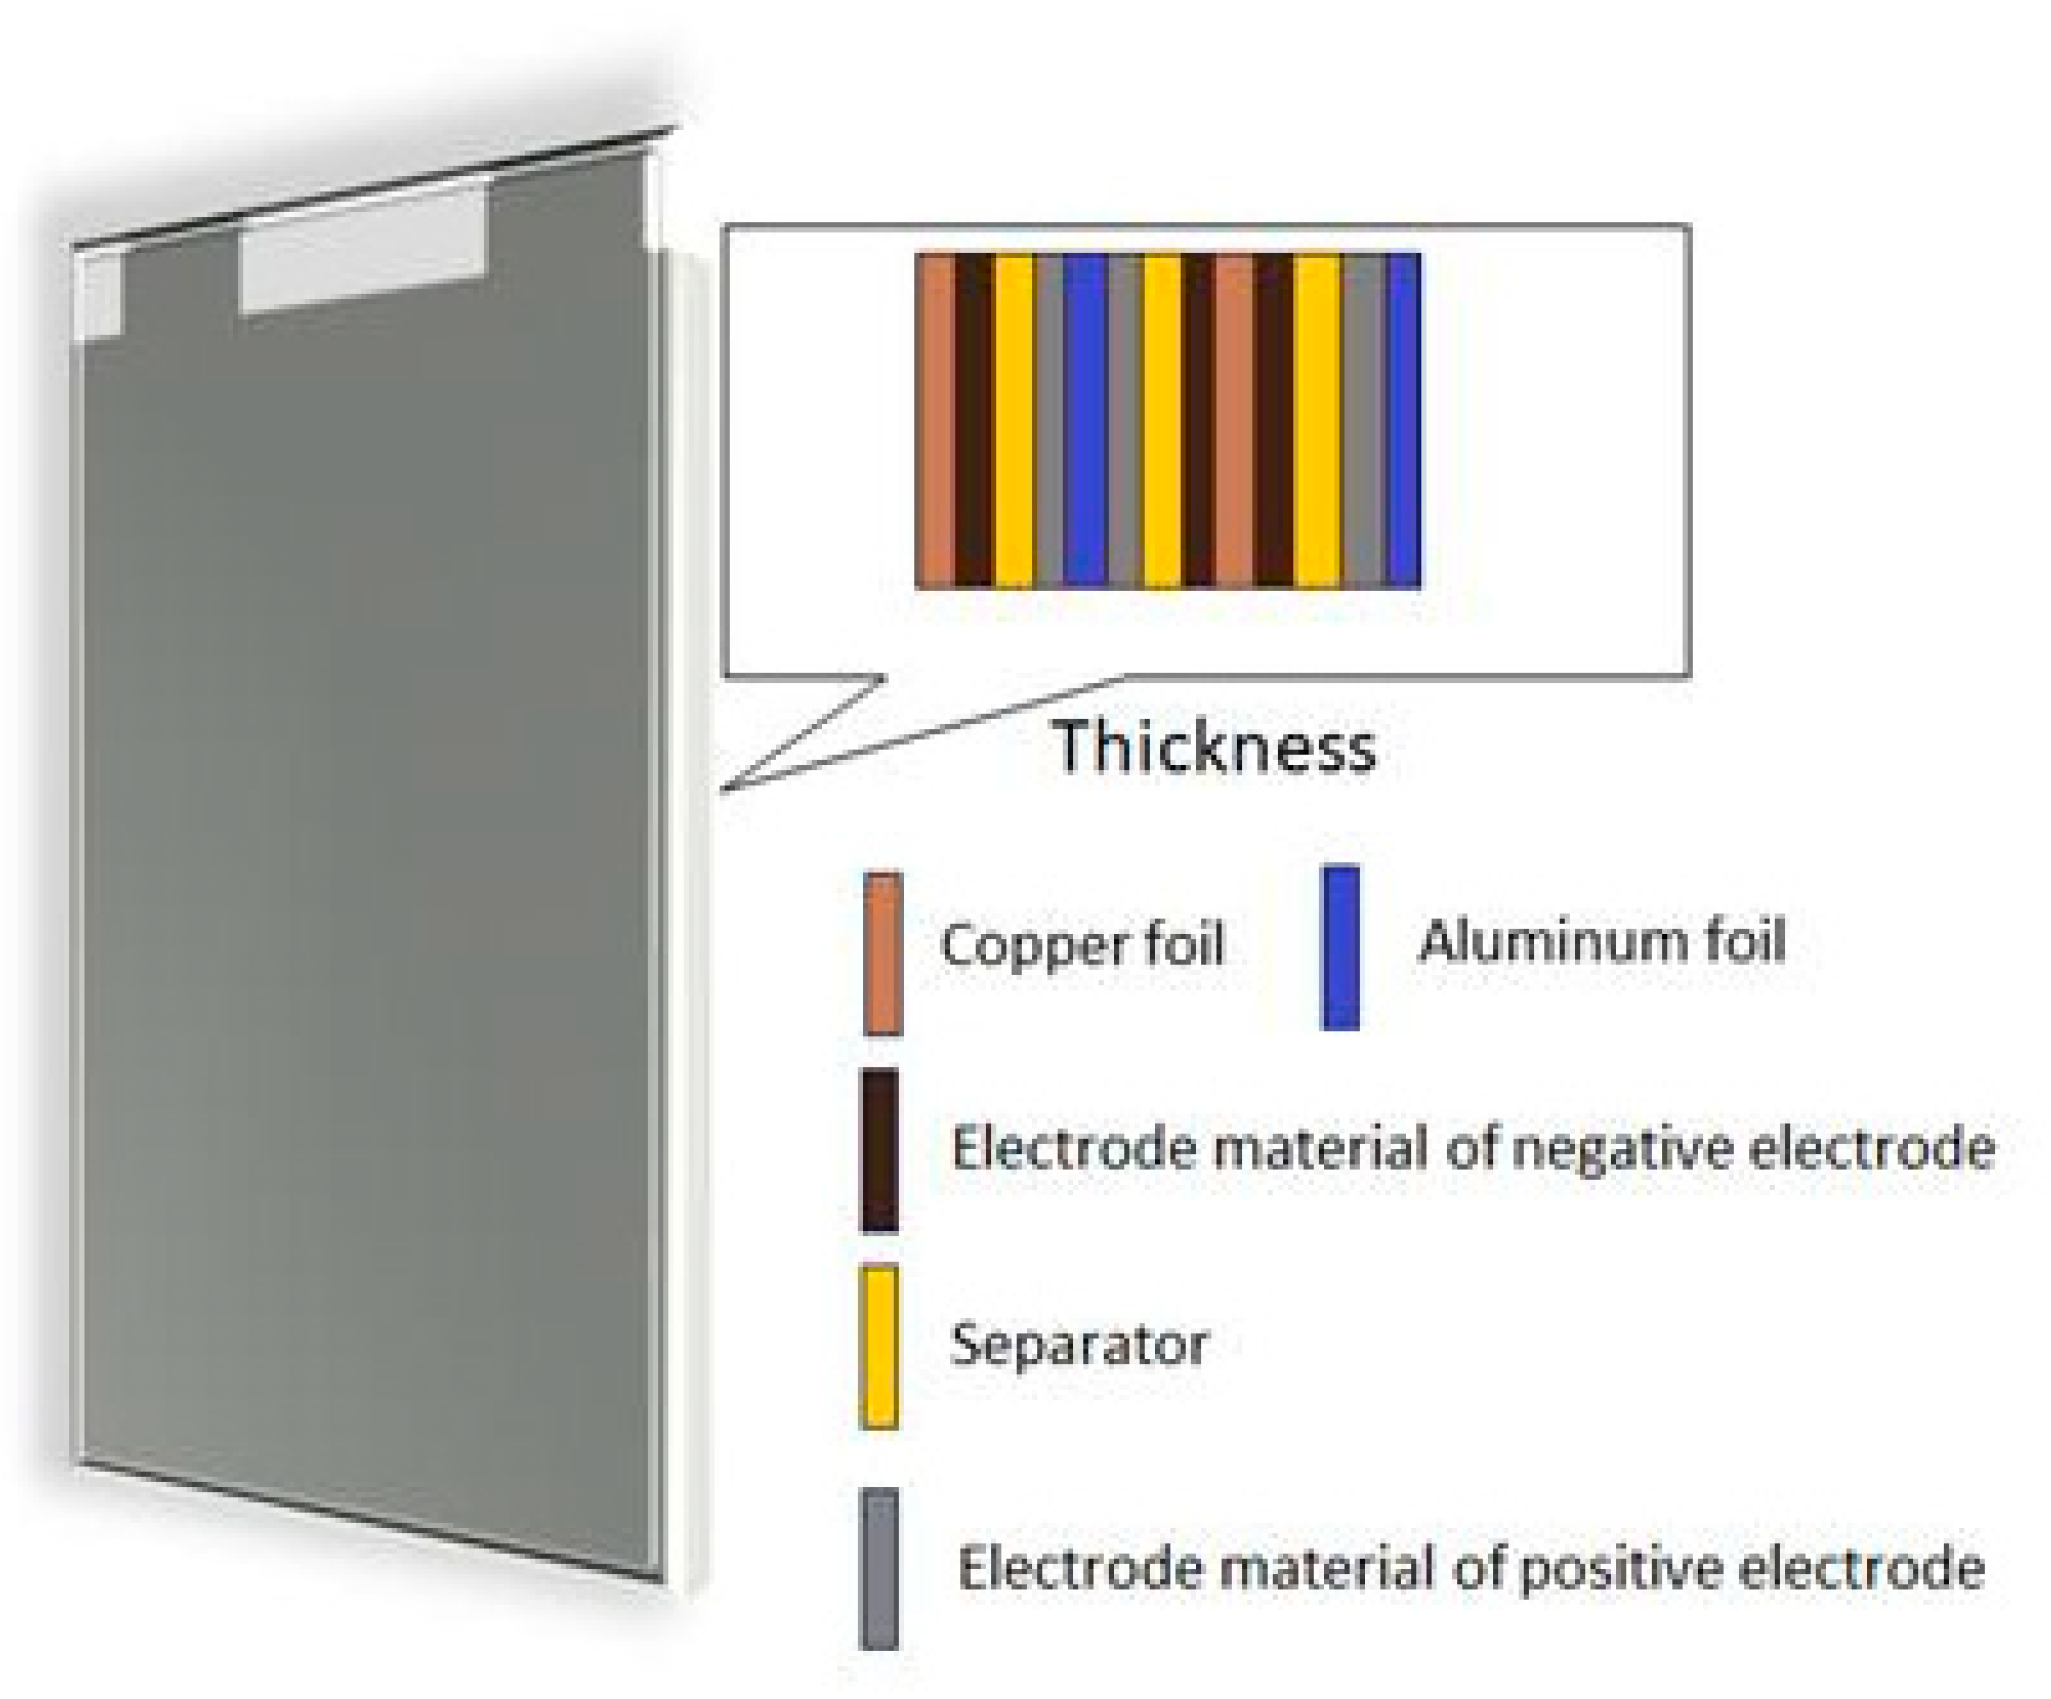
2.1. Geometry of the Model
2.2. Thermophysical Properties of the Cell
2.3. Physics of the Problem
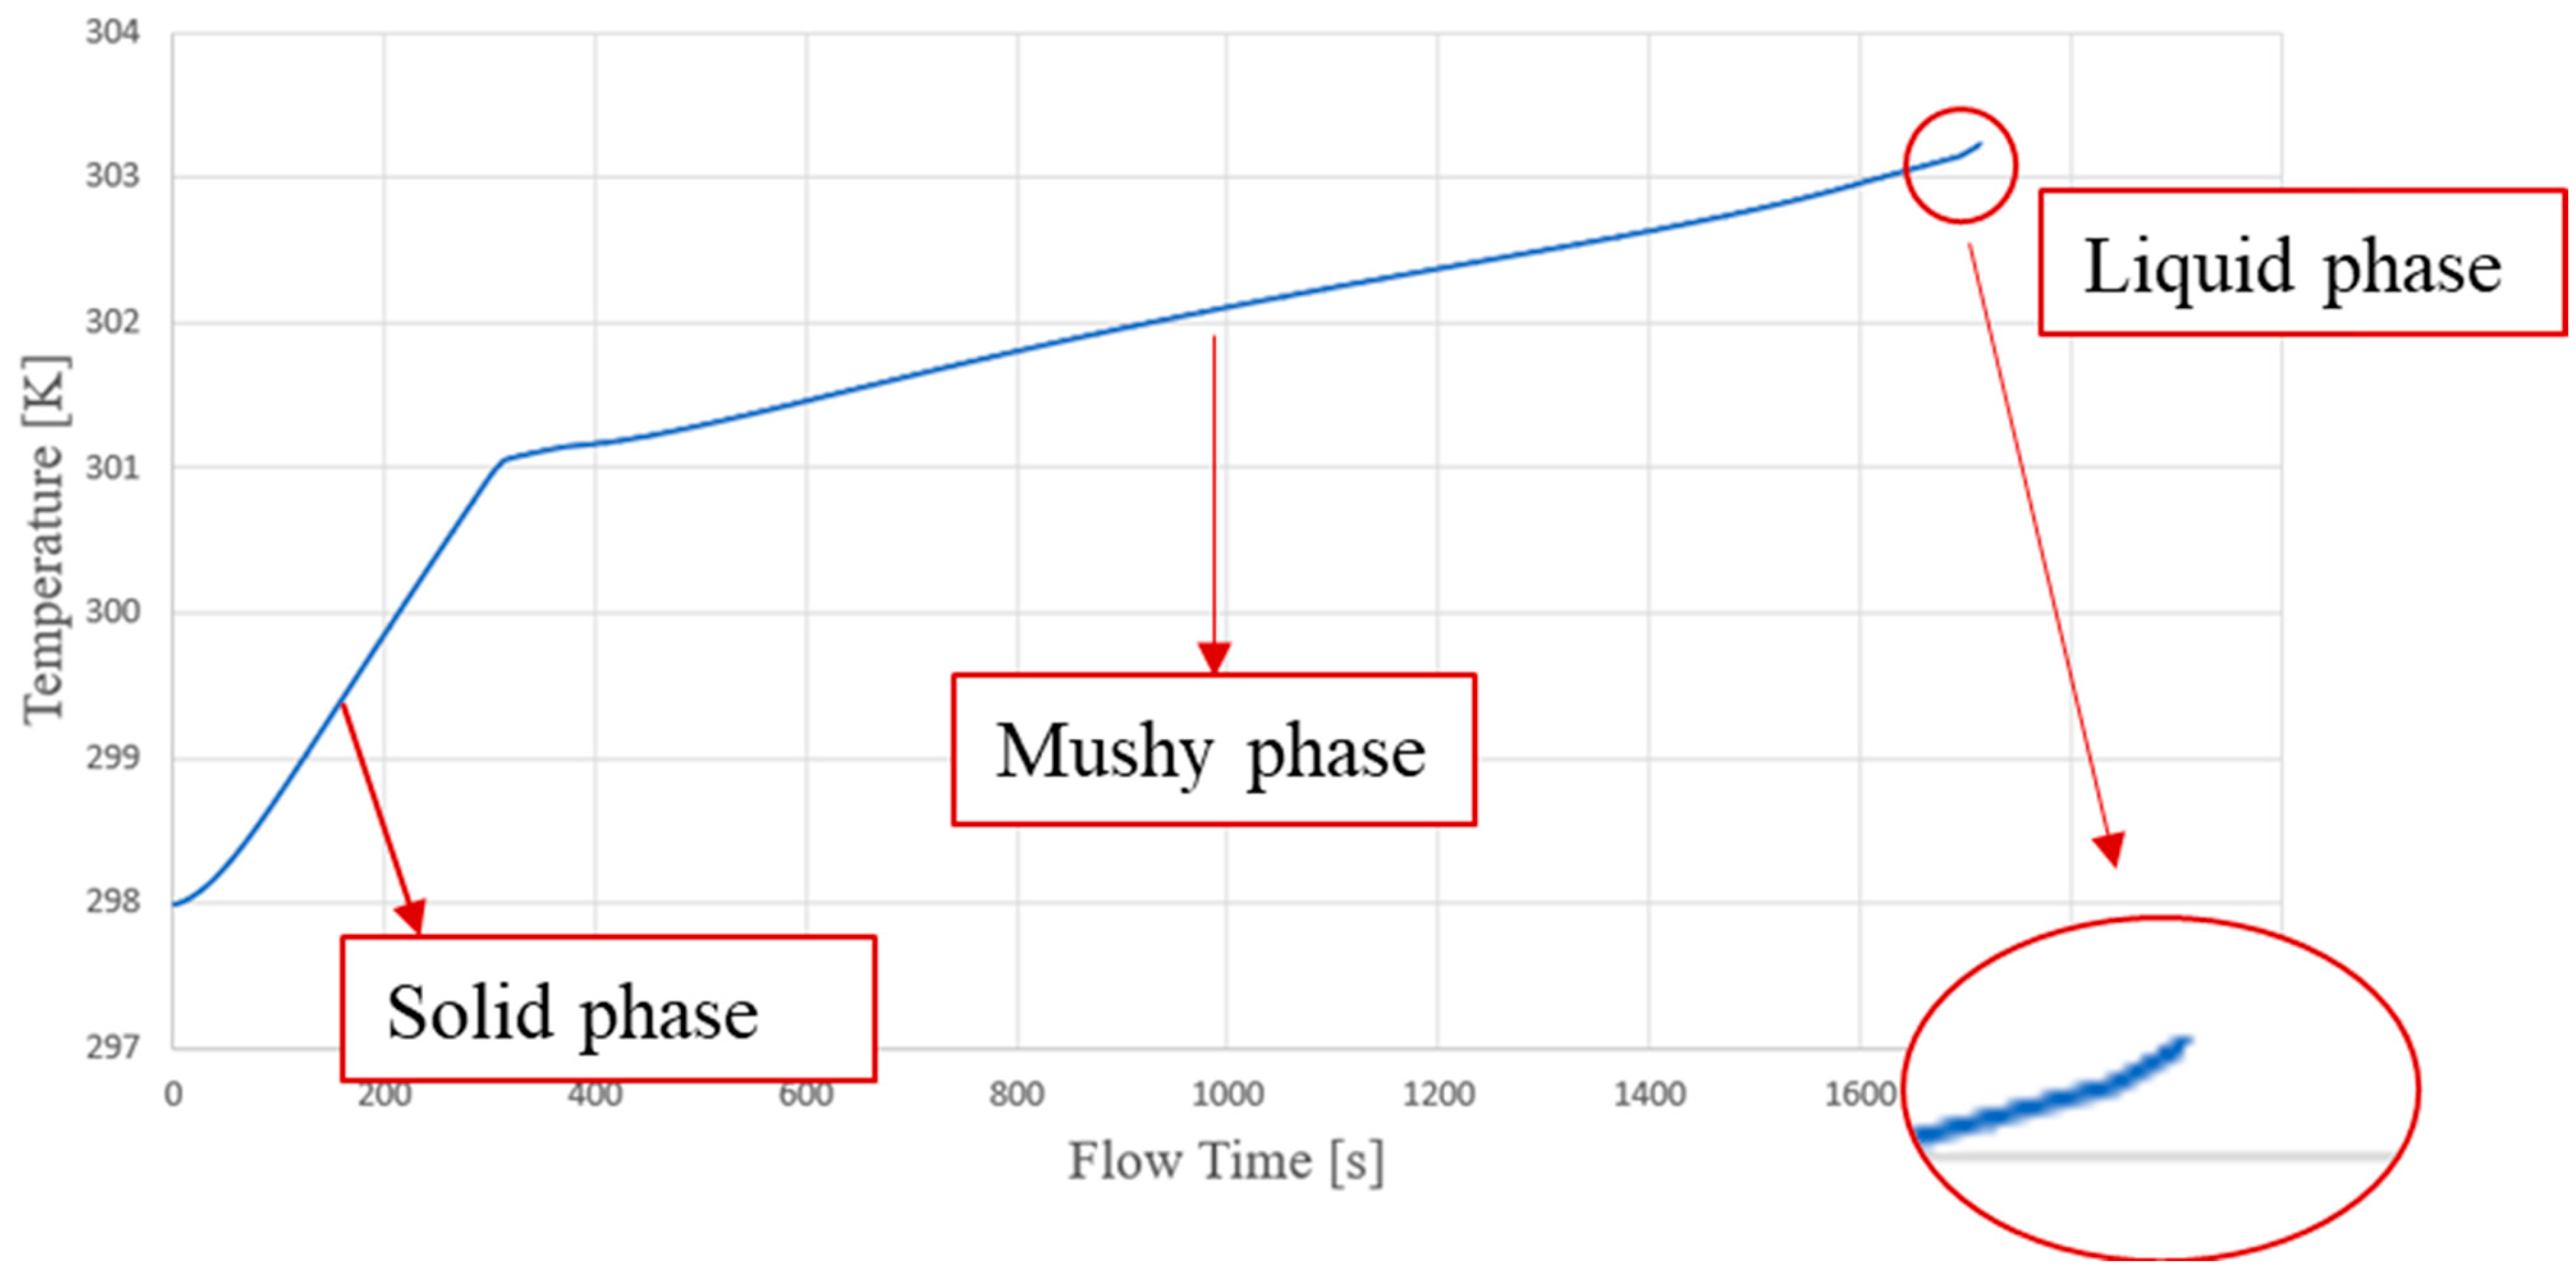
2.4. PCM Model Description
3. Results and Discussion
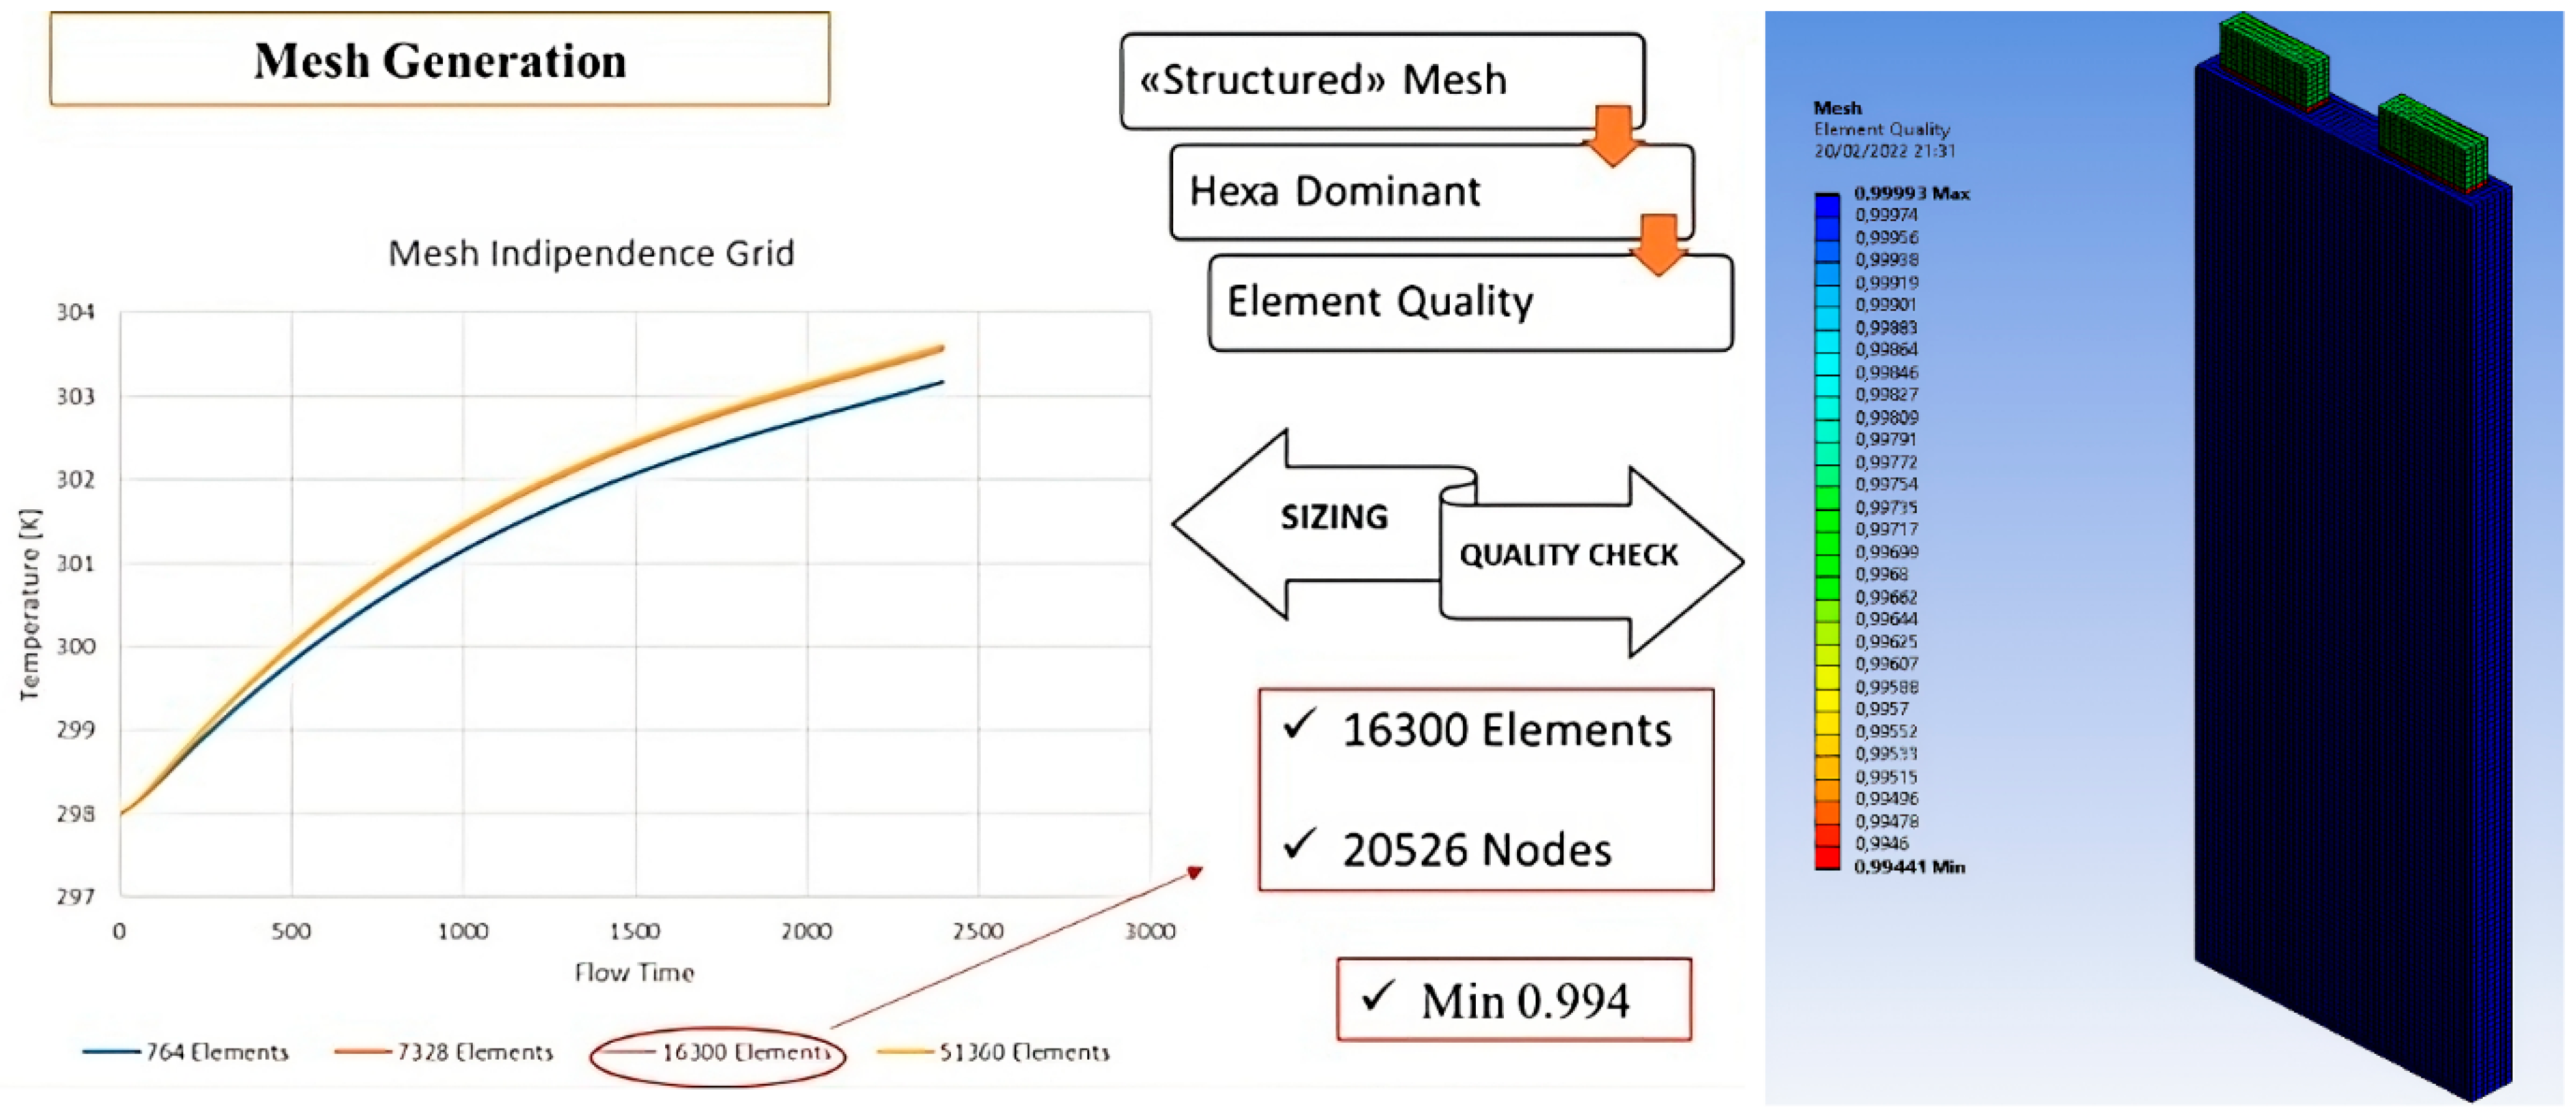
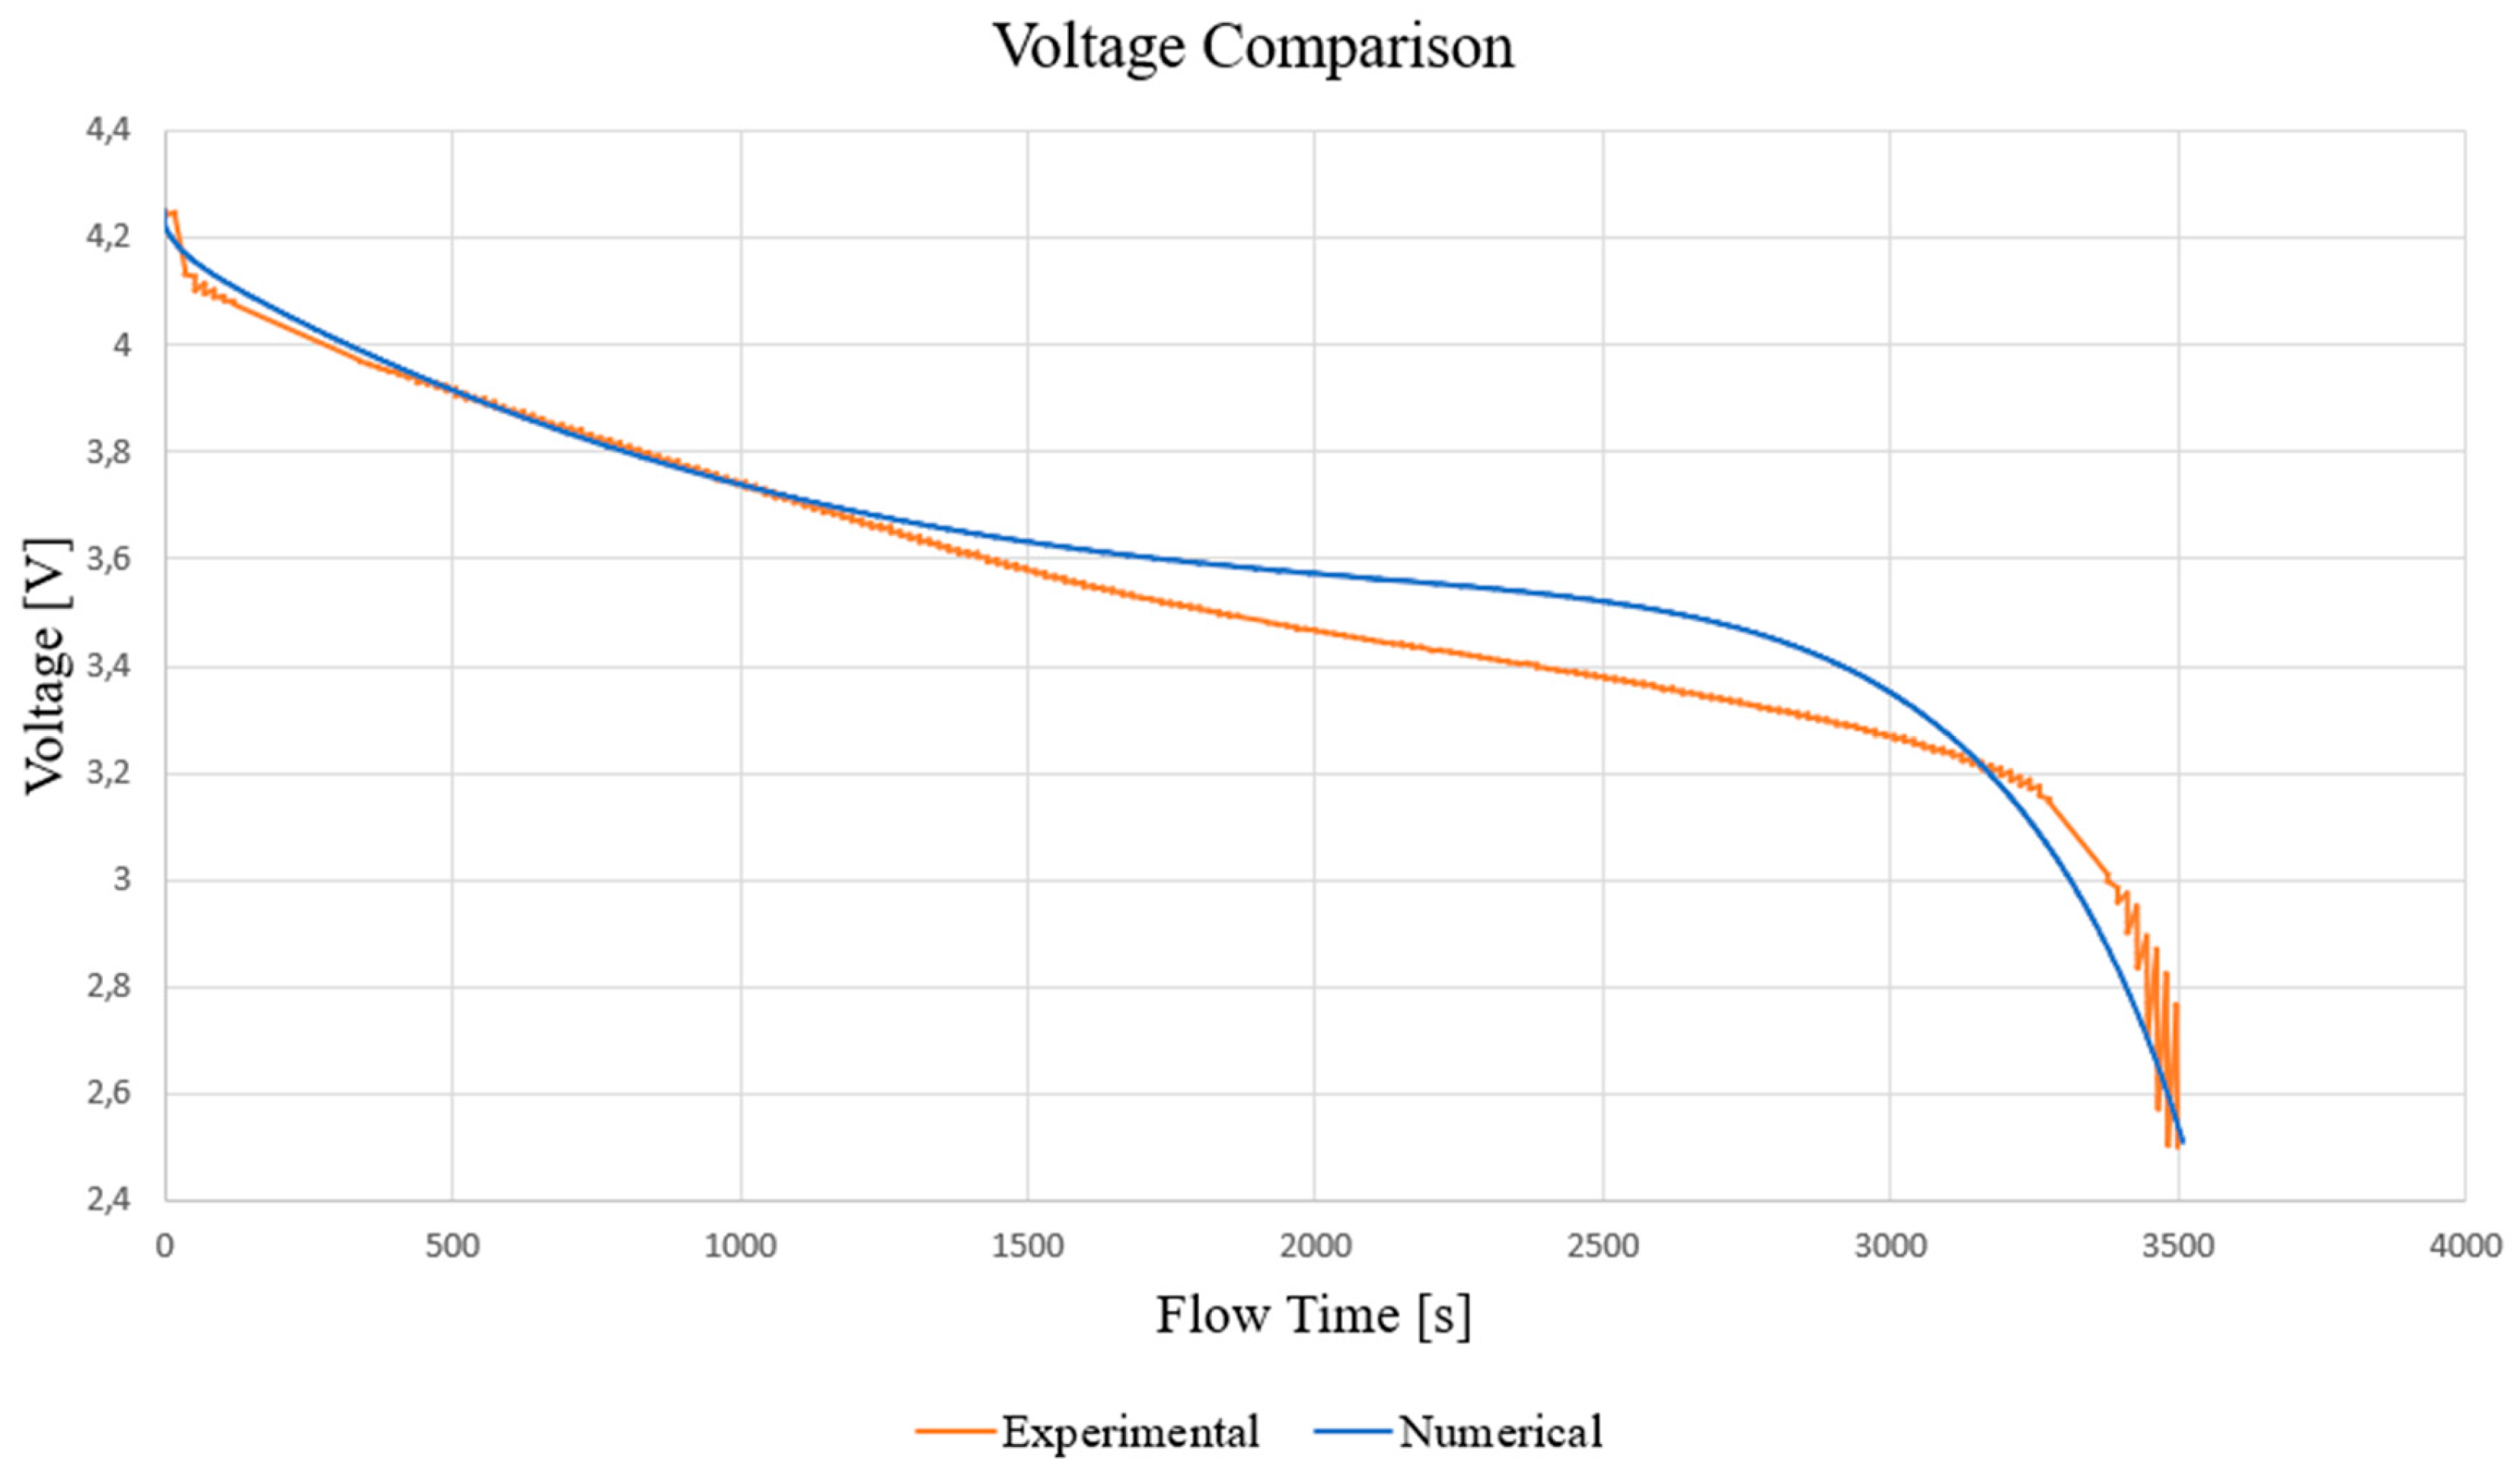
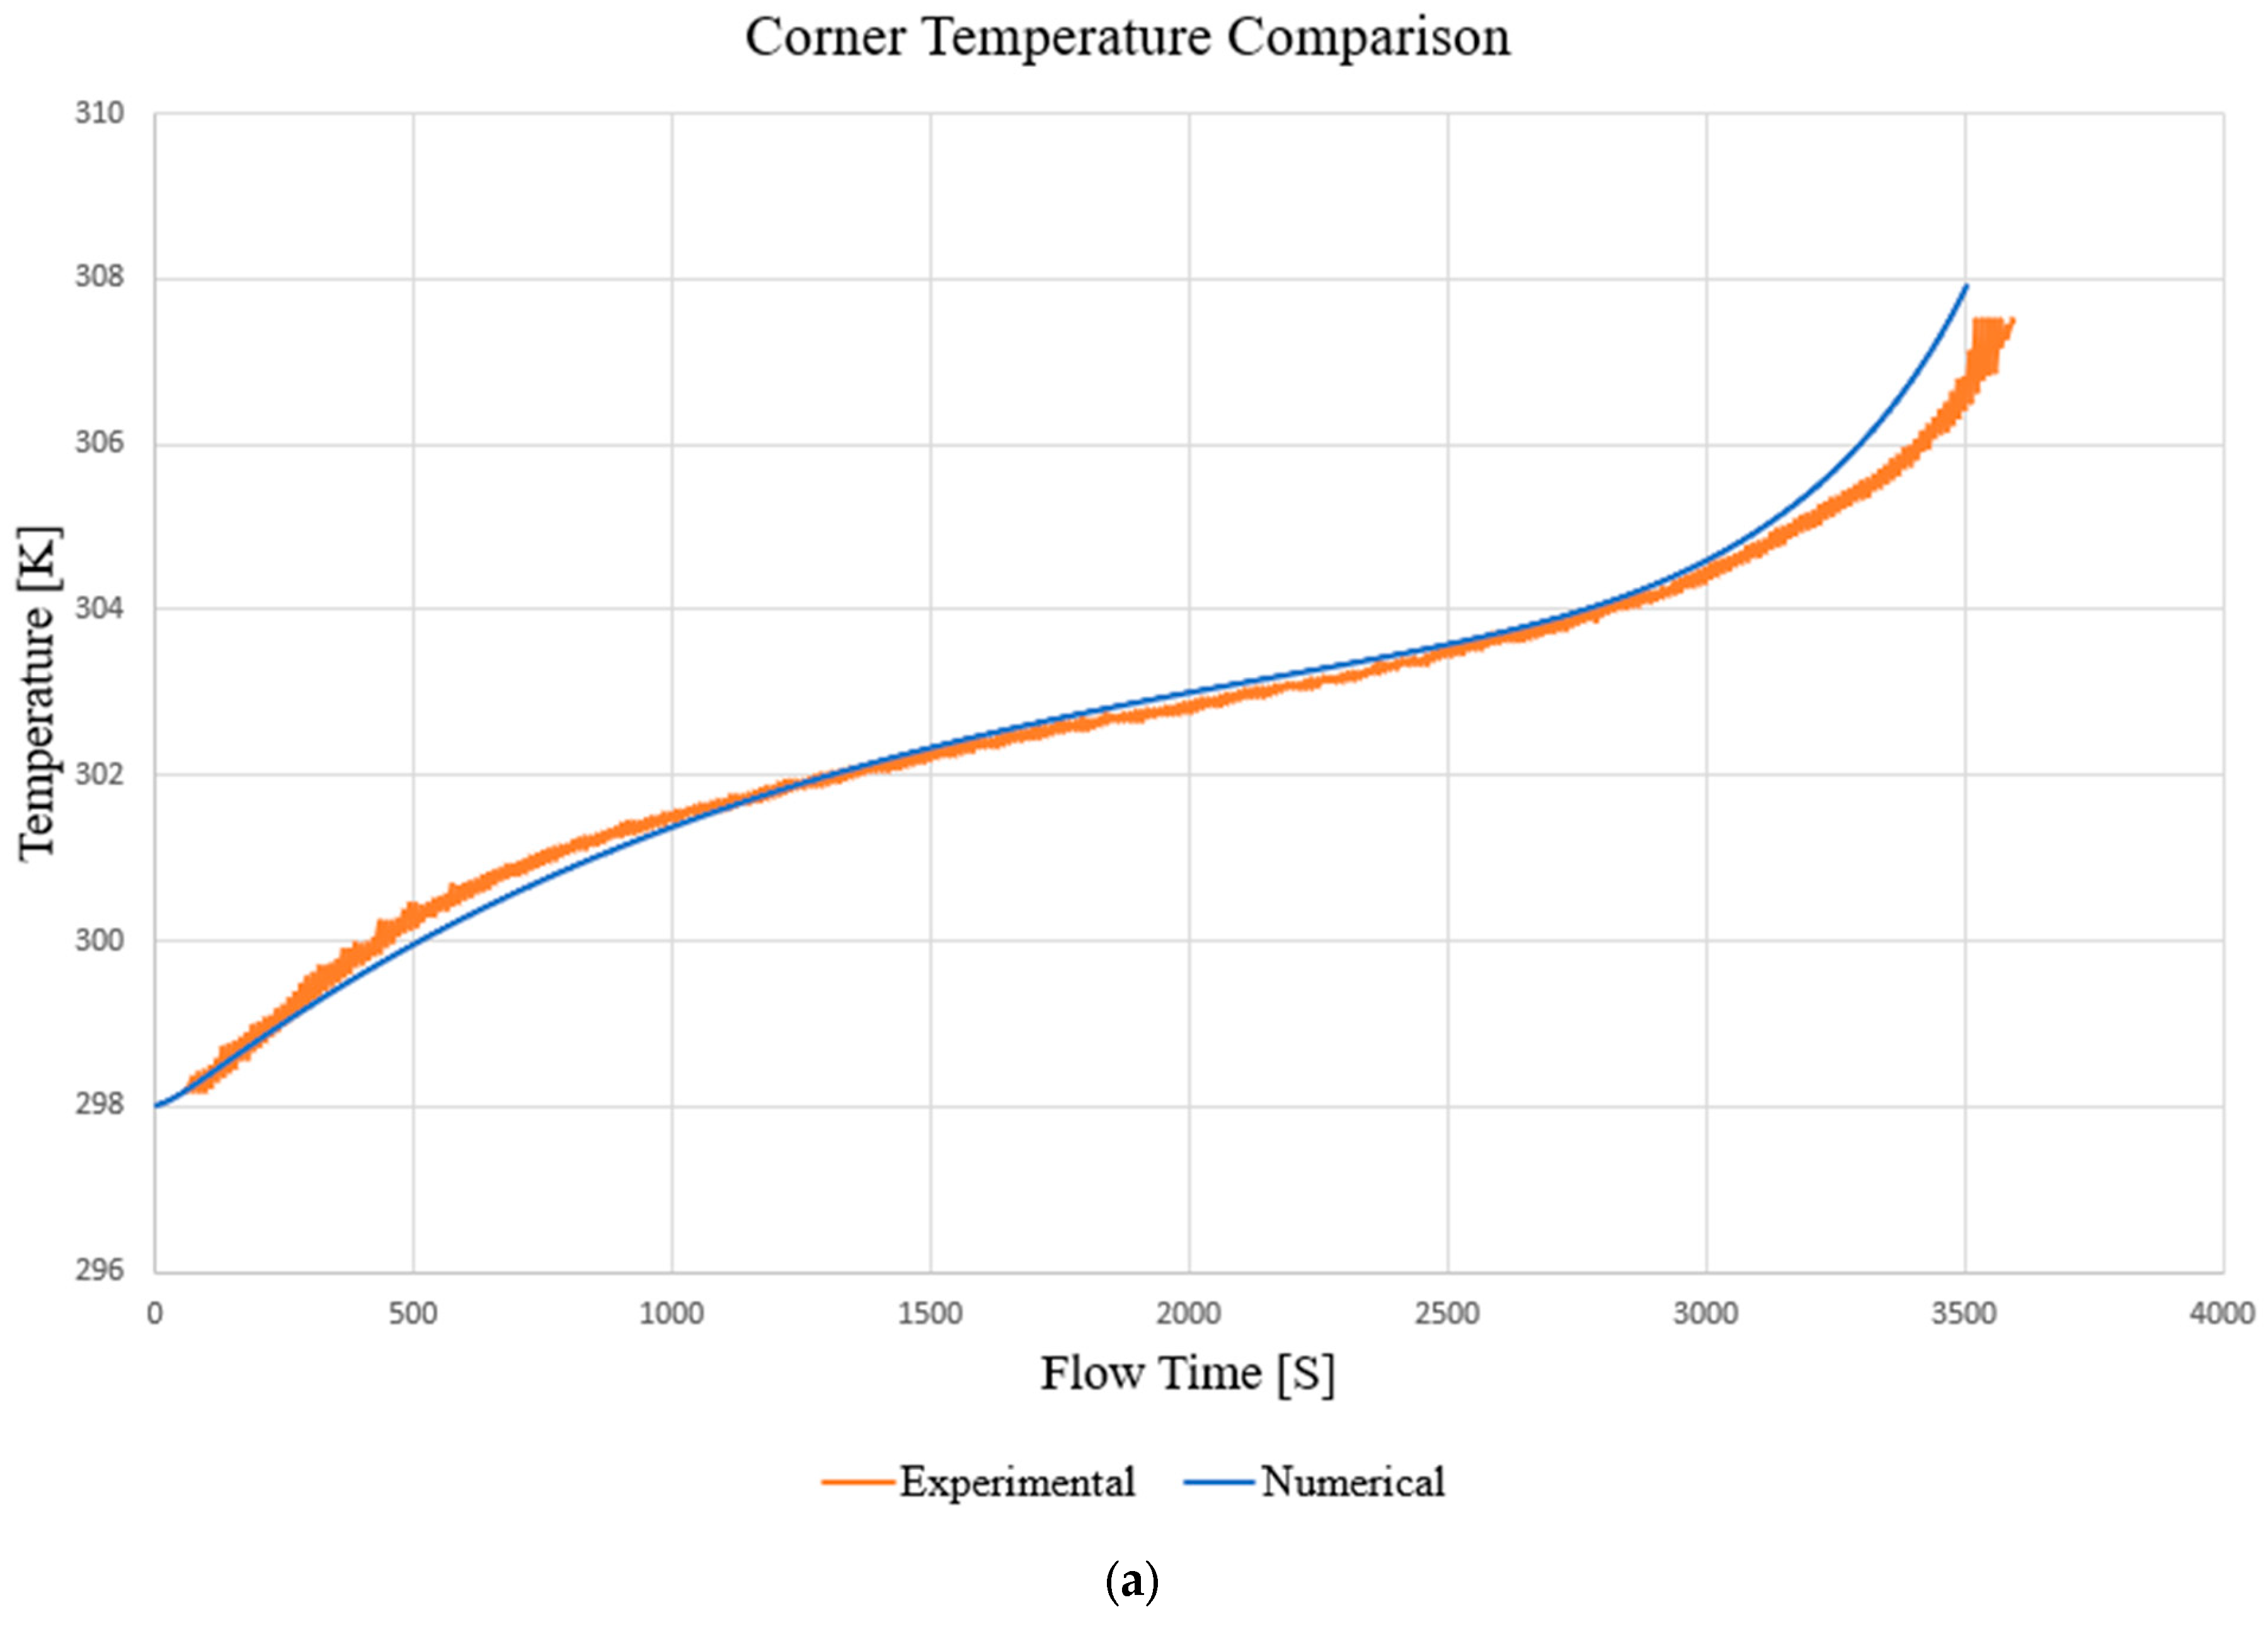
3.1. Model Discussion
- The boundary between the terminal and the cell itself is a “coupled” type of boundary condition that assures the continuity of the temperature across the defined boundary;
- The initial temperature is considered to be 298 K, which is equal to the ambient temperature;
- No flow field is considered for the liquid phase of the PCM;
- The contribution of thermal radiation is not considered;
- The time step was set to 0.6 s, and the number of time steps was determined based on the different C-rates until the cell was completely discharged. The convergence criterion was set with a residual threshold equal to 10−6 for all computational variables monitored;
- Heat transfer from the end surfaces to the room temperature occurs by free convection, and the heat transfer coefficient was set at 10 W/m2K [40].
3.2. Battery Pack
3.3. Effect of the Number of Plates
4. Conclusions
- -
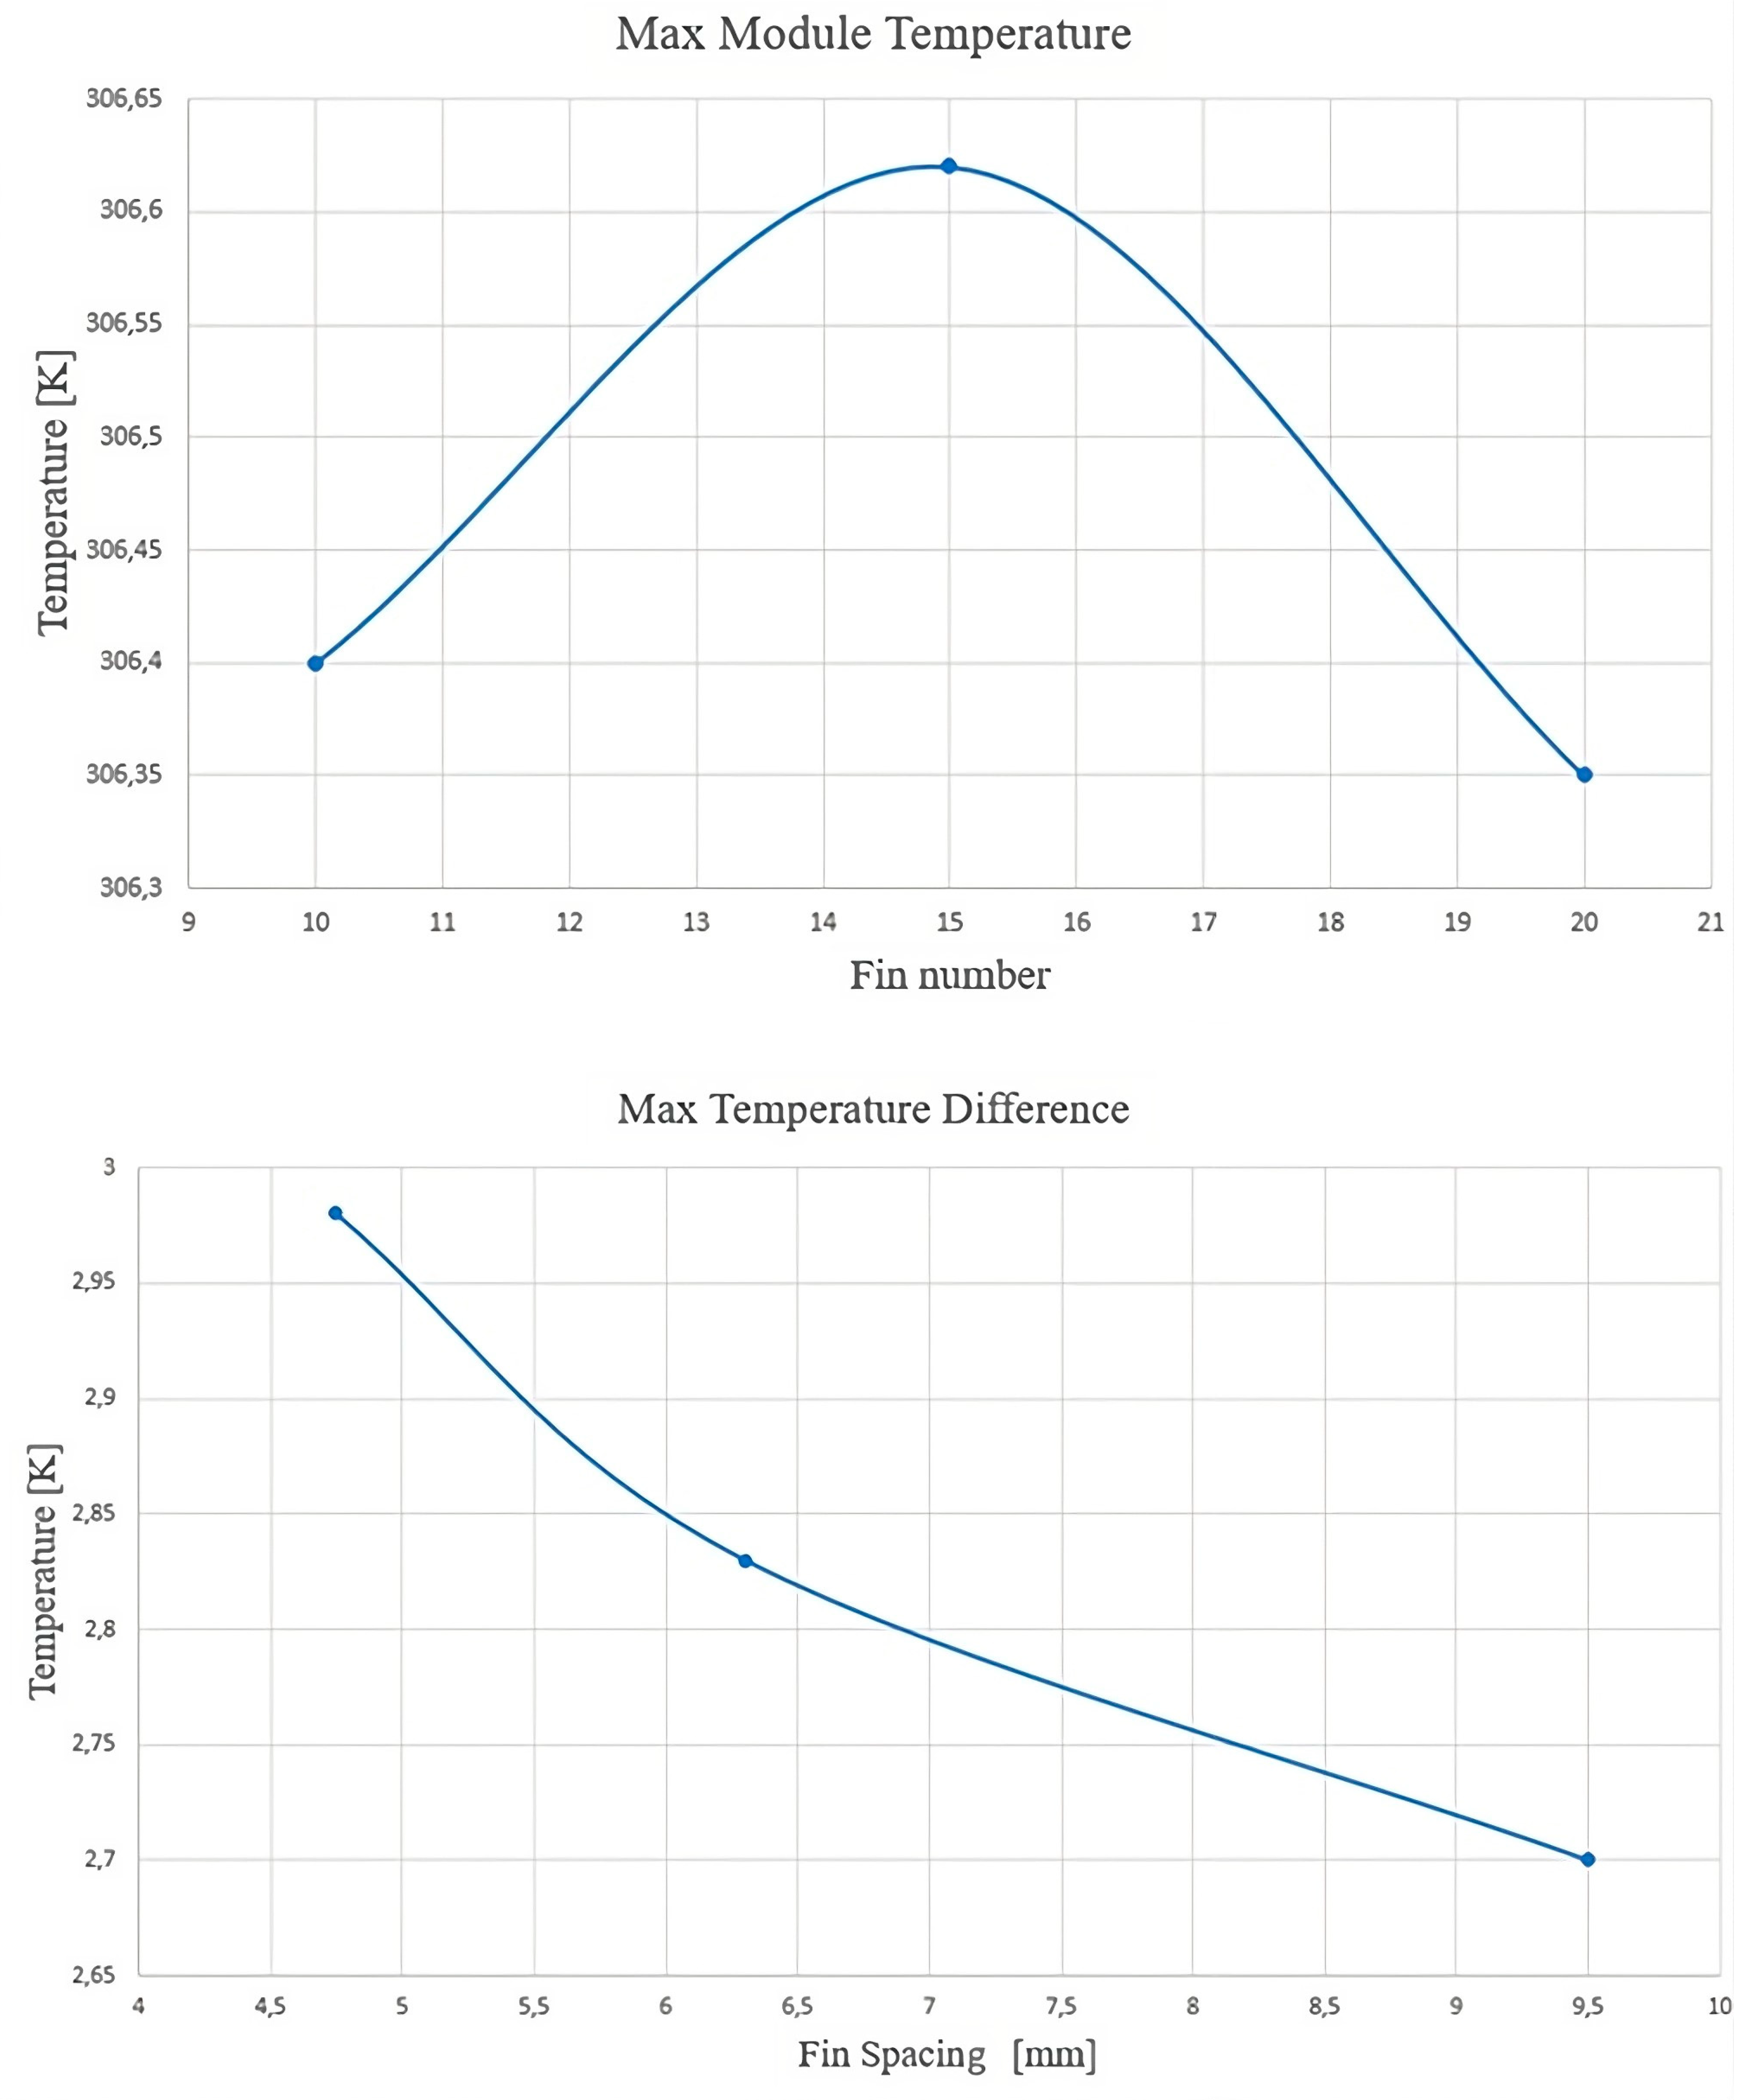
- The thickness of the fins is designed into the battery pack, reducing the maximum temperature and temperature difference and increasing the heat exchange area with the PCM. The best configuration was achieved with 10 fins of 1.5 mm thickness each.
- -
- The fin spacing and number of fins are important factors that should be carefully considered when designing the PCM–fin structure. A fin spacing of 9.5 mm results in the smallest temperature difference among the other values considered.
- -
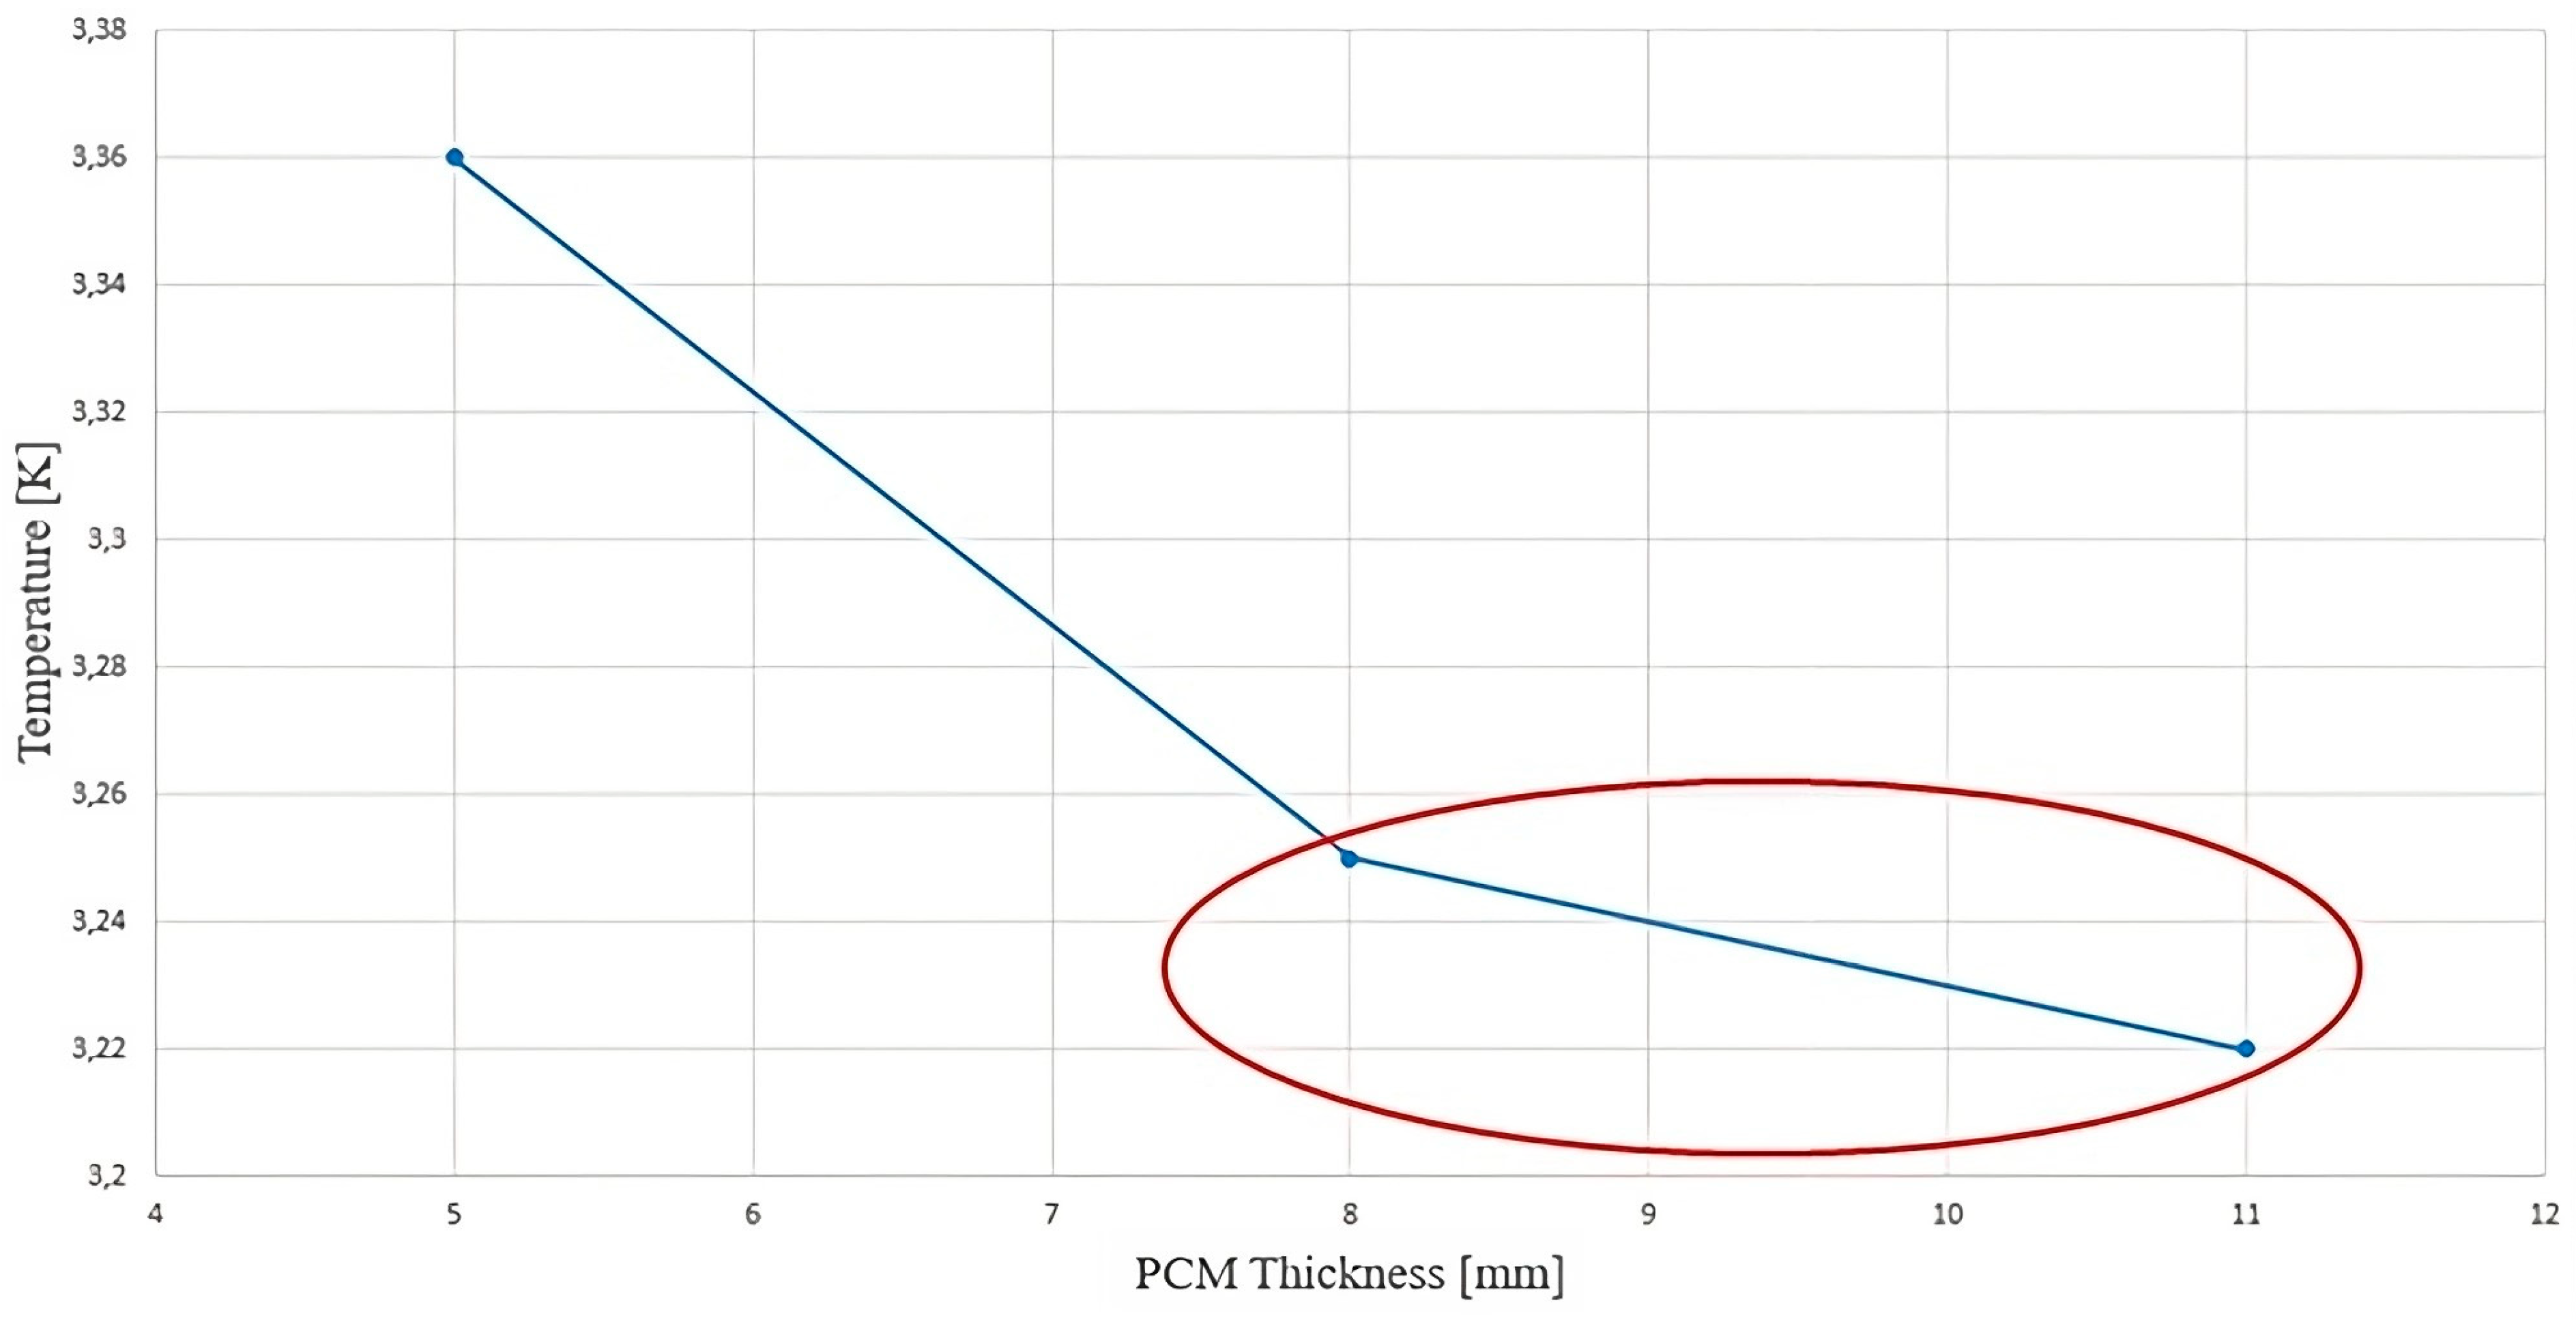
- Adequately increasing the thickness of the PCM can improve thermal performance and is more efficient than other factors. After the PCM thickness exceeded the critical value of 11 mm, the improvement in heat dissipation efficiency was insignificant.
Author Contributions
Funding
Data Availability Statement
Acknowledgments
Conflicts of Interest
Nomenclature
| Acronyms | |
| 1P3S | three batteries connected in series |
| BMS | Battery Management System |
| BTMS | Battery Thermal Management System |
| CFD | Computational Fluid Dynamic |
| DOD | depth of discharge |
| ECM | Equivalent Circuit Model |
| HEV | Hybrid Electric Vehicle |
| LFP | Lithium Iron Phosphate |
| LIB | Lithium-Ion Battery |
| MSE | Mean Squared Error |
| NCA | lithium Nickel Cobalt Aluminium oxide |
| NMC | Nickel Manganese Cobalt |
| PCM | Phase change material |
| SOC | state of charge |
| TCE | thermal conductivity enhancement |
| TR | thermal runaway |
| UDS | User-Defined Scalar |
| Variables | |
| cp | specific heat (J·kg−1·K−1) |
| cp,i, | specific heat for the specific component (J·kg−1·K−1) |
| H | PCM enthalpy (J) |
| Href | reference enthalpy (PCM) (J) |
| i | current density (Am−2) |
| l | thermal conductivity of the liquid phase (W·m−1·K−1) |
| s | thermal conductivity of the solid phase (W·m−1·K−1) |
| L | latent heat of the PCM (J) |
| Ln | cathode slice (m) |
| Lp | anode slice (m) |
| Ls | separator slice (m) |
| m | PCM mass (kg) |
| volumic heat generation rate (W·m−3) | |
| q | heat generation rate (W·m−2) |
| r | resistivity of the current-collecting tab (Wm) |
| rc | resistivity of the electrical contact (Wm) |
| S | source term (W·m−3) |
| t | time (s) |
| T | temperature profile (K) |
| Tl | temperature of the liquid phase (PCM) (K) |
| Ts | temperature of the solid phase (PCM) (K) |
| UDS0 | diffusivity of the positive side (m2/s) |
| UDS1 | diffusivity of the negative side (m2/s) |
| Uoc | open-circuit potential (V) |
| Vi | volume of the specific component (m3) |
| V | battery operating potential (V) |
| DH | latent heat content variation: 0 for the solid phase and 1 for the liquid phase (J) |
| dc | collector thickness (m) |
| de | electrode thickness (m) |
| g | liquid fraction |
| lx | heat conductivity coefficient on the x-axis (W·m−1·K−1) |
| ly | heat conductivity coefficient on the y-axis (W·m−1·K−1) |
| lz | heat conductivity coefficient on the z-axis (W·m−1·K−1) |
| r | density (kg·m−3) |
| ri | density for the specific component (kg·m−3) |
| rl | density for the liquid phase PCM (kg·m−3) |
| rs | density for the solid phase PCM (kg·m−3) |
| sc | electric conductivity of the collector (Sm−1) |
| se | electric conductivity of the electrode (Sm−1) |
References
- Brinklow, G.; Herreros, J.M.; Rezaei, S.Z.; Doustdar, O.; Tsolakis, A.; Millington, P.; Kolpin, A. Impact of Cylinder Deactivation Strategies on Three-way Catalyst Performance in High Efficiency Low Emissions Engines. Chem. Eng. J. Adv. 2023, 14, 100481. [Google Scholar] [CrossRef]
- Avaritsioti, E. Environmental and Economic Benefits of Car Exhaust Heat Recovery. Transp. Res. Procedia 2016, 14, 1003–1012. [Google Scholar] [CrossRef]
- Zahabi, S.A.H.; Miranda-Moreno, L.; Barla, P.; Vincent, B. Fuel economy of hybrid-electric versus conventional gasoline vehicles in real-world conditions: A case study of cold cities in Quebec, Canada. Transp. Res. Part Transp. Environ. 2014, 32, 184–192. [Google Scholar] [CrossRef]
- Zhang, W.; Fang, X.; Sun, C. The alternative path for fossil oil: Electric vehicles or hydrogen fuel cell vehicles? J. Environ. Manag. 2023, 341, 118019. [Google Scholar] [CrossRef] [PubMed]
- Ahmadi, P.; Khoshnevisan, A. Dynamic simulation and lifecycle assessment of hydrogen fuel cell electric vehicles considering various hydrogen production methods. Int. J. Hydrogen Energy 2022, 47, 26758–26769. [Google Scholar] [CrossRef]
- Santos, G.; Smith, O. Electric vehicles and the energy generation mix in the UK: 2020–2050. Energy Rep. 2023, 9, 5612–5627. [Google Scholar] [CrossRef]
- Sanguesa, J.A.; Torres-Sanz, V.; Garrido, P.; Martinez, F.J.; Marquez-Barja, J.M. A Review on Electric Vehicles: Technologies and Challenges. Smart Cities 2021, 4, 372–404. [Google Scholar] [CrossRef]
- Ali, H.M. Thermal management systems for batteries in electric vehicles: A recent review. Energy Rep. 2023, 9, 5545–5564. [Google Scholar] [CrossRef]
- Kong, D.; Lv, H.; Ping, P.; Wang, G. A review of early warning methods of thermal runaway of lithium ion batteries. J. Energy Storage 2023, 64, 107073. [Google Scholar] [CrossRef]
- Mallick, S.; Gayen, D. Thermal behaviour and thermal runaway propagation in lithium-ion battery systems—A critical review. J. Energy Storage 2023, 62, 106894. [Google Scholar] [CrossRef]
- Shahid, S.; Agelin-Chaab, M. A review of thermal runaway prevention and mitigation strategies for lithium-ion batteries. Energy Convers. Manag. X 2022, 16, 100310. [Google Scholar] [CrossRef]
- Yang, Y.; Wang, R.; Shen, Z.; Yu, Q.; Xiong, R.; Shen, W. Towards a safer lithium-ion batteries: A critical review on cause, characteristics, warning and disposal strategy for thermal runaway. Adv. Appl. Energy 2023, 11, 100146. [Google Scholar] [CrossRef]
- Christensen, P.A.; Milojevic, Z.; Wise, M.S.; Ahmeid, M.; Attidekou, P.S.; Mrozik, W.; Dickmann, N.A.; Restuccia, F.; Lambert, S.M.; Das, P.K. Thermal and mechanical abuse of electric vehicle pouch cell modules. Appl. Therm. Eng. 2021, 189, 116623. [Google Scholar] [CrossRef]
- Wang, W.; Li, Y.; Cheng, L.; Zuo, F.; Yang, S. Safety performance and failure prediction model of cylindrical lithium-ion battery. J. Power Sources 2020, 451, 227755. [Google Scholar] [CrossRef]
- Ianniciello, L.; Biwolé, P.H.; Achard, P. Electric vehicles batteries thermal management systems employing phase change materials. J. Power Sources 2018, 378, 383–403. [Google Scholar] [CrossRef]
- Pema, T. How to Choose Right Battery for Electric Two-Wheelers, Econ. Times 2023. Available online: https://economictimes.indiatimes.com/news/how-to/how-carbon-emissions-can-also-be-used-to-achieve-green-goals/articleshow/102673617.cms (accessed on 16 August 2023).
- Olabi, A.G.; Maghrabie, H.M.; Adhari, O.H.K.; Sayed, E.T.; Yousef, B.A.A.; Salameh, T.; Kamil, M.; Abdelkareem, M.A. Battery thermal management systems: Recent progress and challenges. Int. J. Thermofluids 2022, 15, 100171. [Google Scholar] [CrossRef]
- Zubi, G.; Dufo-López, R.; Carvalho, M.; Pasaoglu, G. The lithium-ion battery: State of the art and future perspectives. Renew. Sustain. Energy Rev. 2018, 89, 292–308. [Google Scholar] [CrossRef]
- Liu, H.; Wei, Z.; He, W.; Zhao, J. Thermal issues about Li-ion batteries and recent progress in battery thermal management systems: A review. Energy Convers. Manag. 2017, 150, 304–330. [Google Scholar] [CrossRef]
- Ning, G.; Haran, B.; Popov, B.N. Capacity fade study of lithium-ion batteries cycled at high discharge rates. J. Power Sources 2003, 117, 160–169. [Google Scholar] [CrossRef]
- Belt, J.R.; Ho, C.D.; Motloch, C.G.; Miller, T.J.; Duong, T.Q. A capacity and power fade study of Li-ion cells during life cycle testing. J. Power Sources 2003, 123, 241–246. [Google Scholar] [CrossRef]
- Park, C.; Jaura, A.K. Dynamic Thermal Model of Li-Ion Battery for Predictive Behavior in Hybrid and Fuel Cell Vehicles; SAE Technical Paper; SAE Internation: Warrendale, PA, USA, 2003; p. 2003-01-2286. [Google Scholar] [CrossRef]
- Chen, Y.; Evans, J.W. Thermal Analysis of Lithium-Ion Batteries. J. Electrochem. Soc. 1996, 143, 2708–2712. [Google Scholar] [CrossRef]
- Lin, J.; Liu, X.; Li, S.; Zhang, C.; Yang, S. A review on recent progress, challenges and perspective of battery thermal management system. Int. J. Heat Mass Transf. 2021, 167, 120834. [Google Scholar] [CrossRef]
- Zhao, G.; Wang, X.; Negnevitsky, M.; Zhang, H. A review of air-cooling battery thermal management systems for electric and hybrid electric vehicles. J. Power Sources 2021, 501, 230001. [Google Scholar] [CrossRef]
- Sharma, D.K.; Prabhakar, A. A review on air cooled and air centric hybrid thermal management techniques for Li-ion battery packs in electric vehicles. J. Energy Storage 2021, 41, 102885. [Google Scholar] [CrossRef]
- Murali, G.; Sravya, G.S.N.; Jaya, J.; Vamsi, V.N. A review on hybrid thermal management of battery packs and it’s cooling performance by enhanced PCM. Renew. Sustain. Energy Rev. 2021, 150, 111513. [Google Scholar] [CrossRef]
- Murugan, M.; Saravanan, A.; Elumalai, P.V.; Murali, G.; Dhineshbabu, N.R.; Kumar, P.; Afzal, A. Thermal management system of lithium-ion battery packs for electric vehicles: An insight based on bibliometric study. J. Energy Storage 2022, 52, 104723. [Google Scholar] [CrossRef]
- Shen, Z.-G.; Chen, S.; Liu, X.; Chen, B. A review on thermal management performance enhancement of phase change materials for vehicle lithium-ion batteries. Renew. Sustain. Energy Rev. 2021, 148, 111301. [Google Scholar] [CrossRef]
- Phase Change Materials for Battery Thermal Management of Electric and Hybrid Vehicles: A Review—ScienceDirect, (n.d.). Available online: https://www.sciencedirect.com/science/article/pii/S2772427122000869 (accessed on 13 December 2023).
- Landini, S.; Leworthy, J.; O’Donovan, T.S. A Review of Phase Change Materials for the Thermal Management and Isothermalisation of Lithium-Ion Cells. J. Energy Storage 2019, 25, 100887. [Google Scholar] [CrossRef]
- Kim, J.; Oh, J.; Lee, H. Review on battery thermal management system for electric vehicles. Appl. Therm. Eng. 2019, 149, 192–212. [Google Scholar] [CrossRef]
- Maknikar, S.K.; Pawar, A.M. Application of phase change material (PCM) in battery thermal management system (BTMS): A critical review. Mater. Today Proc. 2023. [Google Scholar] [CrossRef]
- Choure, B.K.; Alam, T.; Kumar, R. A review on heat transfer enhancement techniques for PCM based thermal energy storage system. J. Energy Storage 2023, 72, 108161. [Google Scholar] [CrossRef]
- Zhao, Y.; Zhang, X.; Yang, B.; Cai, S. A review of battery thermal management systems using liquid cooling and PCM. J. Energy Storage 2024, 76, 109836. [Google Scholar] [CrossRef]
- Chen, J.; Kang, S.; E, J.; Huang, Z.; Wei, K.; Zhang, B.; Zhu, H.; Deng, Y.; Zhang, F.; Liao, G. Effects of different phase change material thermal management strategies on the cooling performance of the power lithium ion batteries: A review. J. Power Sources 2019, 442, 227228. [Google Scholar] [CrossRef]
- Xu, Y.; He, C.; Chen, Y.; Sun, Y.; Yin, H.; Zheng, Z.-J. Experimental and numerical study on the effect of the intelligent memory metal fin on the melting and solidification process of PCM. Renew. Energy 2023, 218, 119366. [Google Scholar] [CrossRef]
- Triscari, G.; Santovito, M.; Bressan, M.; Papurello, D. Experimental and model validation of a phase change material heat exchanger integrated into a real building. Int. J. Energy Res. 2021, 45, 18222–18236. [Google Scholar] [CrossRef]
- Sciacovelli, A.; Gagliardi, F.; Verda, V. Maximization of performance of a PCM latent heat storage system with innovative fins. Appl. Energy 2015, 137, 707–715. [Google Scholar] [CrossRef]
- Estevez, M.A.P.; Calligaro, S.; Bottesi, O.; Caligiuri, C.; Renzi, M. An electro-thermal model and its electrical parameters estimation procedure in a lithium-ion battery cell. Energy 2021, 234, 121296. [Google Scholar] [CrossRef]
- Du, S.; Jia, M.; Cheng, Y.; Tang, Y.; Zhang, H.; Ai, L.; Zhang, K.; Lai, Y. Study on the thermal behaviors of power lithium iron phosphate (LFP) aluminum-laminated battery with different tab configurations. Int. J. Therm. Sci. 2015, 89, 327–336. [Google Scholar] [CrossRef]
- Buck, W.; Rudtsch, S. Thermal Properties. In Springer Handbook of Materials Measurement Methods; Czichos, H., Saito, T., Smith, L., Eds.; Springer: Berlin/Heidelberg, Germany, 2006; pp. 399–429. [Google Scholar] [CrossRef]
- Chen, S.C.; Wan, C.C.; Wang, Y.Y. Thermal analysis of lithium-ion batteries. J. Power Sources 2005, 140, 111–124. [Google Scholar] [CrossRef]
- Estevez, M.A.P.; Caligiuri, C.; Renzi, M. A CFD thermal analysis and validation of a Li-ion pouch cell under different temperatures conditions. E3S Web Conf. 2021, 238, 09003. [Google Scholar] [CrossRef]
- Lidbeck, A. Experimental Characterization of Li-Ion Battery Cells for Thermal Management in Heavy Duty Hybrid Application. 2017. Available online: https://publications.lib.chalmers.se/records/fulltext/252994/252994.pdf (accessed on 23 March 2024).
- Wu, B.; Li, Z.; Zhang, J. Thermal Design for the Pouch-Type Large-Format Lithium-Ion Batteries: I. Thermo-Electrical Modeling and Origins of Temperature Non-Uniformity. J. Electrochem. Soc. 2015, 162, A181–A191. [Google Scholar] [CrossRef]
- Yi, J.; Kim, U.S.; Shin, C.B.; Han, T.; Park, S. Three-Dimensional Thermal Modeling of a Lithium-Ion Battery Considering the Combined Effects of the Electrical and Thermal Contact Resistances between Current Collecting Tab and Lead Wire. J. Electrochem. Soc. 2013, 160, A437–A443. [Google Scholar] [CrossRef]
- Lide, D.R. Handbook of Chemistry and Physics, 84th ed.; CRC Press: Boca Raton, FL, USA, 2003. [Google Scholar]
- Xiao, M.; Choe, S.-Y. Theoretical and experimental analysis of heat generations of a pouch type LiMn2O4/carbon high power Li-polymer battery. J. Power Sources 2013, 241, 46–55. [Google Scholar] [CrossRef]
- Bernardi, D.; Pawlikowski, E.; Newman, J. A General Energy Balance for Battery Systems. J. Electrochem. Soc. 1985, 132, 5–12. [Google Scholar] [CrossRef]
- ANSYS Fluent Advanced Add-On Module, Software Release 17.0. 2016. Available online: https://www.scribd.com/document/344930548/ANSYS-Fluent-Advanced-Add-On-Modules (accessed on 22 March 2024).
- Chen, M.; Rincon-Mora, G.A. Accurate electrical battery model capable of predicting runtime and I-V performance. IEEE Trans. Energy Convers. 2006, 21, 504–511. [Google Scholar] [CrossRef]
- Dutil, Y.; Rousse, D.R.; Salah, N.B.; Lassue, S.; Zalewski, L. A review on phase-change materials: Mathematical modeling and simulations. Renew. Sustain. Energy Rev. 2011, 15, 112–130. [Google Scholar] [CrossRef]
- Voller, V.R.; Prakash, C. A fixed grid numerical modelling methodology for convection-diffusion mushy region phase-change problems. Int. J. Heat Mass Transf. 1987, 30, 1709–1719. [Google Scholar] [CrossRef]
- Al-abidi, A.A.; Mat, S.B.; Sopian, K.; Sulaiman, M.Y.; Mohammed, A.T. CFD applications for latent heat thermal energy storage: A review. Renew. Sustain. Energy Rev. 2013, 20, 353–363. [Google Scholar] [CrossRef]
- Agyenim, F.; Hewitt, N.; Eames, P.; Smyth, M. A review of materials, heat transfer and phase change problem formulation for latent heat thermal energy storage systems (LHTESS). Renew. Sustain. Energy Rev. 2010, 14, 615–628. [Google Scholar] [CrossRef]
- Khateeb, S.A.; Amiruddin, S.; Farid, M.; Selman, J.R.; Al-Hallaj, S. Thermal management of Li-ion battery with phase change material for electric scooters: Experimental validation. J. Power Sources 2005, 142, 345–353. [Google Scholar] [CrossRef]
- Caudwell, D.R.; Trusler, J.P.M.; Vesovic, V.; Wakeham, W.A. The Viscosity and Density of n-Dodecane and n-Octadecane at Pressures up to 200 MPa and Temperatures up to 473 K. Int. J. Thermophys. 2004, 25, 1339–1352. [Google Scholar] [CrossRef]
- Abdi, A.; Ignatowicz, M.; Gunasekara, S.N.; Chiu, J.N.; Martin, V. Experimental investigation of thermo-physical properties of n-octadecane and n-eicosane. Int. J. Heat Mass Transf. 2020, 161, 120285. [Google Scholar] [CrossRef]
- Panchal, S.; Dincer, I.; Agelin-Chaab, M.; Fraser, R.; Fowler, M. Experimental and theoretical investigation of temperature distributions in a prismatic lithium-ion battery. Int. J. Therm. Sci. 2016, 99, 204–212. [Google Scholar] [CrossRef]
- Panchal, S.; Dincer, I.; Agelin-Chaab, M.; Fraser, R.; Fowler, M. Thermal modeling and validation of temperature distributions in a prismatic lithium-ion battery at different discharge rates and varying boundary conditions. Appl. Therm. Eng. 2016, 96, 190–199. [Google Scholar] [CrossRef]
- Lin, C.; Wang, F.; Fan, B.; Ren, S.; Zhang, Y.; Han, L.; Liu, S.; Xu, S. Comparative study on the heat generation behavior of lithium-ion batteries with different cathode materials using accelerating rate calorimetry. Energy Procedia 2017, 142, 3369–3374. [Google Scholar] [CrossRef]
- He, T.; Zhang, T.; Wang, Z.; Cai, Q. A comprehensive numerical study on electrochemical-thermal models of a cylindrical lithium-ion battery during discharge process. Appl. Energy 2022, 313, 118797. [Google Scholar] [CrossRef]
- Ping, P.; Peng, R.; Kong, D.; Chen, G.; Wen, J. Investigation on thermal management performance of PCM-fin structure for Li-ion battery module in high-temperature environment. Energy Convers. Manag. 2018, 176, 131–146. [Google Scholar] [CrossRef]
- Paciolla, P. Enhancement of PCM Materials Using Metal Fins in a Battery Thermal Management System, Laurea, Politecnico di Torino. 2022. Available online: https://webthesis.biblio.polito.it/22462/ (accessed on 10 May 2024).


| Axial Parameter | |||
|---|---|---|---|
| Dimensions (mm) | x | y | z |
| Active Zone | 95 | 300 | 14 |
| Tab Zone | 30 | 15 | 8 |
| Nominal Cell Capacity [Ah] | 59.3 |
| C-Rate (h) | 1 |
| Min. Stop Voltage (V) | 2.5 |
| Max. Stop Voltage (V) | 4.25 |
| Axial Parameters | |||
|---|---|---|---|
| X | Y | Z | |
| Thermal Conductivity [W·m−1·K−1] | 23 | 31.6 | 0.74 |
| Specific Heat [J·kg−1·K−1] | 1091 | ||
| Density [kg·m−3] | 1930 |
| Parameter (unit) | Electrode | Value |
|---|---|---|
| [Ω m] | Positive | 2.6 × 10⁻⁹ |
| Negative | 4.8 × 10⁻¹⁰ |
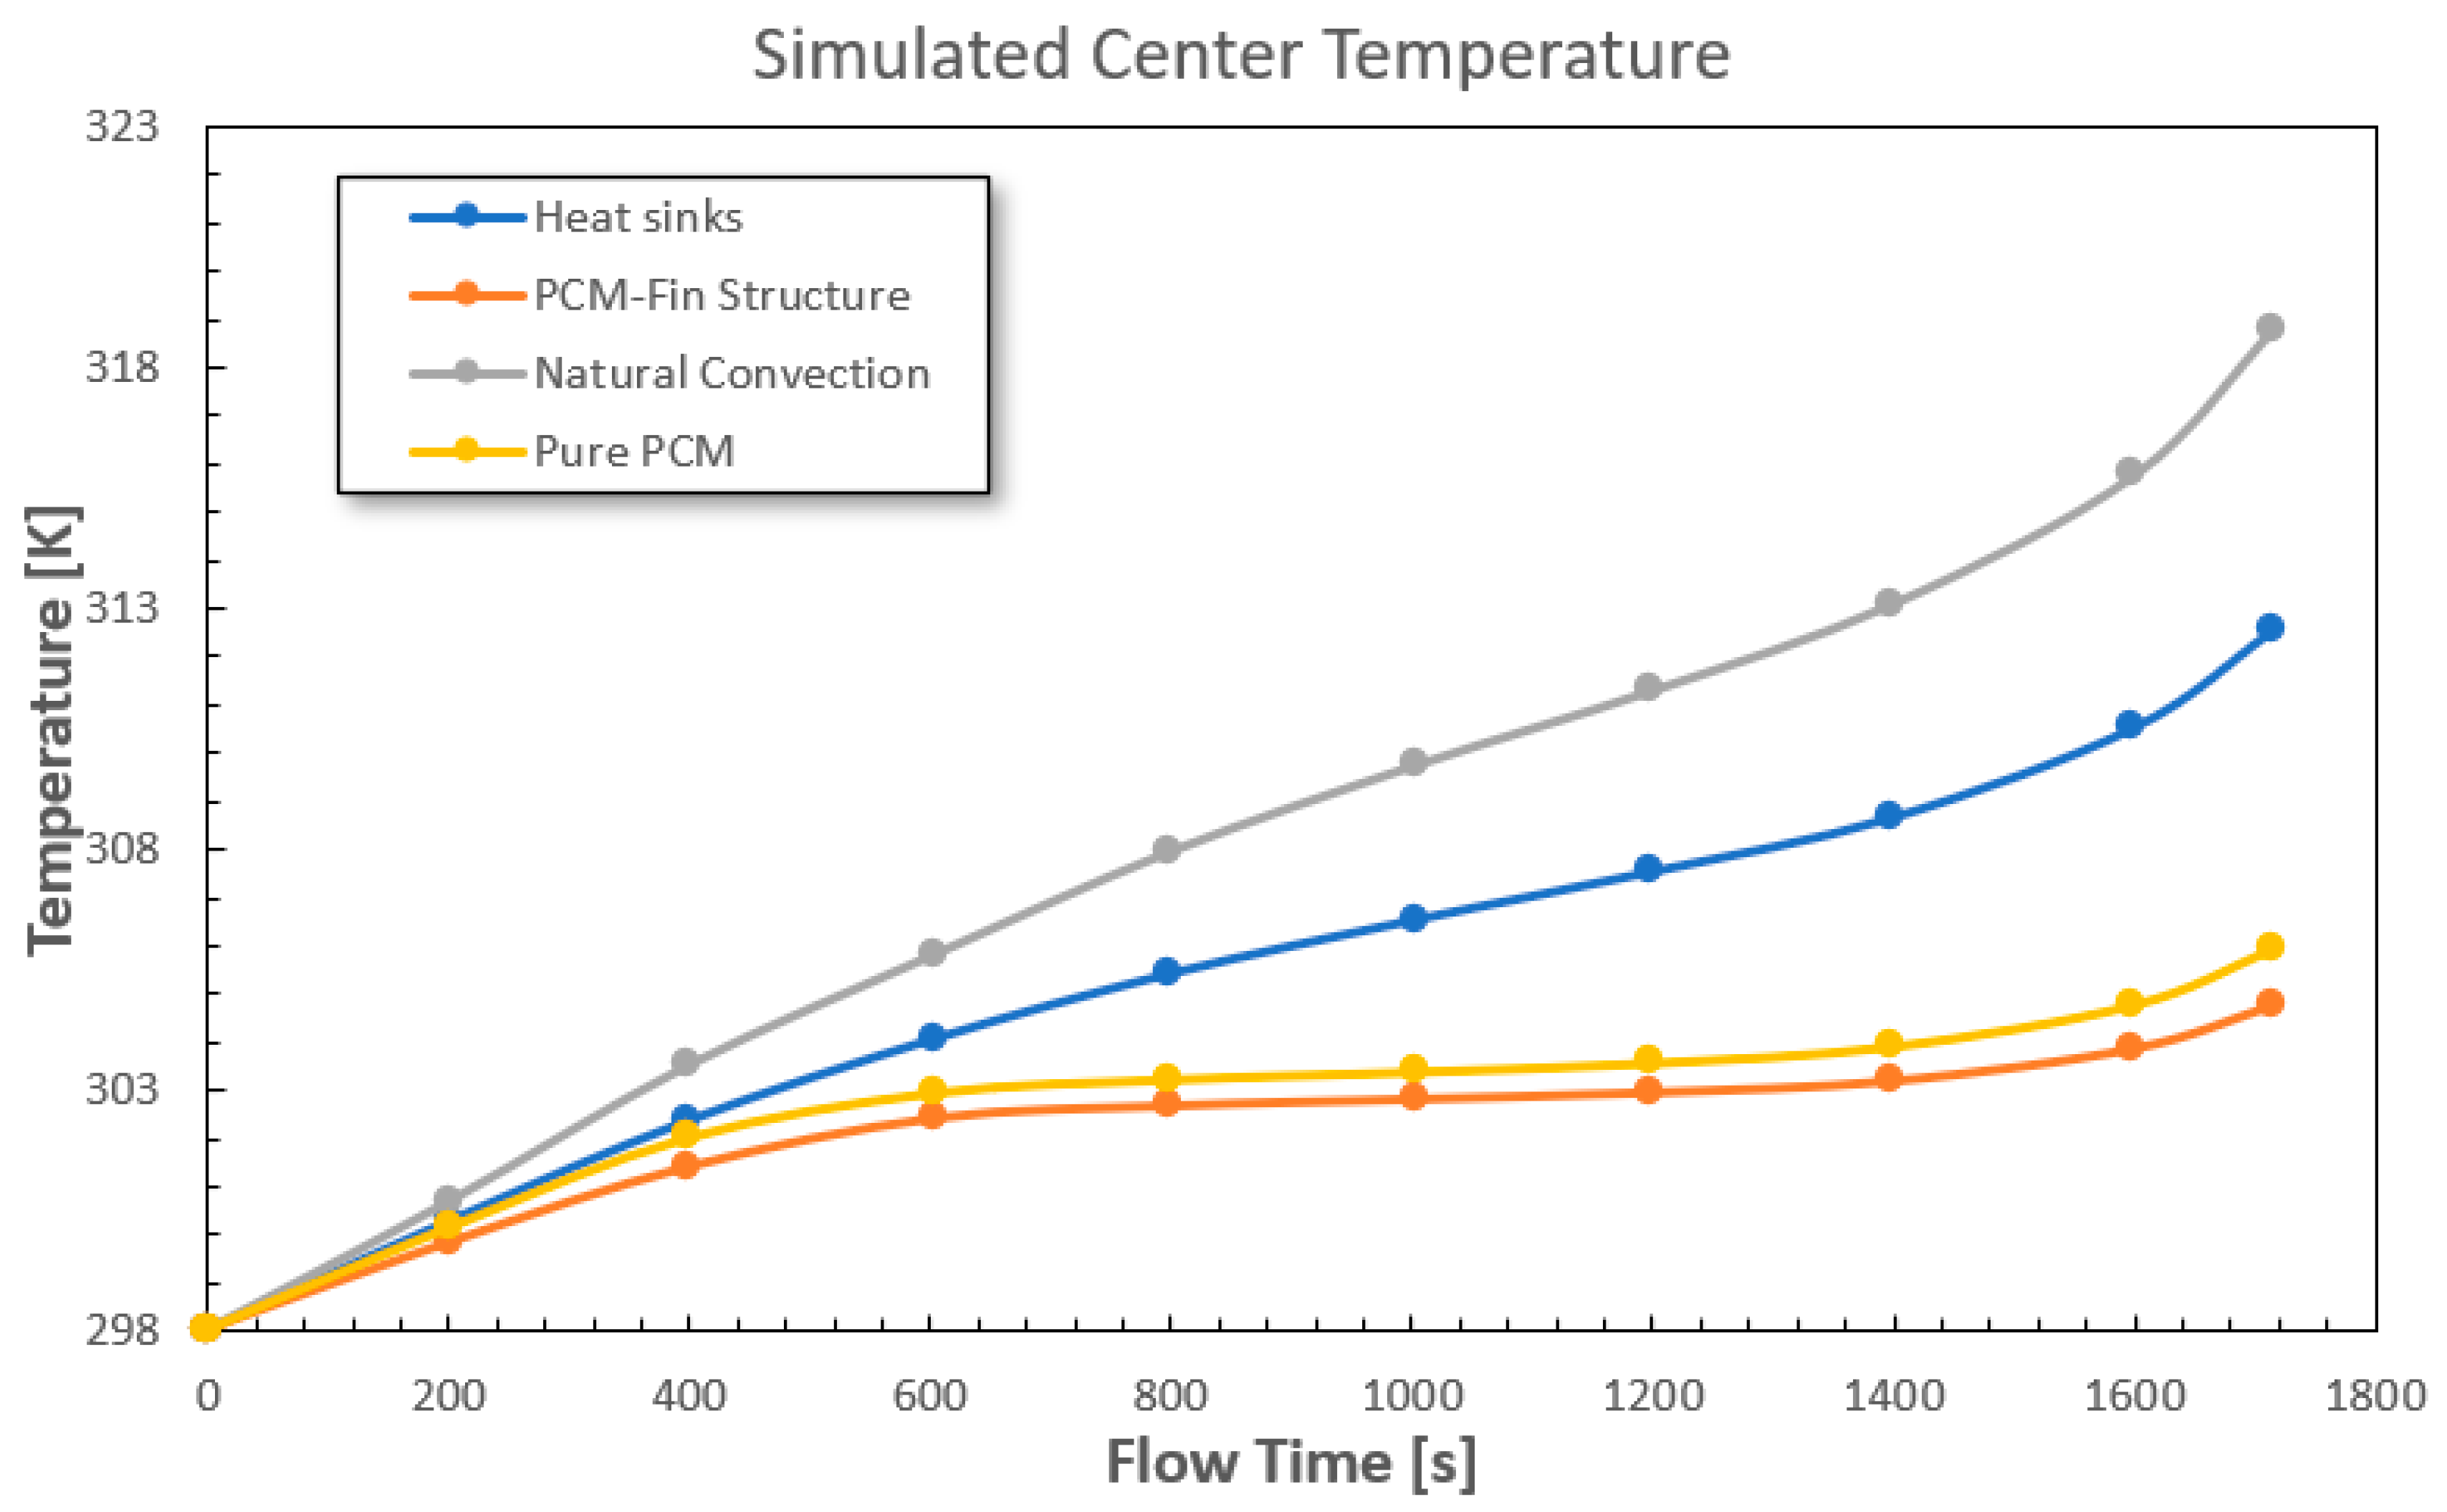
| 1C Discharge Rate | ||||
|---|---|---|---|---|
| Natural Convection | 308.55 | 1.2 | ||
| Cooling Method | Performance | Performance | ||
| Heat Sinks | 305.25 | −9.3% | 0.88 | −27% |
| Pure PCM | 303.55 | −13.9% | 1.05 | −14.3% |
| PCM–Fin Structure | 303.05 | −15.6% | 0.81 | −32.5% |
| 2C Discharge Rate | ||||
|---|---|---|---|---|
| Natural Convection | 318.75 | 2.35 | ||
| Cooling Method | Performance | Performance | ||
| Heat Sinks | 312.65 | −13.45% | 1.79 | −23.9% |
| Pure PCM | 306.05 | −27.8% | 1.97 | −16.2% |
| PCM–Fin Structure | 304.95 | −30.3% | 1.57 | −33.2% |
Disclaimer/Publisher’s Note: The statements, opinions and data contained in all publications are solely those of the individual author(s) and contributor(s) and not of MDPI and/or the editor(s). MDPI and/or the editor(s) disclaim responsibility for any injury to people or property resulting from any ideas, methods, instructions or products referred to in the content. |
© 2024 by the authors. Licensee MDPI, Basel, Switzerland. This article is an open access article distributed under the terms and conditions of the Creative Commons Attribution (CC BY) license (https://creativecommons.org/licenses/by/4.0/).
Share and Cite
Paciolla, P.; Papurello, D. Improved Thermal Management of Li-Ion Batteries with Phase-Change Materials and Metal Fins. Batteries 2024, 10, 190. https://doi.org/10.3390/batteries10060190
Paciolla P, Papurello D. Improved Thermal Management of Li-Ion Batteries with Phase-Change Materials and Metal Fins. Batteries. 2024; 10(6):190. https://doi.org/10.3390/batteries10060190
Chicago/Turabian StylePaciolla, Pierluca, and Davide Papurello. 2024. "Improved Thermal Management of Li-Ion Batteries with Phase-Change Materials and Metal Fins" Batteries 10, no. 6: 190. https://doi.org/10.3390/batteries10060190
APA StylePaciolla, P., & Papurello, D. (2024). Improved Thermal Management of Li-Ion Batteries with Phase-Change Materials and Metal Fins. Batteries, 10(6), 190. https://doi.org/10.3390/batteries10060190