Article

Fault Diagnosis for Lithium-Ion Battery Pack Based on Relative Entropy and State of Charge Estimation

1
College of Automation, Chongqing University of Posts and Telecommunications, Chongqing 400065, China
2
Chongqing Key Laboratory of Complex Systems and Autonomous Control, Chongqing University of Posts and Telecommunications, Chongqing 400065, China
3
School of Automation, Chongqing University, Chongqing 400044, China
4
Key Laboratory of Complex System Safety and Control, Chongqing University, Chongqing 400044, China
*
Author to whom correspondence should be addressed.
Batteries 2024, 10(7), 217; https://doi.org/10.3390/batteries10070217
Submission received: 19 April 2024 / Revised: 18 June 2024 / Accepted: 18 June 2024 / Published: 21 June 2024

Abstract

:
Timely and accurate fault diagnosis for a lithium-ion battery pack is critical to ensure its safety. However, the early fault of a battery pack is difficult to detect because of its unobvious fault effect and nonlinear time-varying characteristics. In this paper, a fault diagnosis method based on relative entropy and state of charge (SOC) estimation is proposed to detect fault in lithium-ion batteries. First, the relative entropies of the voltage, temperature and SOC of battery cells are calculated by using a sliding window, and the cumulative sum (CUSUM) test is adopted to achieve fault diagnosis and isolation. Second, the SOC estimation of the short-circuit cell is obtained, and the short-circuit resistance is estimated for a quantitative analysis of the short-circuit fault. Furthermore, the effectiveness of our method is validated by multiple fault tests in a thermally coupled electrochemical battery model. The results show that the proposed method can accurately detect different types of faults and evaluate the short-circuit fault degree by resistance estimation. The voltage/temperature sensor fault is detected at 71 s/58 s after faults have occurred, and a short-circuit fault is diagnosed at 111 s after the fault. In addition, the standard error deviation of short-circuit resistance estimation is less than 0.12 Ω/0.33 Ω for a 5 Ω/10 Ω short-circuit resistor.

1. Introduction

To relieve the petrochemical energy crisis and environmental pollution problem, energy storage batteries characterized by electrochemical energy storage plays a crucial role in electric vehicles (EVs) and electricity systems. Among electrochemical energy storage batteries, lithium-ion batteries (LIBs) have attracted widespread attention and are regarded as the most promising batteries [1,2] owing to their outstanding characteristics of energy density, long cycle-life and environmental protection. Additionally, the comprehensive research progress in emerging electrolyte systems for ultralow-temperature lithium batteries offers promising prospects for enhancing their performance under extreme conditions, thereby facilitating the broader application of energy storage devices in cold climates [3]. Nowadays, LIBs have been widely used in electric power storage, EVs, electronic devices, electric boats and even electric aircraft. However, safety accidents caused by LIBs have occurred frequently in recent years, such as fires and explosions, which has aroused public concerns and inhibited LIBs from further development to some extent. Therefore, to prevent safety accidents involving LIBs, it is very necessary to detect and isolate the faults of lithium-ion battery packs in the early fault period.
The reasons for safety accidents with LIBs include natural battery aging and battery abuse. Battery abuse is a major factor and can be categorized into mechanical abuse, electrical abuse and thermal abuse [4]. Moreover, battery abuse will give rise to a variety of battery faults and accelerate battery degradation, even causing a thermal runaway [5,6]. The main cause of thermal runaway is internal short circuit (ISC), which can be divided into micro-short circuit (MSC) and hard-short circuit. However, because a hard-short circuit will immediately lead to thermal runaway, it is meaningless to attempt to detect a hard-short circuit because there is not enough time to take action to avoid thermal runaway [7,8]. Therefore, it is critical to detect ISC faults, especially MSC faults. However, other types of faults will also turn into ISC faults if they are not detected in a limited period. Consequently, developing a multiple-fault diagnosis and identification method is very important for lithium-ion battery packs [9].
Common battery faults include overcharge/over-discharge, connection fault, external/internal short circuit, sensor fault and inconsistency within the battery pack. A variety of methods have been proposed for the detection of one type of these faults or multi-faults in lithium-ion battery packs. The detection methods can be classified into two categories: model-based fault diagnosis methods [10,11,12,13,14] and non-model-based fault diagnosis methods [15,16,17,18,19,20,21,22]. Model-based methods usually establish the battery model to obtain the parameters using fault information and a set of residual signals. Then, the battery faults can be detected by comparing the residual signals with a fault threshold. For example, Xiong et al. proposed a sensor fault diagnosis method by using an unscented Kalman filter (UKF) for SOC estimation, then combining it with a coulomb counting method to detect and isolate current/voltage sensor faults [10]. Zhang et al. proposed a model-based and entropy method for multi-fault diagnosis; the terminal voltage residual and temperature residual based on an extended Kalman filter (EKF) were used to detect and isolate multi-faults in LIBs [11]. Gao et al. developed the relationship between the main parameters of the model and SOC based on a cell difference model, with EKF used for SOC estimation and recursive least squares (RLS) for MSC diagnosis [12]. These model-based methods can effectively detect and isolate battery faults, but most of these fault diagnosis methods require the offline identification of model parameters, which indicates fault diagnosis performance degradation under different operating conditions and temperatures. In addition, if all parameters of the battery pack are identified online in a short time, it will produce a large computational burden. Non-model-based diagnostic methods (including machine learning, statistical analysis and information entropy) have been extensively applied to detect faults in LIBs. Naha et al. proposed a supervised machine learning approach to classify the faults with features extracted from charging curves [15]. In addition, the entropy or correlation coefficient of terminal voltage changes significantly if a fault has occurred, which can be used for fault detection by comparing the terminal voltage in the fault with that in normal operation. Kang et al. designed the interleaved voltage topology and correlation coefficient method for multi-fault diagnosis (voltage sensor fault, connection fault and short-circuit fault) [16]. Zhao et al. proposed a fault diagnosis method based on a machine learning algorithm and a 3σ multilevel screening strategy, and the fault occurrence frequencies of terminal voltage were calculated [17]. Moreover, information entropy methods were developed, and the entropy was calculated in real time using sliding windows to detect faults in LIBs [18,19]. Chen et al. identified the internal state parameters of a faulty battery using RLS and an EKF, and the parameters were subsequently analyzed using the local outlier factor to diagnose the fault in the battery [20]. Li et al. utilized the interclass correlation coefficient method to extract fault information from the voltage by using a sliding window, and then they designed a loop that connects the first and last voltages to locate faults in battery packs [21]. Ma et al. established a fault-free voltage model by a graph neural network and conducted fault diagnosis by comparing it with the measured voltage [22]. These methods have been validated in the test set and performed well in fault diagnosis; however, the accuracy of these methods largely depends on large numbers of fault data and is susceptible to measurement noise.
In addition, because most of the existing methods focus on single type of fault diagnosis, the quantitative analysis of short-circuit fault is still relatively few; thus, in this paper, a multi-fault diagnosis method based on relative entropy and SOC estimation is proposed for a lithium-ion battery pack. The faults include voltage sensor fault, temperature sensor fault and short-circuit fault. First, the cell with measured median voltage is selected as the reference cell, and the relative entropies of the voltage and temperature of the other cells to those of the reference cell are calculated using a sliding window. Second, the relative entropies are evaluated by the cumulative sum (CUSUM) test to achieve fault diagnosis and isolation. Next, the equivalent circuit model parameters of the reference cell are identified using recursive least squares with the variable forgetting factor (VFFRLS), and the SOC of the short-circuit cell is estimated based on the EKF. Furthermore, the short-circuit resistance is estimated with RLS for the quantitative analysis of short-circuit fault.
The main contributions of this research lie in the following aspects: (1) The proposed fault diagnosis method can apply to various operating environments because it is not necessary for a battery model to be built to obtain fault residuals. Importantly, the computational burden and hardware redundancy are not increased to accomplish fault diagnosis and quantitative analysis with the proposed method. (2) The forgetting mechanism can effectively extract the fault information of the voltage and temperature of the battery pack, and CUSUM is used to evaluate the fault information, ensuring the efficiency and accuracy of fault diagnosis. Specifically, the voltage/temperature sensor fault was detected at 71 s/58 s after faults occurred under the US06 condition, and a short-circuit fault was diagnosed at 111 s after the fault with a 5 Ω short-circuit resistor under Federal Urban Driving Schedule (FUDS). The standard error deviation of short-circuit resistance estimation is less than 0.12 Ω/0.33 Ω for a 5 Ω/10 Ω short-circuit resistor under FUDS. (3) Not only can various faults (voltage/temperature sensor faults, short-circuit fault) be diagnosed in the proposed method, but quantitative analysis on short-circuit fault is performed by estimating the resistance of the short-circuit resistor to obtain the degree of short-circuit fault. The remainder of this paper is organized as follows. The multi-fault diagnosis method is introduced in Section 2. The results of the virtual battery pack with the sensor faults and short-circuit faults are analyzed and discussed in Section 3. Finally, the key conclusions are summarized in Section 4.

2. Methods

In this section, a relative entropy method is adopted to calculate the relative entropy of cells’ voltage, temperature and SOC in real time, and the CUSUM is applied to achieve fault diagnosis and isolation. During the charge or discharge process, the difference in SOC between a normal cell and a fault cell can be expressed as ΔSOC, and the CUSUM of ΔSOC is represented as CUΔSOC during the charge or discharge period. When the CUΔSOC is positive in both the charging and discharging phases, it indicates that the SOC of the fault cell is consistently lower than that of the normal cell during this period. Therefore, it can be diagnosed that the fault may be an internal short-circuit fault. Conversely, if the CUΔSOC is negative during the charge phase, it can be implied that the fault cell is likely an aged cell. Furthermore, with the diagnosed short-circuit fault, we quantitatively estimate short-circuit resistance. The specific implementation process is shown in Figure 1.

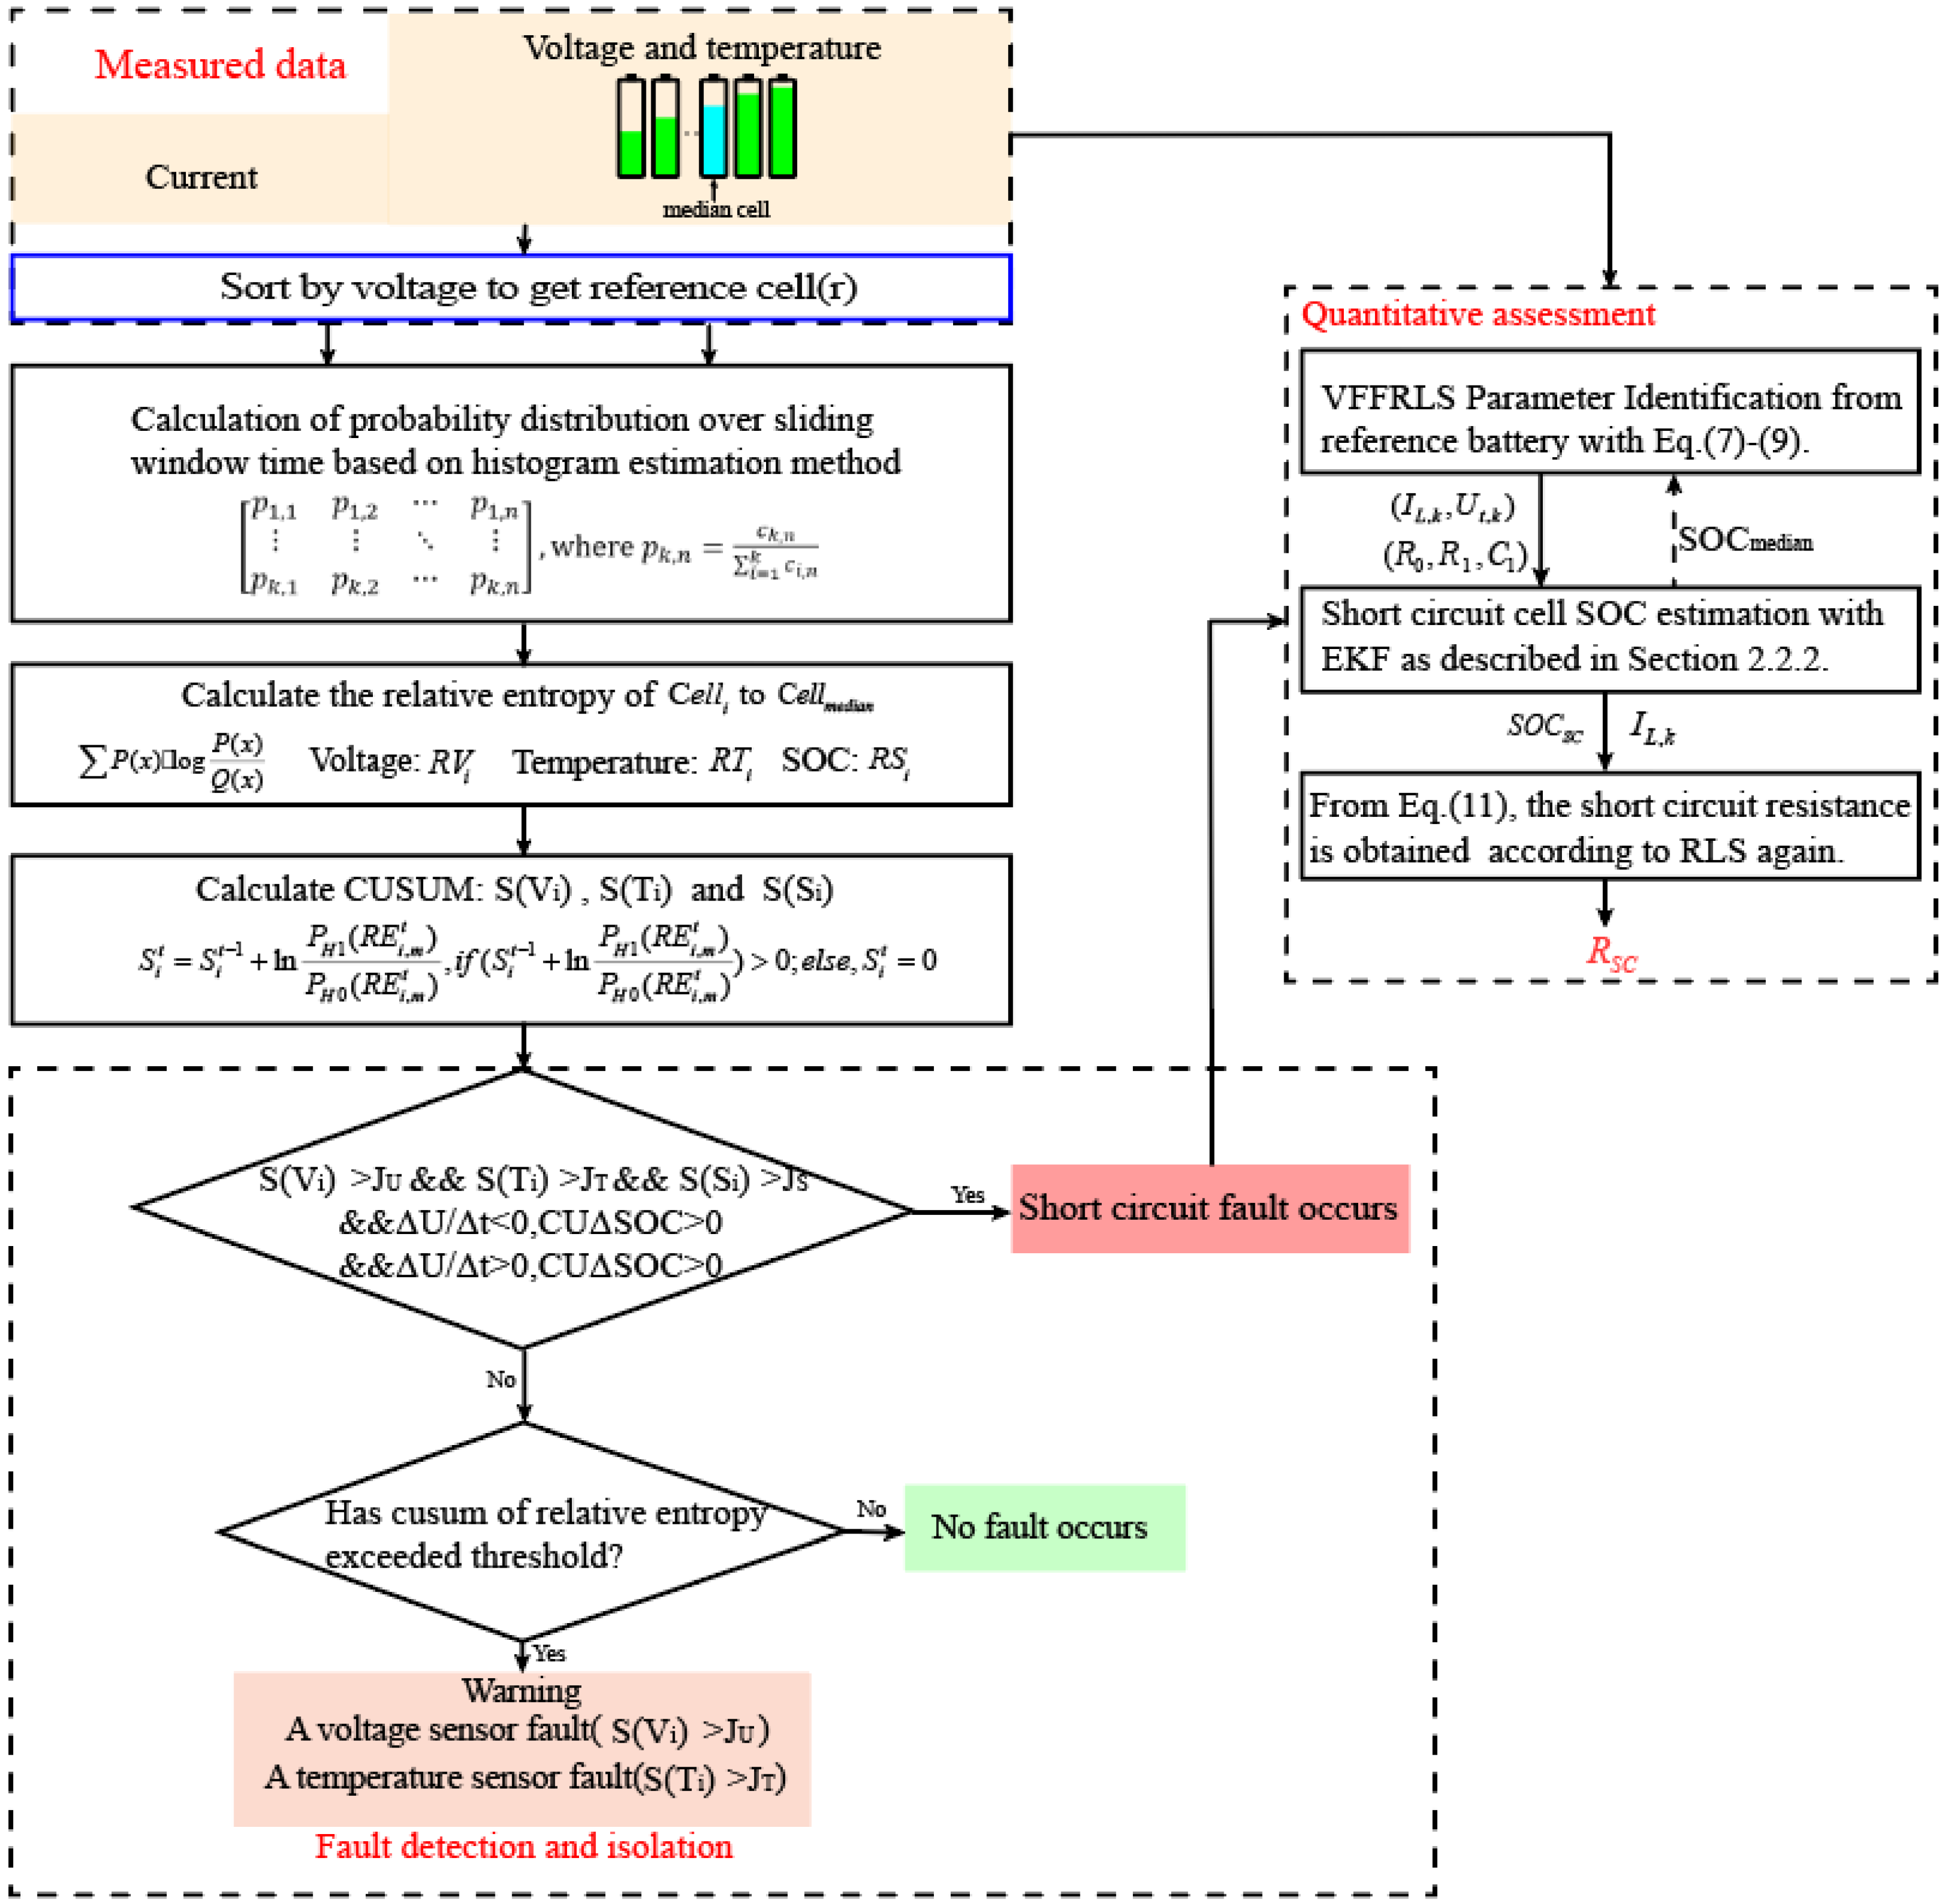
2.1. Description of Relative Entropy Method

2.1.1. Relative Entropy Calculation

Relative entropy has been widely used in information theory and data mining due to its excellent performance in measuring the difference between two probabilities’ distributions [23]. Assuming that P ( x ) and Q ( x ) are two probability distribution functions for a discrete random variable x , the relative entropy of P to Q is defined by
R E ( P | | Q ) = P ( x ) · l o g P ( x ) Q ( x )
where the sum of P(x) and Q(x) are both 1. Usually, P and Q come from frequency distributions, so the relative entropy is always positive. If P and Q are identical, the relative entropy is zero. The higher the relative entropy, the lower the similarity between two probability distributions. In this work, relative entropy is used to detect battery fault information. First, for a series-connected battery pack, the cell with the median voltage is selected and regarded as the reference cell. Next, the relative entropy of the measured values (voltage, temperature and SOC) of the other cells to the reference cell is calculated. Despite the inconsistency of cells in the battery pack, this difference is not obvious proof that the battery pack can operate normally. However, if a sensor fault occurs in a battery, the value measured by the sensor will definitely deviate from that of the reference cell. Similarly, if a short-circuit fault occurs in a battery, the measured temperature and voltage will also greatly differ from that of the reference cell. Therefore, to obtain the fault information in real time, it is necessary to calculate the relative entropy of temperature, voltage and SOC for each cell, adopting the sliding window at each sampling moment. Here, taking the voltage of a battery pack as an example, the raw voltage matrix of n cells within sampling time t1 to t2 is represented as
U = U 1 ,   U 2 , U i , U n = u 1 t 1 u 2 t 1 u n t 1 u 1 t 2 u 2 t 2 u n t 2
The voltage of the reference cell during this period can be expressed as U m = u m t 1 , u m t 2 T . Next, in sampling time t1 to t2, a matrix C is defined as
C = c 1,1 c 1,2 c 1 , n c k , 1 c k , 2 c k , n
where k indicates the number of intervals from t1 to t2; normally, k is set to 10 [19,24]. c k , n refers to the number of incidences of U n in u m i n + ( x 1 ) u m a x u m i n k , u m i n + x u m a x u m i n k during t1 to t2, u m a x and u m i n are the maximum and minimum values of U , respectively, and x = 1 k . According to C, the frequency distribution matrix P is obtained thus:
P = p 1,1 p 1,2 p 1 , n p k , 1 p k , 2 p k , n ,   w h e r e   p k , n = c k , n i = 1 k c i , n
The relative entropy R D t 2 of the measured temperature and voltage of all cells to that of the reference cell is defined as R D t 2 = R E 1 , m t 2 , R E 2 , m t 2 , R E n , m t 2 . Like the Shannon entropy, the sliding window length has a great influence on the entropy value: neither too small nor too large can reveal the battery fault information; here, the sliding window size is chosen as 100 [19,24].

2.1.2. Relative Entropy Evaluation

In order to accurately detect faults in a battery and reduce the risk of false/missed alarms, a CUSUM test is applied to evaluate the relative entropy of carrying fault information; the details can be referred to [11,25]. Fault diagnosis can be regarded as a binary hypothesis problem; based on the likelihood ratio principle, the CUSUM of the log-likelihood ratio of the sequence can be formulated as
S i t = S i t 1 + l n P H 1 ( R E i , m t ) P H 0 ( R E i , m t ) , i f     S i t 1 + l n P H 1 ( R E i , m t ) P H 0 ( R E i , m t ) > 0 0 , i f     S i t 1 + l n P H 1 ( R E i , m t ) P H 0 ( R E i , m t ) < 0
where P H 1 and P H 0 are the probability density functions of the sequence under hypotheses H1 (fault) and H0 (no fault), respectively, and the probability distribution is viewed as Gaussian distribution. R E i , m t represents the relative entropy of the measured voltage or temperature of a cell i at sampling point t. If a fault occurs, the CUSUM of log-likelihood ratios S i t will increase continually to exceed the alarm threshold of voltage J U ( J T   f o r   t e m p e r a t u r e ). The alarm threshold has been calibrated by extensive experimental or simulation tests.

2.2. Quantitative Assessment Method of Short-Circuit Fault

To evaluate the severity of a battery’s short-circuit fault, it involves estimating the short-circuit current or resistance by quantitative analysis. If a short-circuit fault occurs, the real discharge electricity of a cell during discharge is larger than that calculated by coulombic counting, and the real charge electricity is smaller than that calculated by coulombic counting during charging. The battery model without/with short-circuit resistance is shown in Figure 2a/Figure 2b, respectively. In this work, firstly, the parameters (R0, R1, C1) of the reference cell in the equivalent circuit model in Figure 2a are identified online by using VFFRLS. Secondly, with the identification parameters, the actual SOC of the short-circuit cell in Figure 2b is estimated by the EKF method. Next, the short-circuit current in Figure 2b is obtained by comparing it with the coulombic counting method. Furthermore, the short-circuit resistance is calculated by using RLS.

2.2.1. Online Parameter Identification

Specifically, according to Kirchhoff’s law, the dynamical electrical equations can be obtained, as shown in Equation (6). R 0 is internal resistance, R 1 C 1 constitutes a network of mass transport effects and dynamic voltage performance, and U 1 describes the diffusion voltage. Open-circuit voltage U o c is a nonlinear function of SOC, and U t represents the battery terminal voltage; I L is the load current, taken as positive for discharging and negative for charging.
U ˙ 1 = 1 R 1 C 1 U 1 + 1 C 1 I L U t = U o c U 1 I L · R 0
By Laplace transformation and bilinear transformation (discretization), Equation (6) can be transformed to Equation (7), where a1, a2 and a3 are the identified parameters. With the identified parameters, the resistance and capacitance parameters in Figure 2a can be obtained as follows.
Y k = U o c ,   k U t ,   k = φ k θ k T φ k = Y k 1 ,   I L ,   k ,   I L ,   k 1 θ k = a 1 ,   a 2 ,   a 3 R 0 = a 2 a 3 1 + a 1 R 1 = 2 ( a 1 a 2 + a 3 ) 1 a 1 2 R 1 C 1 = 1 + a 1 2 ( 1 a 1 )
The process of parameter identification by the recursive least squares method with the forgetting factor is below. First, the parameter vectors θ 0 and the error covariance matrices P 0 in Equation (8) are initialized, and then the parameters (a1, a2 and a3) are adjusted adaptively according to the samples of load current and measured voltage.
K k = P k 1 φ k T ( λ + φ k P k 1 φ k T ) 1 P k = 1 λ [ e y e ( 3 ) K k φ k ] P k 1 θ k T = θ k 1 T + K k ( Y k φ k θ k 1 T )
Because forgetting factor λ has great influence on recognition results, a VFFRLS algorithm is adopted to select the appropriate forgetting factor. This algorithm adaptively searches the optimal forgetting factor according to the estimation error. The forgetting factor is updated as follows.
L ( k ) = i = k M + 1 k e i e i T M λ ( k ) = λ m i n + ( λ m a x λ m i n ) · 2 L ( k )

2.2.2. Short-Circuit Resistance Estimation Based on SOC

With the identified parameters of the reference cell, the SOC of the short-circuit cell can be estimated by employing a closed-loop method of EKF. By discretizing Equation (6) and combining it with the coulombic counting method, the state space equations of the battery model can be expressed as follows
x k = S O C k U 1 ,   k = f ( x k 1 ,   u k ) = S O C k 1 η Δ t C n · I L ,   k e x p ( Δ t / R 1 C 1 ) · U 1 ,   k 1 + ( 1 e x p ( Δ t / R 1 C 1 ) ) · R 1 · I L ,   k + w k 1 y k = U t ,   k = g ( x k ,   u k ) = U o c ( S O C k ) U 1 ,   k R 0 · I L ,   k + v k
where k is the time index and Δ t is the time interval. η is coulomb efficiency, assumed to be 1, and C n is battery available capacity. x k and y k are the state vector and output vector at time k, respectively. f and g denote the state function and measurement function, respectively. w k 1 and v k are the independent zero-mean Gaussian process noise and measurement noise with the covariance Q k and R k . The computational procedure of the EKF algorithm is comprehensively described in [26]. Our paper focuses on the diagnosis of internal short-circuit faults in lithium-ion batteries, so we will not elaborate further on SOC estimation here.
With the actual SOC estimation of the short-circuit battery, we can obtain the relationship between the short-circuit current and the load current, as shown in Equation (11). In consequence, the short-circuit resistance can be estimated online according to the recursive least square method.
I b ,   k = C n · ( S O C k S O C k 1 ) Δ t I S C ,   k = I b ,   k I L ,   k U t ,   k = I S C ,   k · R S C ,   k

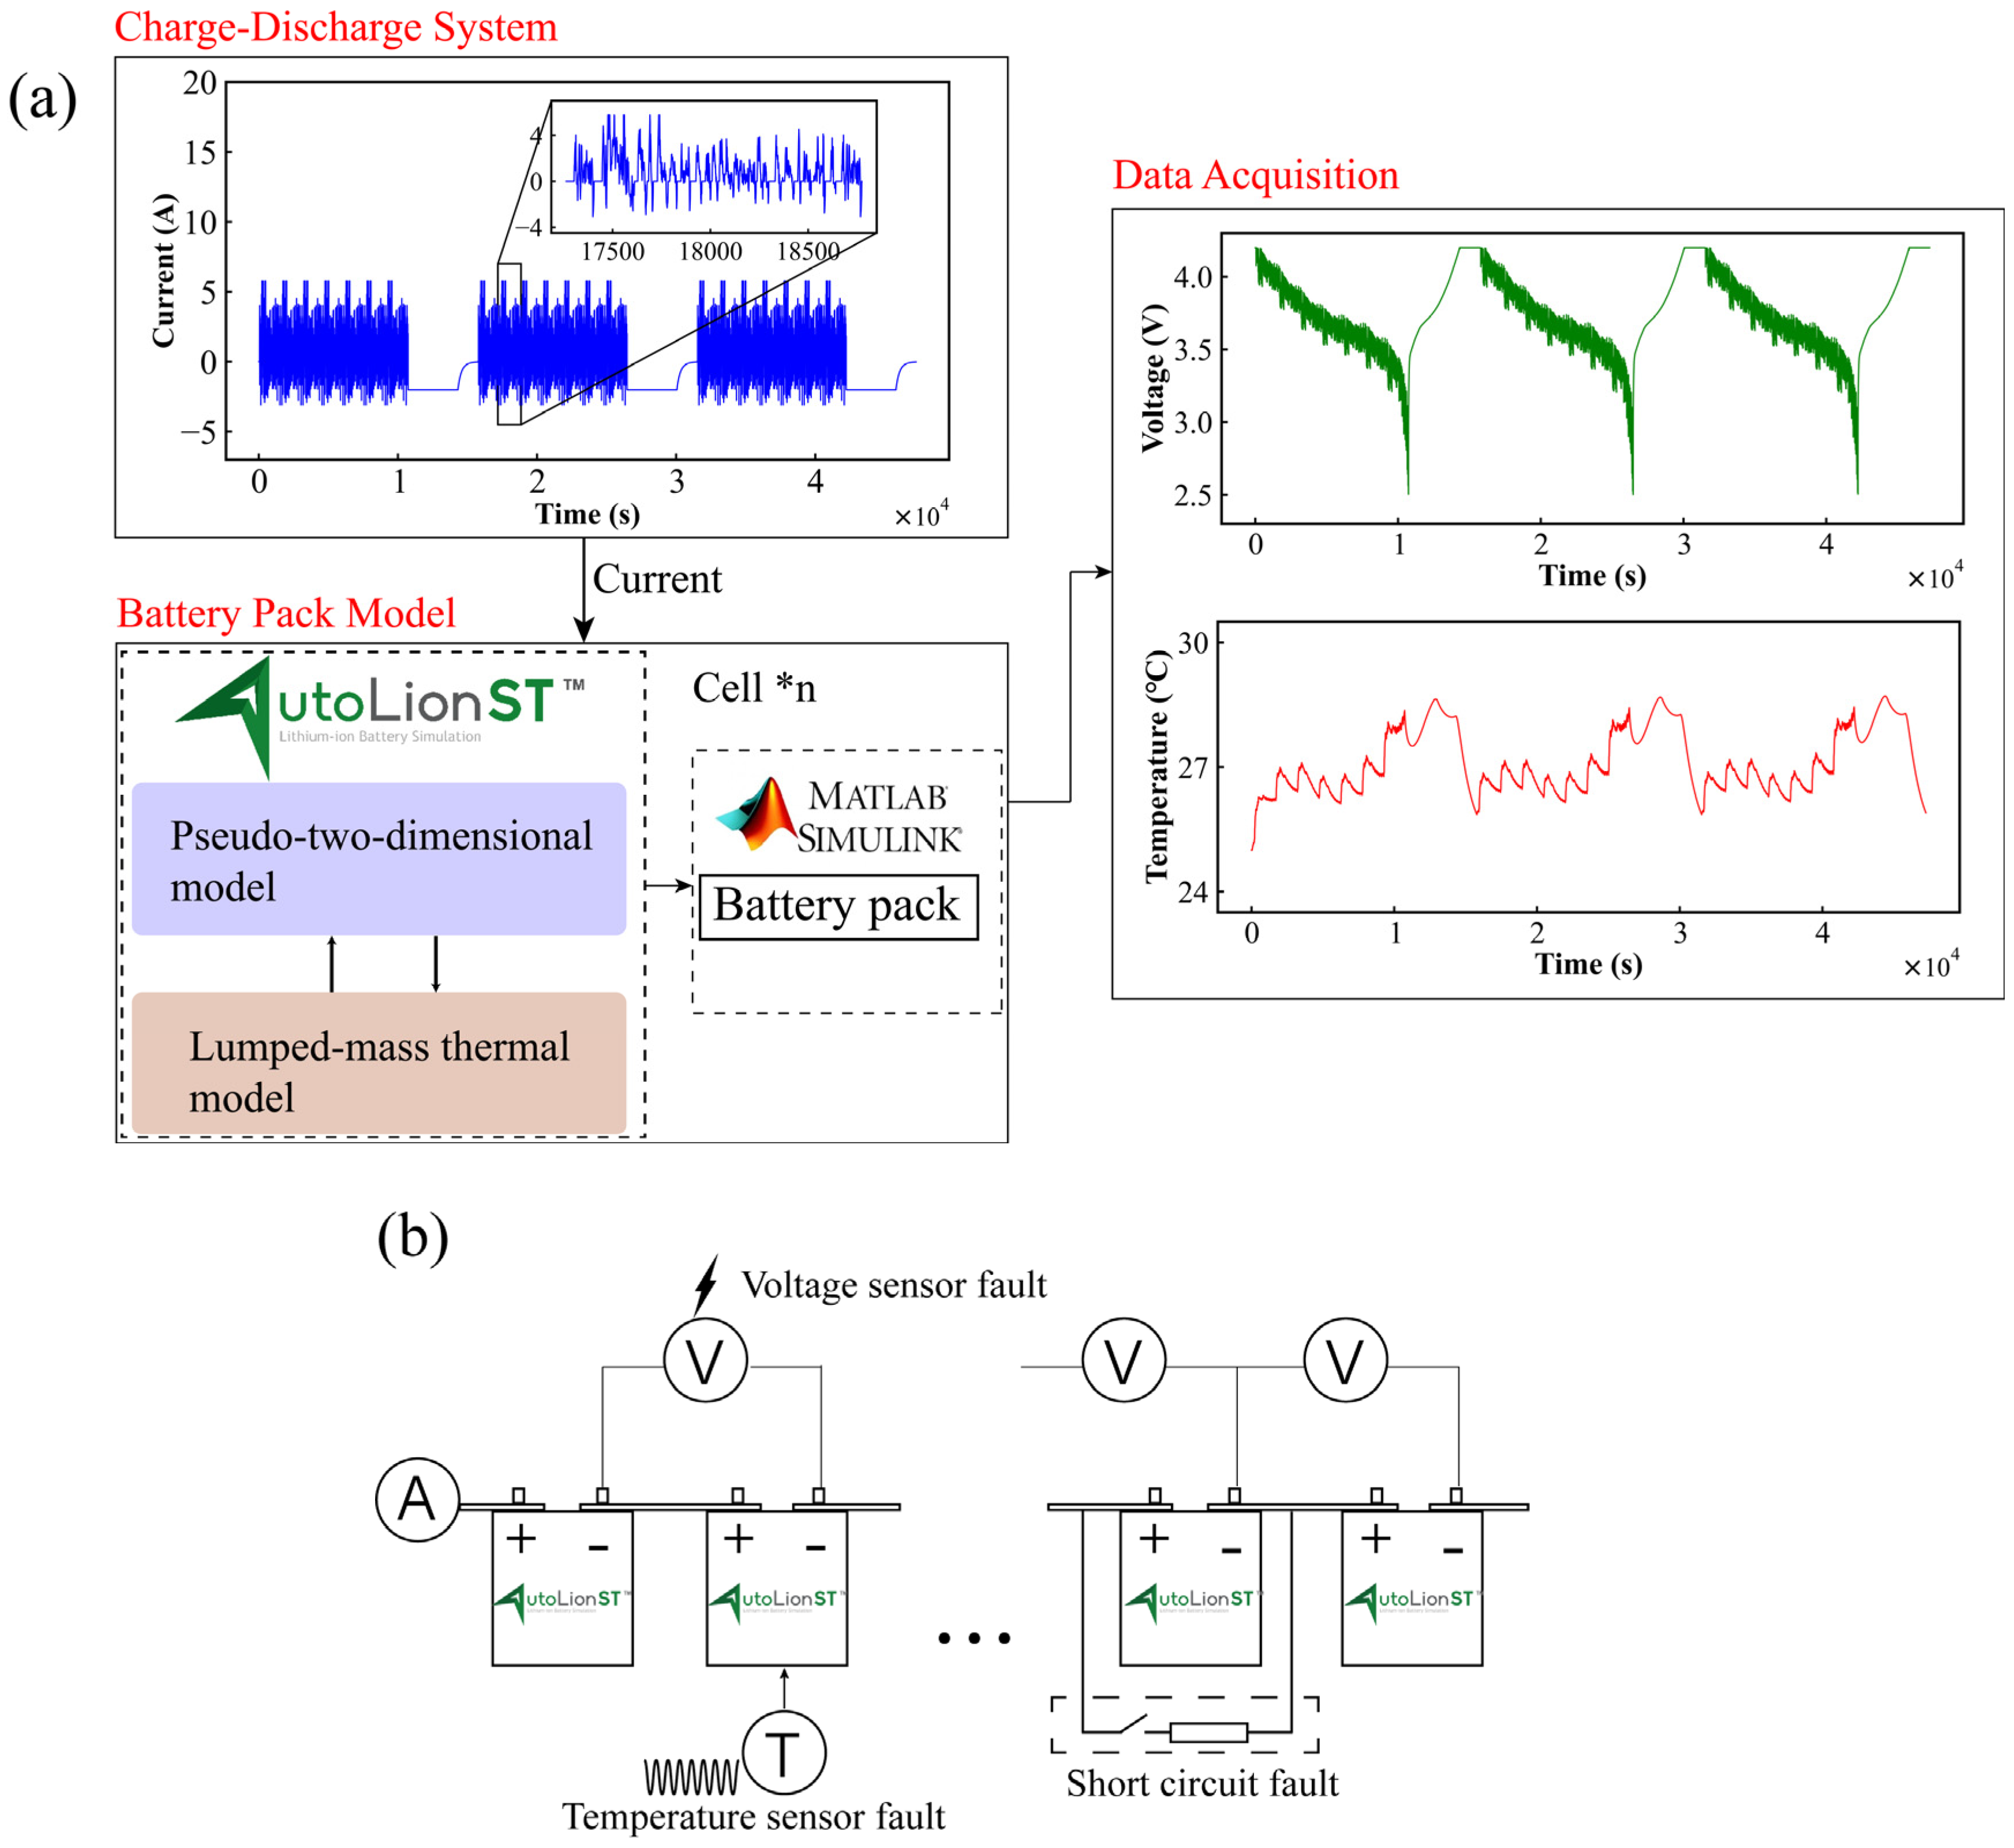
3. Results and Discussion

3.1. Data Preparation and Preprocessing

The multi-fault diagnosis of a lithium-ion battery pack was accomplished based on relative entropy and SOC estimation, including battery short-circuit fault, voltage sensor fault and temperature sensor fault. For the sensor fault tests, because sensors can experience several faults, such as deviation from the measured values to the real value, drifting, the loss of accuracy and the freezing of measured values due to inherent aging and external shocks or vibrations, an equivalent sensor fault experiment was carried out by injecting a strong noise into raw measurement data [11,16,27]. For the short-circuit fault test, destructive short-circuit experiments, such as nail penetration and squeezing, are too difficult to control, so that they are not suitable for studying the early stage of battery short-circuit. The method of cells connecting in parallel with a resistance has become an alternative experiment for battery fault tests [8,11,12,28,29]. For simulating the short-circuit fault, a resistor with a value of 5 Ω/10 Ω was selected to be connected in parallel with cell 5, representing different levels of short-circuit conditions. A dynamic thermally coupled battery model was constructed using the simulation software AutoLion-ST V2020 with a given initial value and current excitation, as shown in Figure 3 Three complete charge and discharge cycles of a battery under Federal Urban Driving Schedule (FUDS) are illustrated in Figure 3a, and the schematic diagram of different fault tests can be shown in Figure 3b. Because an electrochemical model can accurately describe battery electrochemical reactions and performance, an electrochemical–thermal coupling model in the AutoLion-ST software was developed by coupling a pseudo-two-dimensional model and the lumped mass thermal model. The parameters of the coupling model in this work were taken from [30,31,32,33]; the effectiveness of this model has been validated in [33]. The specification of the cylindrical cell was designed and is shown in Table 1.
Moreover, the SOC-OCV curve of the battery was conducted to estimate SOC, as depicted in Figure 4 A fully-charged battery was discharged to a cut-off voltage of 2.5 V, followed by charging to a cut-off voltage of 4.2 V, and the whole charge–discharge process was under a low current of 0.05 C. Two working conditions of FUDS and US06 driving schedules (US06) were considered; the specific operating condition components can be referred to in [34]. To reflect the variation of cells, different initial SOCs of the cells were selected, and the maximum inconsistency was 3%. In addition, the testing ambient temperature and the initial temperature of the battery were under 25°C. The injected Gaussian white noise with standard deviation was 3 mV for the voltage sensor and 0.03°C for the temperature sensor to acquire original data. A battery pack consisting of a single module with eight cells in series was built to verify the effectiveness of the proposed fault diagnosis method. Short-circuit fault and sensor fault tests were conducted under different operating conditions, where the fault parameters were selected mainly based on the experimental values in [8,11,14,35]; and the specific fault parameters for testing are listed in Table 2.

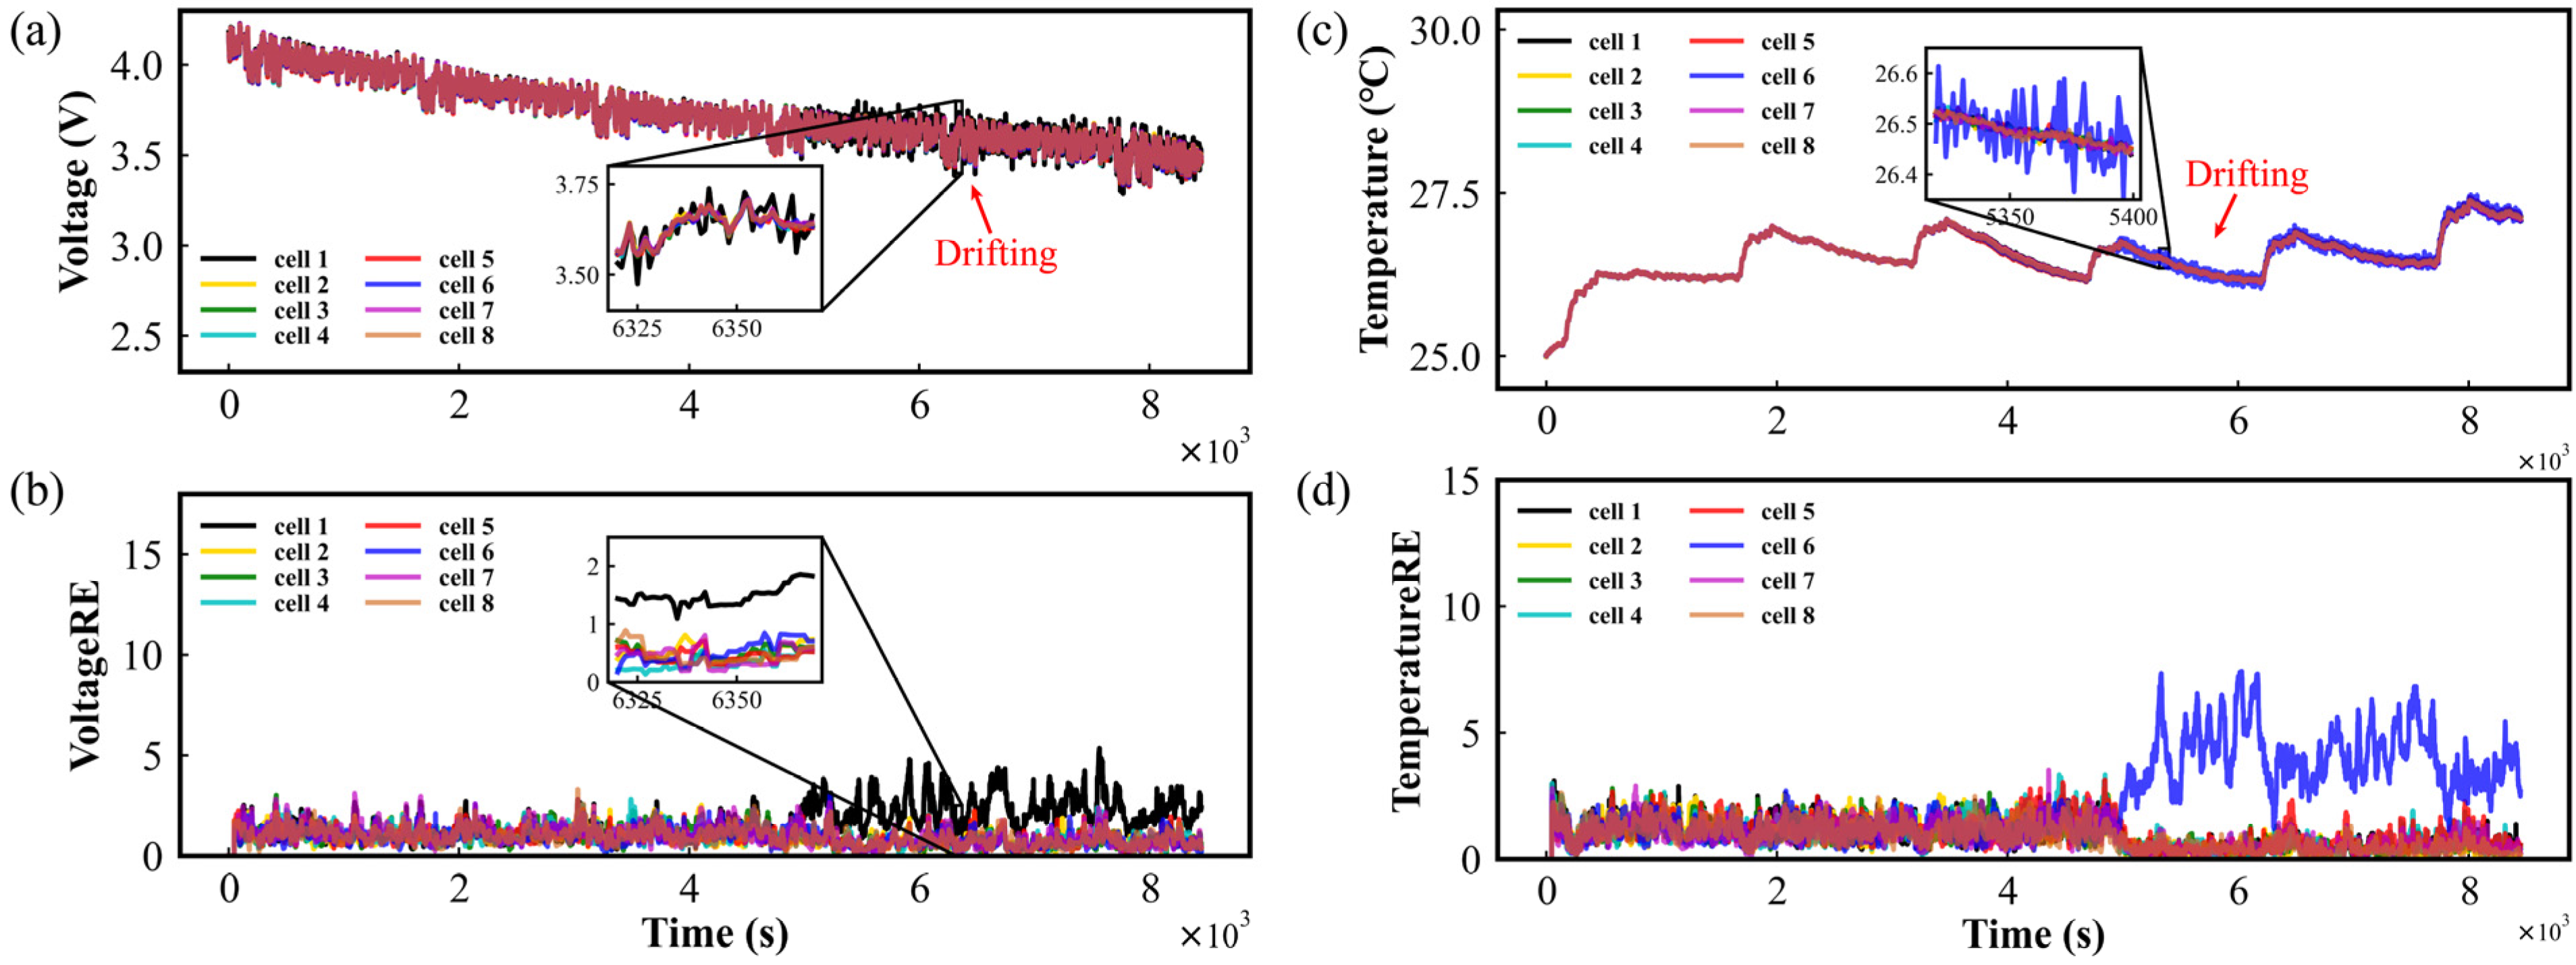
3.2. The Relative Entropy Calculation at Normal Condition

The relative entropy of voltage and temperature is used as fault information, and the CUSUM method is adopted for fault evaluation in the proposed multi-fault diagnosis method. Therefore, to obtain the statistical distribution of two hypotheses and an alarm threshold, a large number of tests were performed under both normal and fault conditions to compromise between missed alarms and false alarms. For the consideration of calculation efficiency and detection sensitivity, the sliding window was chosen as 100, and J U and J T were set to 150, which is more than two times their maximum CUSUM under normal conditions. To test the diagnosis effect of the proposed method on normal batteries, a normal experiment was conducted under FUDS conditions. The voltage/temperature of each cell and the relative entropies of the voltage/temperature of each cell to the reference cell in the battery pack are shown in Figure S1 and Figure S2, respectively. Here, the inconsistency in SOC in the battery pack was set to 3%, which is within a reasonable range to ensure the normal operation of the battery pack. In Figure S1, one can observe that the voltages of individual cells have certain differences during the discharge period, but the calculated voltage relative entropy fluctuates within a certain range. In addition, because of the inconsistency in all cells, the temperature difference reached a maximum at the end of discharge in Figure S2. Moreover, the relative entropies of the voltage and temperature of each cell do not deviate significantly; as can be seen from the zoomed-in figure, even the inconsistency and measurement noise were added to the battery pack.

3.3. The Results of Fault Diagnosis under FUDS Conditions

3.3.1. The Results of Sensor Faults Diagnosis

When only one sensor (either voltage or temperature) shows abnormal data, we attribute it to sensor malfunction. It is only when both sensors on the same battery simultaneously exhibit abnormal readings that we attribute the fault to the battery itself. Therefore, upon detecting sensor faults, we do not attempt to correct the data from these faulty sensors. Instead, we discard the data generated by these faulty sensors and issue a warning. The sensor fault test was carried out by injecting a large amount noise into the original measurement data. The results of the voltage sensor fault on cell 1 and the temperature sensor fault on cell 6 under FUDS are depicted in Figure 5a,c, respectively. Because most of the sensor faults were drifting, here noise was used to simulate the fault. The noise was injected at time of 5000 s. From Figure 5a,c, one can observe that before the sensor fault happened, the measured voltage of cell 1 and the measured temperature of cell 6 fluctuated within a small noise range, just like the other cells. With noise disturbances of 0.02 V for voltage and 0.2 °C for temperature to the measurement signal, the sensor accuracy was apparently distorted, but it is difficult to detect this using the conventional threshold methods. Furthermore, the relative entropies of the voltage and temperature of each cell to the reference cell were calculated in sensor fault conditions, as shown in Figure 5b,d. From Figure 5b, it can be seen that the voltage relative entropy of cell 1 gradually deviates from that of the other cells after 5000 s. Similarly, in Figure 5d, the temperature relative entropy of cell 6 follows the same trend as the voltage relative entropy in Figure 5b. By comparing the relative entropy of cells at normal and fault, it can be indicated that the relative entropies of normal cells are not always kept at the minimum but fluctuate in a small range. Furthermore, the CUSUM method was applied to reduce the impact on sensor fault diagnosis; the result is shown in Figure 6. One can see that when the CUSUM of relative entropy exceeded a preset threshold, the voltage sensor fault was detected at 93 s after voltage disturbance was added to cell 1 and the temperature sensor fault was detected at 65 s after temperature disturbance was added to cell 6, which indicates that the sensor fault can be detected and located in a short time using our proposed method.

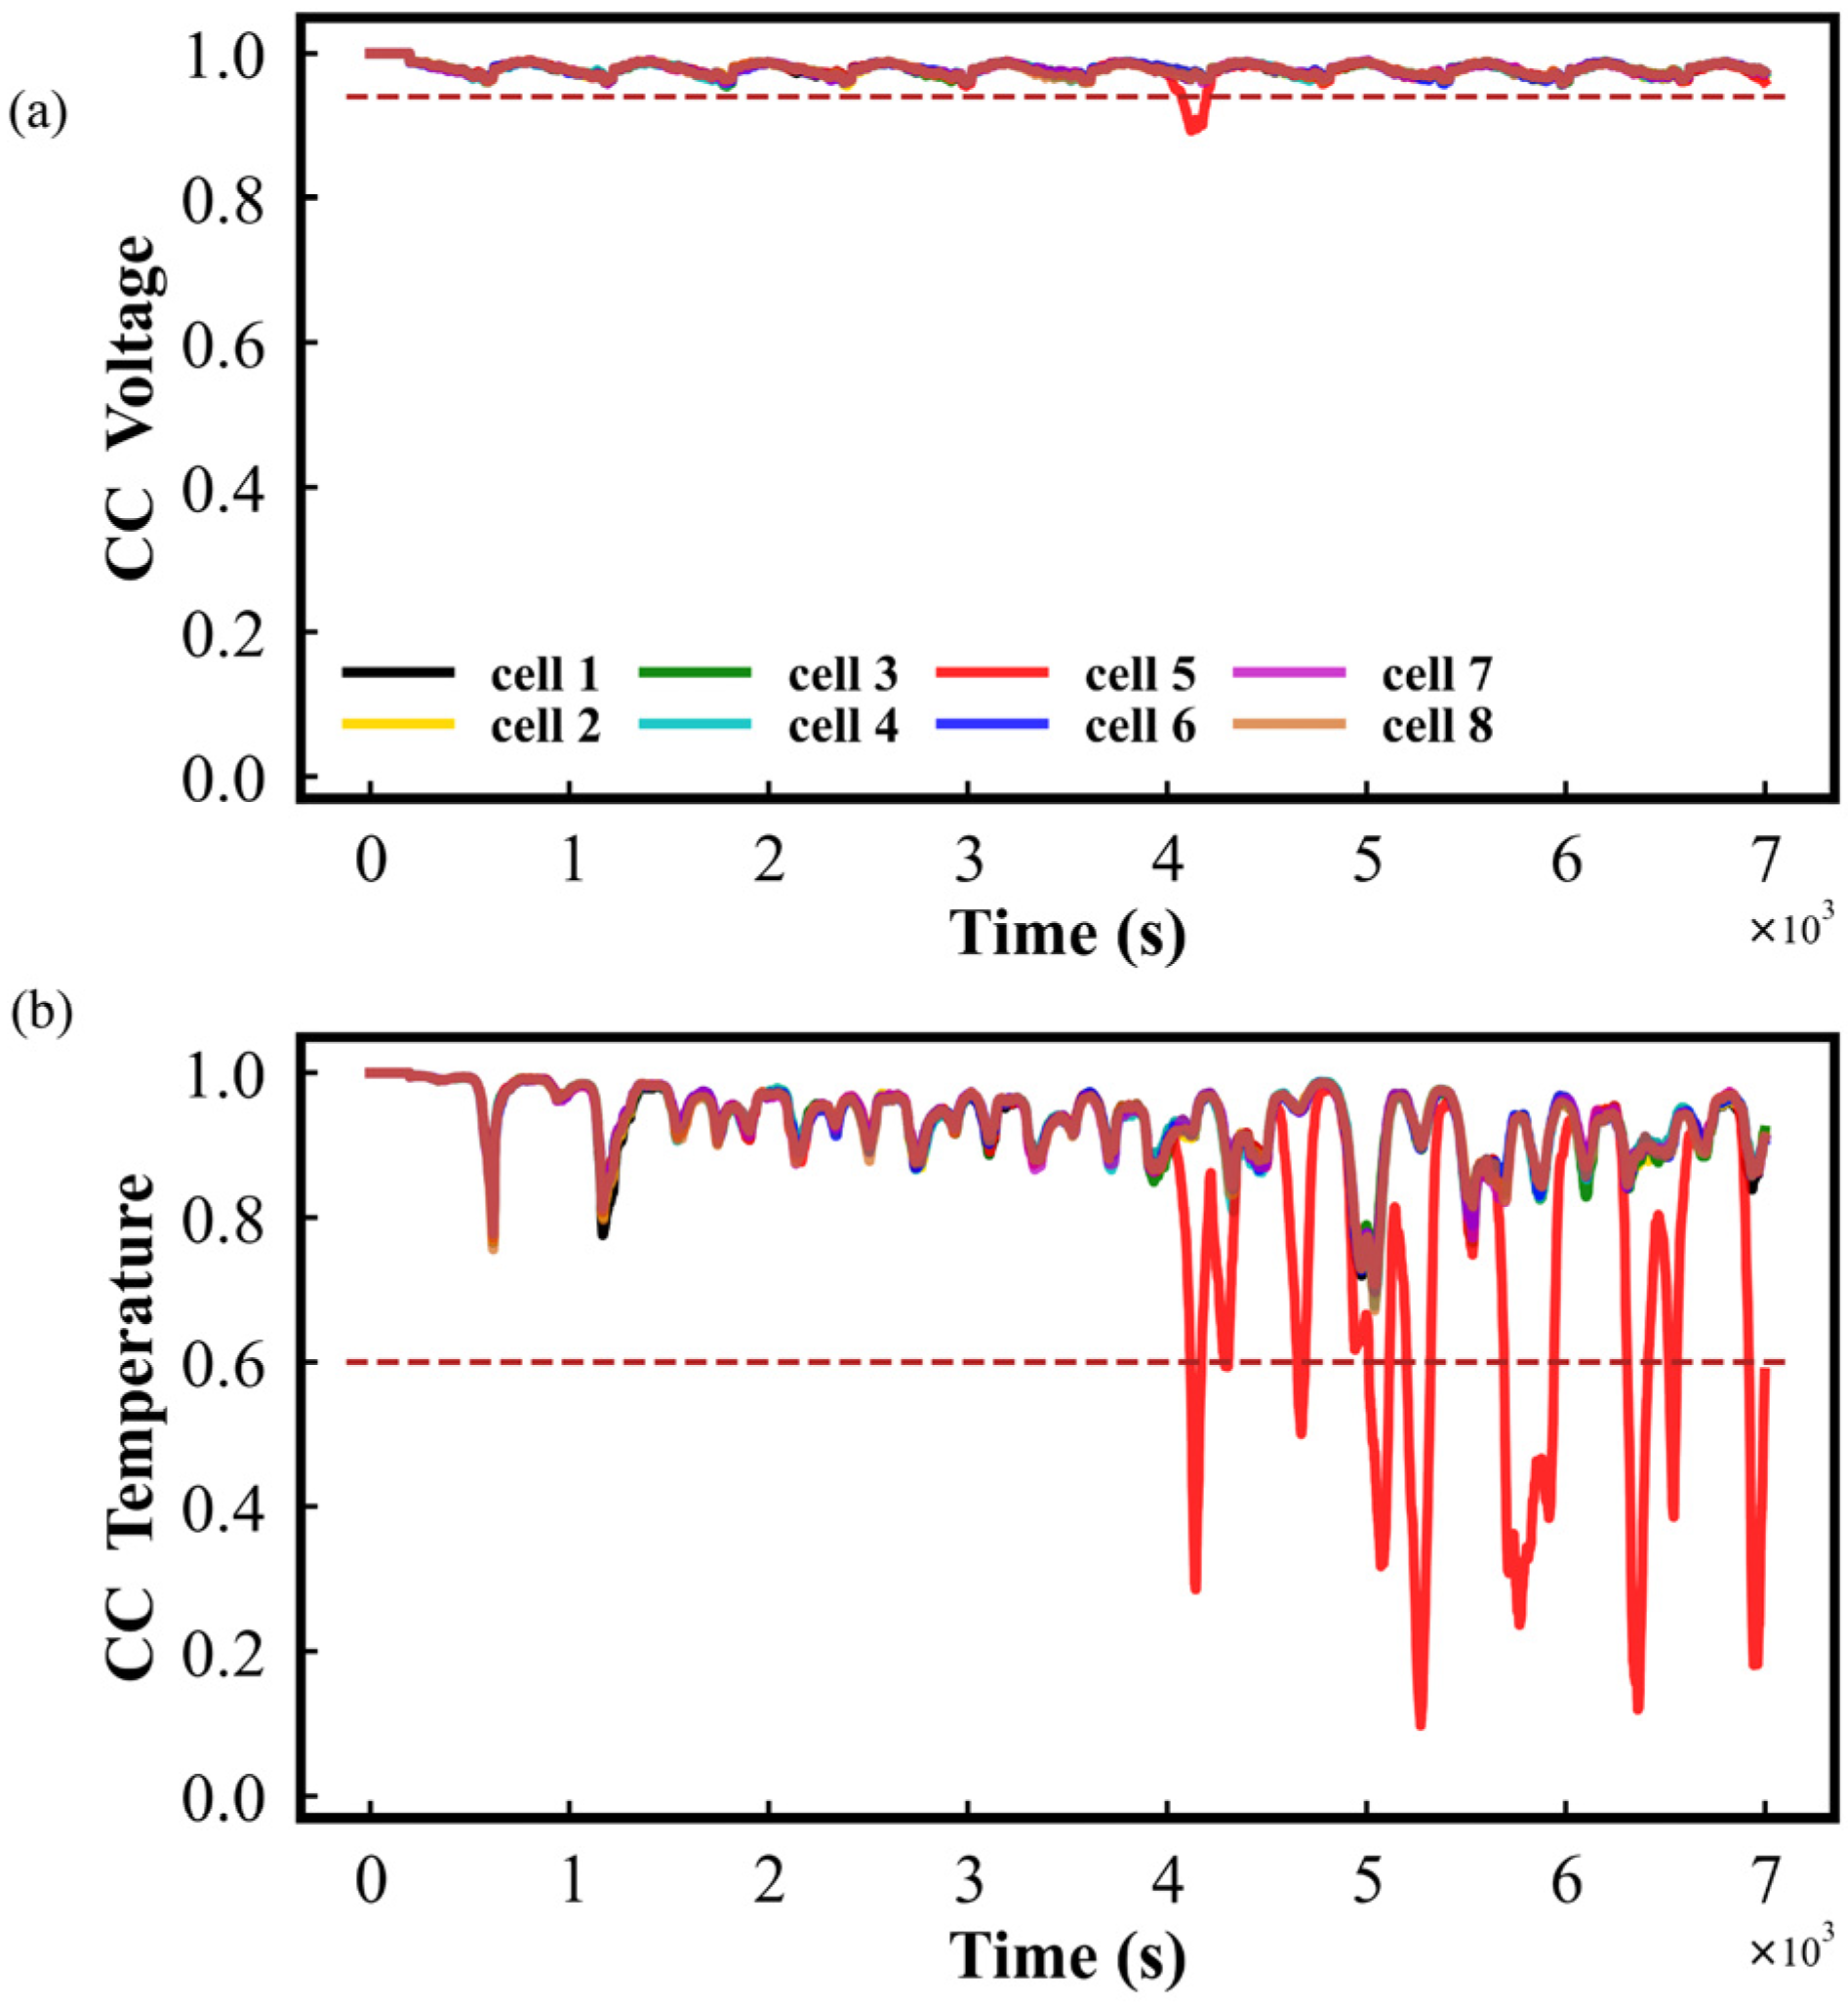
3.3.2. The Results of Short-Circuit Fault Diagnosis

A short-circuit fault test was conducted by connecting a resistor (5 Ω) in parallel with cell 5 under FUDS conditions; the results have been shown in Figure S3. It can be seen that the voltage of cell 5 is significantly lower and the temperature of cell 5 higher than those of the other cells after the short-circuit fault occurred. Because of the short-circuit fault on cell 5, the power consumption of the short-circuit battery cell was accelerated and reached the cut-off voltage quickly, which increased the gap between the short-circuit battery cell and the other cells to the maximum at the end of discharge. To avoid over-discharging in the short-circuit test, the battery pack was discharged until at 10–20% of its SOC. With a resistor (5 Ω) connecting it in parallel with cell 5, the voltage profile and temperature profile of all cells is depicted in Figure S3a and Figure S3c, respectively. To detect the short-circuit fault of the battery pack, the relative entropy of the voltage and temperature of all cells was calculated as fault information, as shown in Figure S3b,d. One can see that the relative entropies of the voltage and temperature of cell 5 deviated from the other cells after the short-circuit fault occurred. Furthermore, the CUSUM of the voltage and temperature relative entropy of all cells was calculated, as shown in Figure S4a,b, respectively. One can see that the CUSUM of the voltage and temperature relative entropy of cell 5 exceeded the predetermined thresholds at 4109 s and 4111 s, respectively, which indicates that a short-circuit fault of cell 5 was detected, but the severity of the short-circuit is not available.
To analyze the severity of the short-circuit of the battery pack, a quantitative evaluation was performed using SOC estimation. The SOC estimation of the reference cell (cell 4) was obtained by the EKF based on online identification parameters, as shown in Figure S5a. Here, the SOC-AH curve represents the SOC estimated using the coulombic counting method. After a resistor of 5 Ω connected with cell 5 in parallel at the time of 4000 s (when the short-circuit fault occurred), one can see that the SOC of cell 5 dropped rapidly and deviated from that of the reference cell due to the continuous power consumption by the short-circuit resistor. During this period, the SOC of a normal cell remains higher than that of a short-circuited cell, implying that the ΔSOC is consistently positive throughout the discharge phase. Moreover, the resistance of the short-circuit fault was estimated using RLS, as shown in Figure S5b. It can be observed that the mean absolute error of resistance estimation is 0.17 Ω and the standard deviation is 0.12 Ω, indicating an accurate estimation of short-circuit resistance with a small margin of error.
Furthermore, to compare short-circuit faults of different degrees, the voltage relative entropy and temperature relative entropy of all cells were obtained in the short-circuit fault of connecting a 10 Ω resistor with cell 5 in parallel, as shown in Figure S6a,b, respectively. It can be clearly observed that the deviation of the voltage relative entropy and temperature relative entropy of cell 5 was small because of the slight short-circuit fault. Usually, the smaller the resistance of connecting with cell 5 in parallel, the more serious the short-circuit fault. In addition, the CUSUM of the voltage relative entropy and temperature relative entropy of all cells were calculated to detect the short-circuit fault; the results are depicted in Figure S7. It can be seen that the CUSUM of the voltage relative entropy of cell 5 exceeded the predetermined thresholds at 4101 s and that the CUSUM of temperature relative entropy exceeded at 4200 s. By comparing the results with the short-circuit fault of connecting a 5 Ω resistor with cell 5 in parallel, one can notice that it takes longer to detect a short-circuit fault in connecting a 10 Ω resistor. Moreover, the SOC estimations of the short-circuit cell and the reference cell are shown in Figure S8a. Similarly, one can observe that the SOC of cell 5 drops rapidly and deviates from that of the reference cell at 4000 s (when the short-circuit fault occurred), which indicates that the more severe the short-circuit is, the faster the SOC drops. The resistance of the short-circuit fault was estimated and is shown in Figure S8b. The mean absolute error of resistance estimation is 0.42 Ω, and standard deviation is 0.33 Ω, indicating the effectiveness of the proposed quantitative evaluation method.

3.4. Method Comparison under US06 Condition

To further verify the performance of the proposed method, a variety of fault tests, including a short-circuit, a voltage sensor fault with 0.05 V noise and a temperature sensor fault with 0.5 °C noise, were performed to compare the proposed method with a correlation coefficient-based [36] method under US06 conditions. To simplify analysis, here, the short-circuit fault created by connecting a 10 Ω resistor with cell 5 in parallel was selected as an example. Firstly, the load current of the battery pack and the voltage and temperature of all cells are shown in Figure S9a–c, respectively. It can be seen that the voltage and temperature change in cell 5 significantly deviated from those of the other cells because of the short-circuit fault. Secondly, the fault diagnosis result based on the correlation coefficient method is displayed in Figure 7 In the correlation coefficient method, the sliding window was set to 200 for the consideration of diagnosis accuracy and computational efficiency. In Figure 7, the dashed lines parallel to the time axis are the appropriate fault thresholds derived from the tests, with minimum voltage and temperature thresholds of 0.94 and 0.6, respectively. The correlation coefficients of the voltage and temperature of each cell to the other cells were calculated in real time by a sliding window, and the maximum correlation coefficient of voltage/temperature was taken as the final diagnostic signal. From Figure 7a, it can be seen that the correlation coefficients of voltage can apparently detect the fault even with the inconsistency and noise interference. Meanwhile, the correlation coefficient of temperature fluctuates considerably in the presence of noise and inconsistency in Figure 7b. The voltage exceeded the threshold at 74 s after the fault occurred, while the temperature exceeded the threshold at 298 s. According to the abnormal correlation coefficient of voltage and temperature, it can be inferred that the short-circuit fault occurred at 298 s because a short-circuit fault influences changes in voltage and temperature. As a contrast, a short-circuit fault diagnosis based on the proposed method under US06 conditions is displayed in Figure S10. According to the CUSUM result of voltage relative entropy and temperature relative entropy in Figure S10c,d, a short-circuit fault can be diagnosed at 121 s after the fault has occurred; the time it takes to detect a short-circuit fault using our method is faster than that of the correlation coefficient method (298 s). Finally, the quantitative analysis of the short-circuit fault using SOC estimation is shown in Figure S11. The resistance of the short-circuit fault is estimated with 0.37 Ω standard deviation and 0.51 Ω mean absolute error.
In addition, a fault diagnosis test based on the Shannon entropy method was conducted, taking the voltage of a 5 Ω short-circuit resistor as an example. As shown in Figure S12a, it is difficult to directly diagnose the fault based only on Shannon entropy. Meanwhile, the correlation coefficient of Shannon entropy (Shannon RE-CC) [28] was calculated, as shown in Figure S12b. It can be seen that the Shannon RE-CC method is very sensitive to noise interference and inconsistency effects, leading to misdiagnosis or missed diagnosis by the set threshold. Therefore, the Shannon entropy-based method was not selected for comparison.
Moreover, different short-circuit fault degrees were tested; the fault diagnosis results are listed in Table 3 and Table 4. By comparing the short-circuit fault diagnosis of our proposed method with the correlation coefficient method in different operating conditions, it can be found the proposed method performs better in short-circuit fault diagnosis for battery packs. To be specific, the proposed method had a significant advantage of diagnosis time; the smaller the short-circuit fault degree, the shorter the diagnosis time of the proposed method than that of the coefficient correlation-based diagnosis method.

4. Conclusions

In conclusion, a fault diagnosis method based on relative entropy and SOC estimation is proposed to ensure the normal operation of a battery system, including the diagnosis of voltage sensor faults, temperature sensor faults and short-circuit faults. First, by selecting a cell with the median voltage in the battery pack to the reference cell, the relative entropies of the voltage and temperature of each cell to that of the reference one are calculated in real time according to the sliding window. Second, the relative entropy of voltage and temperature serve as fault information, and the CUSUM method is adopted for fault evaluation, indicating that the fault information of the battery is amplified by the relative entropy and the risk of false/missed alarms is reduced by the CUSUM method. In addition, VFFRLS is used for the parameter identification of the reference cell. Furthermore, by calculating the ΔSOC between a normal cell and a fault cell during both the charge and discharge phases, it becomes possible to distinguish an internal short-circuit cell from a low-capacity cell. This method can distinguish between micro-short circuit batteries and low-capacity fault batteries (or aged batteries), but it does not determine whether battery aging is due to irreversible side reactions at the positive electrode (such as oxygen release). In fact, our method cannot specifically diagnose the occurrence of irreversible side reactions (such as oxygen release) at the positive electrode of lithium batteries. Thereafter, the SOC of the short-circuit cell is estimated by an EKF, and the short-circuit resistance is estimated according to the proposed method. The effectiveness of the proposed method has been validated and compared with the correlation coefficient method under different fault types and fault degrees in FUDS and US06 with the interference of noise and inconsistency, and the results show that the proposed method performs well in both different conditions and different fault types. Meanwhile, the robustness of the proposed method was verified under the interference of noise and inconsistency in two working conditions of FUDS and US06. It should be noted that not only is the qualitative diagnosis of a short-circuit fault performed in the proposed method, but the resistance of a short-circuit resistor is estimated for an analysis of the degree of short-circuit faults. Importantly, computational effort and hardware redundancy do not increase with the proposed method, including relative entropy calculation, parameter identification and SOC estimation. In the future, the lower diagnosis time, estimation accuracy and verification of the proposed method in real-world vehicles will be the focus of our research.

Supplementary Materials

The following supporting information can be downloaded at: https://www.mdpi.com/article/10.3390/batteries10070217/s1, Figure S1. Voltage and voltage relative entropies of all cells under FUDS conditions: (a) Voltage curve of each cell; (b) Voltage relative entropy curve of each cell to that of reference cell. Figure S2. Temperature and temperature relative entropies of all cells in the battery pack under FUDS conditions: (a) Temperature curve of each cell; (b) Temperature relative entropy curve of each cell to that of reference cell. Figure S3. Short-circuit fault by connecting a resistor (5 Ω) in parallel with cell 5 under FUDS condition: (a) Voltage curve of each cell; (b) Voltage relative entropy curve of each cell to that of reference cell; (c) Temperature curve of each cell; (d) Temperature relative entropy curve of each cell to that of reference cell. Figure S4. Short-circuit fault diagnosis by connecting a resistor (5 Ω) in parallel with cell 5 under FUDS condition: (a) CUSUM result of voltage relative entropy; (b) CUSUM result of temperature relative entropy. Figure S5. Results of quantitative analysis of short-circuit fault by connecting a 5 Ω resistor with cell 5 in parallel: (a) Comparison of SOC estimation of short-circuit cell and reference cell by using the proposed method with that of coulombic counting method; (b) Result of short-circuit resistance estimation. Figure S6. Relative entropy of all cells in short-circuit fault by connecting a 10 Ω resistor with cell 5 in parallel: (a) Voltage relative entropy curve of each cell to that of reference cell; (b) Temperature relative entropy curve of each cell to that of reference cell. Figure S7. Short-circuit fault diagnosis by connecting a 10 Ω resistor with cell 5 in parallel under FUDS condition: (a) CUSUM result of voltage relative entropy; (b) CUSUM result of temperature relative entropy. Figure S8. Results of quantitative analysis of short-circuit fault by connecting a 10 Ω resistor with cell 5 in parallel: (a) Comparison of SOC estimation of short-circuit cell and reference cell by using the proposed method with that of coulombic counting method; (b) Result of short-circuit resistance estimation. Figure S9. The test of short-circuit fault with a 10 Ω resistor connecting with cell 5 in parallel: (a) Load current curve of battery pack; (b) Voltage curves of all cells; (c) Temperature curves of all cells. Figure S10. Short-circuit fault diagnosis based on the proposed method under US06 operating condition: (a) voltage relative entropy curves; (b) CUSUM result of voltage relative entropy; (c) Temperature relative entropy curves; (d) CUSUM result of temperature relative entropy. Figure S11. Results of quantitative analysis of short-circuit fault under US06: (a) Comparison of SOC estimation of short-circuit cell and reference cell by using the proposed method with that of coulombic counting method; (b) Result of short-circuit resistance estimation. Figure S12. The results of Shannon entropy and correlation coefficient of battery pack voltage under short-circuit conditions in the US06 driving cycle are presented: (a) Battery pack voltage Shannon entropy; (b) The median correlation coefficient of Shannon entropy.

Author Contributions

Conceptualization, T.-E.F.; Methodology, F.C.; Software, H.-R.L.; Validation, X.T.; Investigation, F.F. All authors have read and agreed to the published version of the manuscript.

Funding

This work is supported by the Natural Science Foundation of Chongqing (Grant Nos. cstc2021jcyj-msxmX0503, CSTB2023NSCQ-MSX0359), the Scientific and Technological Research Program of Chongqing Municipal Education Commission (Grant No. KJQN202300607), Xiaomi Foundation/Xiaomi Young Talents Program.

Data Availability Statement

The original contributions presented in the study are included in the article, further inquiries can be directed to the corresponding authors.

Conflicts of Interest

The authors declare no conflict of interest.

References

  1. Xiong, R.; Sun, W.; Yu, Q.; Sun, F. Research progress, challenges and prospects of fault diagnosis on battery system of electric vehicles. Appl. Energy 2020, 279, 115855. [Google Scholar] [CrossRef]
  2. Qiao, D.; Wei, X.; Fan, W.; Jiang, B.; Lai, X.; Zheng, Y.; Tang, X.; Dai, H. Toward safe carbon-neutral transportation: Battery internal short circuit diagnosis based on cloud data for electric vehicles. Appl. Energy 2022, 317, 119168. [Google Scholar] [CrossRef]
  3. Yang, T.; Zheng, Y.; Liu, Y.; Luo, D.; Yu, A.; Chen, Z. Reviving low-temperature performance of lithium batteries by emerging electrolyte systems. Renewables 2023, 1, 2–20. [Google Scholar] [CrossRef]
  4. Pan, Y.; Feng, X.; Zhang, M.; Han, X.; Lu, L.; Ouyang, M. Internal short circuit detection for lithium-ion battery pack with parallel-series hybrid connections. J. Clean. Prod. 2020, 255, 120277. [Google Scholar] [CrossRef]
  5. Zhang, J.N.; Zhang, L.; Sun, F.C.; Wang, Z.P. An Overview on Thermal Safety Issues of Lithium-ion Batteries for Electric Vehicle Application. IEEE Access 2018, 6, 23848–23863. [Google Scholar] [CrossRef]
  6. Gan, N.F.; Sun, Z.Y.; Zhang, Z.S.; Xu, S.Q.; Liu, P.; Qin, Z.A. Data-Driven Fault Diagnosis of Lithium-Ion Battery Overdischarge in Electric Vehicles. IEEE Trans. Power Electron. 2022, 37, 4575–4588. [Google Scholar] [CrossRef]
  7. Seo, M.; Park, M.; Song, Y.; Kim, S.W. Online Detection of Soft Internal Short Circuit in Lithium-Ion Batteries at Various Standard Charging Ranges. IEEE Access 2020, 8, 70947–70959. [Google Scholar] [CrossRef]
  8. Ouyang, M.G.; Zhang, M.X.; Feng, X.N.; Lu, L.G.; Li, J.Q.; He, X.M.; Zheng, Y.J. Internal short circuit detection for battery pack using equivalent parameter and consistency method. J. Power Sources 2015, 294, 272–283. [Google Scholar] [CrossRef]
  9. Zhu, X.Q.; Wang, Z.P.; Wang, Y.T.; Wang, H.; Wang, C.; Tong, L.; Yi, M. Overcharge investigation of large format lithium-ion pouch cells with Li(Ni0.6Co0.2Mn0.2)O2 cathode for electric vehicles: Thermal runaway features and safety management method. Energy 2019, 169, 868–880. [Google Scholar] [CrossRef]
  10. Xiong, R.; Yu, Q.Q.; Shen, W.X.; Lin, C.; Sun, F.C. A Sensor Fault Diagnosis Method for a Lithium-Ion Battery Pack in Electric Vehicles. IEEE Trans. Power Electron. 2019, 34, 9709–9718. [Google Scholar] [CrossRef]
  11. Zhang, K.; Hu, X.S.; Liu, Y.G.; Lin, X.K.; Liu, W.X. Multi-fault Detection and Isolation for Lithium-Ion Battery Systems. IEEE Trans. Power Electron. 2022, 37, 971–989. [Google Scholar] [CrossRef]
  12. Gao, W.K.; Zheng, Y.J.; Ouyang, M.G.; Li, J.Q.; Lai, X.; Hu, X.S. Micro-Short-Circuit Diagnosis for Series-Connected Lithium-Ion Battery Packs Using Mean-Difference Model. IEEE Trans. Ind. Electron. 2019, 66, 2132–2142. [Google Scholar] [CrossRef]
  13. Hu, J.; He, H.W.; Wei, Z.B.; Li, Y. Disturbance-Immune and Aging-Robust Internal Short Circuit Diagnostic for Lithium-Ion Battery. IEEE Trans. Ind. Electron. 2022, 69, 1988–1999. [Google Scholar] [CrossRef]
  14. Liu, Z.T.; He, H.W. Sensor fault detection and isolation for a lithium-ion battery pack in electric vehicles using adaptive extended Kalman filter. Appl. Energy 2017, 185, 2033–2044. [Google Scholar] [CrossRef]
  15. Naha, A.; Khandelwal, A.; Agarwal, S.; Tagade, P.; Hariharan, K.S.; Kaushik, A.; Yadu, A.; Kolake, S.M.; Han, S.; Oh, B. Internal short circuit detection in Li-ion batteries using supervised machine learning. Sci. Rep. 2020, 10, 1301. [Google Scholar] [CrossRef] [PubMed]
  16. Kang, Y.Z.; Duan, B.; Zhou, Z.K.; Shang, Y.L.; Zhang, C.H. A multi-fault diagnostic method based on an interleaved voltage measurement topology for series connected battery packs. J. Power Sources 2019, 417, 132–144. [Google Scholar] [CrossRef]
  17. Zhao, Y.; Liu, P.; Wang, Z.P.; Zhang, L.; Hong, J.C. Fault and defect diagnosis of battery for electric vehicles based on big data analysis methods. Appl. Energy 2017, 207, 354–362. [Google Scholar] [CrossRef]
  18. Shang, Y.L.; Lu, G.P.; Kang, Y.Z.; Zhou, Z.K.; Duan, B.; Zhang, C.H. A multi-fault diagnosis method based on modified Sample Entropy for lithium-ion battery strings. J. Power Sources 2020, 446, 227275. [Google Scholar] [CrossRef]
  19. Wang, Z.P.; Hong, J.C.; Liu, P. Voltage fault diagnosis and prognosis of battery systems based on entropy and Z-score for electric vehicles. Appl. Energy 2017, 196, 289–302. [Google Scholar] [CrossRef]
  20. Chen, Z.H.; Xu, K.; Wei, J.W.; Dong, G.Z. Voltage fault detection for lithium-ion battery pack using local outlier factor. Measurement 2019, 146, 544–556. [Google Scholar] [CrossRef]
  21. Li, X.Y.; Wang, Z.P. A novel fault diagnosis method for lithium-Ion battery packs of electric vehicles. Measurement 2018, 116, 402–411. [Google Scholar] [CrossRef]
  22. Ma, G.; Xu, S.; Cheng, C. Fault detection of lithium-ion battery packs with a graph-based method. J. Energy Storage 2021, 43, 103209. [Google Scholar] [CrossRef]
  23. Sun, Z.; Wang, Z.; Liu, P.; Zhang, Z.; Wang, S.; Dorrell, D.G. Relative Entropy based Lithium-ion Battery Pack Short Circuit Detection for Electric Vehicle. In Proceedings of the 2020 IEEE Energy Conversion Congress and Exposition (ECCE), Detroit, MI, USA, 11–15 October 2020; pp. 5061–5067. [Google Scholar] [CrossRef]
  24. Yao, L.; Wang, Z.P.; Ma, J. Fault detection of the connection of lithium-ion power batteries based on entropy for electric vehicles. J. Power Sources 2015, 293, 548–561. [Google Scholar] [CrossRef]
  25. Blanke, M.; Kinnaert, M.; Lunze, J.; Staroswiecki, M. Diagnosis and Fault-Tolerant Control, 3rd ed.; Springer: Berlin, Germany, 2016. [Google Scholar]
  26. Zheng, Y.; Shen, A.; Han, X.; Ouyang, M. Quantitative short circuit identification for single lithium-ion cell applications based on charge and discharge capacity estimation. J. Power Sources 2022, 517, 230716. [Google Scholar] [CrossRef]
  27. Kang, Y.Z.; Duan, B.; Zhou, Z.K.; Shang, Y.L.; Zhang, C.H. Online multi-fault detection and diagnosis for battery packs in electric vehicles. Appl. Energy 2020, 259, 114170. [Google Scholar] [CrossRef]
  28. Qiu, Y.S.; Cao, W.J.; Peng, P.; Jiang, F.M. A novel entropy-based fault diagnosis and inconsistency evaluation approach for lithium-ion battery energy storage systems. J. Energy Storage 2021, 41, 102852. [Google Scholar] [CrossRef]
  29. Xu, J.; Wang, H.T.; Shi, H.; Mei, X.S. Multi-scale short circuit resistance estimation method for series connected battery strings. Energy 2020, 202, 117647. [Google Scholar] [CrossRef]
  30. Gu, W.B.; Wang, C.Y. Thermal and electrochemical coupled modeling of a lithium-ion cell in lithium batteries. ECS Proc. 2000, 99, 748–762. [Google Scholar]
  31. Srinivasan, V.; Wang, C.Y. Analysis of electrochemical and thermal behavior of Li-ion cells. J. Electrochem. Soc. 2003, 150, A98–A106. [Google Scholar] [CrossRef]
  32. Smith, K.; Wang, C.Y. Power and thermal characterization of a lithium-ion battery pack for hybrid-electric vehicles. J. Power Sources 2006, 160, 662–673. [Google Scholar] [CrossRef]
  33. Fang, W.F.; Kwon, O.J.; Wang, C.Y. Electrochemical-thermal modeling of automotive Li-ion batteries and experimental validation using a three-electrode cell. Int. J. Energy Res. 2010, 34, 107–115. [Google Scholar] [CrossRef]
  34. USABC. Electric Vehicle Battery Test Procedures Manual. Revision 2, United States; U.S. Department of Energy Office of Scientific and Technical Information: Oak Ridge, TN, USA, 1996. [Google Scholar] [CrossRef]
  35. Feng, X.N.; Pan, Y.; He, X.M.; Wang, L.; Ouyang, M.G. Detecting the internal short circuit in large-format lithium-ion battery using model-based fault-diagnosis algorithm. J. Energy Storage 2018, 18, 26–39. [Google Scholar] [CrossRef]
  36. Xia, B.; Shang, Y.; Nguyen, T.; Mi, C. A correlation based fault detection method for short circuits in battery packs. J. Power Sources 2017, 337, 1–10. [Google Scholar] [CrossRef]
Figure 1. The schematic process of the multi–fault diagnosis method.
Batteries 10 00217 g001
Figure 2. Structure of the equivalent circuit model: (a) first-order model; (b) first-order model with ISC.
Batteries 10 00217 g002
Figure 3. Schematic diagram of the virtual battery pack experiment: (a) Schematic diagram of the battery pack charging and discharging test; (b) schematic diagram of the different fault tests.
Batteries 10 00217 g003
Figure 4. SOC-OCV curve under charging and discharging.
Batteries 10 00217 g004
Figure 5. Results of sensor faults under FUDS conditions: (a) Voltage curve of each cell; (b) Voltage relative entropy curve of each cell to that of the reference cell; (c) Temperature curve of each cell; (d) Temperature relative entropy curve of each cell to that of the reference cell.
Batteries 10 00217 g005
Figure 6. Results of sensor fault diagnosis under FUDS conditions: (a) CUSUM of voltage relative entropy; (b) CUSUM of temperature relative entropy.
Batteries 10 00217 g006
Figure 7. Short-circuit fault diagnosis results based on the correlation coefficient method: (a) Maximum correlation coefficient of the voltage of each cell to that of other cells; (b) Maximum correlation coefficient of the temperature of each cell to that of the other cells.
Batteries 10 00217 g007
Table 1. Design parameters of cylindrical cell.
Parameters (Units)Value
Positive electrode materialNCM111
Negative electrode materialGRAPHITE
Diameter × Height (mm)18.6 × 65.2
Cell weight (g)43.39
Nominal capacity (Ah)2.15@1 C
Nominal voltage (V)3.65
Discharge cutoff voltage (V)2.5
Charge cutoff voltage (V)4.2
Table 2. Specific setting parameters for battery fault tests.
Fault TypeCell No.Fault DescriptionFault LevelTrigger Time
Short-circuit5Resistance (Ω)5/104000 s
Voltage Sensor1Drift (V)0.02/0.055000 s
Temperature Sensor6Drift (°C)0.2/0.55000 s
Table 3. Comparison of the results of the methods proposed under FUDS and US06 with the method based on correlation coefficients [36].
MethodsFUDSUS06
Proposed methodFault typeDetection time (s)Fault typeDetection time (s)
ISC (5 Ω)111ISC (5 Ω)77
ISC (10 Ω)200ISC (10 Ω)121
Correlation coefficient methodISC (5 Ω)281ISC (5 Ω)89
ISC (10 Ω)765ISC (10 Ω)298
Table 4. Resistance estimation for different short-circuit degree under different operating conditions..
ConditionsShort-Circuit Degree (Ω)Standard Deviation Error (Ω)Mean Absolute Error (Ω)
FUDS50.120.17
100.330.42
US0650.130.21
100.370.51
Disclaimer/Publisher’s Note: The statements, opinions and data contained in all publications are solely those of the individual author(s) and contributor(s) and not of MDPI and/or the editor(s). MDPI and/or the editor(s) disclaim responsibility for any injury to people or property resulting from any ideas, methods, instructions or products referred to in the content.

