Abstract
This study presents the electrical modeling and characteristic analyses of energy storage systems (ESSs) based on the internal impedance characteristics of batteries to improve ESS stability. Frequencies ranging from 1 kHz to 0.1 Hz were injected into lithium-ion batteries, and the variation of the internal impedance of the batteries was obtained based on the reflected wave to determine the ESS state of charge (SoC) and temperature. The changes in the basic electrochemical impedance spectroscopy characteristics of the ESSs were observed. Specifically, the voltage, temperature, and SoC of an ESS that could be employed as a renewable ESS were analyzed. The impedance characteristics of the ESS were investigated via experimentation and simulation. The ESS comprised an electrically equivalent circuit of a series inductor (), series resistor (), parallel resistor (), and parallel capacitor (), as well as a MATLAB program based on its transfer function to generate energy. Furthermore, a method was developed for analyzing the frequency response of ESSs. The feasibility of the proposed electrical modeling was examined for a 58.4 V, 75 Ah, 4.4 kWh ESS.
1. Introduction
Global efforts to reduce global warming and carbon (CO2) emissions are currently ongoing, and the demand for carbon neutrality, a state in which the amounts of carbon emitted and absorbed are equal, is increasing. Furthermore, the need for energy storage systems (ESSs) to replace existing fossil fuels and thereby reduce carbon emissions is increasing. Thus, renewable energy sources, including solar power, wind power, hydrogen, bio energy sources, NCM (Li[Ni,Co,Mn]O2), NCA (Li[Ni,Co,Al]O2), LFP (LiFePO4), and LMO (LiMn2O4), are being actively researched [1,2]. ESSs constitute electrolyte-based lithium ions and have recently become popular, but due to their explosive nature, a constant risk of battery fire and explosion is present. Multifaceted research is being conducted on battery safety for ESSs [3,4].
To reduce global carbon emissions, the rapid status diagnosis of ESSs is essential, which can be quickly and accurately performed through electrochemical impedance spectroscopy (EIS). Based on the results, ESSs could be stably managed [3,4]. This study comprehensively analyzes the relevance of EIS technology for ESSs of several kWh or more, improving the possibility and reliability of the online status diagnosis of ESSs. This study is expected to actively contribute to reducing carbon emissions.
Kong et al. [5] analyzed the fire hazards and safety strategies for lithium-ion batteries, while Kim et al. [6] assessed the explosion risk during lithium-ion battery fires. Furthermore, Troxler et al. [7] investigated the effect of thermal gradients on the performance of lithium-ion batteries. Larsson et al. [8] studied the characteristics of lithium-ion batteries during fire tests. Thermal models of lithium-ion batteries have been studied, including Arora et al. [9], who proposed a neural network-based computational model for the thermal estimation of LFP pouch cells, and Cui et al. [10], who optimized the lumped parameter thermal model for hard-cased lithium-ion batteries. Kleiner et al. [11] experimentally studied the thermal modeling of prismatic lithium-ion batteries for electric vehicle batteries. Moreover, Wang et al. [12] developed a lithium-ion model based on high-speed impedance and presented an online estimation method for battery temperature. Peng and Jiang [13] investigated the surface temperature change and the solid electrolyte at 235 °C, 255 °C, 275 °C, 295 °C, and 315 °C for five lithium-ion batteries with varying cathode materials. Moreover, they examined the possibility of the thermal runaway of the lithium-ion batteries with varying cathode materials by analyzing their decomposition, negative solvent reaction, electrolyte decomposition, and positive solvent reaction. Li et al. [14] investigated the surface and battery temperatures during overcharging and simulated the impedance-based thermal coupling by measuring the resistance values for different states of charge (SoCs).
Studies have also investigated battery overcharging. Belov and Yang [15] reported the surface temperature, heat output, and voltage of 600 and 720 mAh batteries for overcharging at 1 C/12 V, 2 C/9 V, and 3 C/6 V and the time until thermal runaway for each overcharge. They proposed a method to improve the battery stability of lithium-ion batteries via analyses.
Battery modeling studies include Chan and Sutanto [16] and Schmid et al. [17], both of which summarized the (a) Rint model, (b) Thevenin model, (c) dual-polarization model, (d) N-RC Thevenin model, (e) RC model, and (f) PNGV model. Chen and Rincón-Mora [18] presented an accurate electrical battery model that can predict runtime and I–V performance. Bugryniec et al. [19] proposed the advanced abuse modeling of a lithium-ion battery model. Furthermore, Xiong et al. [20] afforded the data-driven multi-scale extended model based on Kalman filtering and the parameter or state estimation of lithium-ion pouch batteries for electric vehicles. Vergori et al. [21] performed battery modeling and simulation using programmable testing equipment.
Ziyad et al. [22,23] introduced a mathematical model of a lead–acid battery. Mahon et al. [24] measured and modeled the high-power performance of carbon-based supercapacitors. Gauchia et al. [25] reported on supercapacitor testing and dynamic modeling, while Buller et al. [26,27] modeled the dynamic behavior of supercapacitors using impedance spectroscopy. Moreover, Bae [28] investigated the electrical modeling and impedance spectra of lithium-ion batteries and supercapacitors. Karden et al. [29] developed the frequency-domain approach to dynamically model electrochemical power sources.
Stroe et al. [30] proposed different methods for measuring the impedance of lithium-ion batteries during aging. Additionally, Varnosfaderani and Strickland [31] developed a method for the online impedance spectroscopy estimation of batteries.
Stroe et al. [32] diagnosed the state-of-health (SoH) of lithium-ion batteries using EIS. Maheshwari et al. [33] experimentally studied the cycle aging of lithium–nickel–manganese–cobalt–oxide-based batteries through EIS. Buller et al. [34] presented impedance-based nonlinear dynamic battery modeling for automotive applications. Furthermore, Sihvo et al. [35] proposed a fast approach for battery impedance identification using pseudo-random sequence signals. Macdonald [36] interpreted applications for analyzing the material properties and electrode effects using impedance spectroscopy. Santoni et al. [37] developed a digital impedance emulator for battery measurement system calibration. Additionally, Gheem et al. [38] employed EIS in the presence of nonlinear distortions and nonstationary behaviors.
Multifaceted studies on EIS have been conducted. Stroe et al. [39] and Deng et al. [40] studied lithium–sulfur batteries, while Lee and Choi [41] studied lithium–polymer batteries. Moreover, Franke-Lang and Kowa [42] focused on zinc–air batteries, and Olarte et al. [43] analyzed the impedance spectra and electrical equivalent circuits of lead–acid batteries.
Oldenburger et al. [44] and Samuel and Paul [45] mathematically and electrically modeled the Warburg impedance (), which stems from diffusion in the extremely low-frequency region in lithium-ion batteries. Barreras et al. [46] presented a hardware-in-the-loop simulation battery model based on impedance spectroscopy. Liebhart et al. [47] proposed the use of passive impedance spectroscopy for monitoring lithium-ion battery cells during vehicle operations.
Kim and Kowal [48] presented a Matlab/Simulink model for monitoring cell SoH and SoC by examining the impedance of lithium-ion batteries. Guha and Patra [49] proposed the online estimation of EIS and the remaining useful life of lithium-ion batteries. Babaeiyazdi et al. [50] studied the SoC prediction of lithium-ion batteries for electric vehicles using EIS. Koleti et al. [51] developed an online method for lithium plating detection in lithium-ion batteries, and Crescentini et al. [52] proposed the online EIS and diagnostics for lithium-ion batteries via low-power integrated sensing and parametric modeling. Galeotti et al. [53] investigated the performance analysis and SoH evaluation of lithium–polymer batteries through EIS.
With regard to the online estimation of the SoC of lithium-ion batteries, Hasan and Scott [54] presented the impedance measurement of batteries under load, while Lee and Cho [55] and Wei et al. [56] conducted measurements using extended Kalman filtering. Furthermore, Kim et al. [57] studied the stable configuration of a lithium-ion series battery pack based on a screening process for improved voltage/SoC balancing, and Wang et al. [58] estimated the SoC of lithium-ion batteries from the fuse open-circuit voltage curve.
Chiang et al. [59] developed an online estimation method for the internal resistance and open-circuit voltage of lithium-ion batteries in electric vehicles. Wei et al. [60] studied the online model identification and SoC estimation for lithium-ion batteries with a recursive total least-squares-based observer. Rivera-Barrera et al. [61] also investigated the SoC estimation for lithium-ion batteries. Alvi et al. [62] examined a smart battery management system for electric vehicle applications, while Jang and Yoo [63] analyzed impedance- and circuit parameter-based battery models for hybrid electric vehicle power systems. Richardson et al. [64] and Gogona et al. [65] proposed methods for analyzing the power and drive systems and analyzed the battery impedance to estimate the internal temperature and lifespan of a battery cell.
2. Impedance Spectrum of Cylindrical and Pouch-Type ESS
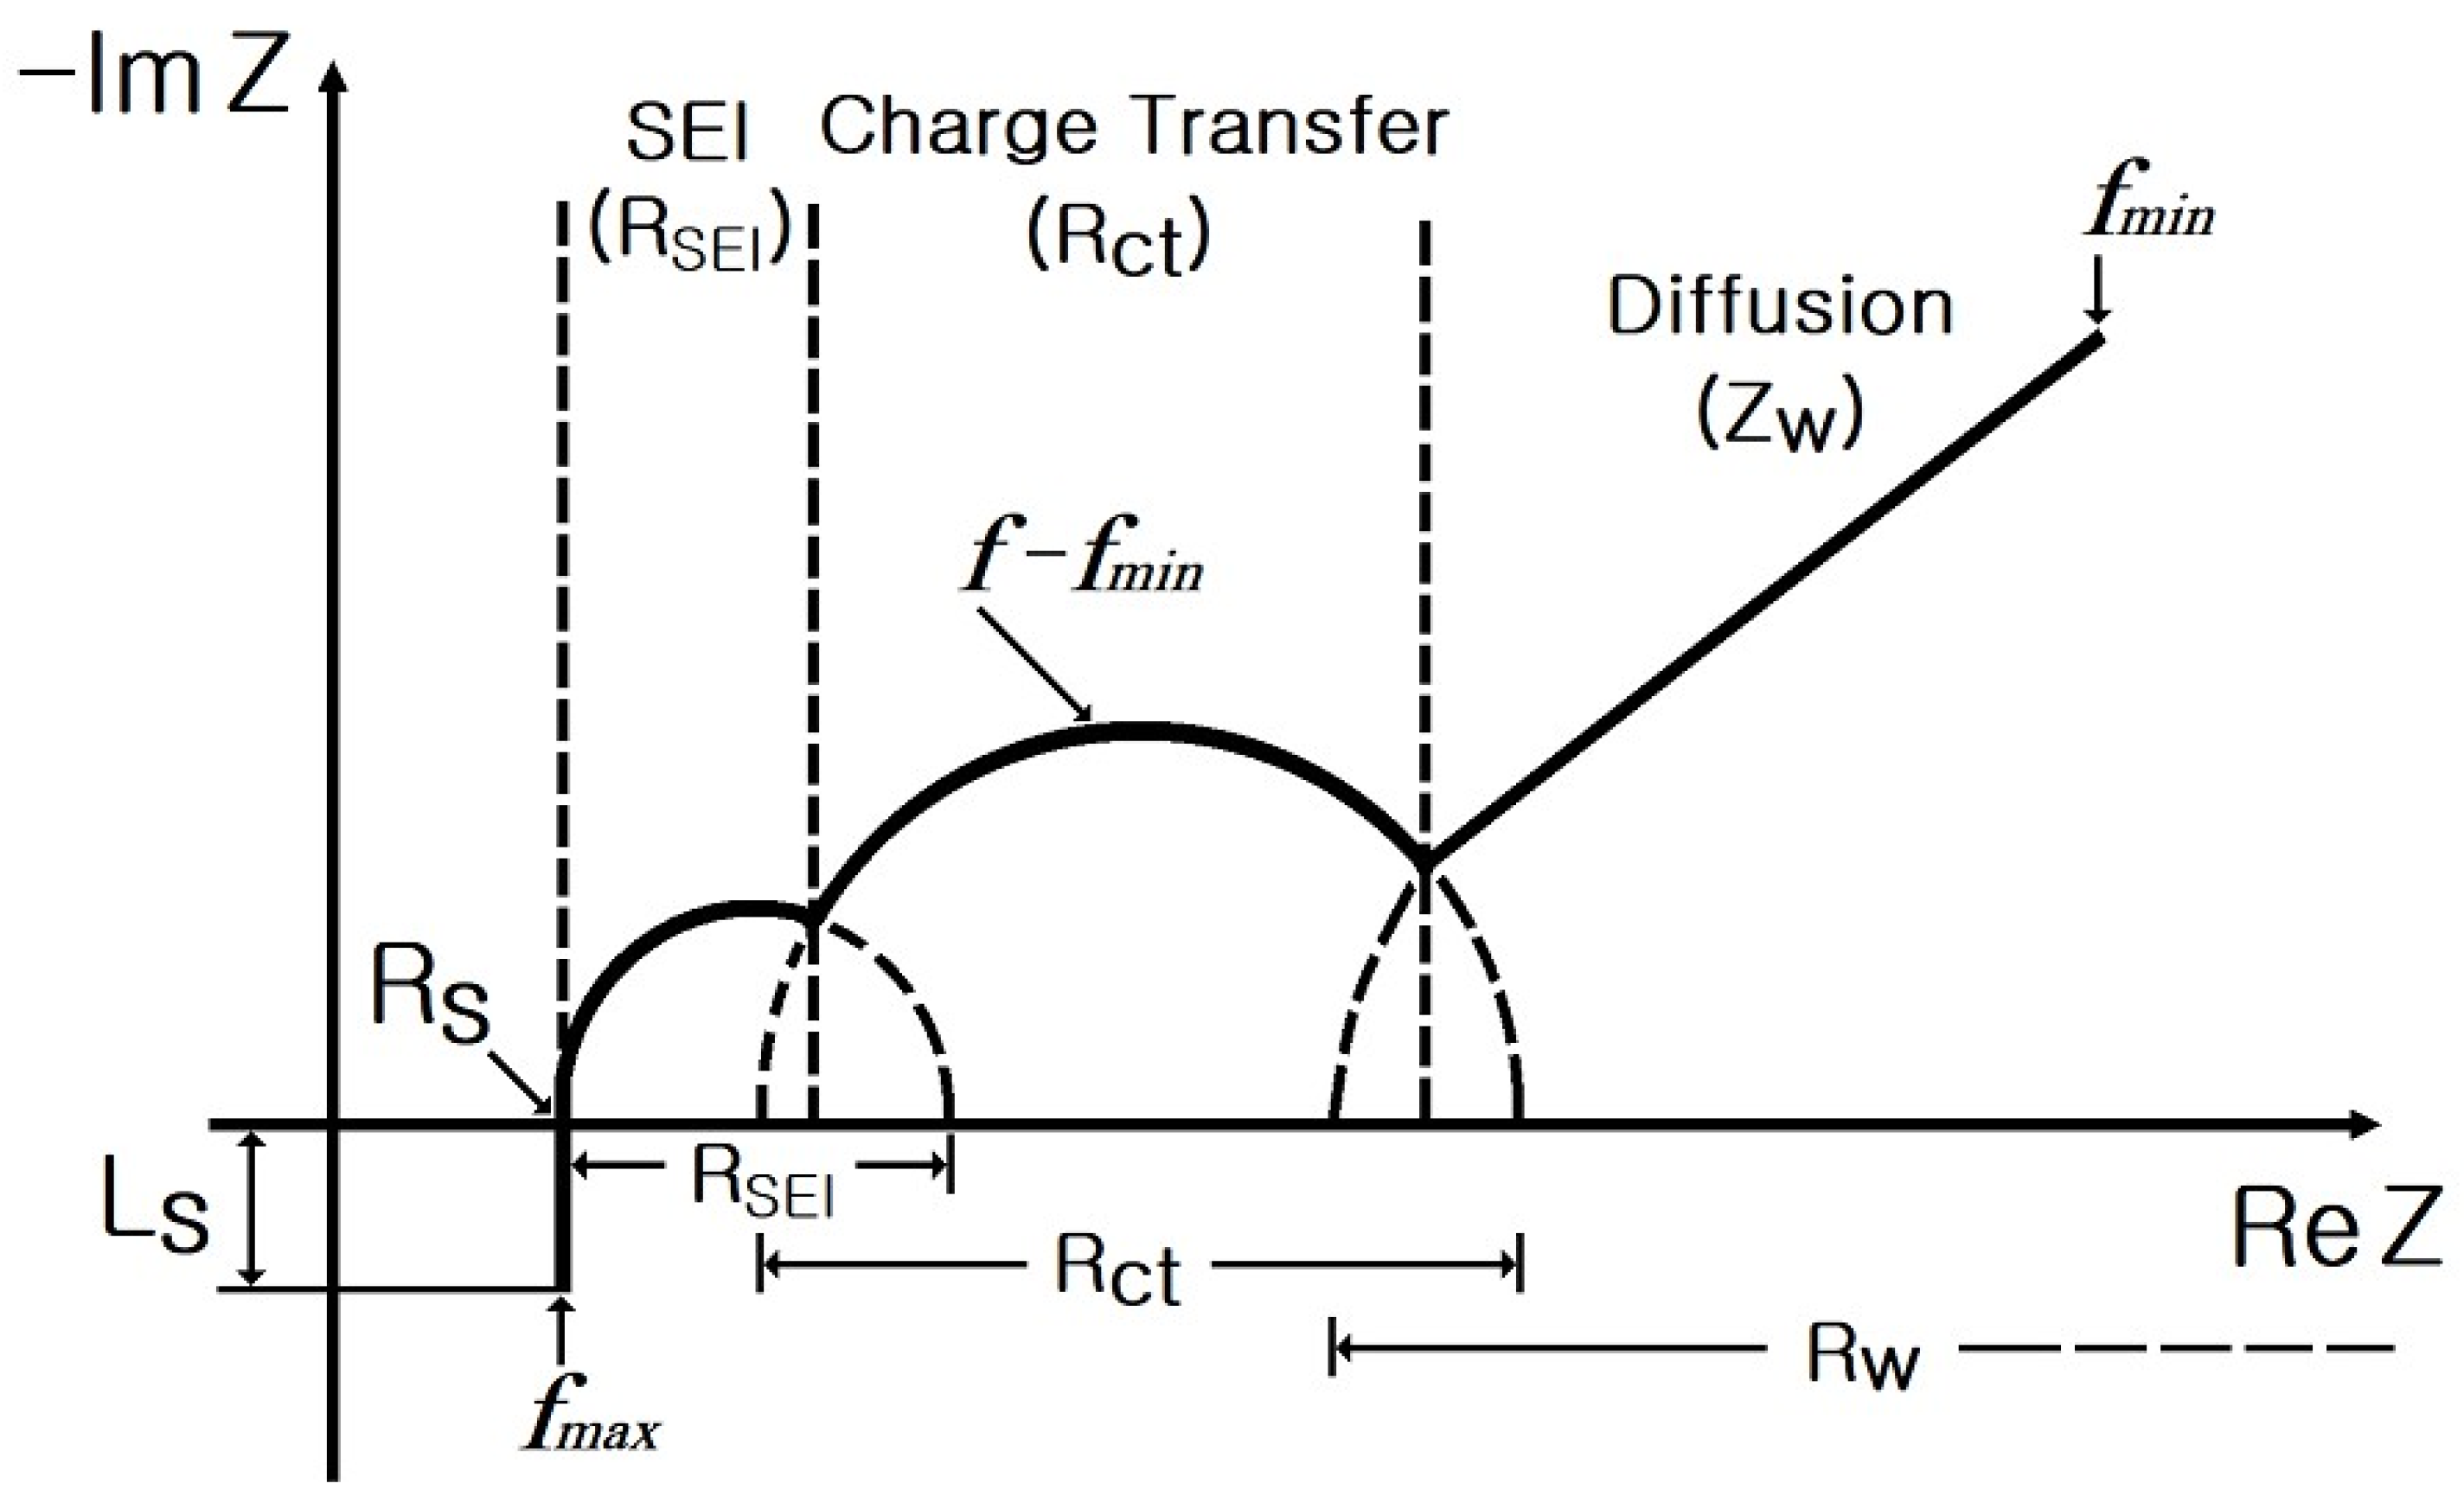
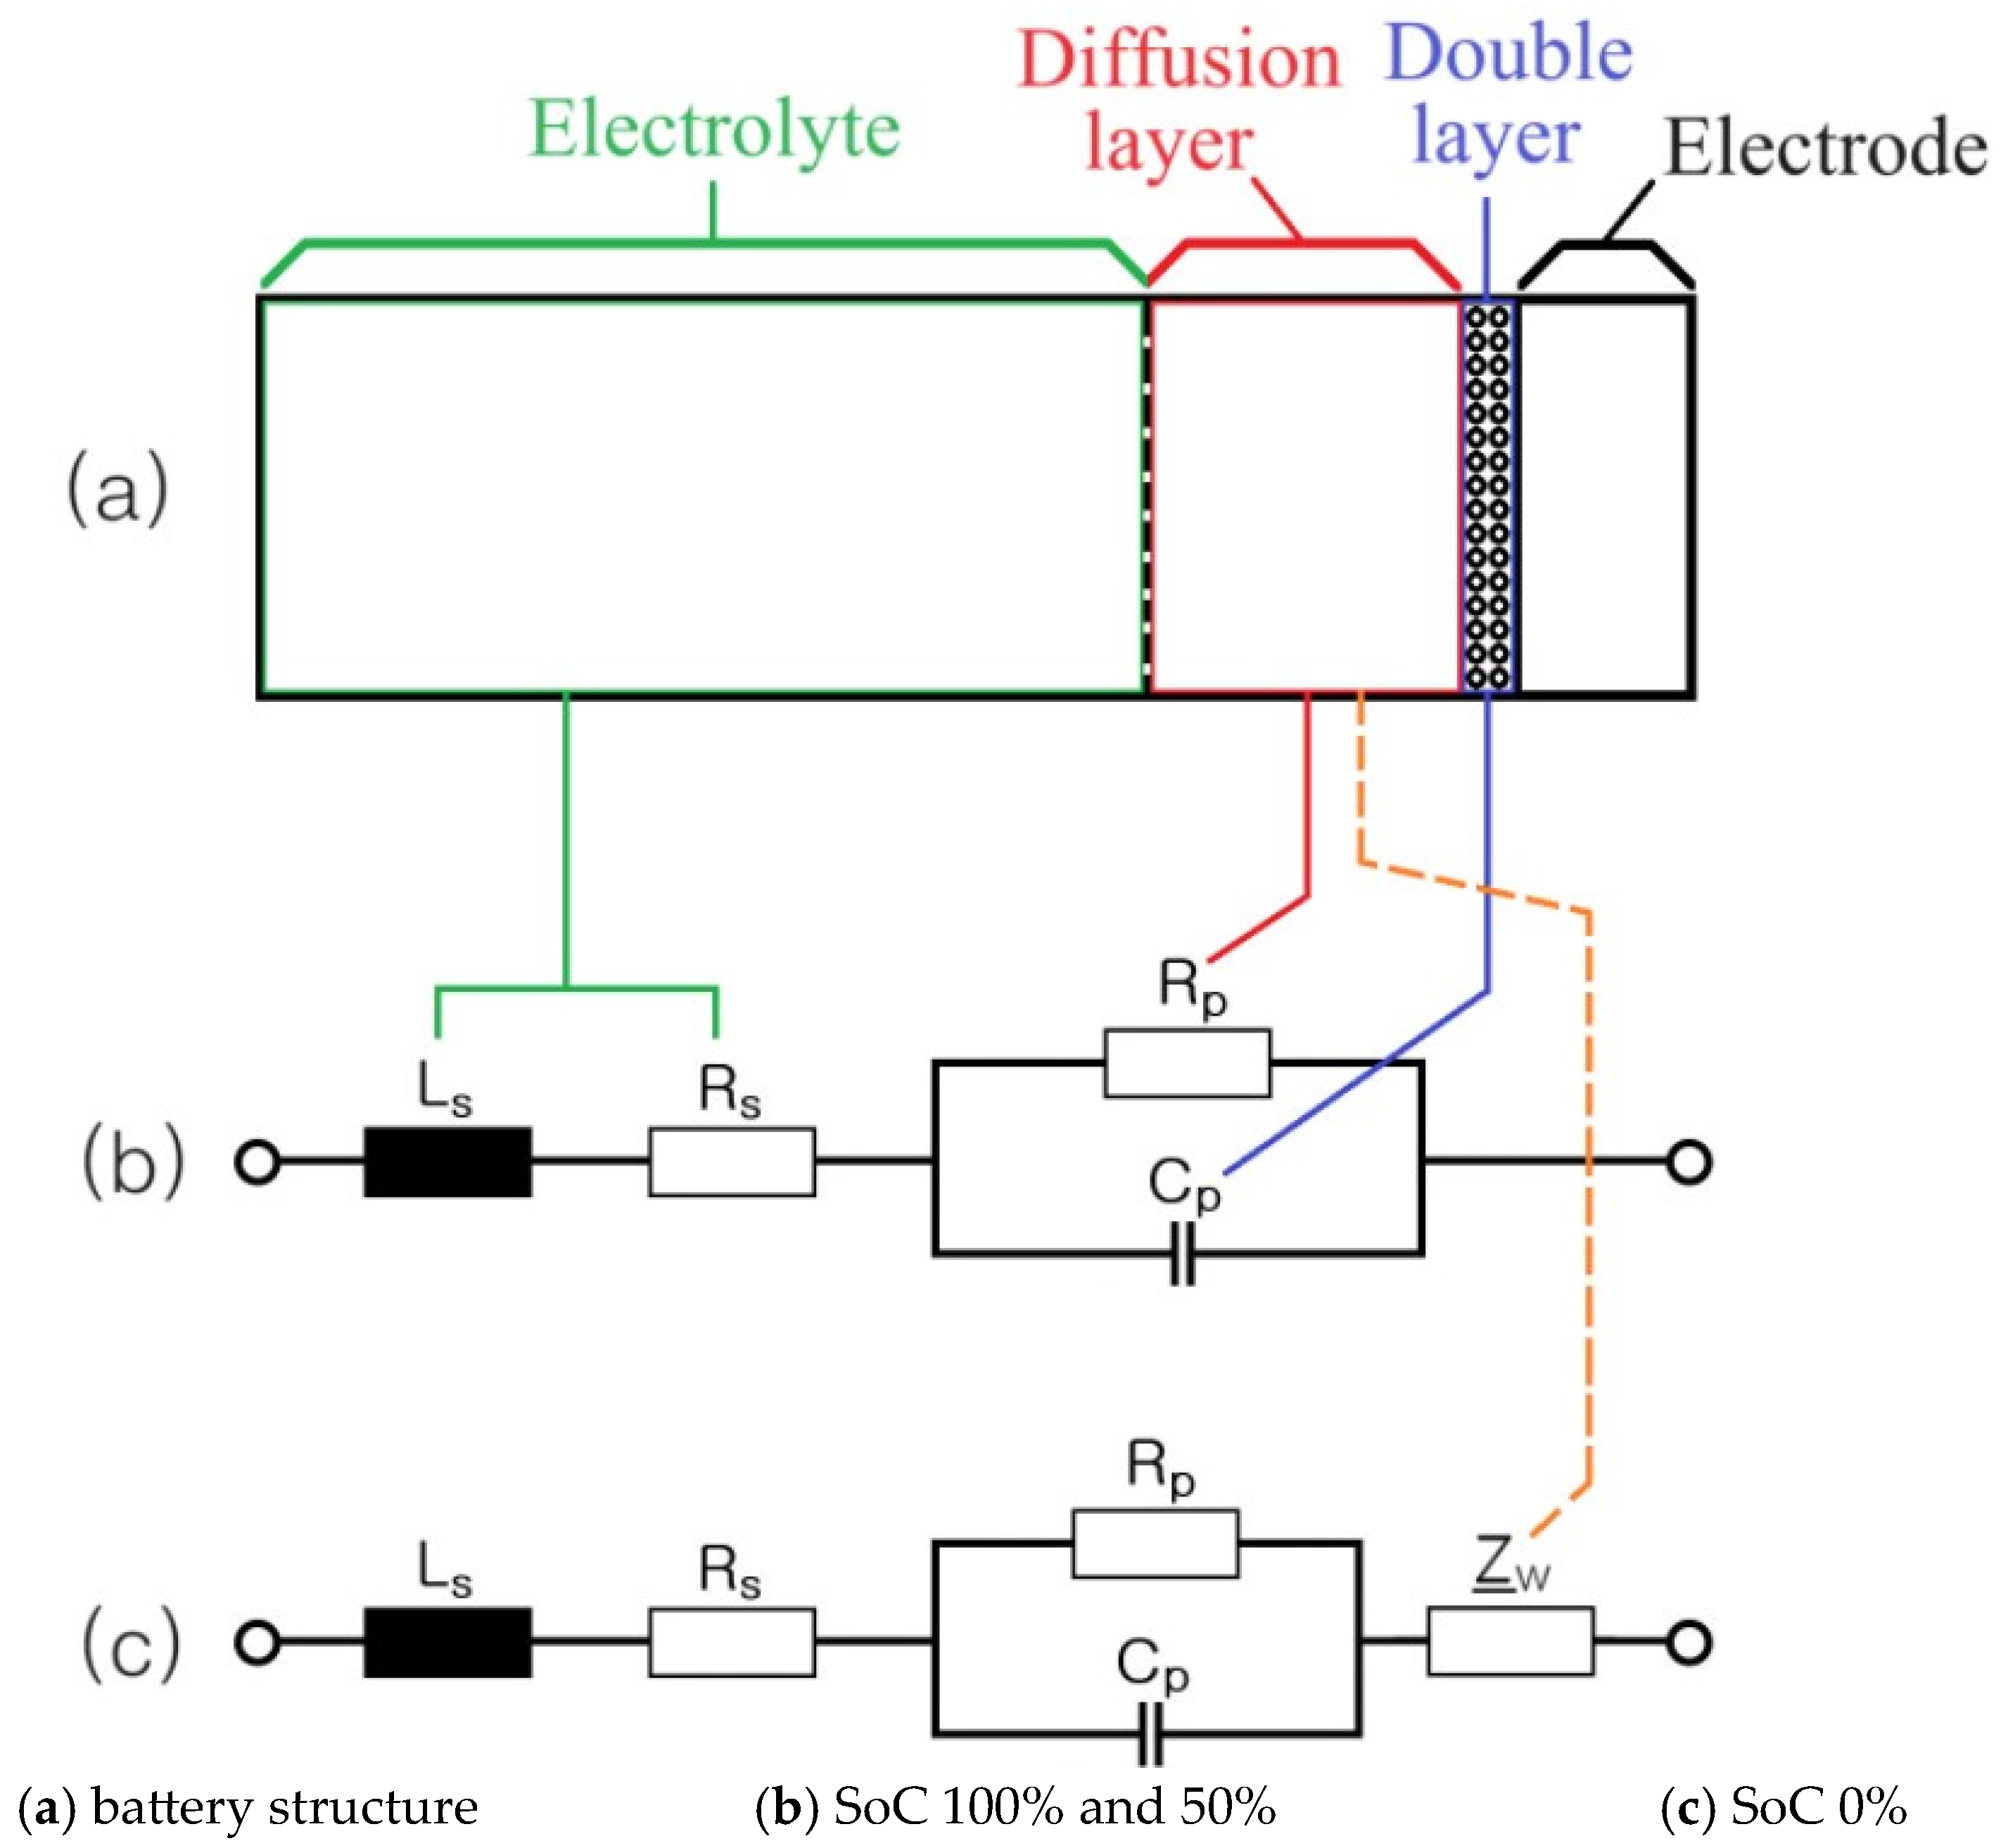
Figure 1 depicts the complex plane diagram of the impedance spectrum of a cylindrical lithium-ion battery [27,28,29]. The impedance spectrum comprises a series inductor () located in the high-frequency region (), and the point at which the trace of the impedance spectrum and the real axis meet provides the series resistor () of the cylindrical battery.
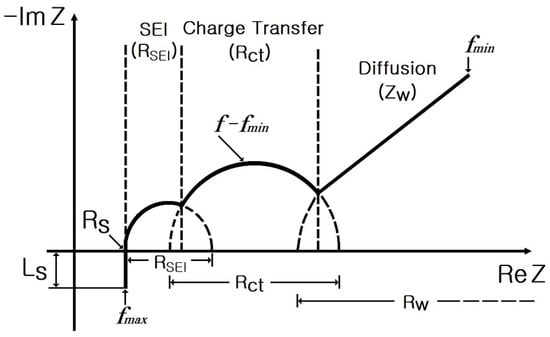
Figure 1.
Complex plane diagram of the impedance spectrum of a cylindrical lithium-ion battery [27,28,29].
The small semicircle is described using the film resistor () and capacitor () corresponding to charge transfer in the solid electrolyte interface (SEI) formed by the inner electrode. is associated with the diffusion of solid-state lithium ions, and it increases with a 45° slope in the complex plane [28,44,45]. can be expressed as follows [28,44,45]:
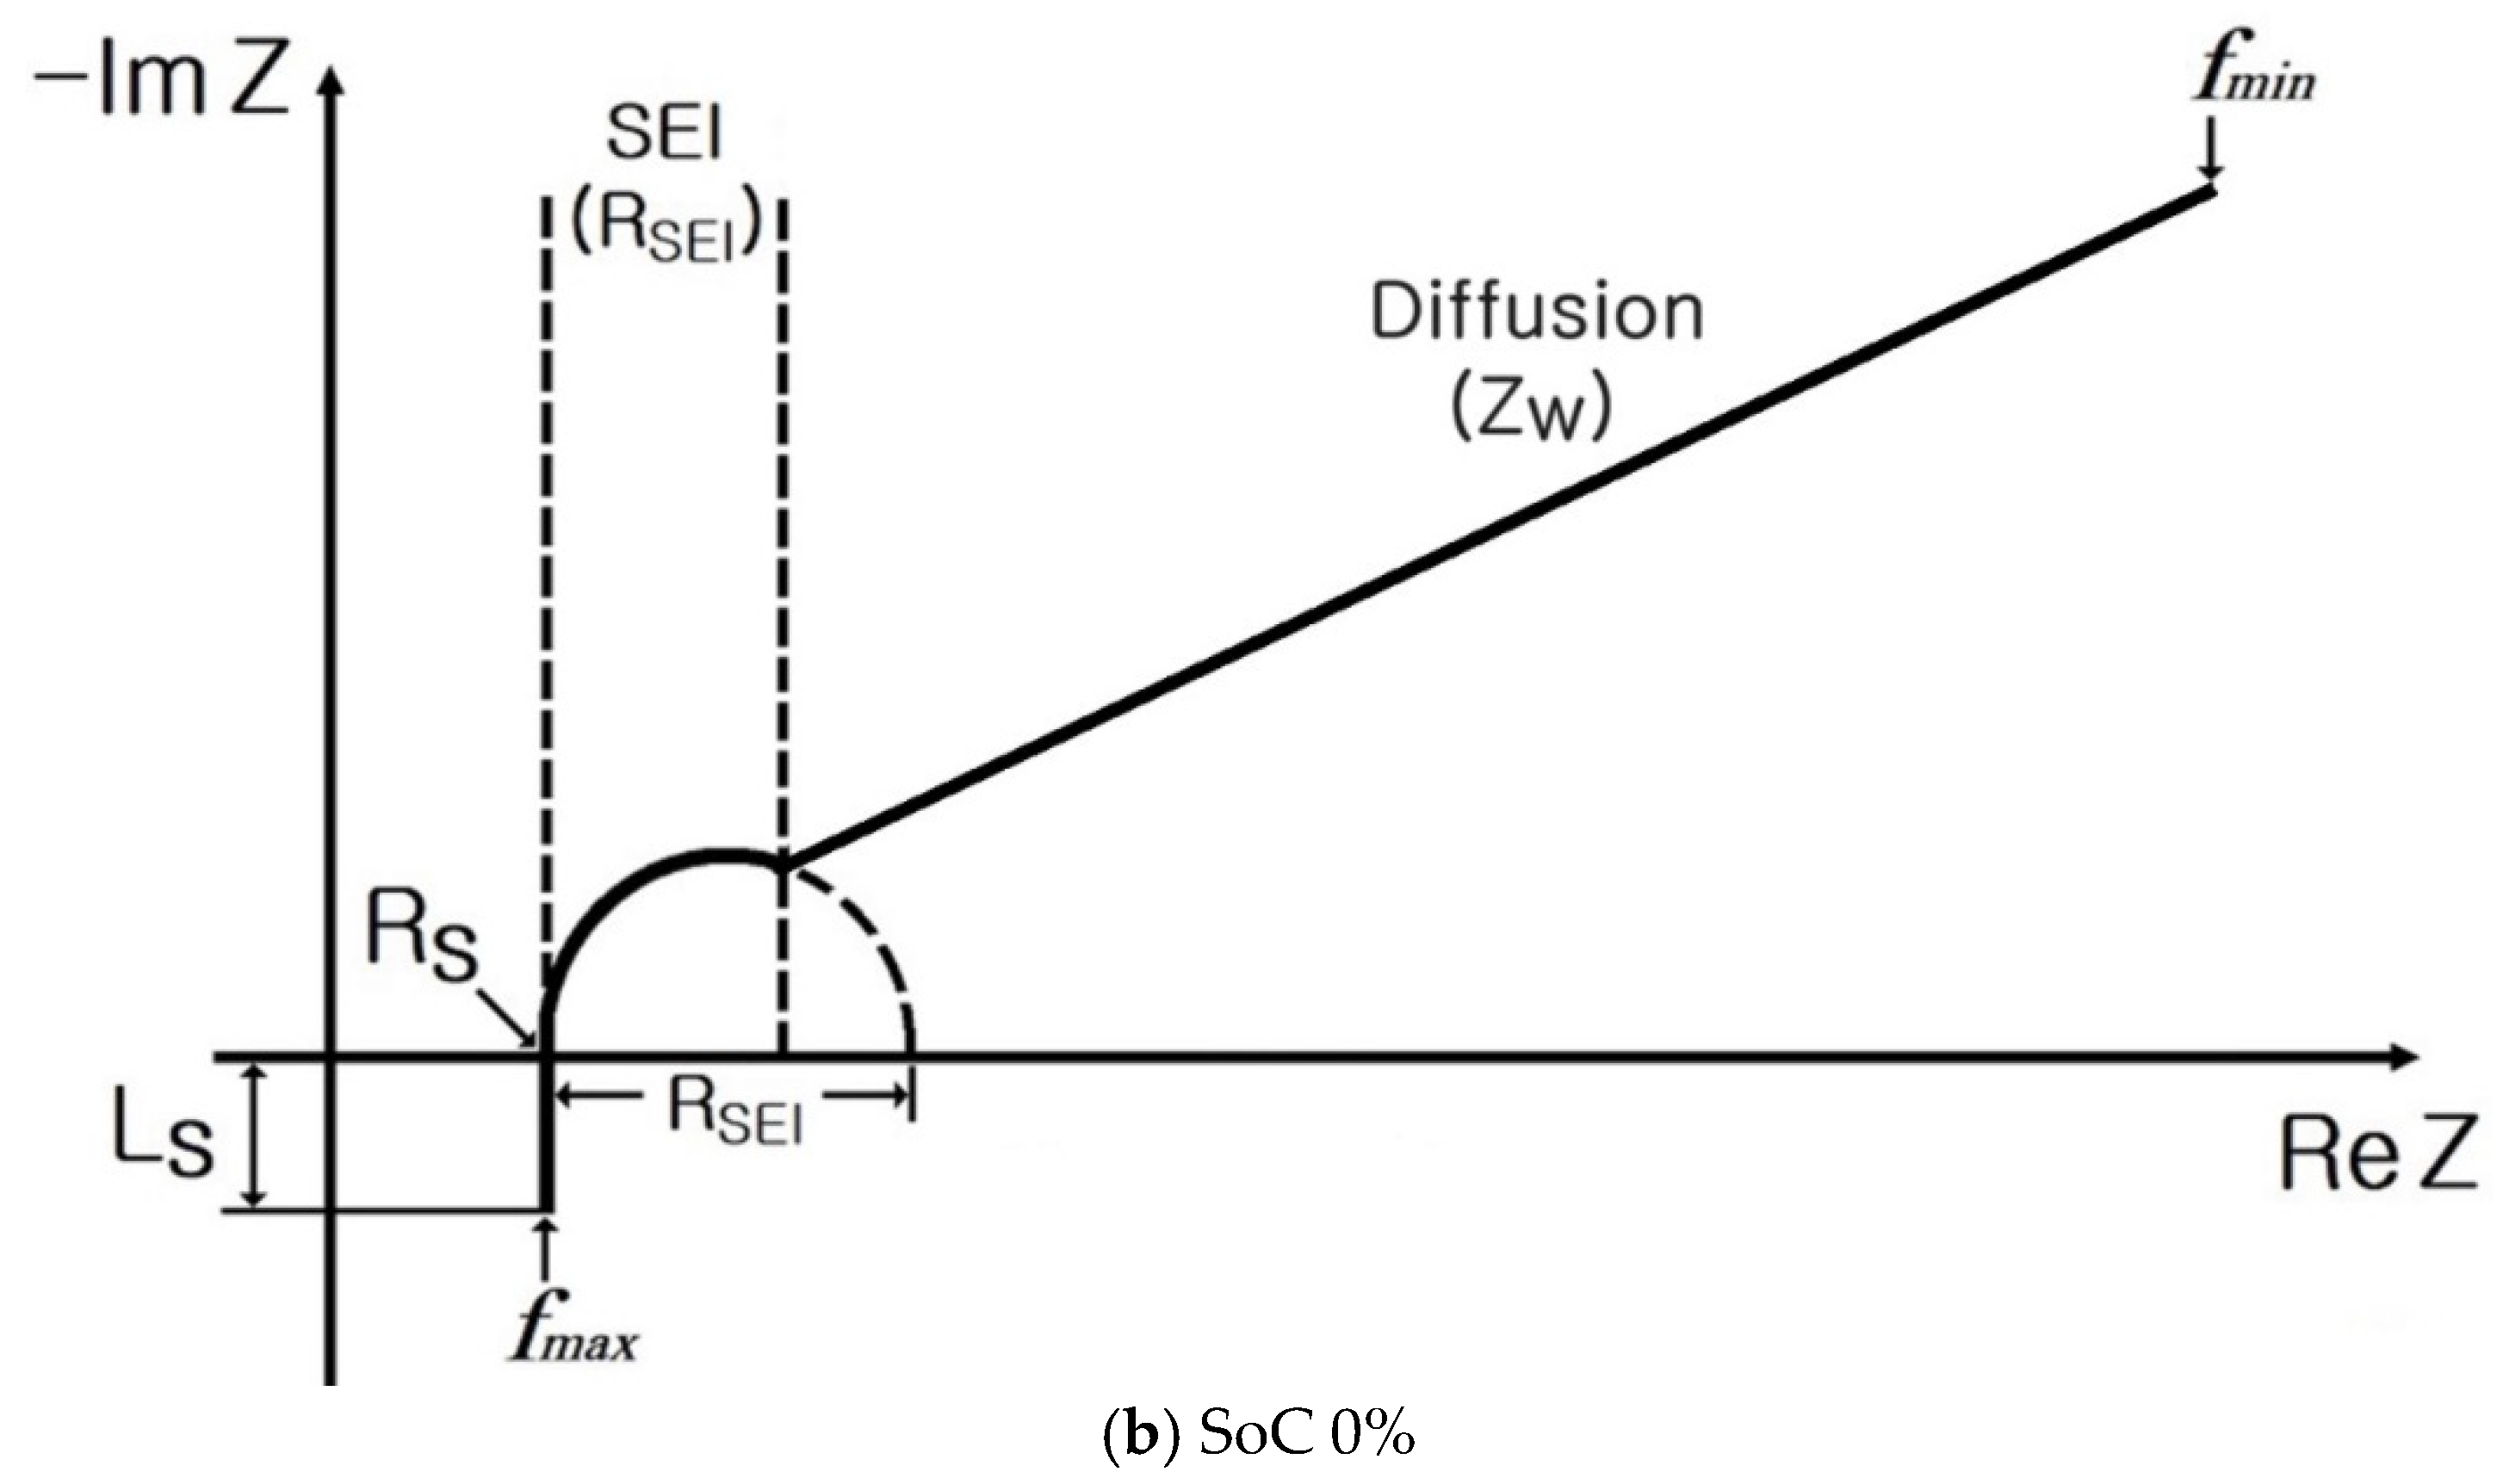
Figure 2 displays the complex plane diagram of the impedance spectrum of a pouch-type lithium-ion battery. Unlike cylindrical lithium-ion batteries, pouch-type lithium-ion batteries do not exhibit diffusion-negative but exhibit an impedance spectrum locus that moves parallel to the real axis with decreasing frequency at SoC 100% and 50%. In contrast, at 0% SoC, almost no charge transfer () area is observed, and increases with a 45° slope. This is the most notable cause for the rapid increase in the internal impedance in pouch-type lithium-ion batteries.
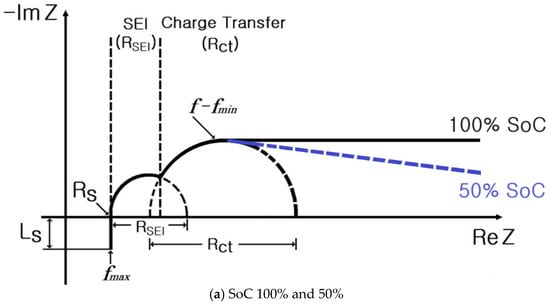

Figure 2.
Complex plane diagram of the impedance spectrum of a pouch-type lithium-ion battery.
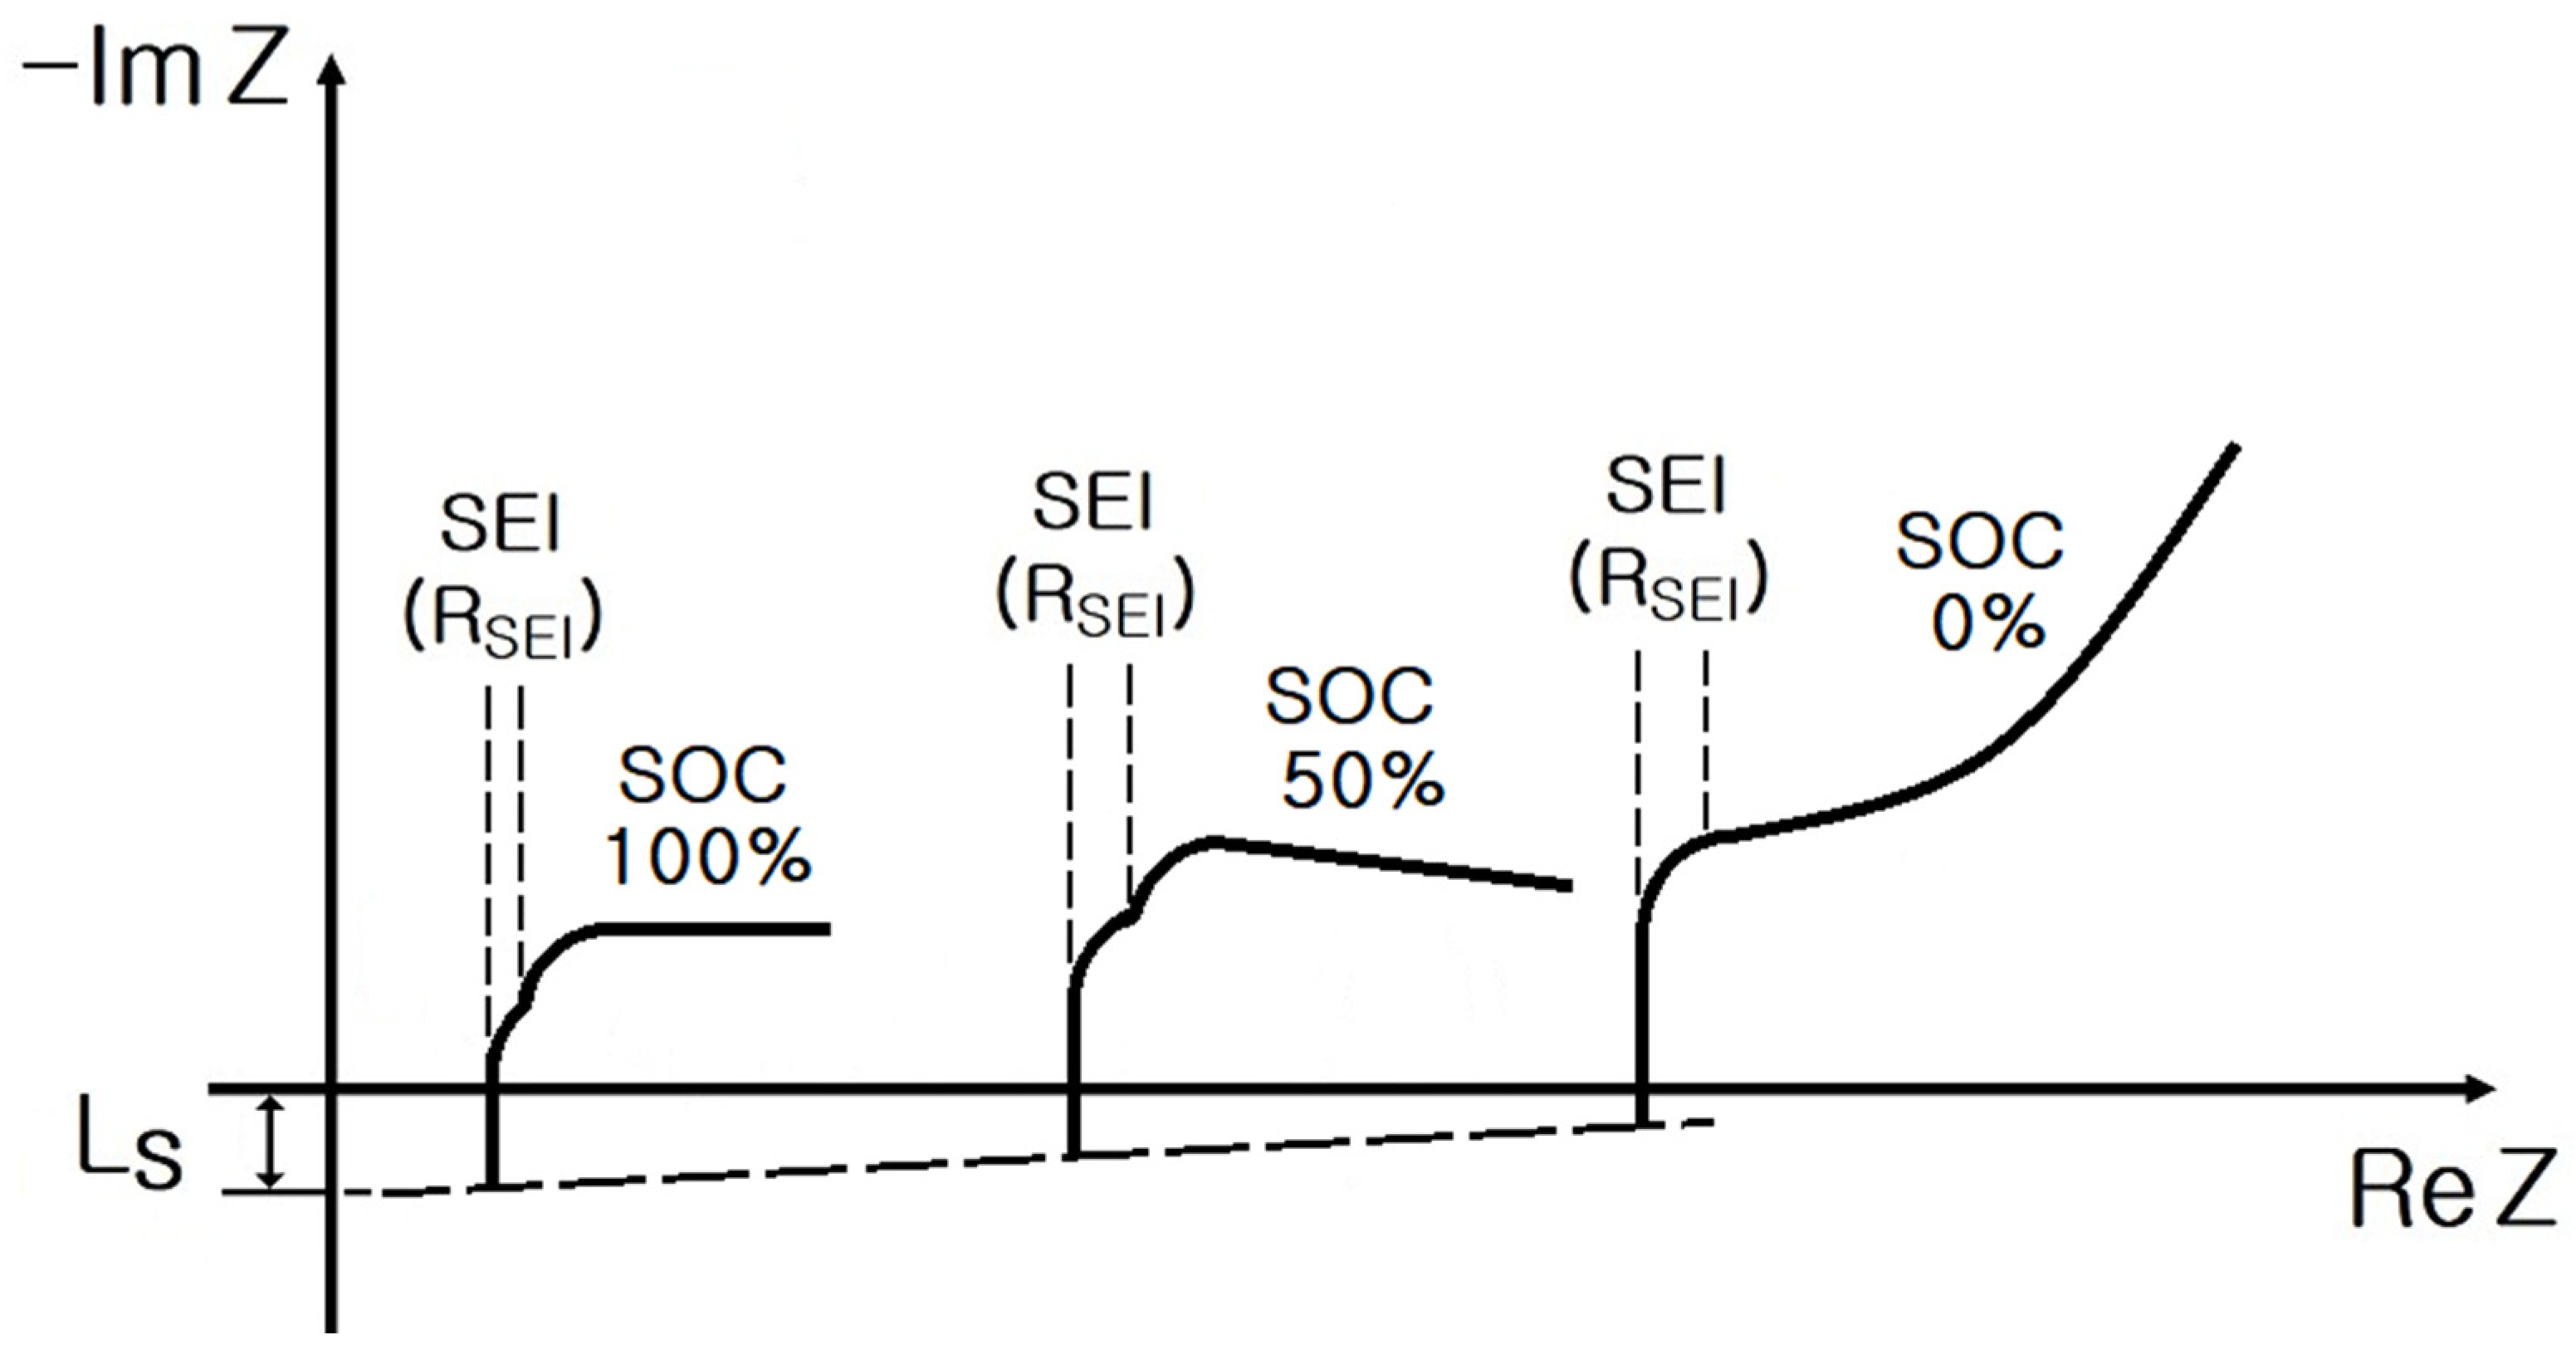
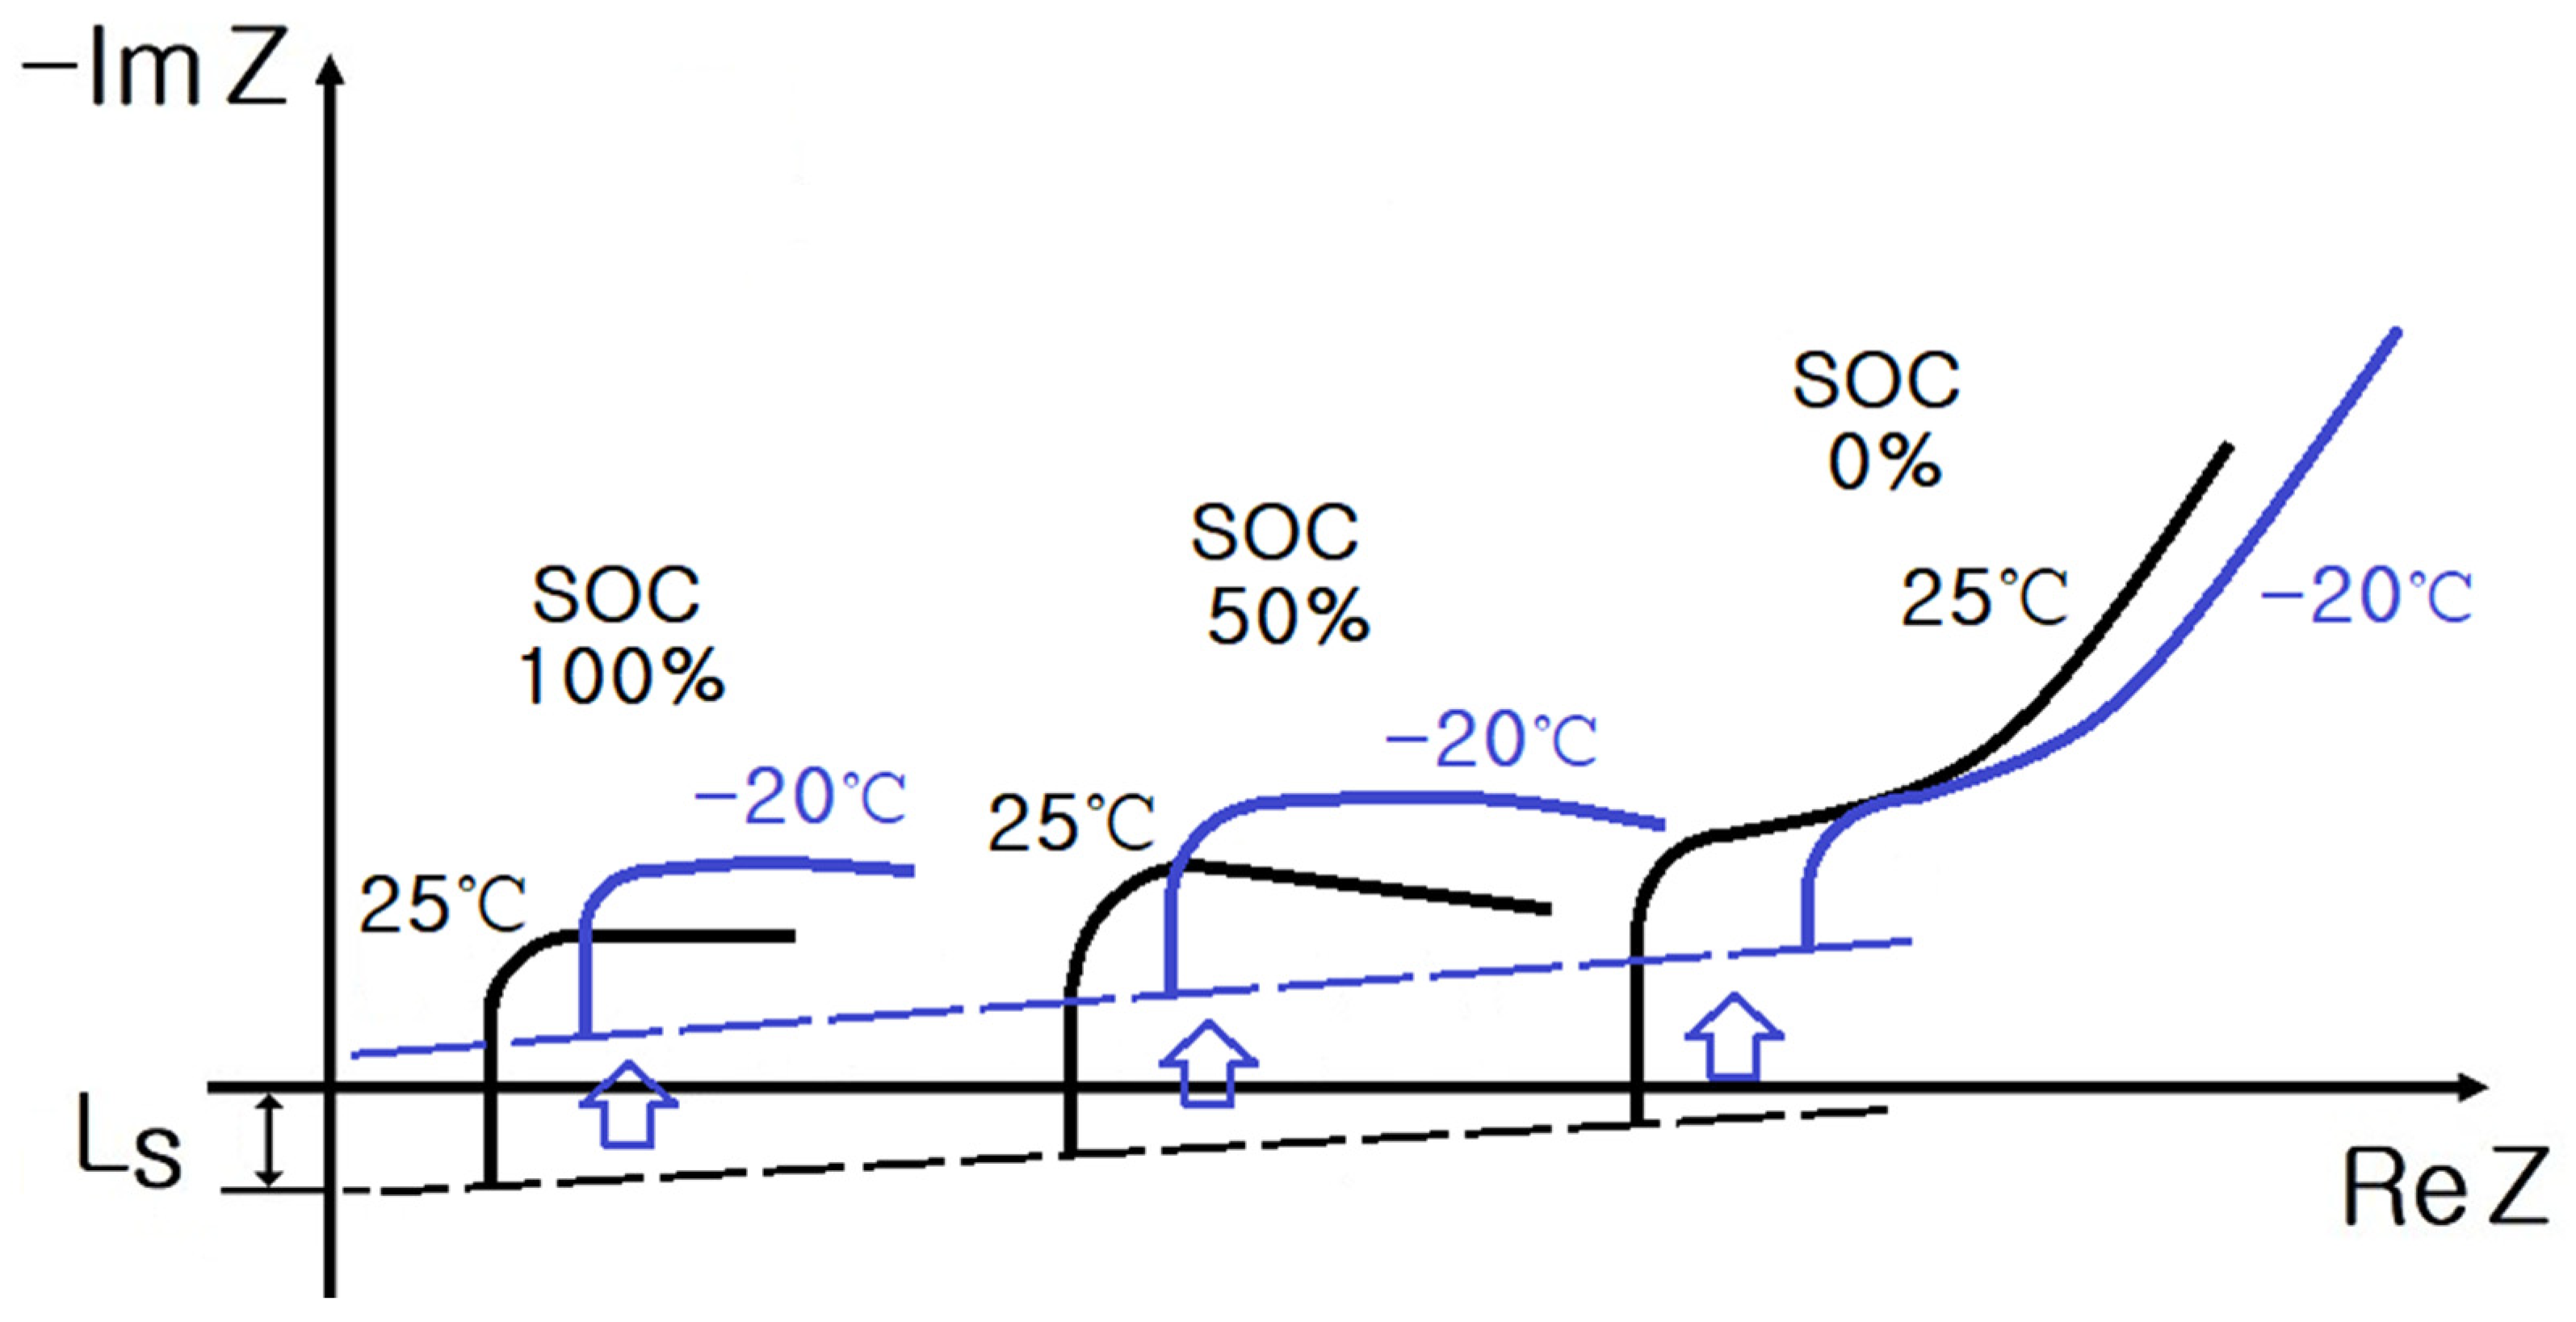
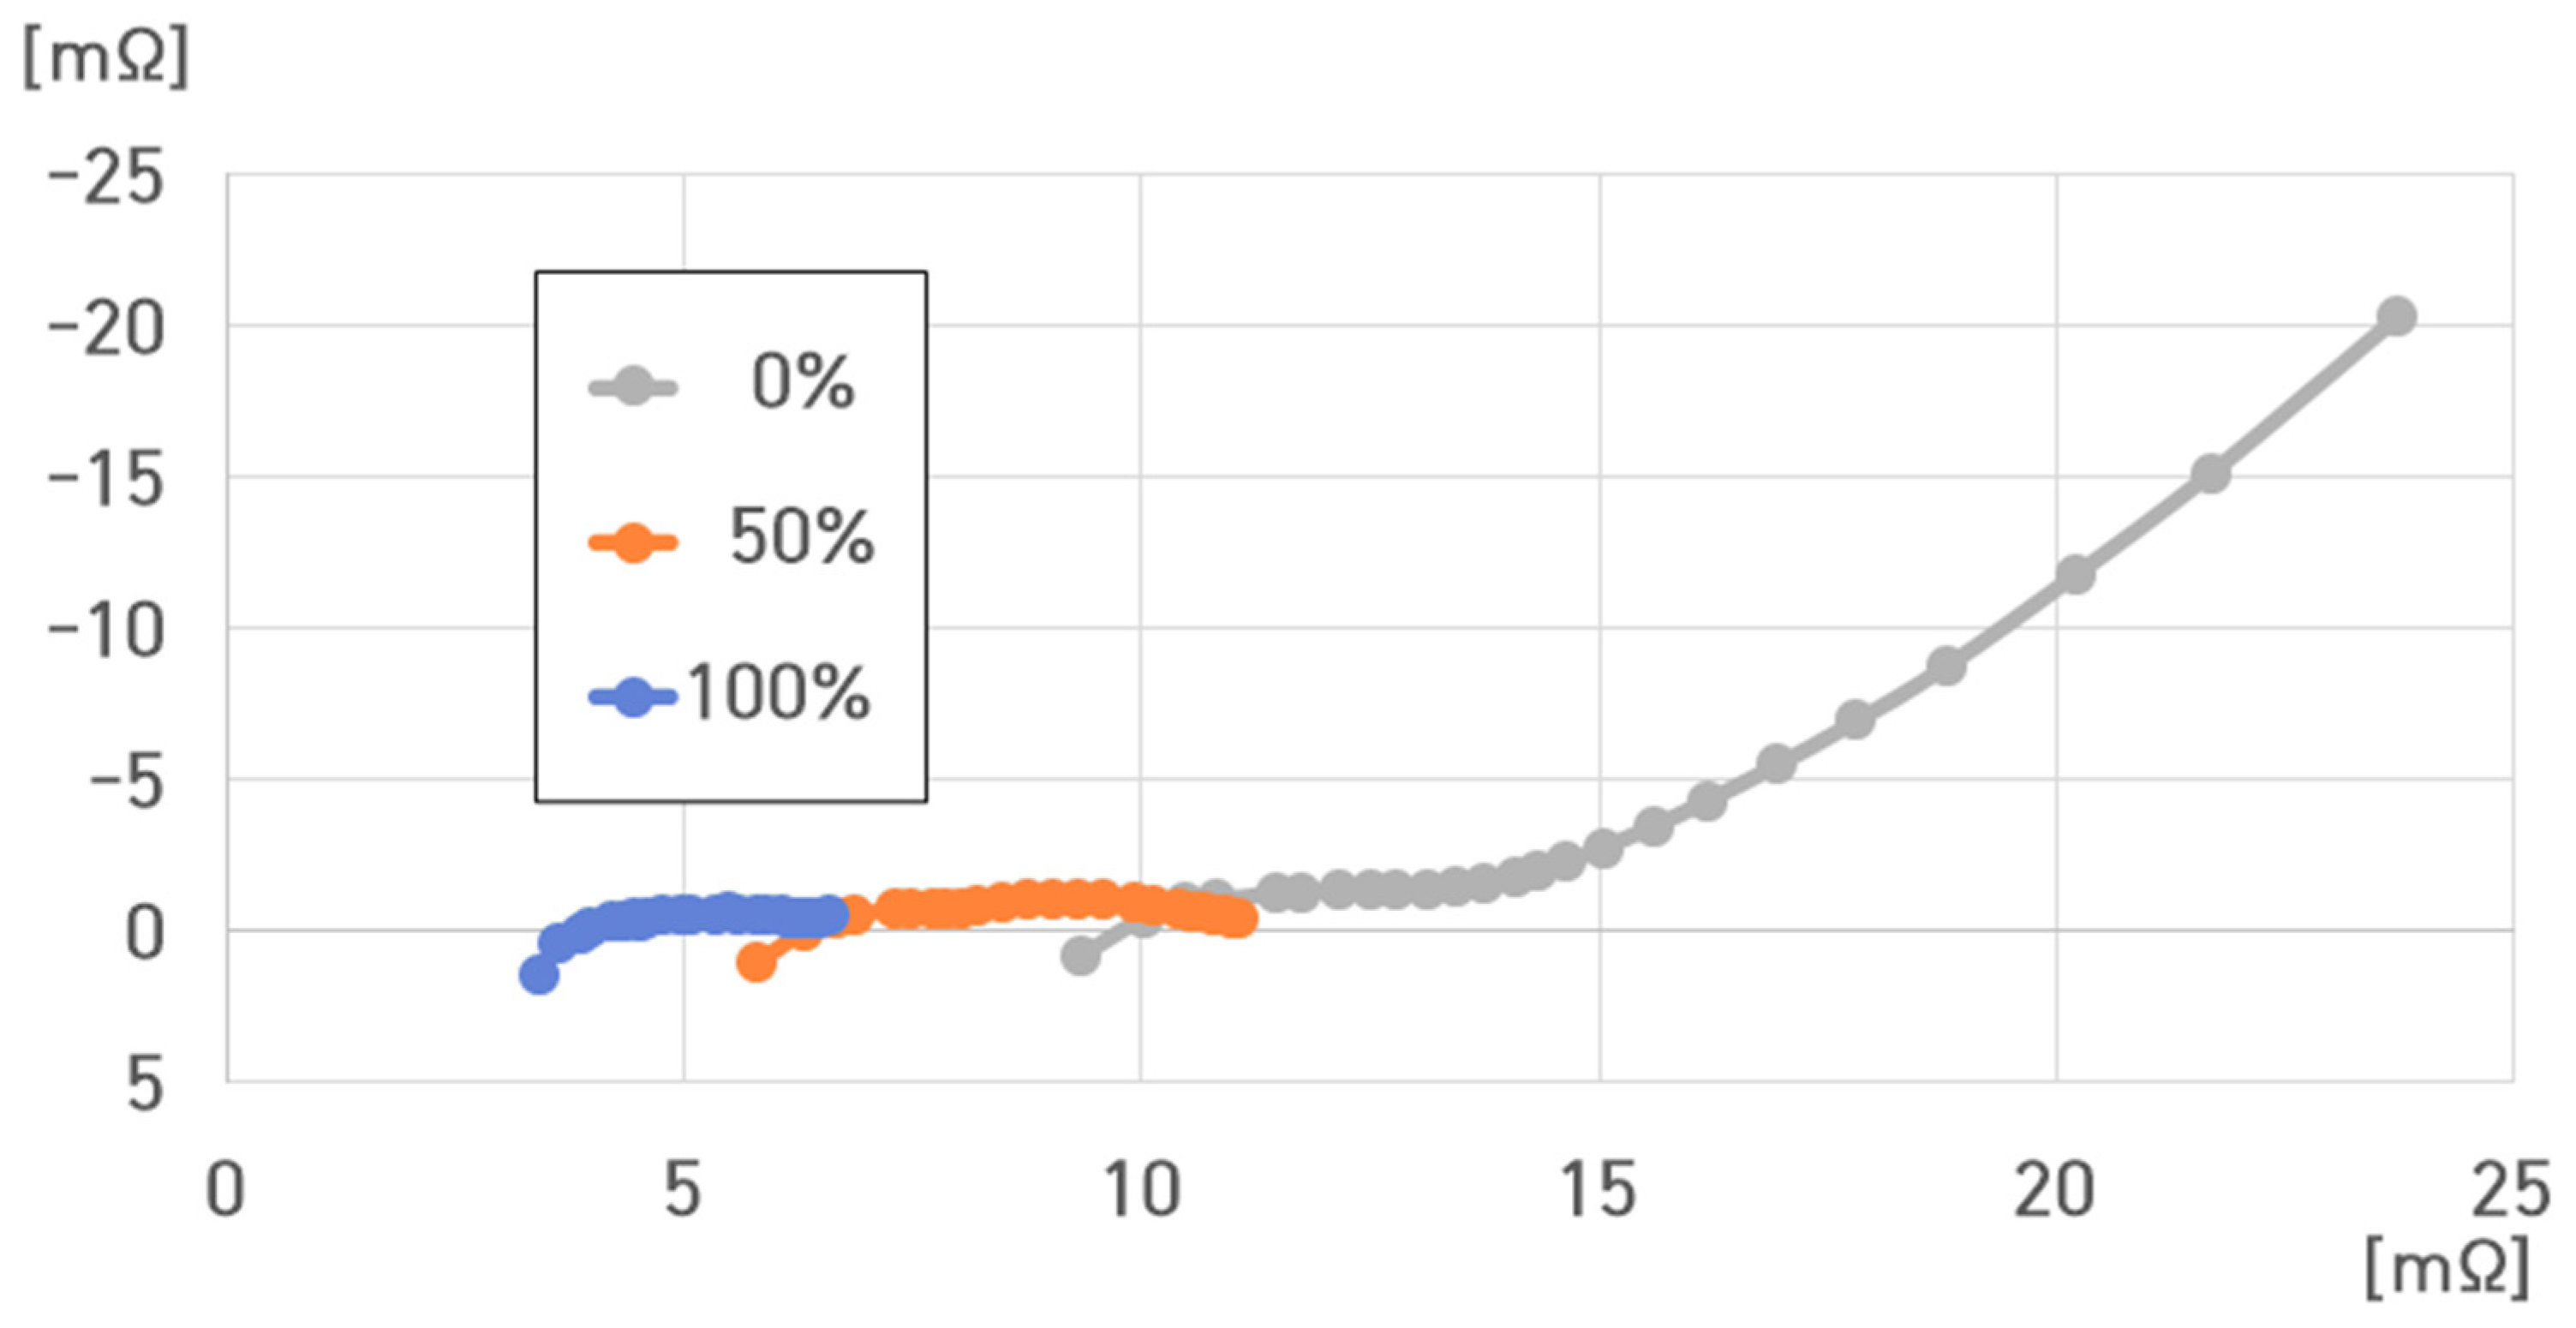
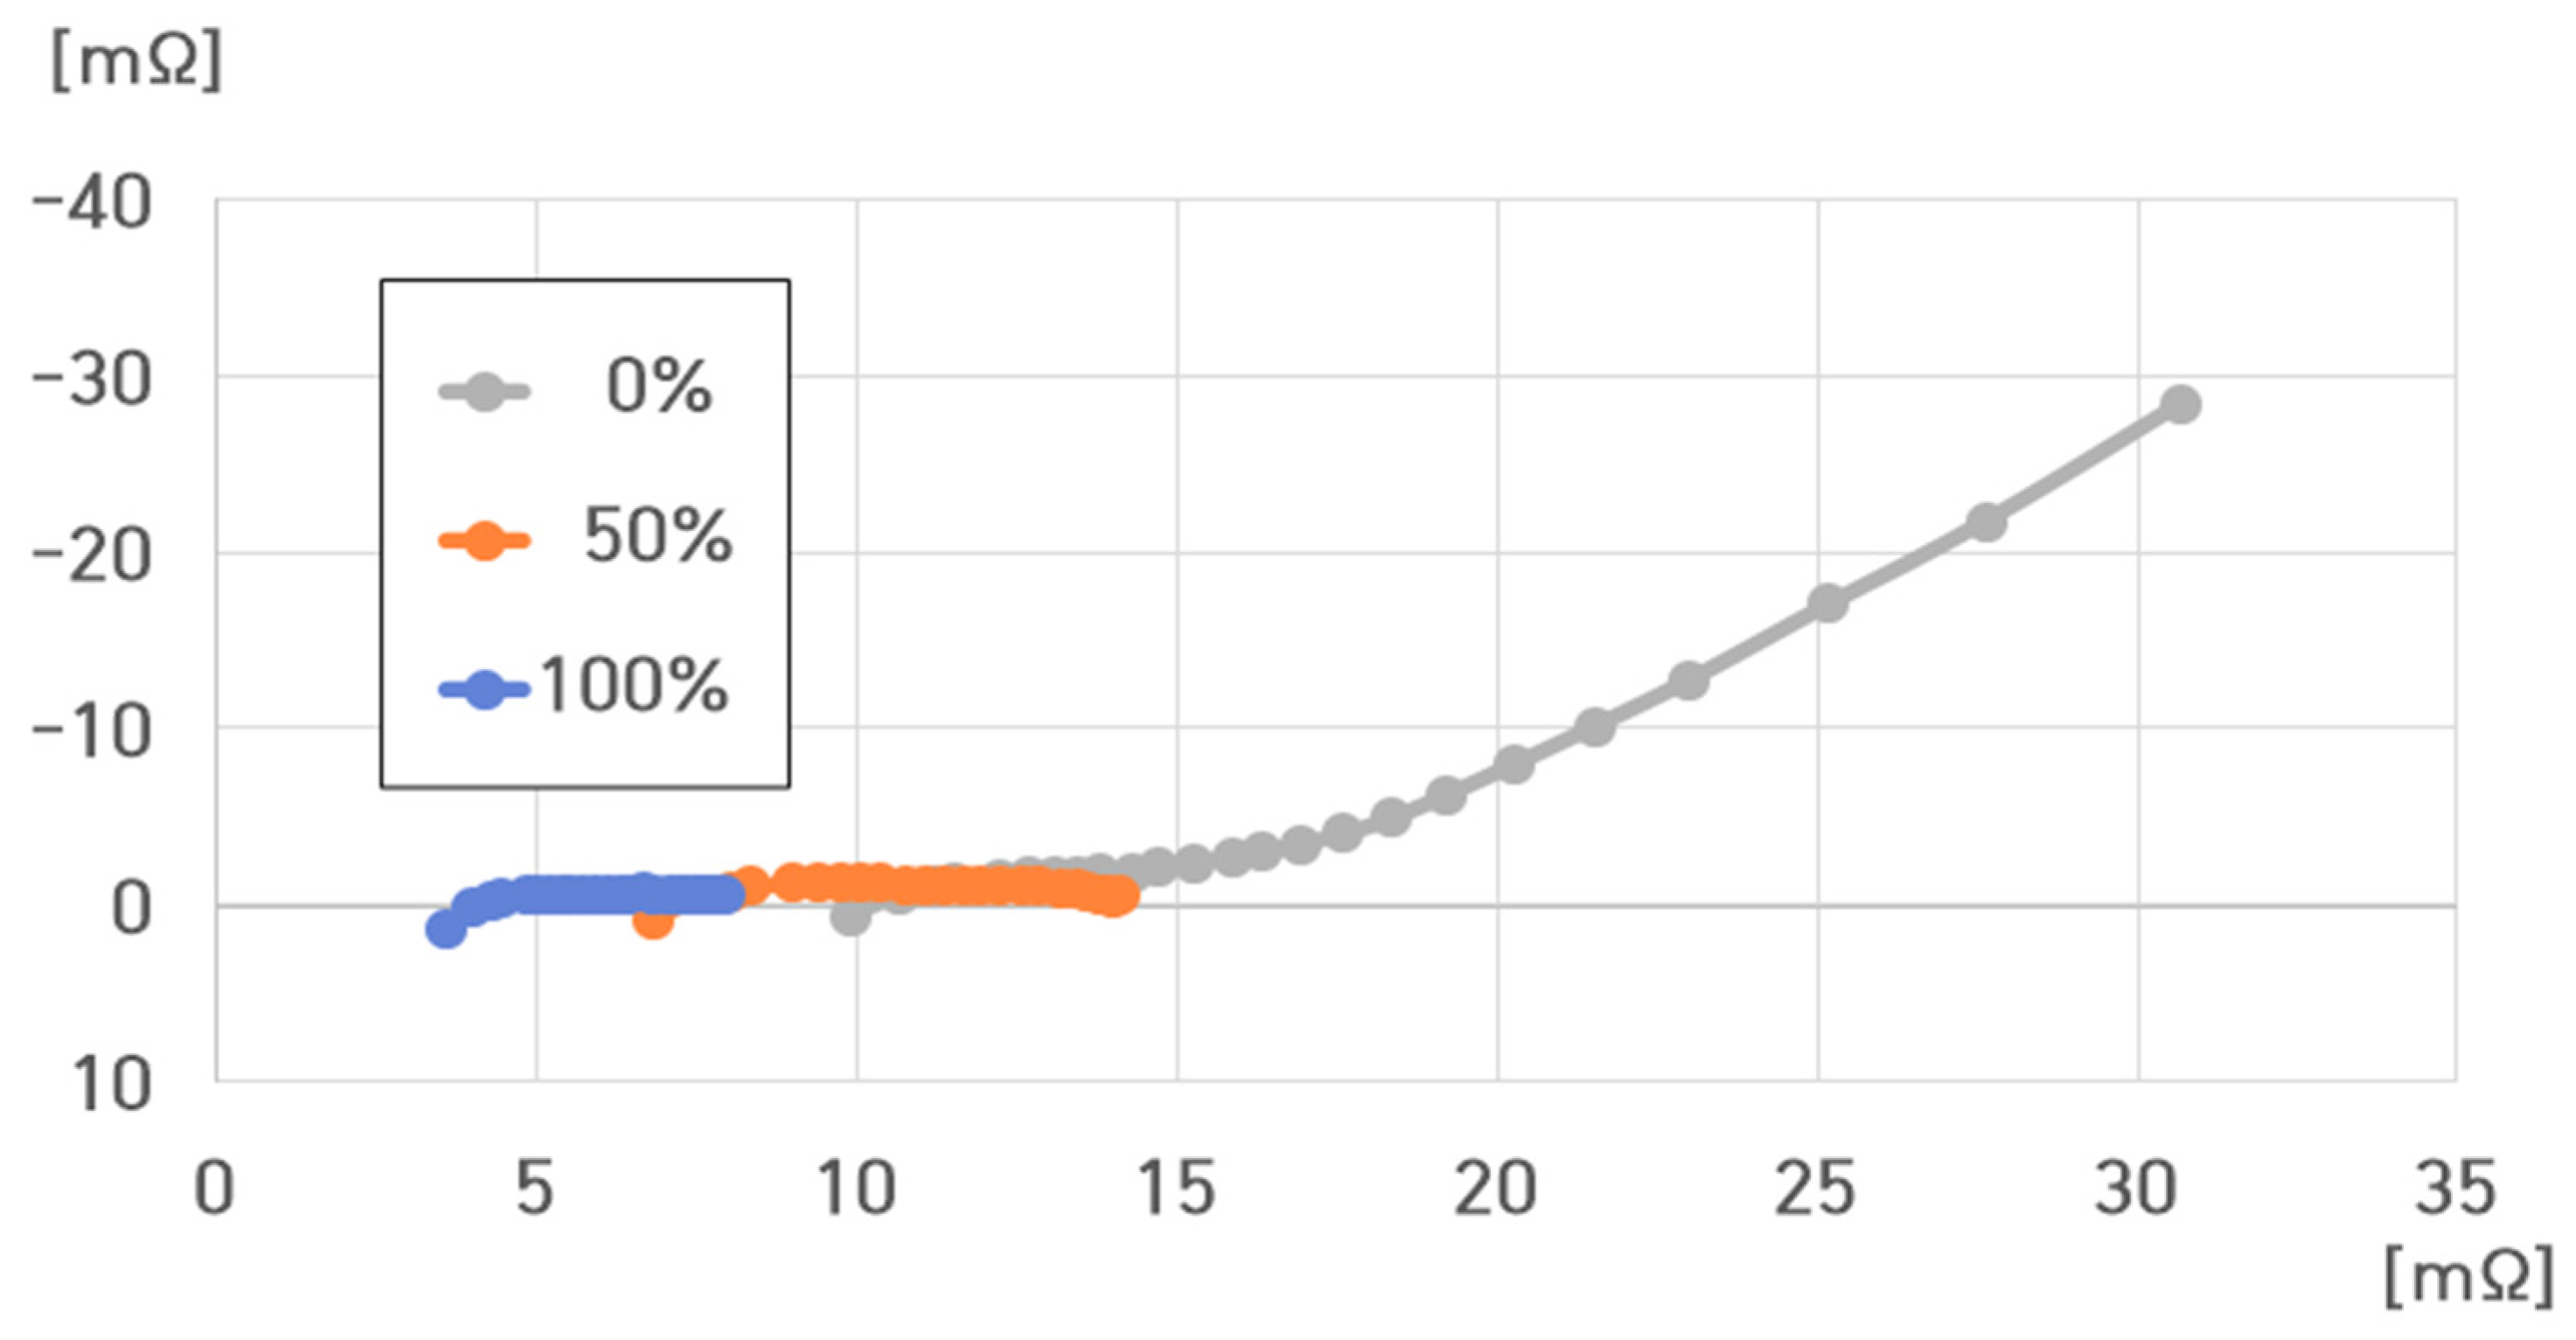
In Figure 3 and Figure 4, at SoCs of 100% and 50%, the and corresponding to charge transfer arise from the SEI formed on the internal electrode of lithium-ion batteries. Furthermore, and a double layer () representing the oxidation and reduction reactions of lithium ions, respectively, are disposed.
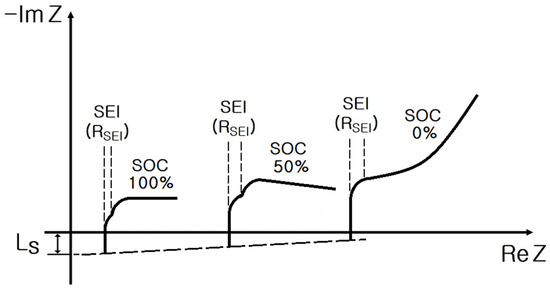
Figure 3.
Impedance spectrum in a cell according to the SoC.
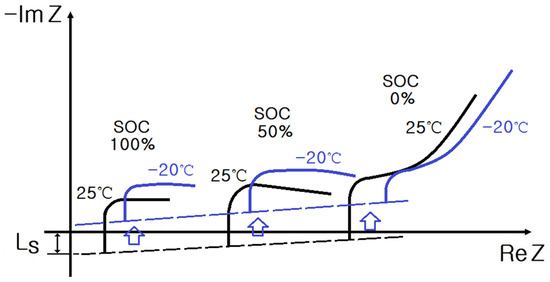
Figure 4.
Impedance spectrum of the ESS based on 16 cells according to the SoC.
Thus, in the complex plane, the impedance spectrum of a cylindrical lithium-ion battery exhibits small and large semicircles that are associated with the SEI and the oxidation and reduction of lithium ions, respectively.
However, at 0% SoC, the and corresponding to charge transfer stem from the SEI formed on the internal electrode of lithium-ion batteries, leading to the appearance of a small semicircle. Since the oxidation or reduction of lithium ions does not occur, no or double layer () is present.
As the temperature decreases below zero, and increase at 100% and 50% SoCs in ESSs, and the impedance spectrum shifts toward the imaginary axis. At 0% SoC, and increase and tends to increase with a 45° slope in the complex plane.
Figure 5 displays the electrical equivalent circuit of an ESS at SoC 100% and 50%, as follows: ––parallel connection of and –parallel connection of no and . The equivalent impedance of the ESS at 100% and 50% SoC is as follows:
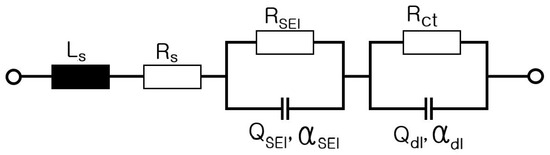
Figure 5.
Electrical equivalent circuit of the ESS at 100% SoC and 50% SoC.
Figure 6 exhibits the electrical equivalent circuit of an ESS at 0% SoC, as follows: ––parallel connection of and –. The equivalent impedance of the ESS at 0% SoC is as follows:
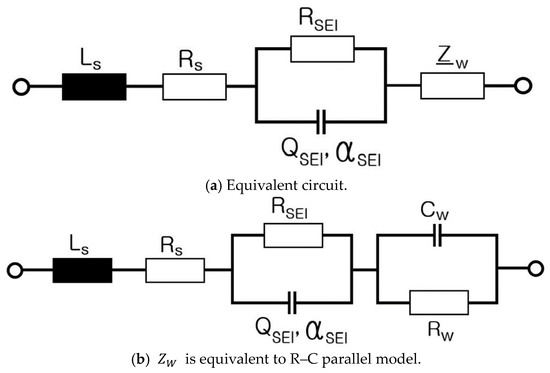
Figure 6.
Electrical equivalent circuit of an ESS at SoC 0%.
3. Experimental Equipment and Systems
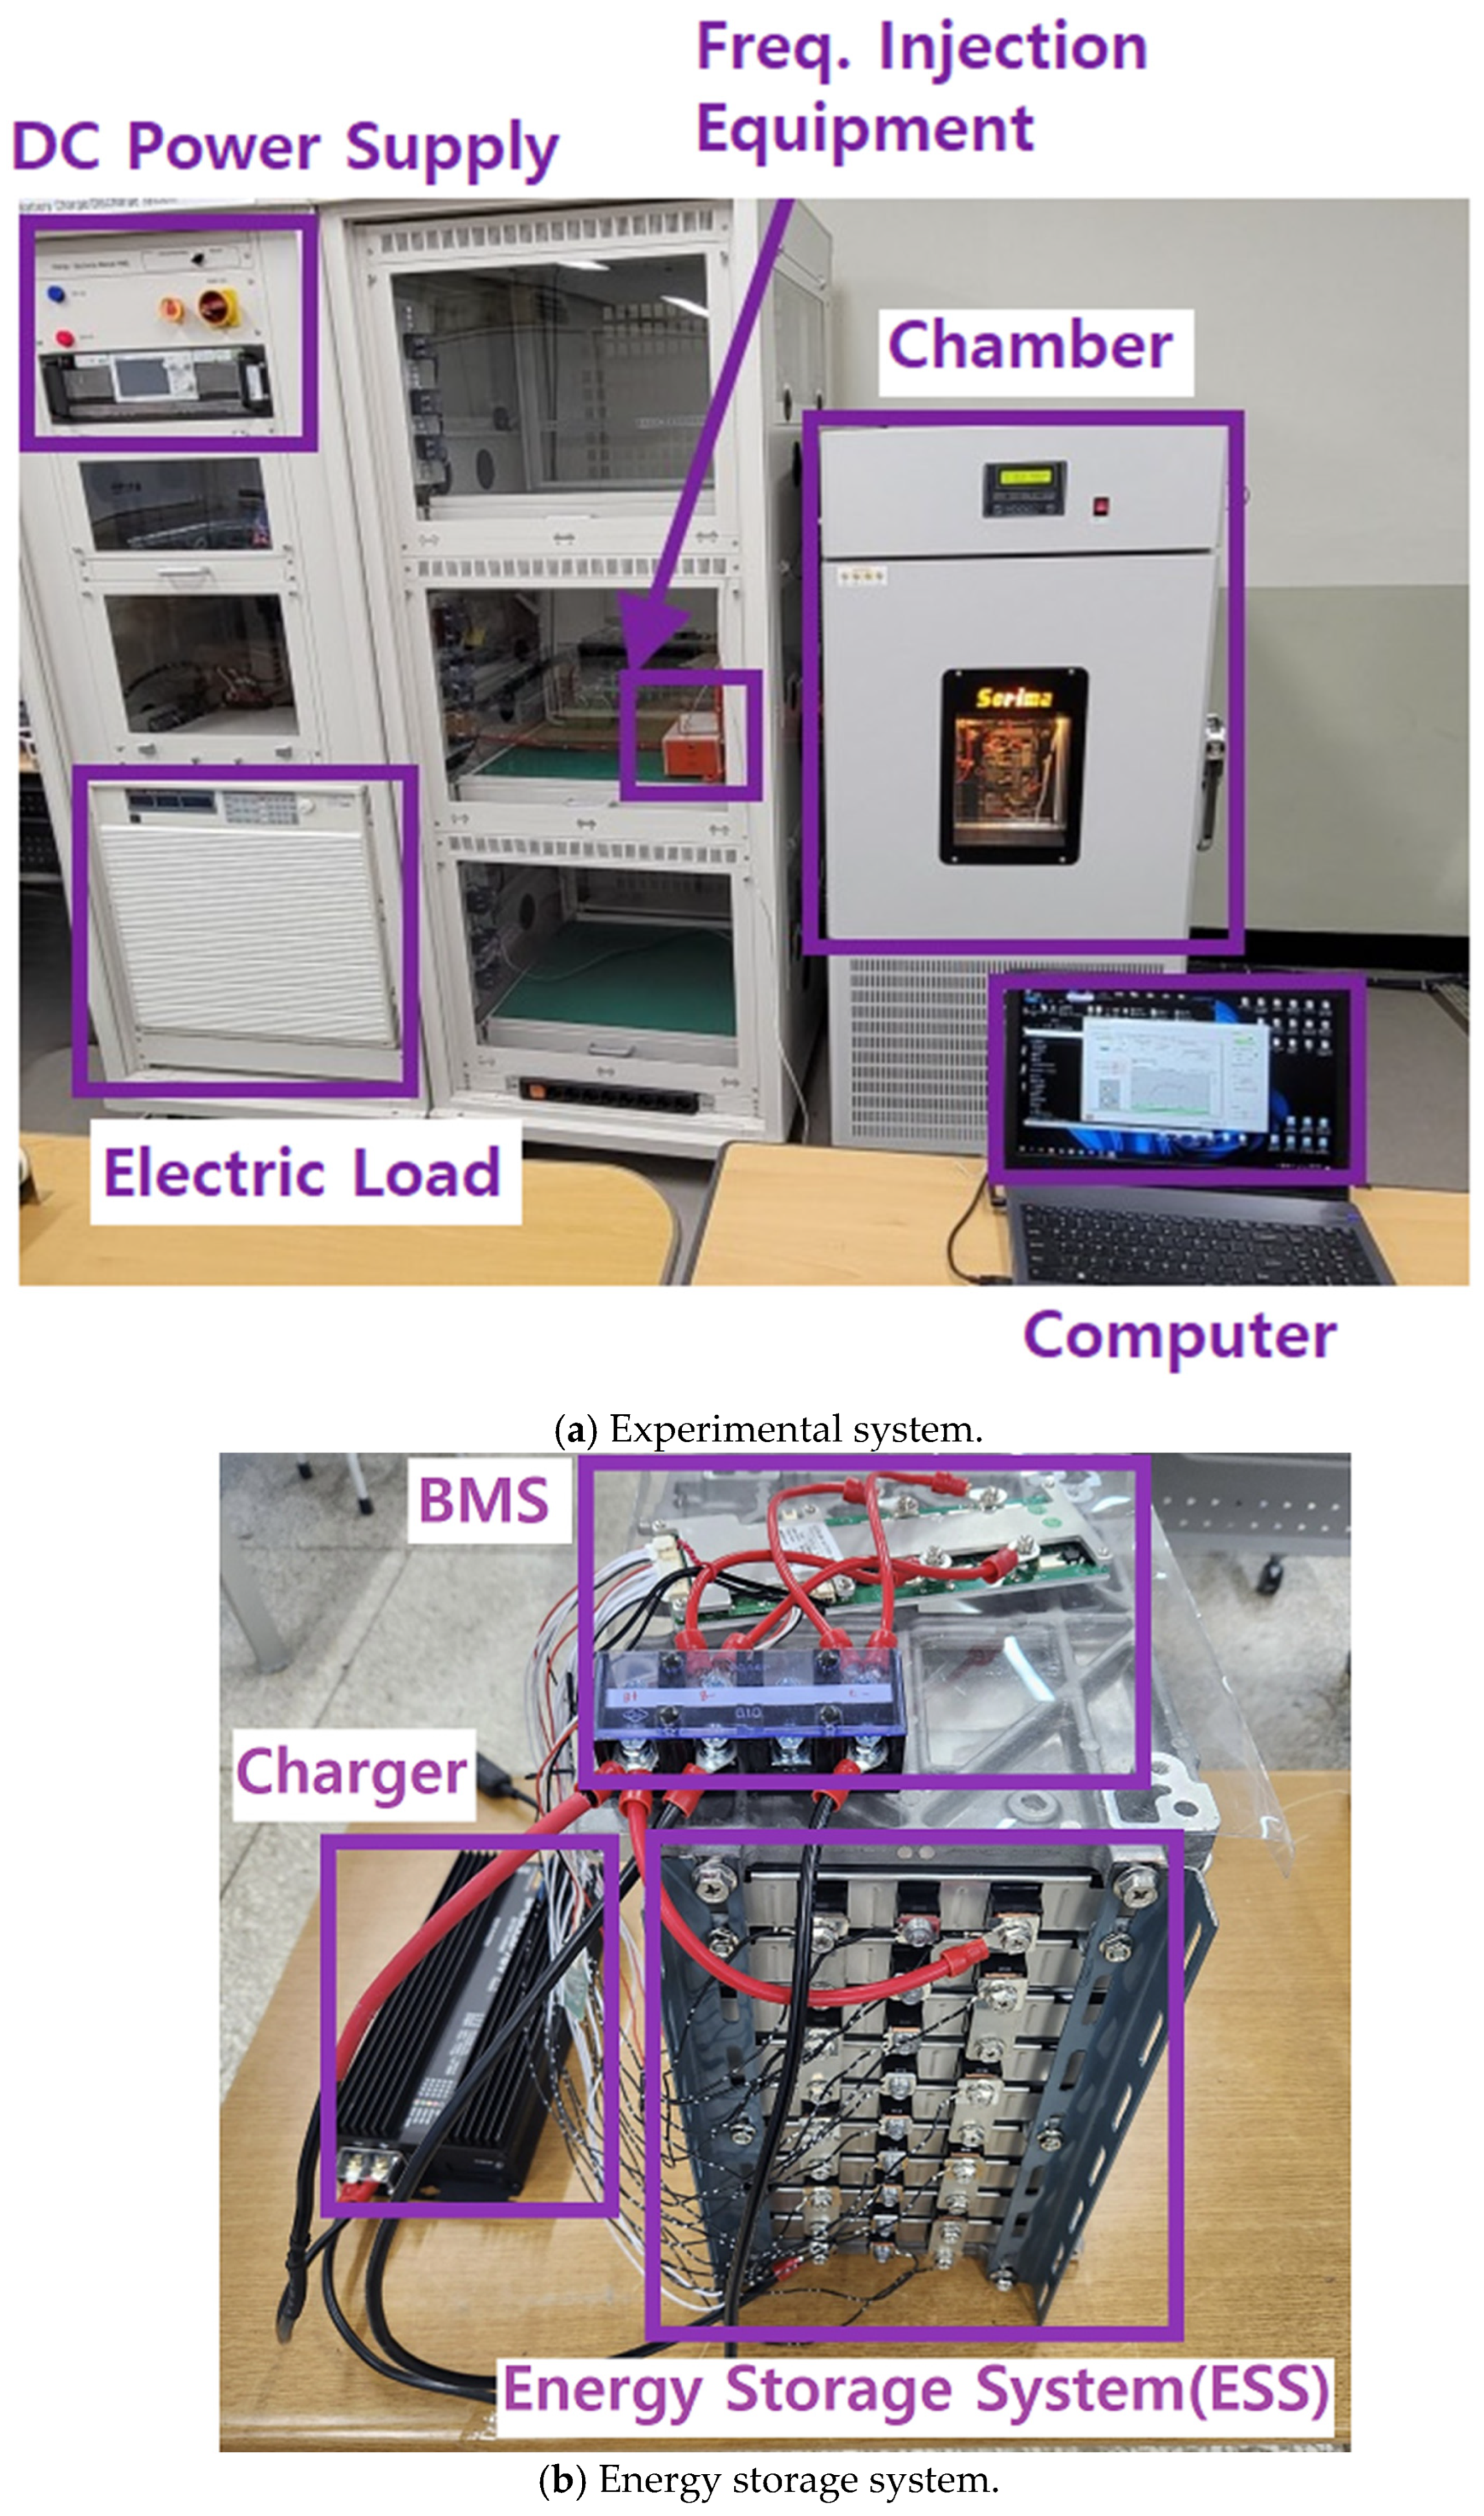
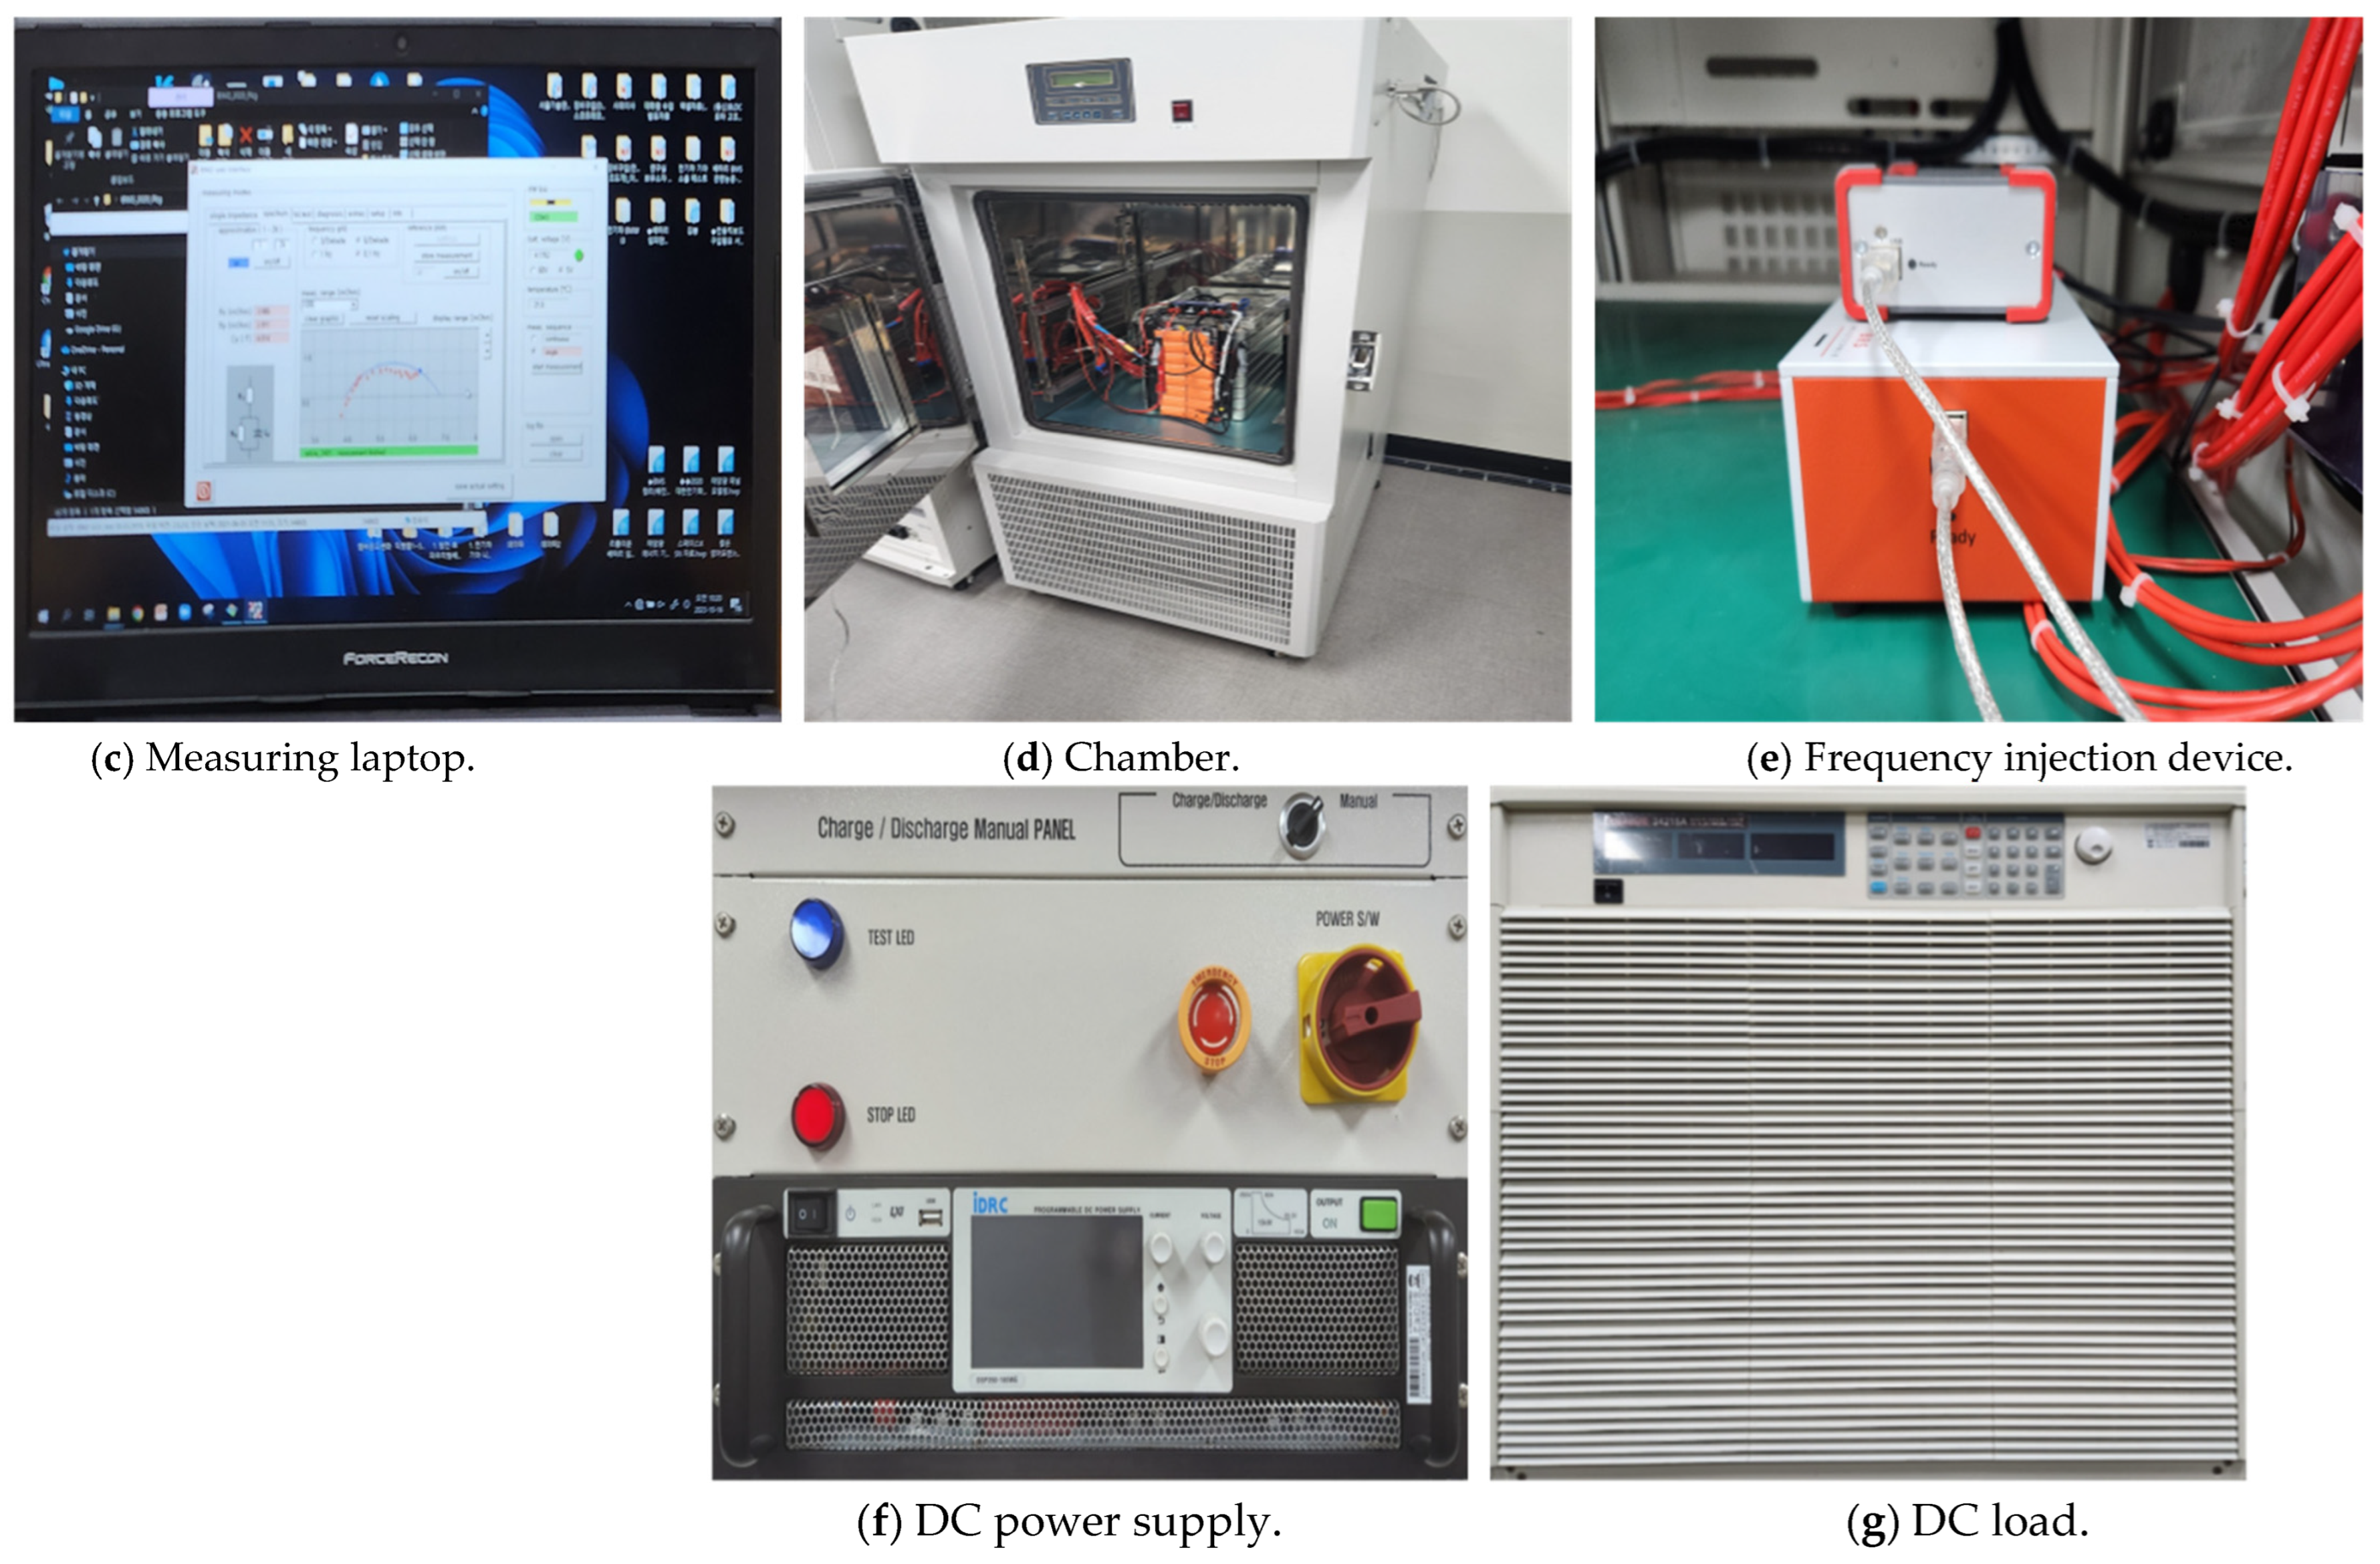
Figure 7 presents the experimental setup for measuring the ESS impedance.
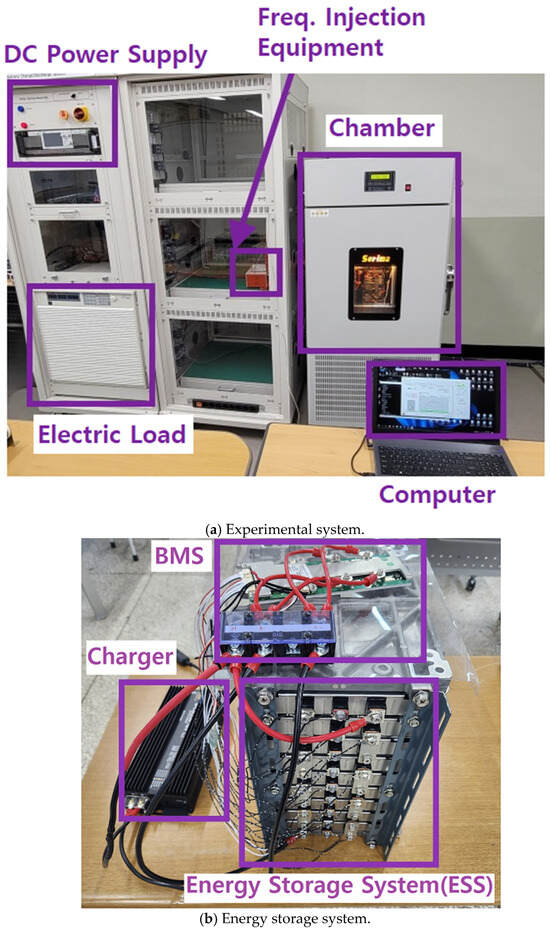

Figure 7.
Experimental apparatus for measuring the ESS impedance.
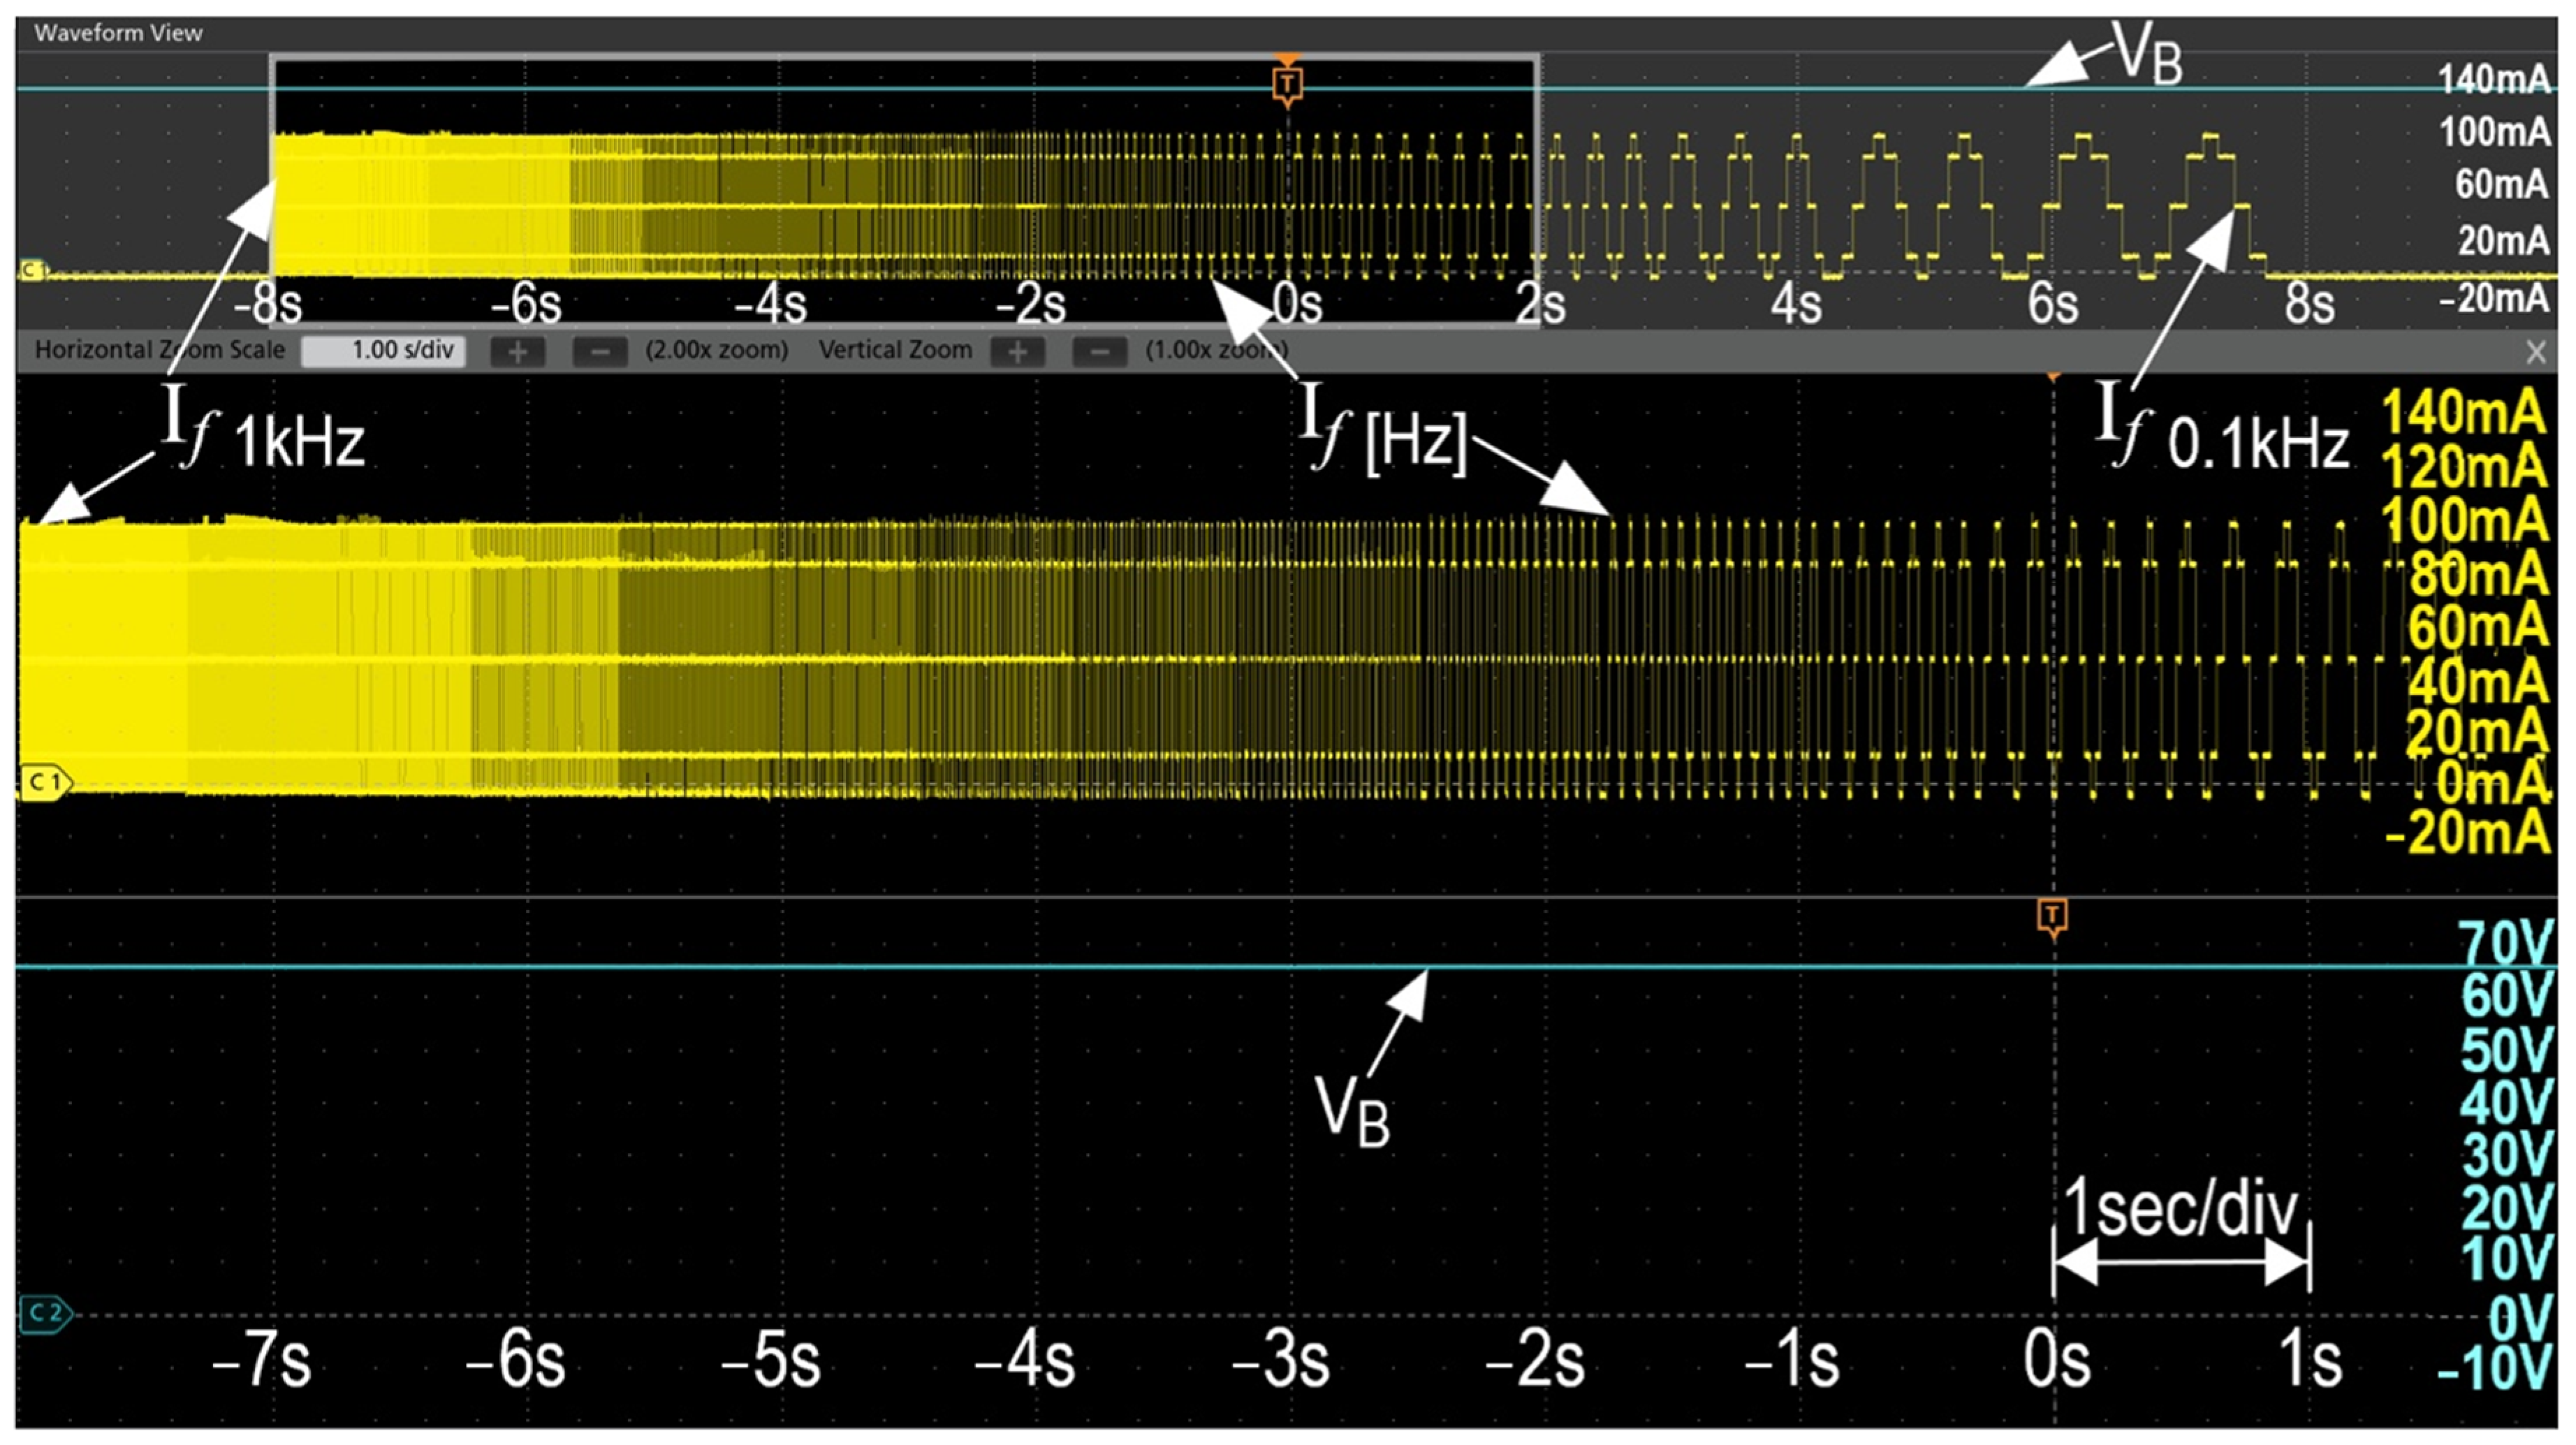
Figure 8 depicts the voltage and current waveforms obtained when measuring the impedance spectra. The measurements were performed using the battery measuring equipment of BRS Messtechnik GmbH (Stuttgart, Germany).

Figure 8.
Voltage and current waveforms when measuring the impedance spectrum.
The ESS’s lithium-ion battery was manufactured by LG Chem.
4. Impedance Characteristic Analysis of a Cell of a Pouch-Type Lithium-Ion Battery (75 Ah)
The characteristics of a single cell of the pouch-type lithium-ion battery (75 Ah) were analyzed.
The following parameter values were considered in the analysis:
- -
- SoC: 100%, 50%, and 0%;
- -
- Temperature: 40 °C, 25 °C, 10 °C, −5 °C, and −20 °C.
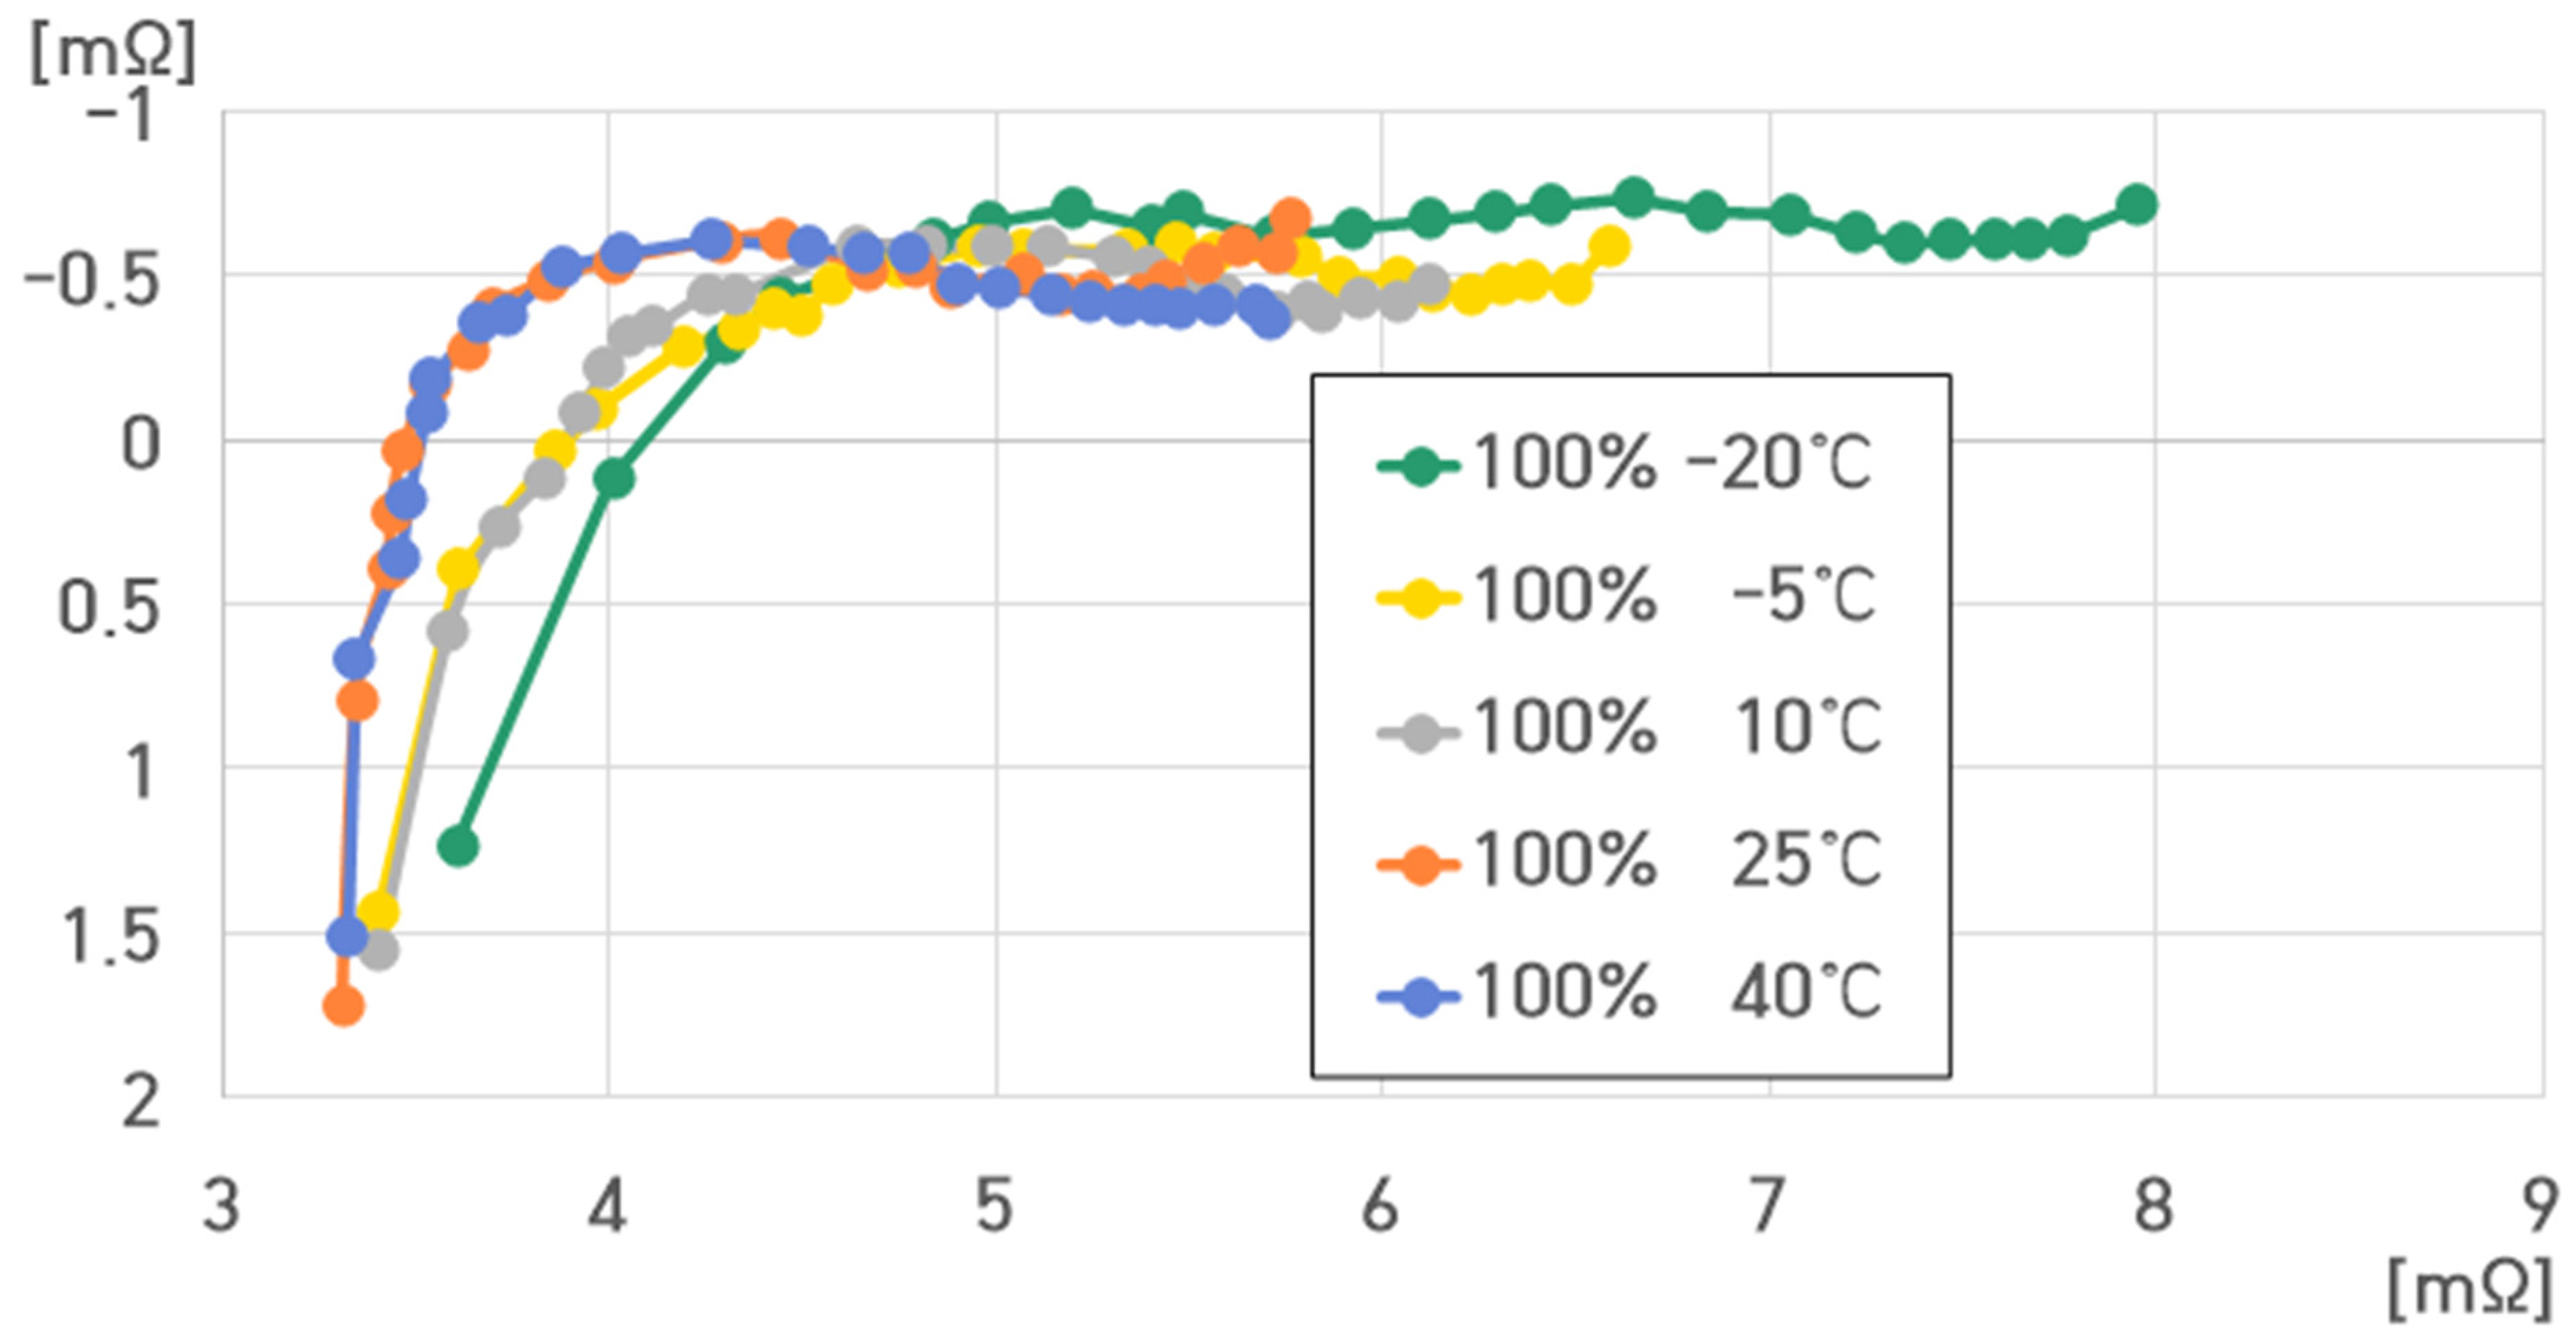
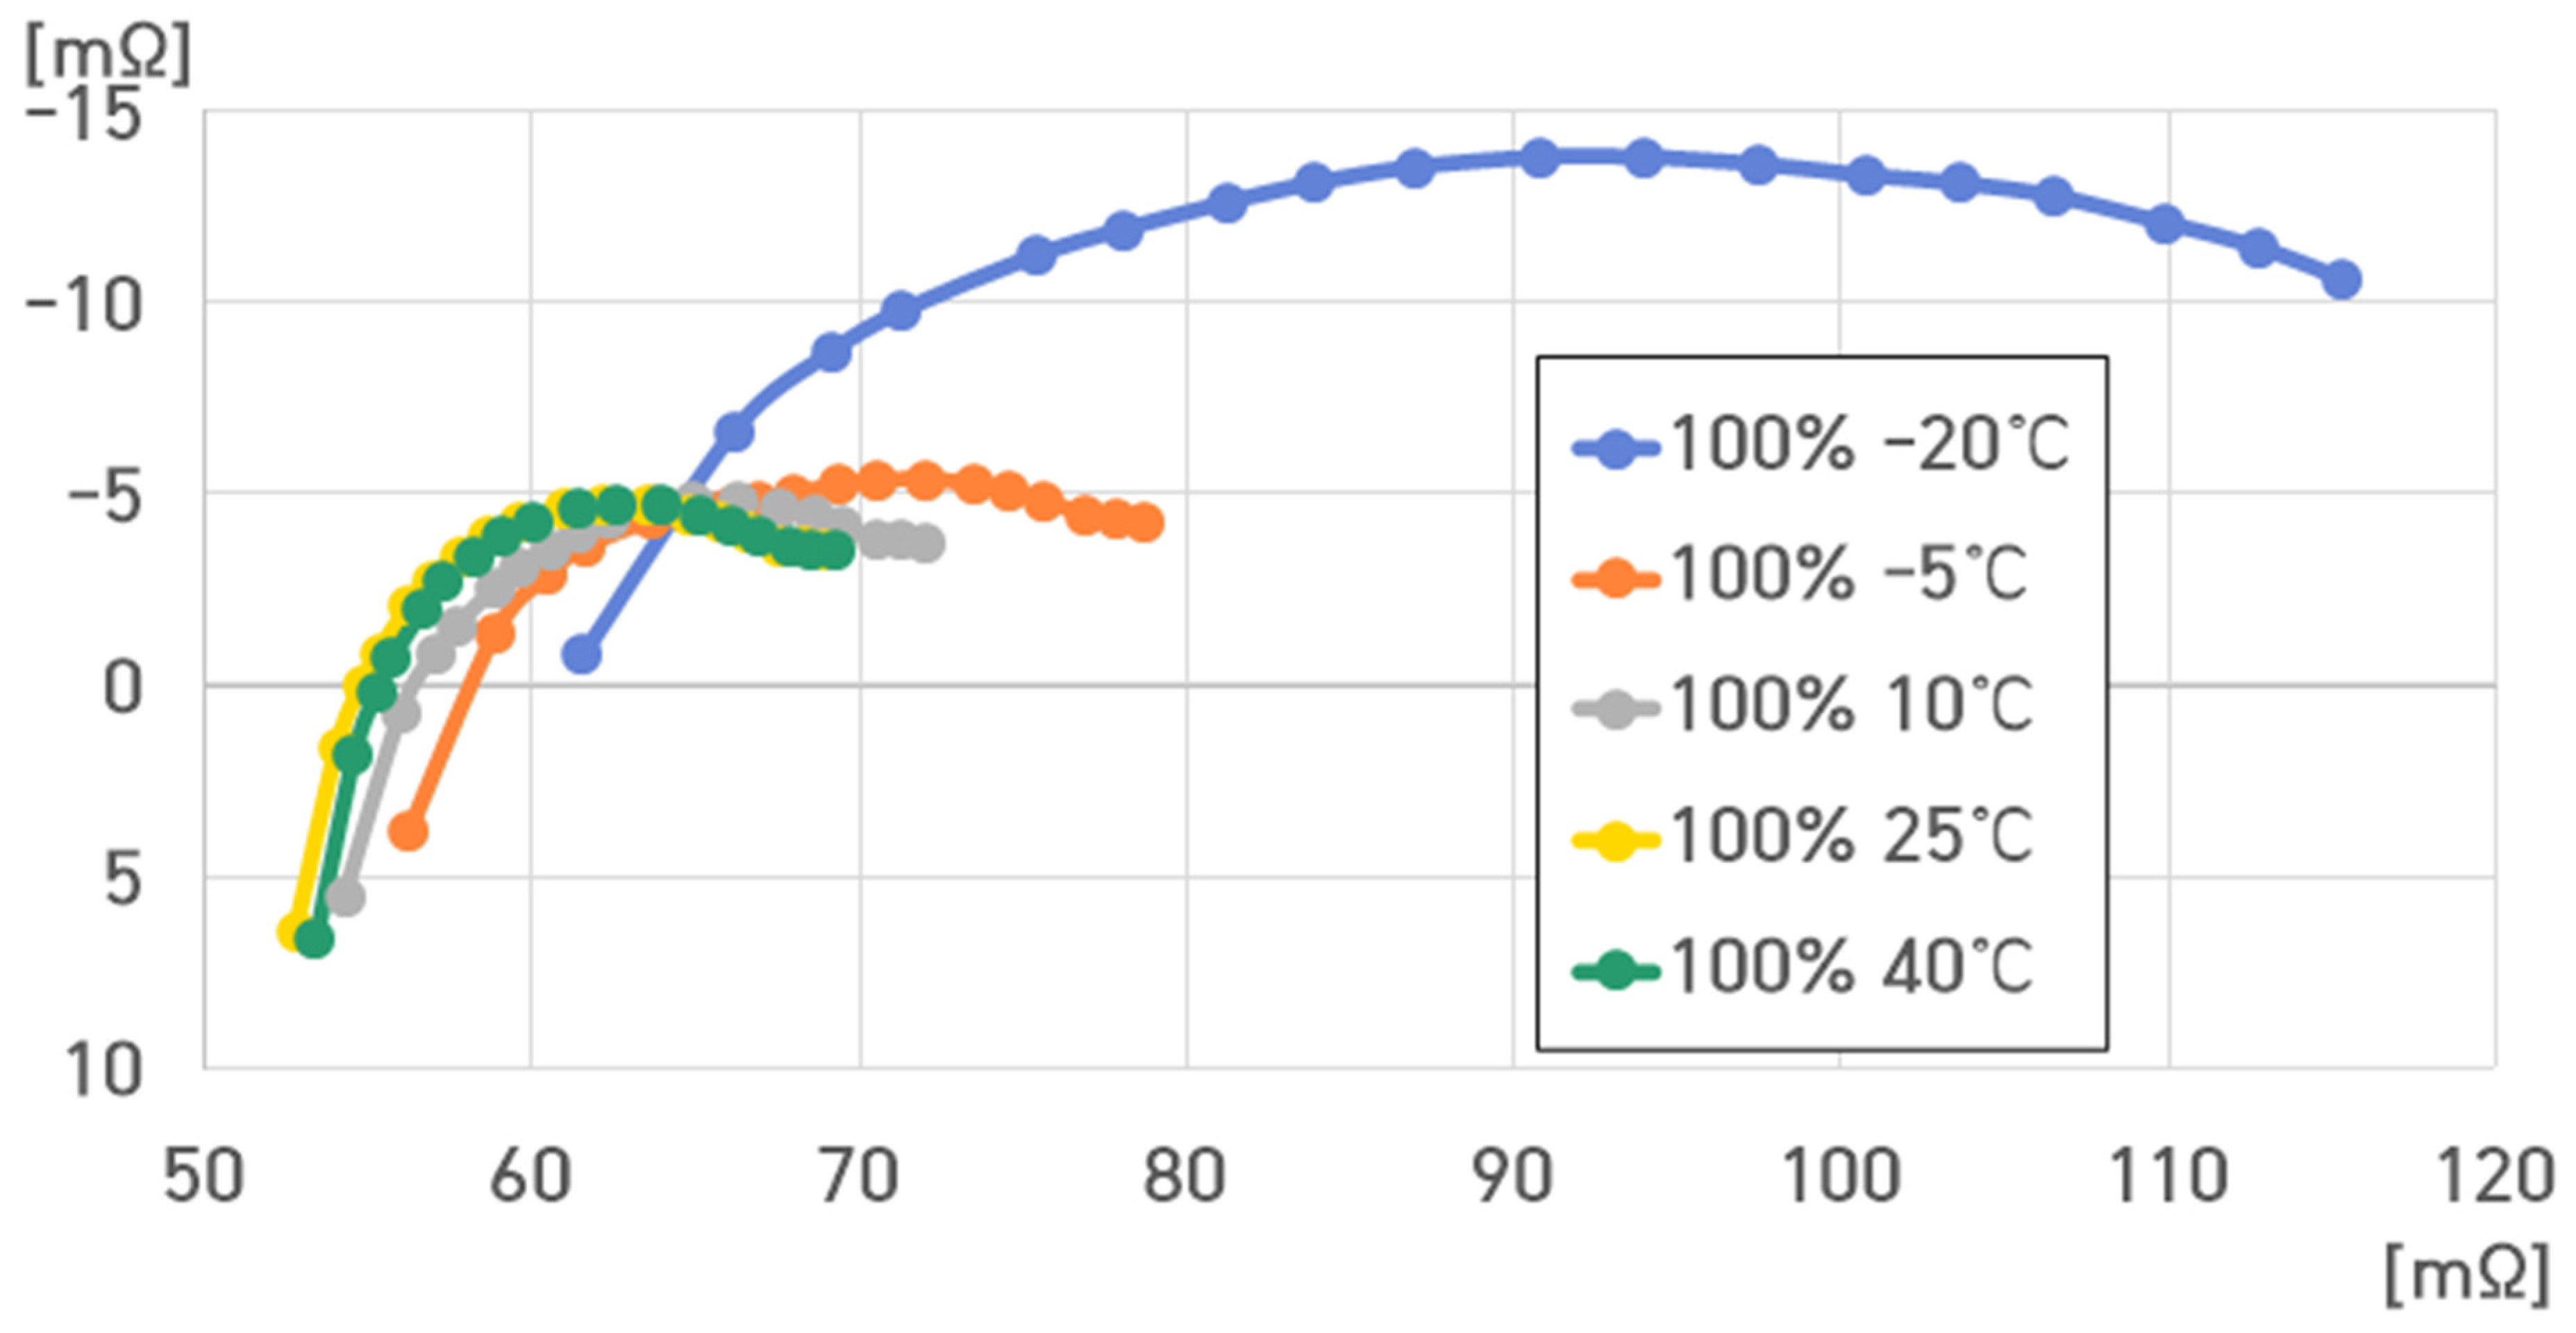
The cell voltage of the pouch-type lithium-ion battery (75 Ah) was 4.2 V at 100% SoC. Figure 9 presents the impedance spectrum measured for one cell of the pouch-type lithium-ion battery at 100% SoC under different temperatures.

Figure 9.
Impedance spectrum of a single cell of the pouch-type lithium-ion battery at 100% SoC under different temperatures.
In Figure 9, the resistance value of the pouch-type lithium-ion battery (75 Ah) at 100% SoC ranges from 3.3083 to 7.9493 mΩ.
At 100% SoC, , , parallel capacitor (), and were as follows:
- (1)
- 100% SoC, 40 °C: , , , ;
- (2)
- 100% SoC, 25 °C: , , , ;
- (3)
- 100% SoC, 10 °C: , , , ;
- (4)
- 100% SoC, −5 °C: , , , ;
- (5)
- 100% SoC, −20 °C: , , , .
In Figure 9, , , , and decreased with increasing and decreasing temperatures.
Particularly, at −20 °C, , , , and rapidly increased, implying that the battery performance rapidly worsened at temperatures below −10 °C.
At 100% SoC, was barely observed, but it appeared at the measurement frequency of around 0 Hz.
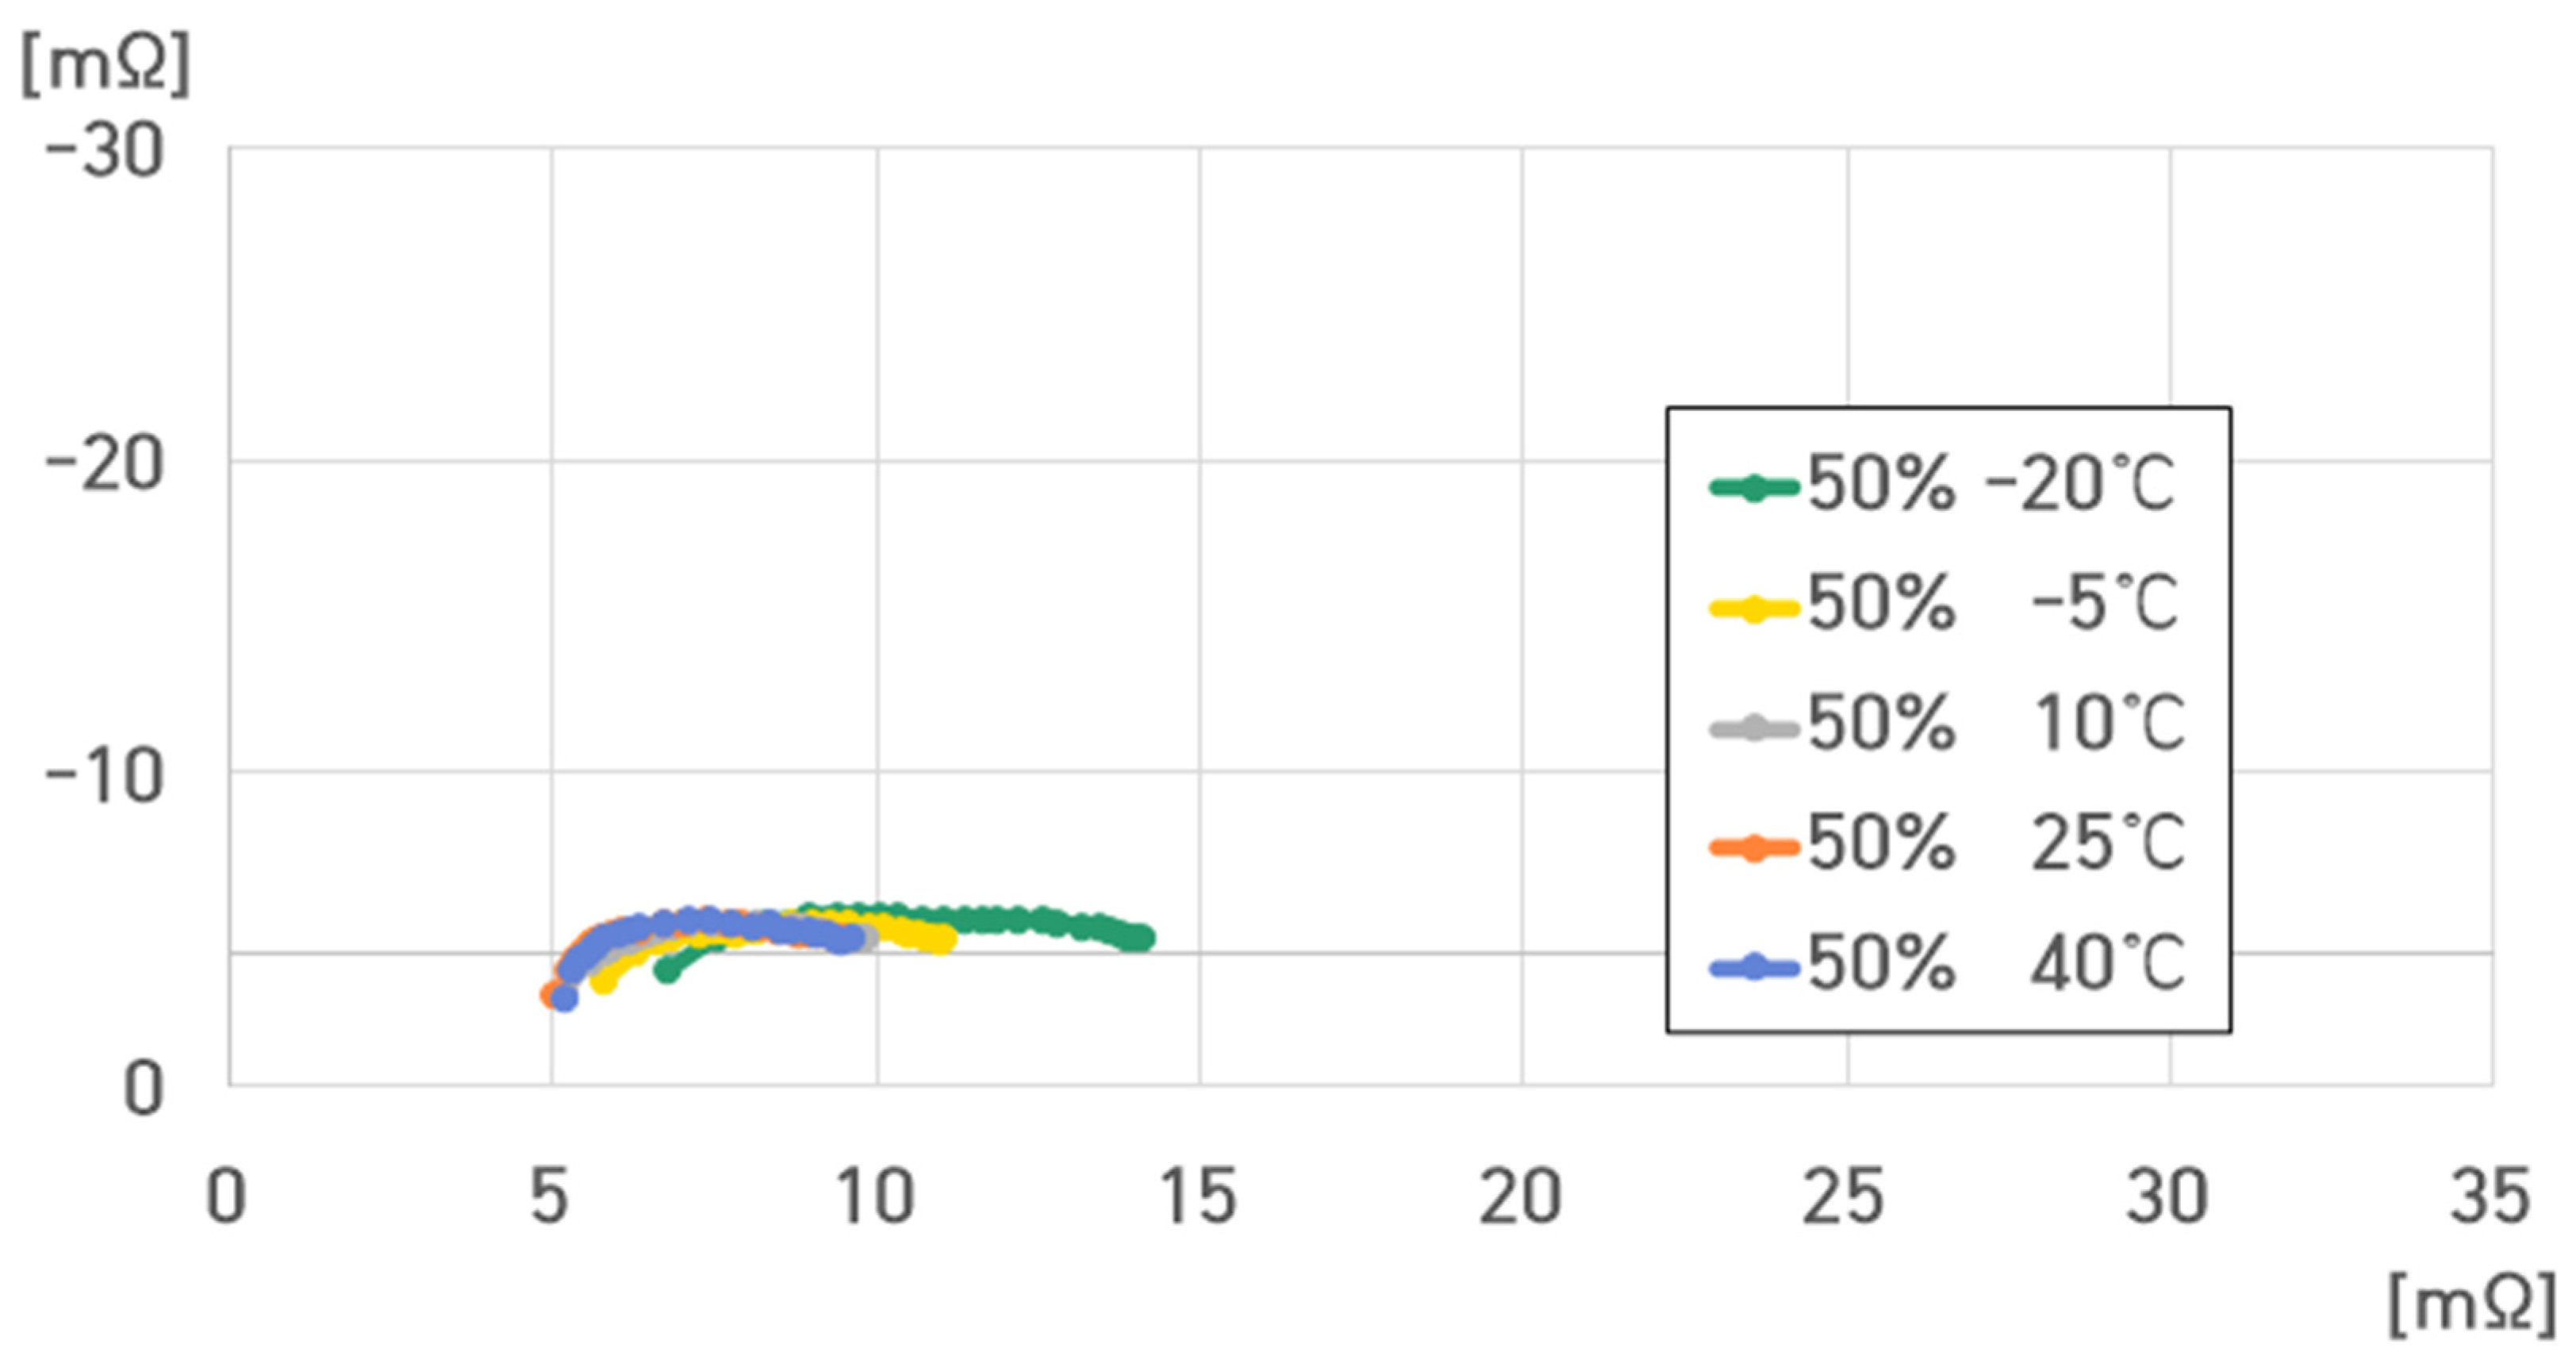
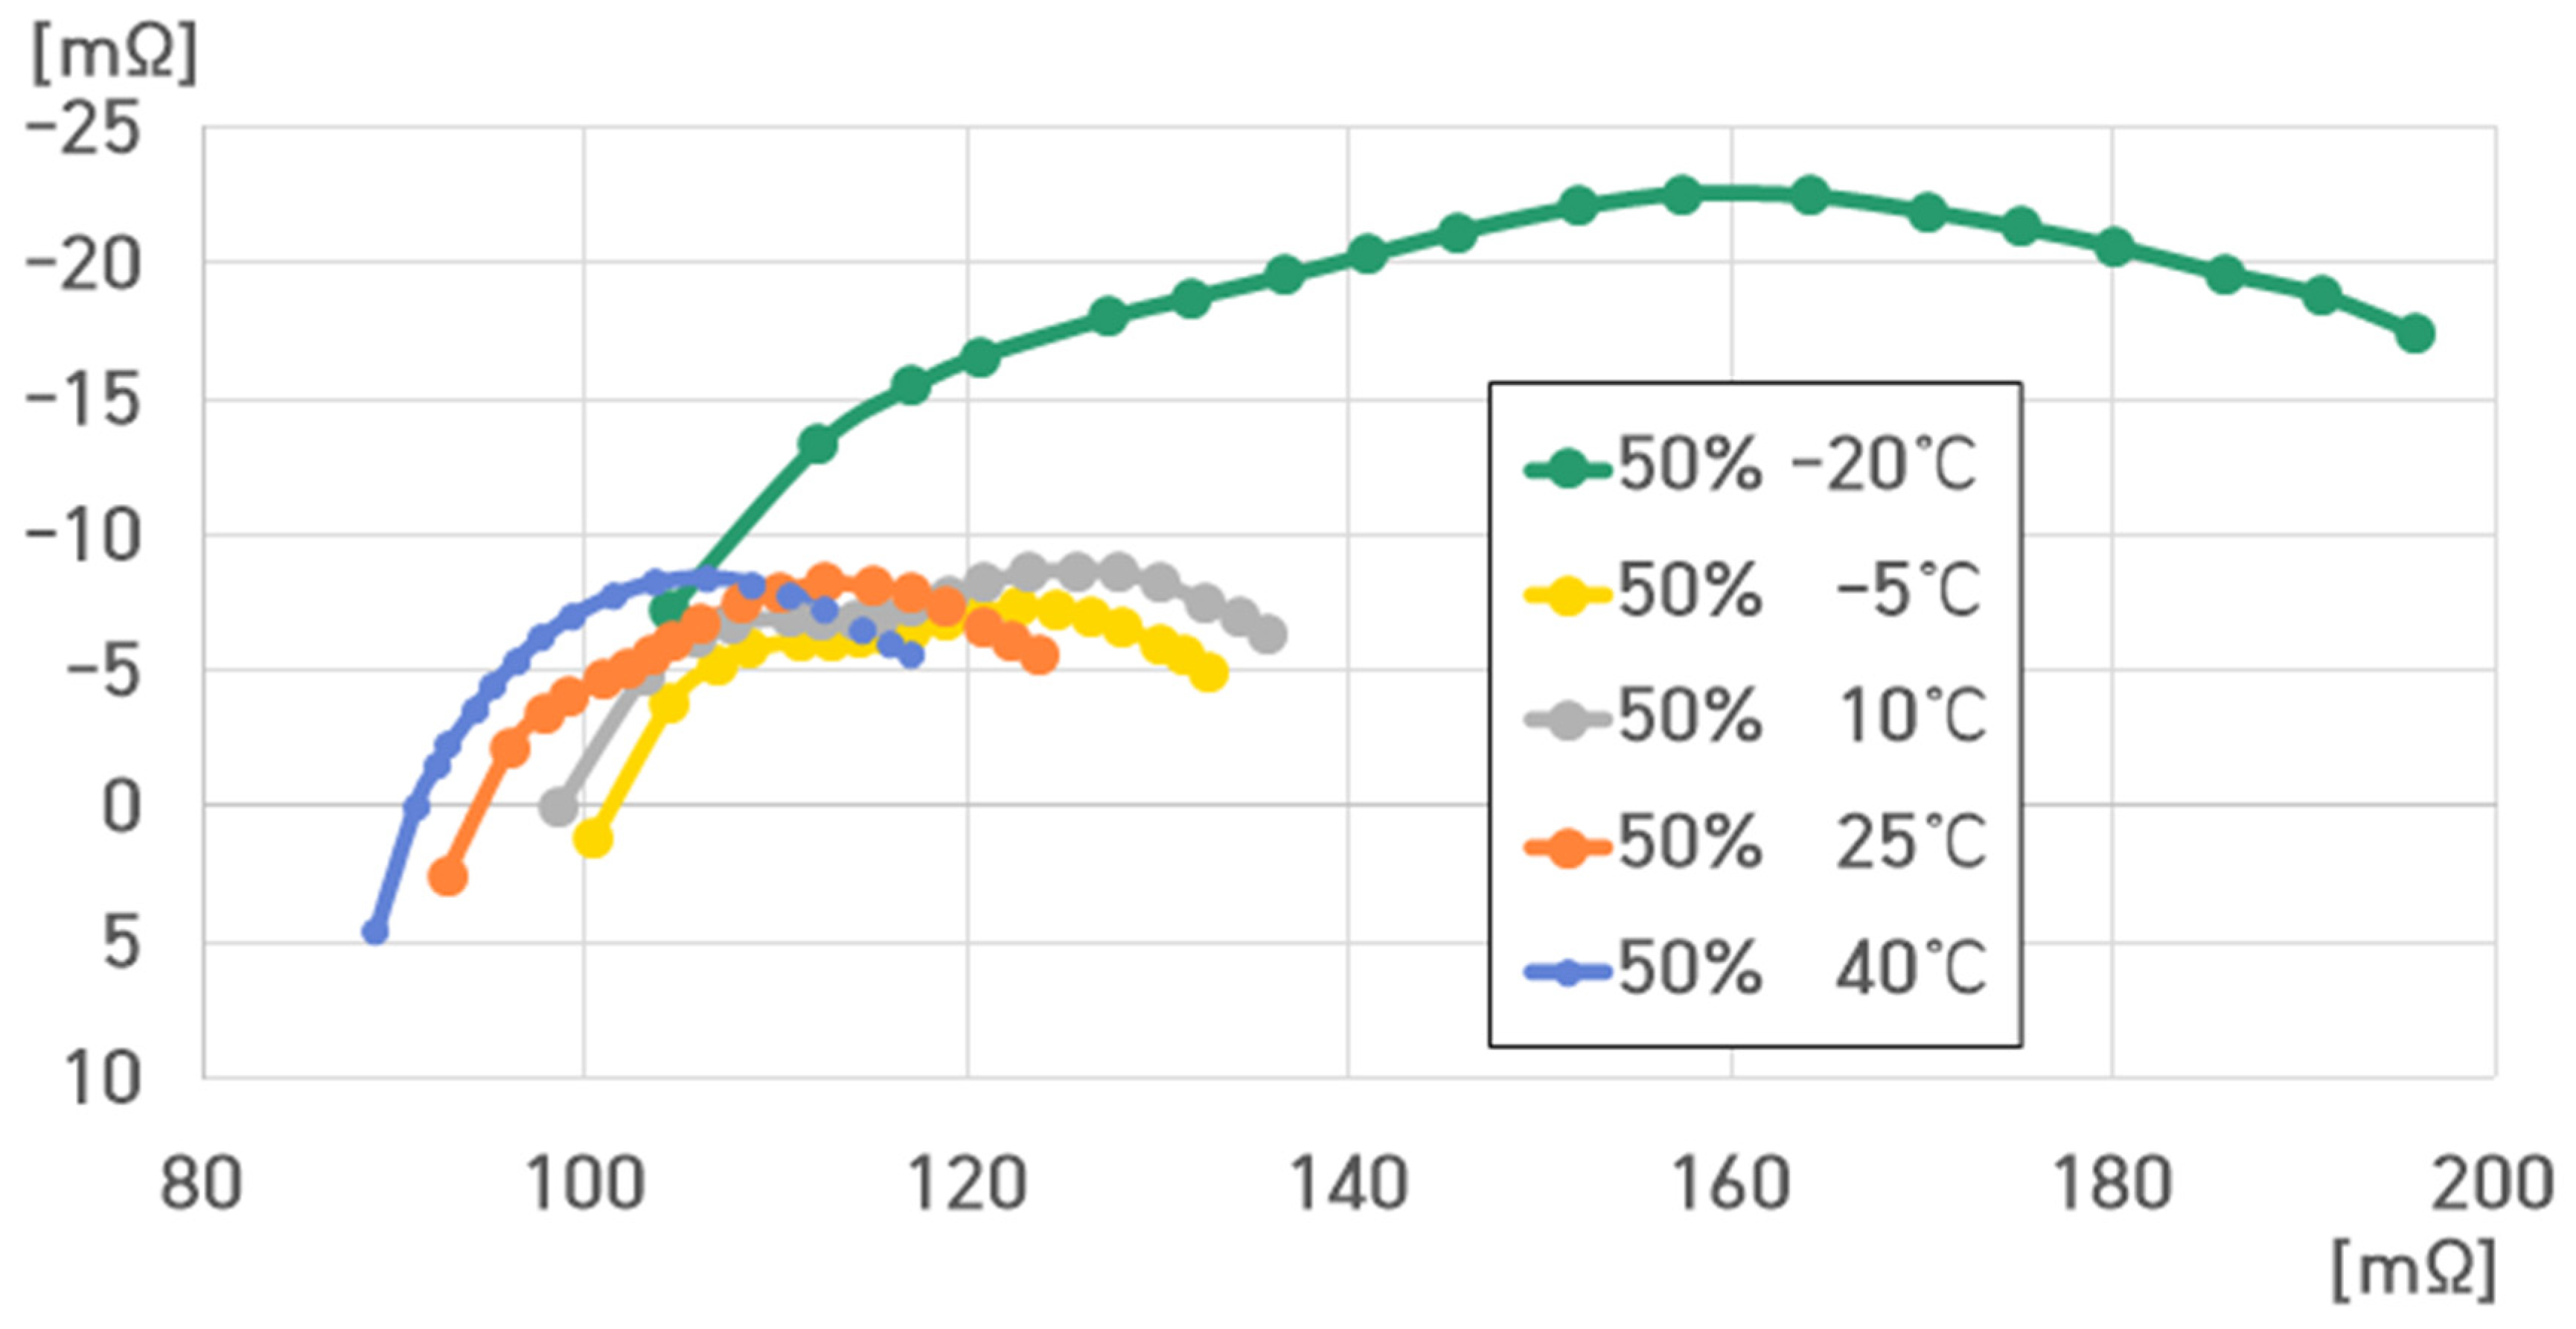
The cell voltage of the pouch-type lithium-ion battery (75 Ah) at 50% SoC was 3.65 V. Figure 10 exhibits the impedance spectrum measured for a single cell of the pouch-type lithium-ion battery at 50% SoC under varying temperatures.
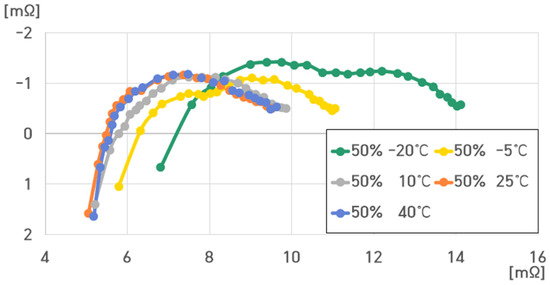
Figure 10.
Impedance spectrum of a single cell of the pouch-type lithium-ion battery at 50% SoC under different temperatures.
The resistance of the pouch-type lithium-ion battery (75 Ah) at 50% SoC ranged from 5.1717 to 14.1187 mΩ.
At 50% SoC, , , , and were as follows.
- (1)
- 50% SoC, 40 °C: , , , ;
- (2)
- 50% SoC, 25 °C: , , , ;
- (3)
- 50% SoC, 10 °C: , , , ;
- (4)
- 50% SoC, −5 °C: , , , ;
- (5)
- 50% SoC, −20 °C: , , , .
As depicted in Figure 10, , , and decreased with increasing and decreasing temperatures. An analysis showed that it was increasing. was the largest at 10 °C, and it sharply decreased at −20 °C.
Unlike the experimental results at 100% SoC, when the temperature decreased to −20 °C at 50% SoC, and increased, while rapidly decreased. This resulted in the semicircle shape of the impedance spectrum (Figure 10). At 50% SoC, similar to the 100% SoC case, almost did not appear, and it appeared near the measurement frequency of 0 Hz.
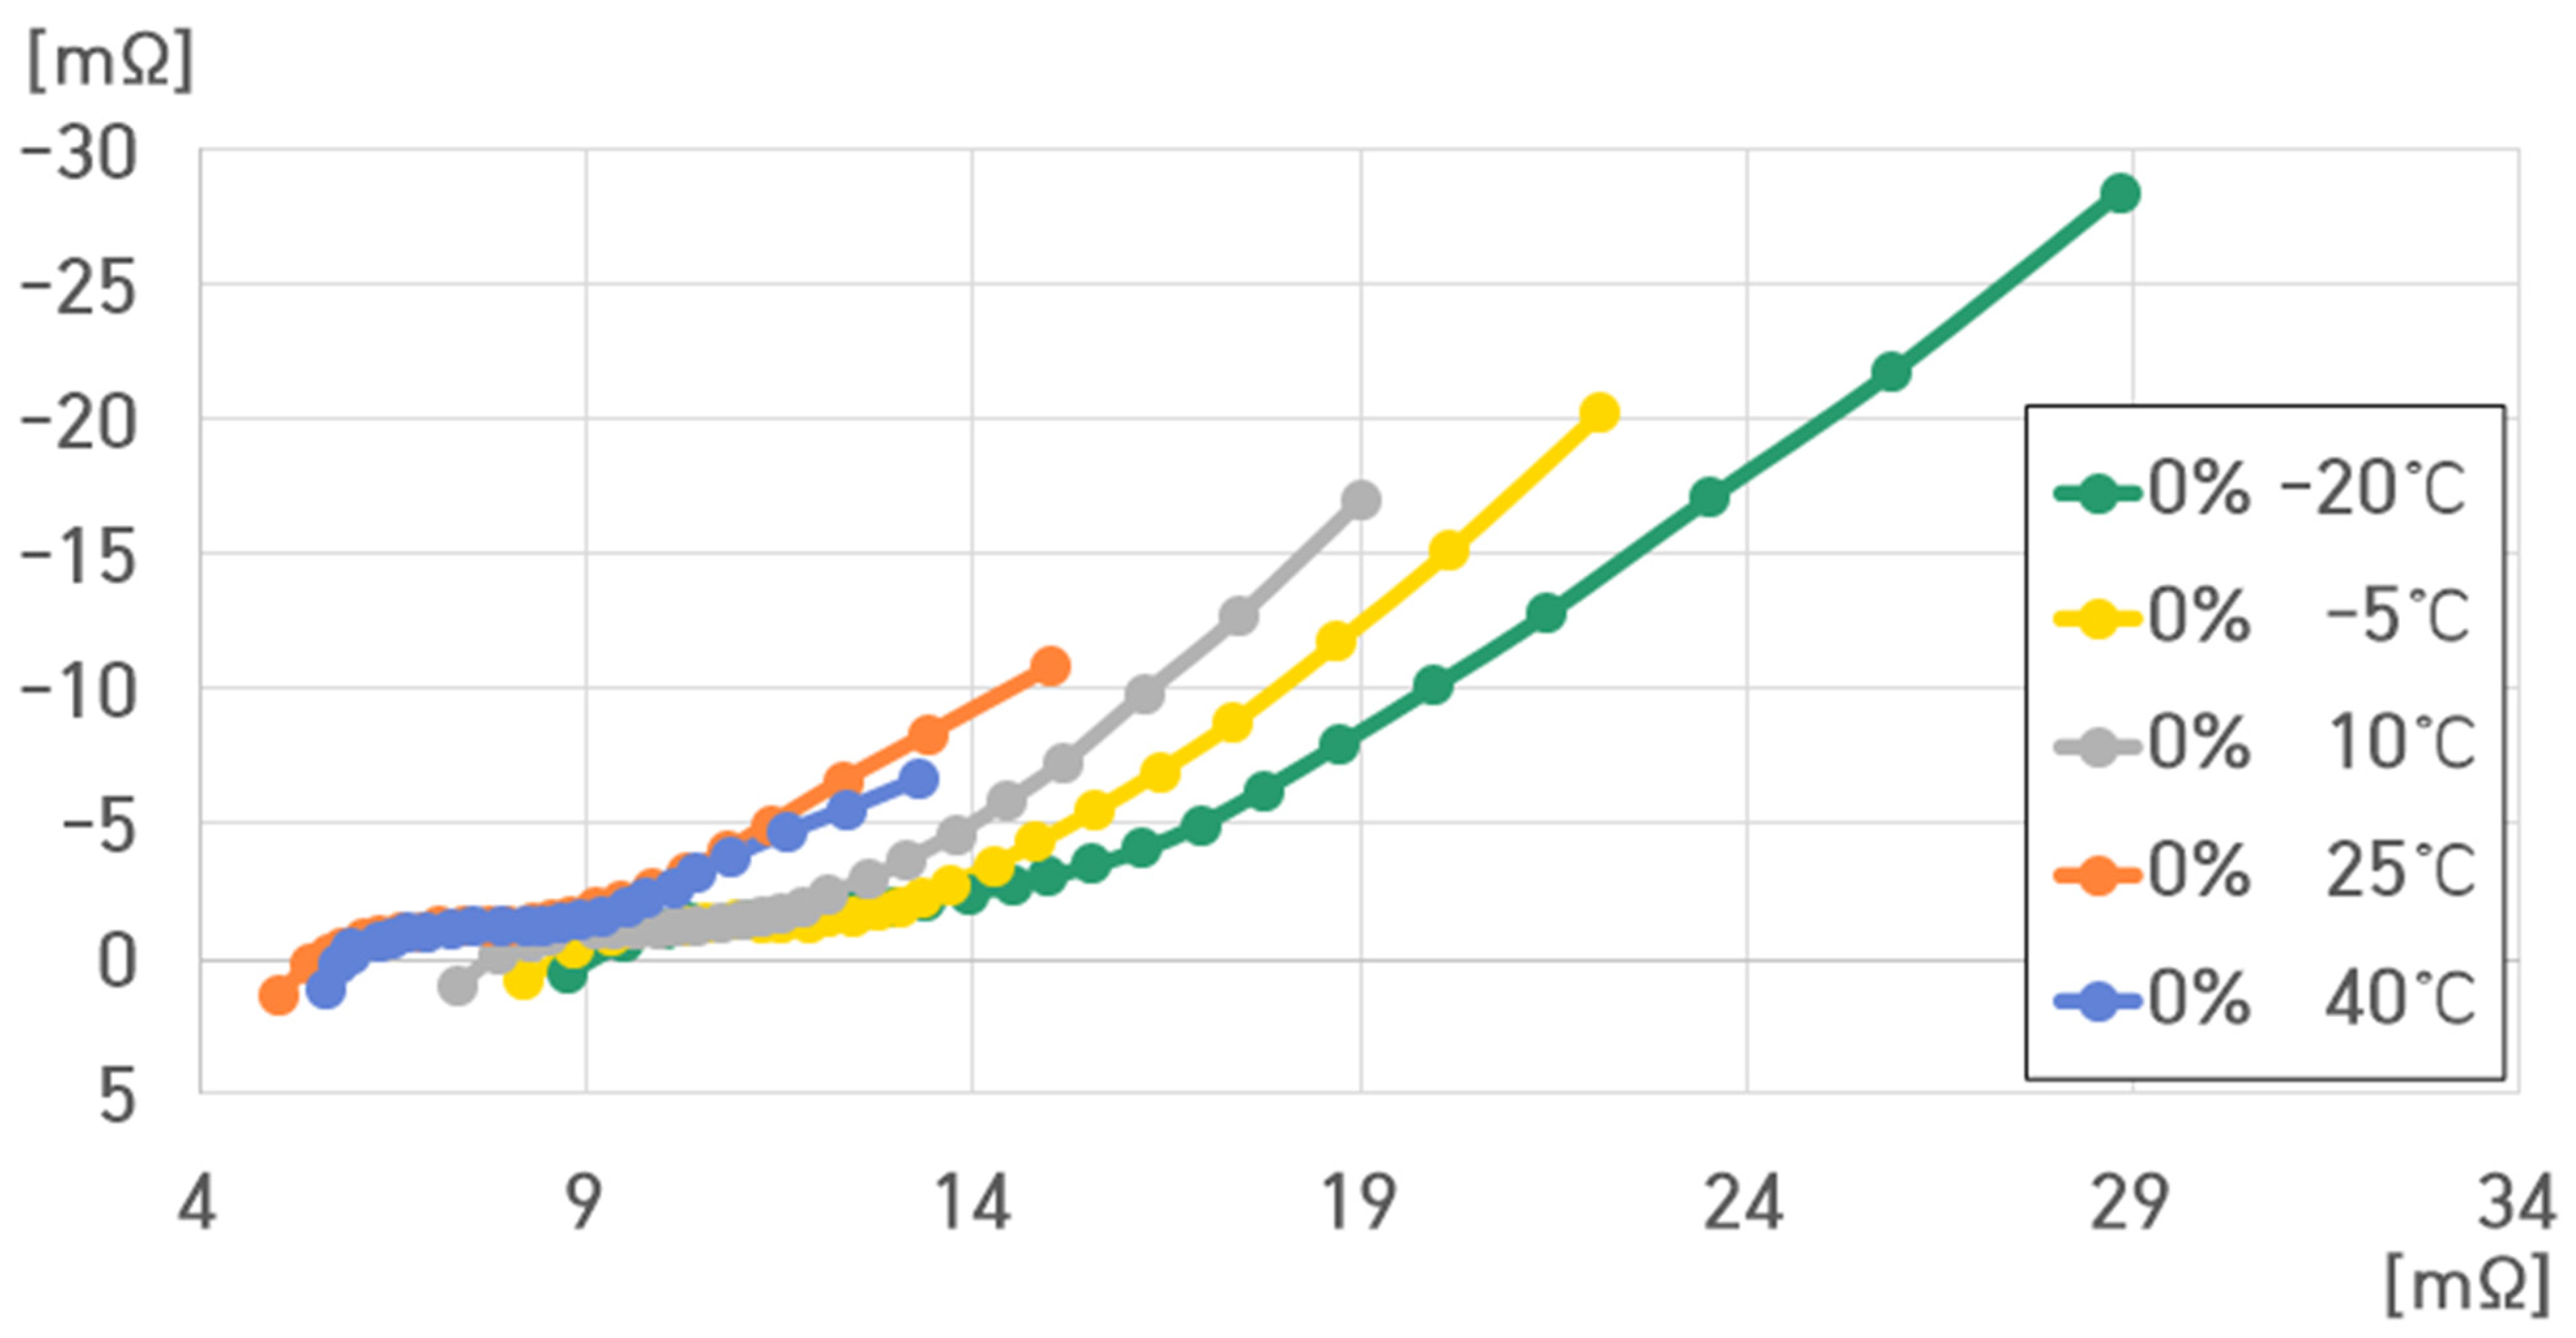
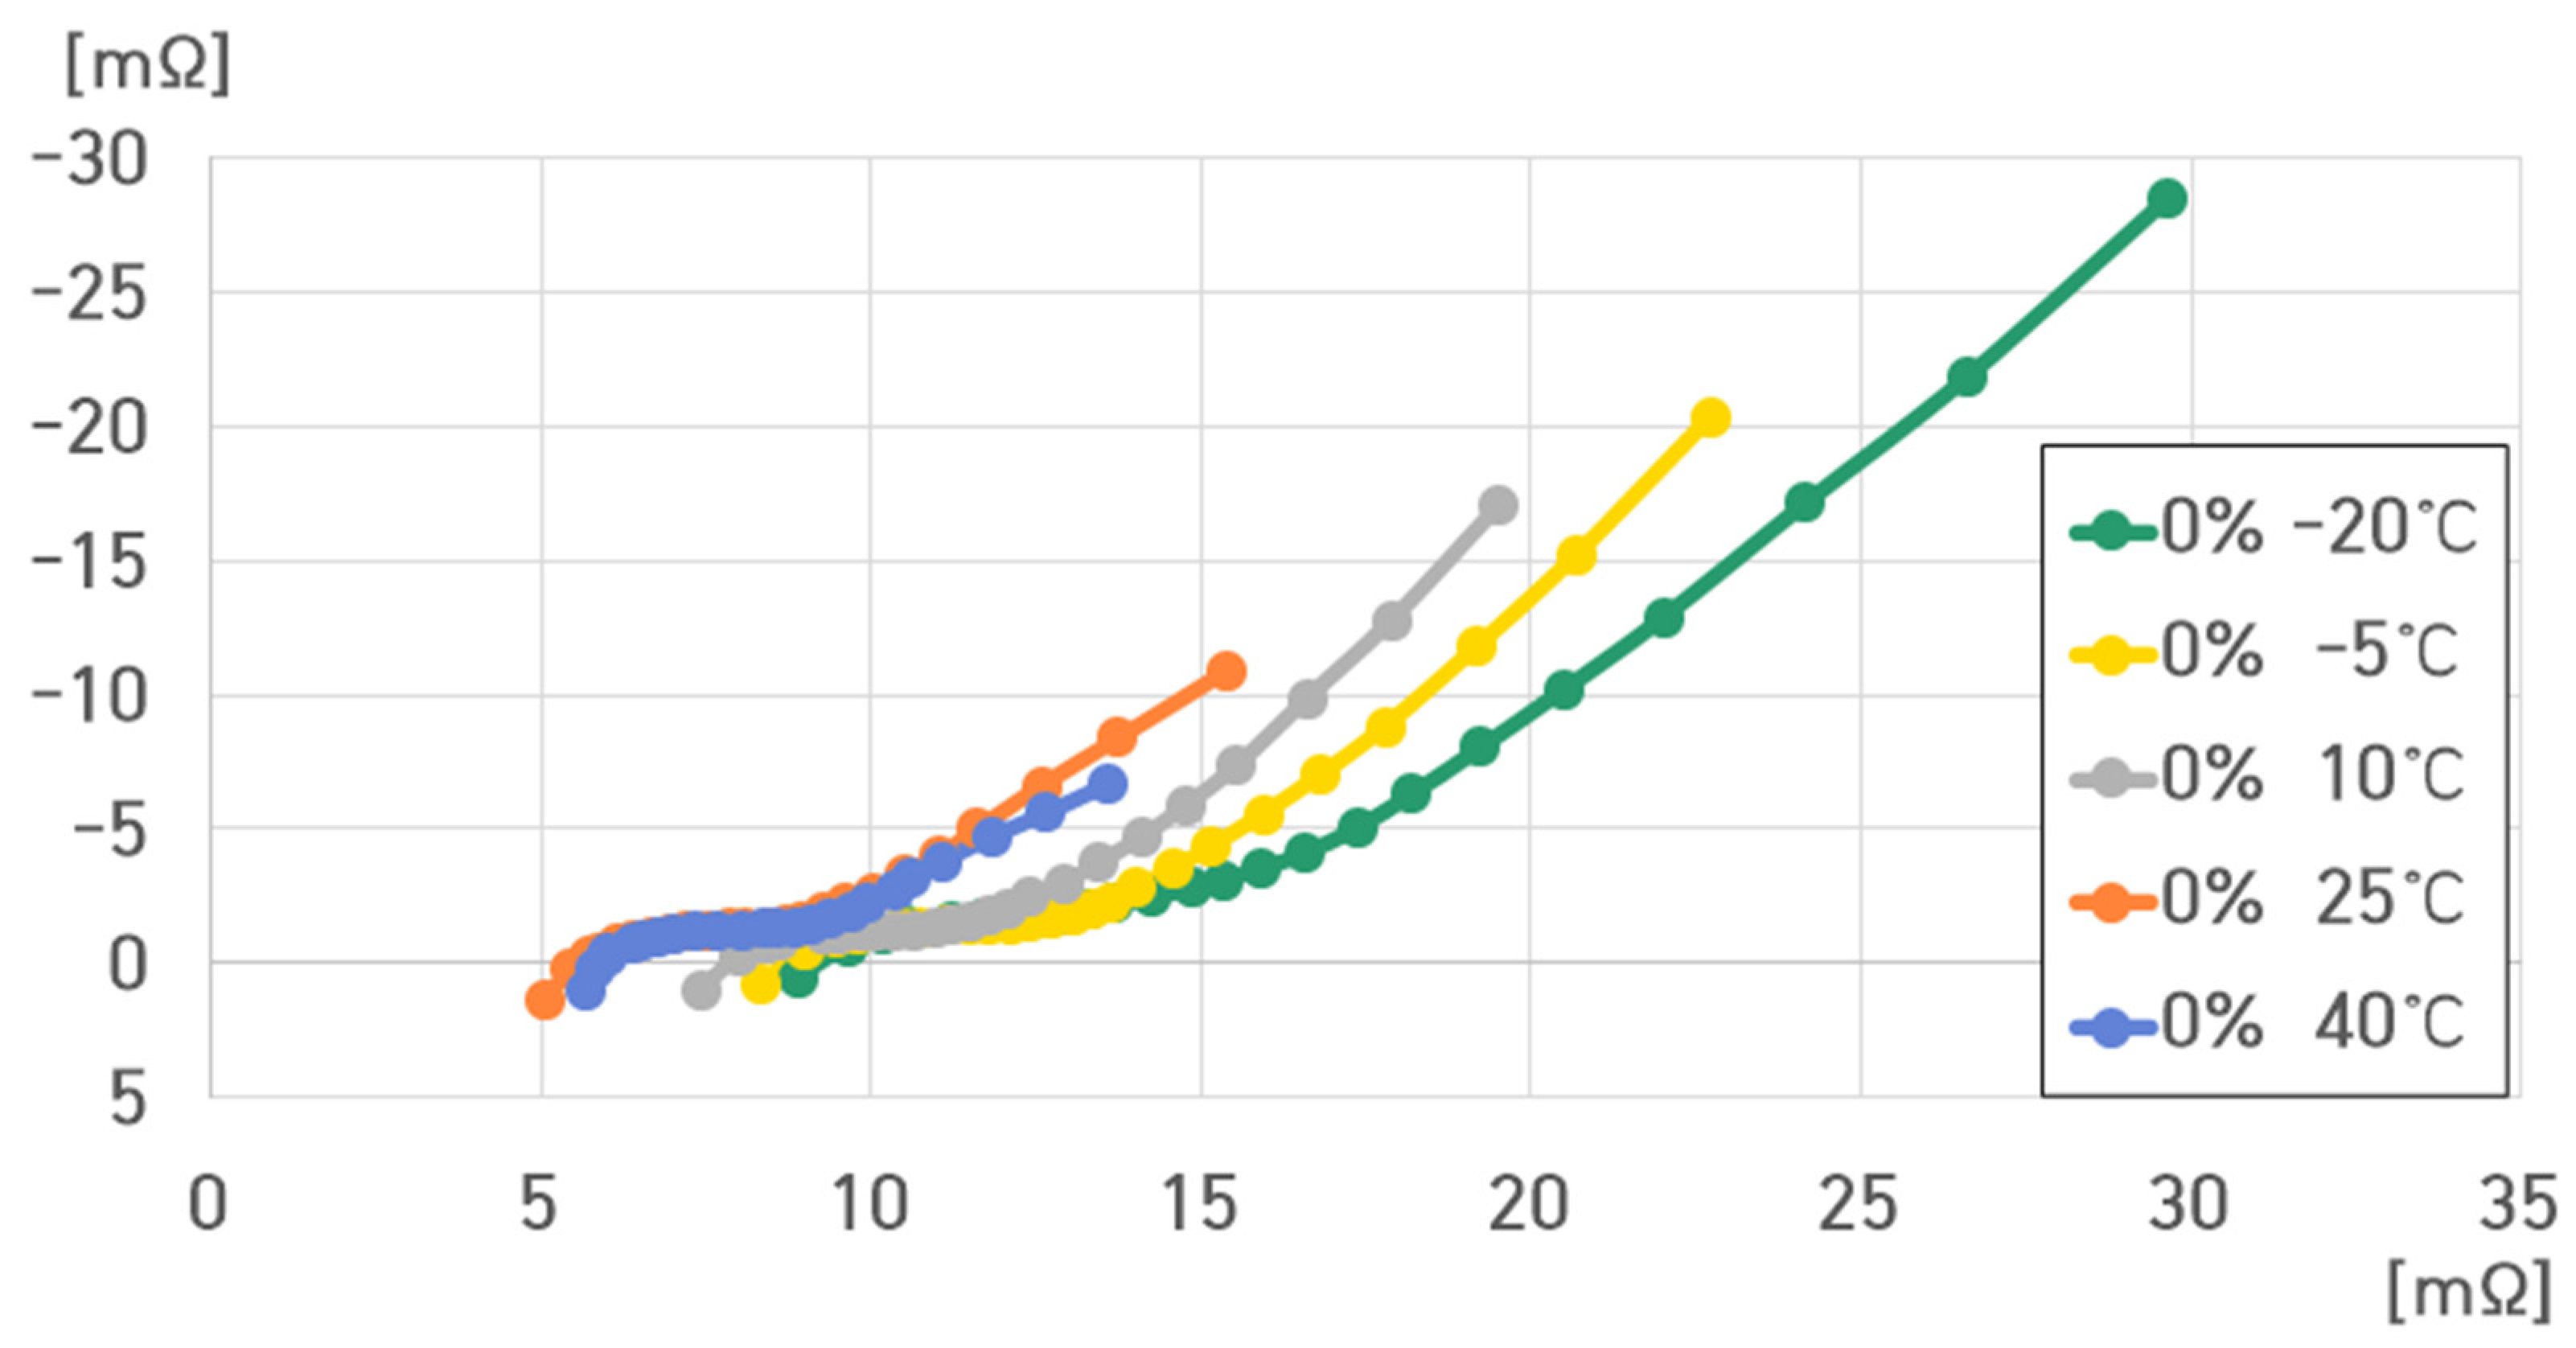
The cell voltage of the pouch-type lithium-ion battery (75 Ah) was 2.5 V at 0% SoC. Figure 11 depicts the impedance spectrum measured for a single cell of the pouch-type lithium-ion battery at 50% SoC under varying temperatures.

Figure 11.
Impedance spectrum of a single cell of the pouch-type lithium-ion battery at 0% SoC under different temperatures.
The battery resistance at 0% SoC ranged from 5.6889 to 29.6618 mΩ.
- (1)
- 0% SoC, 40 °C: , , , ;
- (2)
- 0% SoC, 25 °C: , , , ;
- (3)
- 0% SoC, 10 °C: , , , ;
- (4)
- 0% SoC, −5 °C: , , , ;
- (5)
- 0% SoC, −20 °C: , , , .
, , , and decreased with increasing temperature, while , , and decreased and increased with decreasing temperature.
However, at 0% SoC, increased relatively rapidly compared to that at 100% and 50% SoC. increased with .
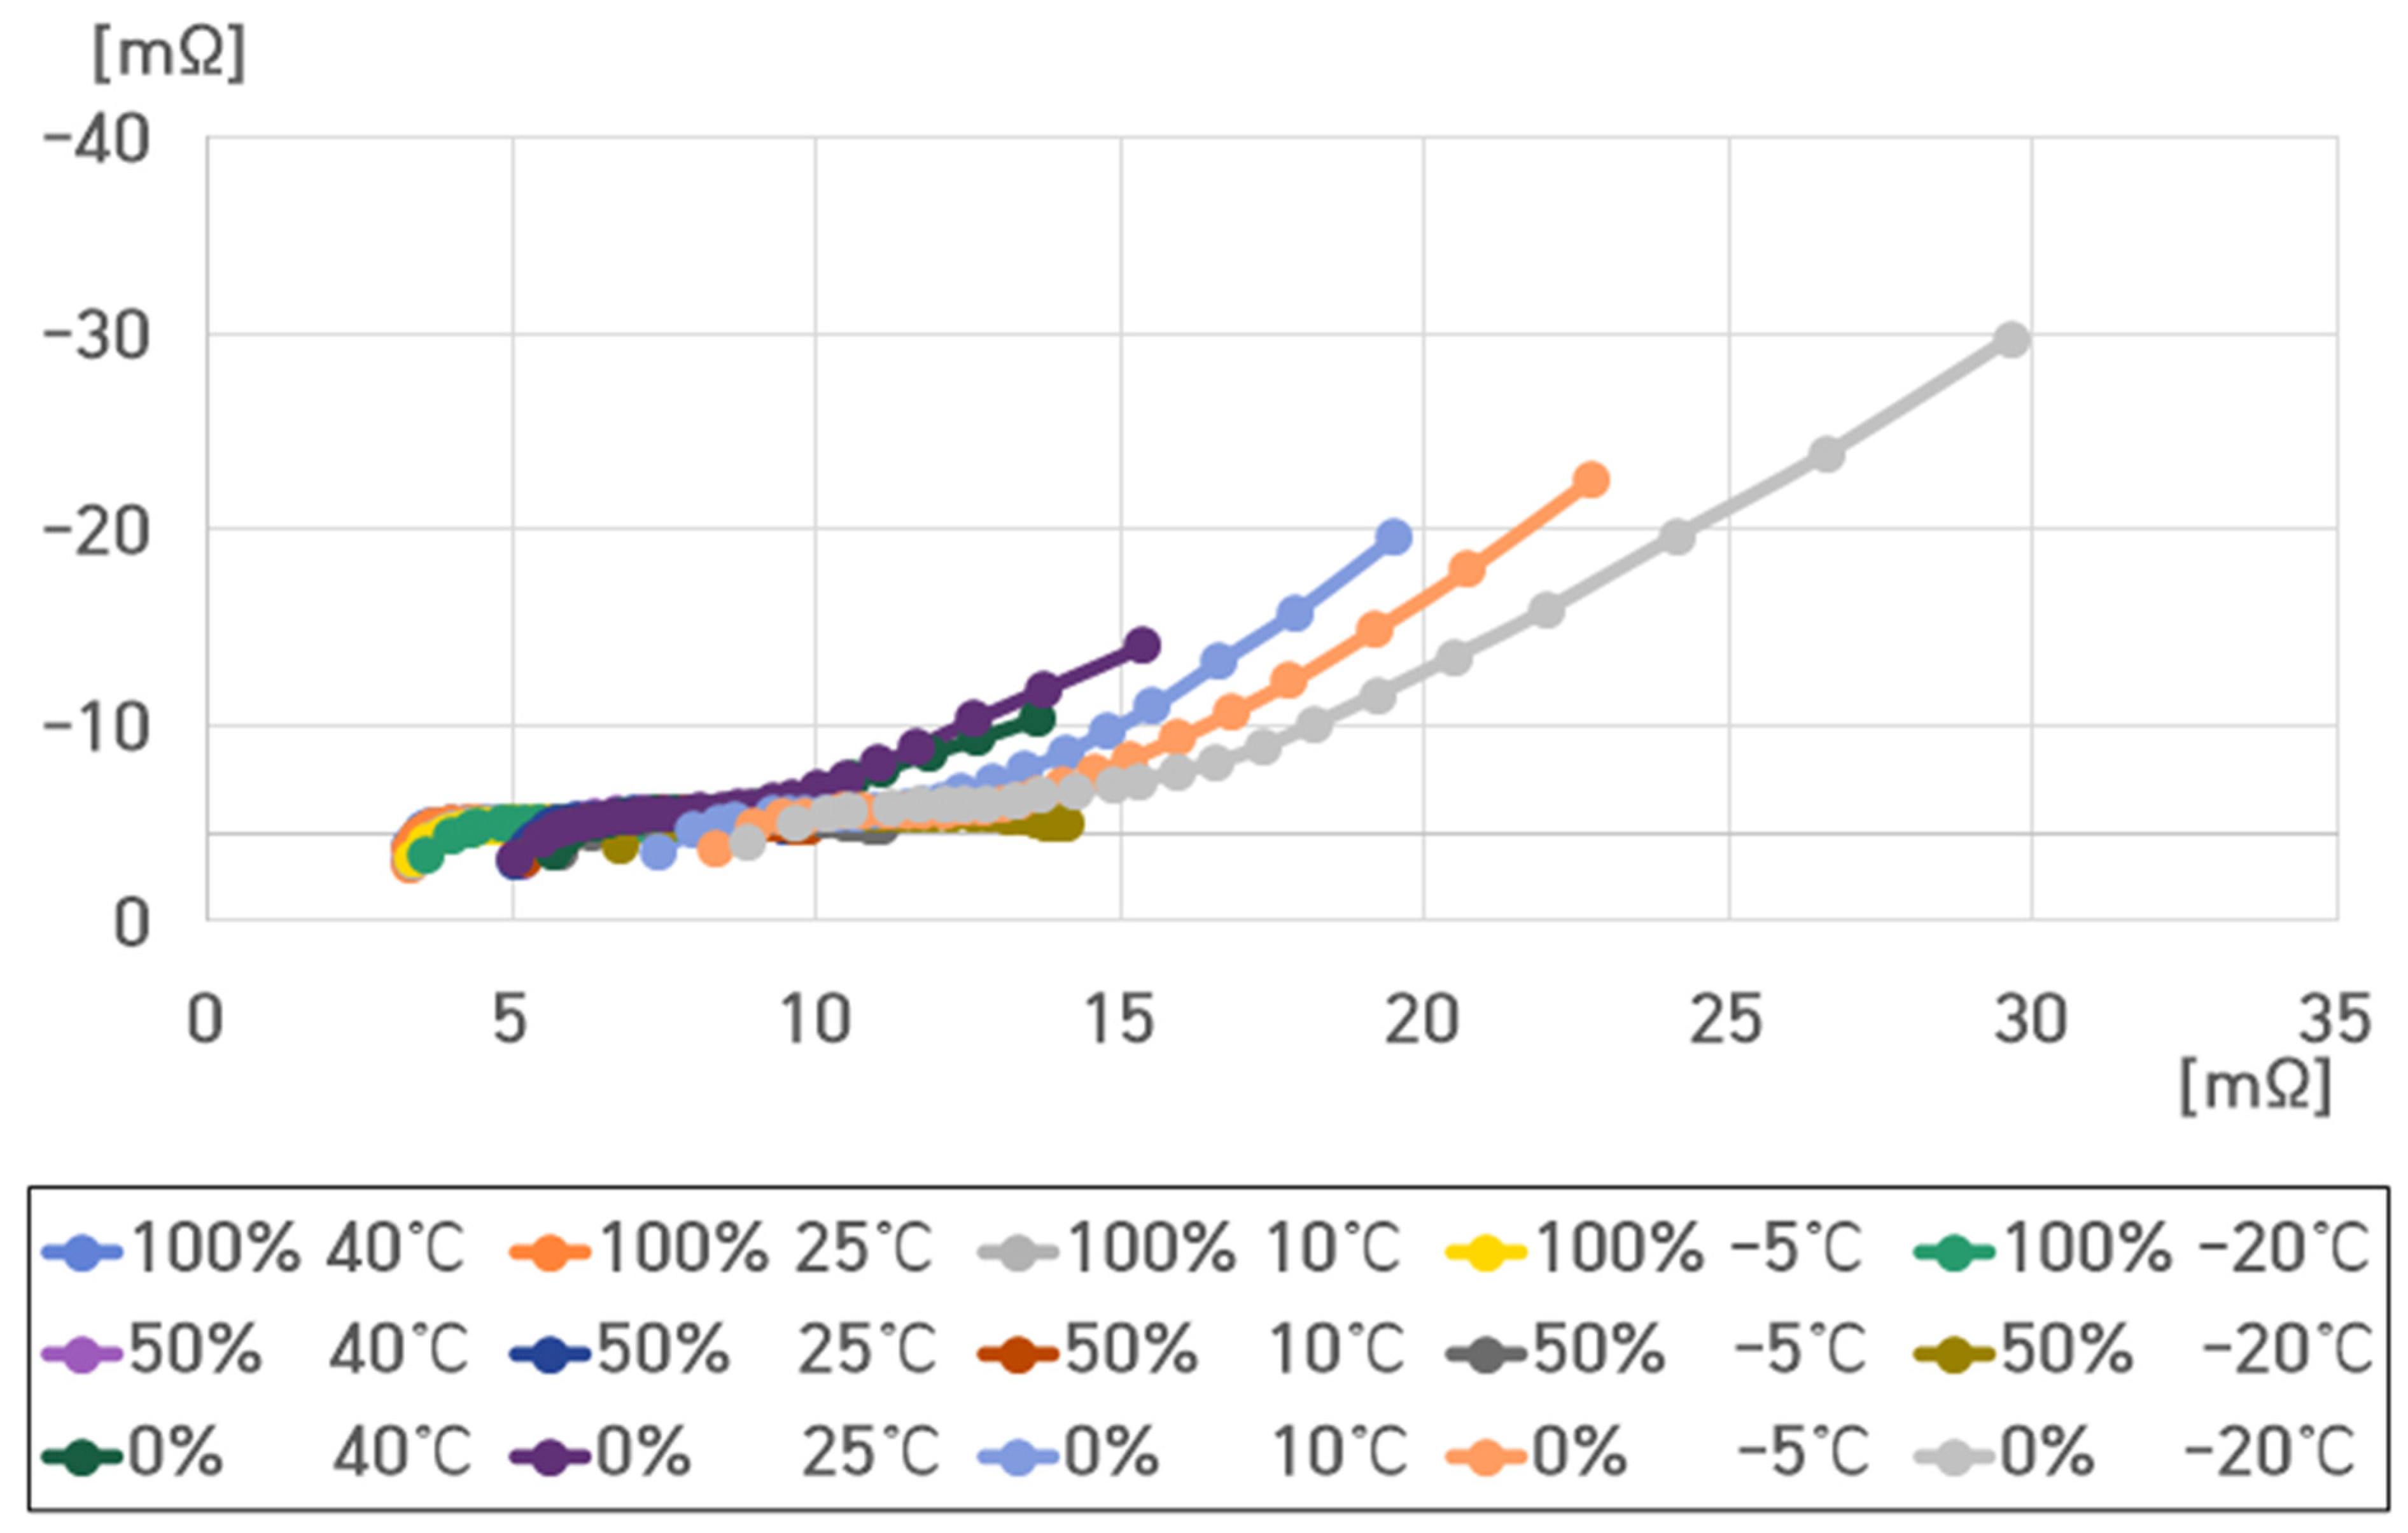
Figure 12, Figure 13, Figure 14, Figure 15 and Figure 16 present the impedance spectra of a single cell under temperatures of 40 °C, 25 °C, 10 °C, −5 °C, and −20 °C at 100%, 50%, and 0% SoCs, respectively.
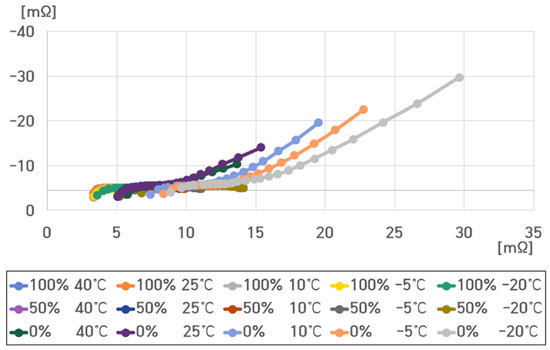
Figure 12.
Impedance spectrum of a single cell of the pouch-type lithium-ion battery under different SoCs and temperatures.
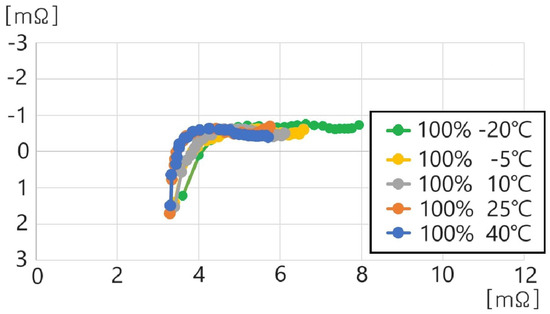
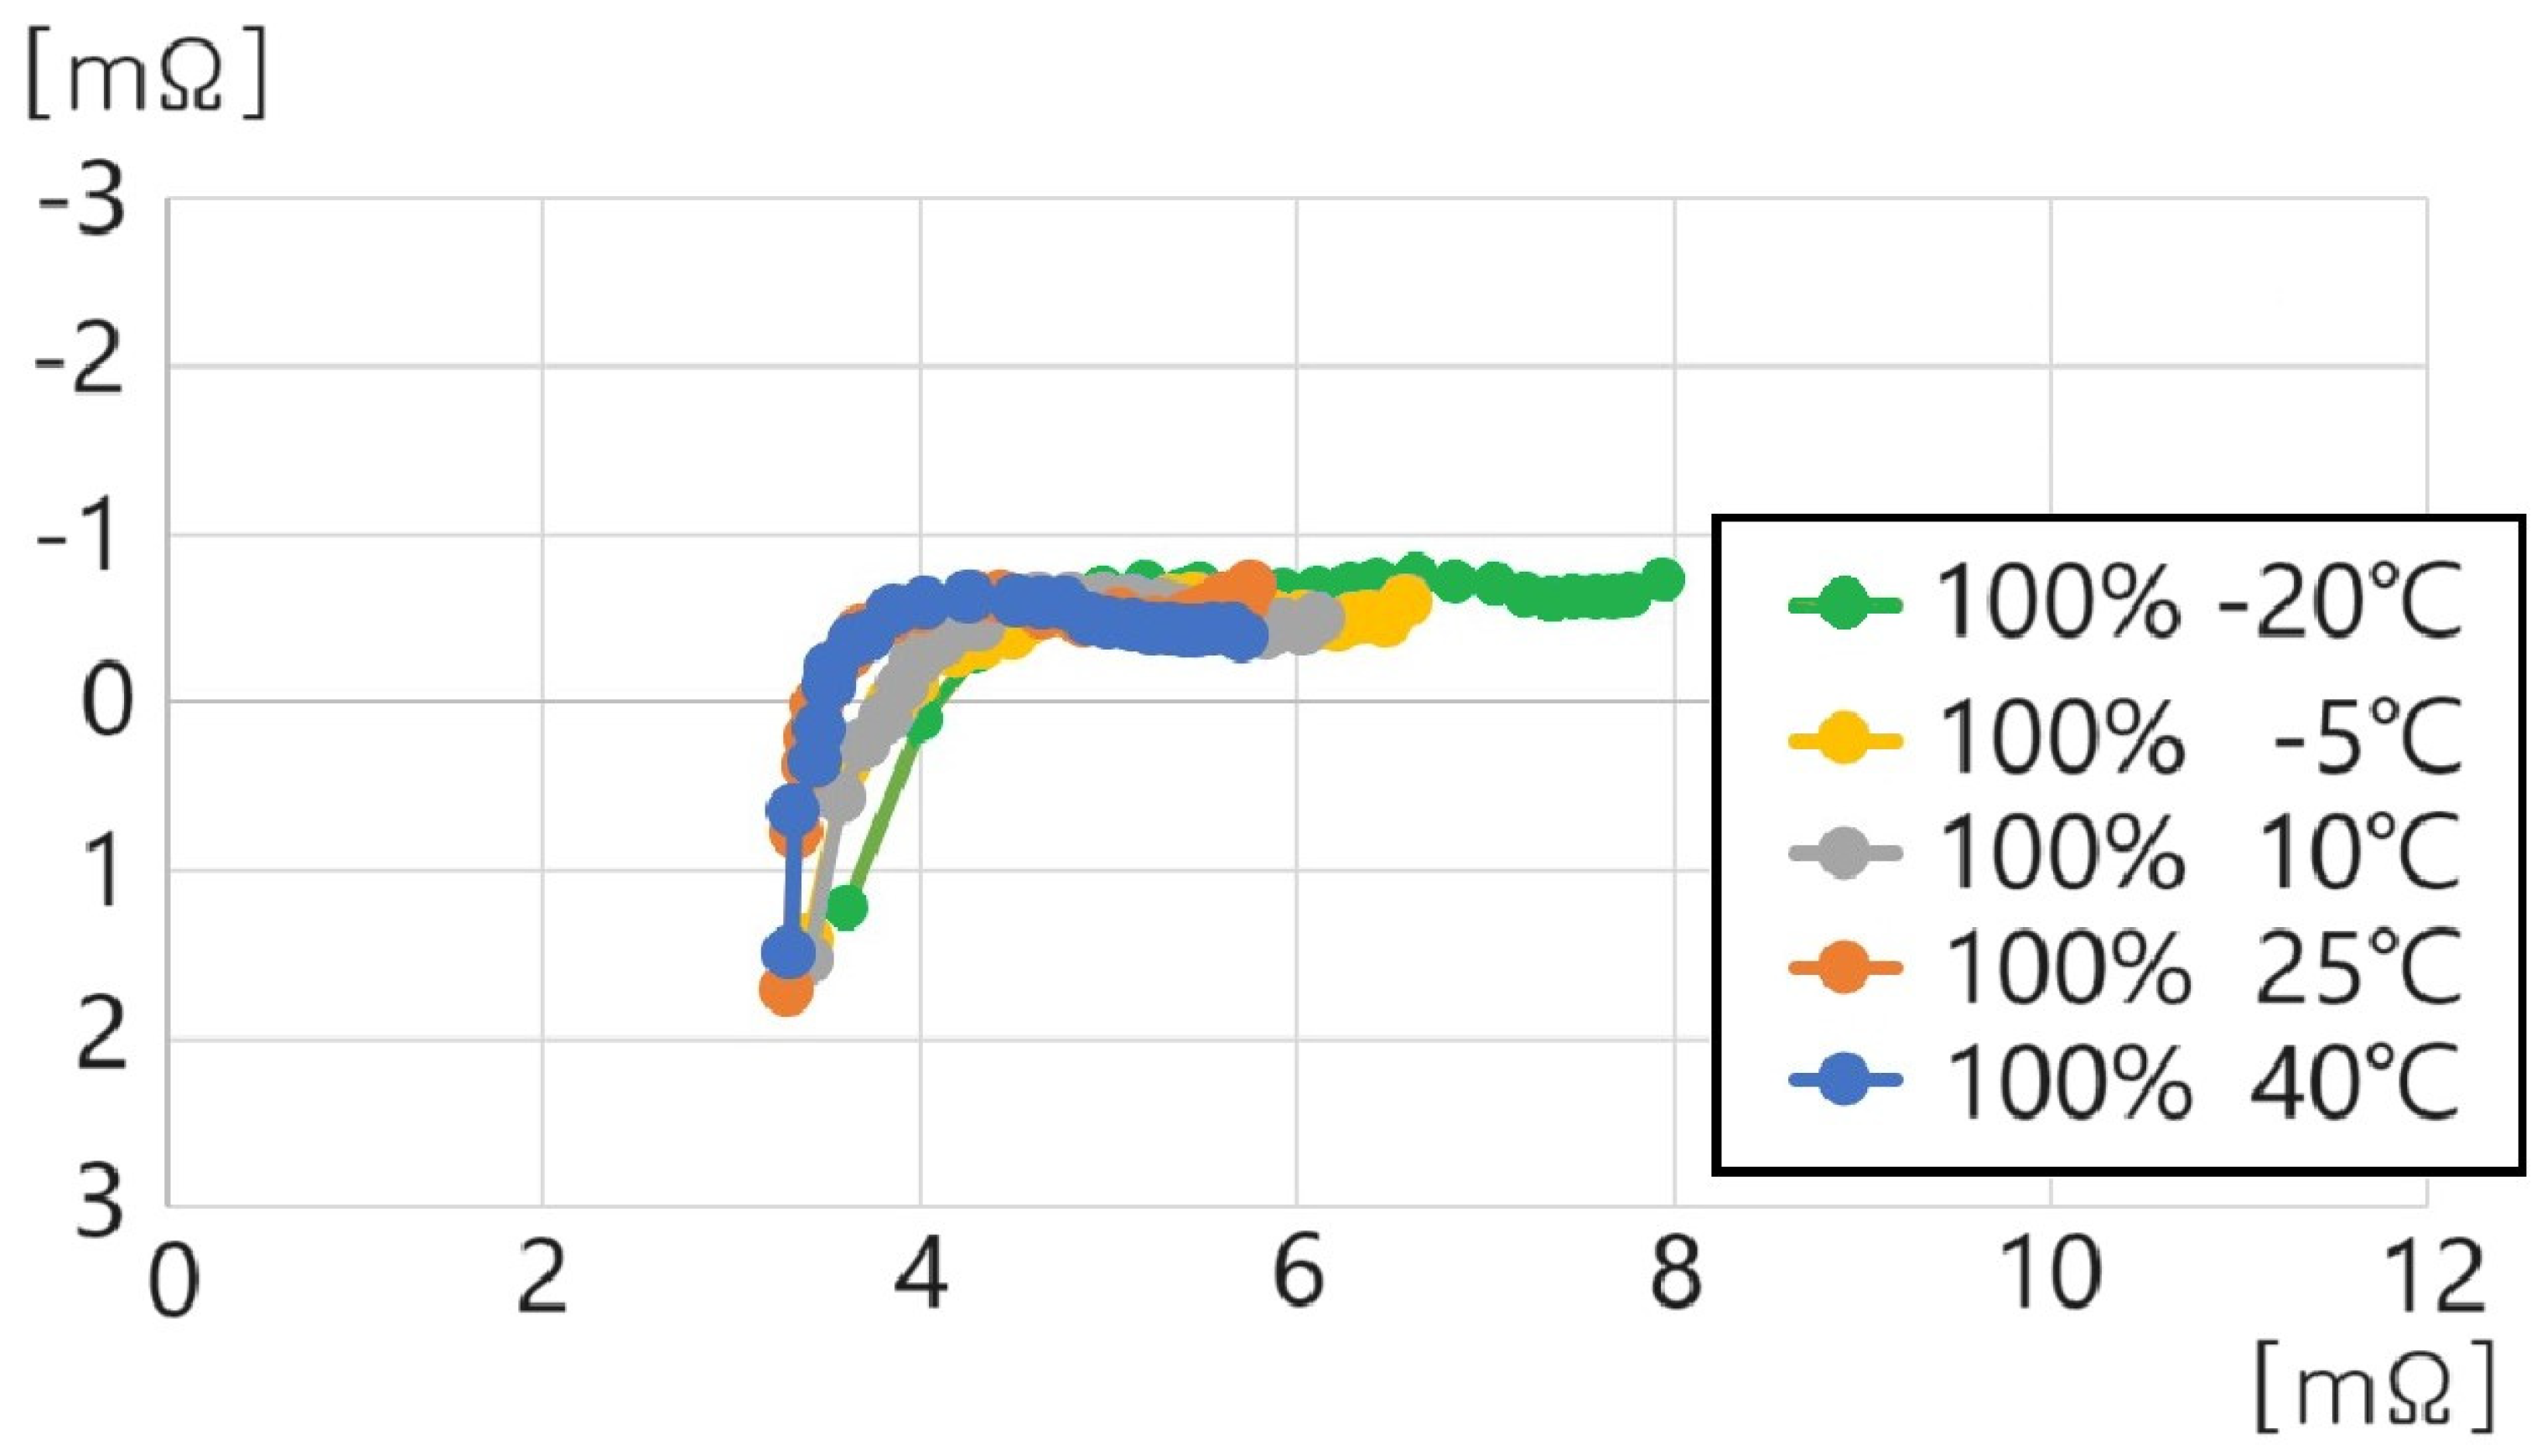
Figure 13.
Impedance spectrum of a single cell of the pouch-type lithium-ion battery at 100% SoC under different temperatures.
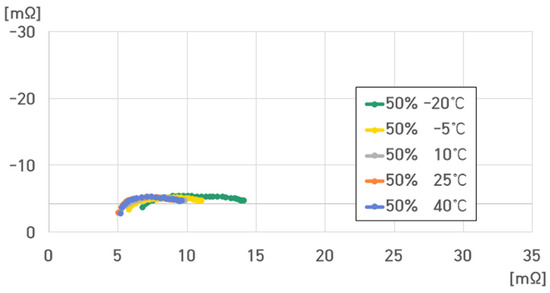
Figure 14.
Impedance spectrum of a single cell of the pouch-type lithium-ion battery at 50% SoC under different temperatures.
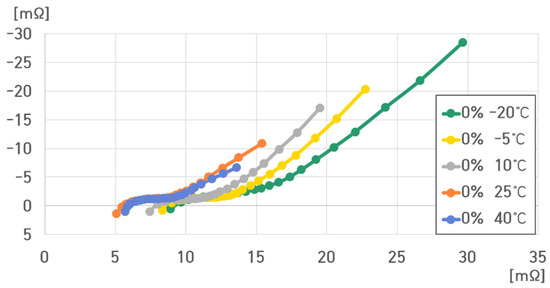
Figure 15.
Impedance spectrum of a single cell of the pouch-type lithium-ion battery at 0% SoC under different temperatures.
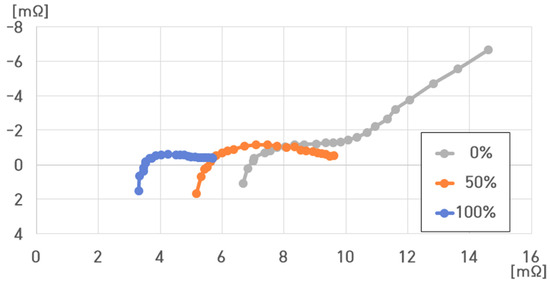
Figure 16.
Impedance spectrum of a single cell of the pouch-type lithium-ion battery at different SoCs under 40 °C.
At 100% SoC, and were small, and was also very small, verifying that the impedance spectrum curve progressed along the X-axis overall.
At 50% SoC, , , and were slightly higher than those at 100% SoC.
At 0% SoC, , , and significantly increased along the Y-axis with a slope of about 45°.
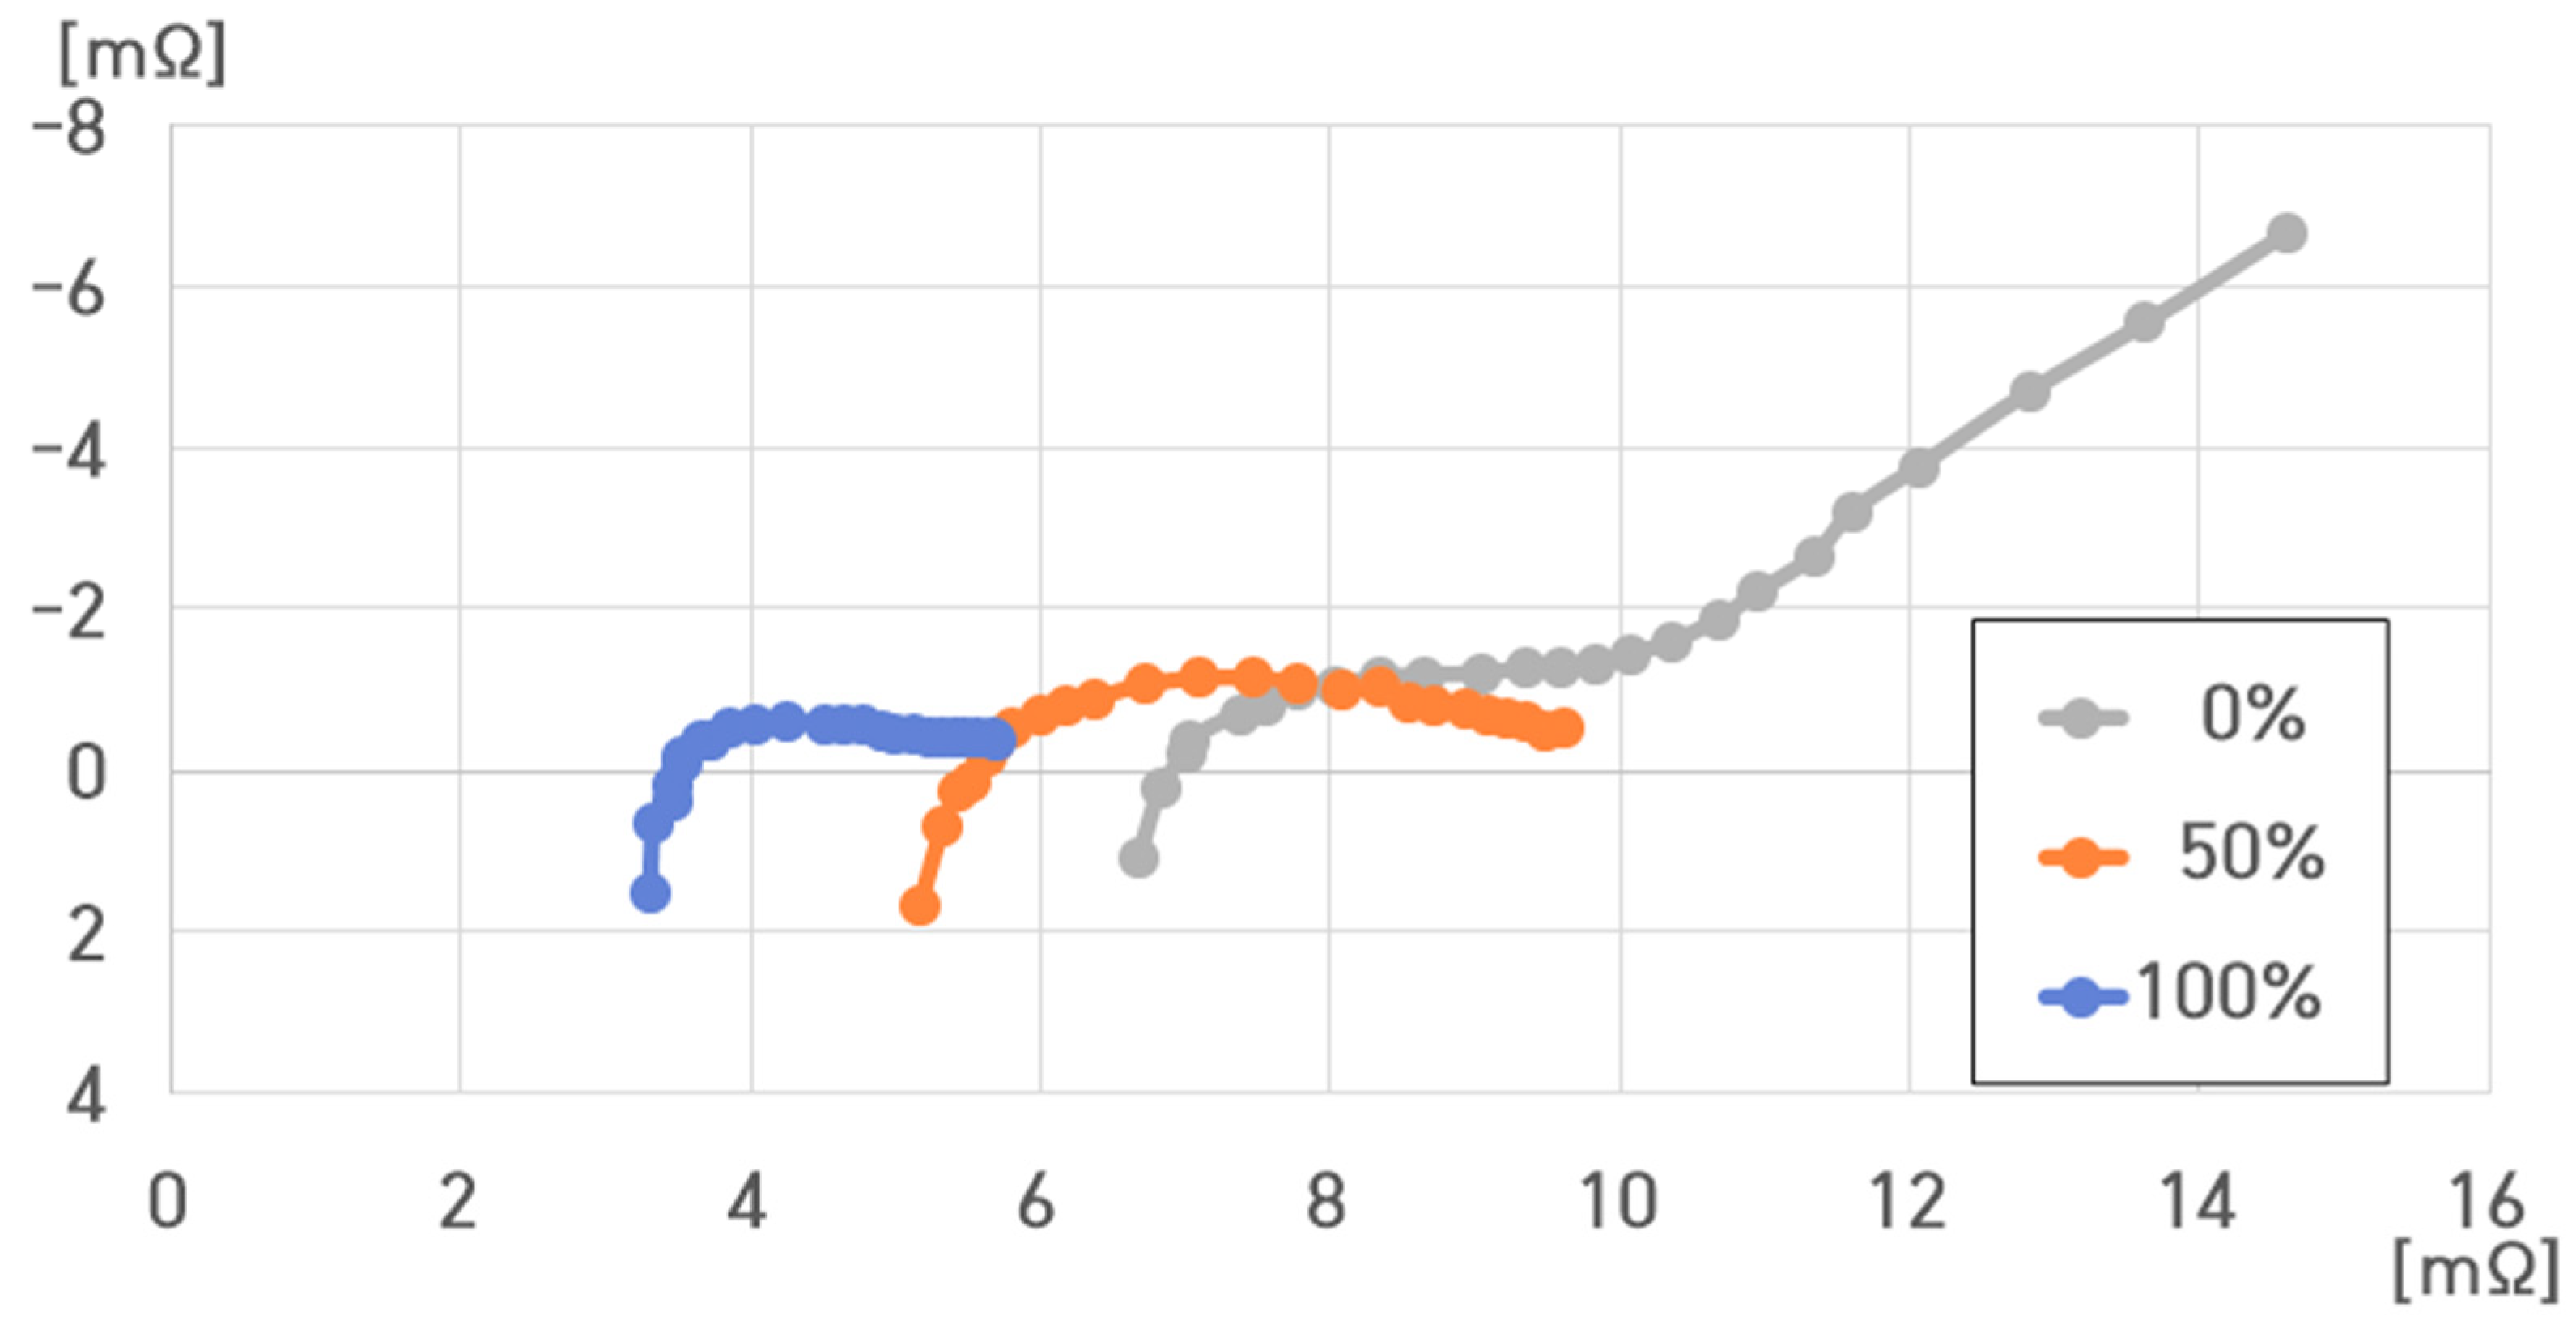
Figure 16 compares the impedance spectrum results for a single cell of the pouch-type lithium-ion battery (75 Ah) at 0%, 50%, and 100% SoC under 40 °C. The resistance value of the battery ranged from 3.212 to 14.6182 mΩ.
At 40 °C, , , , and were as follows:
- (1)
- 40 °C, 100% SoC: , , , ;
- (2)
- 40 °C, 50% SoC: , , , ;
- (3)
- 40 °C, 0% SoC: , , , .
Furthermore, at 40 °C, , , , and decreased with increasing SoC, whereas they increased with decreasing SoC.
However, at 0% SoC, rapidly increased compared to that at 100% and 50% SoC, denoting that increased with for 0% SoC.
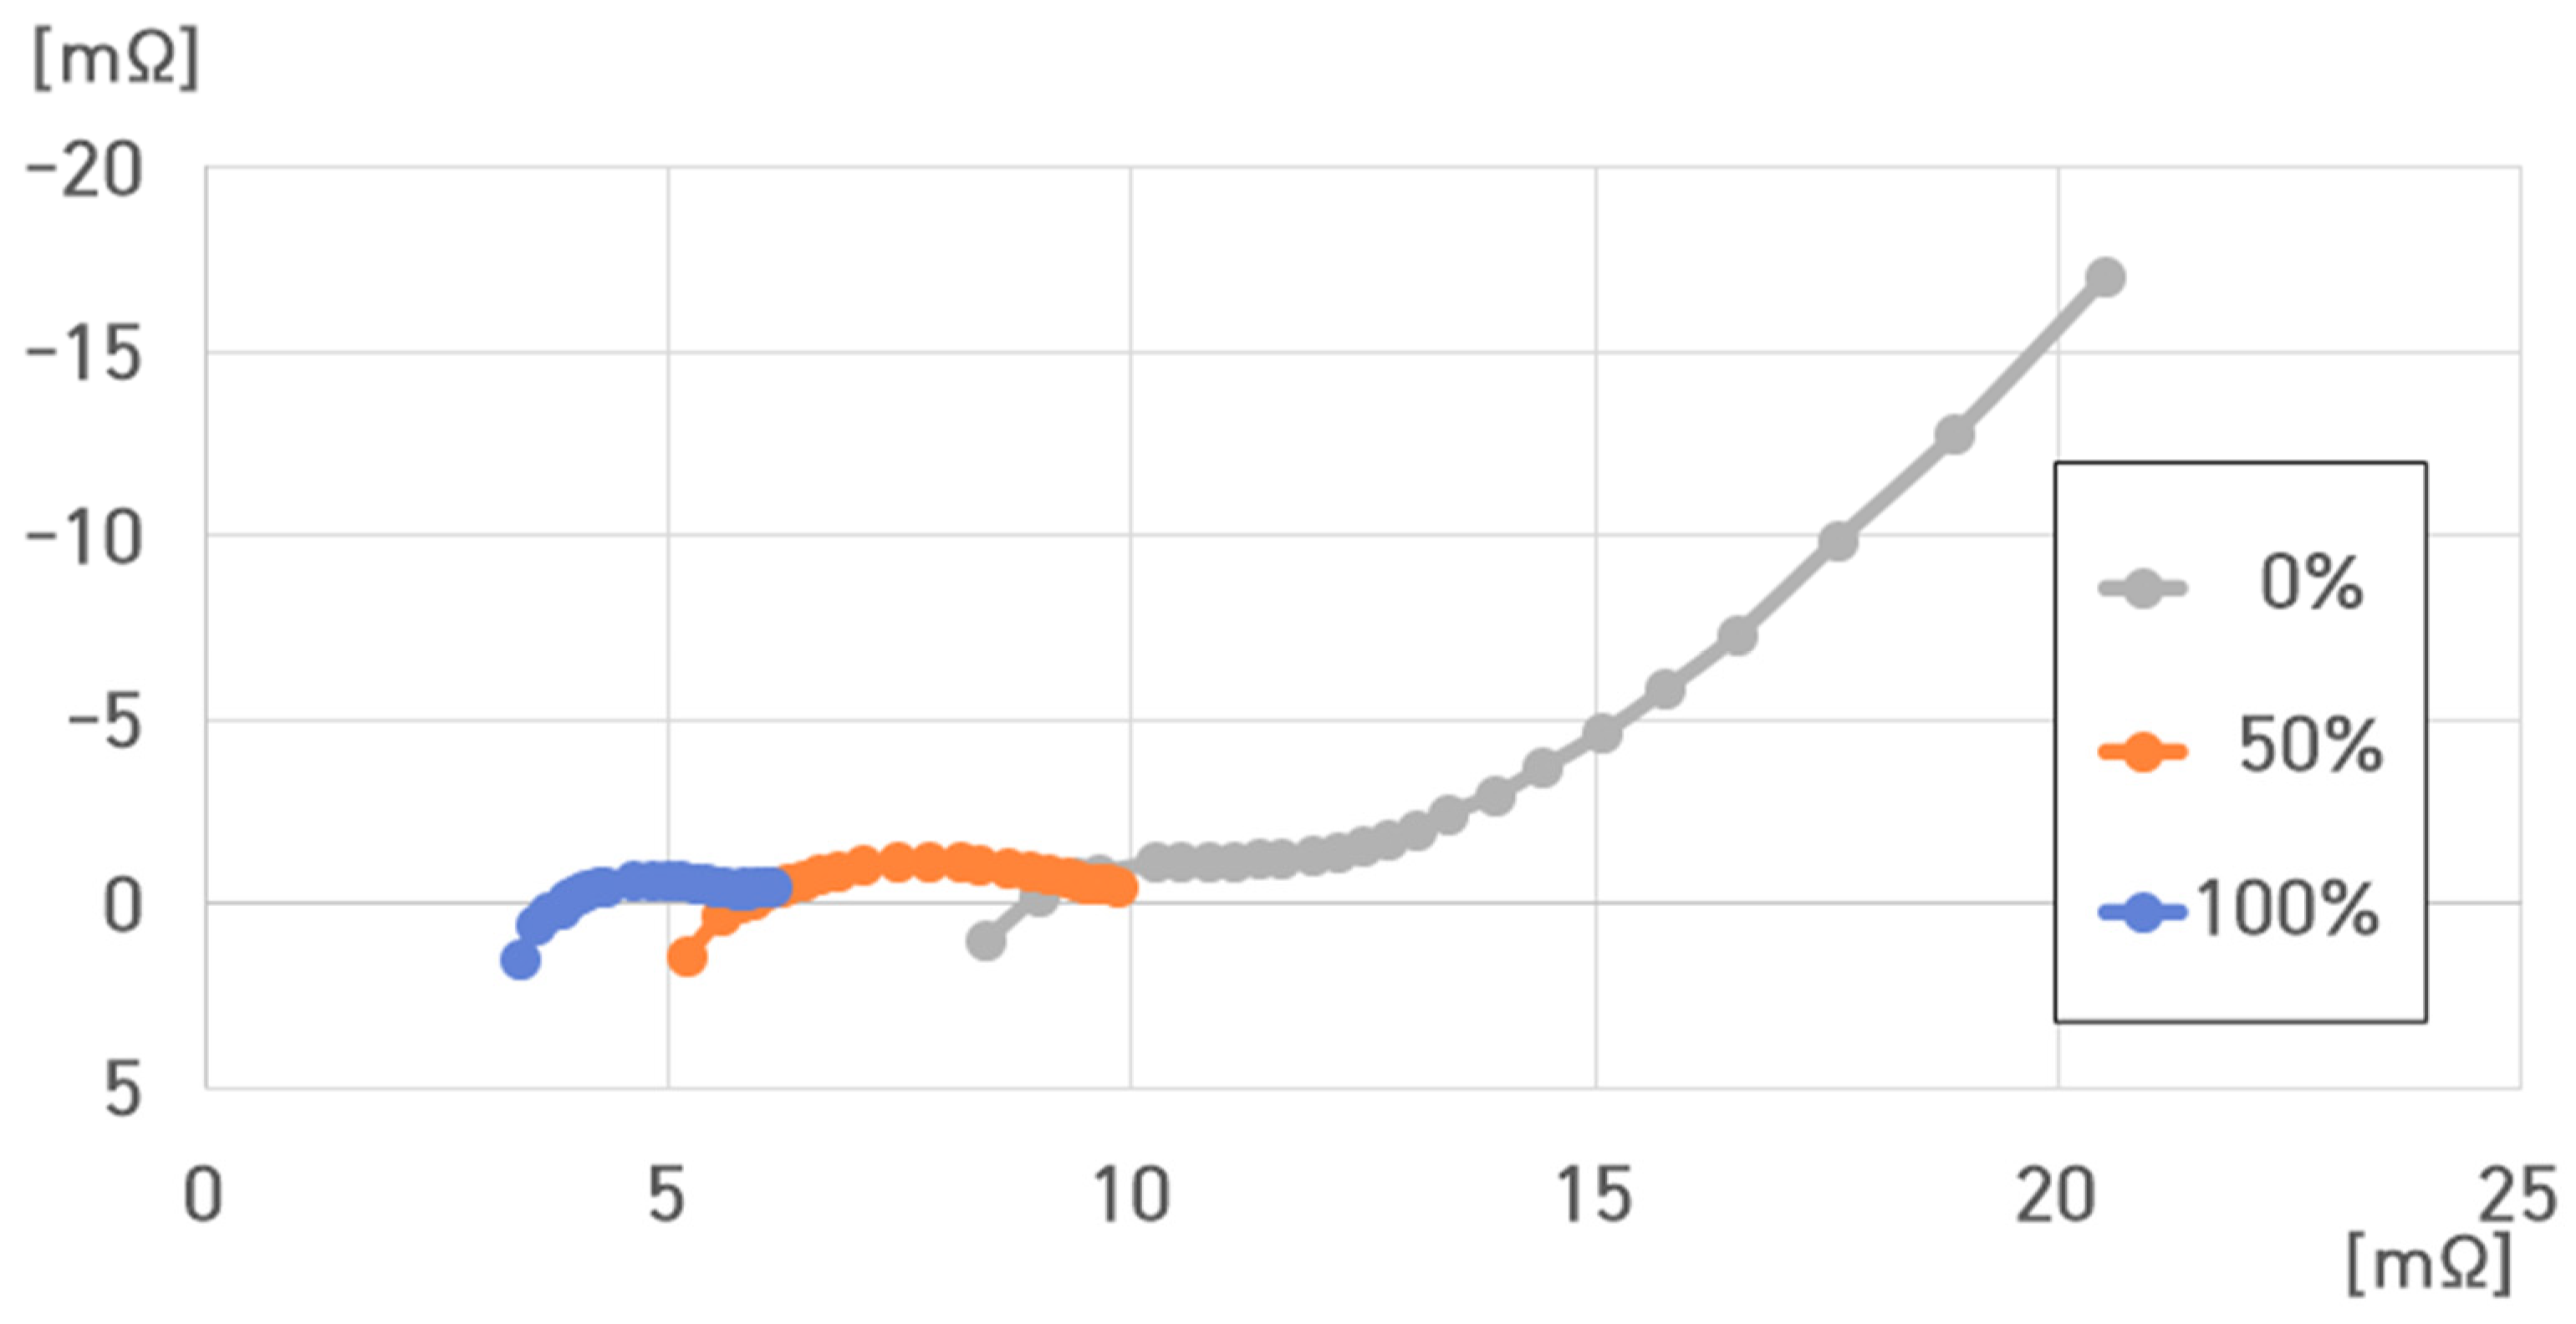
Figure 17 compares the impedance spectrum results for a single cell of the pouch-type lithium-ion battery (75 Ah) at 0%, 50%, and 100% SoC under 25 °C. The resistance value of the battery ranged from 3.3083 to 16.3872 mΩ.
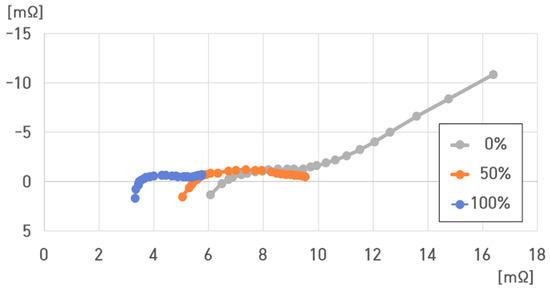
Figure 17.
Impedance spectrum of a single cell of the pouch-type lithium-ion battery at different SoCs under 25 °C.
At 25 °C, , , , and were as follows:
- (1)
- 25 °C, 100% SoC: , , , ;
- (2)
- 25 °C, 50% SoC: , , , ;
- (3)
- 25 °C, 0% SoC: , , , .
Figure 17 shows that at 25 °C, , , , and decreased with increasing SoC. Moreover, they increased with decreasing SoC.
However, at 0% SoC, rapidly increased compared to that at 100% and 50% SoC. Thus, at 0% SoC, increased with .
Figure 18 compares the impedance spectrum results for a single cell of the pouch-type lithium-ion battery (75 Ah) at 0%, 50%, and 100% SoC under 10 °C.

Figure 18.
Impedance spectrum of a single cell of the pouch-type lithium-ion battery at different SoCs under 10 °C.
The resistance value of the battery at 10 °C ranged from 3.4034 to 20.5187 mΩ.
At 10 °C, , , , and were as follows:
- (1)
- 10 °C, 100% SoC: , , ,
- (2)
- 10 °C, 50% SoC: , , , ;
- (3)
- 10 °C, 0% SoC: , , , .
, , , and decreased with increasing SoC, and they increased with decreasing SoC.
However, at 0% SoC, rapidly increased compared to that at 100% and 50% SoC. Hence, at 0% SoC, increased with .
Figure 19 compares the impedance spectrum results for a single cell of the pouch-type lithium-ion battery (75 Ah) at 0%, 50%, and 100% SoC under −5 °C. The resistance value of the battery at −5 °C ranged from 3.4050 to 23.7239 mΩ.
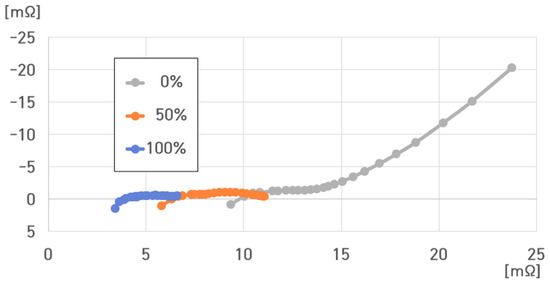
Figure 19.
Impedance spectrum of a single cell of the pouch-type lithium-ion battery at different SoCs under −5 °C.
, , , and were as follows:
- (1)
- −5 °C, 100% SoC: , , , ;
- (2)
- −5 °C, 50% SoC: , , , ;
- (3)
- −5 °C, 0% SoC: , , , .
, , and decreased with increasing SoC. Additionally, they increased with decreasing SoC.
However, at 0% SoC, rapidly increased compared to that at 100% and 50% SoC. This signifies that at 0% SoC, increased with .
Figure 20 compares the impedance spectrum results at 0%, 50%, and 100% SoC for a single cell of the pouch-type lithium-ion battery (75 Ah) under −20 °C. The resistance value of the battery at −20 °C ranged from 3.6055 to 30.6618 mΩ.

Figure 20.
Impedance spectrum of a single cell of the pouch-type lithium-ion battery at different SoCs under −20 °C.
, , , and were as follows:
- (1)
- −20 °C, 100% SoC: , , , ;
- (2)
- −20 °C, 50% SoC: , , , ;
- (3)
- −20 °C, 0% SoC: , , , .
Specifically, , , , and decreased with increasing SoC. Additionally, , , and increased with decreasing SoC.
At 0% SoC, rapidly increased compared to that at 100% and 50% SoC. Therefore, at 0% SoC, increased with .
5. Analysis of Impedance Characteristics of 16 Cells of 4.4 kWh ESS
To analyze the stability of an impedance-based ESS, a 4.4 kWh ESS with a pouch-type lithium-ion battery and 16 cells was studied, which could be used as an ESS for renewable power generation.
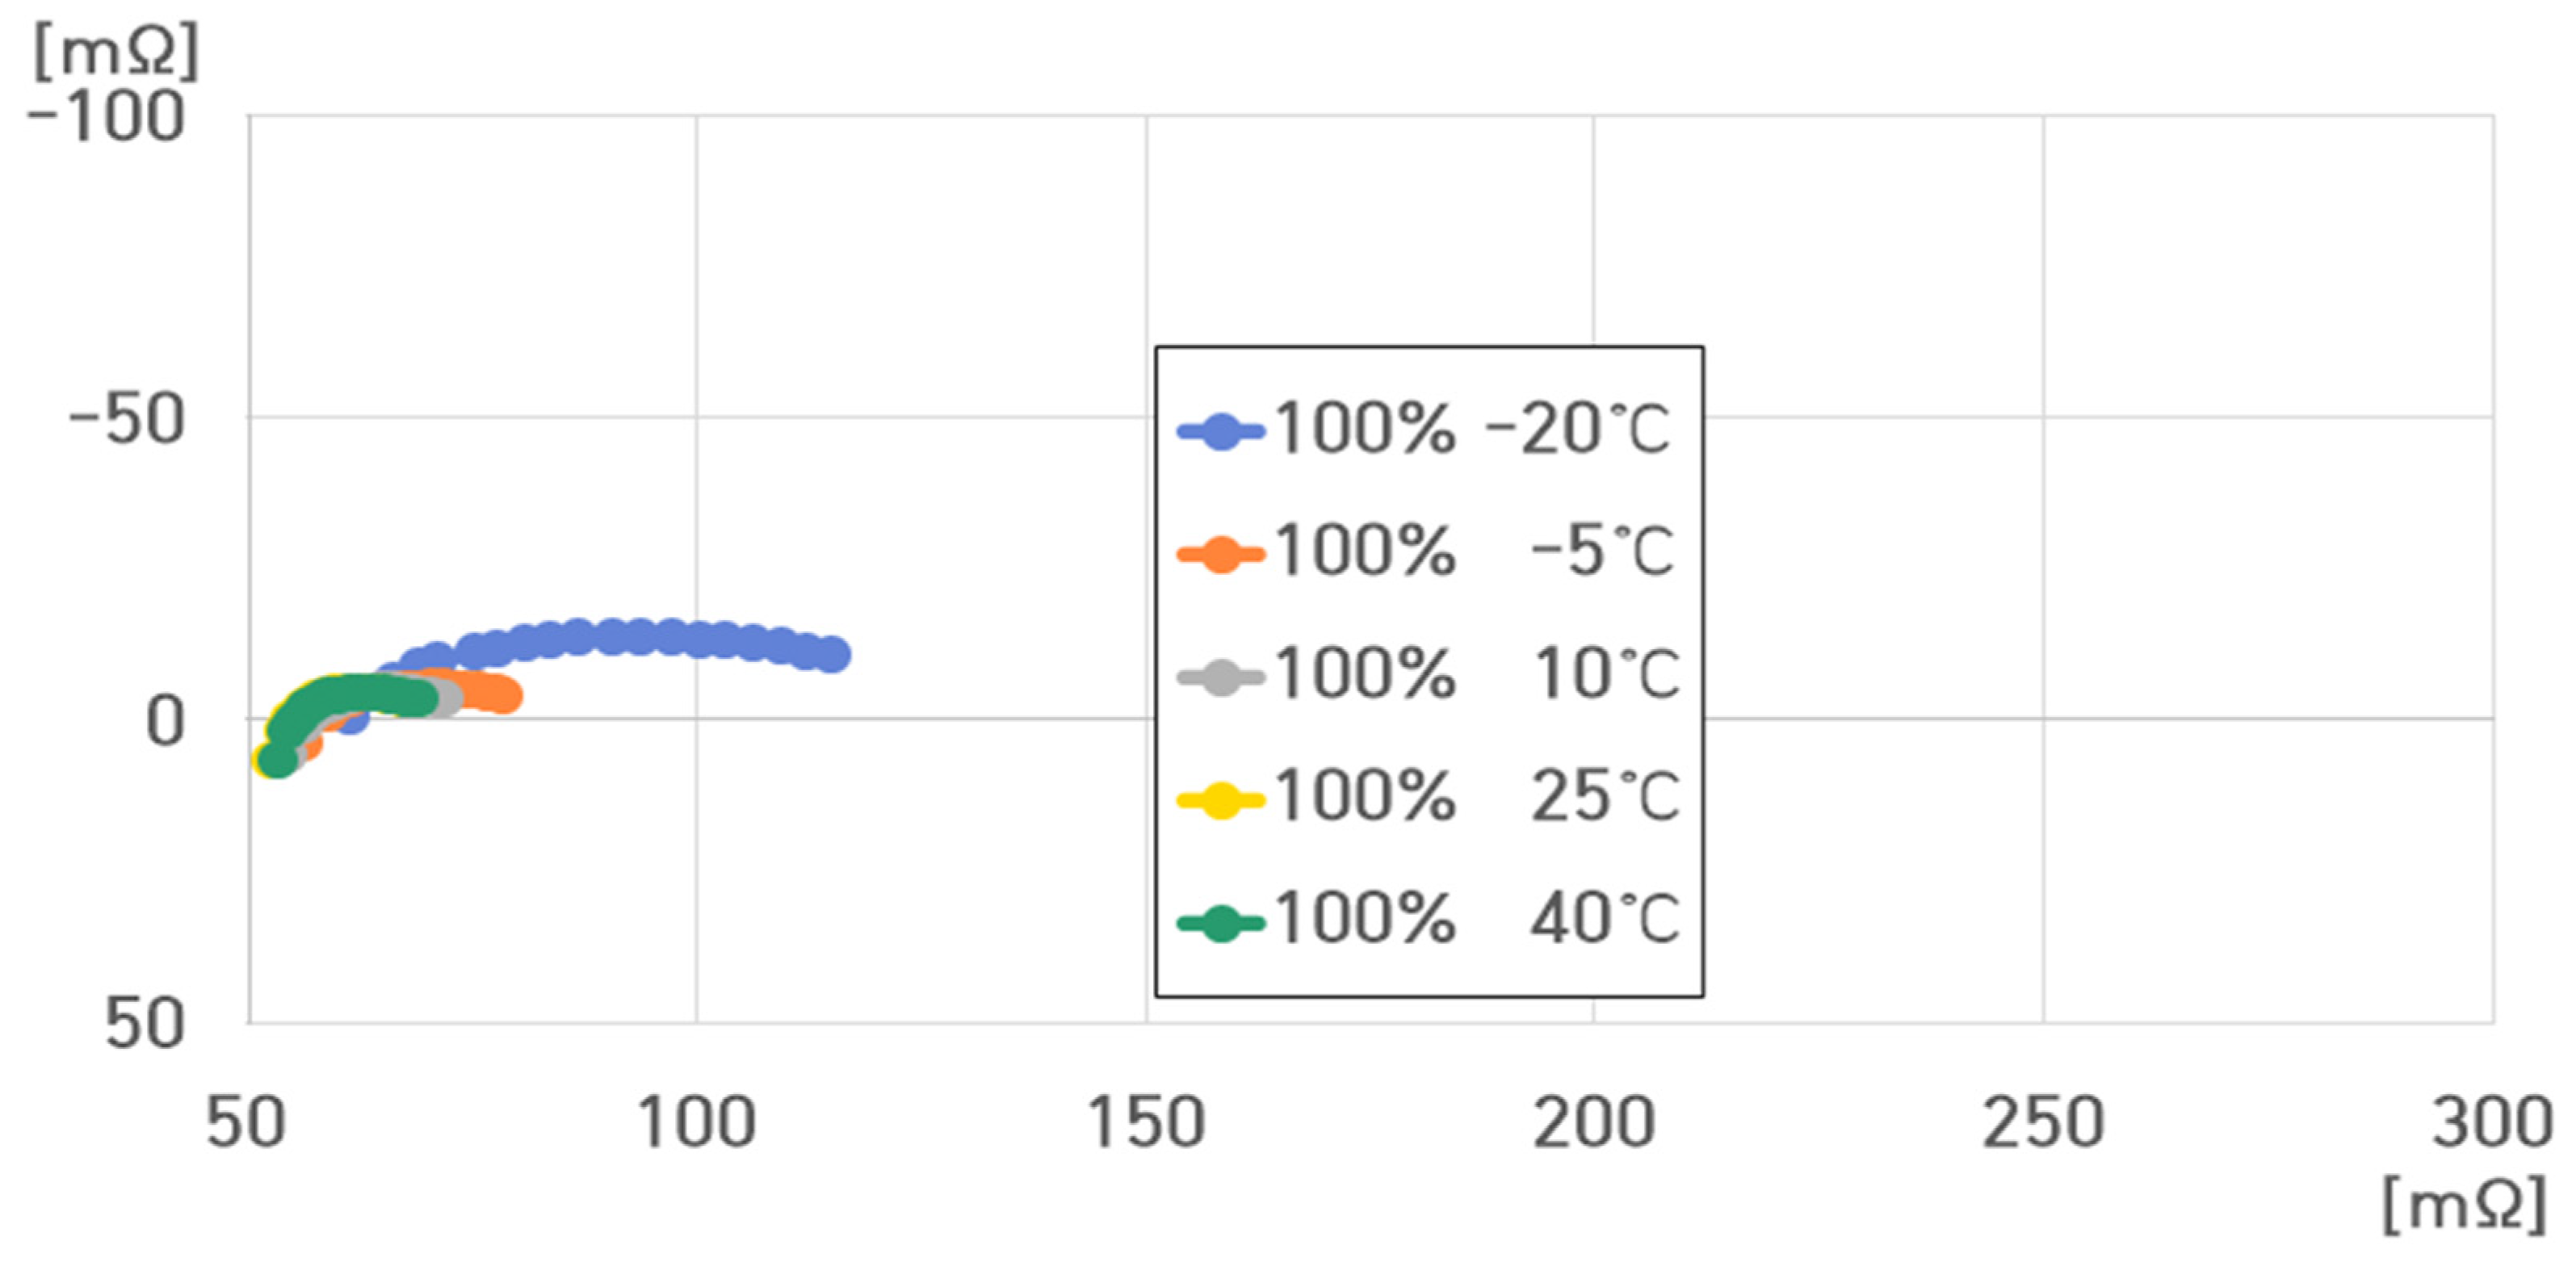
For the 4.4 kWh EES, the voltage was 67.2 V at 100% SoC. Figure 21 presents the impedance spectrum for the 4.4 kWh ESS at 100% SoC under varying temperatures. The ESS resistance value at 100% SoC ranged from 53.603 to 119.909 mΩ.
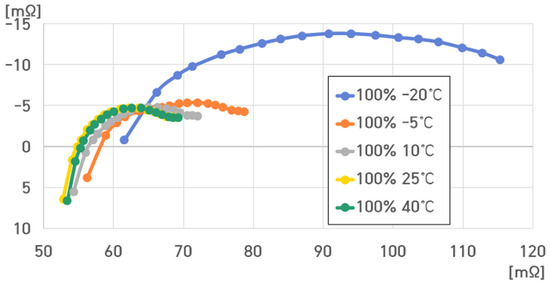
Figure 21.
Impedance spectrum of the 16-cell ESS at 100% SoC under different temperatures.
At 100% SoC, , , , and were as follows:
- (1)
- 100% SoC, 40 °C: , , , ;
- (2)
- 100% SoC, 25 °C: , , , ;
- (3)
- 100% SoC, 10 °C: , , , ;
- (4)
- 100% SoC, −5 °C: , , , ;
- (5)
- 100% SoC, −20 °C: , , , .
and decreased with increasing temperature, and they increased with decreasing temperature.
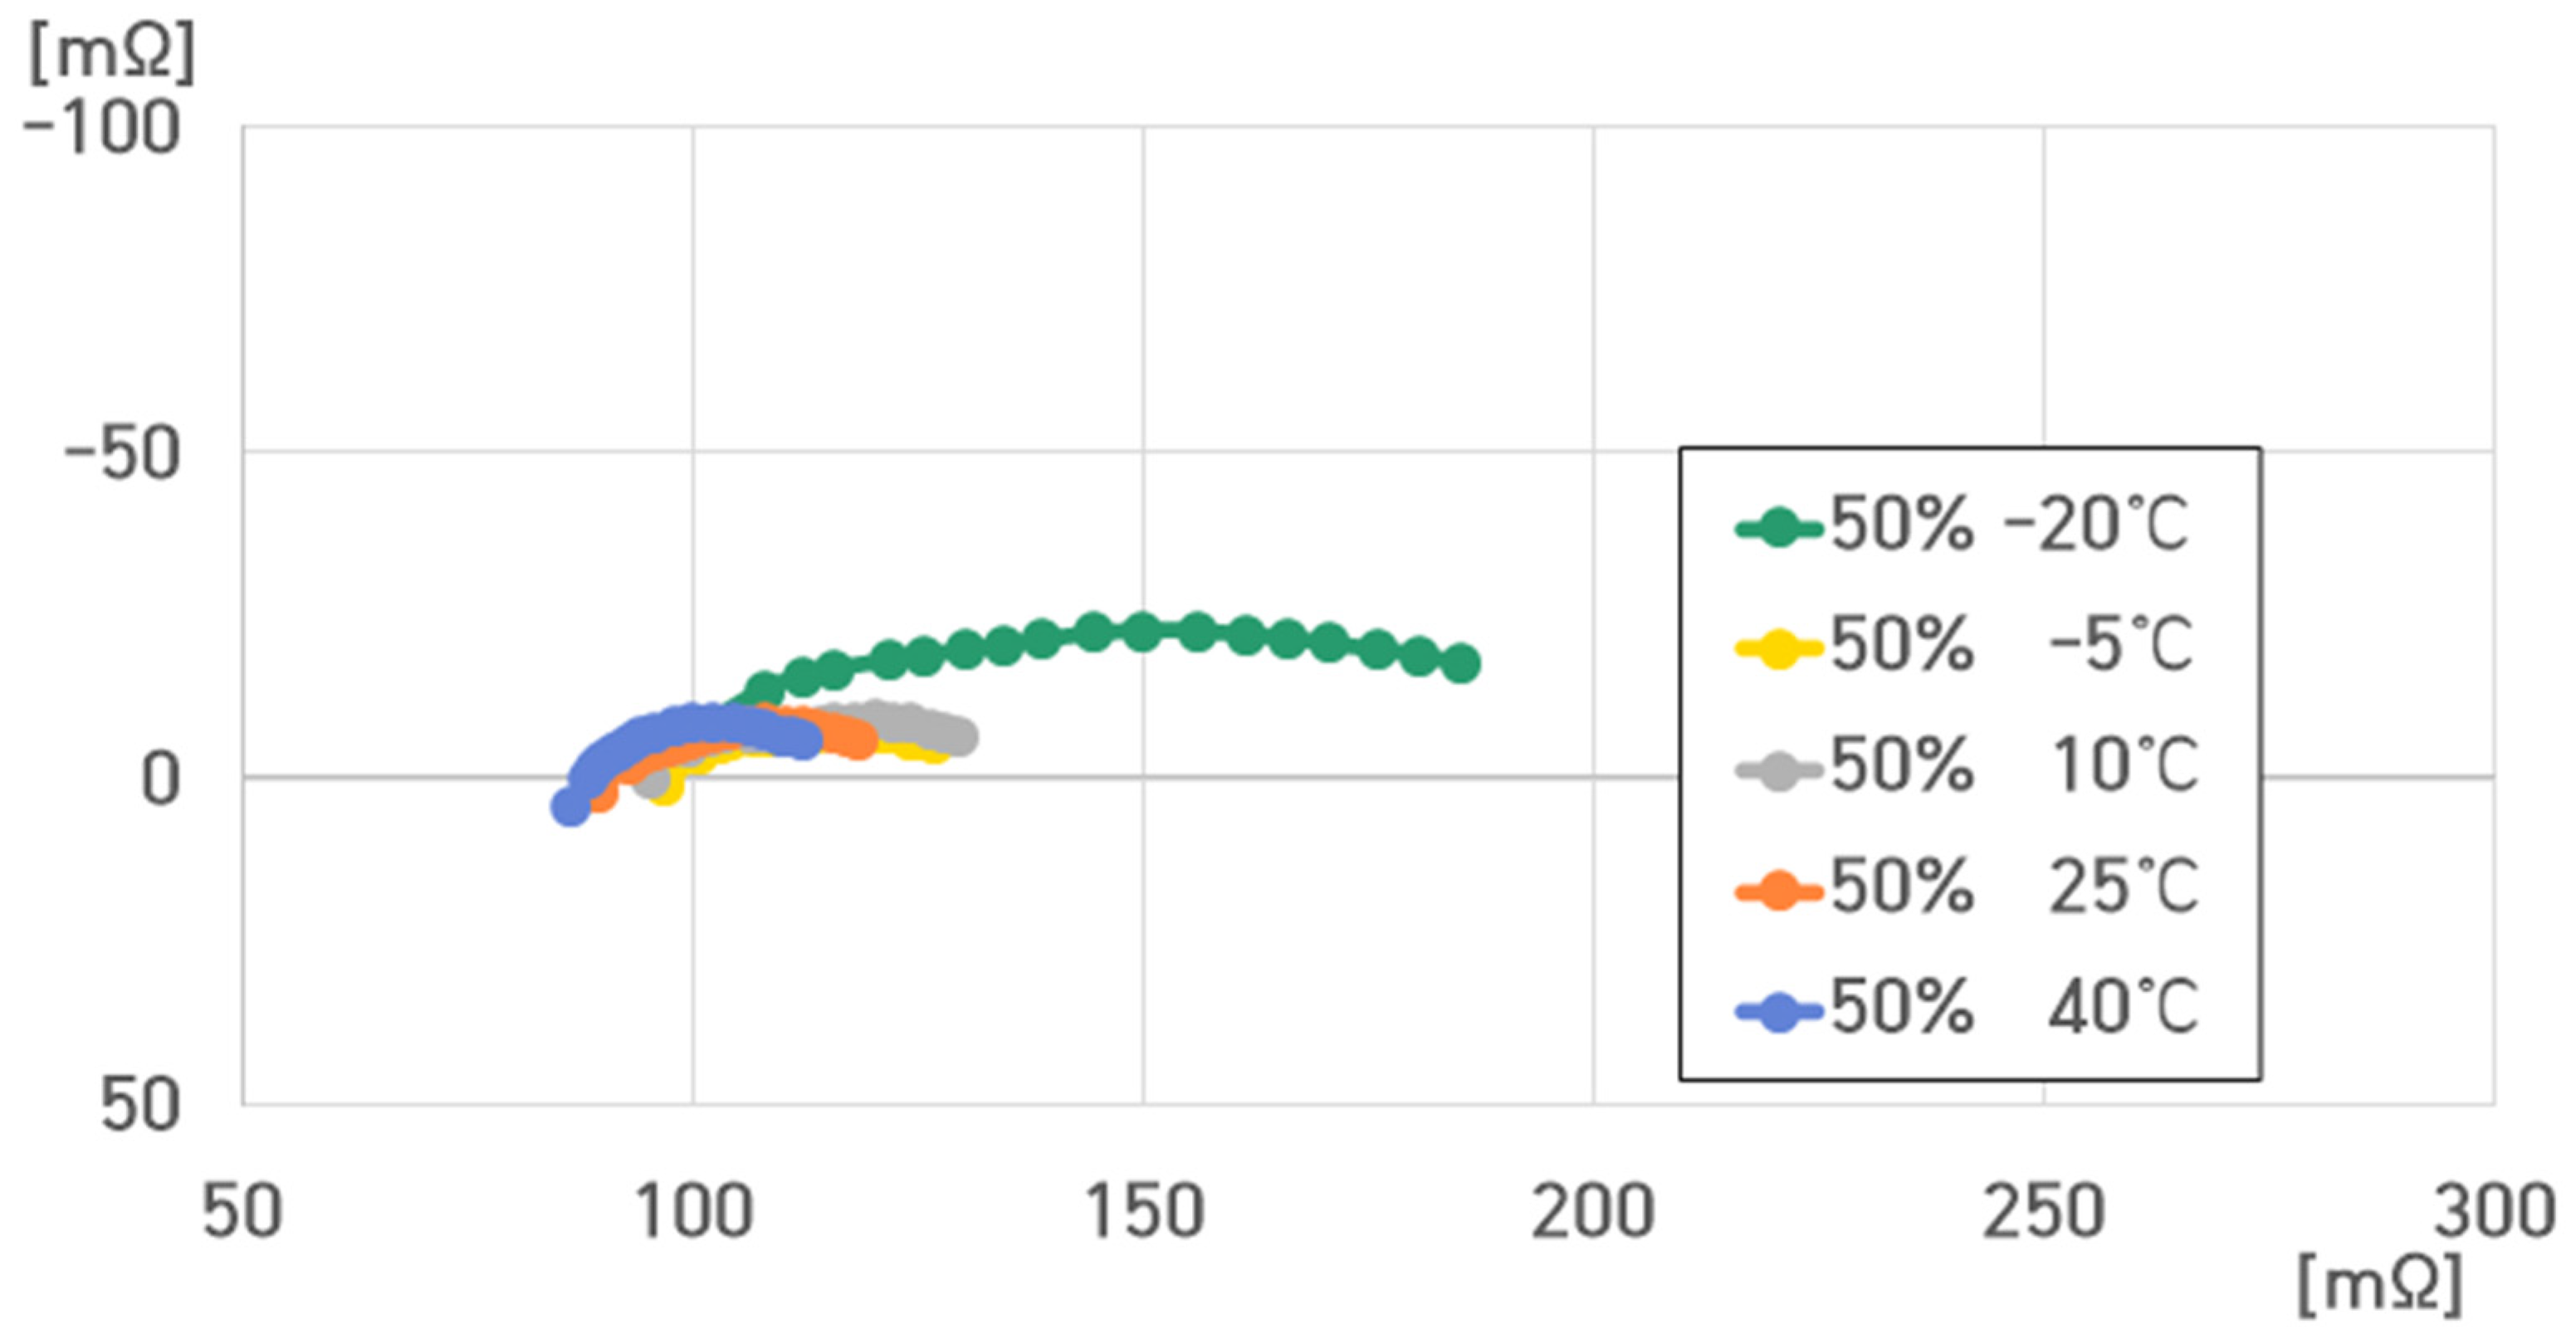
At 50% SoC, the voltage of the 4.4 kWh ESS was 59.2 V. Figure 22 illustrates the impedance spectrum of the 4.4 kWh ESS at 50% SoC under varying temperatures. At 50% SoC, the ESS resistance value ranged from 89.020 to 195.796 mΩ.

Figure 22.
Impedance spectrum of the 16-cell ESS at 50% SoC under different temperatures.
, , , and were as follows:
- (1)
- 50% SoC, 40 °C: , , , ;
- (2)
- 50% SoC, 25 °C: , , , ;
- (3)
- 50% SoC, 10 °C: , , , ;
- (4)
- 50% SoC, −5 °C: , , , ;
- (5)
- 50% SoC, −20 °C: , , , .
and decreased with increasing temperature and increased with decreasing temperature.
exhibited the largest value at 10 °C, and it rapidly decreased at −20 °C. Moreover, was absent.
Particularly, significantly increased at −20 °C, and the battery performance significantly deteriorated as the temperature decreased.
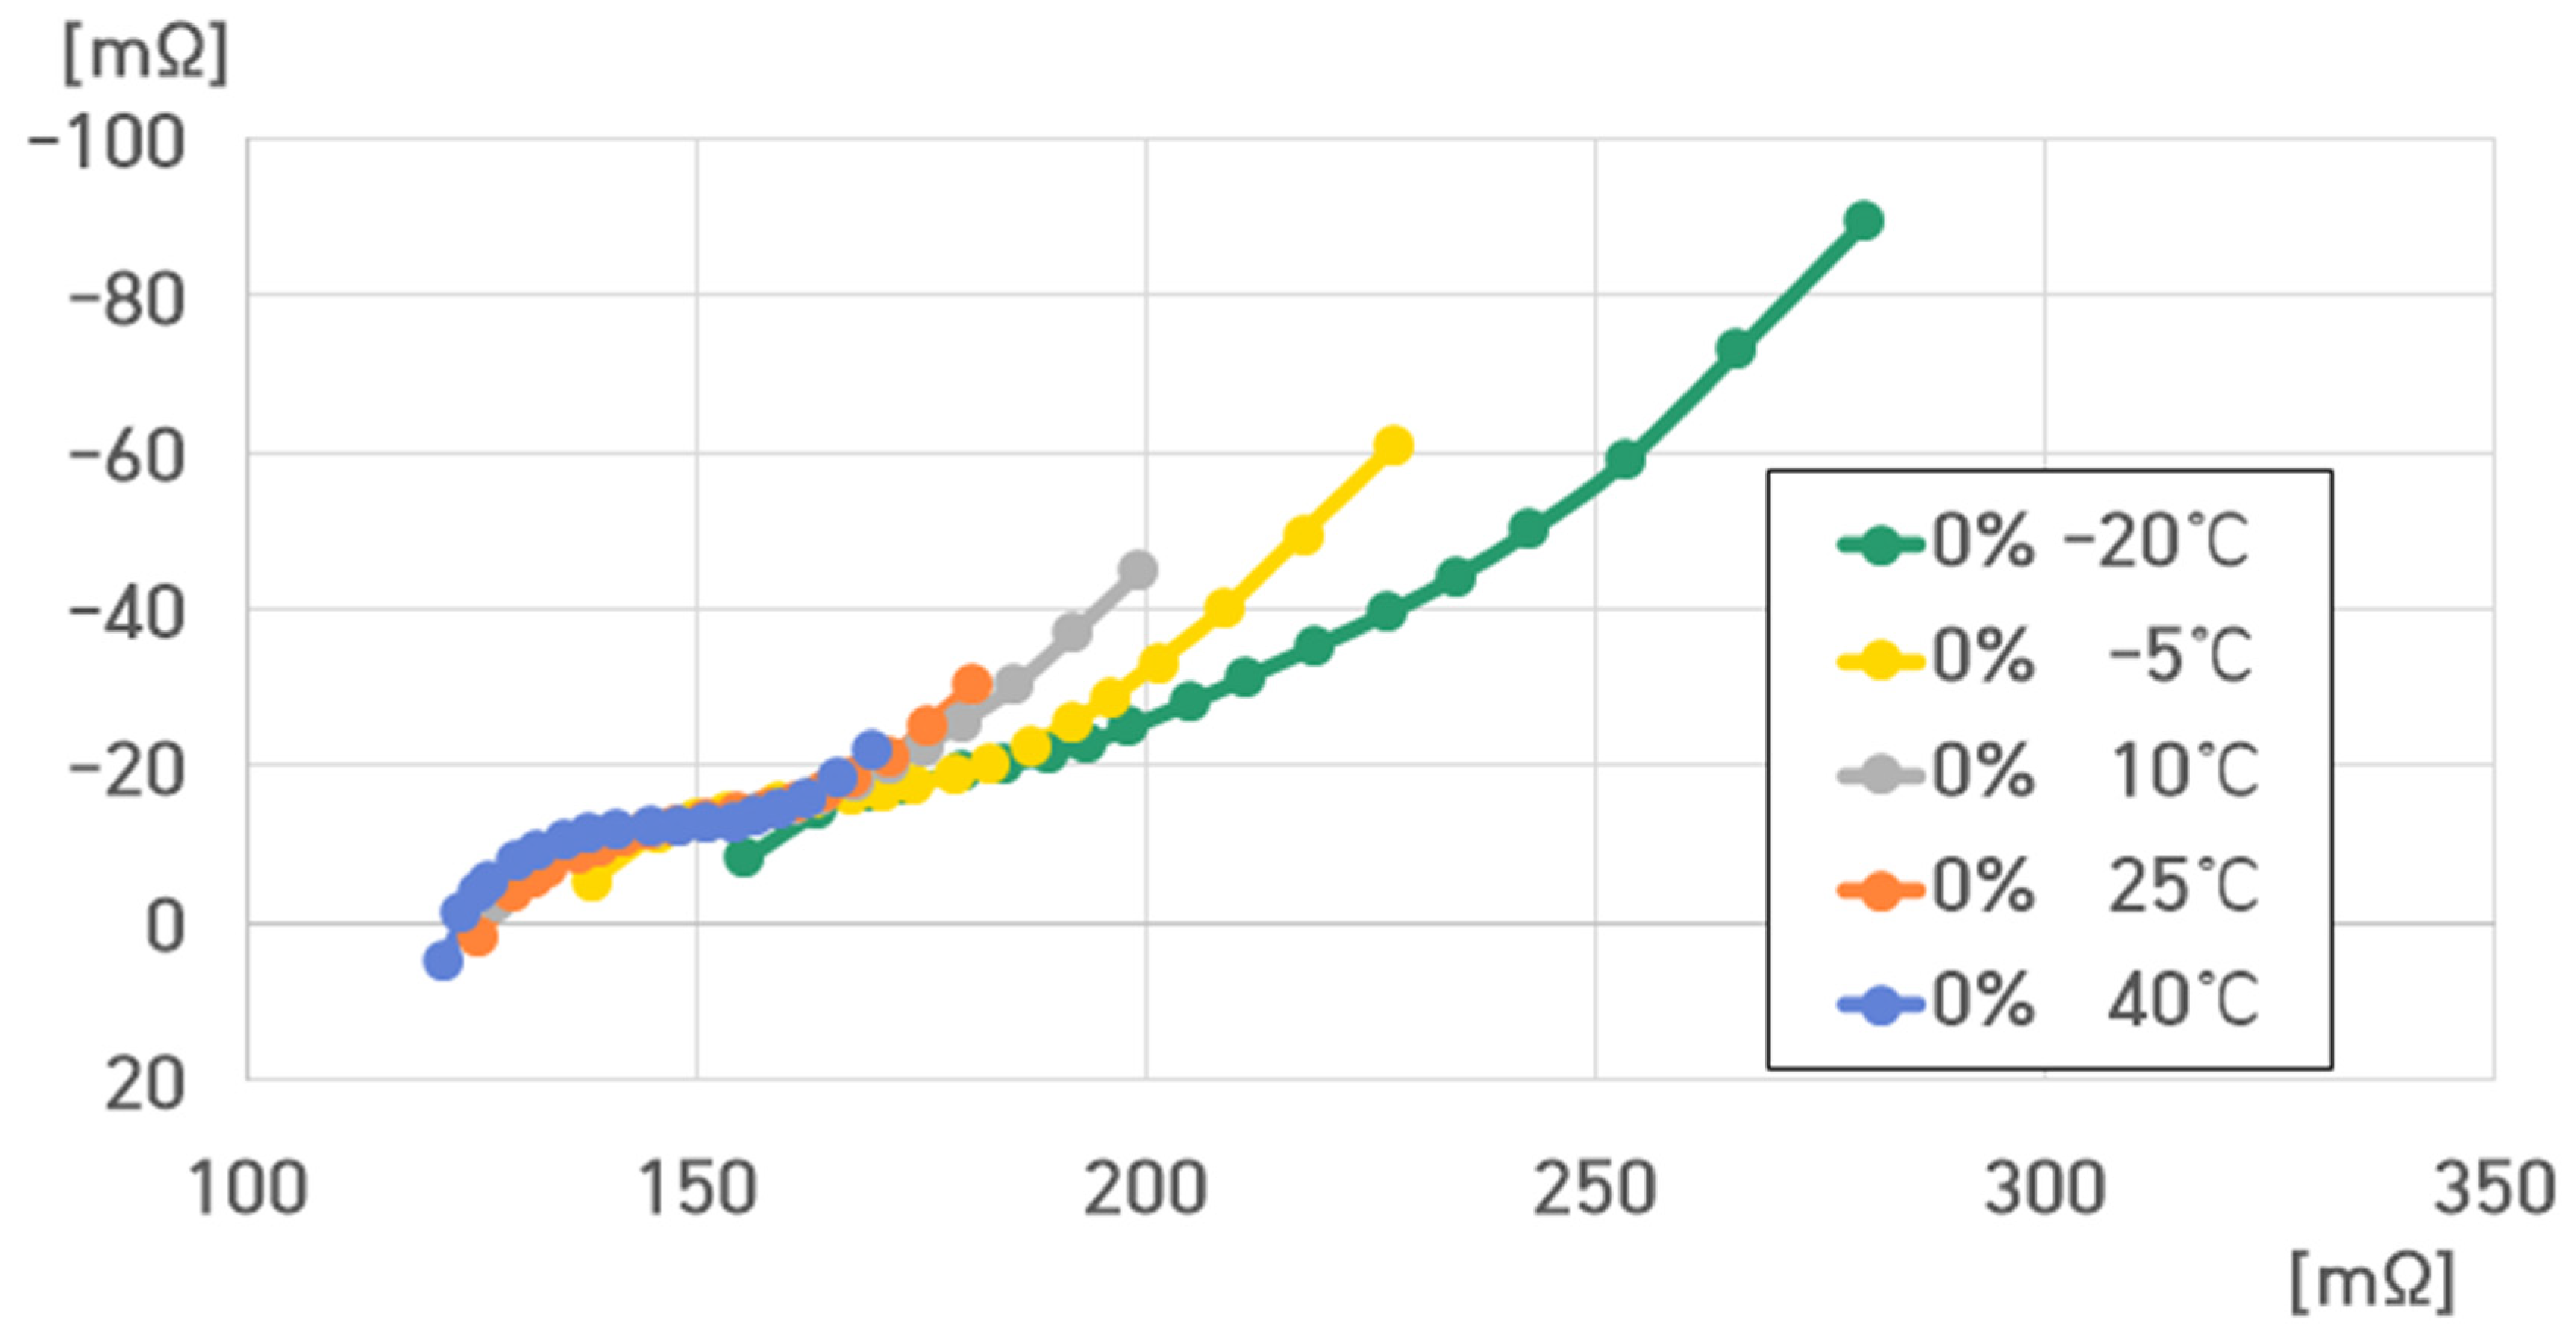
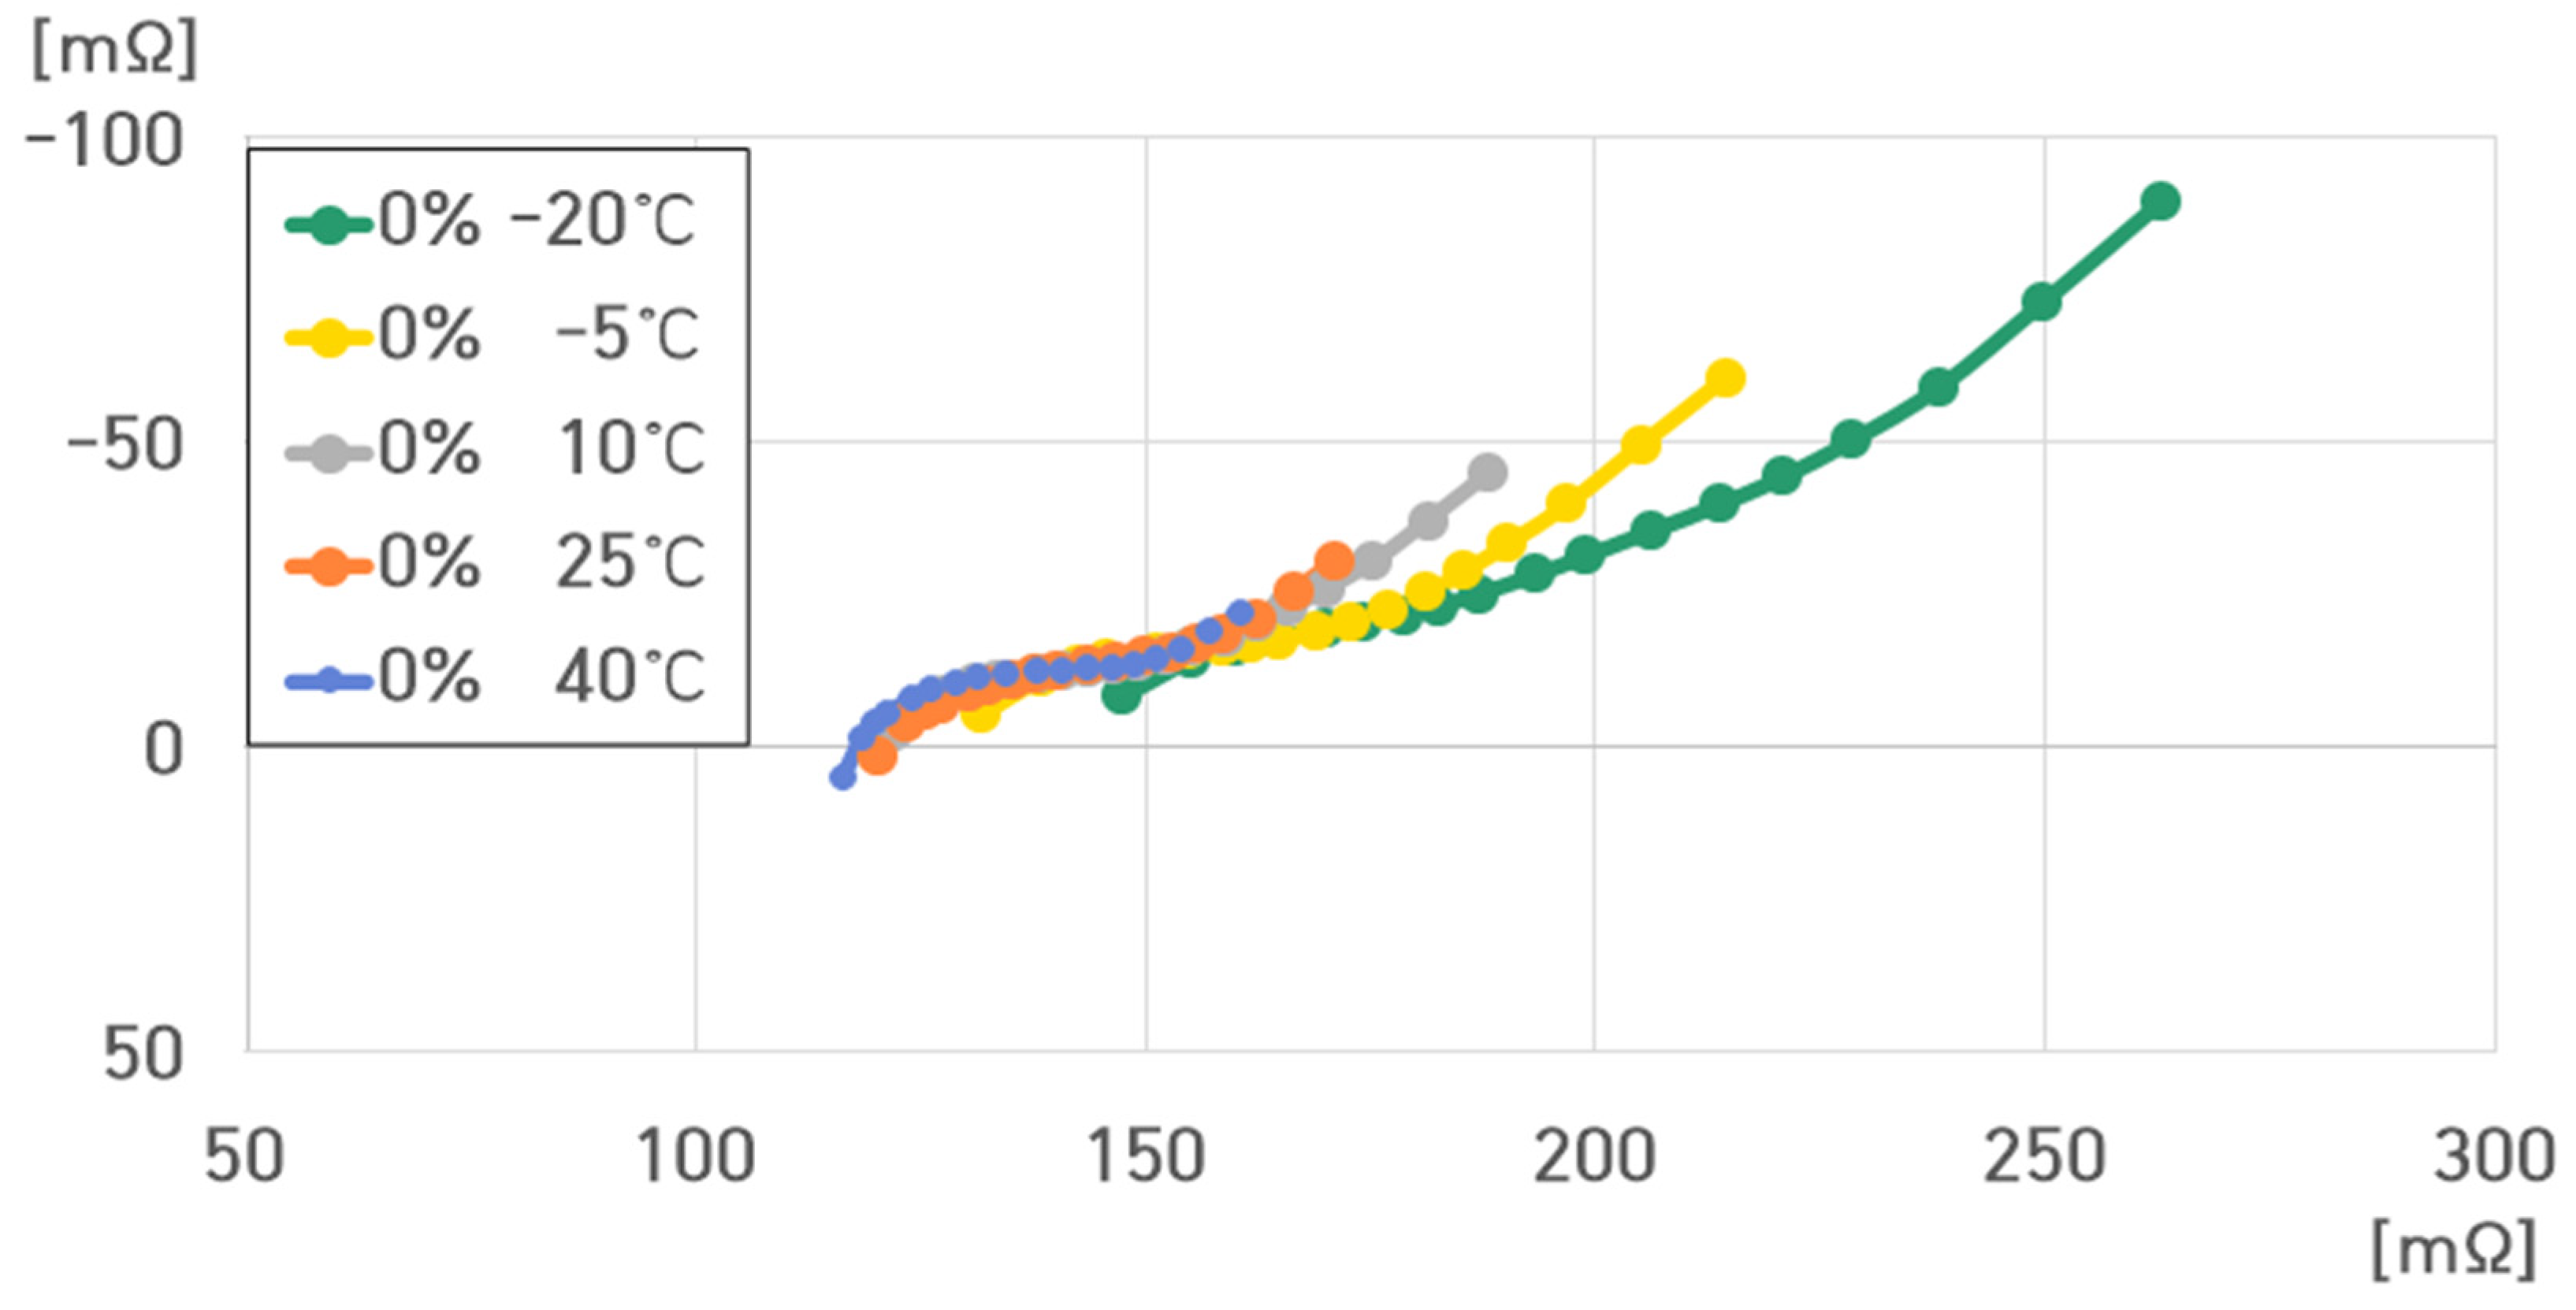
At 0% SoC, the voltage of the 4.4 kWh ESS was 40.0 V. Figure 23 depicts the impedance spectrum of the 4.4 kWh ESS at 0% SoC under varying temperatures.

Figure 23.
Impedance spectrum of the 16-cell ESS at different temperatures at 0% SoC.
The resistance value of the 4.4 kWh ESS at 0% SoC ranged from 121.639 to 279.797 mΩ.
At 0% SoC, , , , and were as follows:
- (1)
- 0% SoC, 40 °C: , , , ;
- (2)
- 0% SoC, 25 °C: , , , ;
- (3)
- 0% SoC, 10 °C: , , , ;
- (4)
- 0% SoC, −5 °C: , , , ;
- (5)
- 0% SoC, −20 °C: , , , .
, , and decreased with increasing temperature, and they increased with decreasing temperature.
At 0% SoC, rapidly increased compared to that at 100% and 50% SoC. Thus, increased with .
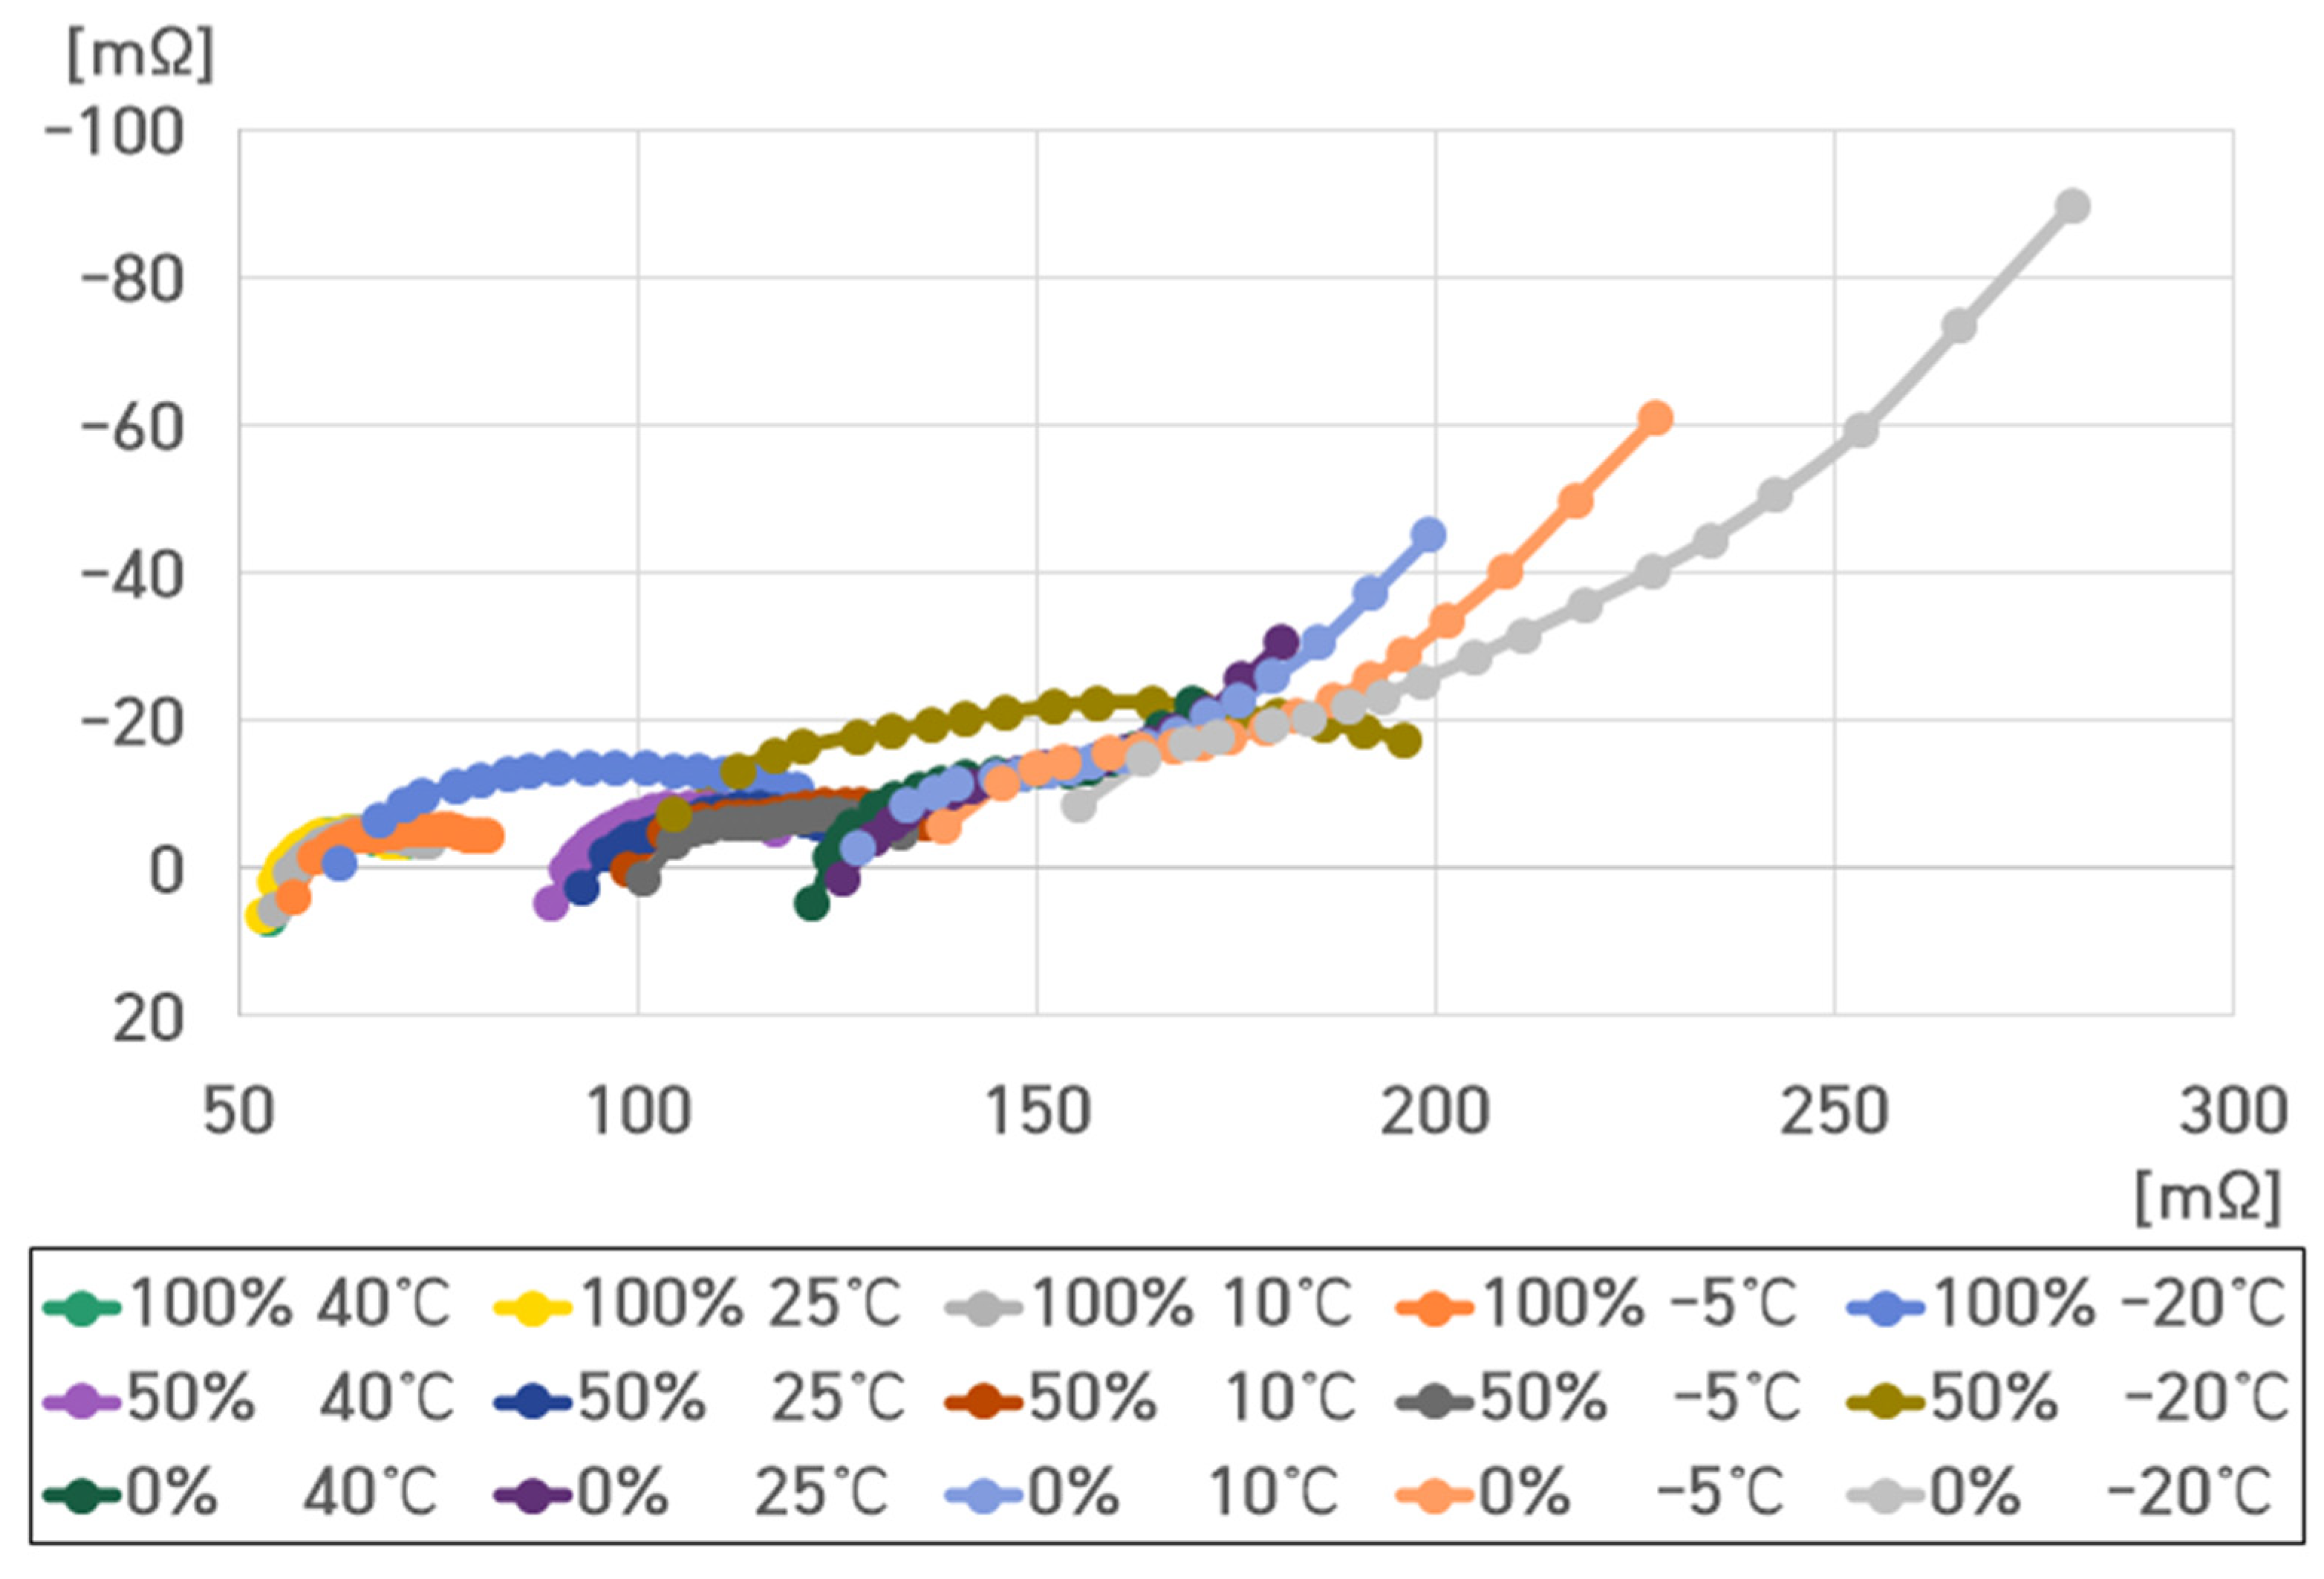
Figure 24, Figure 25, Figure 26 and Figure 27 exhibit the impedance spectra of the 16-cell ESS at 100%, 50%, and 0% SoCs under varying temperatures, unifying the ranges of the X and Y axes.

Figure 24.
Impedance spectrum of the 16-cell ESS under different SoCs and temperatures.
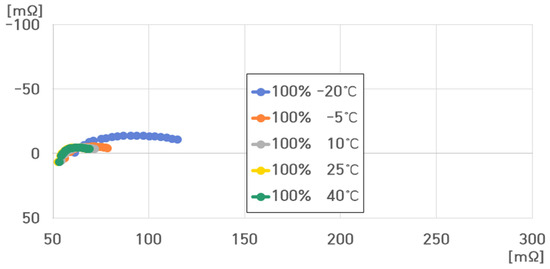
Figure 25.
Impedance spectrum of the 16-cell ESS at 100% SoC under different temperatures.
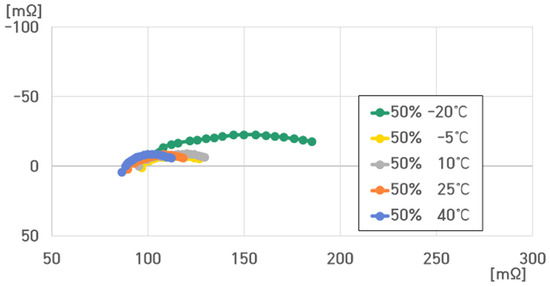
Figure 26.
Impedance spectrum of the 16-cell ESS at 50% SoC under different temperatures.
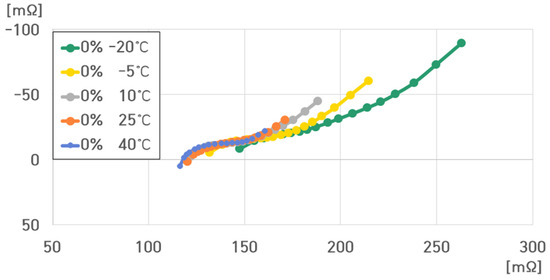
Figure 27.
Impedance spectrum of the 16-cell ESS at 0% SoC under different temperatures.
At 100% SoC, , , and were relatively small compared to those at SoC 50% and 0% SoC.
At 50% SoC, , , and were slightly higher than those at 100% SoC.
Particularly, at −20 °C, very rapidly increased at both 100% and 50% SoC.
At 0% SoC, , , and became very large and increased along the Y-axis with a slope of about 45°.
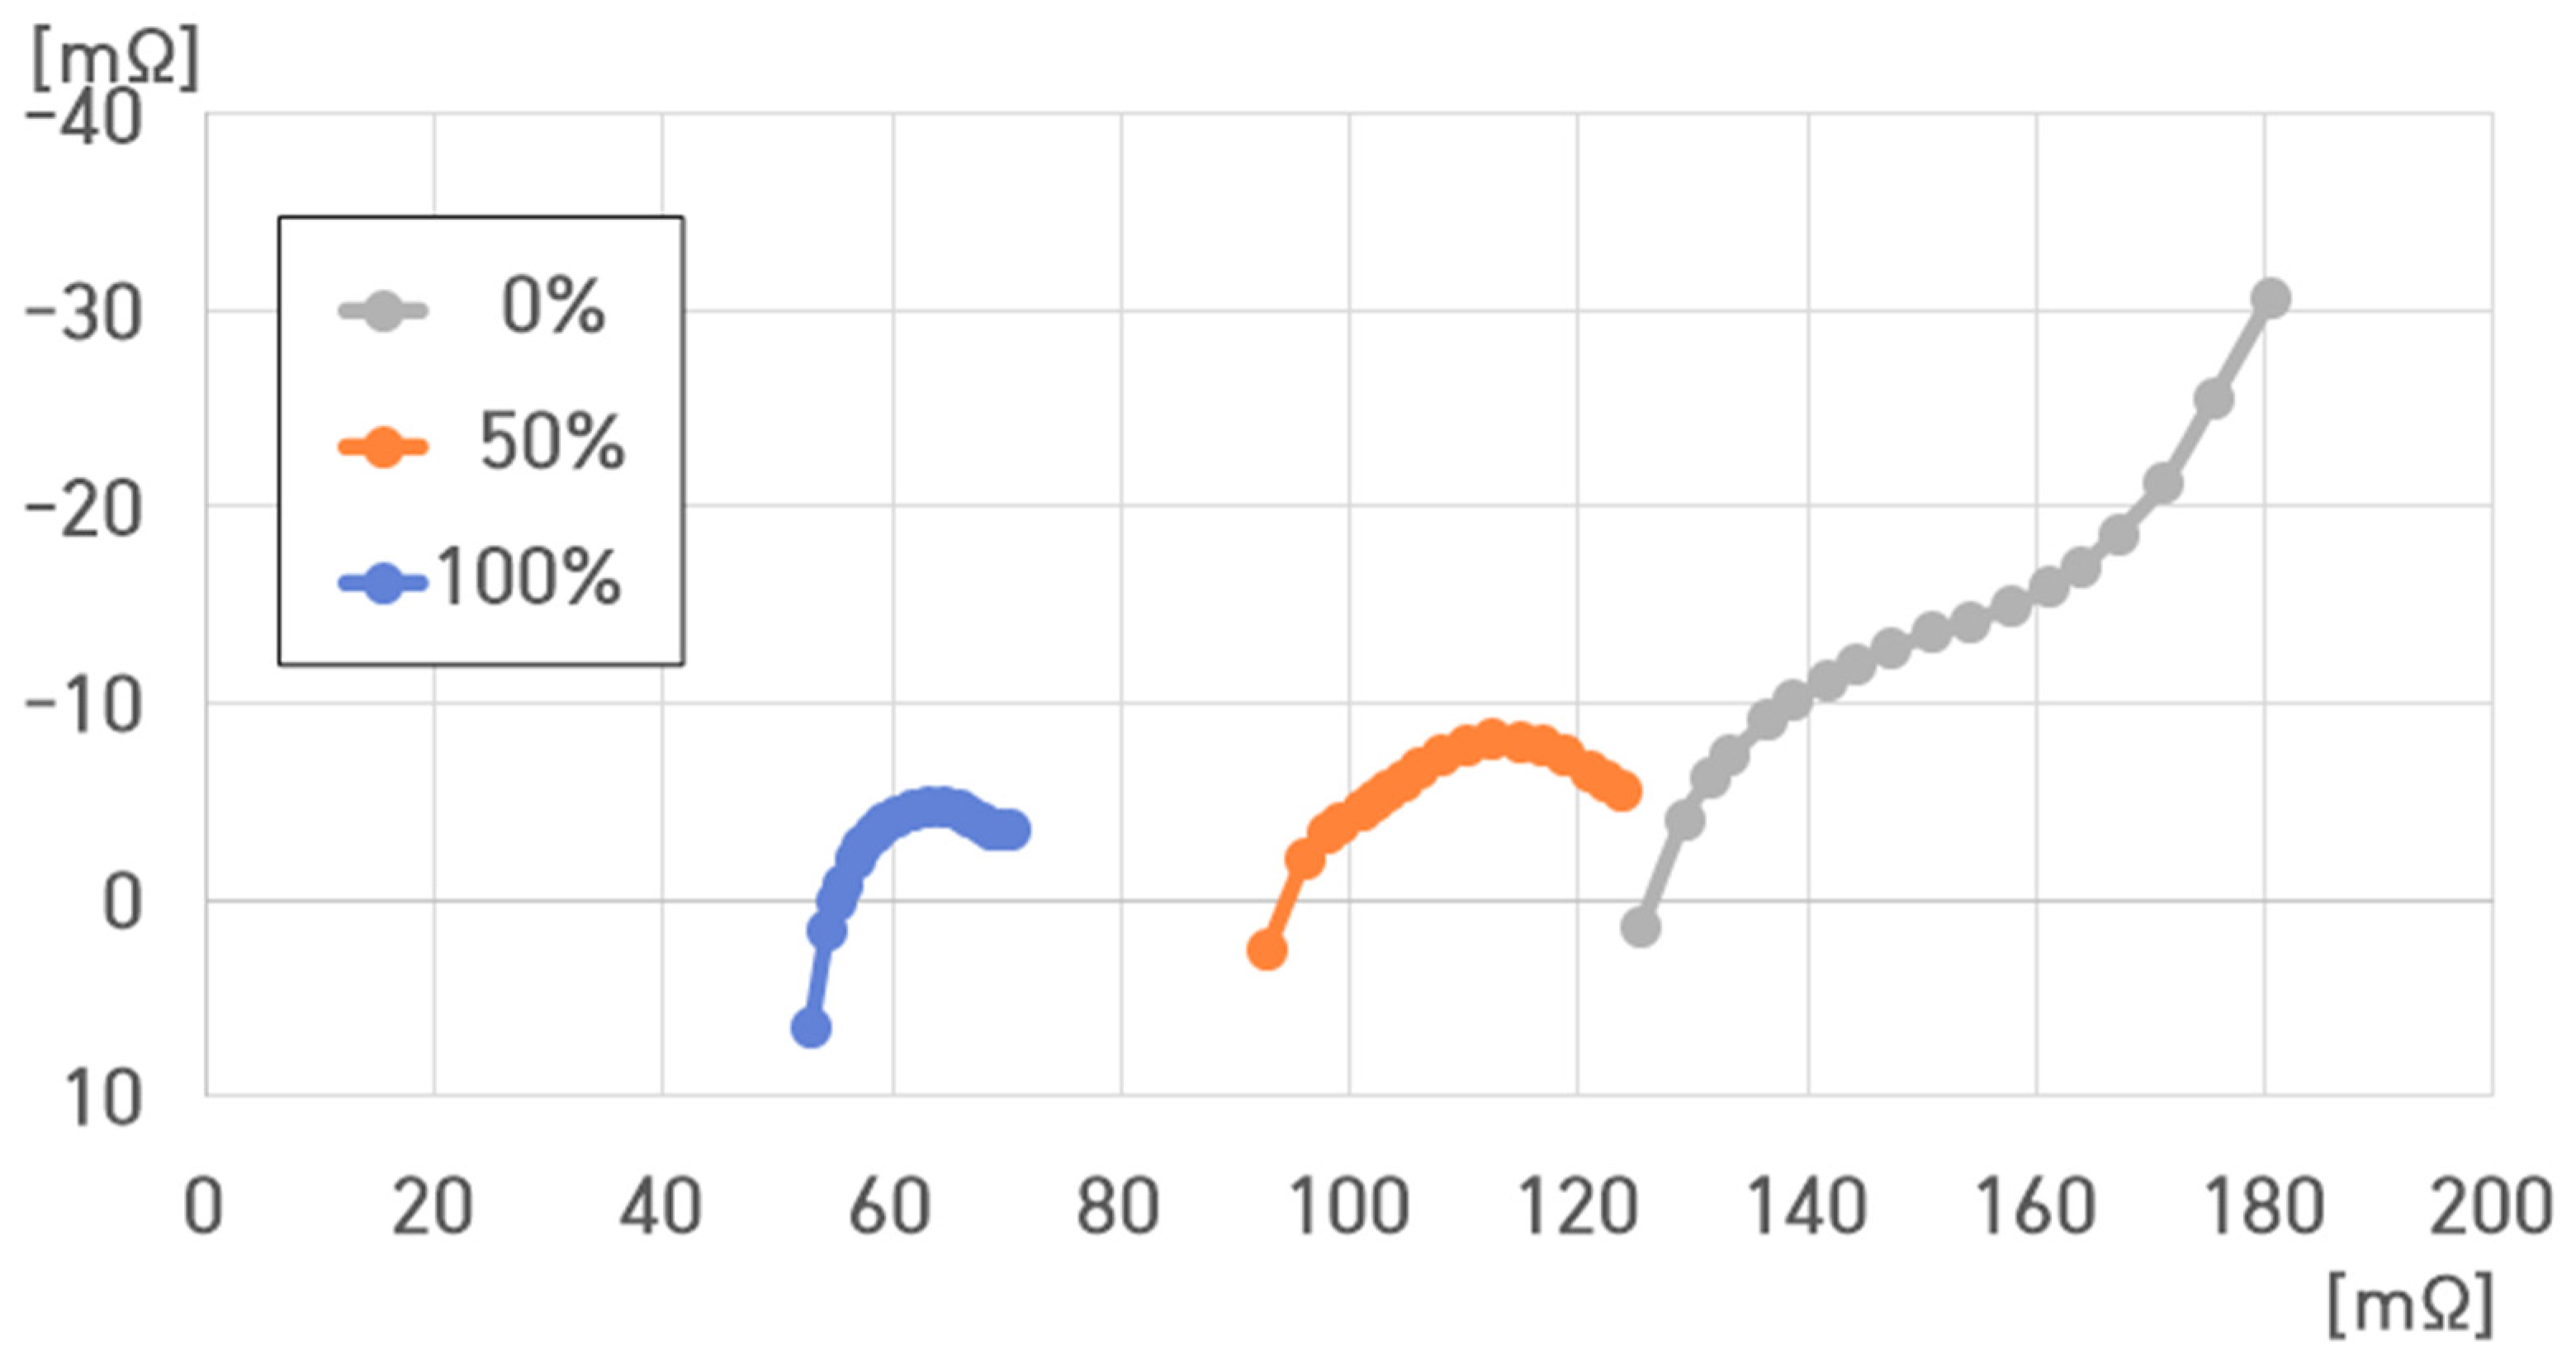
Figure 28 displays the impedance spectra of the 16-cell ESS at 0%, 50%, and 100% SoC under 40 °C.
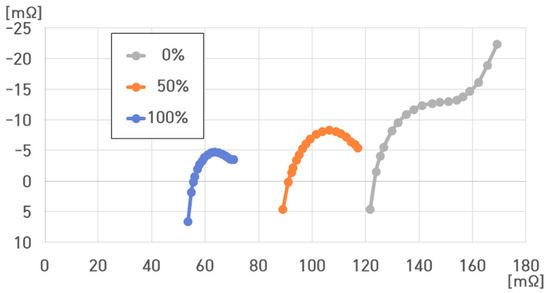
Figure 28.
Impedance spectrum of the ESS at different SoCs for 40 °C.
The resistance value of the 4.4 kWh 16-cell ESS at 40 °C ranged from 53.603 to 169.168 mΩ. , , , and were as follows:
- (1)
- 40 °C, 100% SoC: , , , ;
- (2)
- 40 °C, 50% SoC: , , , ;
- (3)
- 40 °C, 0% SoC: , , , .
Specifically, , , and decreased with increasing SoC and increased with decreasing SoC.
At 50% SoC, exhibited the minimum value, and at 0% SoC, rapidly increased compared to that at 100% and 50% SoC. increased with .
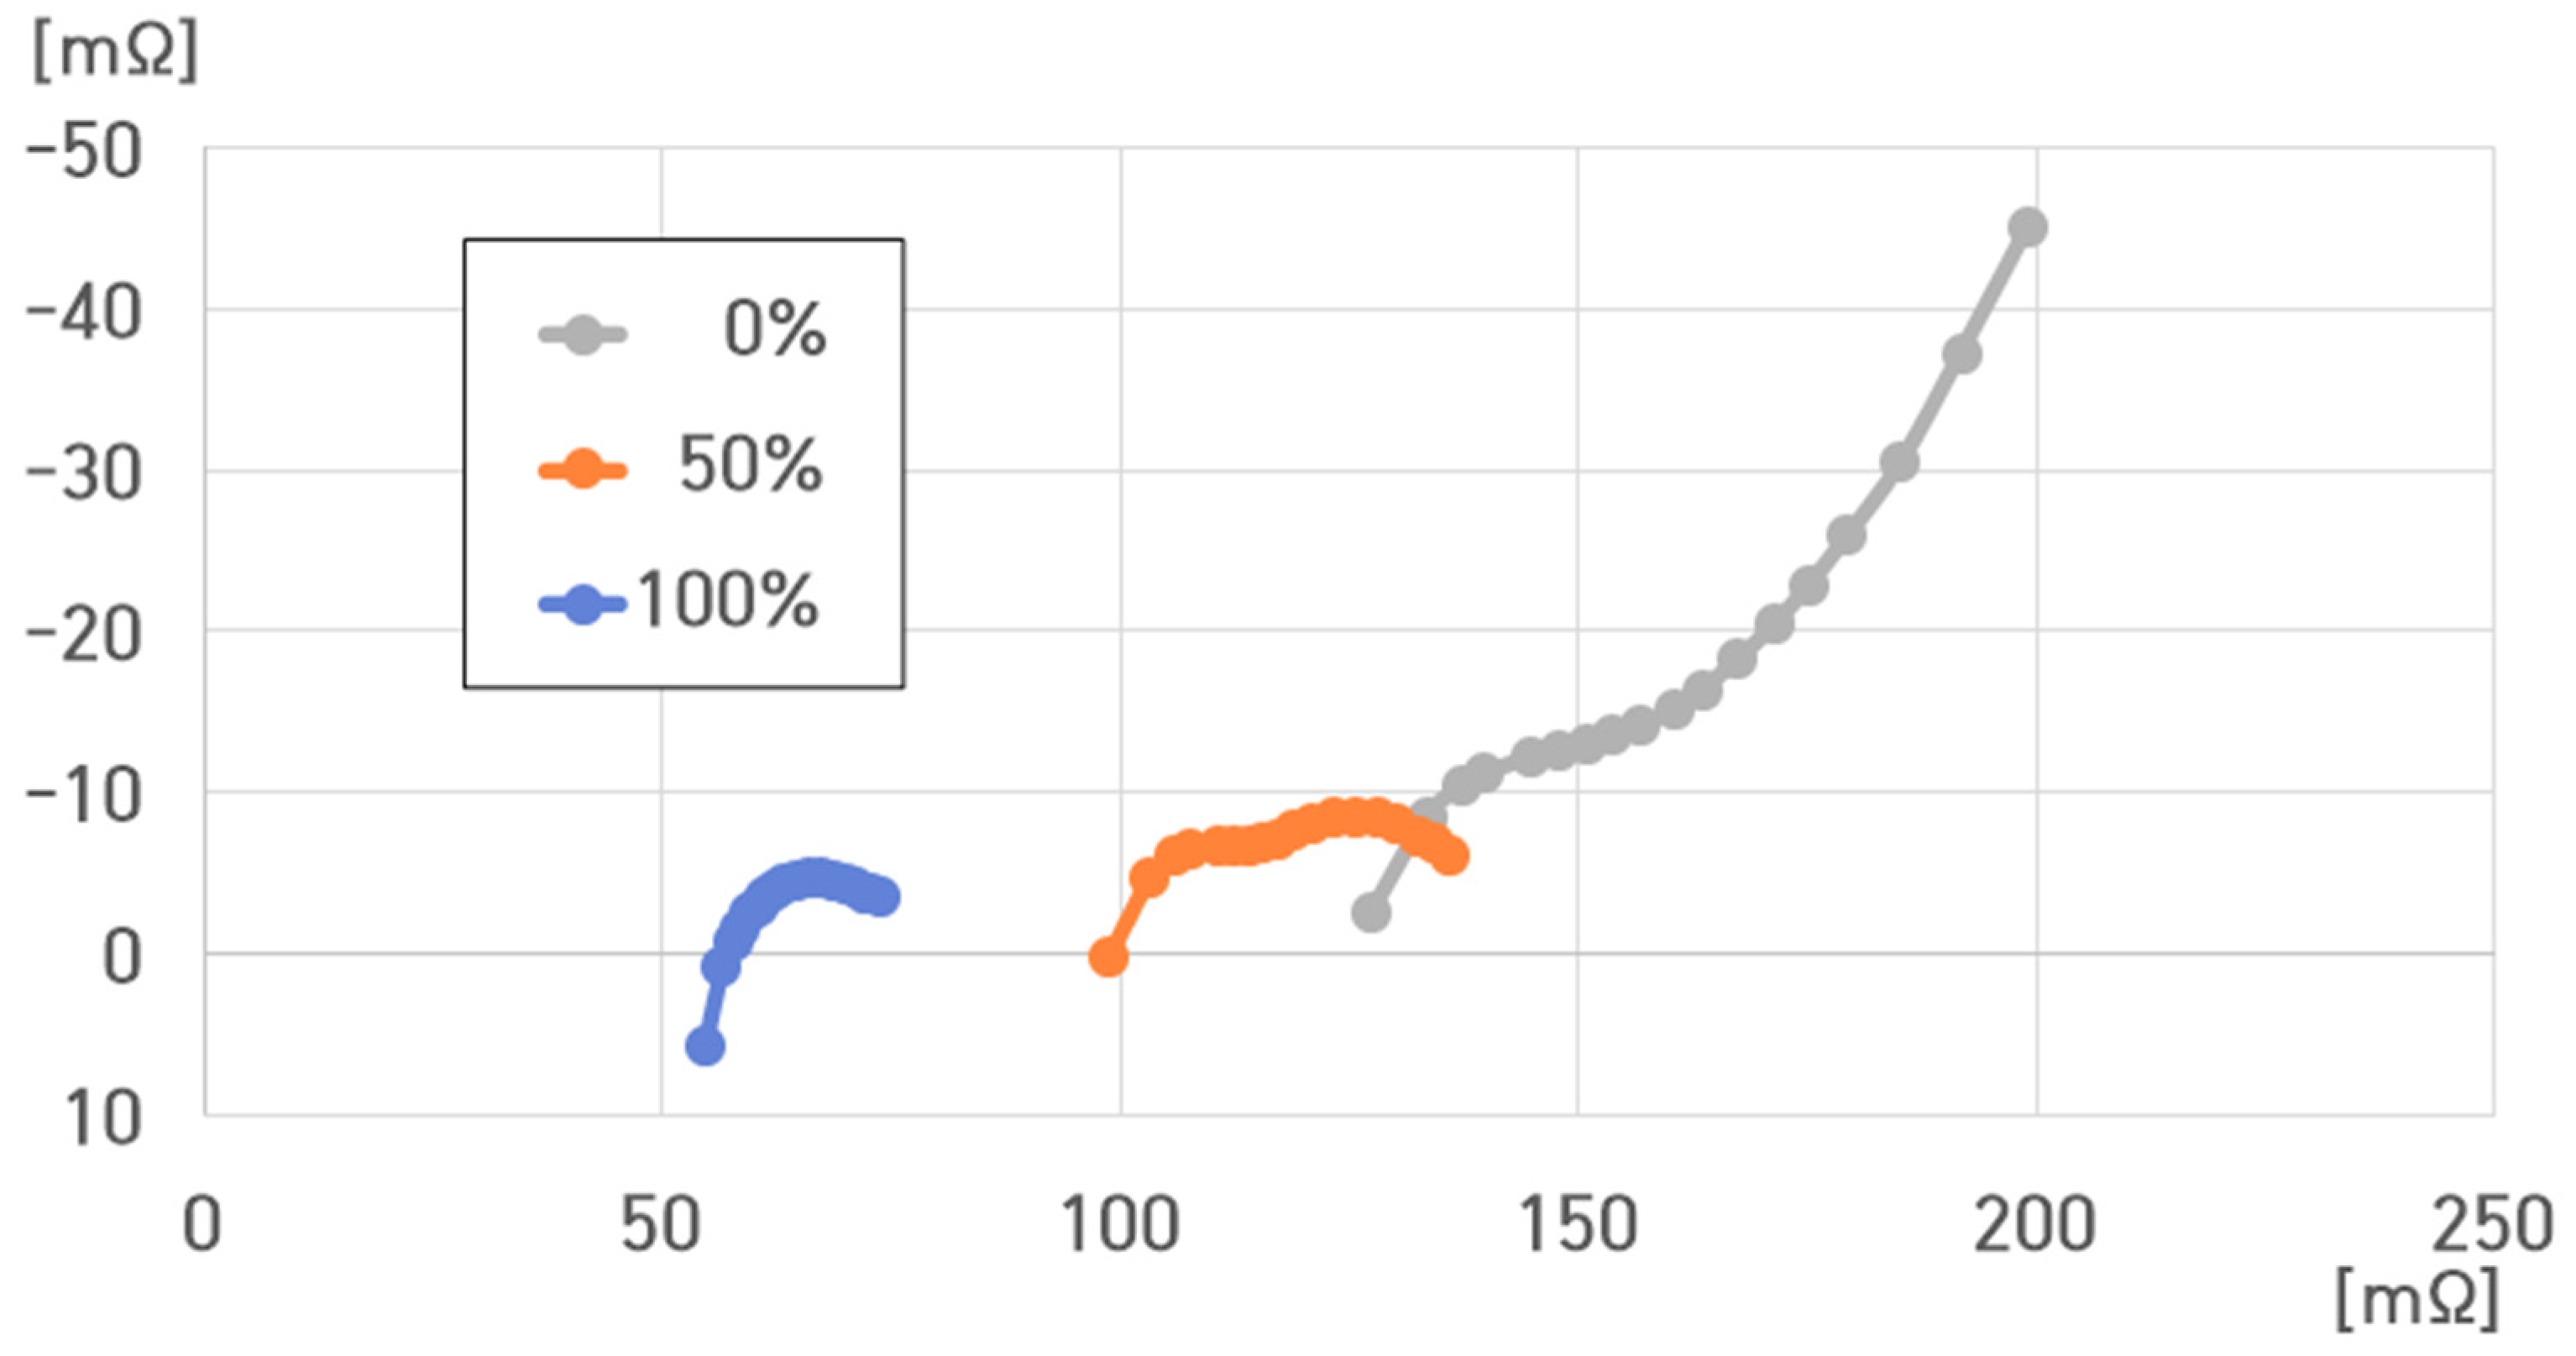
Figure 29 shows that the resistance value of the 4.4 kWh 16-cell ESS at 25 °C ranged from 52.991 to 180.482 mΩ. At 25 °C, , , , and were as follows:
- (1)
- 25 °C, 100% SoCs: , , , ;
- (2)
- 25 °C, 50% SoC: , , , ;
- (3)
- 25 °C, 0% SoC: , , , .

Figure 29.
Impedance spectrum of the 16-cell ESS at different SoCs for 25 °C.
Figure 29.
Impedance spectrum of the 16-cell ESS at different SoCs for 25 °C.
At 25 °C, , , and decreased with increasing SoC.
Moreover, increased with decreasing SoC.
At 50% SoC, exhibited the minimum value, and at 0% SoC, rapidly increased compared to that at 100% and 50% SoC. Hence, at 0% SoC, increased with .
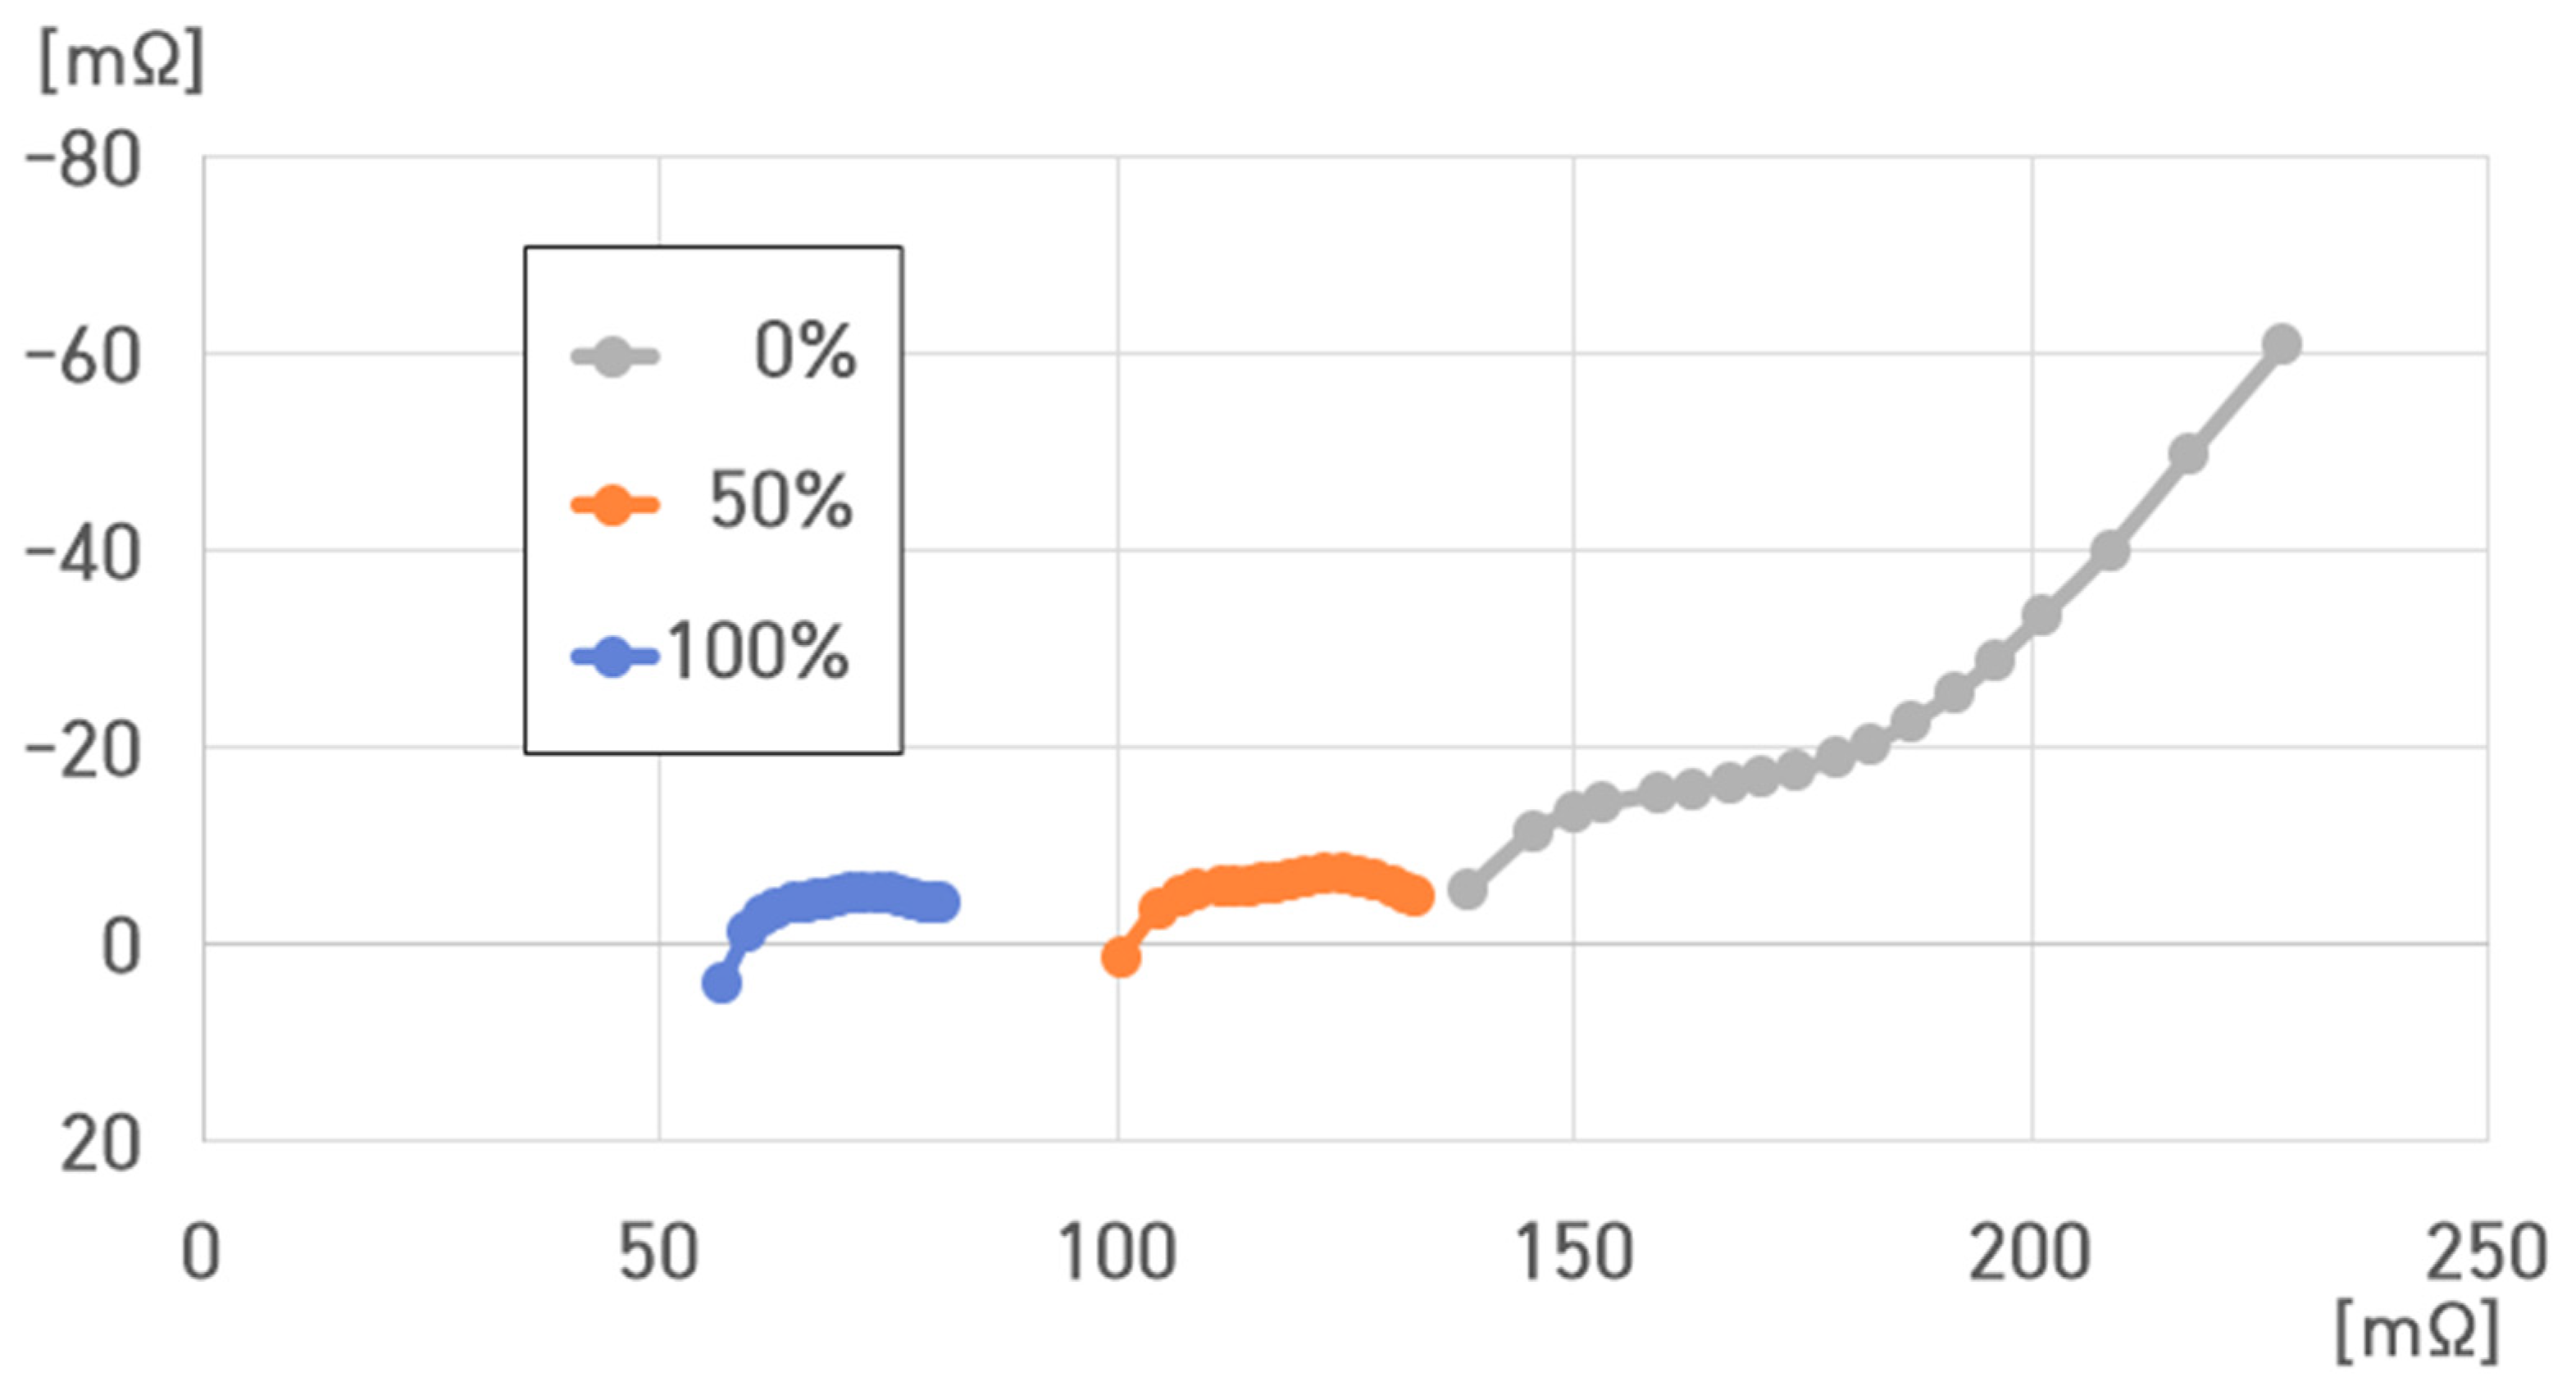
Figure 30 denotes that the resistance value of the 4.4 kWh ESS under 10 °C ranged from 54.557 to 199.100 mΩ. The , , , and values were as follows:
- (1)
- 10 °C, 100% SoC: , , , ;
- (2)
- 10 °C, 50% SoC: , , , ;
- (3)
- 10 °C, 0% SoC: , , , .

Figure 30.
Impedance spectrum of the 16-cell ESS at different SoCs for 10 °C.
Figure 30.
Impedance spectrum of the 16-cell ESS at different SoCs for 10 °C.
, , and decreased with increasing SoC.
Furthermore, they increased with decreasing SoC.
At 0% SoC, rapidly increased compared to that at 100% and 50% SoC.
Therefore, at 0% SoC, increased with .
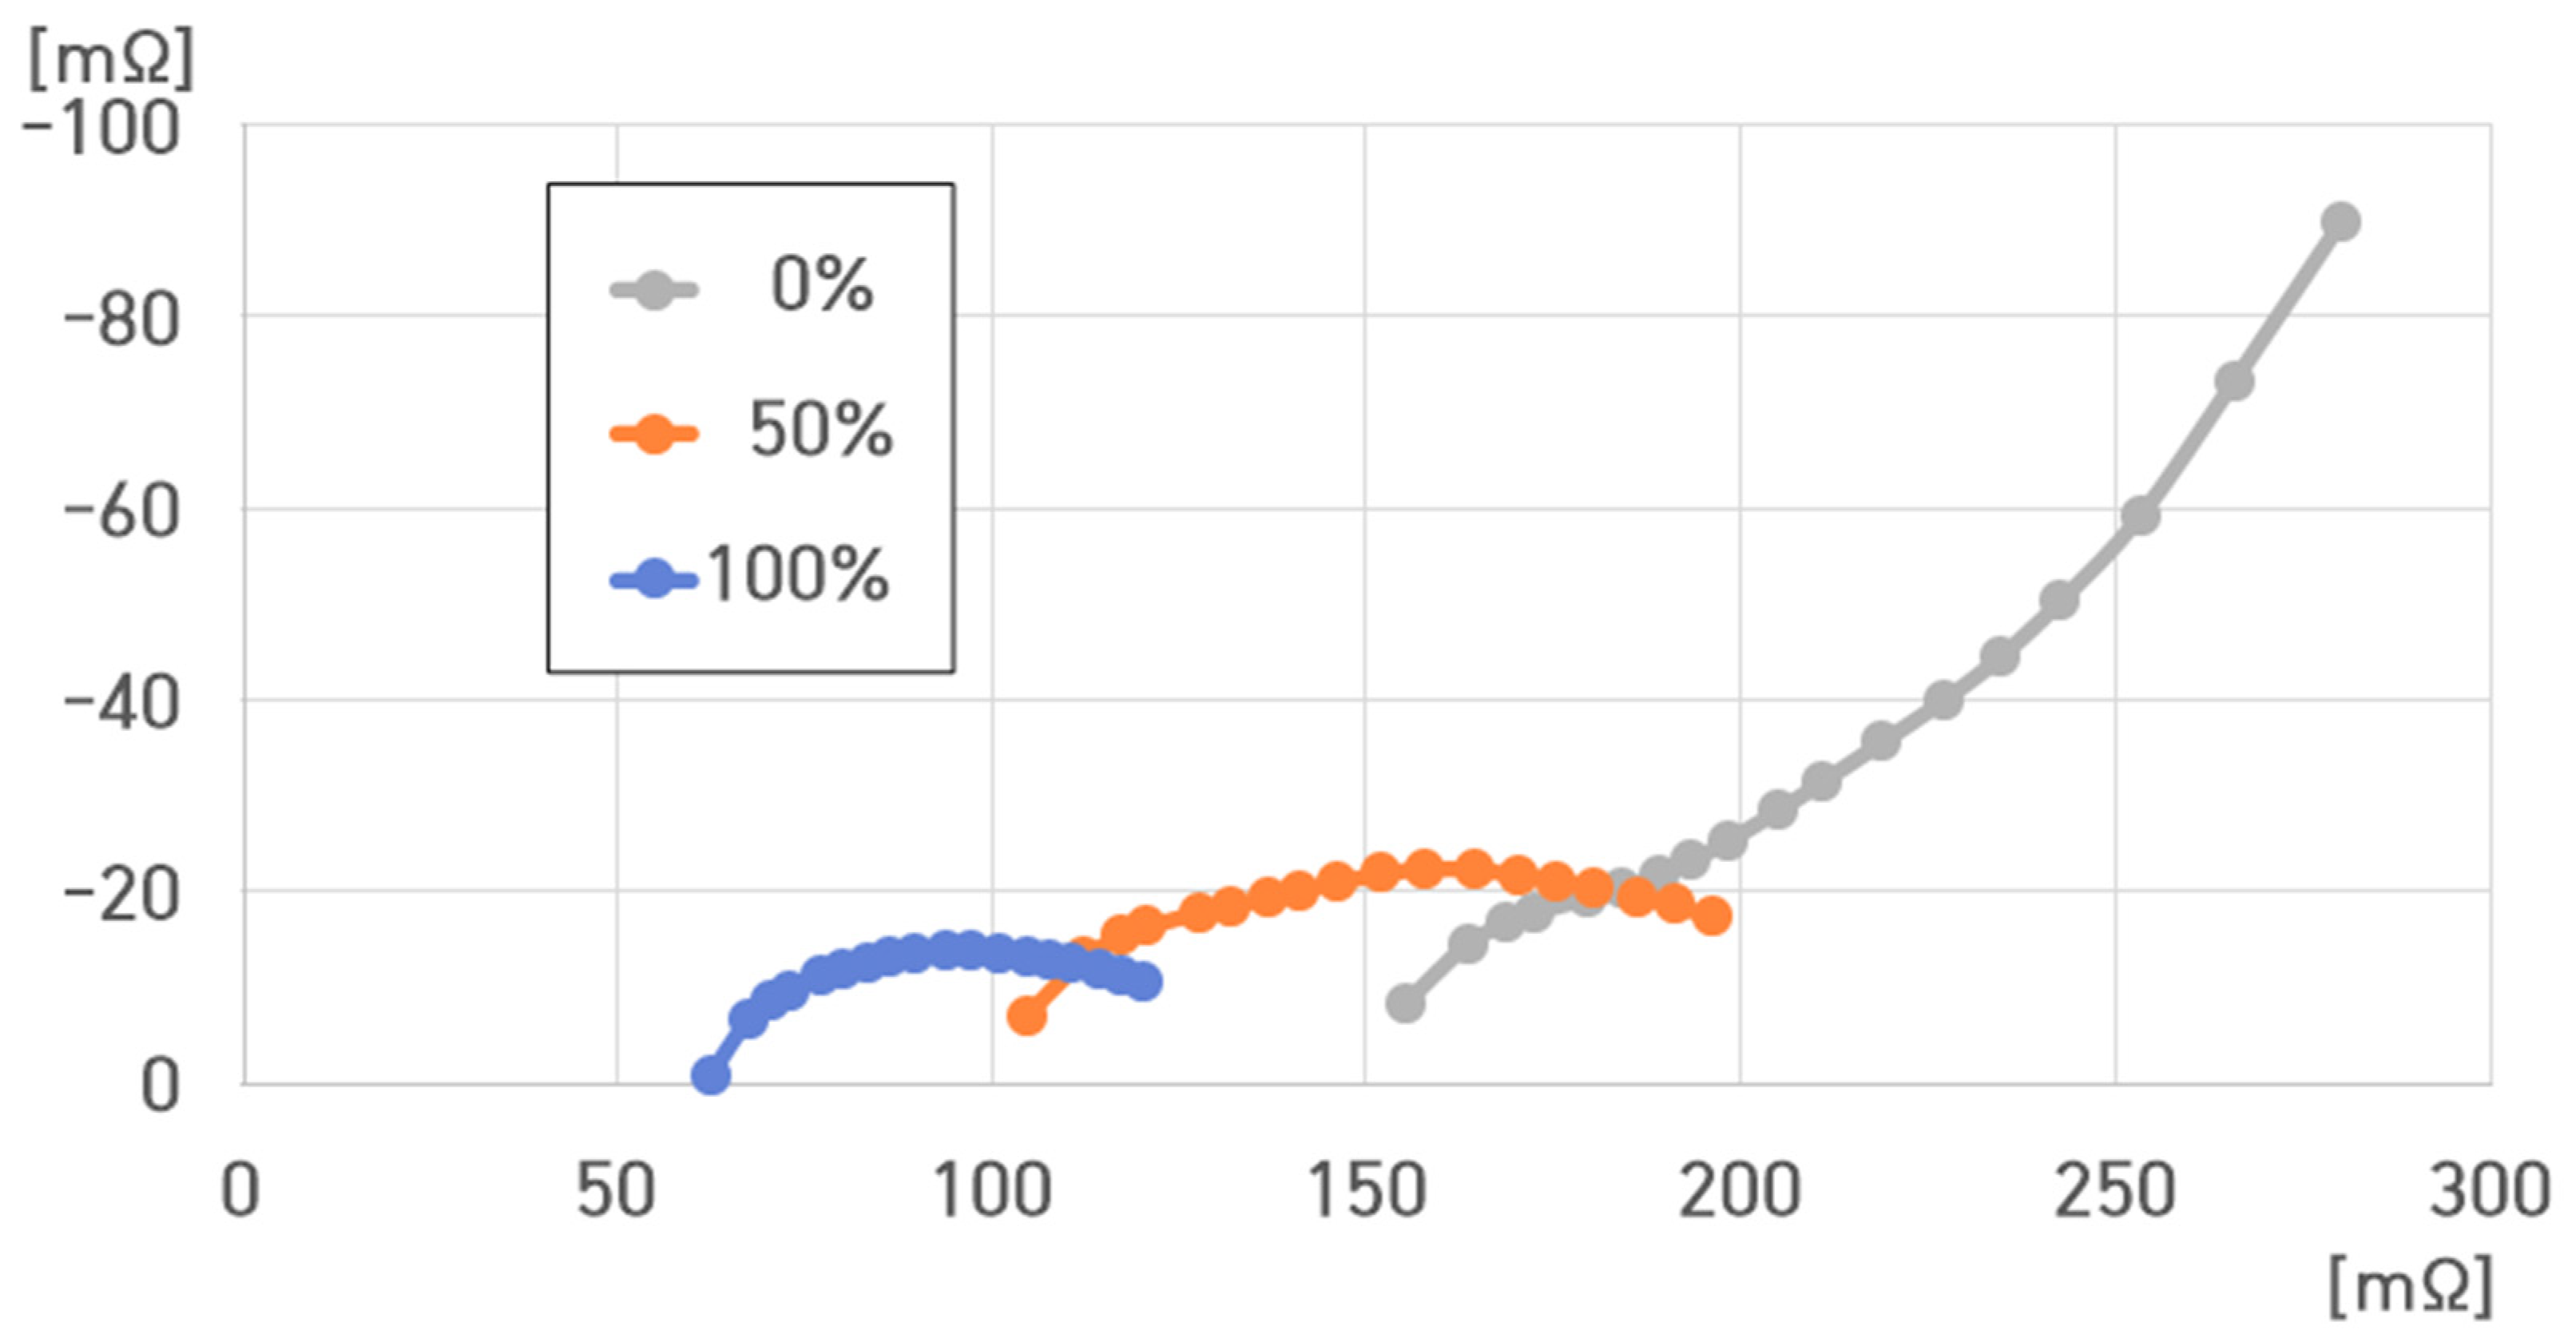
The resistance value of the 4.4 kWh 16-cell ESS was 56.682–227.427 mΩ under −5 °C (Figure 31). At −5 °C, , , , and were as follows:
- (1)
- −5 °C, 100% SoC: , , , ;
- (2)
- −5 °C, 50% SoC: , , , ;
- (3)
- −5 °C, 0% SoC: , , , .

Figure 31.
Impedance spectrum of the 16-cell ESS at different SoCs for −5 °C.
Figure 31.
Impedance spectrum of the 16-cell ESS at different SoCs for −5 °C.
, , and decreased with increasing SoC and increased with decreasing SoC.
At 50% SoC, exhibited the minimum value, and at 0% SoC, rapidly increased compared to that at 100% and 50% SoC.
Hence, at 0% SoC, increased with .
Figure 32 denotes that the resistance value of the 4.4 kWh 16-cell ESS at −20 °C ranged from 62.375 to 279.797 mΩ.
, , , and were as follows:
- (1)
- −20 °C, 100% SoC: , , , ;
- (2)
- −20 °C, 50% SoC: , , , ;
- (3)
- −20 °C, 0% SoC: , , , .

Figure 32.
Impedance spectrum of the ESS at different SoCs for −20 °C.
Figure 32.
Impedance spectrum of the ESS at different SoCs for −20 °C.
, , and decreased with increasing SoC.
Conversely, they increased with decreasing SoC.
At 0% SoC, rapidly increased compared to that at 100% and 50% SoC.
Thus, at 0% SoC, increased with .
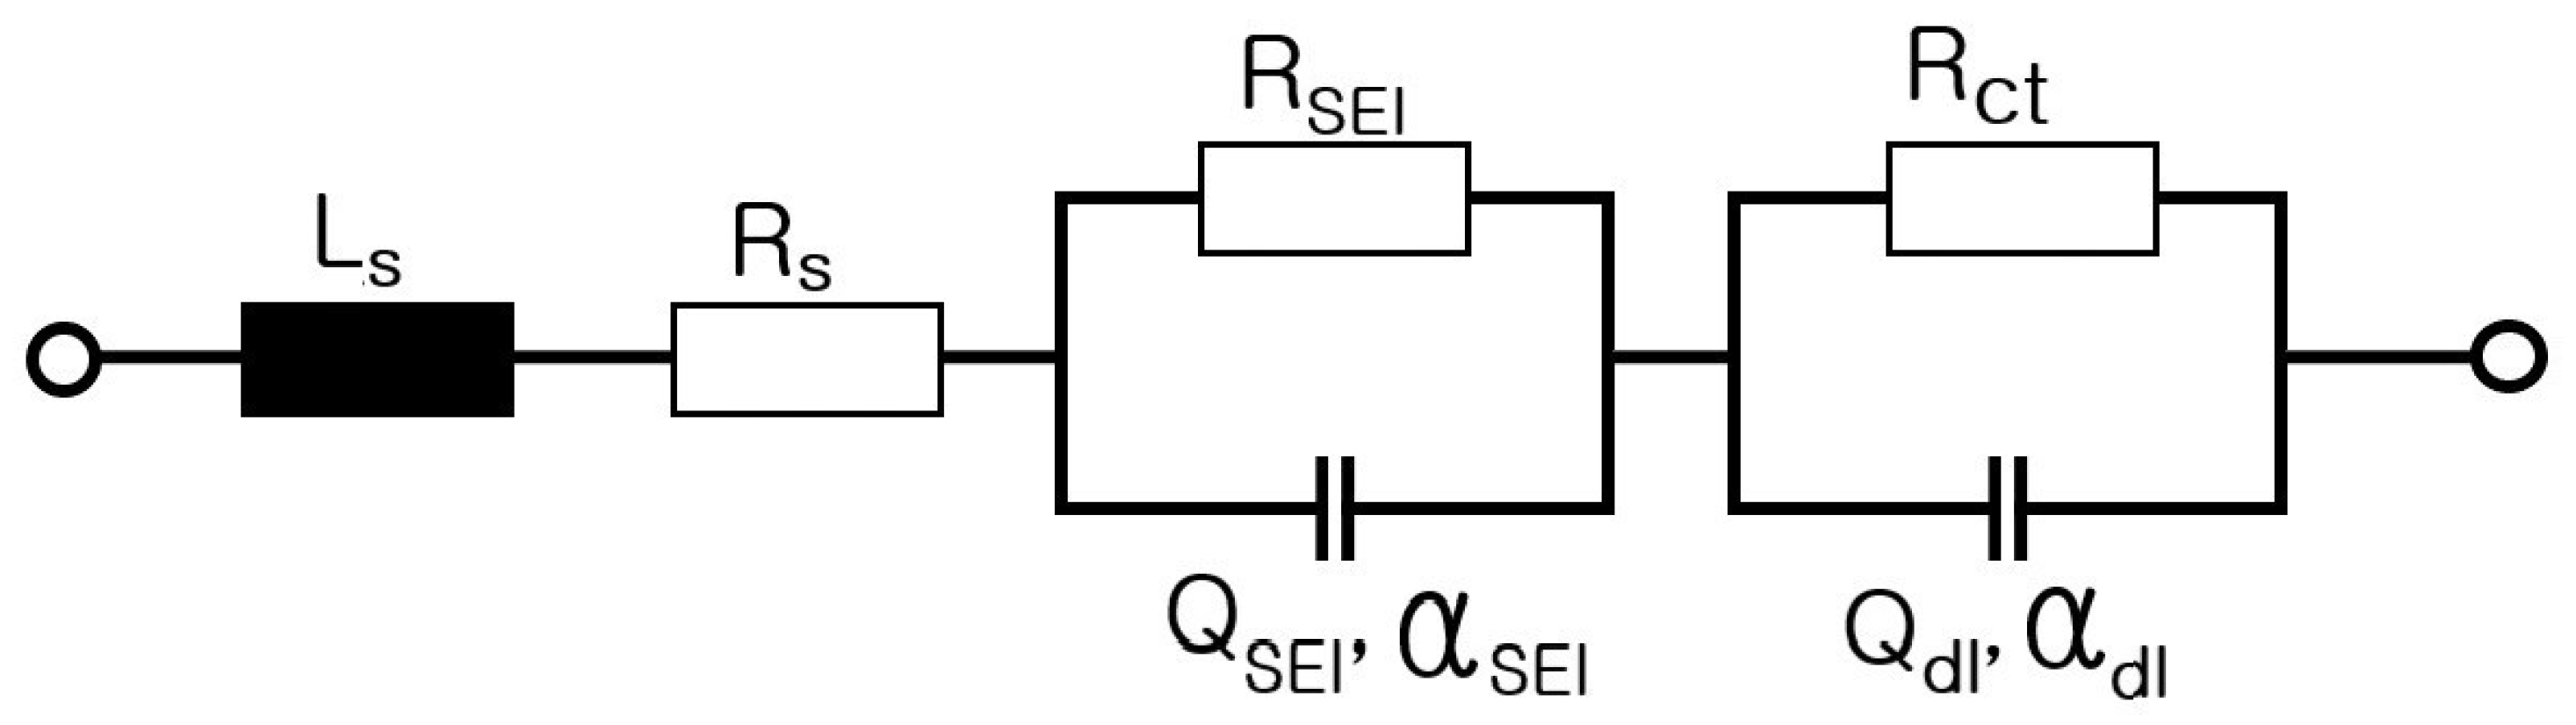
Figure 9, Figure 10, Figure 11, Figure 12, Figure 13, Figure 14, Figure 15, Figure 16, Figure 17, Figure 18, Figure 19, Figure 20, Figure 21, Figure 22, Figure 23, Figure 24, Figure 25, Figure 26, Figure 27, Figure 28, Figure 29, Figure 30, Figure 31 and Figure 32 present the impedance characteristics of pouch-type lithium-ion batteries. They experimentally analyze the variations of , , , and . Figure 33 displays the electrical equivalent circuit of a lithium-ion battery.
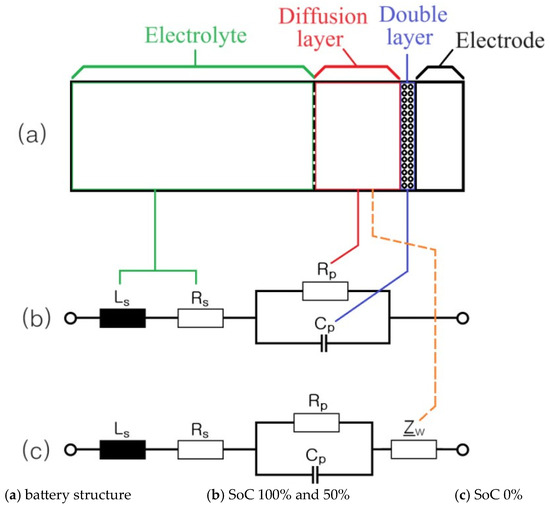
Figure 33.
Electrical equivalent circuit corresponding to the lithium-ion battery.
Figure 9, Figure 10, Figure 11, Figure 12, Figure 13, Figure 14, Figure 15, Figure 16, Figure 17, Figure 18, Figure 19, Figure 20, Figure 21, Figure 22, Figure 23, Figure 24, Figure 25, Figure 26, Figure 27, Figure 28, Figure 29, Figure 30, Figure 31 and Figure 32 highlight that is more significantly affected by SoC than temperature. Furthermore, is more significantly affected by temperature than SoC.
Specifically, rapidly increased at temperatures below −20 °C, and rapidly increased at 0% SoC.
Additionally, was greatly influenced by the structure or shape (cylindrical or straight shaped) of the electrode throughout the battery. The value of the diffusion area rapidly increased and decreased with decreasing temperature and SoC, respectively.
Further research is required to determine whether Ls, , , and are completely related to the performance of lithium-ion batteries.
However, beyond a certain range, the sharp increases in and could stem from the decrease in the ESS performance.
Since the occurrence of had the greatest influence on the increase in the internal resistance of lithium-ion batteries, a battery management system (BMS) should be incorporated.
6. Modeling of ESS and Analysis of Electrical Characteristics According to Frequency
Lithium-ion battery models include the (1) Rint model, (2) Thevenin model, (3) dual-polarization model, (4) N RC model, (5) RC model, and (6) PNGV model [2].
This study employed the Thevenin model, which is the most widely used model, and performed analysis by adding an .
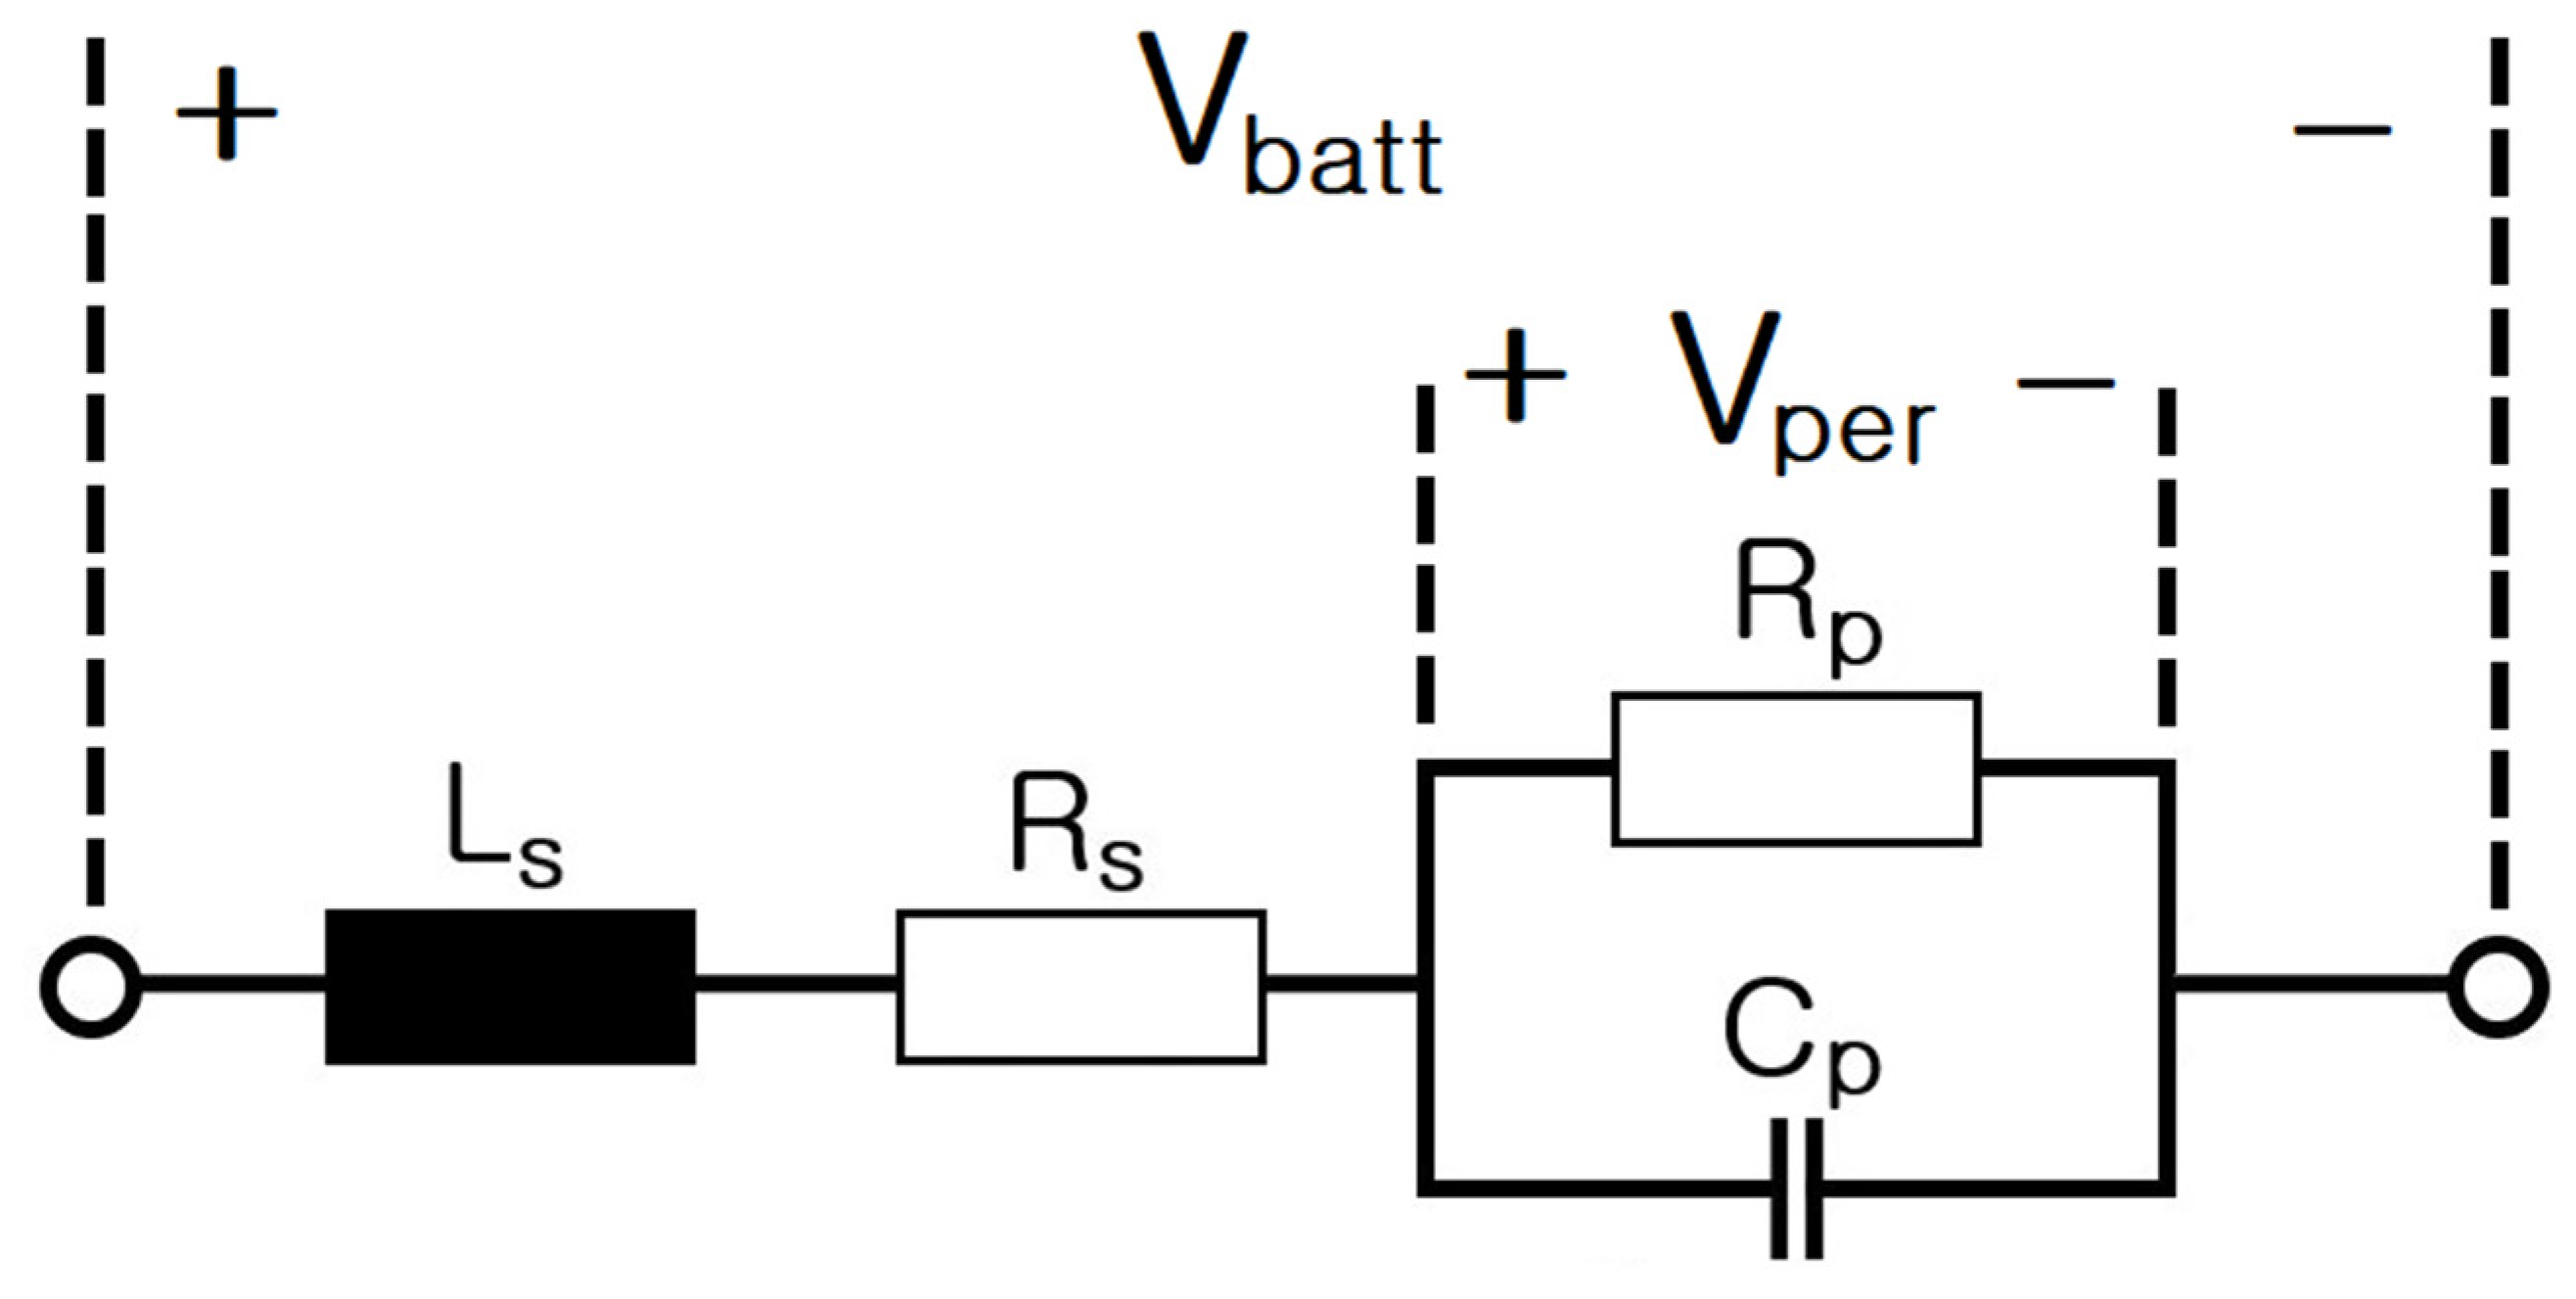
Figure 34 illustrates the simplified electrical equivalent circuit of an ESS based on lithium-ion batteries.
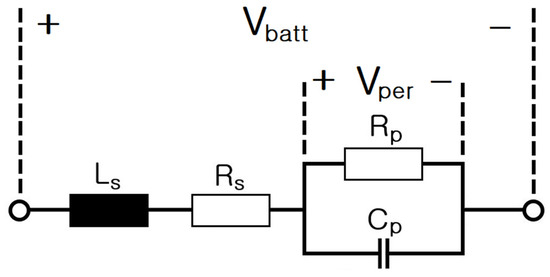
Figure 34.
Electrical equivalent circuit of a simplified ESS.
When voltage is generated in the ESS and a current is flowing through it, the voltages of , , and can be converted using Laplace transform as follows:
Therefore, the Laplace transform of the ESS voltage is as follows:
The ESS transfer function can be written as follows:
Based on the , , , and values obtained in the previous experimental results, the gain margin (GM) and phase margin (PM) were calculated using MATLAB Version 9.4.
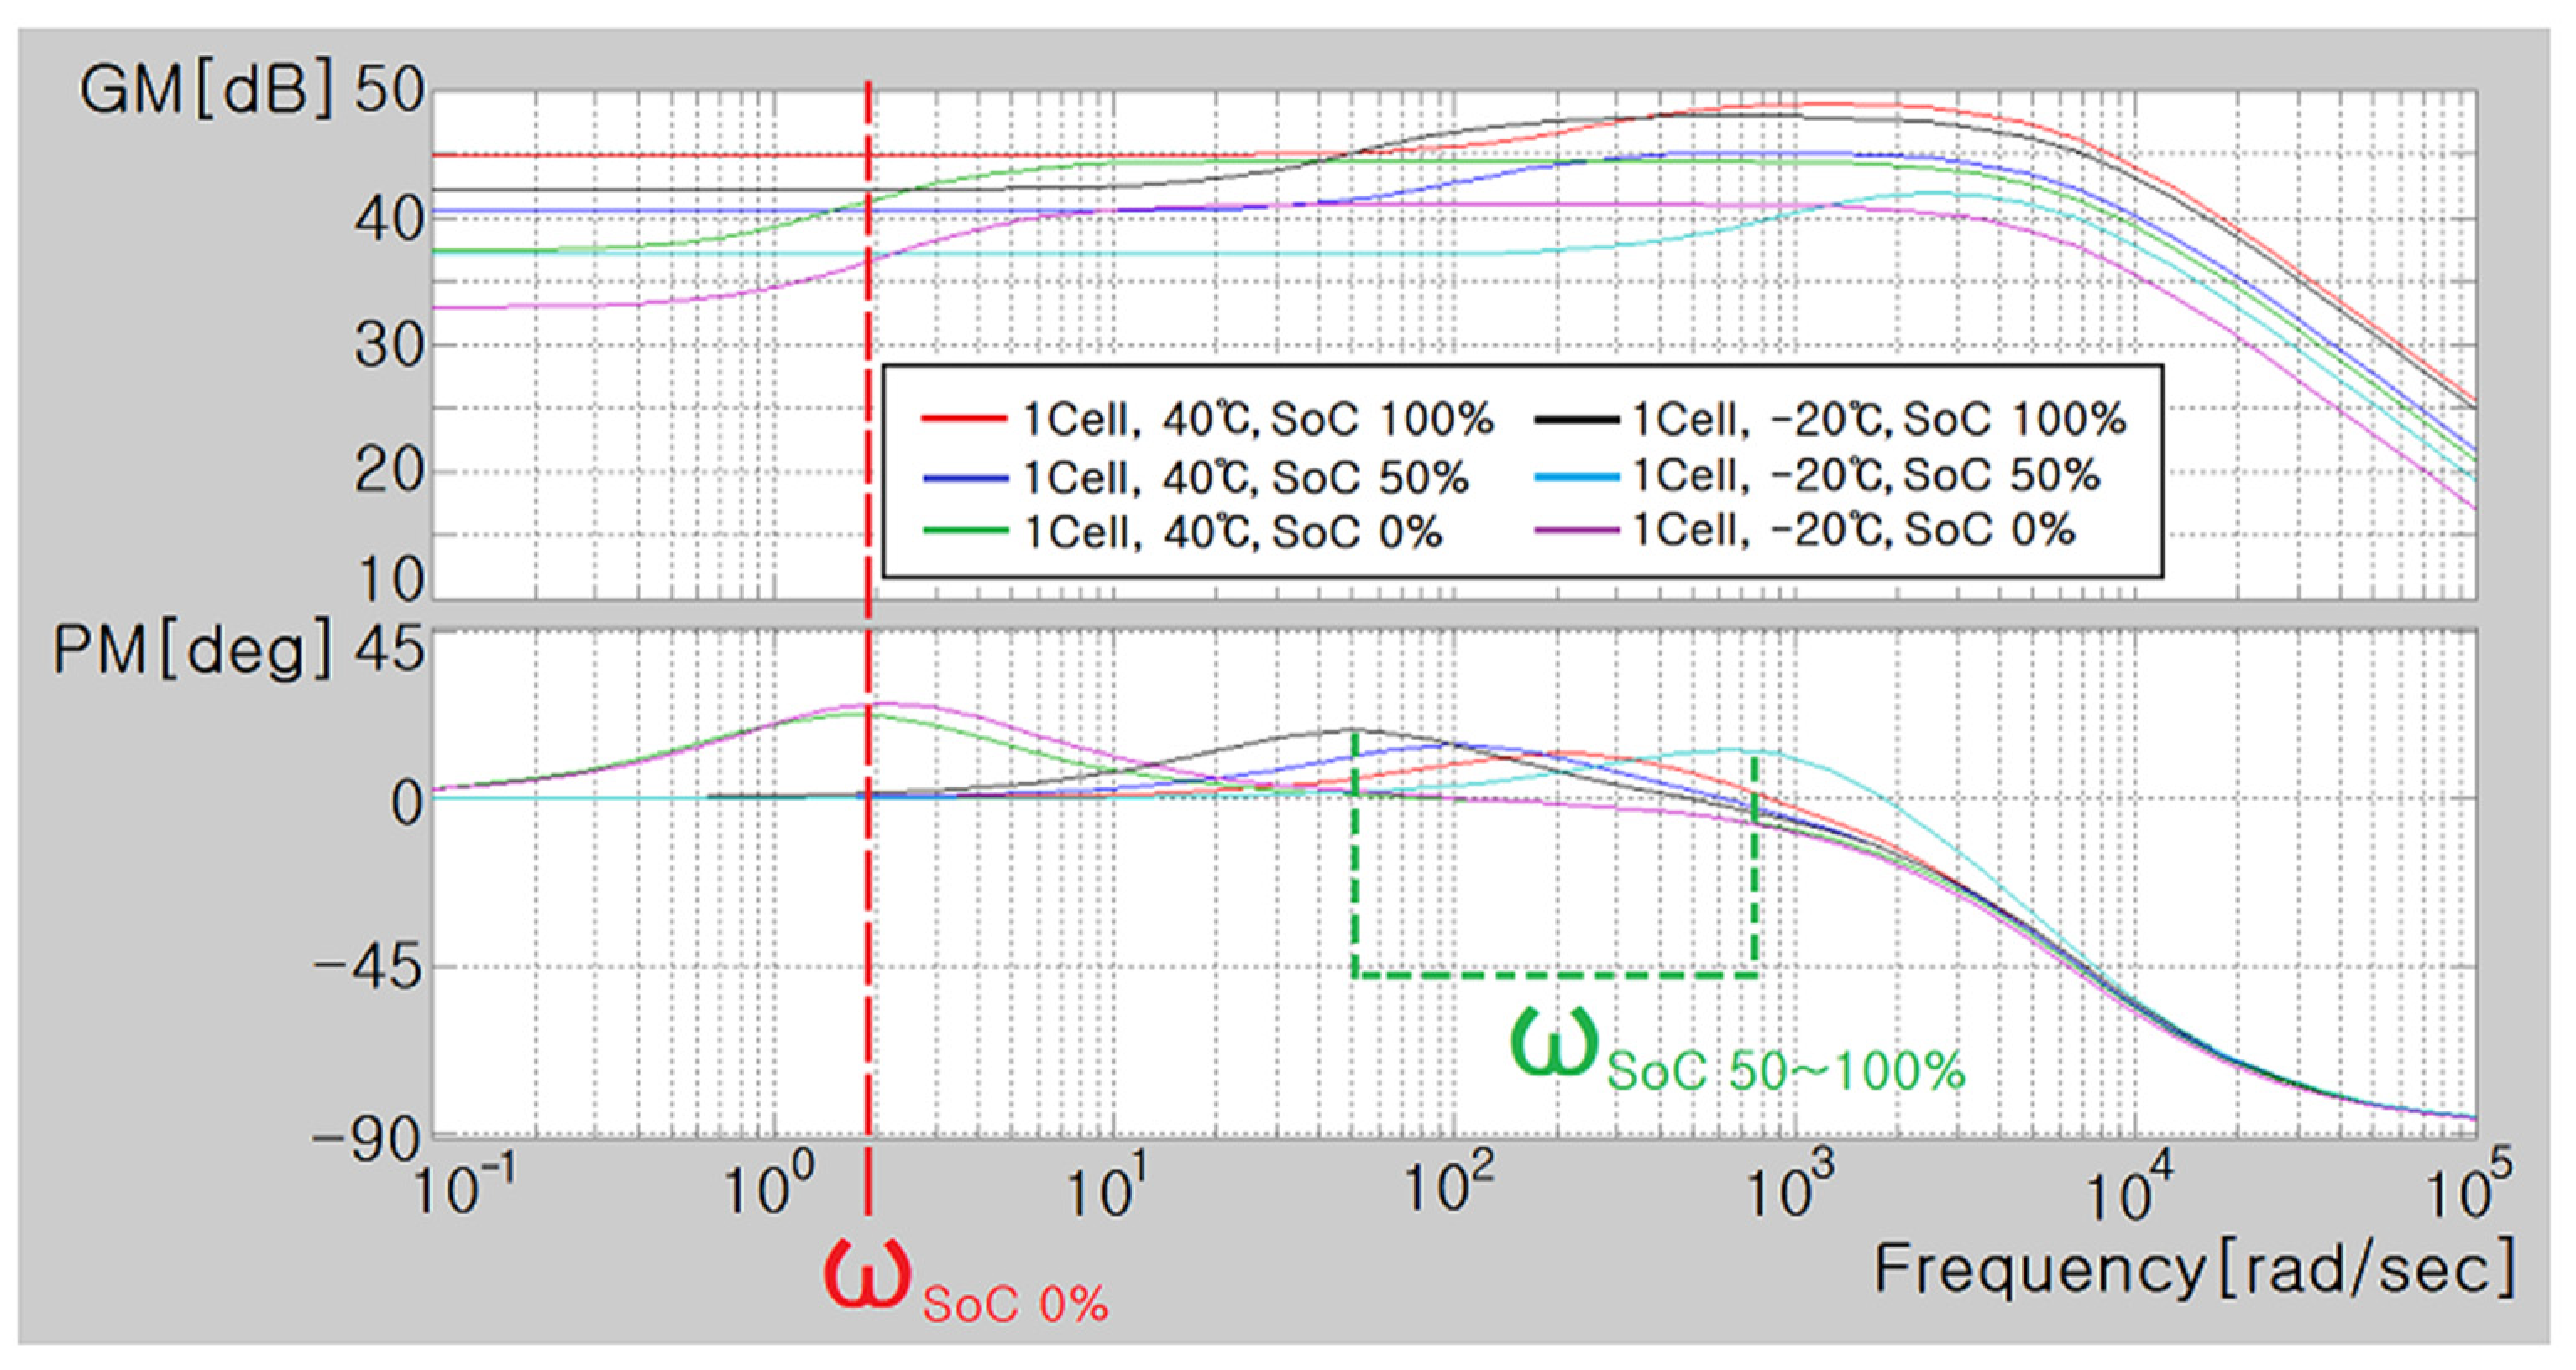
Figure 35 displays the Bode plot for a single cell of the pouch-type lithium-ion battery (75 Ah) at 0%, 50%, and 100% SoC under 40 °C and −20 °C.
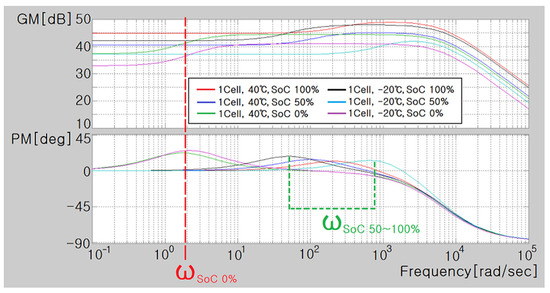
Figure 35.
Bode plot of a single cell of a pouch-type lithium-ion battery (75 Ah).
In the cell, the GM decreased when the angular frequency (ω = 2 π f) was above rad/s (frequency: 1500 Hz), and it decreased as the angular frequency approached 0 rad/s (frequency: 0 Hz), representing the characteristics of a typical low-pass filter (LPF).
At 50% or 100% SoC, PM was maximum at the angular frequency of ≥50 rad/s (frequency: 8 Hz). However, at 0% SoC, PM was maximum at the angular frequency ≥50 rad/s (frequency: 8 Hz). The maximum angular frequency of the PM decreased to 1.6–2.2 rad/s (frequency 0.3 Hz), signifying that the gain reduced at 0 rad/s (frequency: 0 Hz).
In general, GM increased and decreased with the temperature. At 0% SoC, the angular frequency at which PM was maximum exceeded 50 rad/s ▷ 1.6–2.2 rad/s, and the low-frequency GM sharply decreased.
The GM at 0 rad/s (frequency: 0 Hz) for the single cell of a pouch-type lithium-ion battery (75 Ah) was calculated using Equation (8), and the values at 40 °C and −20 °C were as follows:
- (1)
- 1 Cell, 40 °C, 100% SoC: ;
- (2)
- 1 Cell, 40 °C, 50% SoC: ;
- (3)
- 1 Cell, 40 °C, 0% SoC: ;
- (4)
- 1 Cell, −20 °C, 100% SoC: ;
- (5)
- 1 Cell, −20 °C, 50% SoC: ;
- (6)
- 1 Cell, −20 °C, 0% SoC: .
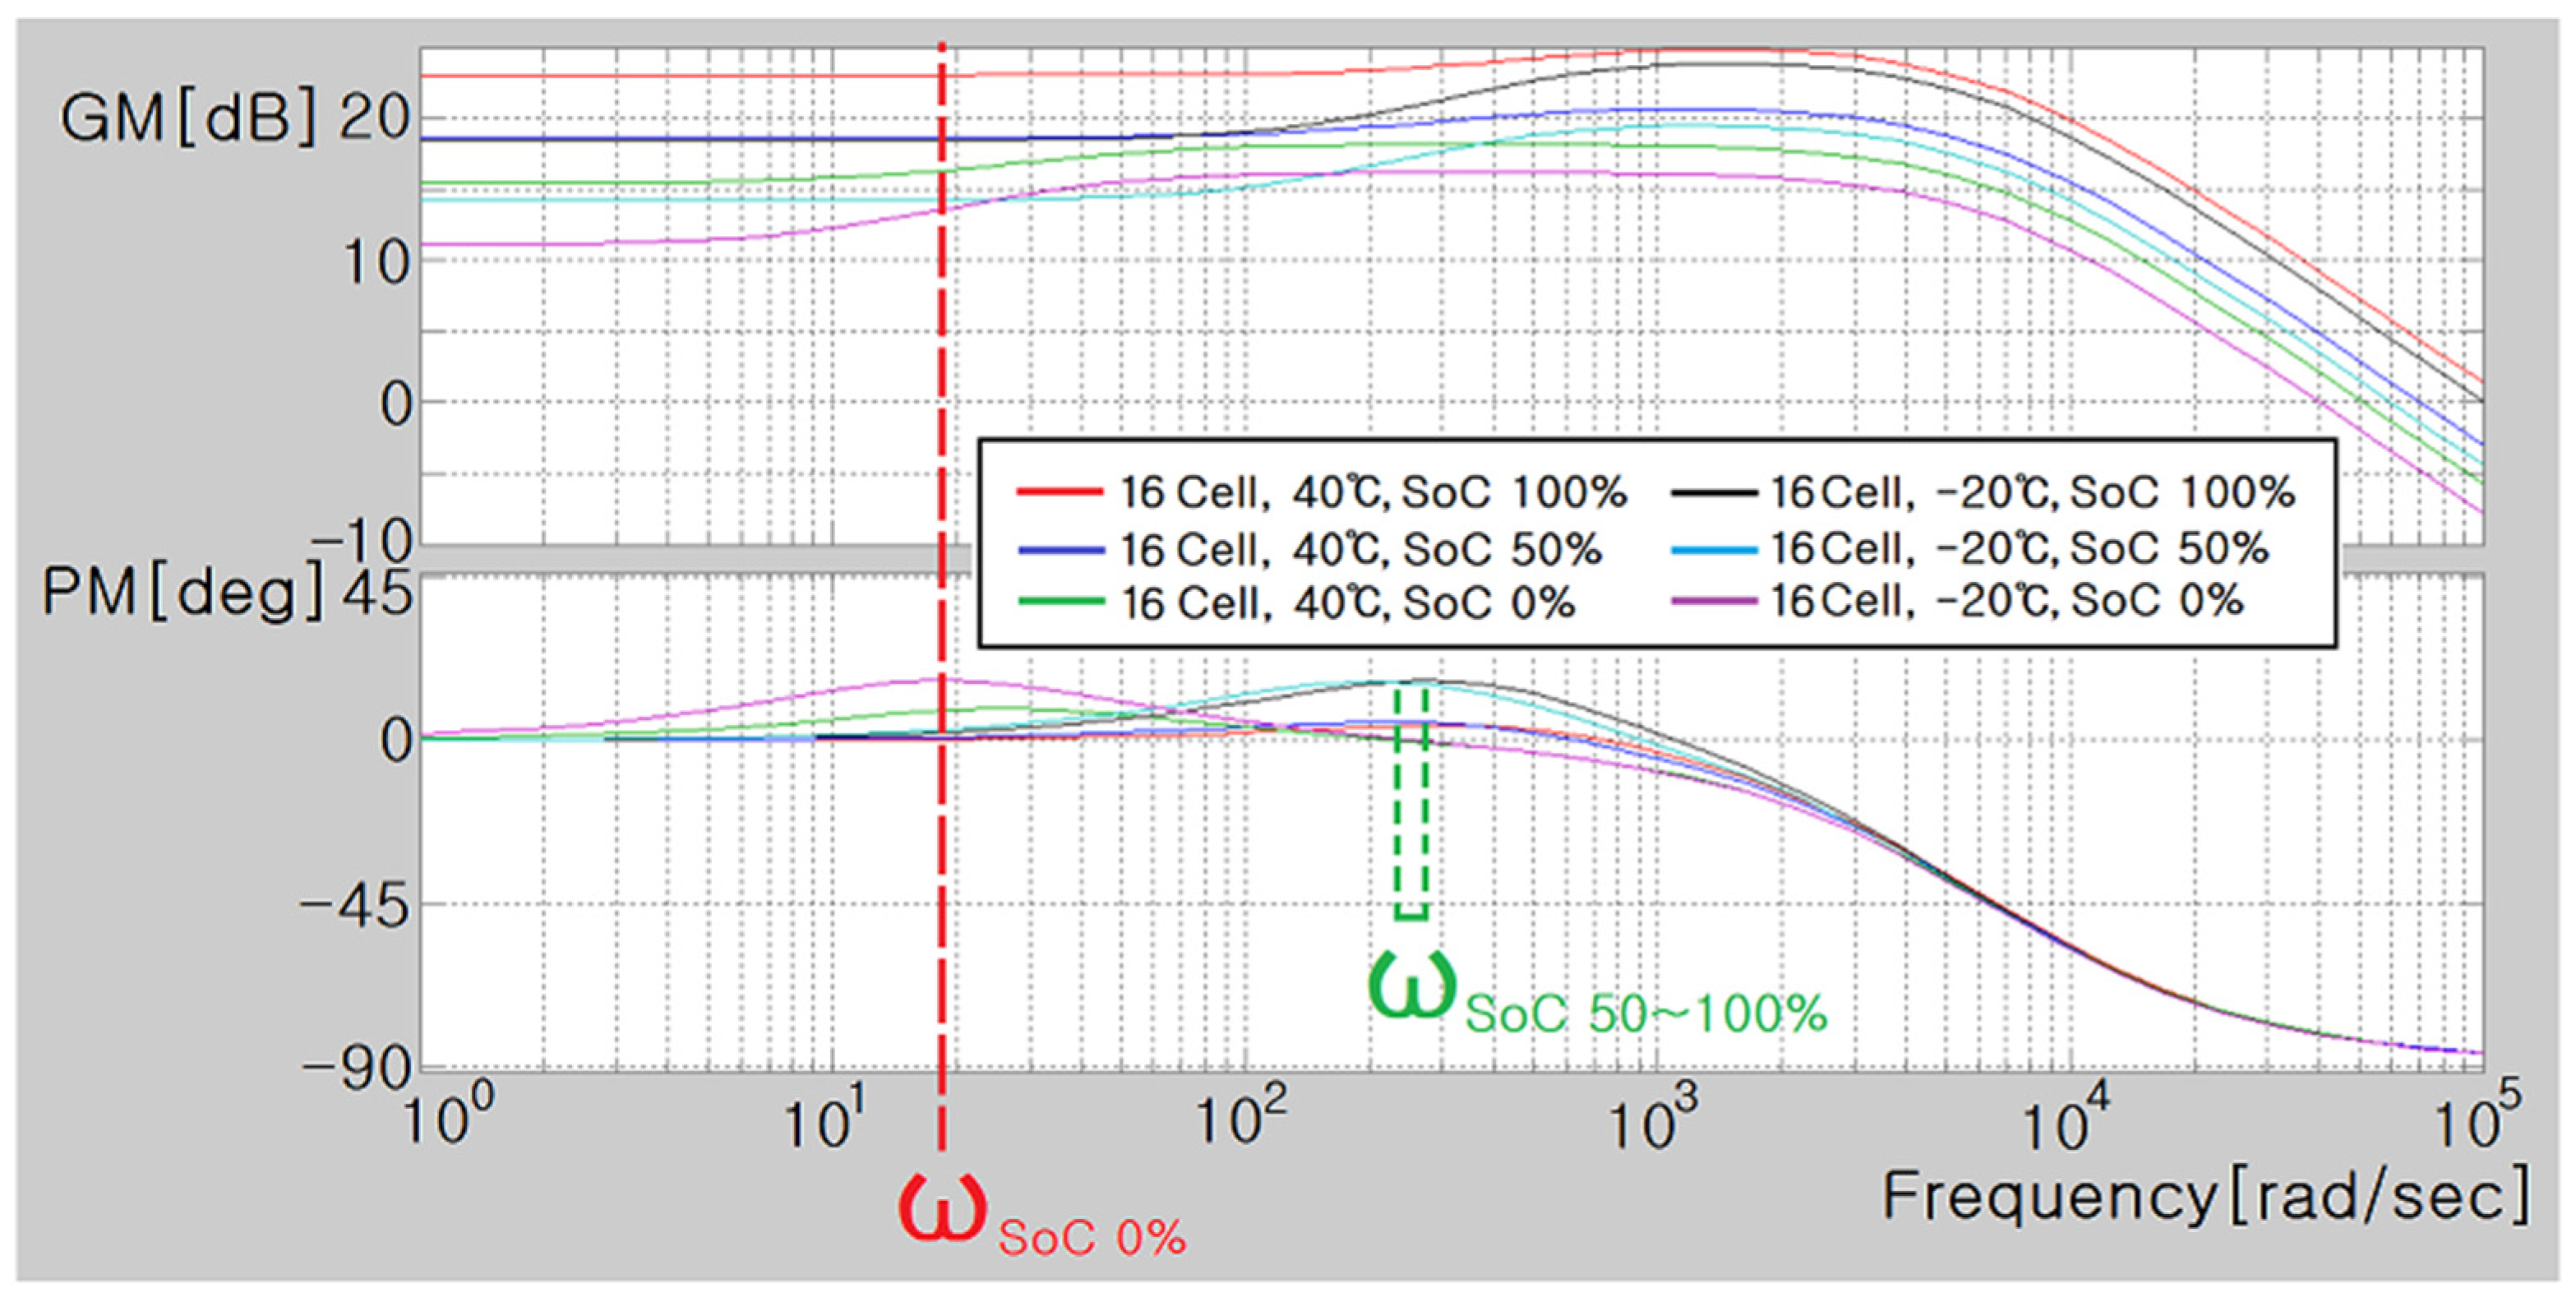
Figure 36 presents the Bode plot for the 16 cells of a pouch-type lithium-ion battery (75 Ah) at 0%, 50%, and 100% SoC under 40 °C and −20 °C.
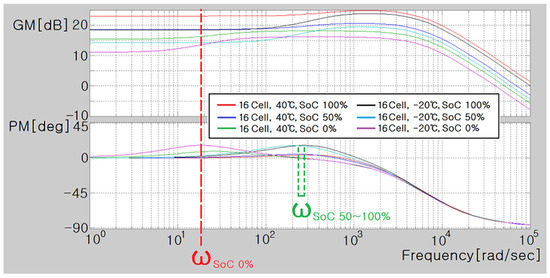
Figure 36.
Bode plot of the 16 cells of the pouch-type lithium-ion battery (75 Ah).
In the 16 cells, the GM decreased when the angular frequency () exceeded 2000 rad/s (frequency: 300 Hz), and it decreased when the angular frequency approached 0 rad/s (frequency: 0 Hz). These trends represent the characteristics of a typical LPF.
At 50% or 100% SoC, PM was maximum at the angular frequency of ≥200 rad/s (frequency: 30 Hz), but at 0% SoC, PM was maximum at the angular frequency of ≥21 rad/s (frequency: 2.4 Hz). PM was minimum at the maximum angular frequency of 15–21 rad/s (frequency: 2.4 Hz), signifying that the gain was reduced at 0 rad/s (frequency: 0 Hz).
In general, GM increased with temperature, and it decreased with temperature. At 0% SoC, the angular frequency at which the PM was at its maximum exceeded 200 rad/s ▷ 15 to 21 rad/s, and the low-frequency GM sharply decreased.
The GM at 0 rad/s (frequency: 0 Hz) for the 16 cells of the pouch-type lithium-ion battery (75 Ah) was calculated using Equation (9). The values at 40 °C and −20 °C were as follows:
- (1)
- 16 Cell, 40 °C, 100% SoC: ;
- (2)
- 16 Cell, 40 °C, 50% SoC: ;
- (3)
- 16 Cell, 40 °C, 0% SoC: ;
- (4)
- 16 Cell, −20 °C, 100% SoC: ;
- (5)
- 16 Cell, −20 °C, 50% SoC: ;
- (6)
- 16 Cell, −20 °C, 0% SoC: .
7. Conclusions
This study discussed the electrical modeling and characteristic analysis of an ESS based on a pouch-type lithium-ion battery according to the internal impedance characteristics. The characteristics of the 58.4 V, 75 Ah, 4.4 kWh ESS, which could be used in renewable energy and mobility fields, were comprehensively analyzed by varying the SoC and temperature.
- ∎
- 100% SoC of One Cell (75 Ah)
- (1)
- Series resistance range: ;
- (2)
- Parallel resistance range: ;
- (3)
- Parallel capacitor range: ;
- (4)
- Series inductor range: .
- ∎
- 50% SoC of One Cell (75 Ah)
- (1)
- Series resistance range: ;
- (2)
- Parallel resistance range: ;
- (3)
- Parallel capacitor range: ;
- (4)
- Series inductor range: .
- ∎
- 0% SoC of One Cell (75 Ah)
- (1)
- Series resistance range: ;
- (2)
- Parallel resistance range: ;
- (3)
- Parallel capacitor range: ;
- (4)
- Series inductor range: .
- ∎
- 100% SoC of the 16-cell 4.4 kWh ESS
- (1)
- Series resistance range: ;
- (2)
- Parallel resistance range: ;
- (3)
- Parallel capacitor range: ;
- (4)
- Series inductor range: .
- ∎
- 50% SoC of the 16-cell 4.4 kWh ESS
- (1)
- Series resistance range: ;
- (2)
- Parallel resistance range: ;
- (3)
- Parallel capacitor range: ;
- (4)
- Series inductor range: .
- ∎
- 0% SoC of the 16-cell 4.4 kWh ESS
- (1)
- Series resistance range: ;
- (2)
- Parallel resistance range: ;
- (3)
- Parallel capacitor range: ;
- (4)
- Series inductor range: .
The impedance changes depending on the temperature and SoC variations in the 4.4 kWh ESS were examined. Moreover, changes in , , , and in the lithium-ion batteries were analyzed. In the ESS, and rapidly increased with decreasing temperature and SoC. Additionally, increased with decreasing temperature.
Furthermore, and increased with decreasing SoC. The value decreased with the temperature and SoC. The increase in impedance in the ESS, , , , and was associated with the overall decrease in the lithium-ion battery performance.
Notably, was the impedance parameter most affected by the changes in temperature and SoC.
In the 4.4 kWh ESS, as the temperature decreased, , , and increased, while decreased.
Overall, and rapidly increased at 0% SoC and −20 °C, significantly degrading the ESS performance.
At 0% SoC, in contrast to that at 50% and 100% SoC, increased because of diffusion, which consequently increased . Moreover, the Bode diagrams of the 4.4 kWh ESS for 40 °C and −20 °C were compared based on ESS modeling, and the GM range () at 0 Hz was 11.0634–23.0223 dB.
At 0% SoC, PM reached its maximum value at the angular frequency (ω) of >200 rad/s. As the angular frequency decreased to about 15–21 rad/s, the low-frequency GM drastically decreased.
Therefore, the safety improvement and characteristic analysis of 4.4 kWh ESSs can be performed in real time based on the changes in the basic EIS characteristics of the ESS SoC and temperature.
Based on ESS modeling, an improved management plan for ESSs can be devised through the management of GM at low frequencies (about 0 Hz) and the appropriate management of the angular frequency (ω) at which the maximum PM is afforded.
Based on the study results, the following research plans can be developed in the future:
- (1)
- Analysis of the changes in the impedance characteristics of lithium-ion cells during failures and abnormalities;
- (2)
- Applicability of impedance spectroscopy to large-capacity ESSs of tens of kWh or several MWh;
- (3)
- In impedance frequency injection, an analysis of the effective frequency rather than continuous frequencies from 1 kHz to 0.1 Hz;
- (4)
- Methods for applying impedance spectra technology for BMS and ways to maintain battery safety.
Through the above research, the spread of renewable energy and ESS could be promoted, and carbon emissions could be reduced by improving the reliability and safety of impedance-based ESSs.
Author Contributions
All authors contributed to the paper. L.B. was responsible for collecting the information and analyzing the different methodologies; J.-Y.B. was the director of the research project. All authors were responsible for organizing and revising the entire paper and for classifying the different methodologies. All authors have read and agreed to the published version of the manuscript.
Funding
This research received no external funding.
Data Availability Statement
The original contributions presented in the study are included in the article, further inquiries can be directed to the corresponding author.
Conflicts of Interest
The authors declare no conflicts of interest.
References
- Ding, Y.L.; Cano, Z.P.; Yu, A.; Lu, J.; Chen, Z. Automotive Li-Ion Batteries: Current Status and Future Perspectives. Electrochem. Energy Rev. 2019, 2, 1–28. [Google Scholar] [CrossRef]
- Komsiyska, L.; Buchberger, T.; Diehl, S.; Ehrensberger, M.; Hanzl, C.; Hartmann, C.; Hölzle, M.; Kleiner, J.; Lewerenz, M.; Liebhart, B.; et al. Critical Review of Intelligent Battery Systems: Challenges, Implementation, and Potential for Electric Vehicles. Energies 2021, 14, 5989. [Google Scholar] [CrossRef]
- Sun, P.; Bisschop, R.; Niu, H.; Huang, X. A Review of Battery Fires in Electric Vehicles. Fire Technol. 2020, 56, 1361–1410. [Google Scholar] [CrossRef]
- Lu, L.; Han, X.; Li, J.; Hua, J.; Ouyang, M. A Review on the Key Issues for Lithium-ion Battery Management in Electric Vehicles. J. Power Sources 2013, 226, 272–288. [Google Scholar] [CrossRef]
- Kong, L.; Li, C.; Jiang, J.; Pecht, M.G. Li-Ion Battery Fire Hazards and Safety Strategies. Energies 2018, 11, 2191. [Google Scholar] [CrossRef]
- Kim, S.W.; Park, S.G.; Lee, E.J. Assessment of the Explosion Risk during Lithium-ion Battery Fires. J. Loss Pervention Process Ind. 2022, 80, 104851. [Google Scholar] [CrossRef]
- Troxler, Y.; Wu, B.; Marinescu, M.; Yufit, V.; Patel, Y.; Marquis, A.J.; Brandon, N.P.; Offer, G.J. The Effect of Thermal Gradients on the Performance of Lithium-ion Batteries. J. Power Sources 2014, 247, 1018–1025. [Google Scholar] [CrossRef]
- Larsson, F.; Andersson, P.; Blomqvist, P.; Lorén, A.; Mellander, B.E. Characteristics of Lithium-ion Batteries during Fire Tests. J. Power Sources 2014, 271, 414–420. [Google Scholar] [CrossRef]
- Arora, S.; Shen, W.; Kapoor, A. Neural Network based Computational Model for Estimation of Heat Generation in LiFePO4 Pouch Cells of Different Nominal Capacities. Comput. Chem. Eng. 2017, 101, 81–94. [Google Scholar] [CrossRef]
- Cui, X.; Zeng, J.; Zhang, H.; Yang, J.; Qiao, J.; Li, J.; Li, W. Optimization of the Lumped Parameter Thermal Model for Hard-cased Li-ion Batteries. J. Energy Storage 2020, 32, 101758. [Google Scholar] [CrossRef]
- Kleiner, J.; Komsiyska, L.; Elger, G.; Endisch, C. Thermal Modelling of a Prismatic Lithium-ion Cell in a Battery Electric Vehicle Environment: Influences of the Experimental Validation Setup. Energies 2020, 13, 62. [Google Scholar] [CrossRef]
- Wang, X.; Wei, X.; Chen, Q.; Zhu, J.; Dai, H. Lithium-ion Battery Temperature Online Estimation based on Fast Impedance Calculation. J. Energy Storage 2019, 26, 100952. [Google Scholar] [CrossRef]
- Peng, P.; Jiang, F. Thermal Safety of Lithium-ion Batteries with Various Cathode Materials: A Numerical Study. Int. J. Heat Mass Transf. 2016, 103, 1008–1016. [Google Scholar] [CrossRef]
- Li, J.; Sun, D.; Jin, X.; Shi, W.; Sun, C. Lithium-ion Battery Overcharging Thermal Characteristics Analysis and an Impedance-Based Electro-Thermal Coupled Model Simulation. Appl. Energy 2019, 254, 113574. [Google Scholar] [CrossRef]
- Belov, D.; Yang, M.H. Failure Mechanism of Li-ion Battery at Overcharge Conditions. J. Solid State Electrochem. 2007, 12, 885–894. [Google Scholar] [CrossRef]
- Chan, H.L.; Sutanto, D. A New Battery Model for use with Battery Energy Storage Systems and Electric Vehicles Power Systems. In Proceedings of the IEEE Power Engineering Society Conference, Singapore, 23–27 January 2000; pp. 470–475. [Google Scholar] [CrossRef]
- Schmid, M.; Vögele, U.; Endisch, C. A Novel Matrix-vector-based Framework for Modeling and Simulation of Electric Vehicle Battery Packs. J. Energy Storage 2020, 32, 101736. [Google Scholar] [CrossRef]
- Chen, M.; Rincón-Mora, G.A. Accurate Electrical Battery Model Capable of Predicting Runtime and I–V Performance. IEEE Trans. Energy Convers. 2006, 21, 504–511. [Google Scholar] [CrossRef]
- Bugryniec, P.J.; Davidson, J.N.; Brown, S.F. Advanced Abuse Modelling of Li-ion Cells—A Novel Description of Cell Pressurisation and Simmering Reactions. J. Power Sources 2020, 474, 228396. [Google Scholar] [CrossRef]
- Xiong, R.; Sun, F.; Chen, Z.; He, H. A Data-driven Multi-scale Extended Kalman Filtering Based Parameter and State Estimation Approach of Lithium-ion Polymer Battery in Electric Vehicles. Appl. Energy 2014, 113, 463–476. [Google Scholar] [CrossRef]
- Vergori, E.; Mocera, F.; Somà, A. Battery Modelling and Simulation Using a Programmable Testing Equipment. Computers 2018, 7, 20. [Google Scholar] [CrossRef]
- Ziyad, M.S.; Margaret, A.C.; William, A.L. A Mathematical Model for Lead-Acid Batteries. IEEE Trans. Energy Convers. 1992, 7, 93–98. [Google Scholar] [CrossRef]
- Margaret, A.C.; Ziyad, M.S. Determination of Lead-Acid Battery Capacity via Mathematical Modeling Techniques. IEEE Trans. Energy Convers. 1992, 7, 442–446. [Google Scholar] [CrossRef]
- Mahon, P.J.; Paul, G.L.; Keshishian, S.M.; Vassallo, A.M. Measurement and Modelling of the High-power performance of Carbon-based Supercapacitors. J. Power Sources 2000, 91, 68–76. [Google Scholar] [CrossRef]
- Gauchia, L.; Castaño, S.; Sanz, J. New Approach to Supercapacitor Testing and Dynamic Modelling. In Proceedings of the IEEE Vehicle Power and Propulsion Conference, Lille, France, 1–3 September 2010; pp. 1–5. [Google Scholar] [CrossRef]
- Buller, S.; Karden, E.; Kok, D.; Doncker, R.W.D. Modeling the Dynamic Behavior of Supercapacitors Using Impedance Spectroscopy. IEEE Trans. Ind. App. 2002, 38, 1622–1626. [Google Scholar] [CrossRef]
- Buller, S.; Thele, M.; Doncker, R.W.D.; Karden, E. Impedance-Based Simulation Models of Supercapacitors and Li-Ion Batteries for Power Electronic Applications. IEEE Trans. Ind. App. 2005, 41, 742–747. [Google Scholar] [CrossRef]
- Bae, J.Y. Electrical Modeling and Impedance Spectra of Lithium-Ion Batteries and Supercapacitors. Batteries 2023, 9, 160. [Google Scholar] [CrossRef]
- Karden, E.; Buller, S.; Doncker, R.W.D. A Frequency-domain Approach to Dynamical Modeling of Electrochemical Power Sources. Electrochim. Acta 2002, 47, 2347–2356. [Google Scholar] [CrossRef]
- Stroe, D.I.; Swierczynski, M.; Stroe, A.I.; Knap, V.; Teodorescu, R.; Andreasen, S.J. Evaluation of Different Methods for Measuring the Impedance of Lithium-Ion Batteries during Ageing. In Proceedings of the International Conference on Ecological Vehicles and Renewable Energies (EVER), Monte Carlo, Monaco, 31 March–2 April 2015. [Google Scholar] [CrossRef]
- Varnosfaderani, M.A.; Strickland, D. Online Impedance Spectroscopy Estimation of a Battery. In Proceedings of the International Conference on European Conference on Power Electronics and Applications (ECCE Europe), Karlsruhe, Germany, 5–9 September 2016; pp. 1–10. [Google Scholar] [CrossRef]
- Stroe, D.I.; Swierczynski, M.; Stan, A.I.; Knap, V.; Teodorescu, R.; Andreasen, S.J. Diagnosis of Lithium-Ion Batteries State-of-Health based on Electrochemical Impedance Spectroscopy Technique. In Proceedings of the IEEE Transactions on Energy Conversion Congress and Exposition (ECCE), Pittsburgh, PA, USA, 14–18 September 2014; pp. 4576–4582. [Google Scholar] [CrossRef]
- Maheshwari, A.; Heck, M.; Santarelli, M. Cycle Aging Studies of Lithium Nickel Manganese Cobalt Oxide-based Batteries Using Electrochemical Impedance Spectroscopy. Electrochim. Acta 2018, 273, 335–348. [Google Scholar] [CrossRef]
- Buller, S.; Thele, M.; Karden, E.; Doncker, R.W.D. Impedance-based Non-linear Dynamic Battery Modeling for Automotive Applications. J. Power Sources 2003, 113, 422–430. [Google Scholar] [CrossRef]
- Sihvo, J.; Stroe, D.I.; Messo, T.; Roinila, T. A Fast Approach for Battery Impedance Identification Using Pseudo Random Sequence (PRS) Signals. IEEE Trans. Power Electron. 2020, 35, 2548–2557. [Google Scholar] [CrossRef]
- Macdonald, J.R. Impedance Spectroscopy. Ann. Biomed. Eng. 1992, 20, 289–305. [Google Scholar] [CrossRef] [PubMed]
- Santoni, F.; Angelis, A.D.; Moschitta, A.; Carbone, P. Digital Impedance Emulator for Battery Measurement System Calibration. Sensors 2021, 21, 7377. [Google Scholar] [CrossRef] [PubMed]
- Gheem, E.V.; Pintelon, R.; Vereecken, J.; Schoukens, J.; Hubin, A.; Verboven, P.; Blajiev, O. Electrochemical Impedance Spectroscopy in the Presence of Nonlinear Distortions and Non-stationary Behaviour Part I: Theory and Validation. Electrochim. Acta 2004, 49, 4753–4762. [Google Scholar] [CrossRef]
- Stroe, D.I.; Knap, V.; Swierczynski, M.; Schaltz, E. Electrochemical Impedance Spectroscopy-based Electric Circuit Modeling of Lithium-Sulfur Batteries during Discharging State. IEEE Trans. Ind. Appl. 2019, 55, 631–637. [Google Scholar] [CrossRef]
- Deng, Z.; Zhang, Z.; Lai, Y.; Liu, J.; Li, J.; Liu, Y. Electrochemical Impedance Spectroscopy Study of a Lithium/Sulfur Battery: Modeling and Analysis of Capacity Fading. J. Electrochem. Soc. 2013, 160, A553–A558. [Google Scholar] [CrossRef]
- Lee, J.H.; Choi, W.J. Novel State-of-Charge Estimation Method for Lithium Polymer Batteries Using Electrochemical Impedance Spectroscopy. J. Power Electron. 2011, 11, 237–243. [Google Scholar] [CrossRef]
- Franke-Lang, R.; Kowa, J. Analysis of Electrochemical Impedance Spectroscopy on Zinc-Air Batteries Using the Distribution of Relaxation Times. Batteries 2021, 7, 56. [Google Scholar] [CrossRef]
- Olarte, J.; Ilarduya, J.M.; Zulueta, E.; Ferret, R.; Fernández-Gámiz, U.; Lopez-Guede, J.M. A Battery Management System with EIS Monitoring of Life Expectancy for Lead–Acid Batteries. Electronics 2021, 10, 1228. [Google Scholar] [CrossRef]
- Oldenburger, M.; Bedürftig, B.; Gruhle, A.; Grimsmann, F.; Richter, E.; Findeisen, R.; Hintennach, A. Investigation of the low frequency warburg impedance of li-ion cells by frequency domain measurements. J. Energy Storage 2019, 21, 272–280. [Google Scholar] [CrossRef]
- Samuel, C.M.; Paul, G. An Impedance Model based on a Transmission Line Circuit and a Frequency Dispersion Warburg Component for the Study of EIS in Li-Ion Batteries. J. Electroanal. Chem. 2020, 871, 114305. [Google Scholar] [CrossRef]
- Barreras, J.V.; Fleischer, C.; Christensen, A.E.; Swierczynski, M.; Schaltz, E.; Andreasen, S.J.; Sauer, D.U. An Advanced HIL Simulation Battery Model for Battery Management System Testing. IEEE Trans. Ind. Appl. 2016, 52, 5086–5099. [Google Scholar] [CrossRef]
- Liebhart, B.; Komsiyska, L.; Endisch, C. Passive Impedance Spectroscopy for Monitoring Lithium-ion Battery Cells during Vehicle Operation. J. Power Sources 2020, 449, 227297. [Google Scholar] [CrossRef]
- Kim, J.H.; Kowal, J. Development of a Matlab/Simulink Model for Monitoring Cell State-of-Health and State-of-Charge via Impedance of Lithium-ion Battery Cells. Batteries 2022, 8, 8. [Google Scholar] [CrossRef]
- Guha, A.; Patra, A. Online Estimation of the Electrochemical Impedance Spectrum and Remaining Useful Life of Lithium-ion Batteries. IEEE Trans. Instrum. Meas. 2018, 67, 1836–1849. [Google Scholar] [CrossRef]
- Babaeiyazdi, I.; Rezaei-Zare, A.; Shokrzadeh, S. State of Charge Prediction of EV Li-ion Batteries Using EIS: A Machine Learning Approach. Energy 2021, 223, 120116. [Google Scholar] [CrossRef]
- Koleti, U.R.; Dinh, T.Q.; Marco, J. A New On-line Method for Lithium Plating Detection in Lithium-ion Batteries. J. Power Sources 2020, 451, 227798. [Google Scholar] [CrossRef]
- Crescentini, M.; De Angelis, A.; Ramilli, R.; De Angelis, G.; Tartagni, M.; Moschitta, A.; Traverso, P.A.; Carbone, P. Online EIS and Diagnostics on Lithium-Ion Batteries by Means of Low-Power Integrated Sensing and Parametric Modeling. IEEE Trans. Instrum. Meas. 2021, 70, 2001711. [Google Scholar] [CrossRef]
- Galeotti, M.; Cinà, L.; Giammanco, C.; Cordiner, S.; Di Carlo, A. Performance Analysis and SOH (State of Health) Evaluation of Lithium Polymer Batteries Through Electrochemical Impedance Spectroscopy. Energy 2015, 89, 678–686. [Google Scholar] [CrossRef]
- Hasan, R.; Scott, J. Impedance Measurement of Batteries Under Load. In Proceedings of the IEEE International Instrumentation and Measurement Technology Conference (I2MTC), Auckland, New Zealand, 20–23 May 2019. [Google Scholar] [CrossRef]
- Lee, J.M.; Nam, O.Y.; Cho, B.H. Li-ion Battery SOC Estimation Method based on the Reduced Order Extended Kalman Filtering. J. Power Sources 2007, 174, 9–15. [Google Scholar] [CrossRef]
- Wei, Z.; Zhao, J.; Zou, C.; Lim, T.M.; Tseng, K.J. Comparative Study of Methods for Integrated Model Identification and State of Charge Estimation of Lithium-ion Battery. J. Power Sources 2018, 402, 189–197. [Google Scholar] [CrossRef]
- Kim, J.H.; Shin, J.W.; Chun, C.Y.; Cho, B.H. Stable Configuration of a Li-Ion Series Battery Pack Based on a Screening Process for Improved Voltage/SOC Balancing. IEEE Trans. Power Electron. 2012, 27, 411–424. [Google Scholar] [CrossRef]
- Wang, Y.; Zhao, L.; Cheng, J.; Zhou, J.; Wang, S. A State of Charge Estimation Method of Lithium-Ion Battery Based on Fused Open Circuit Voltage Curve. Appl. Sci. 2020, 10, 1264. [Google Scholar] [CrossRef]
- Chiang, Y.H.; Sean, W.Y.; Ke, J.C. Online Estimation of Internal Resistance and Open-circuit Voltage of Lithium-ion Batteries in Electric Vehicles. J. Power Sources 2011, 196, 3921–3932. [Google Scholar] [CrossRef]
- Wei, Z.; Zou, C.; Leng, F.; Soong, B.H.; Tseng, K.J. Online Model Identification and State-of-Charge Estimate for Lithium-Ion Battery with a Recursive Total Least Squares-Based Observer. IEEE Trans. Ind. Electron. 2018, 65, 1336–1346. [Google Scholar] [CrossRef]
- Rivera-Barrera, J.; Muñoz-Galeano, N.; Sarmiento-Maldonado, H. SoC Estimation for Lithium-ion Batteries: Review and Future Challenges. Electronics 2017, 6, 102. [Google Scholar] [CrossRef]
- Alvi, M.J.; Zafar, A.; Nengroo, S.H.; Hussain, S.; Alvi, M.J.; Kim, H.J. Towards a Smarter Battery Management System for Electric Vehicle Applications: A Critical Review of Lithium-ion Battery State of Charge Estimation. Energies 2019, 12, 446. [Google Scholar] [CrossRef]
- Jang, J.H.; Yoo, J.Y. Impedance-based and Circuit-parameter-based Battery Models for HEV Power Systems. Int. J. Automot. Technol. 2008, 9, 615–623. [Google Scholar] [CrossRef]
- Richardson, R.R.; Ireland, P.T.; Howey, D.A. Battery Internal Temperature Estimation by Combined Impedance and Surface Temperature Measurement. J. Power Sources 2014, 265, 254–261. [Google Scholar] [CrossRef]
- Gogona, R.; Pinson, M.B.; Bazant, M.Z.; Sarma, S.E. Internal Resistance Matching for Parallel-connected Lithium-ion Cells and Impacts on Battery Pack Cycle Life. J. Power Sources 2014, 252, 8–13. [Google Scholar] [CrossRef]


Disclaimer/Publisher’s Note: The statements, opinions and data contained in all publications are solely those of the individual author(s) and contributor(s) and not of MDPI and/or the editor(s). MDPI and/or the editor(s) disclaim responsibility for any injury to people or property resulting from any ideas, methods, instructions or products referred to in the content. |
© 2024 by the authors. Licensee MDPI, Basel, Switzerland. This article is an open access article distributed under the terms and conditions of the Creative Commons Attribution (CC BY) license (https://creativecommons.org/licenses/by/4.0/).