Article

Revealing a Correlation between Physical Parameters and Differential Voltage Analysis of a Commercial Li-Ion Battery Based on Fiber Optic Sensors

i3N and Department of Physics, University of Aveiro, Campus de Santiago, 3810-193 Aveiro, Portugal
*
Author to whom correspondence should be addressed.
Batteries 2024, 10(8), 289; https://doi.org/10.3390/batteries10080289
Submission received: 10 July 2024 / Revised: 9 August 2024 / Accepted: 11 August 2024 / Published: 13 August 2024
(This article belongs to the Special Issue Towards a Smarter Battery Management System)

Abstract

:
This work describes a specialized optical fiber hybrid sensing configuration conceived to monitor internal physical parameters (temperature and pressure) within Li-ion batteries (LiBs) and correlate them with electrochemical performance in operando. The batteries underwent thorough cycling tests under C/3 and C/5 operating rate conditions. Throughout the cycling tests, the optical fiber sensors revealed a compelling correlation between internal and external temperature behavior. Additionally, the application of differential voltage analysis derivative curves during battery operation unveiled insights into the relationship between pressure and temperature changes and the batteries’ electrochemical performance. This optical sensing approach contributes to an understanding of internal LiB dynamics, offering implications for optimizing their performance and safety across diverse applications.

1. Introduction

Efforts to advance efficient and dependable energy storage solutions have intensified as the demand for portable electronics, electric vehicles, and renewable energy sources continues to surge [1,2,3]. Lithium-ion batteries (LiBs) have emerged as a leading technology across various applications due to their impressive energy density, extended life cycle, and minimal self-discharge rates. Yet, to fully capitalize on LiBs’ potential and ensure their safe and optimal performance, understanding the internal dynamics of these energy storage devices is paramount [4,5,6]. Conventional approaches to monitoring LiB performance often rely on electrical measurements, which may lack spatial resolution and struggle to provide insights into the battery’s electrochemical processes [7]. In recent years, integrating optical fiber sensors (OFSs) have emerged as a promising strategy to address these limitations [8,9,10,11]. Notably, their high sensitivity, immunity to electromagnetic interference, and high endurance against harsh environments make OFSs particularly well suited for this application [7,12]. Incorporating OFSs into LiBs paves the way for a more thorough characterization and optimization of battery operation [13,14,15,16,17,18]. By offering in situ measurements of the internal parameters of the battery cells, these sensors enable a deeper understanding of electrochemical processes and thermal behavior during charge and discharge cycles. This knowledge is vital for identifying possible potential degradation mechanisms, refining battery design, and bolstering the overall performance and safety of the existing battery management systems [5,19,20].
Differential Voltage Analysis (DVA) has emerged as a valuable technique for the characterization and diagnosis of lithium-ion batteries. By differentiating the charge/discharge voltage with respect to capacity, DVA provides detailed insights into internal electrochemical processes and changes occurring within the battery cells, making it possible to evaluate the degradation state of the battery and the aging effect [21,22,23]. Recent studies have shown that DVA can identify degradation states and incipient failures [24,25,26], facilitating the implementation of predictive maintenance strategies and performance optimization. The application of DVA in conjunction with optical fiber sensors, such as FBG and FPI sensors, offers a powerful approach for real-time monitoring, enabling a more accurate and comprehensive analysis of battery behavior under different operating conditions.
In this study, an optical fiber hybrid sensing configuration, combining fiber Bragg grating (FBG) and intrinsic Fabry–Perot interferometer (FPI) sensors, was developed and instrumented into an 18650 LiB to monitor internal temperature and pressure changes in real time, during their operation. The battery underwent cycling tests at C/3 and C/5 C-rate operating conditions. A comparative analysis, based on DVA, is presented to elucidate and correlate insights regarding the battery electrochemical behavior with the OFS data, and how different C-rates influence the battery performance.

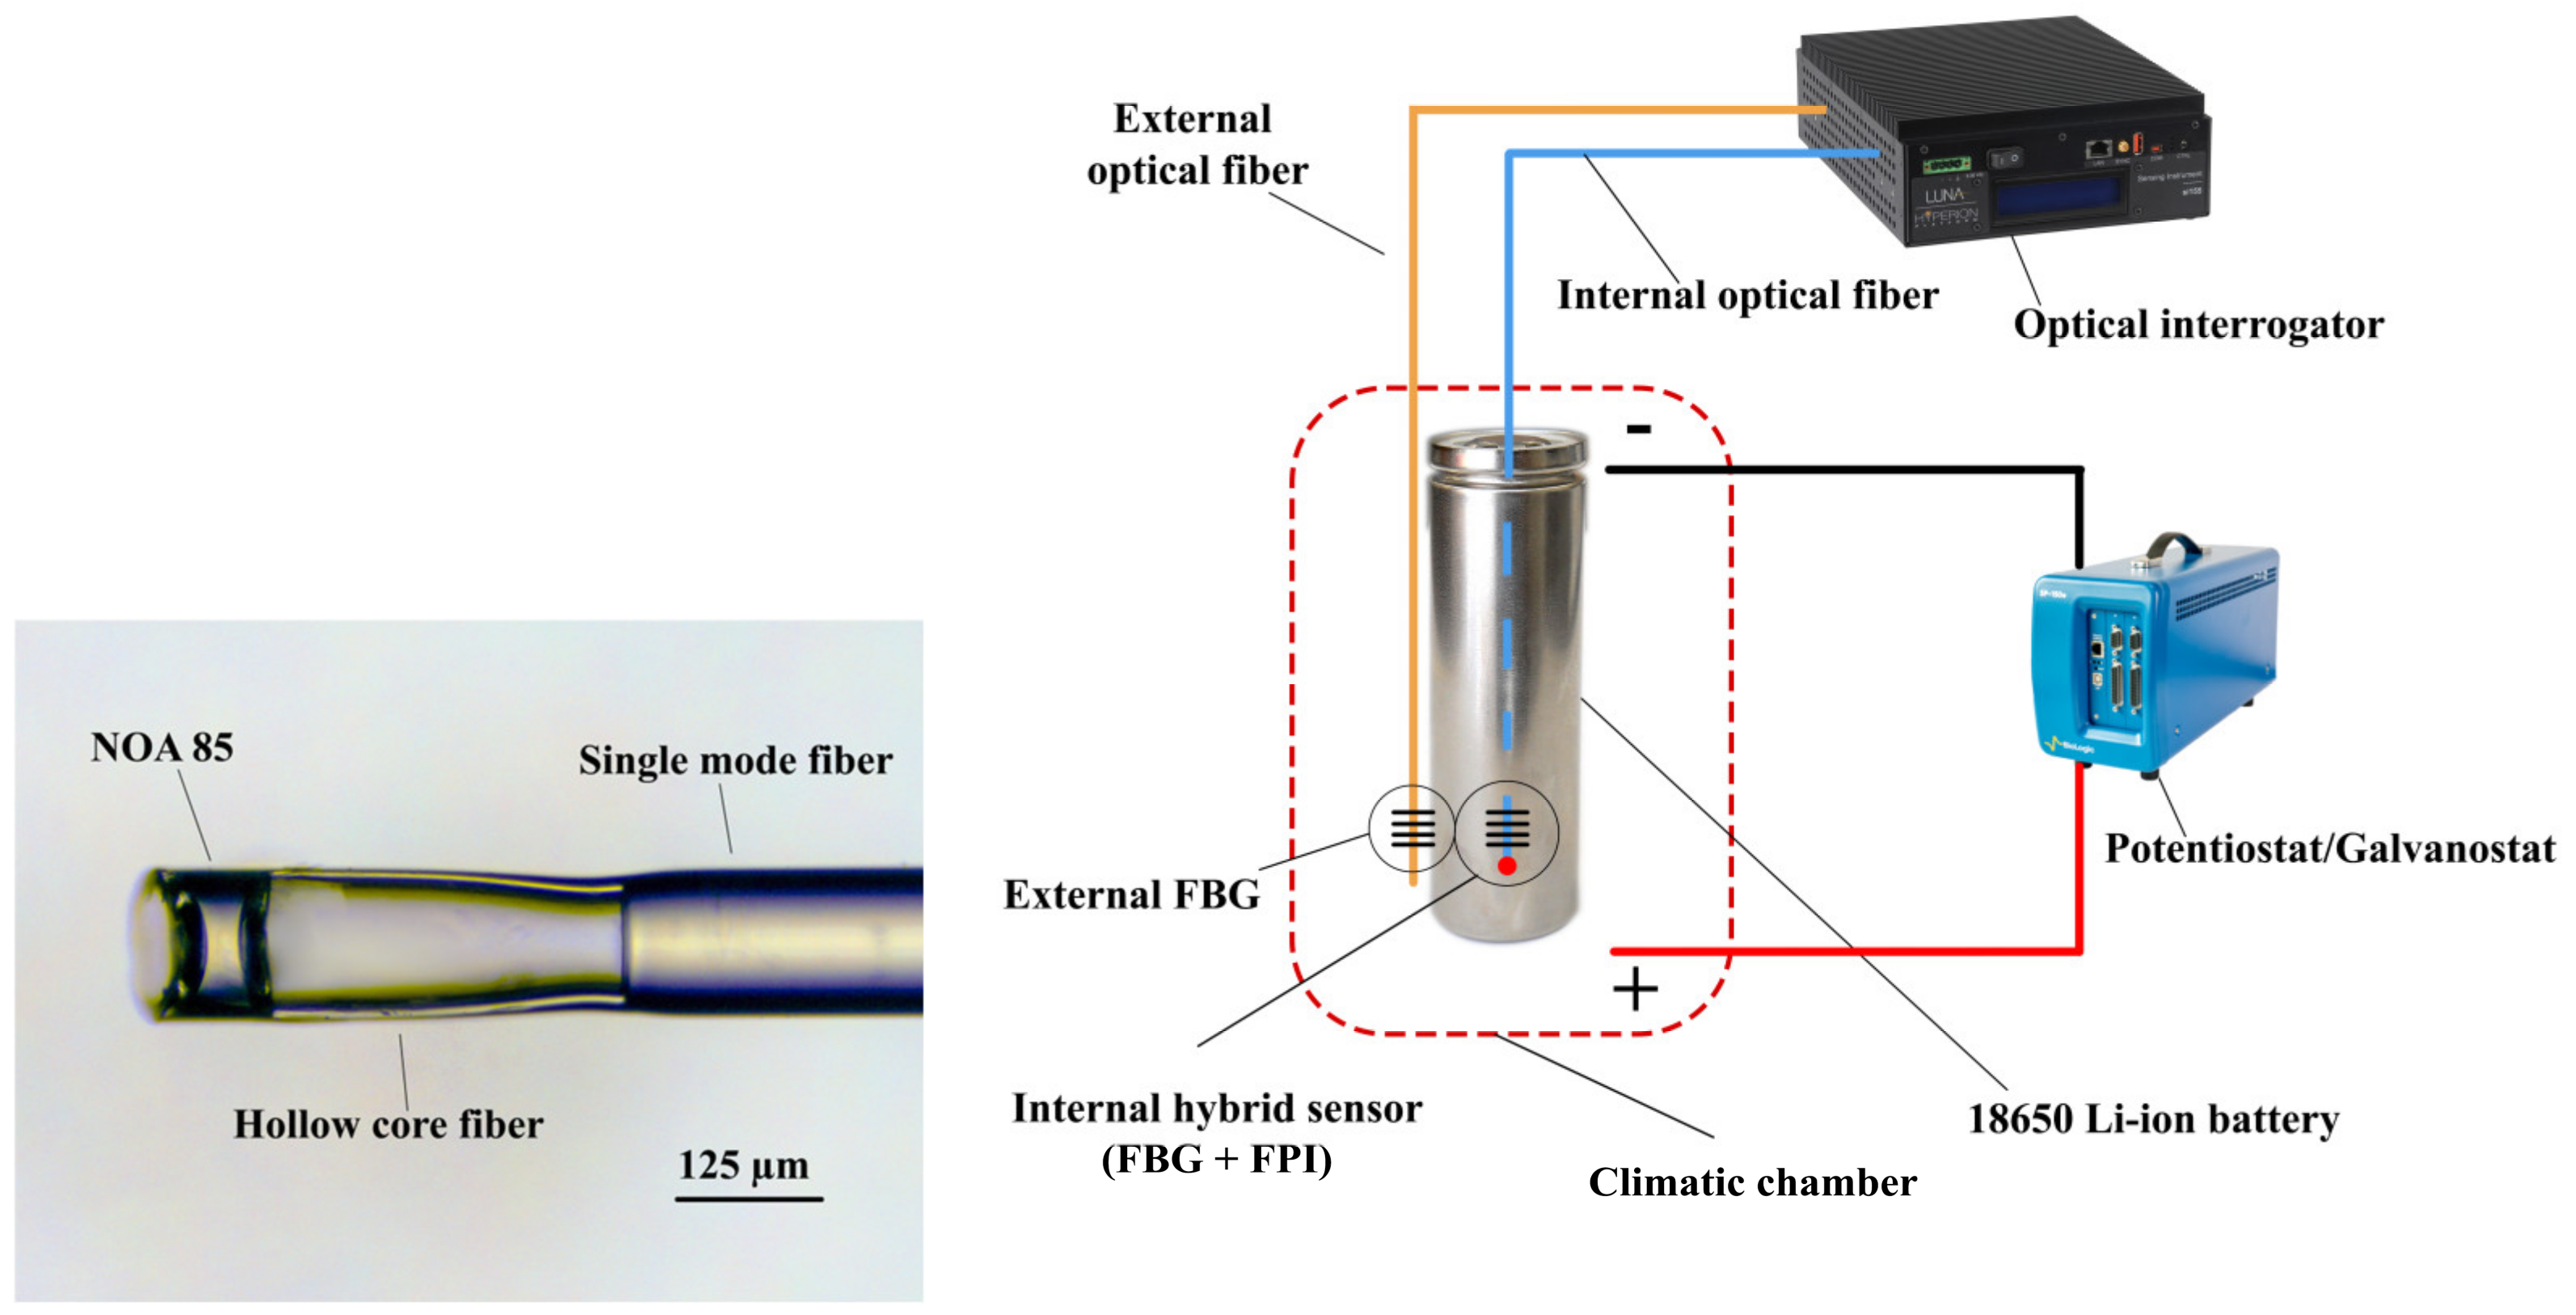
2. Materials and Methods
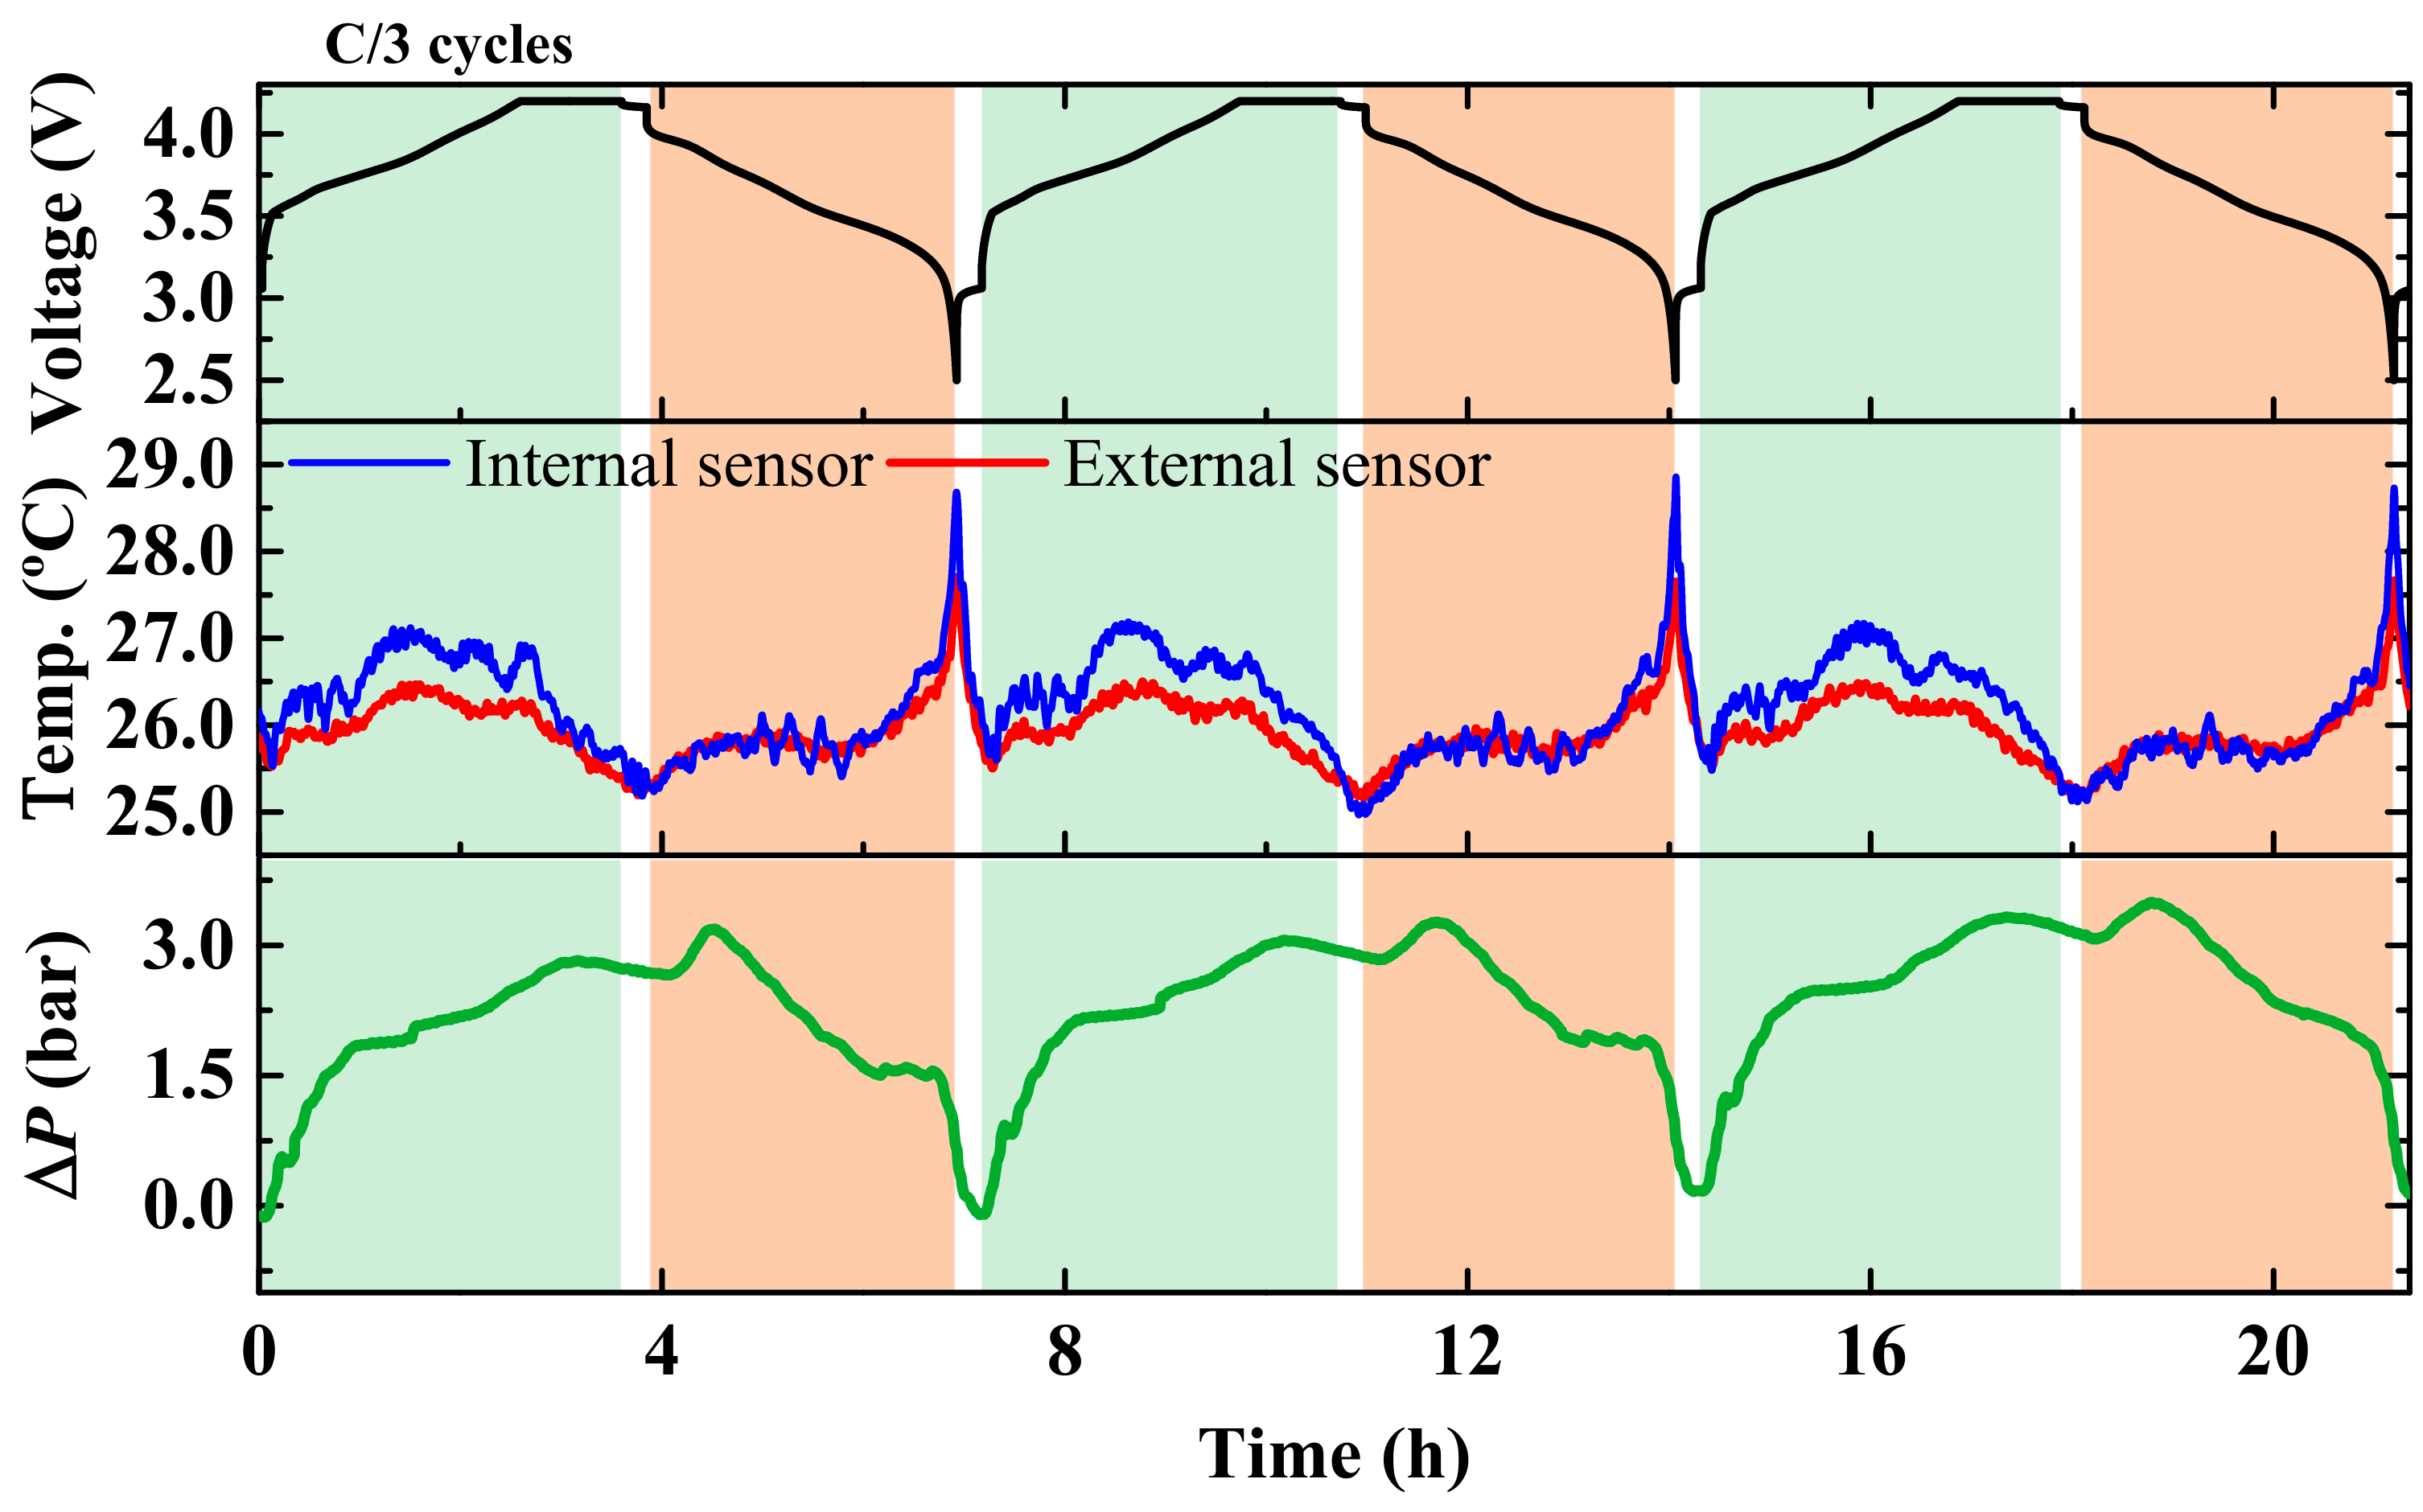
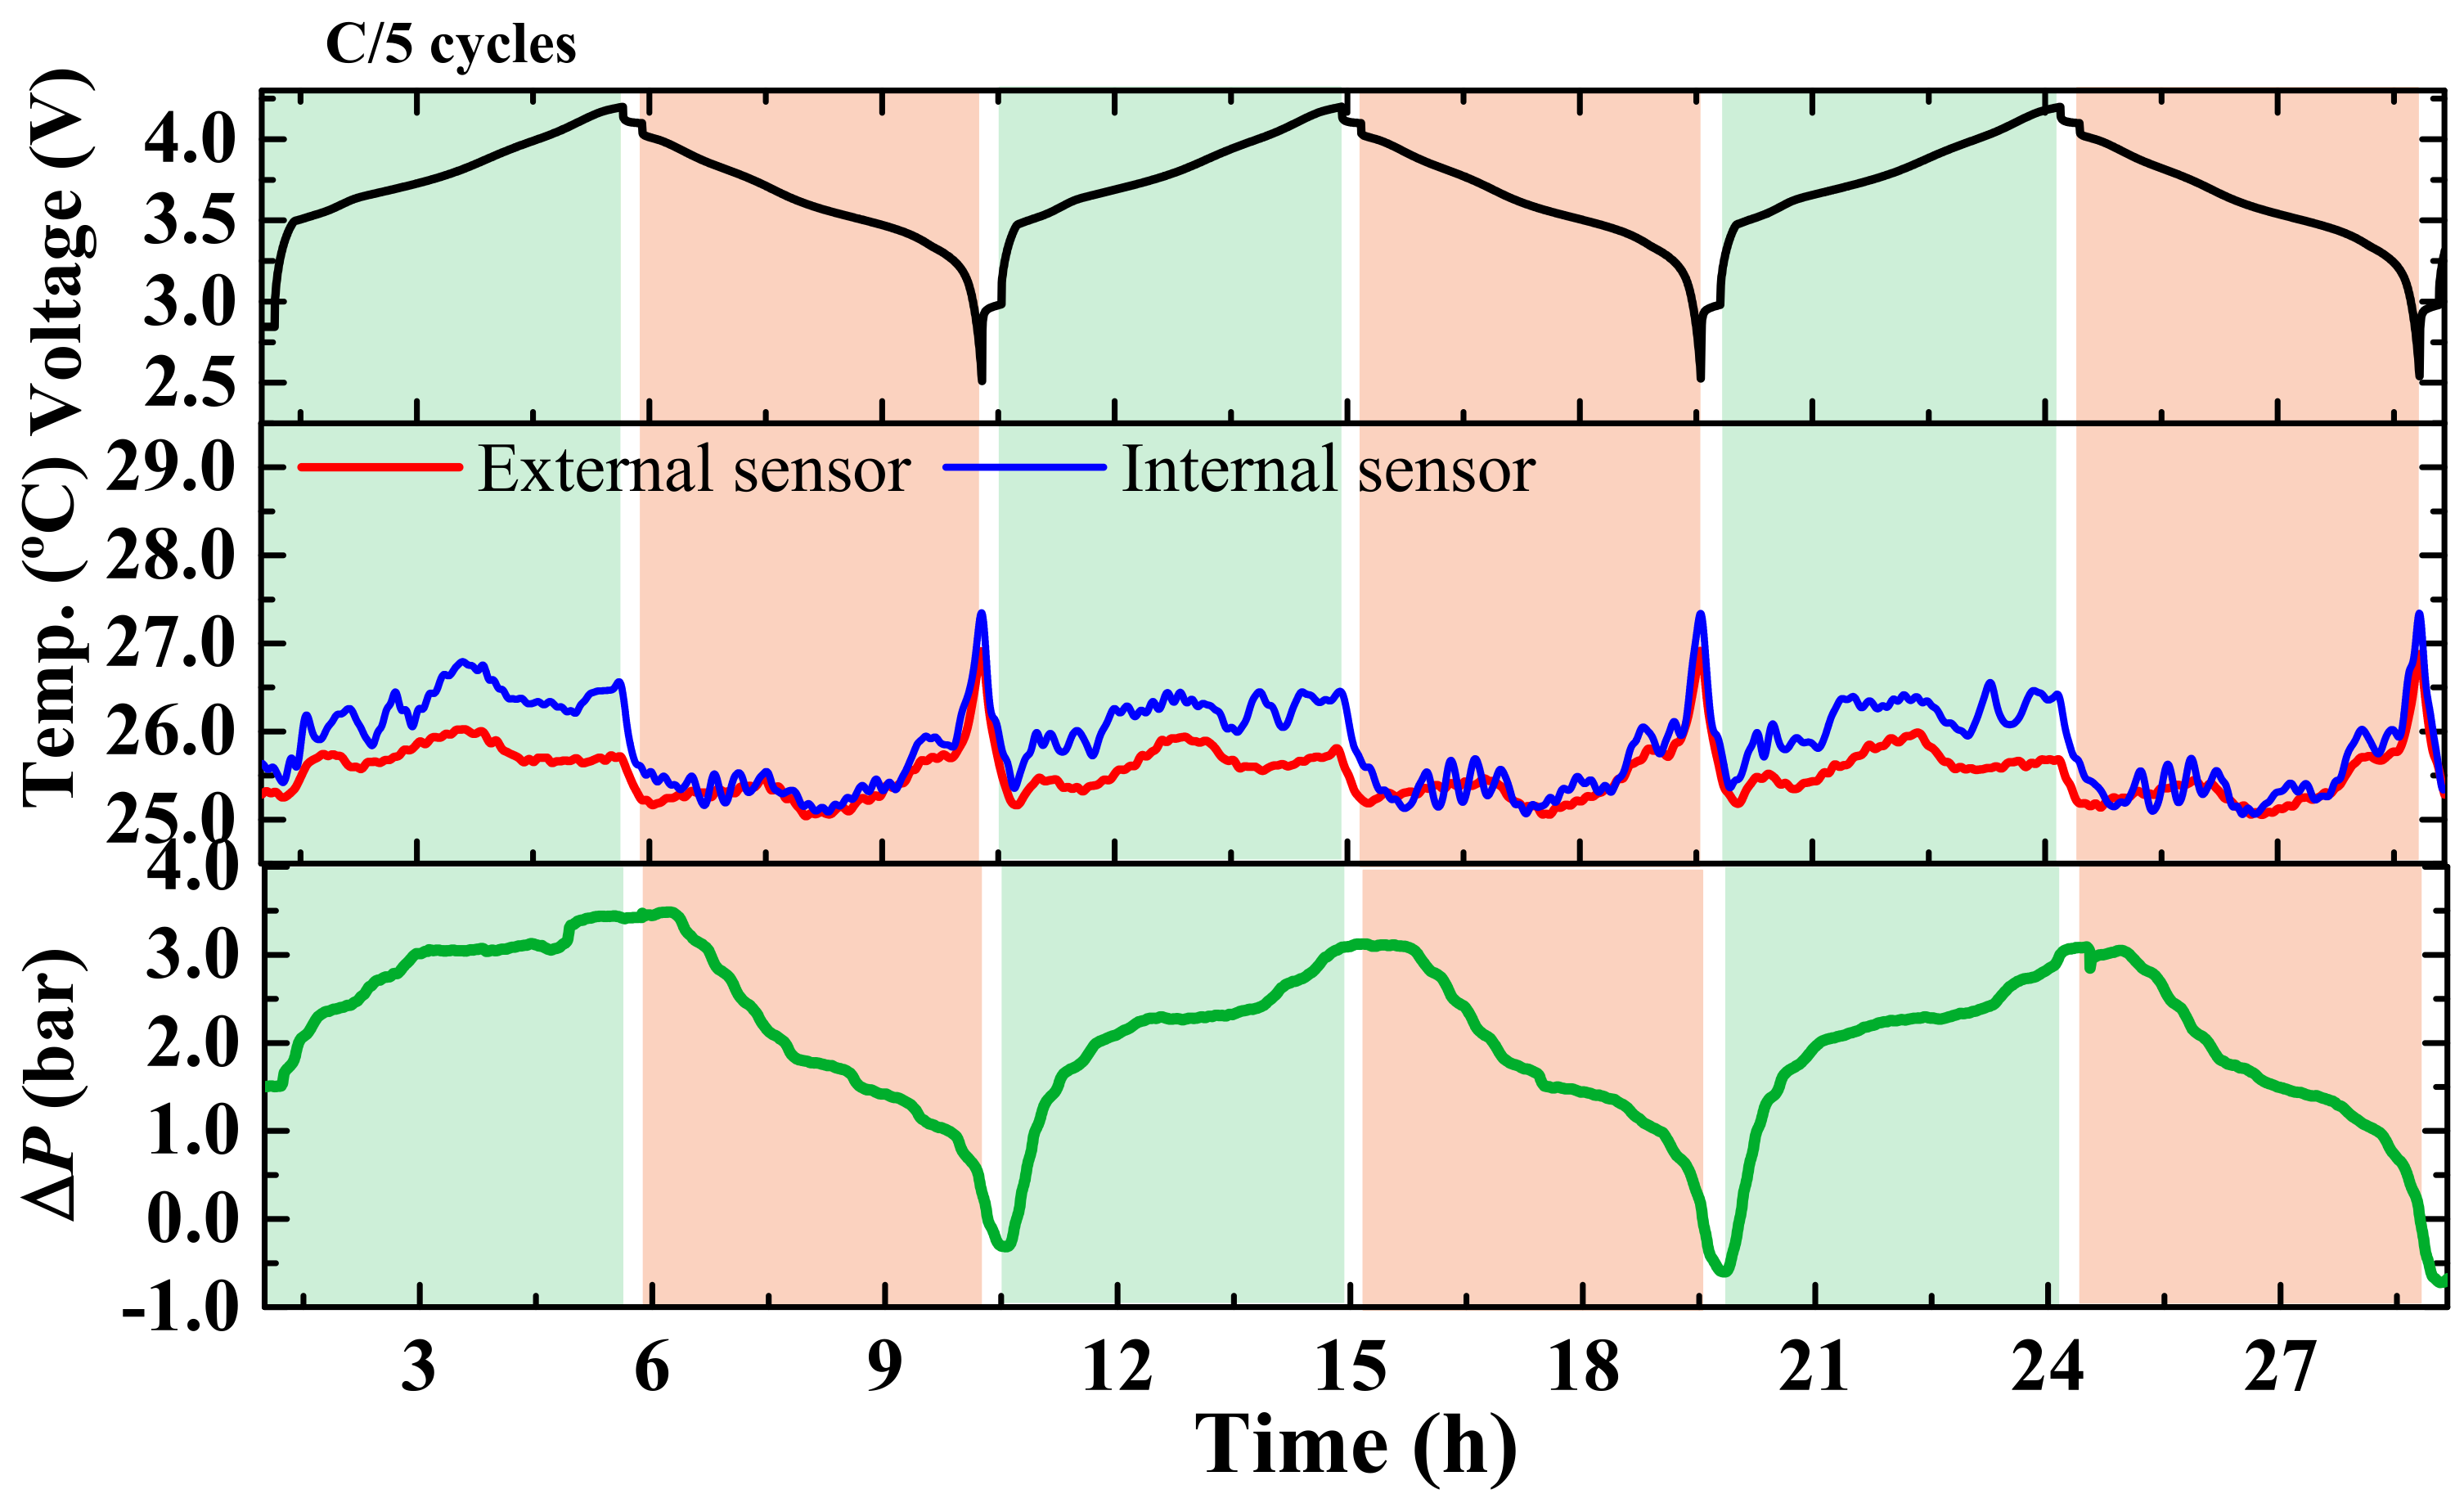
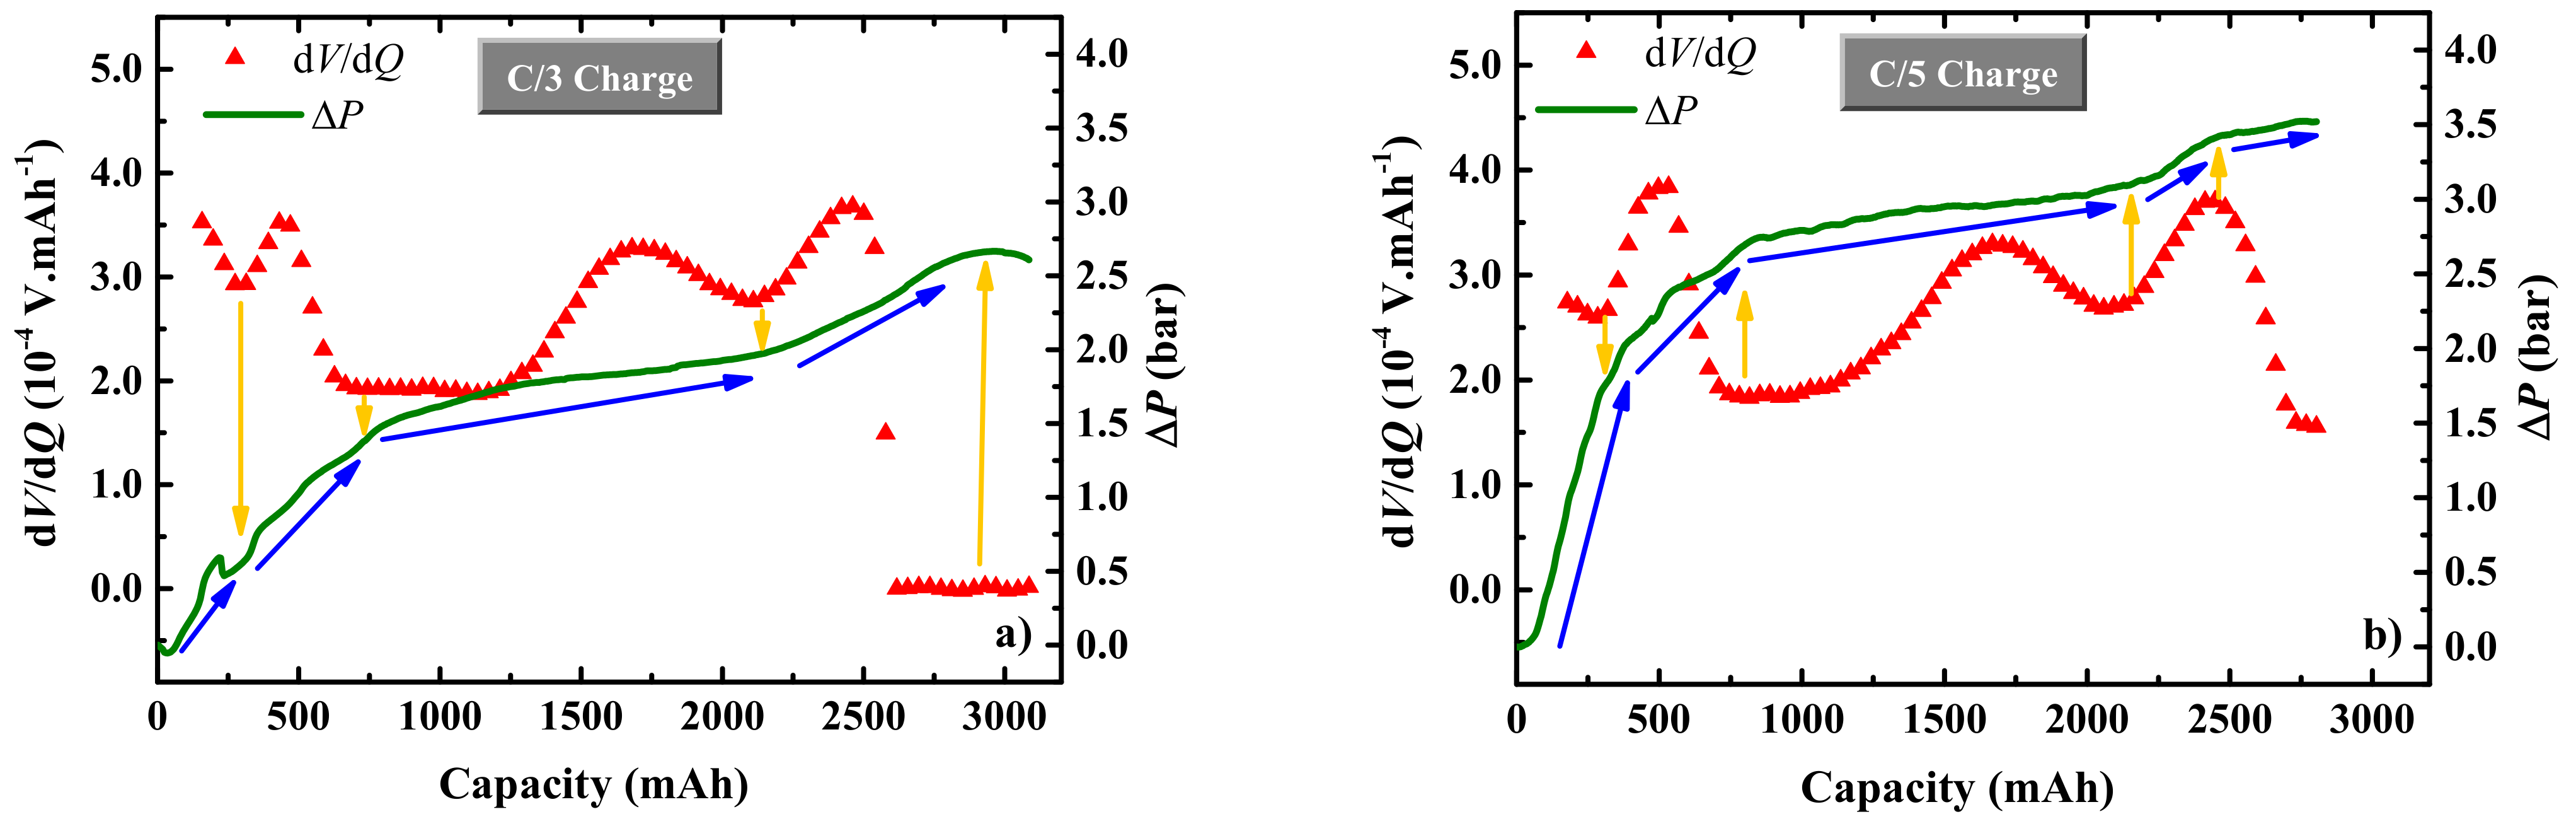
The optical fiber hybrid sensor developed underwent a multi-step fabrication process. Initially, intrinsic FPI cavities were created by splicing a hollow core (HC) silica capillary, with an internal diameter of ~96 μm and an outer diameter of ~125 μm, to a photosensitive single-mode fiber (PS-SMF). Subsequently, a small portion of ultraviolet-cured Norland Optical Adhesive 85 (NOA85, Edmund Optics, Barrington, IL, USA) was inserted into the fiber end of the HC cavity. The FPI sensor was then utilized for simultaneous pressure and temperature measurements, relying on interference patterns generated by reflected light within the FPI cavity. Furthermore, an FBG sensor was inscribed into the PS-SMF near the HC splice using a pulsed Q-switched Nd:YAG laser system (LOTIS TII LS-2137U Laser, Minsk, Belarus). The FBG was designed to provide temperature-sensing capabilities by exploiting the temperature-dependent Bragg wavelength shift. The resulting hybrid sensor had a total length of approximately 1.0 cm. Through calibration steps of each physical parameter, sensitivities of 0.86 nm/°C and −12.3 nm/bar were obtained for the FPI sensor, within the temperature range of 20.0 °C to 40.0 °C and pressure range of 0 bar to 3.0 bar, respectively. For the FBG, a standard value of ~9.5 pm/°C was obtained. It is worth noting that the FBG sensors exhibited insensitivity to pressure variations in the pressure range used. More details regarding the calibration of the sensors may be accessed in the Supplementary Material, Figure S1.
The hybrid sensor was then carefully instrumented into a commercial 18,650 cylindrical LiB. These specific LiBs were of the INR18650 MH1 3200 mAh capacity (LG Chem, Seoul, Republic of Korea), with dimensions of 18 × 65 mm. They were composed of pure graphite anodes and lithium nickel manganese cobalt (N0.93M0.03C0.05O2—NMC91) cathodes, manufactured by LG Chem, featuring a nominal voltage of 3.63 V and a cut-off voltage of 2.50 V.
The OFS instrumentation process involved creating a central hole (0.8 mm in diameter) on the negative side of the battery, which was then sealed with epoxy resin to prevent the entry of any hazardous components into the LiB environment. This entire process was conducted in a glove box with a controlled Argon environment to ensure safety and prevent any interaction of oxygen with the LiB electrolyte. This procedure, previously performed in other studies, has been reported to have no significant impact on the internal functioning of the battery [27,28,29]. The sensor was placed in the center of the cell, in a specific area devoid of material, ensuring that the sensor head was free from any strain or longitudinal forces.
For external temperature sensing, an additional FBG sensor was attached to the battery surface using adhesive with high thermal conductivity to facilitate efficient heat transfer. Special care was taken to ensure that the sensors did not interfere with the normal operation of the battery, and were securely attached to withstand mechanical stress during cycling tests.
The instrumented LiB underwent cycling tests to evaluate its performance under different operating conditions, cycling at C/3 and C/5 under a temperature of 25.0 °C. These tests were conducted using an SP-150e battery cycling system (Biologic®, Seyssinet-Pariset, France), capable of precisely controlling the charge and discharge processes, with optical data acquired by the Hyperion si155 optical interrogation system (LUNA®, Roanoke, VA, USA).
Figure 1 shows the developed optical fiber sensor in the fiber tip and the experimental setup. The battery was subjected to 2 sets of charge/discharge cycles, one at C/3, with a constant-current/constant-voltage (CCCV) charge and a constant-current (CC) discharge, while the other set was performed at a C/5 rate, with a CC charge and a CC discharge. During each set, 3 complete cycles were performed.
Throughout the cycling tests, data from the OFS were continuously recorded alongside other pertinent parameters such as voltage, current, and capacity, in real time. This data acquisition was facilitated by a dedicated system utilizing BioLogic V11, EC-Lab® software. Subsequently, to process the obtained optical data, a Fast Fourier Transform bandpass filter was applied to the FPI spectrum. The subsequent analysis involved tracking the peaks of the filtered FPI spectrum and the Bragg wavelength of the FBG sensor.
Using the acquired data and the sensitivities obtained from both sensors for each parameter, it was possible to decouple the influence of pressure and temperature variations at the same location using a single optical fiber line. This was achieved by employing the following matrix method:
Δ P Δ T = 1 D K T , F P I K T , F B G K P , F P I K P , F B G Δ λ F B G Δ λ F P I
where K represents the sensitivity coefficients to temperature, KT,FBG for the FBG, and KT,FPI for the FPI, and to pressure, KP,FBG and KP,FPI for the FBG and FPI, respectively. ΔλFBG and ΔλFPI represent the wavelength variation of the FBG and FPI sensors, respectively, ΔP and ΔT are the pressure and temperature variations, and D is the K matrix determinant.
To further understand the relationship between pressure and temperature with the electrochemical events during battery operation, DVA derivative curves (dV/dQ) were employed. These DVA curves served as a valuable tool in elucidating the intricate dynamics between pressure, temperature, and the electrochemical performance of the LiB. The DVA curve parameters were obtained based on the work of Dubarry et al. [30]. Through careful examination of these curves, critical insights into the battery’s behavior under different operating conditions were obtained, contributing to a comprehensive understanding of its performance characteristics.

3. Results

Figure 2 shows all the galvanostatic cycles performed in the LiB at each different C-rate. On the top is presented the voltage profile acquired during the experiment, in the middle is the internal and external temperature acquired by the FBGs, and on the bottom is the pressure response, also acquired by the optical fiber hybrid sensor after the dual parameter discrimination through the matrixial method. From a global point of view, it is evident how the temperature and pressure responses present a cyclical behavior, following the charge/discharge cycles. At the end of the discharge step, a sharp temperature rise was observed, while a decline in pressure was detected. During the CC charge step, an incremental temperature and pressure evolution is observed, and during the constant-voltage (CV) charge the temperature decreased and the pressure stabilized. The pressure variation presented a clear trend: while charging, the pressure rose, and while discharging, the pressure fell. The maximum temperature achieved was ~28.0 °C under C/3 and ~27.5 °C under C/5, which were both achieved at the end of the discharge steps. The pressure fluctuated approximately the same amount for both sets, in a range of ~3.0 bar, with the lower value achieved during the rest period right after the discharge steps, and the highest value at the beginning of the discharge, around 3.70 V. This pressure behavior is likely related to the volumetric expansion of the internal jelly roll materials, which indicates expansion during charging and contraction during discharging, behavior already reported in the literature [31]. The temperatures reached during the cycling tests do not justify the formation of internal gas provenience from the electrolyte decomposition and, in this way, the pressure profile monitored inside the battery cannot be associated with that.
During the final CV charge phase of the C/3 charge cycle, the charge power is lower (see Supplementary Material, Figure S2). This means the battery undergoes a less stressful process, which explains the greater pressure and temperature relaxation observed during the transition from charging to discharging, compared to the C/5 set. Because of the CV charge step, the LiB spends more time in lower power stages. In this way, the data presented indicate that the smarter hybrid sensor was capable of detecting temperature and pressure variations and unveiling the cyclical behavior of the LiB.
Figure 3 presents the DVA analysis of the battery cycle along with the pressure variation during the same stage, for charge and discharge, during both cycling operation conditions. With this study, it was possible to correlate the electrochemical events of the LiB, indicated by variations in the DVA curve, with pressure fluctuations. This has not yet been reported in the literature, to the best of our knowledge, and is of great importance for understanding the internal performance of LiB. In both C/3 and C/5 cycles, it was possible to observe that the pressure curve changes its profile at specific points where the DVA presented very specific changes.
For the charge during the C/3 set (Figure 3a) at 250 mAh, a variation in the DVA profile is followed by an abrupt fluctuation in the pressure, indicating that the electrochemical event related to this DVA local minimum influences the pressure evolution within the battery. In the range of 500 to 1250 mAh, the DVA curve found a stationary region; the pressure stayed with the same increase rate from the beginning of this region until ~2250 mAh, where the DVA profile presents another local minimum. At around 2250 mAh, the DVA profile finds another variation, which is reflected in pressure profile changes. The region from 2600 to 3150 mAh is noted by a CV stage, where the DVA is null; as expected, during this stage, around 2900 mAh, the pressure starts to stabilize and define the local maxima in the region.
For the C/5 charge (Figure 3b), it is possible to notice some similarities with the C/3 charge. The trend of the pressure profile is close to that described for C/3, and there is a local minimum of 250 mAh in the DVA, which is also correlated to the pressure alteration in this region. A similar behavior was observed at 2250 mAh; however, as in the C/5 charge set, the CV stage was not applied, and the DVA finished earlier, going up to ~2900 mAh and not presenting the null DVA region as observed in C/3, neither for the local maxima or for the pressure. This point is also important to highlight because it was possible to observe the impact of the absence of CV steps on the electrochemical and physical performance of the LiB.
In the discharge charts (Figure 3c,d), noticeable differences can be observed between the C/3 and C/5 tests. Due to the absence of the CC charge step in the C/5 set, it appears that the events (local maxima and minima) of the DVA profile for the C/5 set occurred earlier. This can be explained by the fact that, without the CC charge step, the battery in the C/5 set starts discharging without being fully charged. This results in the earlier stages of the DVA profile and explains why the DVA curve extends up to ~2900 mAh for the C/3 set but only up to ~2600 mAh for the C/5 set. For the C/3 discharge, a sharp correlation between the pressure and DVA profiles can be observed between 250 mAh and 1000 mAh, where the pressure follows the trend of the DVA curve. At the local minimum of the DVA at 1000 mAh, the pressure decrease rate remains consistent until the beginning of the final stage of the discharge, within the region delineated between ~2550 mAh and ~2850 mAh, shown in light grey. In this region, there is an increase in the pressure decrease rate, coinciding with an abrupt variation in the DVA profile, marking the final stage of the discharge step.
For the C/5 discharge, as with the charge, some similarities can be observed. The trend of the pressure profile is similar to the DVA profile in the early stages of discharge. Furthermore, the behavior of the pressure is similar during the final stages of discharge, between 2200 and 2600 mAh. However, in the C/5 discharge, the effect of the DVA local maxima on the pressure is more evident, particularly at ~1050 mAh. Additionally, the DVA curve exhibits even more abrupt fluctuations in the light-grey demarcated area. The explanation for this is that, at lower C-rates, the electrochemical stages of the battery are more evident, which is reflected by the DVA profile.
Figure 4 shows the correlation data from the electrochemical DVA profile with the temperature variation tracked by the internal OFS within the battery. During the charge (Figure 4a,b), the DVA shows peaks around 500 mAh, 1750 mAh, and 2500 mAh. The temperature increases gradually up to about 1000 mAh, then stabilizes until 2300 and 2100 mAh for C/3 and C/5, respectively, and rises again until 2600 and 2800 mAh for C/3 and C/5, respectively. The thermal decrease observed in the C/3 set is related to the CV charge step. As previously discussed, during this stage, the battery is subjected to less electrical power, allowing it to cool down. This cooling effect is not observed in the C/5 set, where the charge step is conducted only in the CC steps.
During the discharge, a similar behavior is observed when compared to the pressure response. The temperature events in C/5 appear to happen early when compared to C/3, and the DVA curve ends earlier. Additionally, due to the lack of a CV charge step in the C/5 set, the battery is not charged as it was in C/3. Four distinct stages of temperature behavior can be identified during the discharge steps, as highlighted in the regions in Figure 4c,d. Initially, there is a period of thermal stability at the beginning of the discharge, which lasts longer in the C/3 set due to the extra charge provided by the CV step during charging. This is followed by a region of high thermal fluctuation. Next, there is a new region of thermal stability, coinciding with the local minimum in the DVA profile (2000 mAh for C/3 and 1750 mAh for C/5). Finally, there is a zone with a sharp temperature increase, following the electrochemical data of the DVA profile. A clear correlation can be observed between the DVA peaks and the temperature increases, especially in the last stage of the discharge, after 2250 and 2050 mAh for C/3 and C/5, respectively.
These results provide a clear view of how the internal cell parameters, such as temperature and pressure, are interconnected with the electrochemical DVA data. High-energy events detected by the DVA correspond to significant temperature and pressure fluctuations, and the charge/discharge rate notably impacts these variables.
In all the figures, a clear correlation between the DVA peaks and temperature fluctuation is observed. This indicates that the DVA peaks specify high-energy events that result in temperature responses. During periods of thermal stability, the DVA values are lower and more consistent, suggesting that these periods are characterized by more efficient energy transfer. The rate of charge/discharge (C/3 vs. C/5) influences the magnitude of temperature variations and the amplitude of DVA peaks. The DVA data refer to the electrochemical events that happen within the LIB, as demonstrated in the literature [32,33,34,35,36], where each stage of the DVA is related to a specific reaction in different stages of the battery anode and cathode materials during the galvanostatic cycling processes.

4. Conclusions

In this study, we developed and instrumented an optical fiber hybrid sensing configuration, based on FBG and FPI sensors, within a commercial LiB to monitor and evaluate, in real time, some of their specific safety parameters. The optical data collected throughout the cycling tests revealed a consistent correlation between internal and external temperature values. However, some differences were observed by the internal sensors during some steps of the cycling tests. Regarding the pressure values sensed during the galvanostatic cycles, it was observed that the battery expands during charging and compresses during discharging, as a consequence of Li-ion intercalations from and to the anode material during cycling. Additionally, the temperature data indicated that the end of the discharge process is the most thermally critical part due to the rapid voltage decay.
During the cycling tests, concerning the temperature variation data, four different moments were identified (thermal stability, high thermal fluctuation, thermal rise, and thermal fall) and they are present in different stages of the DVA data, at each different C-rate applied. Regarding the electrochemical DVA curves during battery cycling with the internal pressure detected by the optical sensor, a good correlation can also be highlighted between the successive slope changes of the pressure data with the slope changes of DVA data. The optical sensing approach developed offers a nuanced understanding of in situ internal LiB dynamics, with implications for optimizing their performance and safety under different conditions. Furthermore, the sensing technology presented serves as a valuable tool for examining battery behavior across various scenarios, enhancing the actual battery management systems through reliable data on internal conditions.
As an extension of the current work, a long-term cycling measurement and correlation analysis can be further investigated to reveal the degradation mechanisms for these batteries, and to offer insights for battery design.

Supplementary Materials

The following supporting information can be downloaded at: https://www.mdpi.com/article/10.3390/batteries10080289/s1, Figure S1: (a) Pressure calibration for the FPI and FBG sensors. (b) Temperature calibration for the FPI and FBG sensors. (c) Response of the FPI sensor under varying pressures in a pressure chamber, with the temperature maintained at 25 °C; Figure S2: Presentation of voltage and power profiles during the charge-discharge cycles of the battery. The dark grey areas indicate the regions where the constant voltage charge step occurs, demonstrating that the power during this step is lower compared to the final stages of the constant current charge.

Author Contributions

All authors contributed equally. L.M. and M.N. conceptualized the experiments and analyzed the data. L.M., M.S.F. and M.N. discussed the results, as well as wrote and revised the document. All authors have read and agreed to the published version of the manuscript.

Funding

The authors gratefully acknowledge the European Project “Innovative physical/virtual sensor platform for battery cell” (INSTABAT) (European Union’s Horizon 2020 research and innovation program under grant agreement No 955930), https://www.instabat.eu/. The authors also acknowledge the financial support within the scope of the project i3N, UIDB/50025/2020, UIDP/50025/2020, and LA/P/0037/2020, all financed by national funds through the Fundação para a Ciência e Tecnologia and the Ministério da Educação e Ciência of Portugal. The authors LM, MSF, and MN are grateful for the grants 2023.01848.BD, CEECINST/00013/2021/CP2779/CT0014, and CDL-CTTRI-123-ARH/2020, respectively.

Data Availability Statement

The original contributions presented in the study are included in the article, further inquiries can be directed to the corresponding author.

Conflicts of Interest

The authors declare no conflicts of interest.

References

  1. Giarola, S.; Molar-Cruz, A.; Vaillancourt, K.; Bahn, O.; Sarmiento, L.; Hawkes, A.; Brown, M. The Role of Energy Storage in the Uptake of Renewable Energy: A Model Comparison Approach. Energy Policy 2021, 151, 112159. [Google Scholar] [CrossRef]
  2. Mitali, J.; Dhinakaran, S.; Mohamad, A.A. Energy Storage Systems: A Review. Energy Storage Sav. 2022, 1, 166–216. [Google Scholar] [CrossRef]
  3. Chu, S.; Cui, Y.; Liu, N. The Path towards Sustainable Energy. Nat. Mater. 2016, 16, 16–22. [Google Scholar] [CrossRef] [PubMed]
  4. Chombo, P.V.; Laoonual, Y. A Review of Safety Strategies of a Li-Ion Battery. J. Power Sources 2020, 478, 228649. [Google Scholar] [CrossRef]
  5. Li, B.; Parekh, M.H.; Adams, R.A.; Adams, T.E.; Love, C.T.; Pol, V.G.; Tomar, V. Lithium-Ion Battery Thermal Safety by Early Internal Detection, Prediction and Prevention. Sci. Rep. 2019, 9, 13255. [Google Scholar] [CrossRef]
  6. Yang, G.; Leitão, C.; Li, Y.; Pinto, J.; Jiang, X. Real-Time Temperature Measurement with Fiber Bragg Sensors in Lithium Batteries for Safety Usage. Measurement 2013, 46, 3166–3172. [Google Scholar] [CrossRef]
  7. Nascimento, M.; Ferreira, M.S.; Pinto, J.L. Real Time Thermal Monitoring of Lithium Batteries with Fiber Sensors and Thermocouples: A Comparative Study. Measurement 2017, 111, 260–263. [Google Scholar] [CrossRef]
  8. Matuck, L.; Pinto, J.L.; Marques, C.; Nascimento, M. Simultaneous Strain and Temperature Discrimination in 18650 Li-Ion Batteries Using Polarization-Maintaining Fiber Bragg Gratings. Batteries 2022, 8, 233. [Google Scholar] [CrossRef]
  9. Freitas, F.; Matuck, L.; Bierlich, J.; Ferreira, M.; Marques, C.; Nascimento, M. Innovative Hybrid Optical Sensing Design to Simultaneously Discriminate Pressure and Temperature. J. Phys. Conf. Ser. 2022, 2407, 12023. [Google Scholar] [CrossRef]
  10. Lao, J.; Sun, P.; Liu, F.; Zhang, X.; Zhao, C.; Mai, W.; Guo, T.; Xiao, G.; Albert, J. In Situ Plasmonic Optical Fiber Detection of the State of Charge of Supercapacitors for Renewable Energy Storage. Light Sci. Appl. 2018, 7, 34. [Google Scholar] [CrossRef]
  11. Bae, C.-J.; Manandhar, A.; Kiesel, P.; Raghavan, A. Monitoring the Strain Evolution of Lithium-Ion Battery Electrodes Using an Optical Fiber Bragg Grating Sensor. Energy Technol. 2016, 4, 851–855. [Google Scholar] [CrossRef]
  12. Huang, J.; Han, X.; Liu, F.; Gervillié, C.; Blanquer, L.A.; Guo, T.; Tarascon, J.M. Monitoring Battery Electrolyte Chemistry: Via in-Operando Tilted Fiber Bragg Grating Sensors. Energy Environ. Sci. 2021, 14, 6464–6475. [Google Scholar] [CrossRef]
  13. Fortier, A.; Tsao, M.; Williard, N.D.; Xing, Y.; Pecht, M.G. Preliminary Study on Integration of Fiber Optic Bragg Grating Sensors in Li-Ion Batteries and In Situ Strain and Temperature Monitoring of Battery Cells. Energies 2017, 10, 838. [Google Scholar] [CrossRef]
  14. Peng, J.; Jia, S.; Jin, Y.; Xu, S.; Xu, Z. Design and Investigation of a Sensitivity-Enhanced Fiber Bragg Grating Sensor for Micro-Strain Measurement. Sens. Actuators A Phys. 2018, 285, 437–447. [Google Scholar] [CrossRef]
  15. Wang, R.; Zhang, H.; Liu, Q.; Liu, F.; Han, X.; Liu, X.; Li, K.; Xiao, G.; Albert, J.; Lu, X.; et al. Operando Monitoring of Ion Activities in Aqueous Batteries with Plasmonic Fiber-Optic Sensors. Nat. Commun. 2022, 13, 547. [Google Scholar] [CrossRef]
  16. Rente, B.; Fabian, M.; Vidakovic, M.; Liu, X.; Li, X.; Li, K.; Sun, T.; Grattan, K.T.V. Lithium-Ion Battery State-of-Charge Estimator Based on FBG-Based Strain Sensor and Employing Machine Learning. IEEE Sens. J. 2021, 21, 1453–1460. [Google Scholar] [CrossRef]
  17. Nascimento, M.; Paixão, T.; Ferreira, M.S.; Pinto, J.L. Thermal Mapping of a Lithium Polymer Batteries Pack with FBGs Network. Batteries 2018, 4, 67. [Google Scholar] [CrossRef]
  18. Peng, J.; Jia, S.; Yu, H.; Kang, X.; Yang, S.; Xu, S. Design and Experiment of FBG Sensors for Temperature Monitoring on External Electrode of Lithium-Ion Batteries. IEEE Sens. J. 2021, 21, 4628–4634. [Google Scholar] [CrossRef]
  19. Wang, Y.; Tian, J.; Sun, Z.; Wang, L.; Xu, R.; Li, M.; Chen, Z. A Comprehensive Review of Battery Modeling and State Estimation Approaches for Advanced Battery Management Systems. Renew. Sustain. Energy Rev. 2020, 131, 110015. [Google Scholar] [CrossRef]
  20. Chen, Y.; Kang, Y.; Zhao, Y.; Wang, L.; Liu, J.; Li, Y.; Liang, Z.; He, X.; Li, X.; Tavajohi, N.; et al. A Review of Lithium-Ion Battery Safety Concerns: The Issues, Strategies, and Testing Standards. J. Energy Chem. 2021, 59, 83–99. [Google Scholar] [CrossRef]
  21. Bloom, I.; Jansen, A.N.; Abraham, D.P.; Knuth, J.; Jones, S.A.; Battaglia, V.S.; Henriksen, G.L. Differential Voltage Analyses of High-Power, Lithium-Ion Cells 1. Technique and Application. J. Power Sources 2005, 139, 295–303. [Google Scholar] [CrossRef]
  22. Dahn, H.M.; Smith, A.J.; Burns, J.C.; Stevens, D.A.; Dahn, J.R. User-Friendly Differential Voltage Analysis Freeware for the Analysis of Degradation Mechanisms in Li-Ion Batteries. J. Electrochem. Soc. 2012, 159, A1405–A1409. [Google Scholar] [CrossRef]
  23. Zheng, L.; Zhu, J.; Lu, D.D.C.; Wang, G.; He, T. Incremental Capacity Analysis and Differential Voltage Analysis Based State of Charge and Capacity Estimation for Lithium-Ion Batteries. Energy 2018, 150, 759–769. [Google Scholar] [CrossRef]
  24. Sturm, J.; Frank, A.; Rheinfeld, A.; Erhard, S.V.; Jossen, A. Impact of Electrode and Cell Design on Fast Charging Capabilities of Cylindrical Lithium-Ion Batteries. J. Electrochem. Soc. 2020, 167, 130505. [Google Scholar] [CrossRef]
  25. Vidal, D. Effect of the Positive Electrode and of Mechanical Stresses on the Cyclability of a Li-Ion Cell Containing Silicon-Based Negative Electrode. Ph.D. Thesis, Université Grenoble Alpes, Saint-Martin-d’Hères, France, 2022. [Google Scholar]
  26. Murashko, K.; Li, D.; Danilov, D.L.; Notten, P.H.L.; Pyrhonen, J.; Jokiniemi, J. Determination of Li-Ion Battery Degradation Mechanisms at High c-Rate Charging. In Proceedings of the 2019 IEEE Vehicle Power and Propulsion Conference, VPPC 2019—Proceedings, Hanoi, Vietnam, 14–17 October 2019; pp. 1–6. [Google Scholar] [CrossRef]
  27. Li, S.; Patel, A.N.; Zhang, C.; Amietszajew, T.; Kirkaldy, N.; Offer, G.J.; Marinescu, M. Internal Temperature Estimation for Lithium-Ion Batteries through Distributed Equivalent Circuit Network Model. J. Power Sources 2024, 611, 234701. [Google Scholar] [CrossRef]
  28. Wang, N.; Chen, A.; Zhao, W.; Zhu, R.; Duan, B. An Online Temperature Estimation for Cylindrical Lithium-Ion Batteries Based on Simplified Distribution Electrical-Thermal Model. J. Energy Storage 2022, 55, 105326. [Google Scholar] [CrossRef]
  29. Wang, H.; Yang, Z.; Jiang, C.; Ji, Z.; Zhu, Z. Internal Temperature and Flame Jet Characteristics during Thermal Runaway Triggered by Nail Penetration for NCM811 Lithium-Ion Battery. J. Therm. Anal. Calorim. 2022, 147, 14925–14938. [Google Scholar] [CrossRef]
  30. Dubarry, M.; Anseán, D. Best Practices for Incremental Capacity Analysis. Front. Energy Res. 2022, 10, 1023555. [Google Scholar] [CrossRef]
  31. Nadimpalli, S.P.V.; Sethuraman, V.A.; Abraham, D.P.; Bower, A.F.; Guduru, P.R. Stress Evolution in Lithium-Ion Composite Electrodes during Electrochemical Cycling and Resulting Internal Pressures on the Cell Casing. J. Electrochem. Soc. 2015, 162, A2656. [Google Scholar] [CrossRef]
  32. Jamil, S.; Wang, G.; Yang, L.; Xie, X.; Cao, S.; Liu, H.; Chang, B.; Wang, X. Suppressing H2–H3 Phase Transition in High Ni–Low Co Layered Oxide Cathode Material by Dual Modification. J. Mater. Chem. A 2020, 8, 21306–21316. [Google Scholar] [CrossRef]
  33. Asenbauer, J.; Eisenmann, T.; Kuenzel, M.; Kazzazi, A.; Chen, Z.; Bresser, D. The Success Story of Graphite as a Lithium-Ion Anode Material-Fundamentals, Remaining Challenges, and Recent Developments Including Silicon (Oxide) Composites. Sustain. Energy Fuels 2020, 4, 5387–5416. [Google Scholar] [CrossRef]
  34. Hahn, M.; Buqa, H.; Ruch, P.W.; Goers, D.; Spahr, M.E.; Ufheil, J.; Novák, P.; Kötz, R. A Dilatometric Study of Lithium Intercalation into Powder-Type Graphite Electrodes. Electrochem. Solid-State Lett. 2008, 11, A151. [Google Scholar] [CrossRef]
  35. Jung, R.; Metzger, M.; Maglia, F.; Stinner, C.; Gasteiger, H.A. Oxygen Release and Its Effect on the Cycling Stability of LiNixMny CozO2 (NMC) Cathode Materials for Li-Ion Batteries. J. Electrochem. Soc. 2017, 164, A1361–A1377. [Google Scholar] [CrossRef]
  36. Laszczynski, N.; Solchenbach, S.; Gasteiger, H.A.; Lucht, B.L. Understanding Electrolyte Decomposition of Graphite/NCM811 Cells at Elevated Operating Voltage. J. Electrochem. Soc. 2019, 166, A1853–A1859. [Google Scholar] [CrossRef]
Figure 1. (left) Photo of the sensor head. (right) Experimental configuration featuring the instrumented LiB.
Batteries 10 00289 g001
Figure 2. Temperature and pressure evolution for the different C-rates tested, C/3 top, C/5 bottom. The green and red zones on the charts make reference to charge and discharge steps, respectively, while the rest periods are delimited by the white zones.
Batteries 10 00289 g002aBatteries 10 00289 g002b
Figure 3. DVA and ΔP correlation under C/3 charge and discharge ((a,c), respectively) and C/5 charge and discharge ((b,d), respectively).
Batteries 10 00289 g003aBatteries 10 00289 g003b
Figure 4. DVA and ΔT correlation under C/3 charge and discharge ((a,c), respectively) and C/5 charge and discharge ((b,d), respectively).
Batteries 10 00289 g004aBatteries 10 00289 g004b
Disclaimer/Publisher’s Note: The statements, opinions and data contained in all publications are solely those of the individual author(s) and contributor(s) and not of MDPI and/or the editor(s). MDPI and/or the editor(s) disclaim responsibility for any injury to people or property resulting from any ideas, methods, instructions or products referred to in the content.

