Article

A Y-Type Air-Cooled Battery Thermal Management System with a Short Airflow Path for Temperature Uniformity

1
School of Information Engineering and Internet of Things, Huzhou Vocational & Technical College, Huzhou 313000, China
2
School of Information Engineering, Henan Institute of Science and Technology, Xinxiang 453003, China
*
Author to whom correspondence should be addressed.
Batteries 2024, 10(9), 302; https://doi.org/10.3390/batteries10090302
Submission received: 5 July 2024 / Revised: 12 August 2024 / Accepted: 26 August 2024 / Published: 27 August 2024
(This article belongs to the Special Issue Recent Advances in the Thermal Safety of Lithium-Ion Batteries)

Abstract

:
A Y-type air-cooled structure has been proposed to improve the heat dissipation efficiency and temperature uniformity of battery thermal management systems (BTMSs) by reducing the flow path of air. By combining computational fluid dynamics (CFD) methods, the influence of the depths of the distribution and convergence plenums on the airflow velocity through battery cells was analyzed to improve heat dissipation efficiency. Adjusting the width of the first and ninth cooling channels can change the air velocity of these two channels, thereby improving the temperature uniformity of the BTMS. Further discussion was conducted regarding the influences of inlet and outlet depths. When the inlet width and outlet width were 20 mm, the maximum temperature and maximum temperature difference of the Y-type BTMS were 39.84 °C and 0.066 °C at a discharge rate of 2.5 °C, respectively; these temperatures were 1.537 °C (3.68%) and 0.059 °C (47.2%) lower than those of the T-type model. Meanwhile, the energy consumption of the sample also decreased by 13.1%. The results indicate that the heat dissipation performance of the proposed Y-type BTMS was improved, achieving excellent temperature uniformity, and the energy consumption was also reduced.

Graphical Abstract

1. Introduction

Energy is one of the most important issues for politicians and government officials in various countries. Therefore, researchers have attached great importance to this discussion [1,2,3]. Fossil fuel resources will eventually be depleted; therefore, it is necessary to search for new available energy sources. This has led to many countries investing more in electric vehicles. The main component of electric vehicles is the battery [4,5]. A lithium-ion battery pack composed of hundreds or thousands of battery units integrated in series and in parallel inevitably accumulates a large amount of heat during discharge. If heat dissipation is not carried out, heat loss problems can easily result, affecting the working performance and safety of the battery.
The cooling systems in electric and hybrid vehicles can be active or passive cooling systems; air, liquid or phase-change materials cooling; single cooling systems or combined cooling and heating systems and direct or indirect cooling systems. A BTMS based on forced air cooling technology is the simplest method to solve the problem of internal heating in battery packs and provides a feasible solution when the internal design space of electric vehicles is tight. The air-cooled BTMS is also the foundation of other cooling technologies, and other cooling technologies usually require air cooling technology to be used in conjunction. The application limitations of air-cooled BTMSs are becoming increasingly apparent. However, in terms of actual usage effects, it is still suitable for some pure electric/hybrid electric vehicles with moderate battery energy density or equipped with lithium iron phosphate batteries. For this type of electric vehicle, due to the fact that the heat generated by the battery does not rapidly increase, a forced air cooling BTMS is sufficient to maintain the thermal balance of the system. Many researchers have proposed different battery cooling solutions over recent years [6,7]. The effects of quantity [8,9,10] and location [11,12] of the inlets and outlets on heat dissipation performance have been studied. Hong et al. [10] improved the cooling performance of Z-type air-cooled BTMS by adding a secondary outlet. Peng et al. [13] analyzed the influence of the position and height of the inlet and outlet on the cooling performance of U-type battery packs. Zhang et al. [14] designed an air-cooled T-type BTMS. Compared to others, T-type BTMS has better cooling performance and energy consumption.
The key to designing the structure of an air-cooled BTMS is to carefully consider the impact of the flow and distribution of cooling air on the cooling performance of the battery pack. As shown in Figure 1, the Z-type and U-type BTMS are in series. The T-type BTMS is a parallel type, and its cooling performance is significantly better than that of the Z-type and U-type BTMSs at the same inlet flow rate. However, the T-type BTMS also has similar defects as Z-type and U-type BTMS, especially the long airflow path makes it difficult for the cooling air to continue dissipating heat for the battery when flowing near the outlet due to its high temperature. Taking inspiration from this, we absorbs and improves the T-type structure, proposes a Y-type BTMS with a symmetrical flow field, retains the parallel structure, optimizes the layout of the inlet and outlet, shortens the airflow path and is expected to enable the BTMS to achieve better heat dissipation performance and better thermal uniformity. This paper proposes a Y-type air-cooled BTMS for a 1 × 8 arrangement in a square lithium-ion battery pack, providing a feasible cooling solution for electric/hybrid vehicles equipped with iron phosphate batteries in compact vehicle design spaces or requiring light weight.

2. Model and Methodology

2.1. Model Description

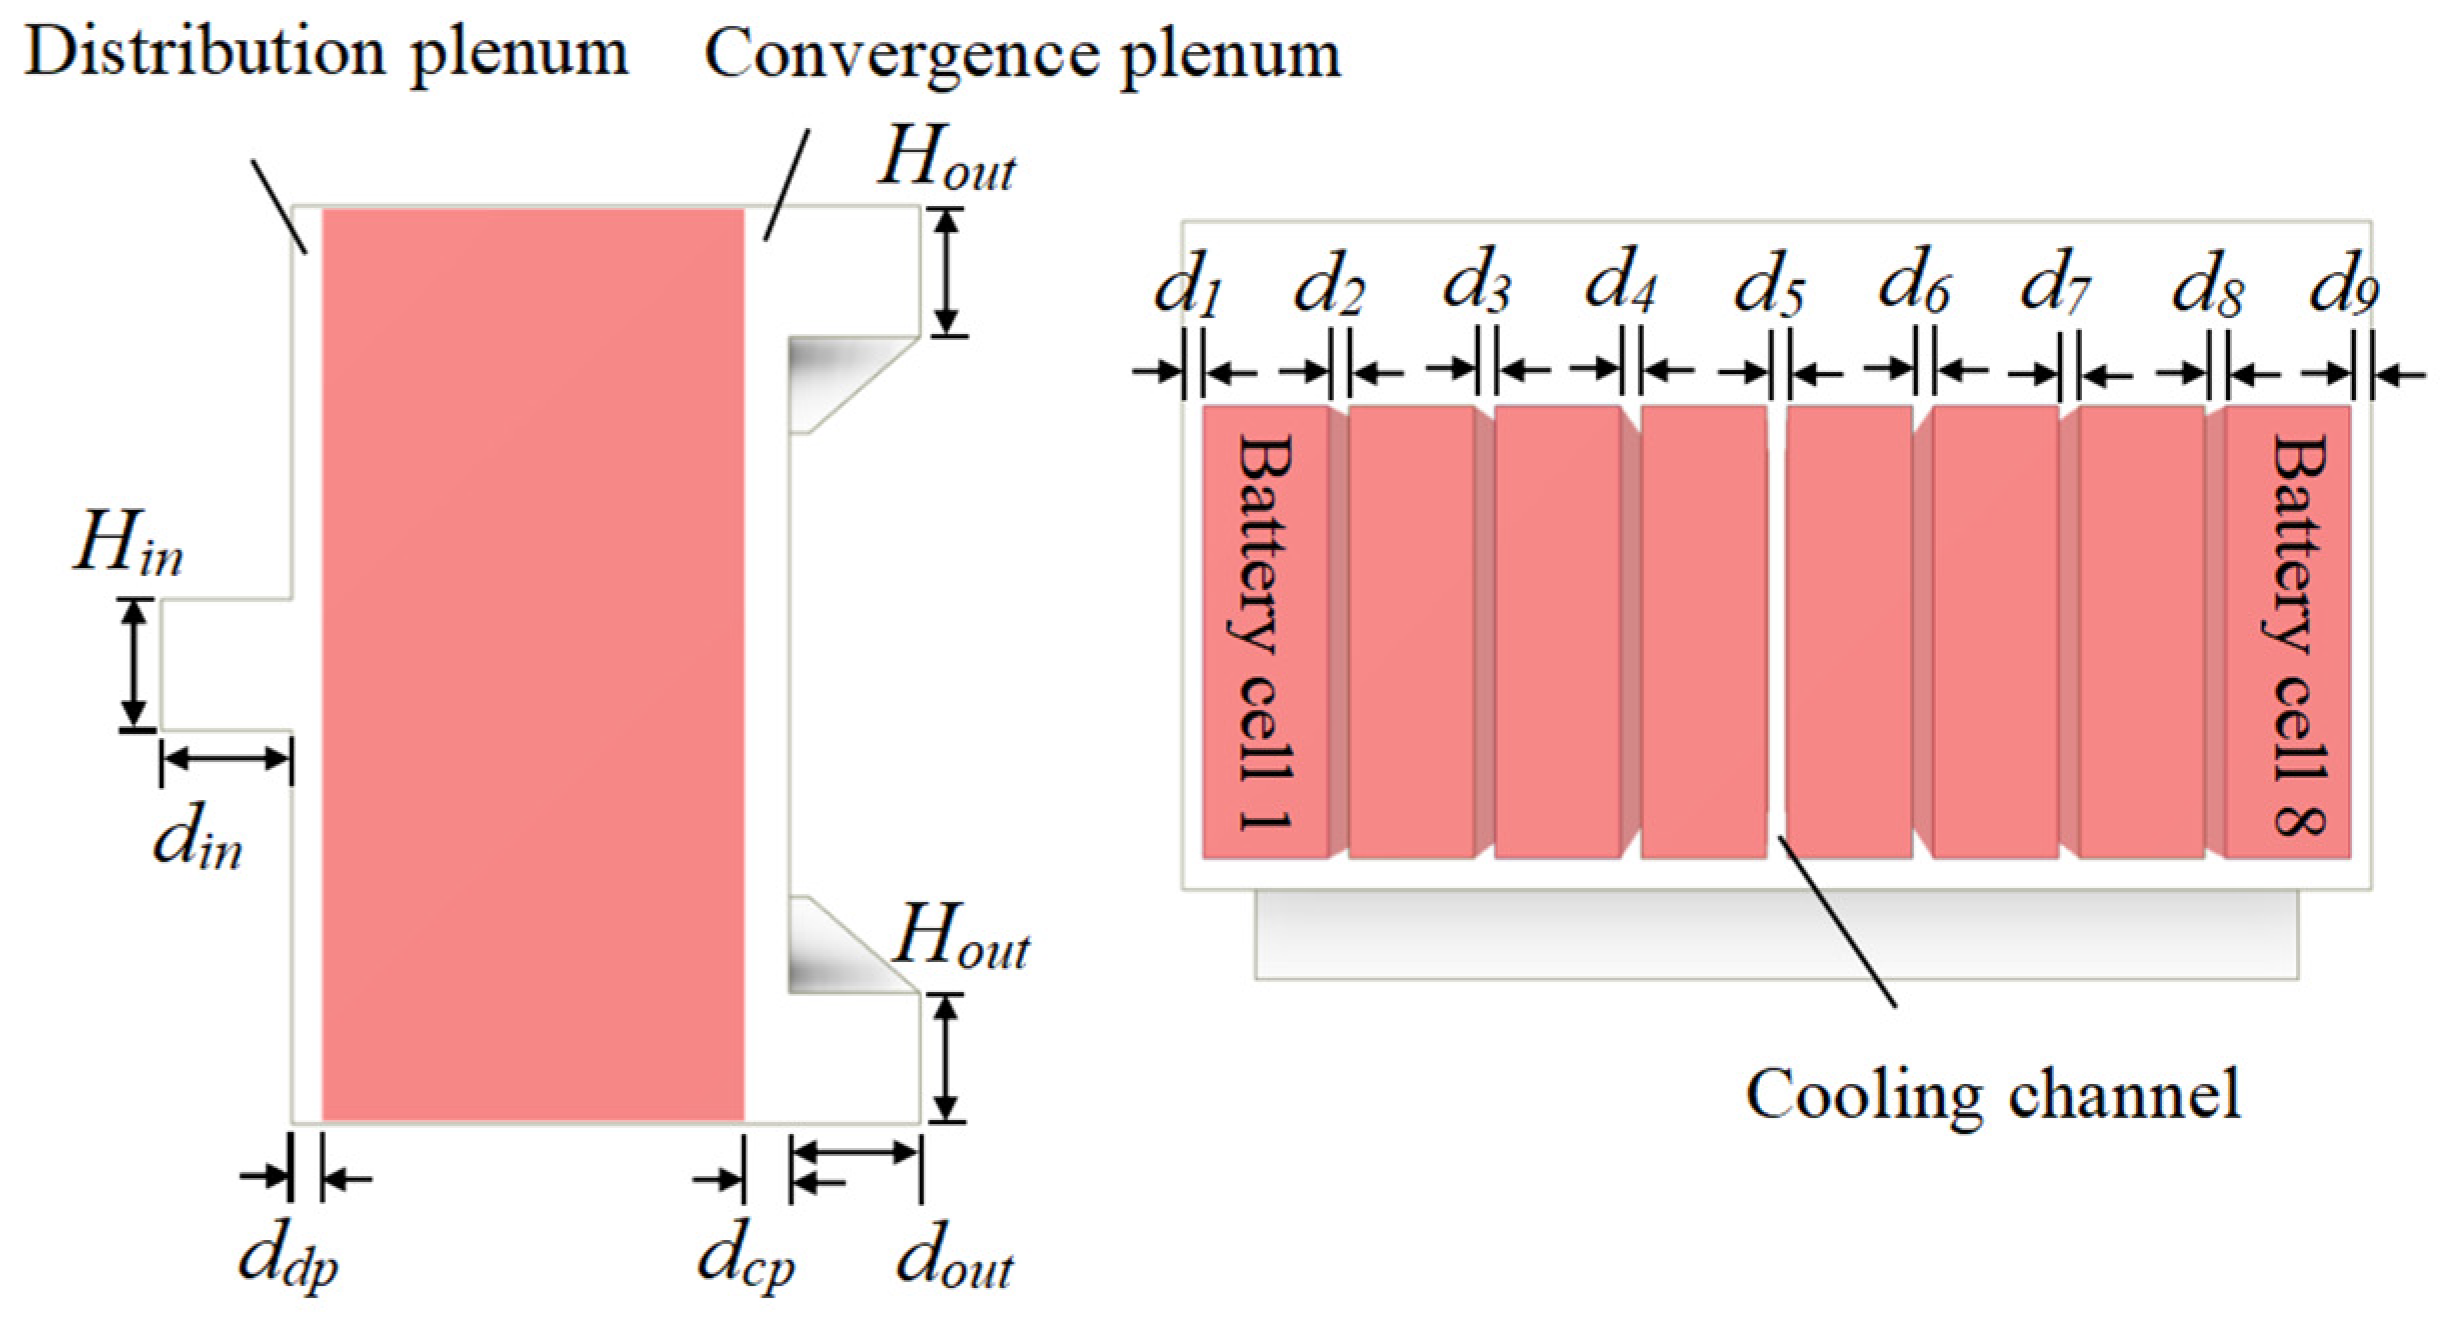
The Y-type air-cooled BTMS shown in Figure 2 consists of 8 prismatic cells arranged in series and 9 cooling channels. Considering the volume limitation of automotive BTMSs, the system includes an external battery box similar to a Y-type skeleton and 8 square lithium-ion batteries arranged parallel to the x-axis direction. The batteries are tightly connected to the wall on both sides along the length direction. The size of the battery cell is 65 × 18 × 140 mm (length × width × height). The inlet air rate is 5.2 × 10⁻³ m3/s, and the inlet is located in the middle of the side of the box. Two outlets are symmetrically arranged on opposite sides of the box. The cooling air spreads out in a distribution plenum and flows into 9 cooling channels for heat exchange with continuously discharging batteries. Finally, it converges through a convergence plenum and flows out from the outlet areas on both sides.
As is well known, due to the heat-dissipating effect of airflow, the temperature between the inlet and outlet of a BTMS varies greatly. The inlet air temperature is lower, while the outlet air temperature is higher, forming a large temperature gradient at both ends of the battery. In the Y-type BTMS, the airflow from the distribution plenum to the convergence plenum is shortened along the length direction of the battery, which reduces the time for the battery to heat the air and lowers the temperature of the battery near the outlet, resulting in better cooling performance of the system. For the Y-type BTMS, because there are two outlets, the cooling channel is divided into two symmetrical parts along the height direction of the battery during operation. Each part is allocated half of the cooling airflow, which may cause the temperature of the battery to increase near the inlet, thereby reducing the temperature gradient. It can be expected that the Y-type BTMS will achieve better uniformity.
This study used the air parameters shown in Table 1 and the battery cell parameters shown in Table 2 in the numerical calculations for the Y-type BTMS.

2.2. Numerical Model

2.2.1. Control Equation

CFD is a common computer numerical simulation method. The current mainstream CFD calculation methods are based on commercial software and can be simplified into three main processes: modeling, numerical computation and result output. Compared with experiments, they have the advantages of low cost and high reliability, making them an effective means to solve thermal engineering problems.
In this study, the Y-type lithium-ion battery pack was modeled using the CFD method to calculate the velocity and temperature fields of BTMS. In order to simplify the calculation process and take into account the complexity of air flow and battery heating in BTMS, several assumptions were made: (1) that the Mach number Ma of the cooling air is much smaller than 0.3 due to its compressibility; (2) that the buoyancy effect of the air is negligible; (3) that the battery case is insulated and has no relative slip with the air; (4) that, during the heating process, the influence of temperature on the physical properties of air and battery materials can be ignored; (5) that the ambient temperature will not change over time after being set; (6) that lithium ion batteries are uniform solids with constant, anisotropic thermal conductivity and constant specific heat capacity; and (7) that the thermal deformation of the heat dissipation system is negligible.
The flow process should follow the laws of mass, momentum, energy and turbulent transport equations [15].
The continuity equation is as follows:
u i x i = 0
where u i is the ith Reynolds average velocity component.
The momentum conservation equation is as follows:
ρ a u j u i x j = p a x i + x j [ ( μ + μ t ) u i x j ]
where ρ a and p a are the density and static pressure of air, while μ and μ t are the molecular dynamic viscosity coefficient and turbulent dynamic viscosity coefficient, respectively.
The energy conservation equation is as follows:
ρ a C a T a t + ρ a C a v T a = k a T a
where C a , k a , v and T a are the specific heat, thermal conduction coefficient, velocity and temperature of air, respectively.
Before determining the control equation, it was necessary to determine the flow state of the air in the battery pack. The system’s Reynolds number was calculated as 3409 by Formulas (4) and (5). In this study, the flow state of cooling air inside the system was turbulent.
Re = ρ a u D μ
D = 2 H i n L i n H i n + L i n
where Re is the Reynolds number; the value of inlet wind speed u is 1.52 m/s; D is the feature length and the inlet height H i n and length L i n are 20 mm and 171 mm, respectively.
Based on the standard k ε turbulence model, the air flow rate was calculated using the NS equations. In the k ε model, k represents turbulent kinetic energy and ε represents turbulent dissipation rate. The equations are shown below.
The turbulent kinetic energy equation is as follows:
t ρ a k + x j ρ a k u j = x j μ + μ t α k k x j + G k + G b ρ a ε Y M + S k
The turbulent kinetic energy dissipation equation is as follows:
t ρ a ε + x j ρ a ε u j = x j μ + μ t α ε ε x j + C 1 ε ε k G k + C 3 ε G b ρ C 2 ε ε 2 k + S ε
where u j is the jth component of the velocity vector; G k is the turbulent kinetic energy generated by the smooth velocity gradient; G b is the turbulent energy generated by the buoyancy factor; Y M is the influence factor of turbulent pulsation on the total dissipation rate; G 1 ε , G 2 ε and G 3 ε are empirical constants; α k and α ε are Prandtl numbers corresponding to the turbulent kinetic energy and turbulent kinetic energy dissipation rate and S k and S ε are the source terms of k and ε , respectively.
In addition, the heat generated within the battery area of the battery pack includes internal waste heat and heat carried away by air, and its energy conservation equation can be expressed as follows [16]:
ρ b C p b T t = k b T + Q
where ρ b , C p b , k b and Q are the density, specific heat capacity, thermal conductivity and heat generation of the battery, respectively.

2.2.2. Mesh Generation and Evaluation

For the proposed Y-type BTMS, the geometry model of the battery pack module was constructed using Design Modeler software (Ansys DesignModeler 2022 R1) and imported into Fluent Meshing without adding local dimensions, and then mesh partitioning and repair were performed. In mesh partitioning mode, the Fluent function can handle meshes of almost infinite size and complexity.
The volume meshes can be generated from boundary meshes to ensure a good starting point for generating volume meshes. Various properties of the computational surface mesh should be specified and adjusted until the surface mesh accurately captures the topology of the imported CAD geometry. There should be no gaps or fragments, and the surface mesh of key areas should be refined to ensure that important physical behaviors in CFD analysis can be captured. For the elements of the surface grid, a minimum size of 0.0001 m and a maximum size of 0.003 m were specified. The edge length of each subsequent element layer was increased by 1.2. The type of size function applied to surface meshes was selected based on curvature and proximity. Given a specific geometric curvature, the maximum allowable angle for an element edge to cross was specified as 18. The minimum number of layers generated in the gap was 1. We set the refinement based on proximity of edges, while considering the proximity from edge to edge. The types of imported geometry consist of solid models and fluid models. The types of inlet and outlet boundaries were specified as walls.
Five boundary layers were added to the solid area along the walls of the model. The type of offset was selected as smooth transition, which determines how to generate the mesh elements closest to the boundary. For the smooth transition migration method, adjacent elements grow at a rate of 0.272, while for the boundary layer, the growth rate is 1.2.
For the entire volume within the geometry, the meshes were composed of polyhedral elements. In addition to the fluid region, the solid region was also meshed. Element size control, such as growth rate and maximum cell length, was evaluated globally. The number of additional layers required for rapid transition between finer elements in the boundary grid and coarser elements in the initial Cartesian grid is 2. The number of layers controlling the gap between the hexahedral core and the geometric shape is 1. For the volume-filling type of polyhedral core, the minimum unit length is 0.0001 and the maximum unit length is 0.0032. In order to perform volume mesh partitioning faster and more effectively, parallel settings are used to generate computational meshes.
After calculating the grid generation, orthogonal quality was used to evaluate the grid. In general, the minimum orthogonal quality of the mesh is required to be greater than 0.2. If the mesh quality is higher than 0.2 but relatively low, a highly skewed mesh can be improved by moving the nodes of the elements. The node movement process used to improve grid quality is automated, and the user can specify quality improvements based on specified quality measures. In this study, the mesh quality requirement needed to be higher than 0.3. Figure 3 shows a 3D mesh model of the battery pack casing, where the cutting plane is inserted along the plane normal to the X-axis, in which case the minimum orthogonal mass occurred in the air, i.e., the fluid region, with a value of 0.52575382, while the unit portion, i.e., the solid region, had a larger orthogonal mass.

2.3. Calculation Process

2.3.1. Boundary Conditions

Using the software FLUENT (Fluent 2022 R1) to solve the above control equations, in order to achieve accurate solutions, the following boundary conditions were set for the BTMS. Unless otherwise specified, the initial temperature of all zones was 25 °C, and the air pressure was standard atmospheric pressure. The air inlet was the velocity inlet, and the air outlet was the standard atmospheric pressure outlet. The battery box wall was an insulated anti-slip wall, and an enhanced wall function was used when near-wall treatment was required. The pressure–velocity coupling scheme used the SIMPLE algorithm, and the mass flux type used distance-based Rhie—Chow. The gradient calculation method for controlling the spatial discretization of the convection term in the solution equation was set based on the least squares element. The discretization scheme of the pressure equation was second-order, while the discretization of the momentum and energy equations was second-order upwind. The solution of energy was considered to converge with a residual value set to 1 × 10 7 .

2.3.2. CFD Model Validation

The numerical simulation model and CFD method for battery packs were to be used for subsequent optimization research, and their reliability is crucial for the optimization analysis of BTMS.
Zhang et al. [14] conducted experimental research on the T-type air-cooled BTMS model and performed simulation and experimental analysis; more details can be found in reference [14]. This paper simulated the forced air cooling of T-type BTMS battery pack based on the above methods and compares the simulation results with those in reference [14]. The temperature simulated here corresponded to the same time (end of discharge) and operating conditions (discharge rate, air flow rate, air inlet temperature, etc.) as the literature. As shown in Figure 4, the maximum temperature of each single cell in the battery pack ( T c ) at the end of discharge at 2.5 C using this method was compared with the highest temperature in reference [14], and its relative error was calculated. When the inlet velocity was 3 m/s, the maximum temperature difference between cell 4 in this method and cell 4 in reference [14] was only 0.186 °C, with a corresponding maximum relative error of 0.96%. This indicates that the proposed method is effective and feasible.

3. Results and Discussion

3.1. Distribution Plenum and Convergence Plenum

3.1.1. Distribution Plenum and Convergence Plenum with Same Depth

For the convenience of quantitative evaluation, the thermal characteristics of the BTMS were evaluated by using the maximum temperature ( T max ) of the battery pack and the maximum temperature difference ( Δ T max ) between each individual cell in the battery pack. It can be clearly seen from the Y-type BTMS structure in Figure 5 that the sizes of the distribution plenum and convergence plenum had an impact on the air flow velocity, thereby affecting the thermal characteristics of the system.
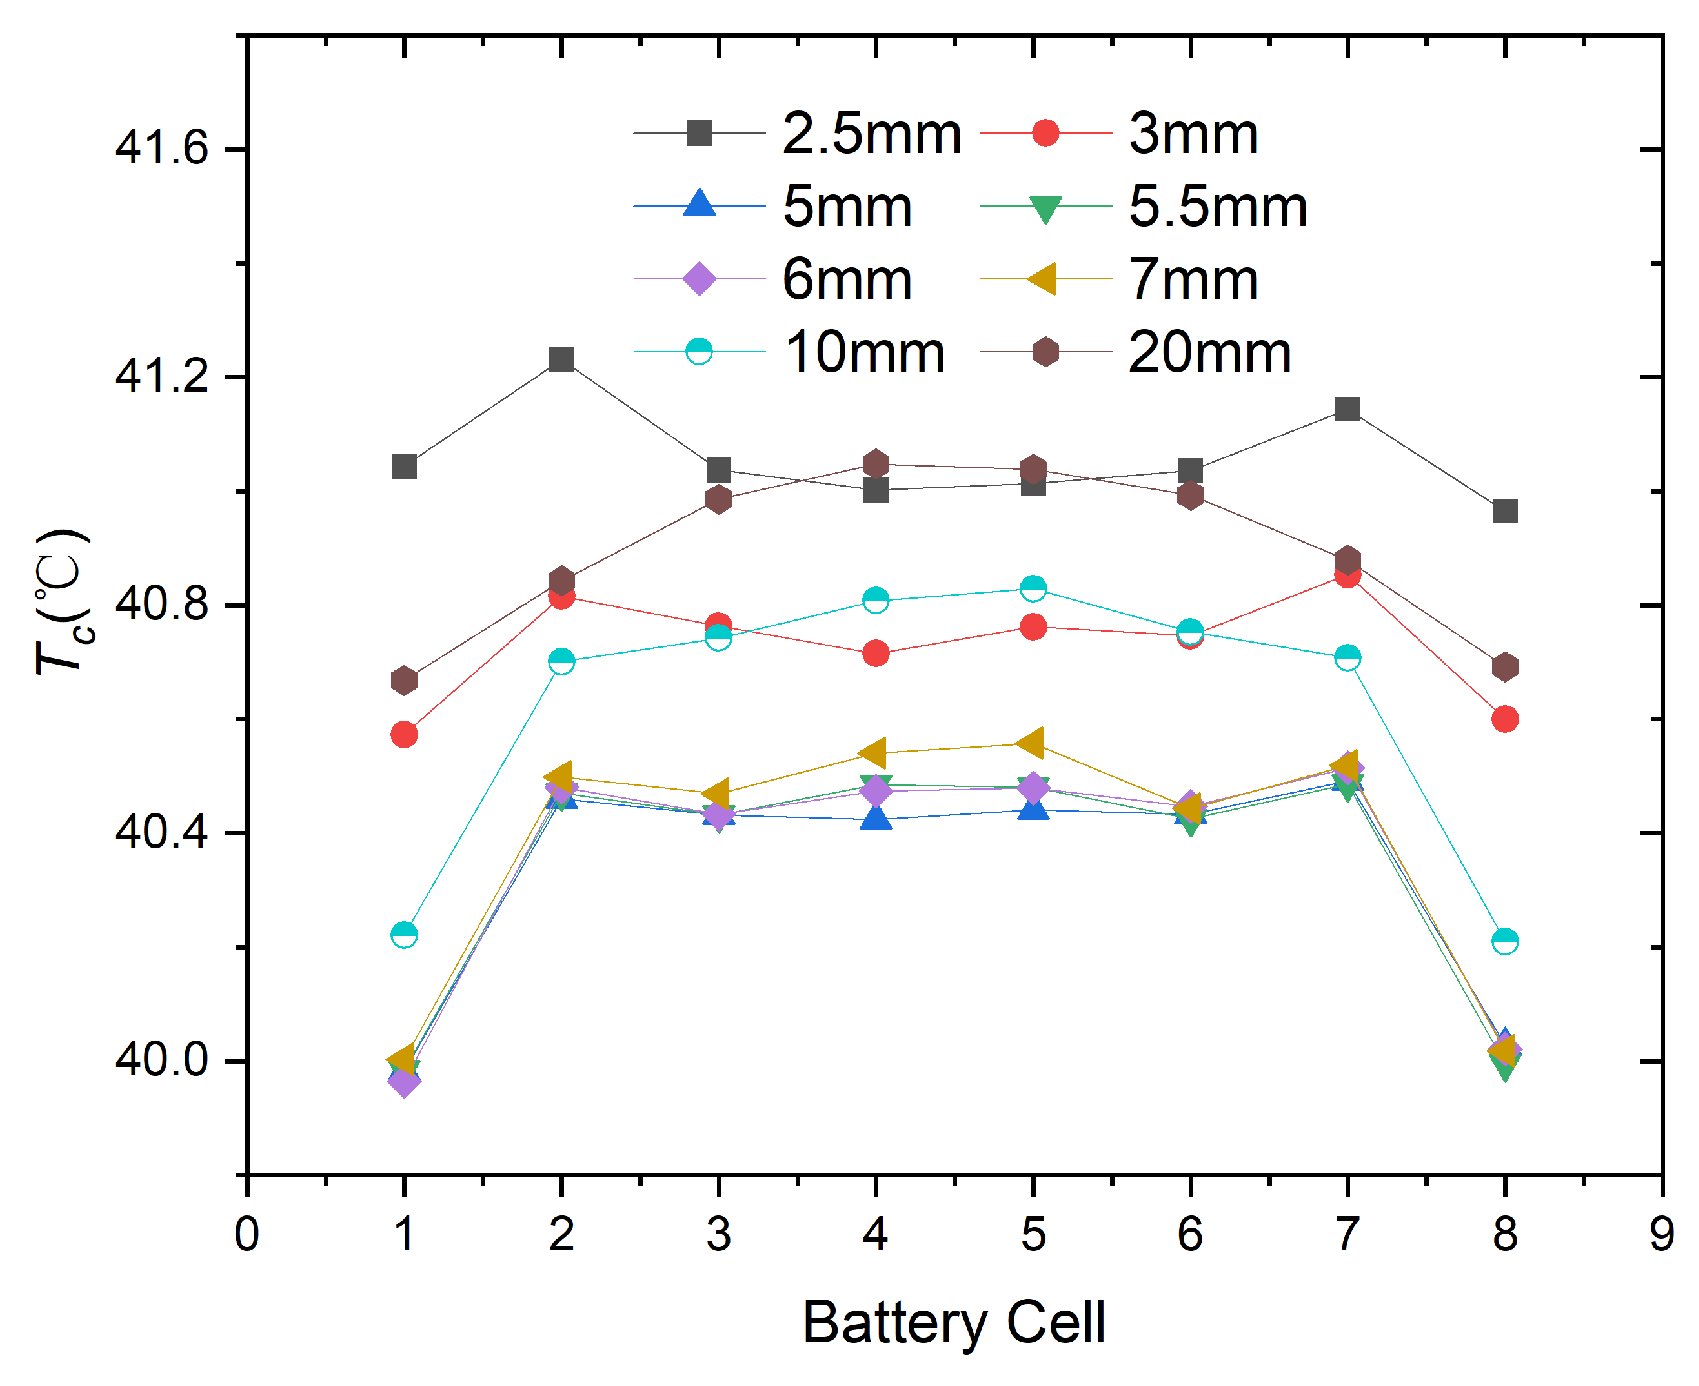
As shown in Figure 5, considering that the dimensions of d d p and d c p were equal, their values ranged from 2.5 mm to 20 mm. The inlet width d i n , outlet width d o u t , inlet height H i n and outlet height H o u t were all 20 mm, and the widths ( d 1 d 9 ) of all cooling channels were set to 3 mm. The battery was set to discharge at 2.5 C, with an air flow velocity of 1.52 m/s, corresponding to a total flow rate of 5.2 × 10 3 m 3 · s 1 , which is consistent with reference [14]. Figure 6 shows the effect of d d p and d c p on T c , and the heat dissipation performance of BTMS was similar when the d d p values were 5 mm, 5.5 mm and 6 mm. The performance was optimal when d d p is 5.5 mm, with T max of 40.486 °C and Δ T max of 0.501 °C. Compared with the optimal T max after adding turbulence plates in reference [5], T max was decreased by 0.876 °C (2.1%).
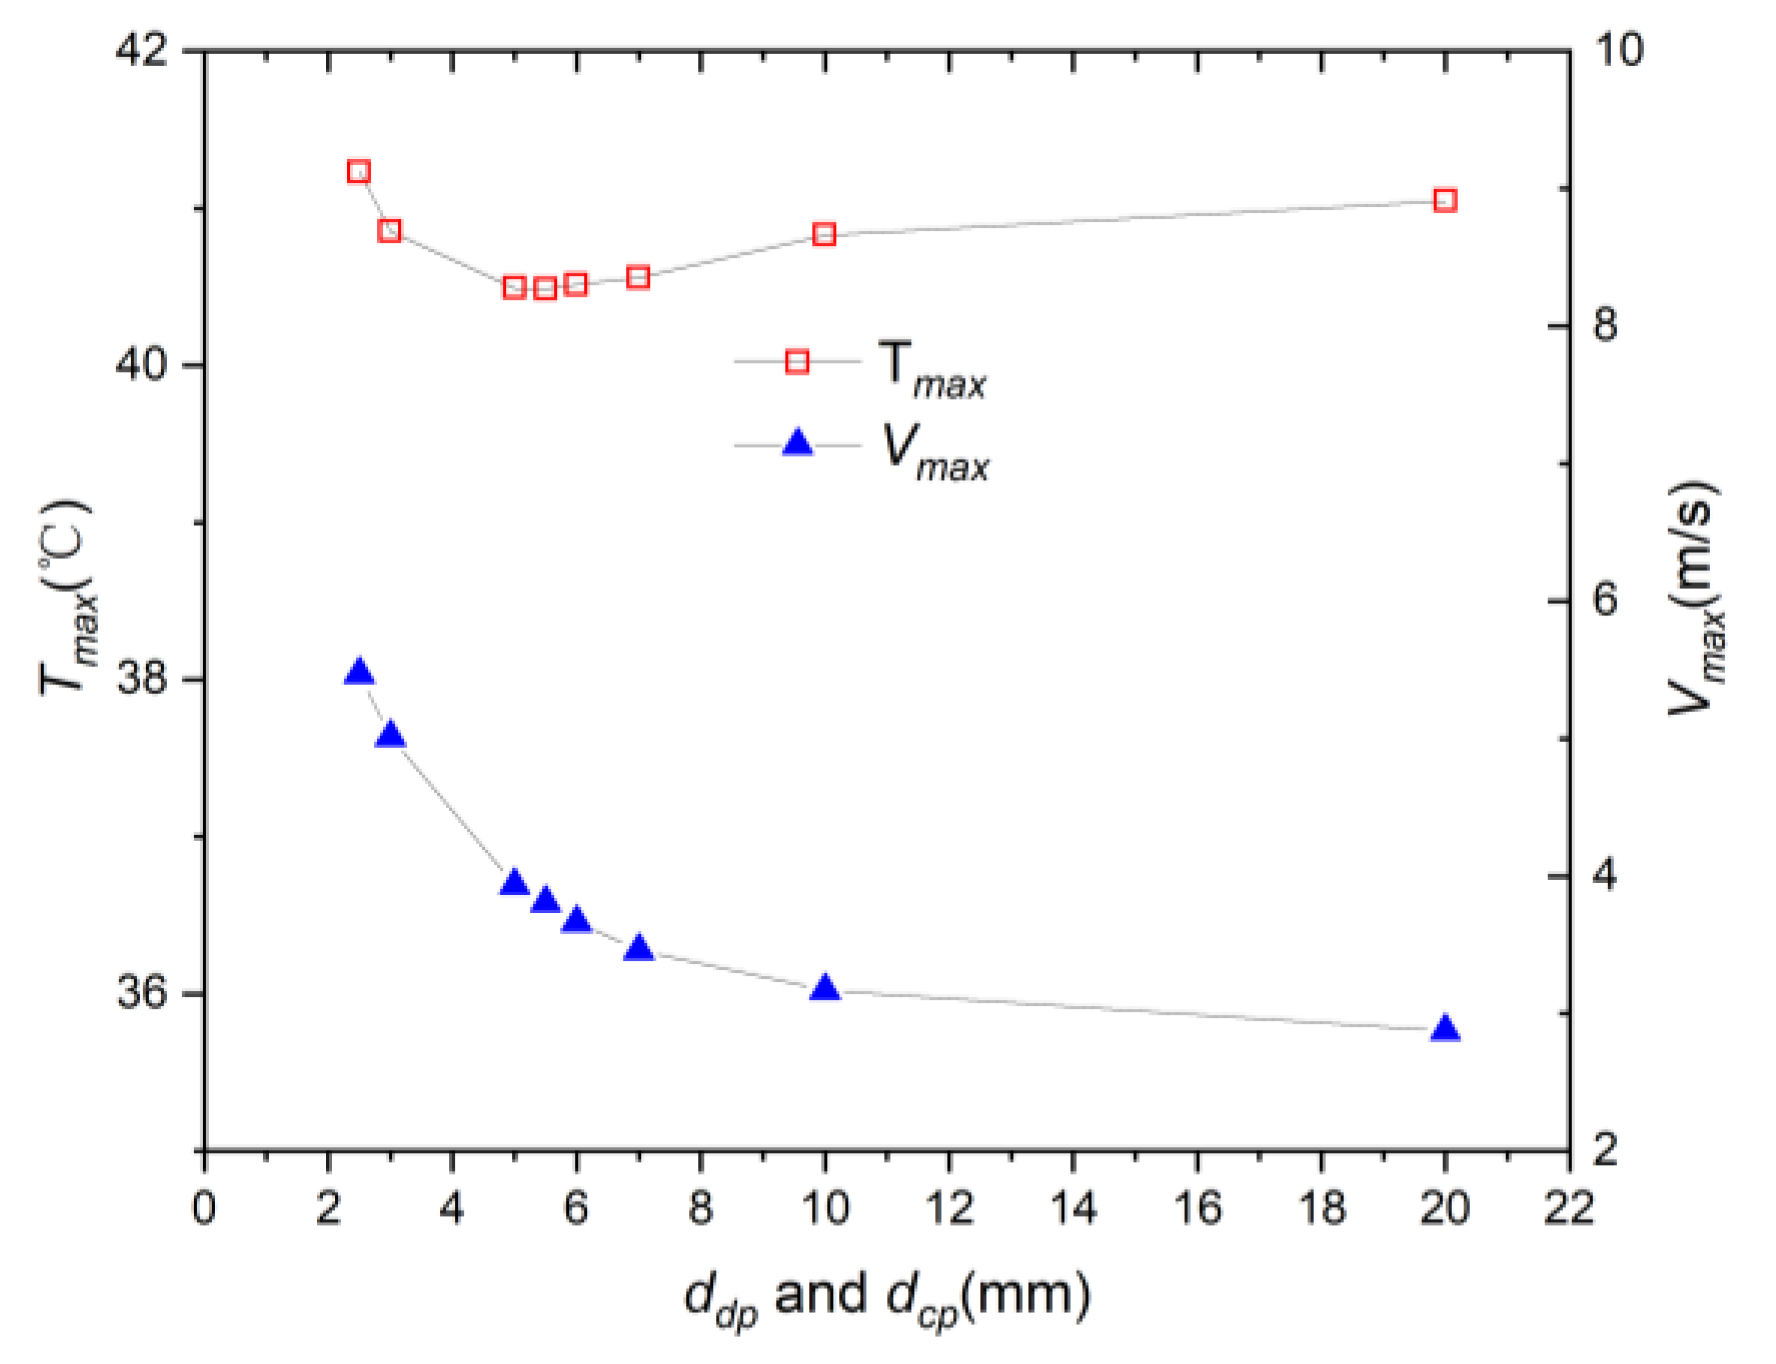
Heat dissipation performance is closely related to air flow velocity. T max and the maximum flow velocity ( V max ) at the X-axis centerline position are shown in Figure 7. As d d p increased from 2.5 mm to 20 mm, V max gradually decreased from 5.467 m/s to 2.875 m/s. Generally speaking, the smaller the flow velocity, the worse the heat dissipation performance, while the larger the flow velocity, the better the heat dissipation performance. As d d p increased from 5.5 mm to 20 mm, T max gradually increased from 40.486 °C to 41.048 °C, which conforms to the general rule of the relationship between flow velocity and heat dissipation performance. However, when d d p increased from 2.5 mm to 5.5 mm, T max gradually decreased from 41.231 °C to 40.486 °C, which does not conform to the general rule of the relationship between flow velocity and heat dissipation performance.
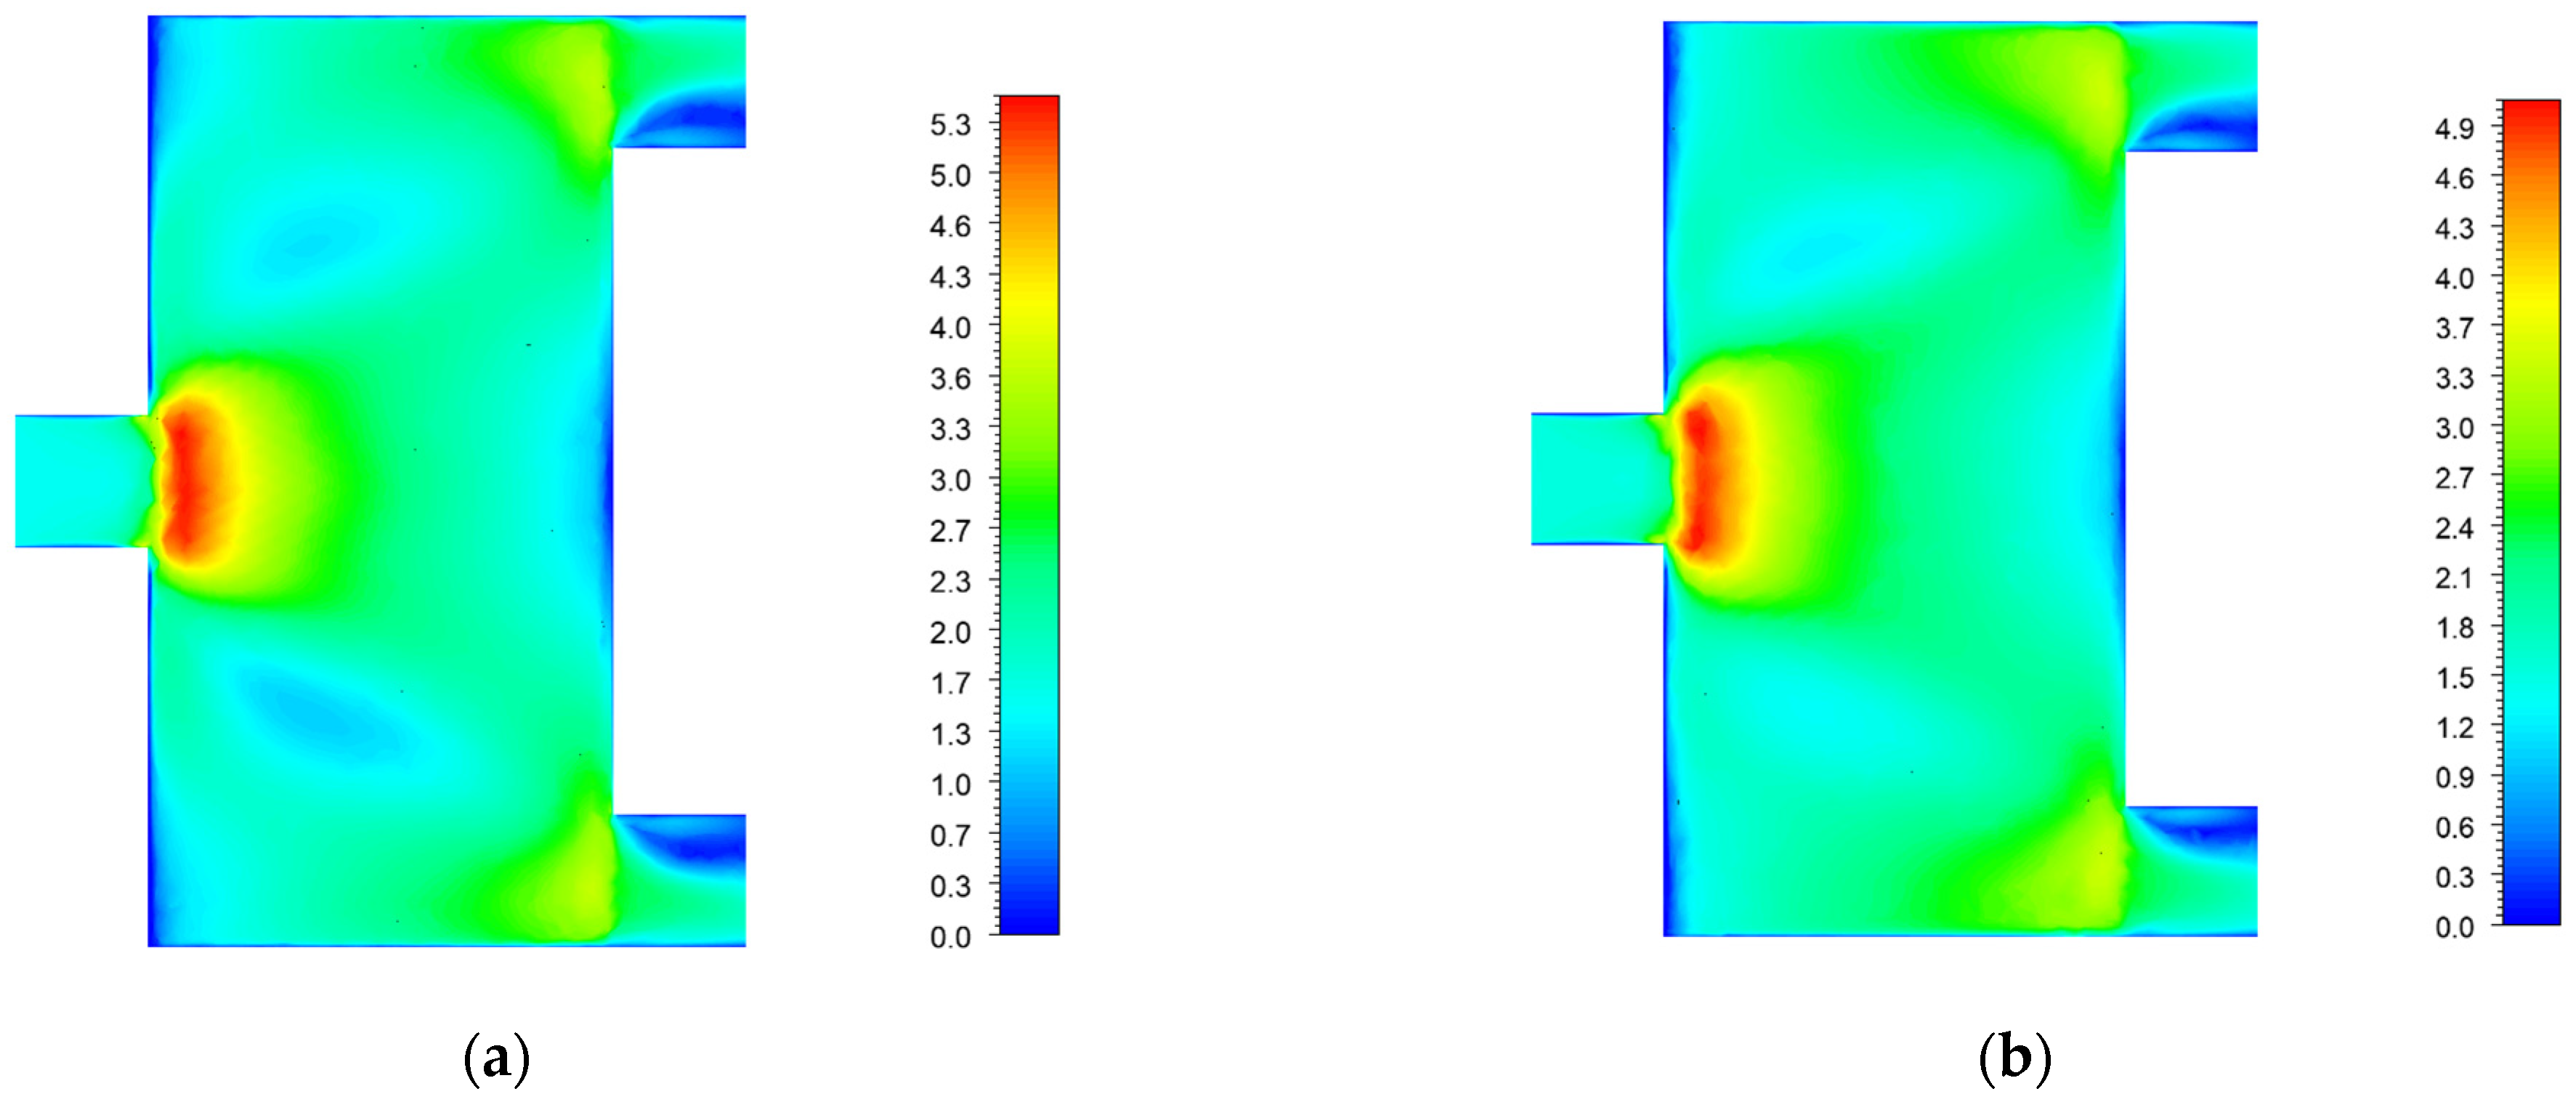
Figure 8 shows the velocity cloud map located at the X-axis cross-section (in channel 5). When d d p was 2.5 mm and 3 mm, eddy currents were observed in Figure 8a,b, which may make it difficult for air to enter the top of distribution plenum and affect the stability of fluid flow. That is to say, when d d p is small, the heat dissipation performance of the system is affected not only by the flow velocity but also by eddy currents. This can explain why, when d d p increased from 2.5 mm to 5.5 mm, the flow velocity decreased while the heat dissipation performance of the system still improved. When drawing a fluid velocity cloud map and calculating V max , the cross-section taken was the projection plane of the battery unit in the YZ plane, where the Y-axis and Z-axis dimensions of the fluid region were equal to the Y-axis and Z-axis dimensions of the battery cells, respectively. This could provide more accurate results.

3.1.2. Distribution Plenum and Convergence Plenum with Different Depths

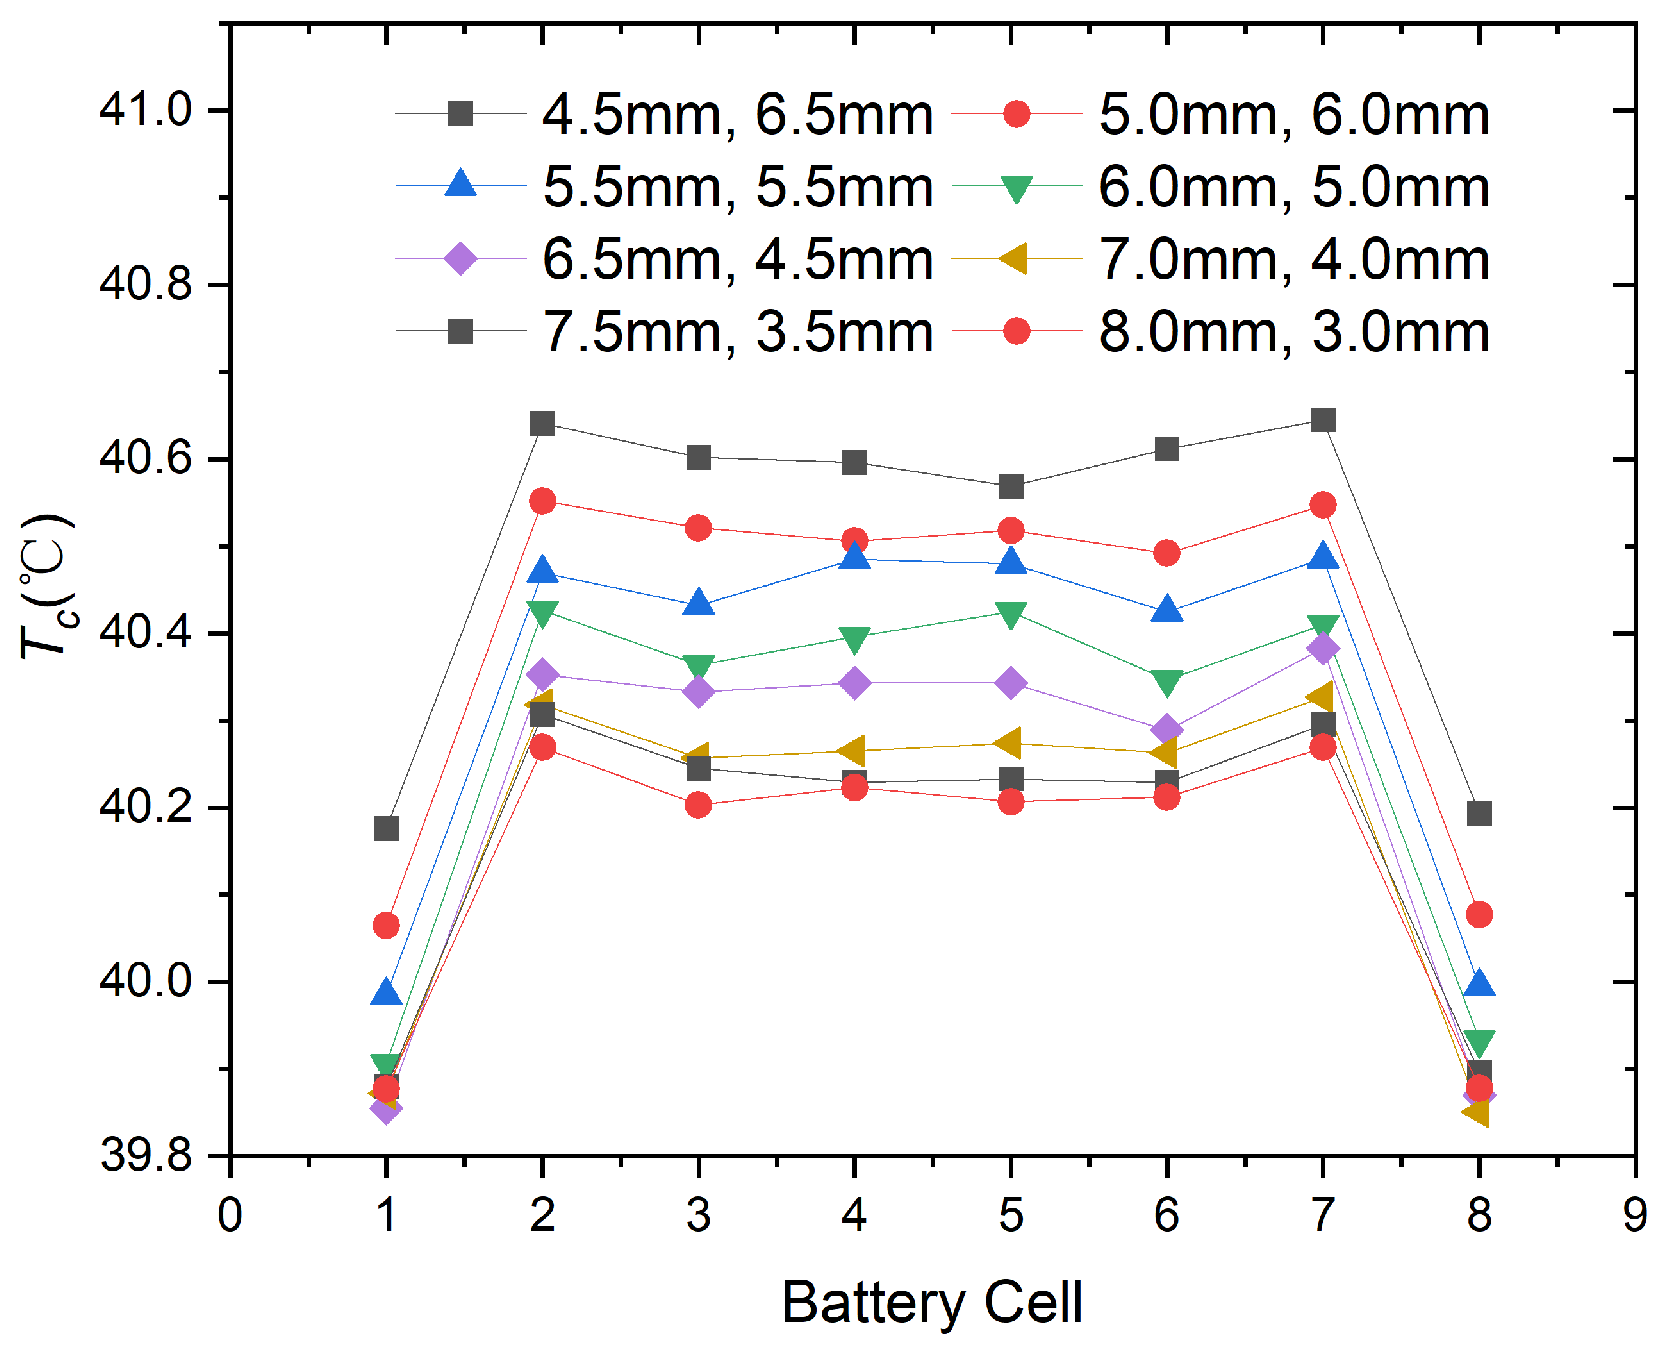
As shown in Figure 6, when both d d p and d c p were 5.5 mm, the system had the best heat dissipation performance. Next, in order to analyze the heat dissipation performance of Y-type BTMS when d d p and d c p are not equal, the sum of d d p and d c p was set to 11 mm, while the other dimensions and conditions remained unchanged. As shown in Figure 9, d d p increased from 4.5 mm to 8 mm, and the corresponding d c p decreased from 6.5 mm to 3.0 mm. As d d p increased, the heat dissipation performance of the system improved, with little change in the heat dissipation performance when d d p was 7.0 mm, 7.5 mm and 8.0 mm. When d d p and d c p were 8.0 mm and 3.0 mm respectively, the system had the best heat dissipation performance, with T max of 40.269 °C and Δ T max of 0.392 °C.
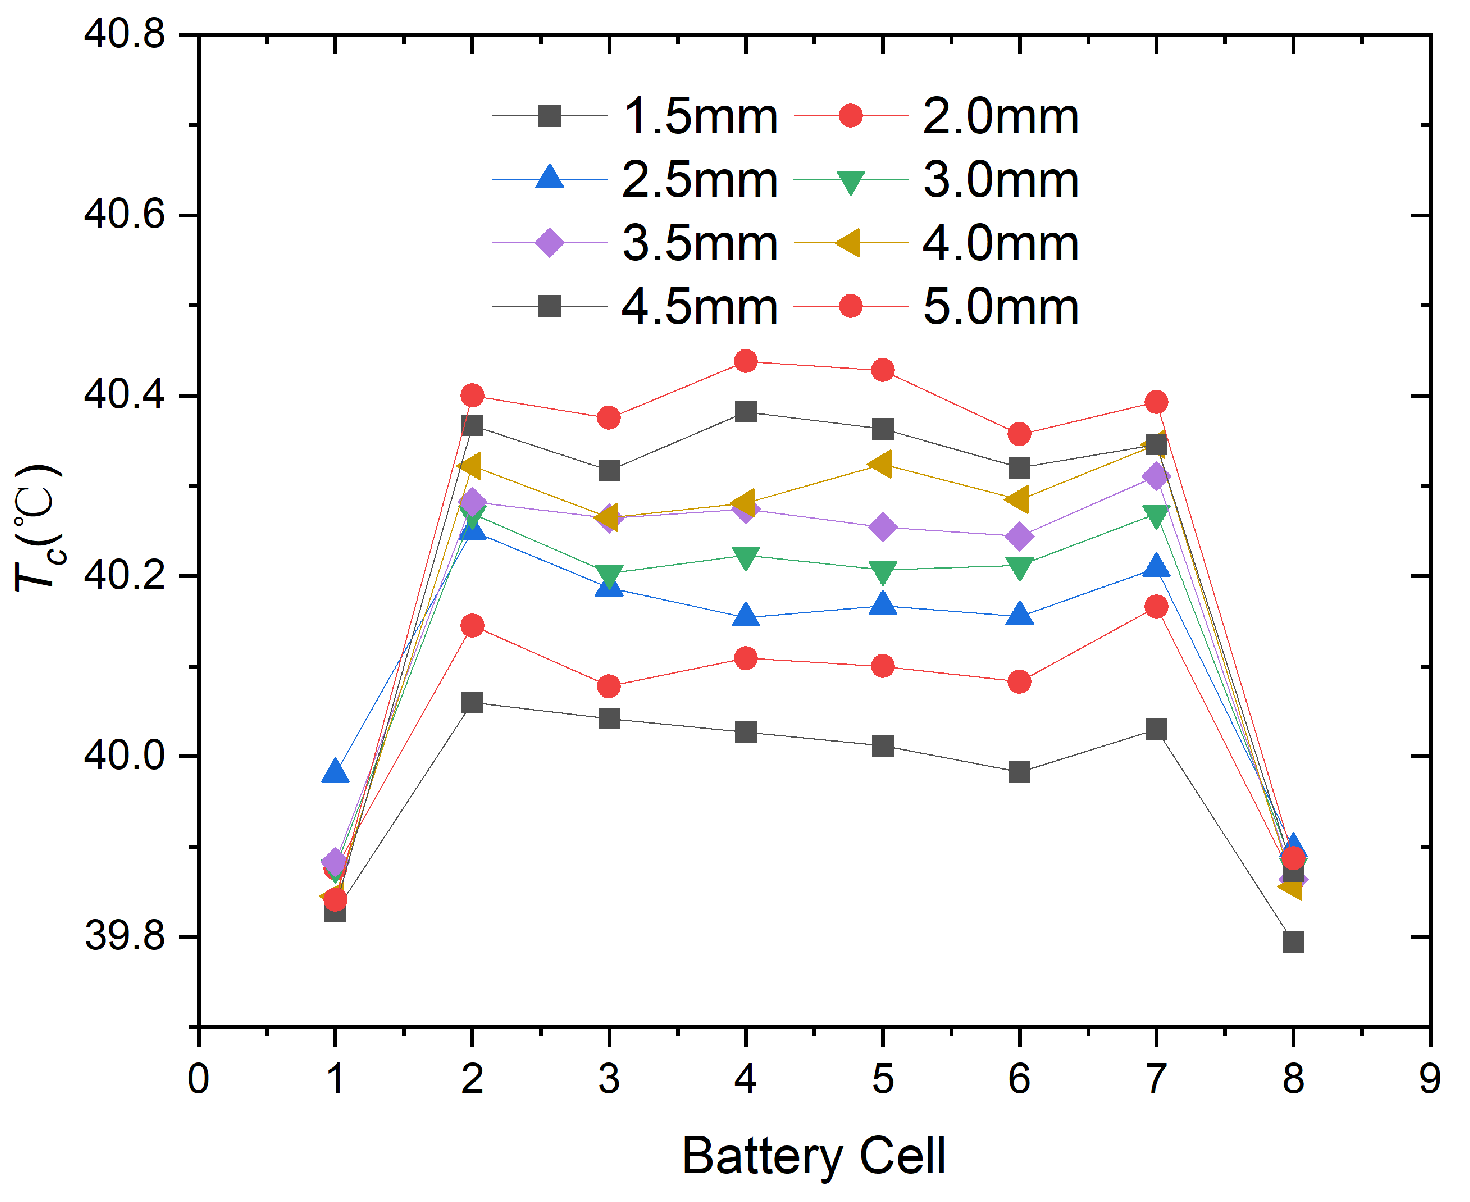
As shown in Figure 10, we analyzed the effect of d c p on the system’s heat dissipation performance when d d p was kept at 8.0 mm. It was found that the system’s heat dissipation performance improved with the decrease in d c p . Considering the deployment of batteries, the minimum value of d c p was set to 1.5 mm. When d c p was 1.5 mm, T max was 40.06 °C and Δ T max was 0.266 °C.
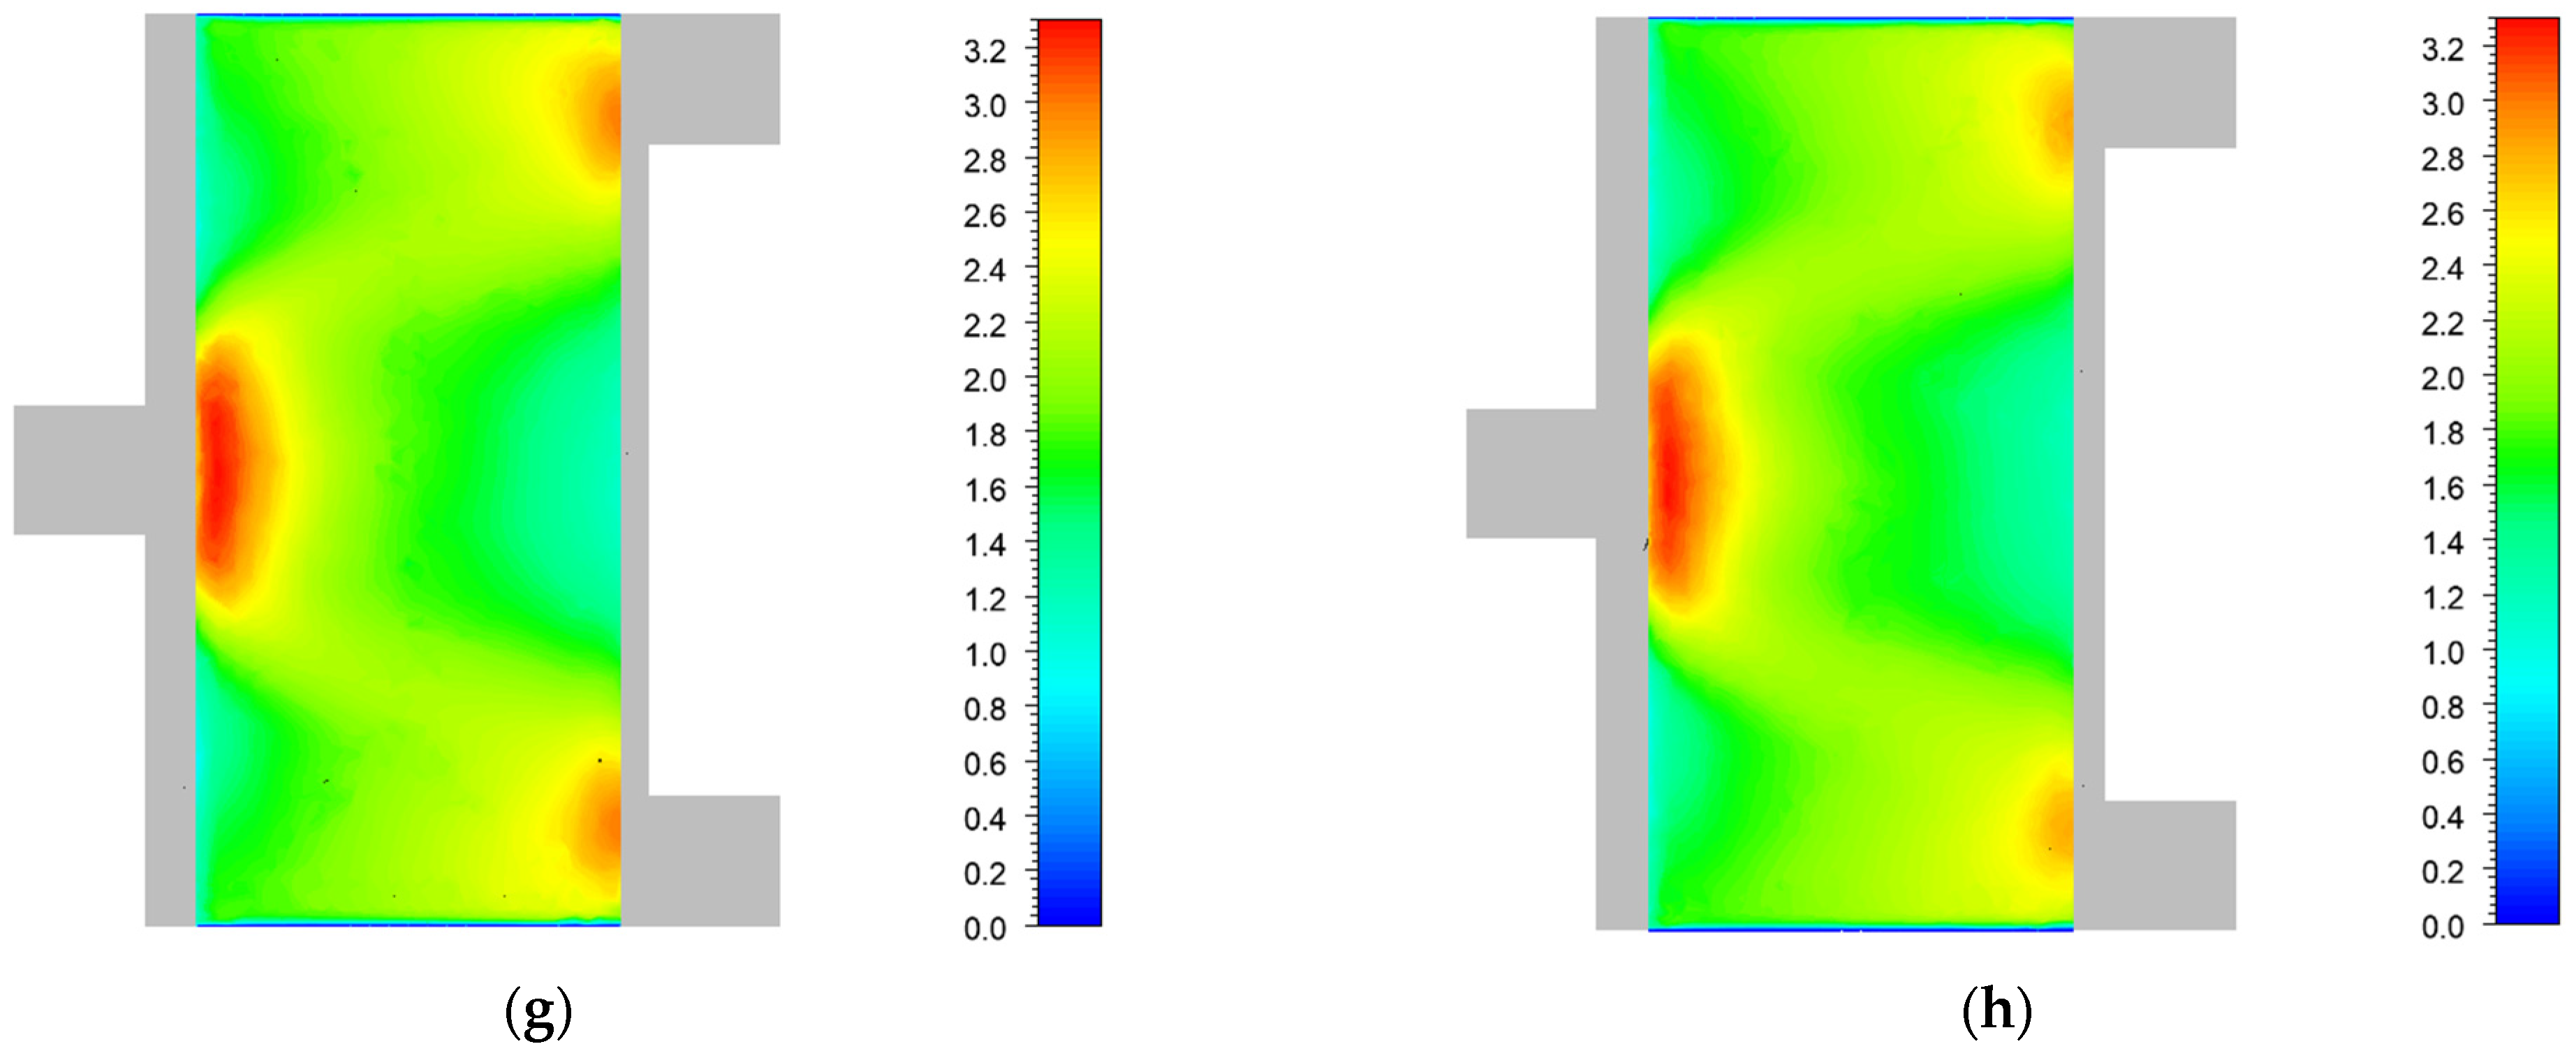
Figure 11 shows the air flow velocity in the X-axis cross-section (in channel 5), where d d p is 8.0 mm. The dimensions of the cross-section on the Y-axis and Z-axis are the same as the projected dimensions of the battery cells on the Y-axis and Z-axis, allowing a better observation of the effect of flow velocity on heat dissipation performance. It can be clearly seen from Figure 11 that as d c p decreases, V max increases.
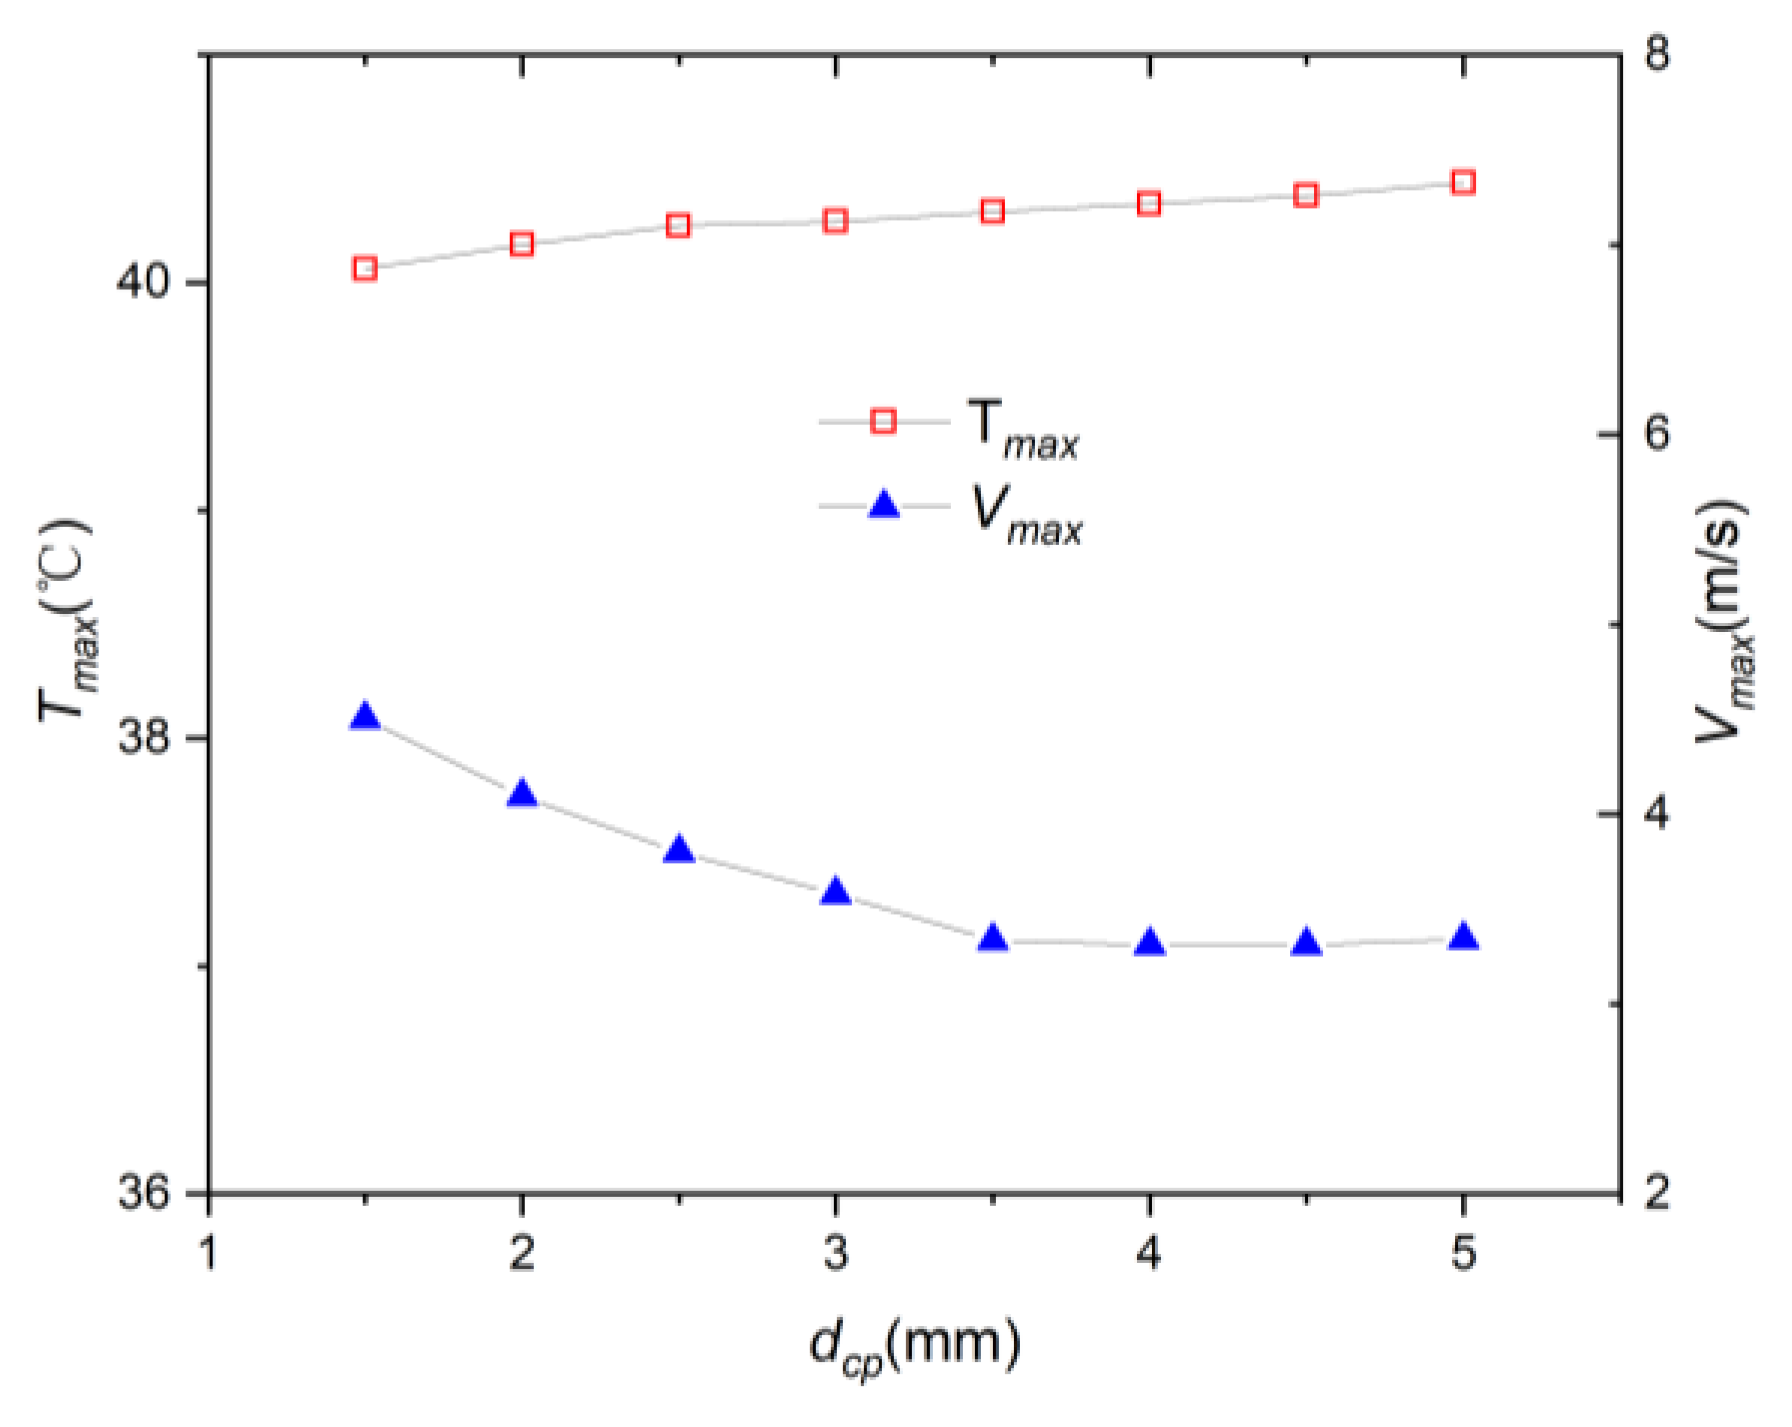
As mentioned earlier, increasing air flow can better remove heat and improve system heat dissipation performance. From Figure 12, it can be seen that when d d p was 8.0 mm, the effect of d c p on T max and V max was significant. When d c p decreased from 5.0 mm to 3.5 mm, V max remained basically unchanged at approximately 3.300 m/s. When d c p decrease from 3.5 mm to 1.5 mm, V max rapidly increase from 3.336 m/s to 4.502 m/s, and correspondingly, T max decreased from 40.311 °C to 40.06 °C.

3.2. Influence of Cooling Channel Width on Temperature Uniformity

From the temperature distribution of the eight batteries in the BTMS shown in Figure 10, it can be seen that the minimum value of T c occurred on both sides of the battery pack, indicating that batteries 1 and 8 had the best heat dissipation effect. This is easy to understand because the air in cooling channels 1 and 9 only needed to take away the heat of one adjacent battery, while the air in other cooling channels needed to take away the heat of two adjacent batteries, as shown in Figure 5. Based on this, we can improve temperature uniformity by adjusting the width of cooling channels 1 and 9, thereby reducing the flow rate of these two channels.
On the basis of the sample size in Figure 12, keeping d d p and d c p unchanged at 8.0 mm and 1.5 mm, respectively, we reduced d 1 and d 9 and made them equal, while keeping the width of the other cooling channels unchanged at 3 mm. The influence of d 1 and d 9 on the temperature of the battery pack is shown in Figure 13; the air flow velocity here was still 1.52 m/s. Due to the change in d 1 , the total flow rate was no longer 5.2 × 10 3   m 3 · s 1 . It can be seen that as d 1 decreased from 3.0 mm to 2.2 mm, the T c value of the middle six battery cells gradually decreased, while the T c value of the remaining batteries, numbers 1 and 8, did not change a great deal. As a result, the heat dissipation performance and temperature uniformity of the BTMS were improved. As d 1 continued to decrease from 2.2 mm, the T c value of the middle six battery cells still gradually decreases, but the T c value of battery cells 1 and 8 gradually increased and exceeded that of the middle six battery cells, resulting in a decrease in the temperature uniformity of the system. When d 1 was 2.2 mm, T max was 39.84 °C and Δ T max is 0.066 °C, the system had the best heat dissipation performance and temperature uniformity. T max and Δ T max of the best sample were 1.537 °C (3.68%) and 0.059 °C (47.2%) lower than those of the T-type model.
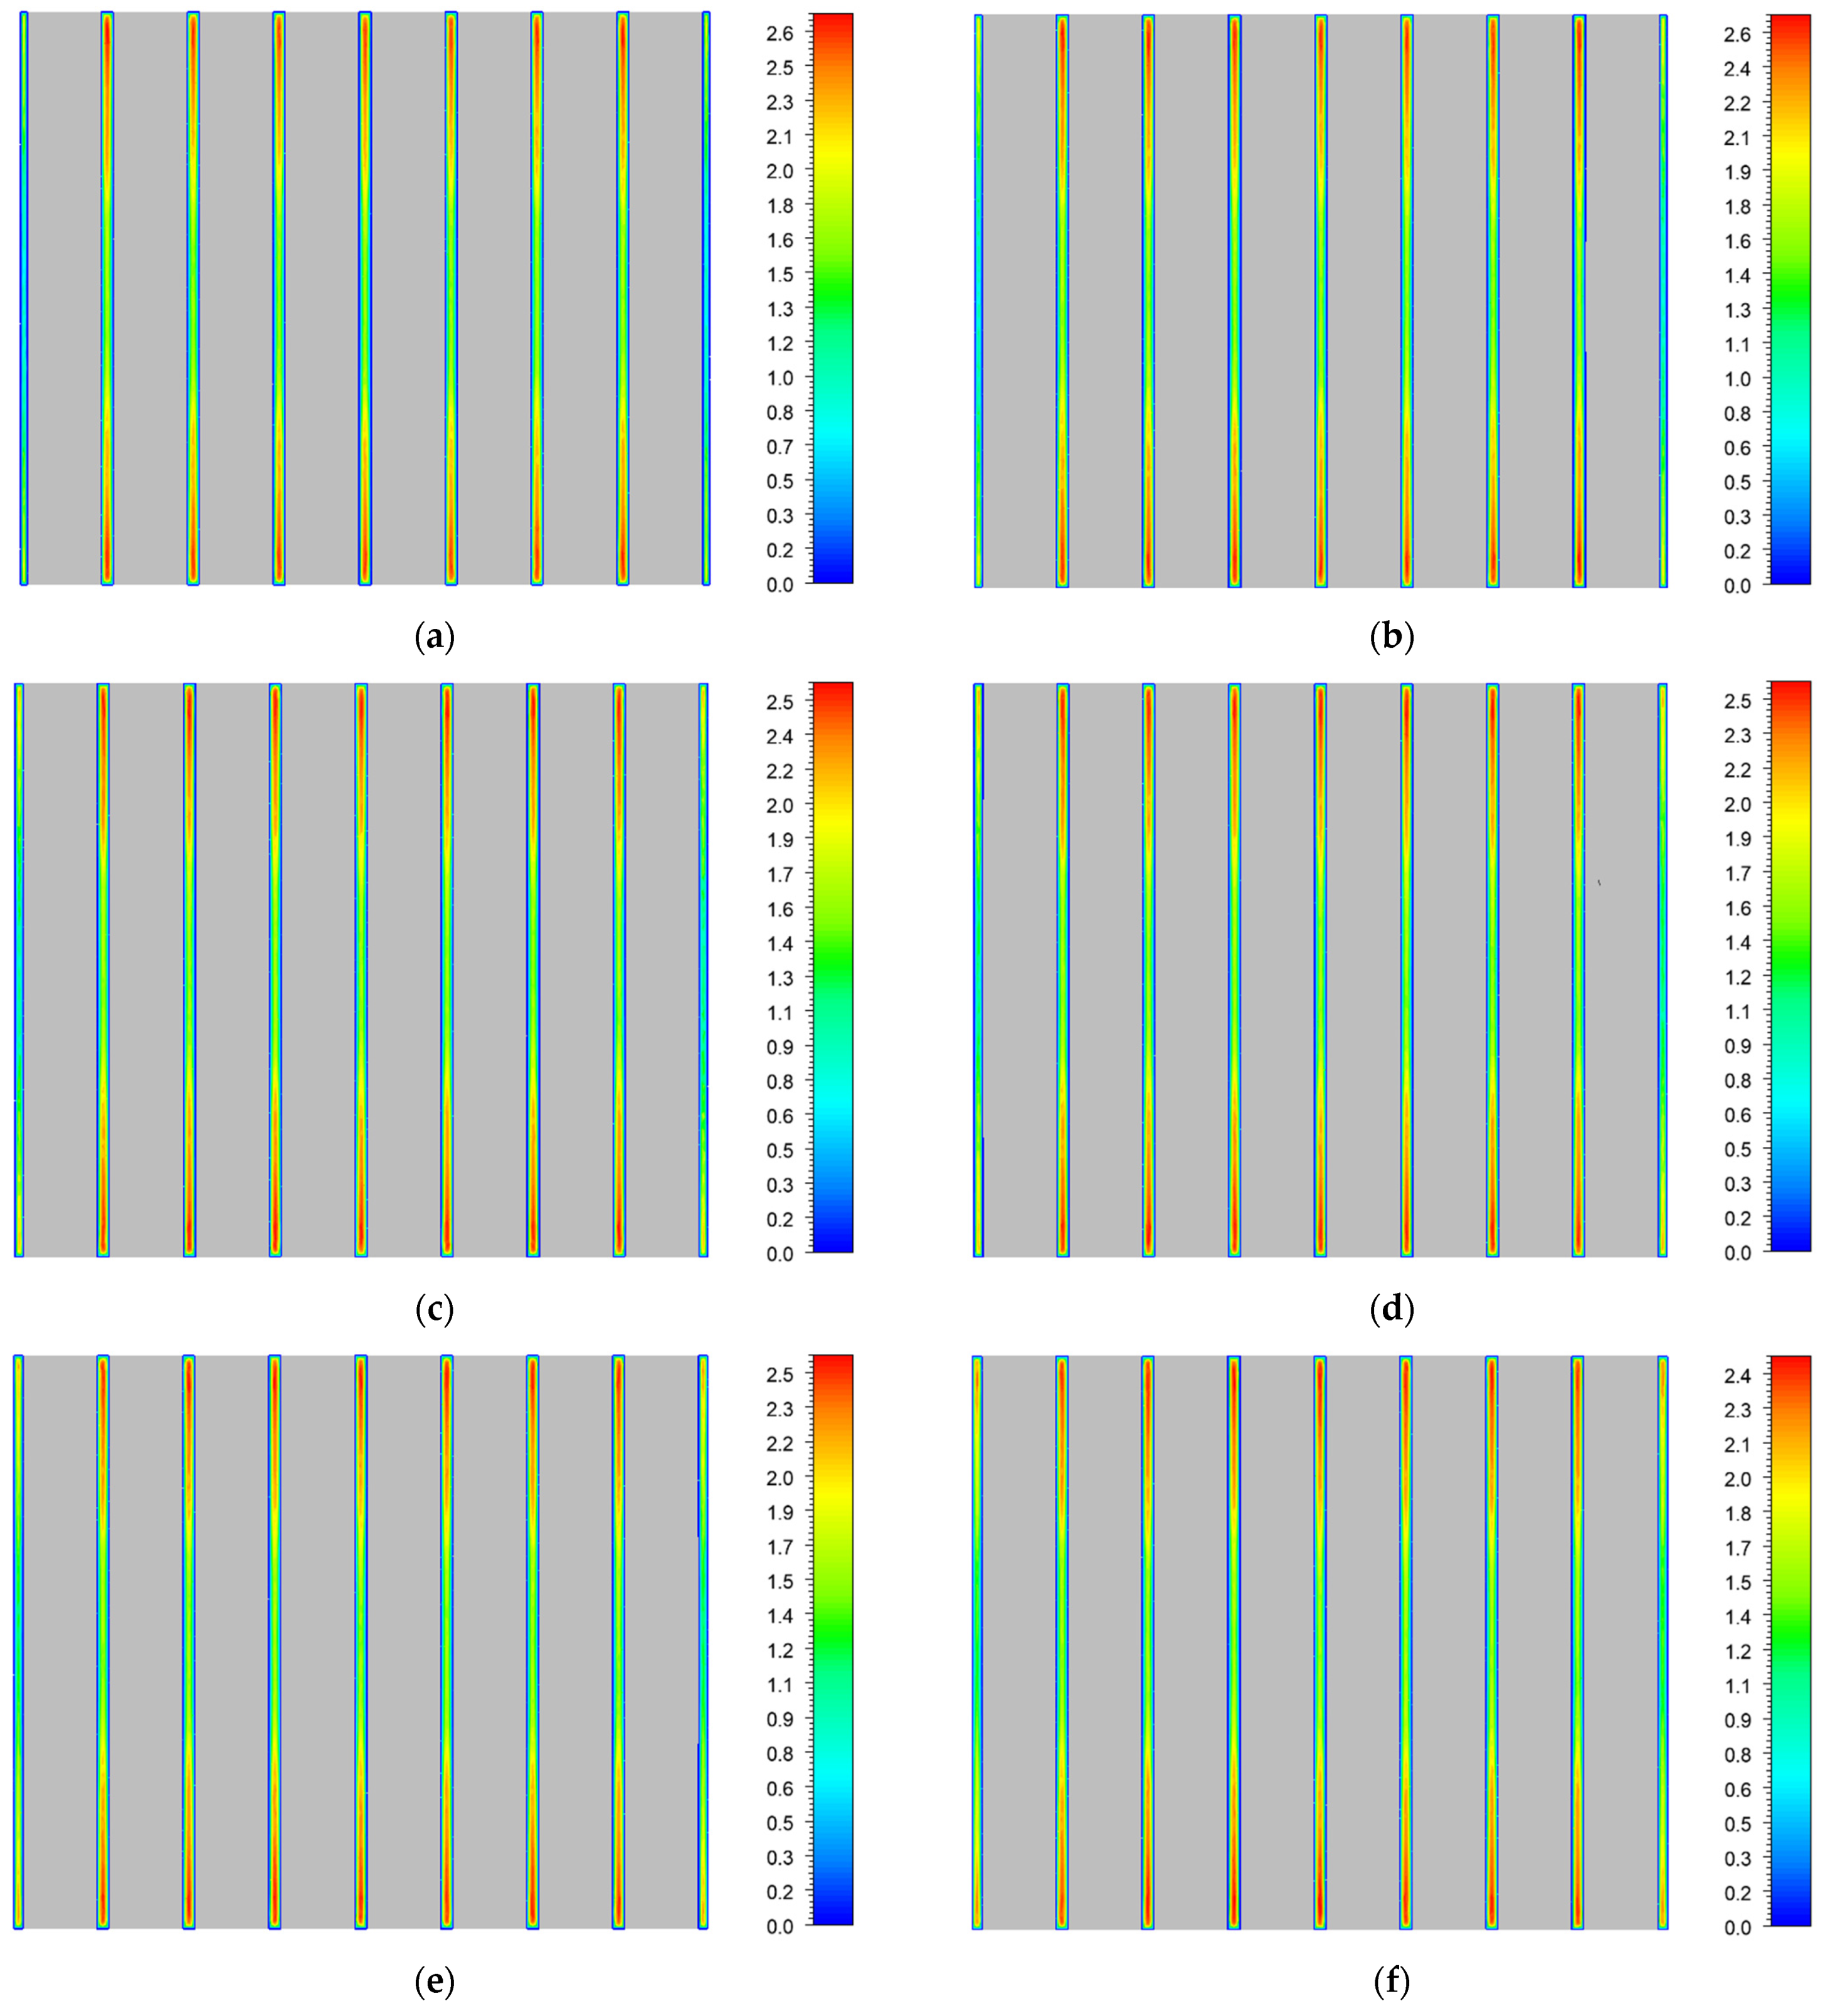
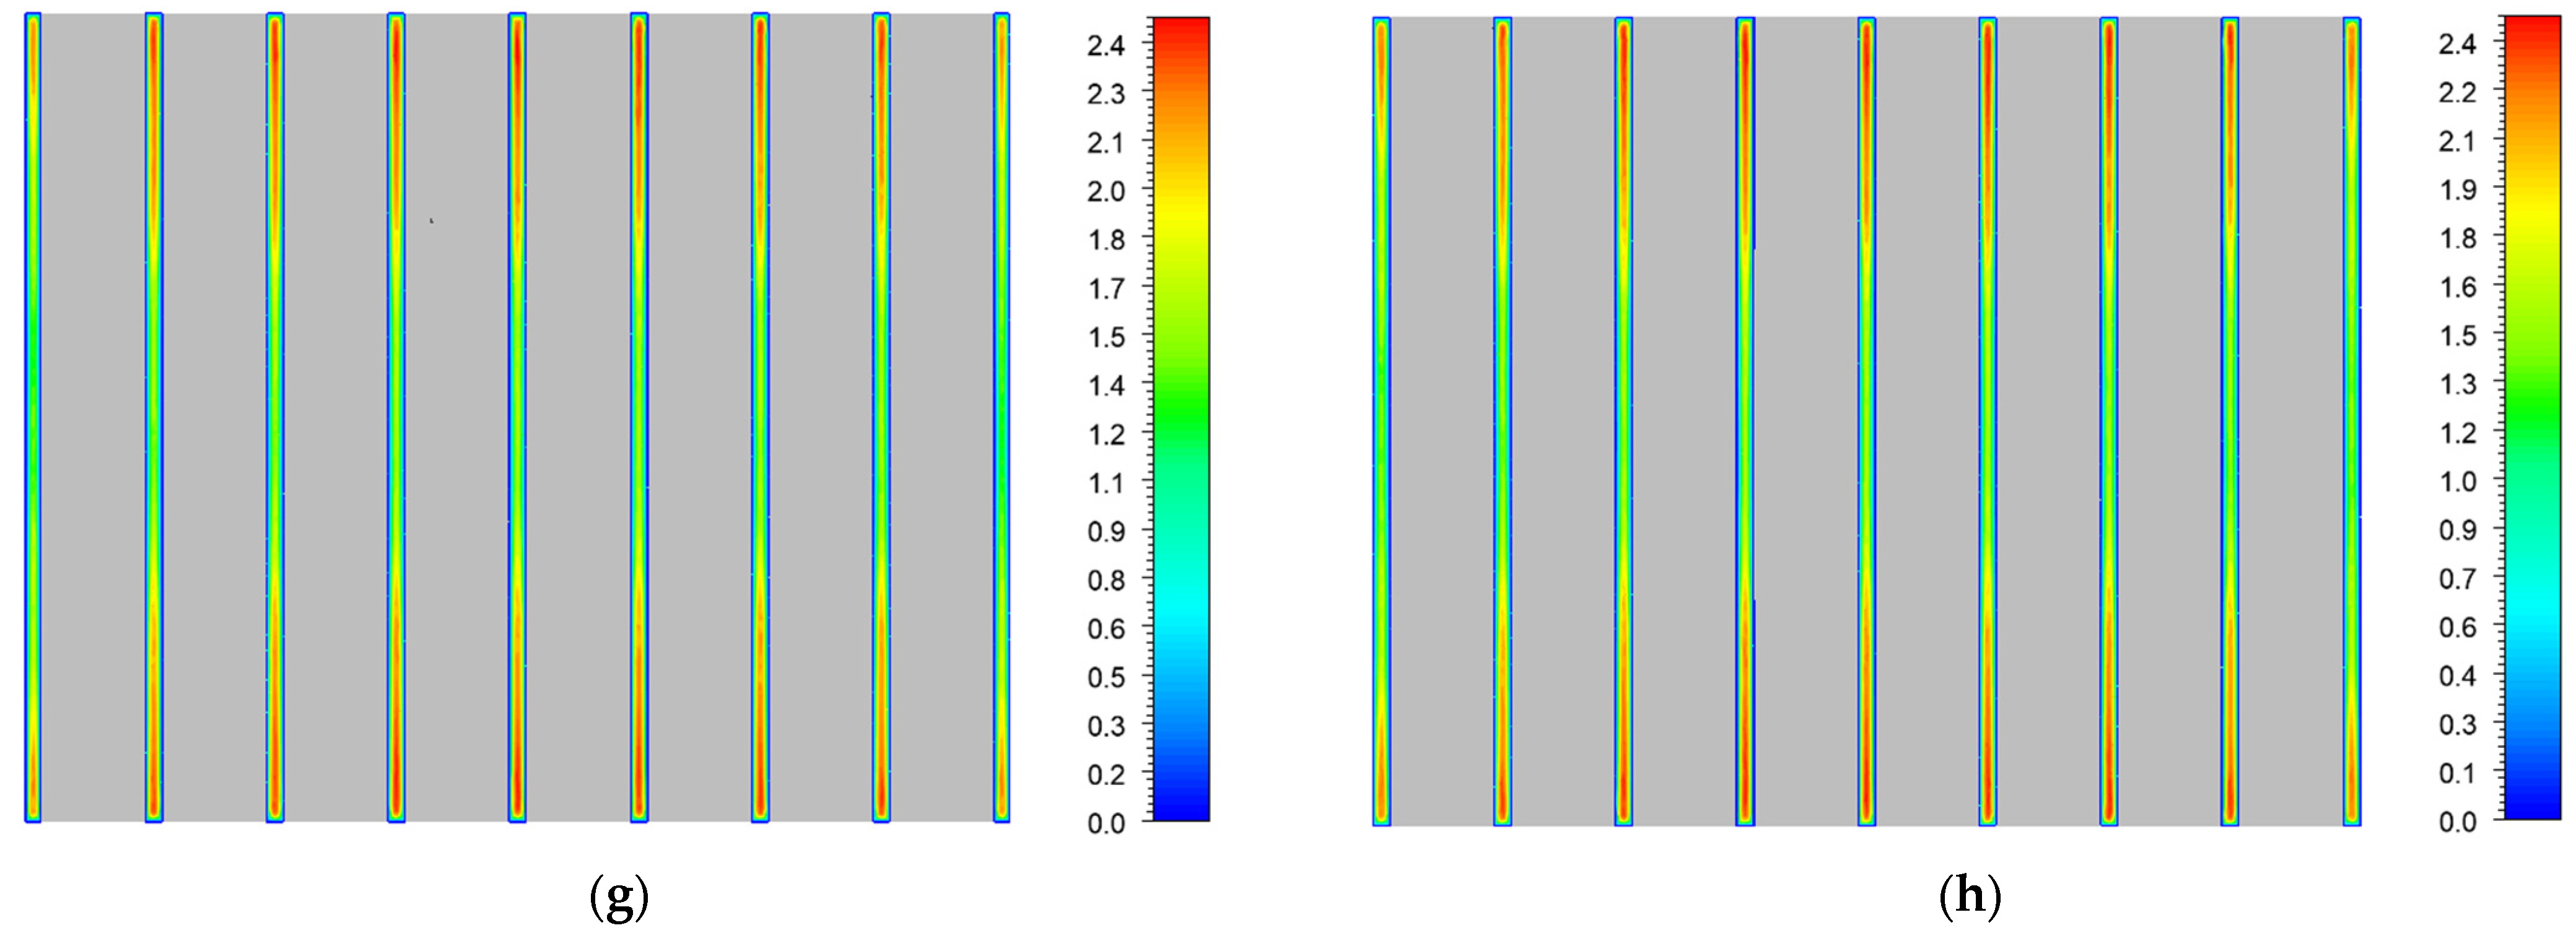
When d 1 changes, the improvement of system heat dissipation performance may be related to the changes in flow velocity in all cooling channels, while the improvement of system temperature uniformity may be related to the changes in flow velocity in cooling channels 1 and 9. Figure 14 shows the system flow velocity cloud map with changes in d 1 , with the cross-section taken from the middle section of the battery pack in the Y-axis direction. It can be seen that as d 1 decreased, there was indeed a significant change in the flow velocity of all channels and the flow velocity of cooling channels 1 and 9.
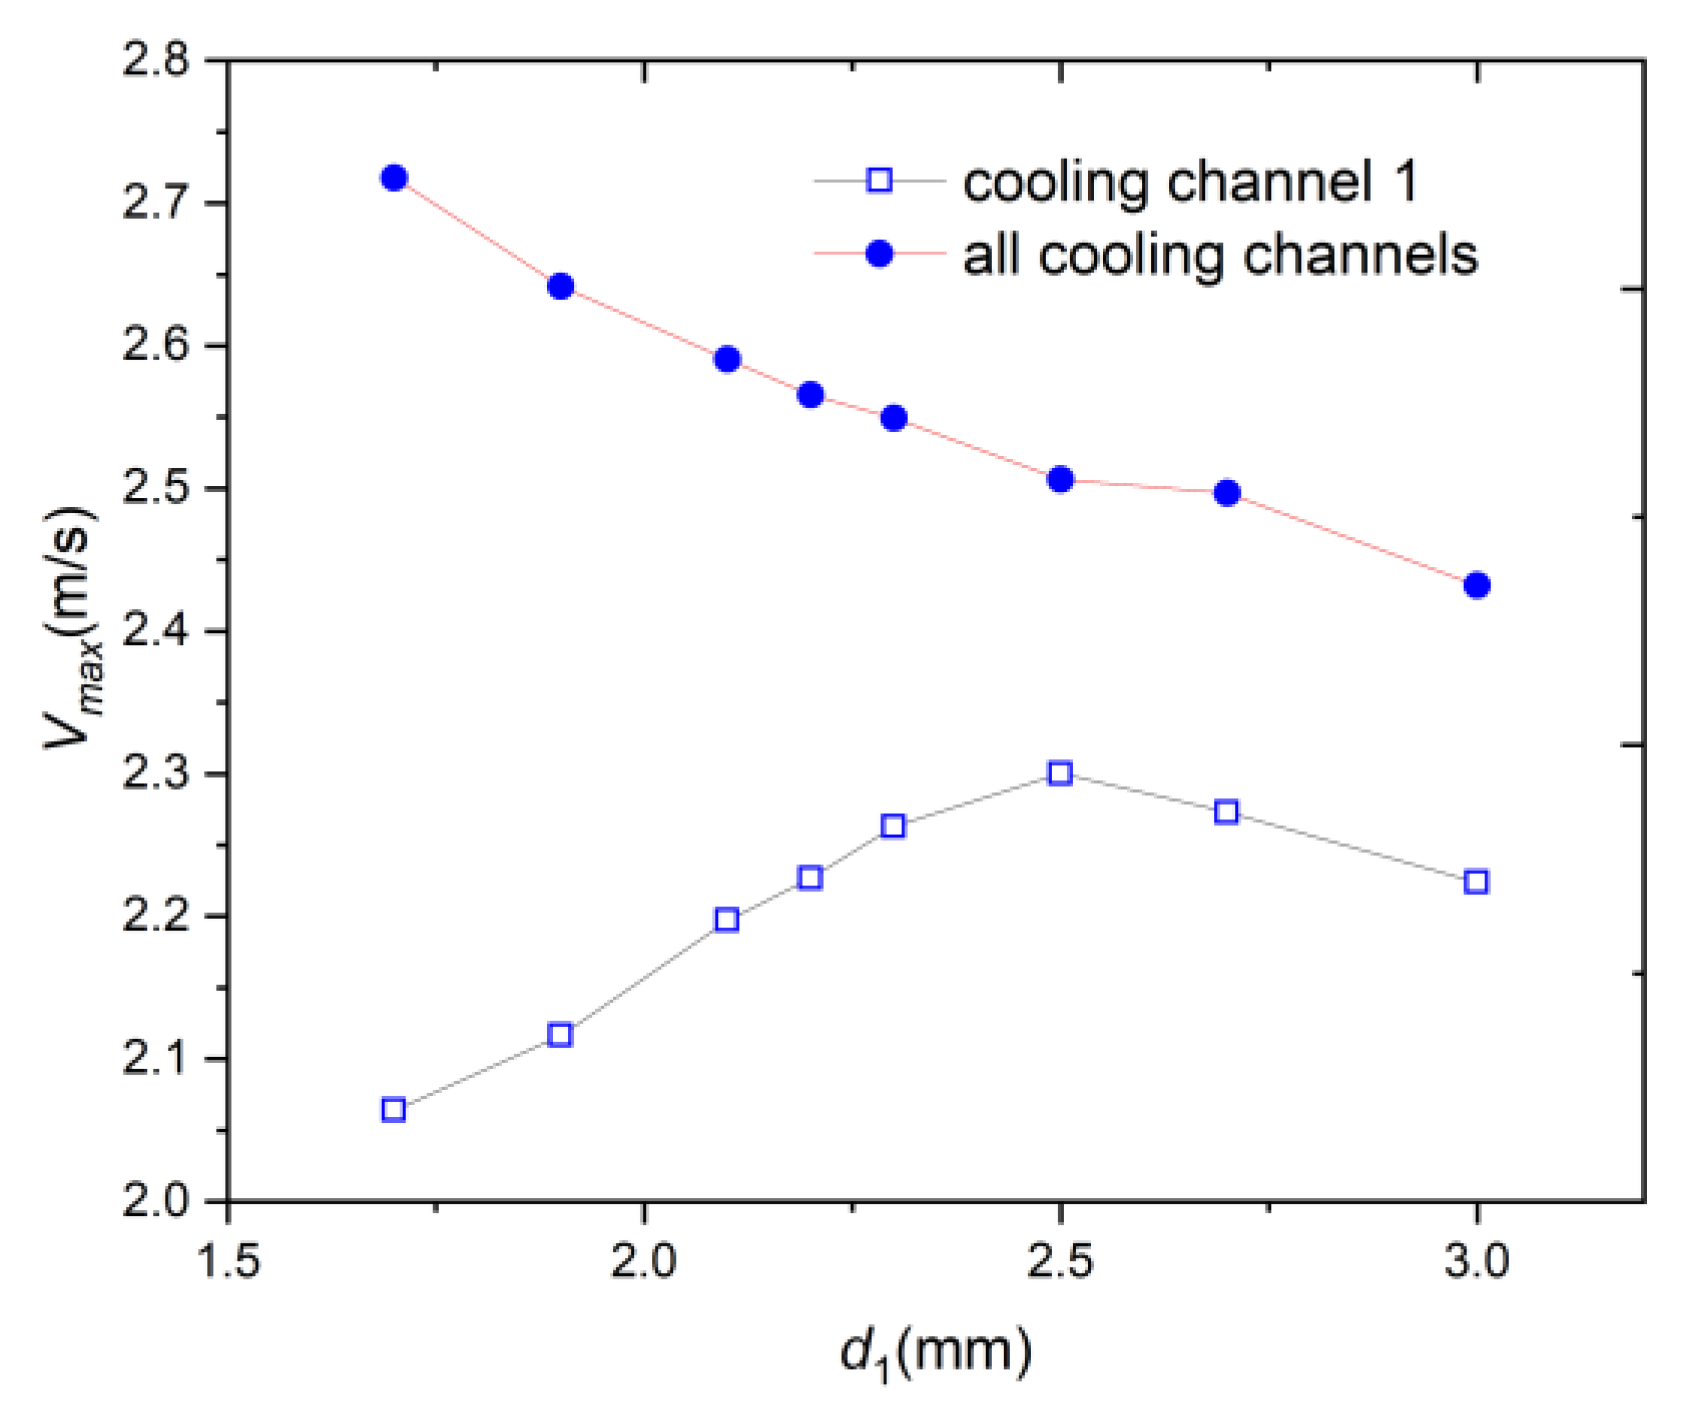
Figure 15 shows the maximum flow velocities of cooling channel 1 and all cooling channels when d 1 changed, with d 1 ranging from 1.7 mm to 3.0 mm. When d 1 decreased, the V max value of all cooling channels gradually increased from 2.432 m/s to 2.718 m/s. Therefore, the V max value of all cooling channels in Figure 13 can be used to explain the overall heat dissipation performance T max .
As shown Figure 15, when d 1 decreased from 3.0 mm to 2.5 mm, the V max value of cooling channel 1 gradually increased from 2.224 m/s to 2.300 m/s, corresponding to the T c of battery cell 1 gradually decreasing from 39.828 °C to 39.719 °C in Figure 13. As shown in the same figure, when d 1 decreased from 2.5 mm to 1.7 mm, the V max of cooling channel 1 gradually decreased from 2.300 m/s to 2.064 m/s, corresponding to the T c of battery cell 1 gradually increasing from 39.719 °C to 39.956 °C in Figure 13. Therefore, the V max of cooling channel 1 can be used to explain the T c of battery cell 1.

3.3. Inlet and Outlet

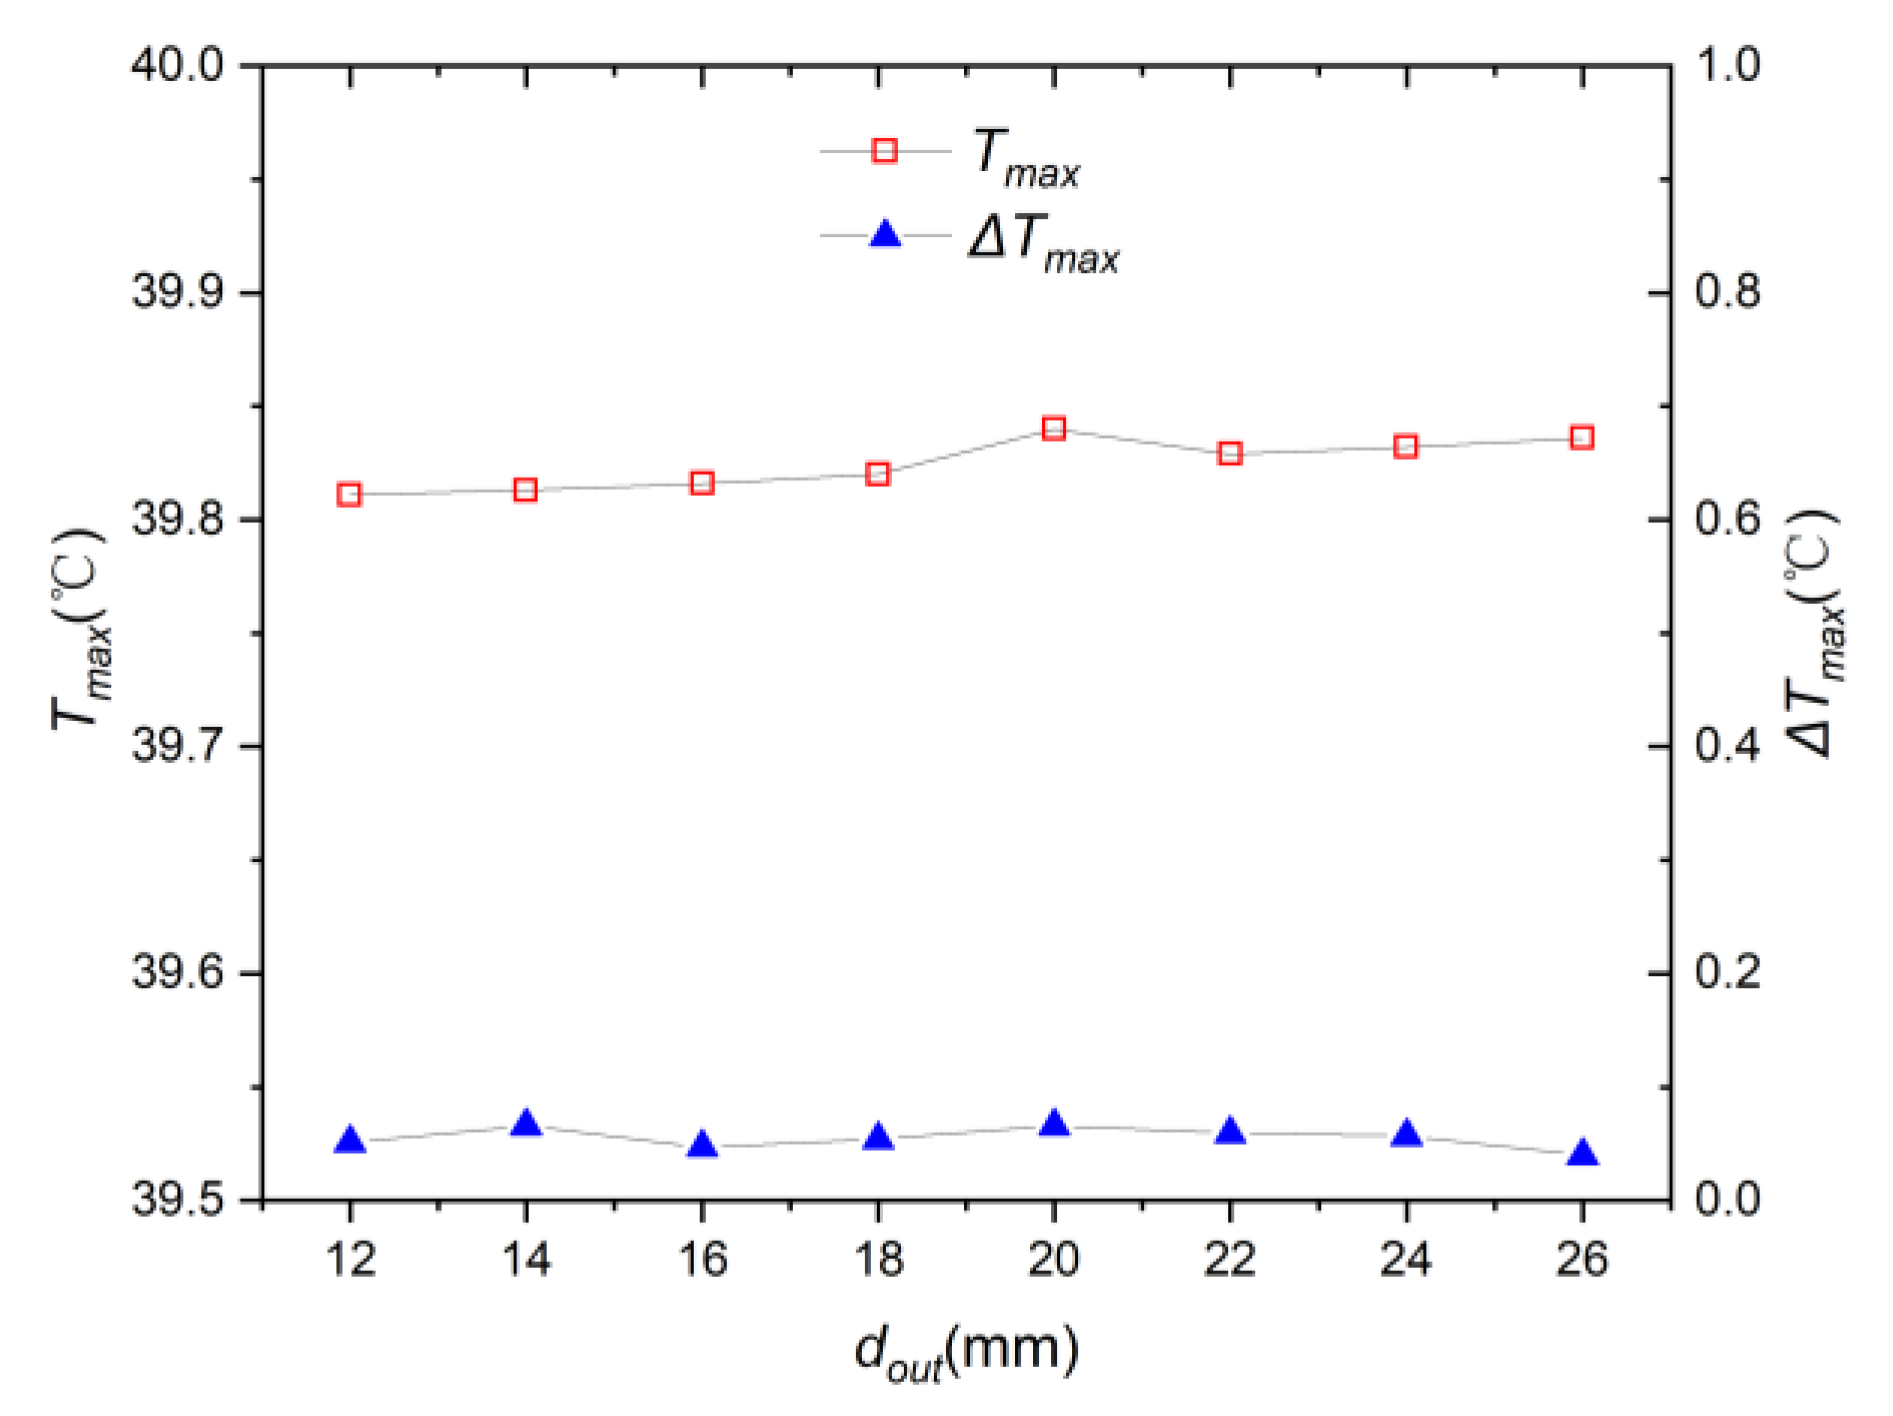
This study discusses the impact of d i n and d o u t on system performance. Using the size of the best-performing sample in Figure 15, we kept d o u t constant at 20 mm, and the impact of d i n on system performance is shown in Figure 16. When d i n increased from 12 mm to 26 mm, T max and Δ T max remained basically unchanged, with average values of 39.848 °C and 0.074 °C, respectively. Using the size of the best-performing sample shown in Figure 15, we once again kept d i n constant at 20 mm, and the effect of d o u t on system performance is shown in Figure 17. When d o u t increased from 12 mm to 26 mm, T max and Δ T max remained basically unchanged, with average values of 39.825 °C and 0.055 °C, respectively. Compared with the optimal results of the T-type BTMS with added turbulence in reference [5], the T max and Δ T max values of the T-type BTMS system were reduced by 1.537 °C (3.71%) and 0.07 °C (56%), respectively. It was observed that the T max value of the system was below 40 °C, and the battery cells were in the optimal operating temperature range of 20–40 °C.

3.4. Energy Consumption and Safety Analysis

3.4.1. Energy Consumption

When designing a BTMS, energy consumption needs to be considered [14,17]. For the purpose of quantitative evaluation, system energy consumption ( W p ) is introduced to represent the energy consumed by BTMS, and the calculation formula is:
W p = Δ P i n o u t Q i n
where Δ P i n o u t is the pressure drop of the area-weighted average between the inlet and outlet, while Q i n is the inlet airflow rate.
The cooling performance and energy consumption of the BTMS at each design stage at the end of discharge at a 2.5 C discharge rate is summarized in Table 3, but the impacts of d i n and d o u t are longer included. In the first three design stages, Q i n were 5.2 × 10 3   m 3 · s 1 . In design stage 4, as mentioned earlier, due to the decrease in d 1 , Q i n was slightly lower than 5.2 × 10 3   m 3 · s 1 . The pressure at the outlet was close to zero; therefore, the system energy consumption was directly proportional to the inlet pressure.
In design stage 1, when d d p and d c p increased simultaneously, energy consumption rapidly decreased. In design phase 2, when the sum of d d p and d c p remained constant, there was little change in energy consumption. In design phase 3, when d d p remained constant and d c p increased, energy consumption rapidly decreased. The results indicate that the reduction in energy consumption (pressure drop) is mainly influenced by d c p . This suggests that we can reduce system energy consumption by increasing d c p . Furthermore, from the results of the above three stages, it can be seen that the cooling performance of the system often deteriorates when power consumption decreases. When designing the BTMS structure, we need to seek a balance between cooling performance and energy consumption according to our needs. In design phase 4, we found that the energy consumption was less affected by d 1 . The energy consumption of sample with the best cooling performance was 0.0825 W, which was 0.0124 W (13.1%) lower than that of the T-type model.

3.4.2. Safety Analysis

The safety of batteries under extreme conditions is also crucial, such as BTMS being exposed to higher ambient temperatures and higher discharge rates. The sample with the best performance in stage 4 was selected for analysis, where d 1 was 2.2 mm. The performance of the BTMS is summarized in Table 4 for ambient temperatures of 25, 30 and 35 °C and discharge rates of 2.5, 3 and 4 C, respectively. When the ambient temperature was 35 °C and the discharge rate was 2.5 C, the T max value of BTMS at the end of discharge was below 50 °C, indicating good heat dissipation performance. Δ T max was very small under different conditions, indicating that the Y-type BTMS had excellent temperature uniformity. We found an interesting phenomenon from the results: while keeping the discharge rate constant, the relationship between T max and different ambient temperatures can be obtained. We hope to continue analyzing whether the pattern is universal in future research. The formula is as follows:
T max , T i = T max , T j + T i T j
where T i and T j are two different ambient temperatures, while T m a x , T i and T m a x , T j are the maximum temperatures of the BTMS at ambient temperatures T i and T j , respectively.
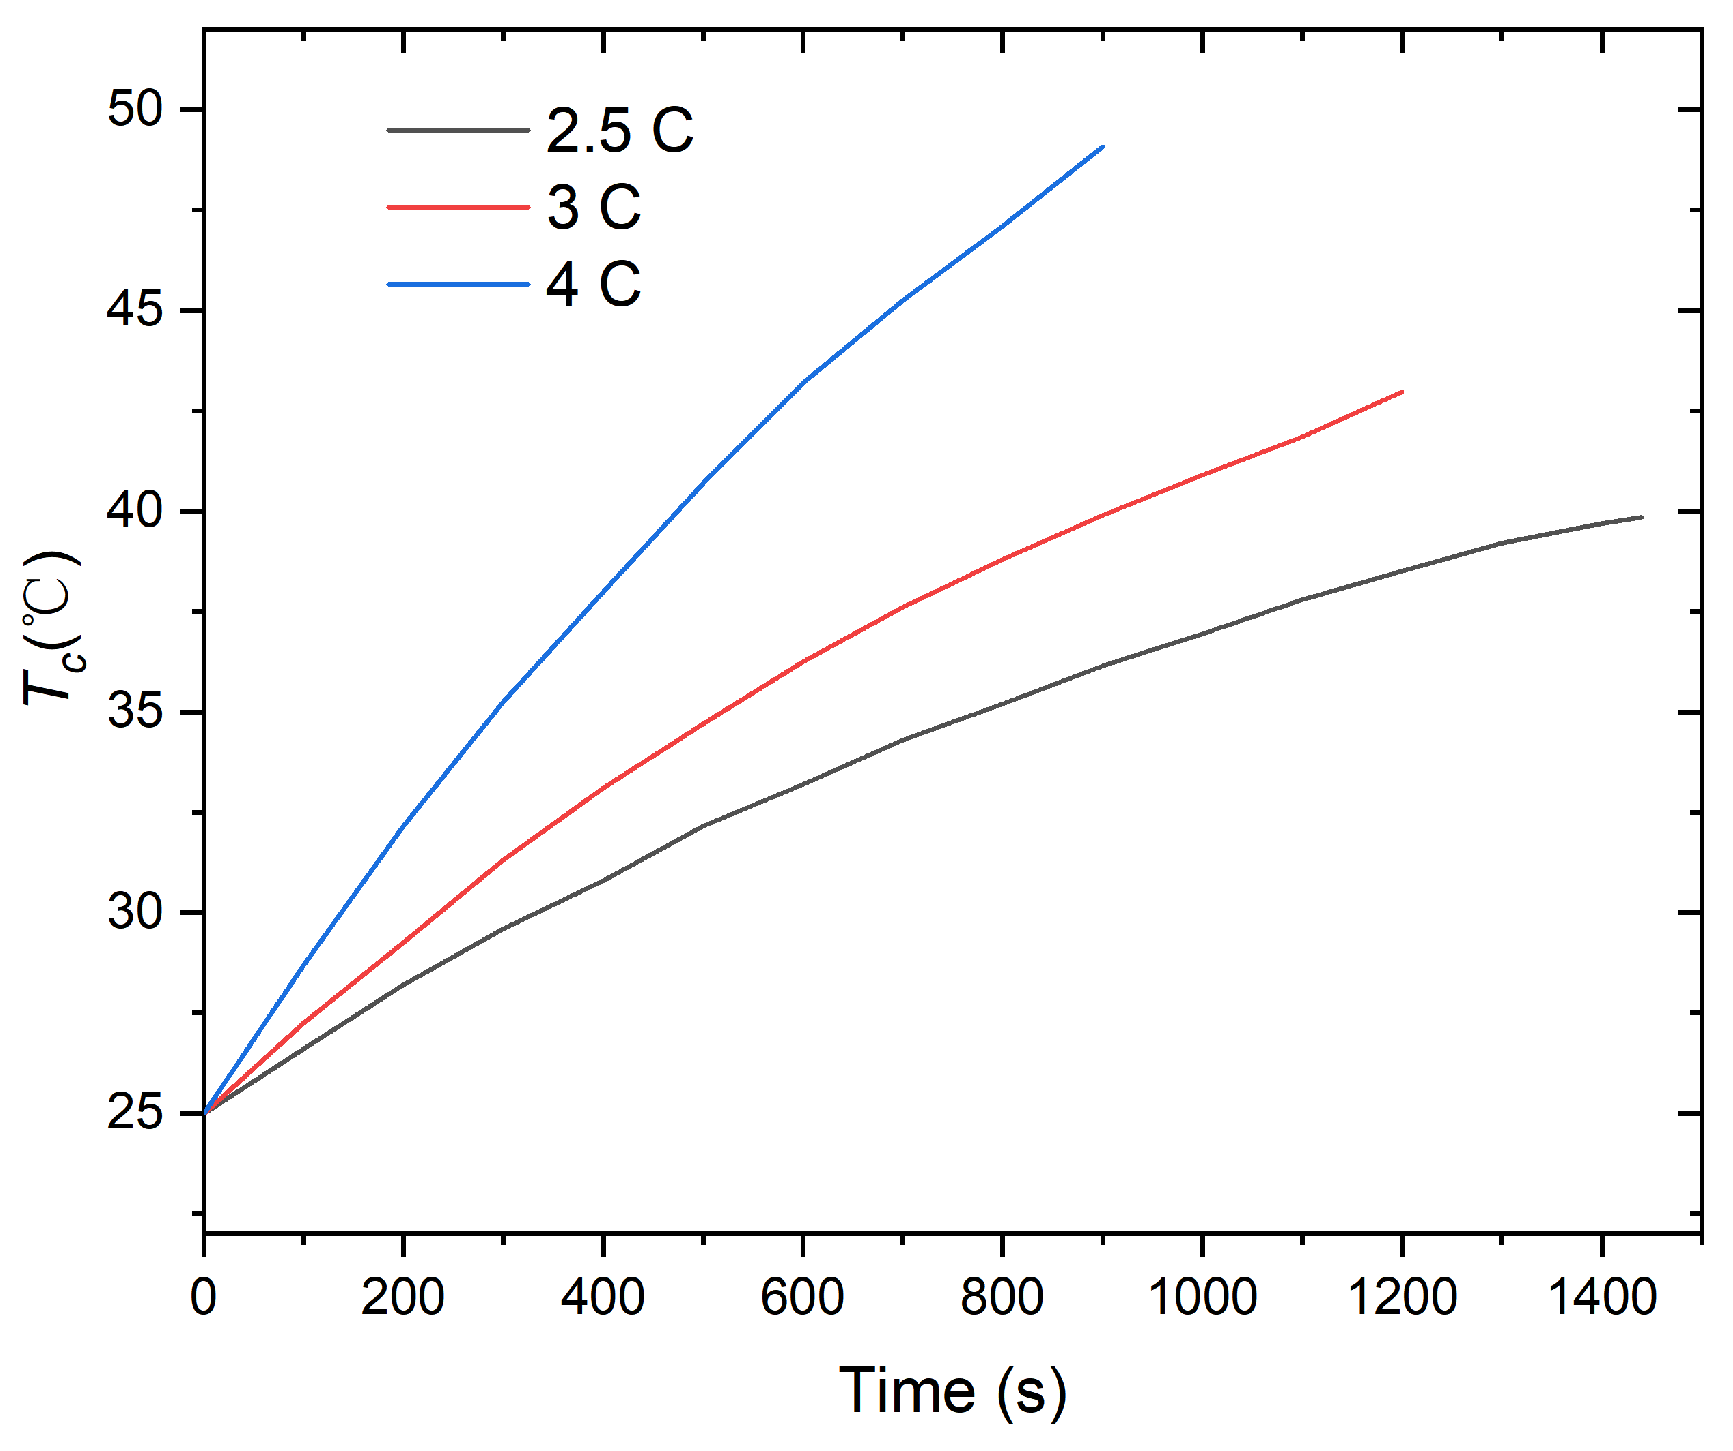
Finally, we studied the dynamic performance of battery heat dissipation in the BTMS. For an ambient temperature of 25 °C, the T c of battery cell 4 of the sample in Table 4 at different discharge rates is shown in Figure 18; the other cells are almost the same. From Figure 4, it can be observed that the battery cell heated up rapidly in the initial stage and then gradually slowed down.

4. Conclusions

This paper proposes a Y-type air-cooled BTMS system with shortened airflow path characteristics. Several important conclusions of the study are as follows:
(1)
By adjusting the depths of the distribution plenum and convergence plenum, the airflow velocities passing through the vicinities of the battery cells can be changed, thereby reducing T max . When d d p remains at 8.0 mm and d c p decreases from 3.5 mm to 1.5 mm, V max rapidly increases, and the corresponding T max can be reduced to 40.06 °C.
(2)
By changing the width of cooling channels 1 and 9, the flow velocity of these two channels can be adjusted to improve the temperature uniformity of the system. When d 1 and d 9 decrease from 3.0 mm to 1.7 mm, the T c value of the middle six batteries gradually decreases, and the T c value of batteries 1 and 8 first decreases and then increases. When d 1 and d 9 are 2.2 mm, the heat dissipation performance and temperature uniformity of the system are optimal, with T max of 39.84 °C and Δ T max of 0.066 °C. The maximum flow velocity of all cooling channels and the maximum flow velocity of cooling channel 1 can be used separately to analyze T max and T c of battery cell 1.
(3)
The inlet and outlet widths have little effect on the heat dissipation performance and temperature uniformity of the system. When d o u t increases from 12 mm to 26 mm, the average values of the T max and Δ T max are 39.825 °C and 0.055 °C, respectively. The battery cells in the system are still within the optimal operating temperature range of 20–40 °C. Δ T max is less than 0.1 °C, and the system achieves excellent temperature uniformity.
(4)
The cooling performance and energy consumption of the BTMS at each design stage at the end of a 2.5 C discharge rate are summarized. The results indicate that the reduction in energy consumption (pressure drop) is mainly influenced by d c p . The energy consumption of the sample with the best cooling performance is 0.0825 W, which is 0.0124 W (13.1%) lower than that of the T-type model.
(5)
Δ T max is very small when the BTMS is exposed to higher ambient temperatures and higher discharge rates, indicating that the BTMS has excellent temperature uniformity. Keeping the discharge rate constant, the relationship between T max and different ambient temperatures can be obtained.

Author Contributions

Conceptualization, J.L.; methodology, J.L.; software, J.L.; validation, X.L. (Xiangyang Li), J.L. and X.L. (Xiaomin Li); formal analysis, X.L. (Xiaomin Li); investigation, X.L. (Xiaomin Li); resources, X.L. (Xiaomin Li); data curation, X.L. (Xiangyang Li); writing—original draft preparation, X.L. (Xiangyang Li); writing—review and editing, X.L. (Xiangyang Li); visualization, X.L. (Xiaomin Li); supervision, J.L.; project administration, J.L.; funding acquisition, X.L. (Xiangyang Li), J.L. and X.L. (Xiaomin Li). All authors have read and agreed to the published version of the manuscript.

Funding

This work was supported by the Huzhou Natural Science Foundation (Nos. 2022YZ43 and 2022YZ01), the Henan Province Science and Technology Key Project under Grant No. 232102211071, and the Project for Huzhou Key Laboratory of IoT Intelligent System Integration Technology under Grant No. 2022-21.

Data Availability Statement

The data are contained within the article.

Conflicts of Interest

The authors declare no conflicts of interest.

References

  1. Gibbons, L.; Javed, S. A review of HVAC solution-sets and energy performance of nearly zero-energy multi-story apartment buildings in Nordic climates by statistical analysis of environmental performance certificates and literature review. Energy 2022, 238, 121709. [Google Scholar] [CrossRef]
  2. Asif, A.; Abdul, R.R.K.; Mohammed, S.A.D.; Rahul, K.; Mit, A.; Goon, P.S. A critical review on renewable battery thermal management system using heat pipes. J. Therm. Anal. Calorim. 2023, 16, 148. [Google Scholar]
  3. Hajidavalloo, M.R.; Chen, J.; Hu, Q.; Song, Z.; Yin, X.; Li, Z. NMPC-Based integrated thermal management of battery and cabin for electric vehicles in cold weather conditions. IEEE Trans. Intell. Veh. 2023, 8, 4208–4222. [Google Scholar] [CrossRef]
  4. Kiani, M.; Omiddezyani, S.; Houshfar, E.; Miremadi, S.R.; Ashjaee, M.; Nejad, A.M. Lithium-ion battery thermal management system with Al2O3/AgO/CuO nanofluids and phase change material. Appl. Therm. Eng. 2020, 180, 115840. [Google Scholar] [CrossRef]
  5. Shen, K.; Yang, L.; Sun, J.; Xu, C.; Wang, H.; Zheng, Y.; Feng, X. Experimental and simulations study of thermal performance of cell-to-pack structure for a lithium-ion battery pack. J. Electrochem. Energy Convers. Storage 2023, 20, 041003. [Google Scholar] [CrossRef]
  6. Zhao, C.; Cao, W.; Dong, T.; Jiang, F. Thermal behavior study of discharging/charging cylindrical lithium-ion battery module cooled by channeled liquid flow. Int. J. Heat Mass Transf. 2018, 120, 751–762. [Google Scholar] [CrossRef]
  7. Ravikumar, B.; Mynam, M.; Rai, B. Molecular dynamics investigation of electric field altered behavior of lithium ion battery electrolytes. J. Mol. Liq. 2020, 300, 112252. [Google Scholar] [CrossRef]
  8. Lu, Z.; Yu, X.; Wei, L.; Qiu, Y.; Zhang, L.; Meng, X.; Jin, L. Parametric study of forced air cooling strategy for lithium-ion battery pack with staggered arrangement. Appl. Therm. Eng. 2018, 136, 28–40. [Google Scholar] [CrossRef]
  9. Wang, T.; Tseng, K.J.; Zhao, J. Development of efficient air-cooling strategies for lithium-ion battery module based on empirical heat source model. Appl. Therm. Eng. 2015, 90, 521–529. [Google Scholar] [CrossRef]
  10. Hong, S.; Zhang, X.; Chen, K. Design of flow configuration for parallel air-cooled battery thermal management system with secondary vent. Int. J. Heat Mass Transf. 2018, 116, 1204–1212. [Google Scholar] [CrossRef]
  11. Yu, K.; Yang, X.; Cheng, Y.; Li, C. Thermal analysis and two-directional air flow thermal management for lithium-ion battery pack. J. Power Sources 2014, 270, 193–200. [Google Scholar] [CrossRef]
  12. Shahid, S.; Agelin-Chaab, M. Development and analysis of a technique to improve air-cooling and temperature uniformity in a battery pack for cylindrical batteries. Therm. Sci. Eng. Prog. 2018, 5, 351–363. [Google Scholar] [CrossRef]
  13. Peng, X.; Ma, C.; Garg, A.; Bao, N.; Liao, X. Thermal performance investigation of an aircooled lithium-ion battery pack considering the inconsistency of battery cells. Appl. Therm. Eng. 2019, 153, 596–603. [Google Scholar] [CrossRef]
  14. Zhang, F.; Yi, M.; Wang, P.; Liu, C. Optimization design for improving thermal performance of T-type air-cooled lithium-ion battery pack. J. Energy Storage 2021, 44, 103464. [Google Scholar] [CrossRef]
  15. Chen, K.; Song, M.; Wei, W.; Wang, S. Design of the structure of battery pack in parallel air-cooled battery thermal management system for cooling efficiency improvement. Int. J. Heat Mass Transf. 2019, 132, 309–321. [Google Scholar] [CrossRef]
  16. Zhang, F.; Lin, A.; Wang, P.; Liu, P. Optimization design of a parallel air-cooled battery thermal management system with spoilers. Appl. Therm. Eng. 2021, 182, 116062. [Google Scholar] [CrossRef]
  17. Weng, J.; Xiao, C.; Yang, X.; Ouyang, D.; Chen, M.; Zhang, G.; Waiming, L.E.; Yuen, K.K.R.; Wang, J. An energy-saving battery thermal management strategy coupling tubular phase-change-material with dynamic liquid cooling under different ambient temperatures. Renew. Energy 2022, 195, 918–930. [Google Scholar] [CrossRef]
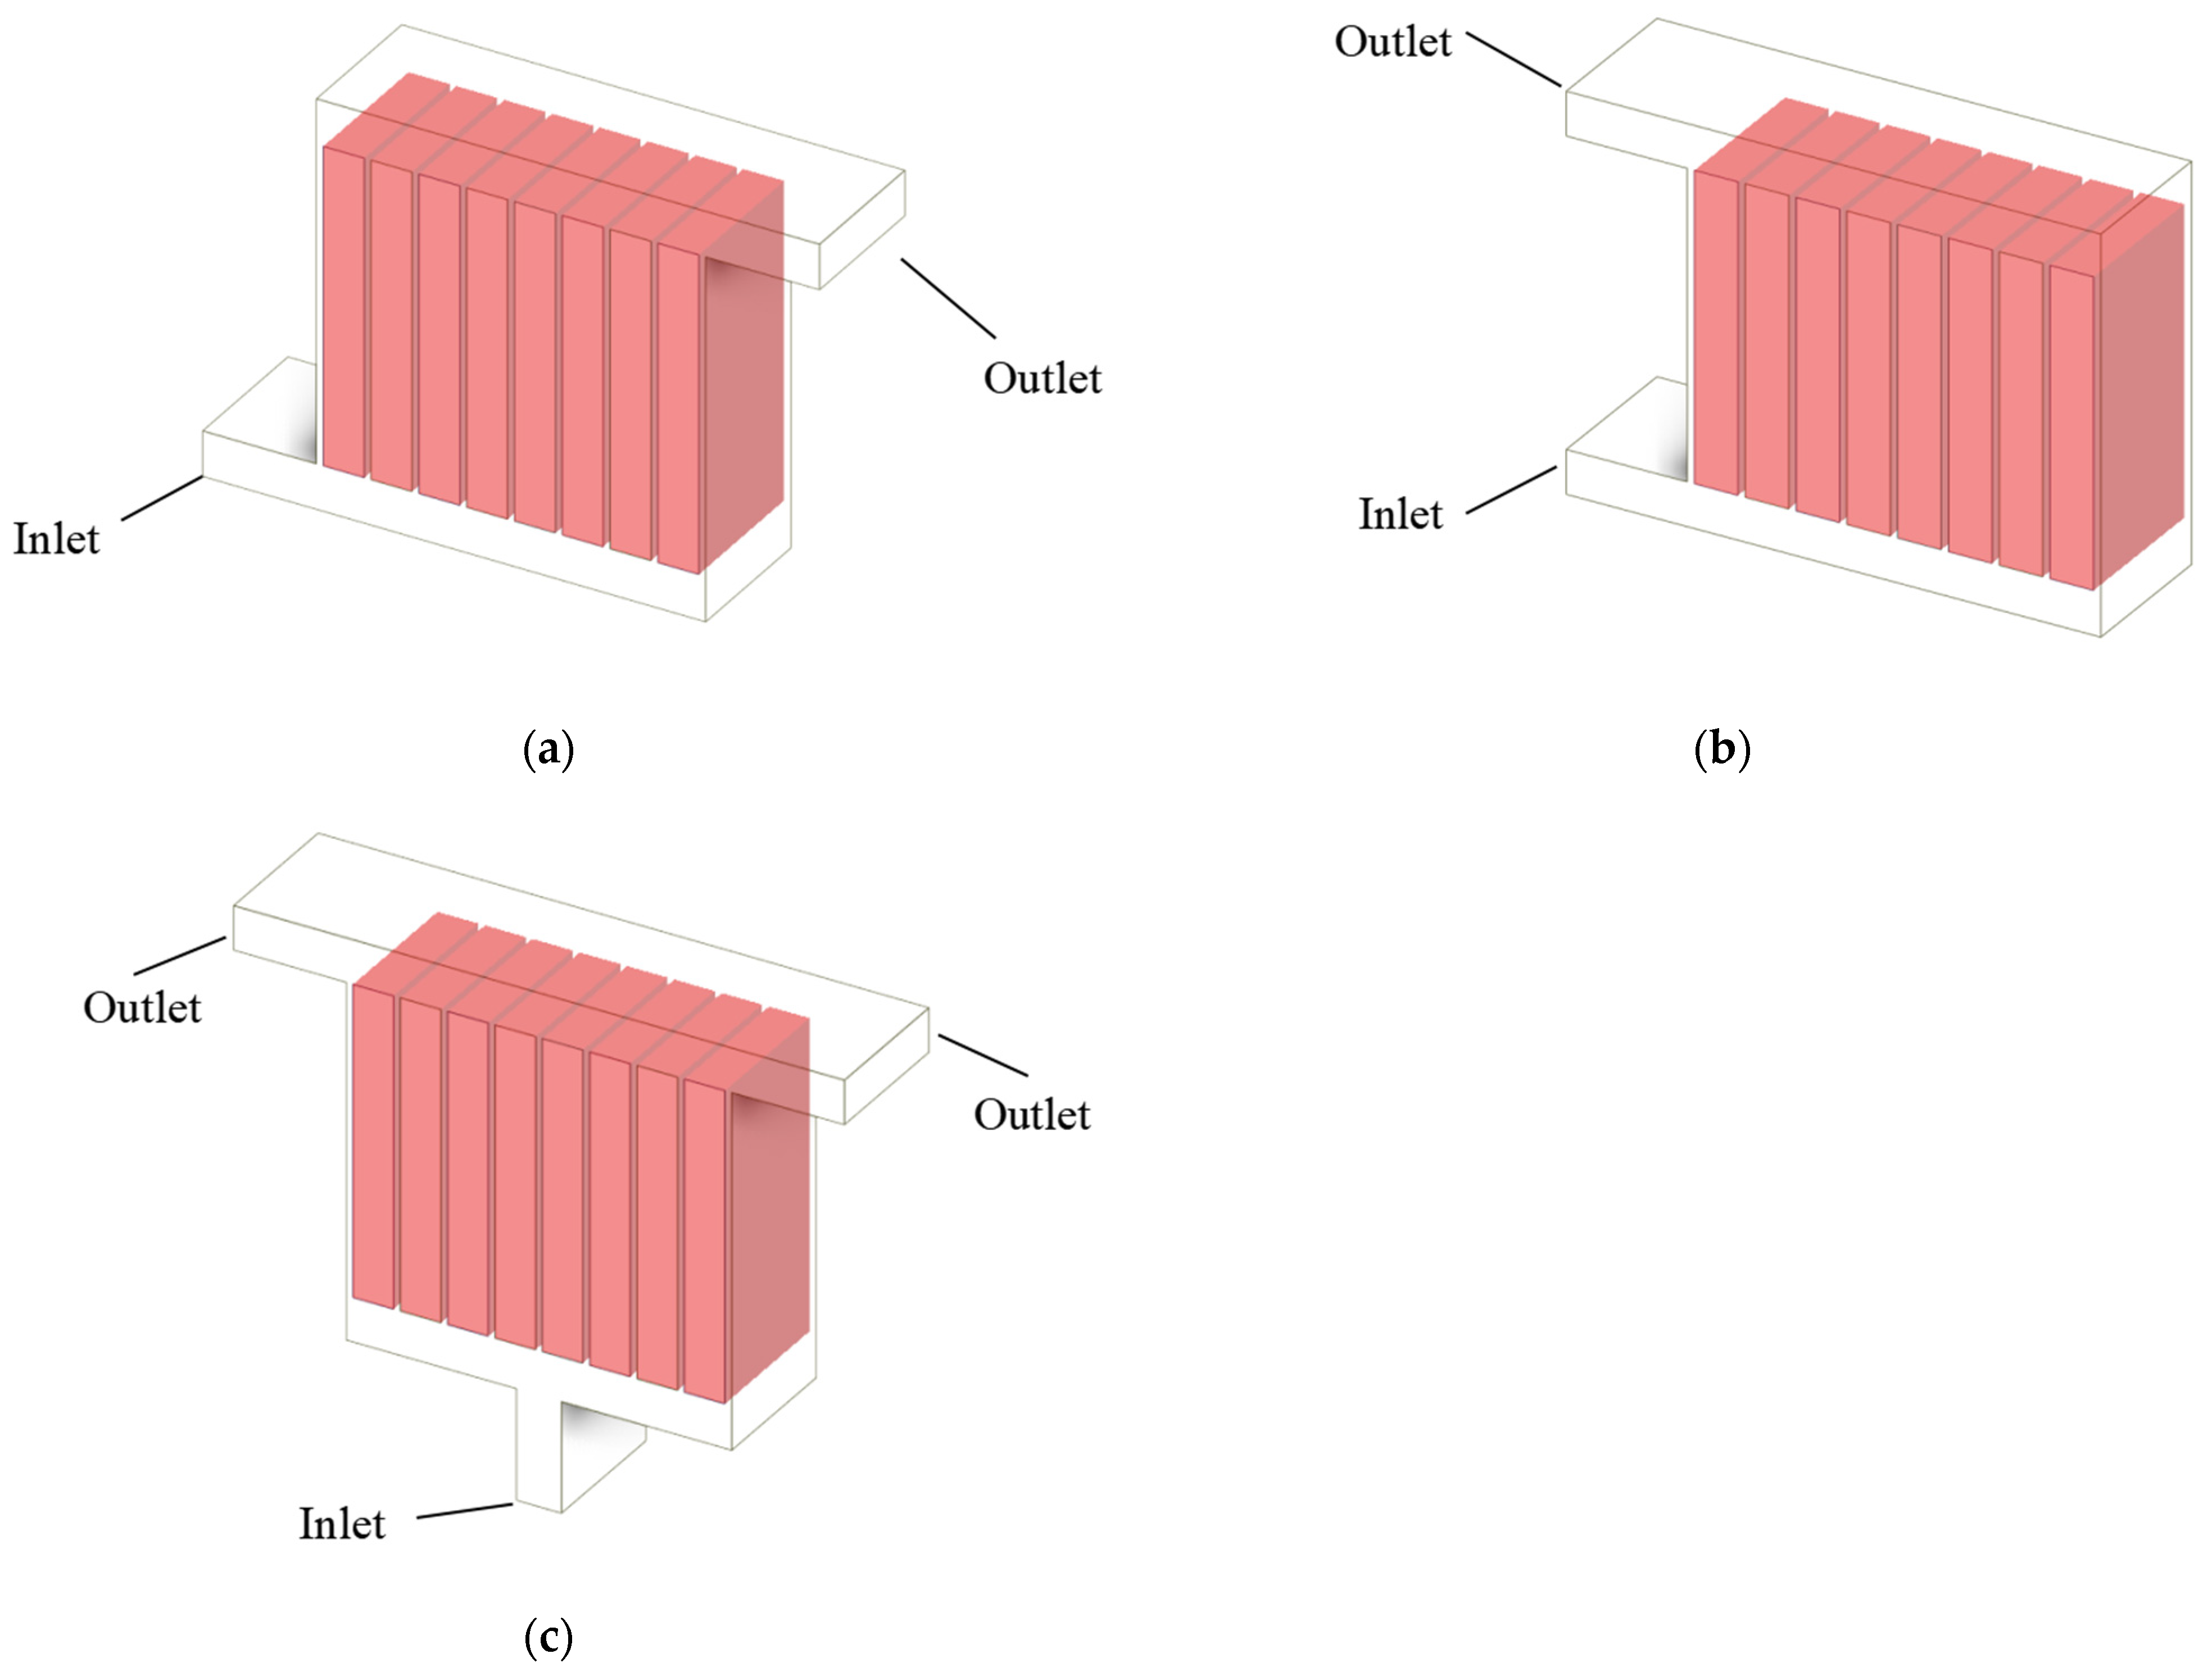
Figure 1. Structural design of BTMSs. (a) Z-type; (b) U-type; (c) T-type.
Batteries 10 00302 g001
Figure 2. Three-dimensional model of Y-type air-cooled BTMS and battery cell.
Batteries 10 00302 g002
Figure 3. Half of the 3D mesh model of the battery pack cut in cross-section normal to the X-axis.
Batteries 10 00302 g003
Figure 4. Comparison between the simulation results of a T-type air-cooled BTMS battery pack in this paper and the results given in reference [14]. Copyright (2024), with permission from Elsevier.
Batteries 10 00302 g004
Figure 5. Right and top views of a Y-type air-cooled BTMS.
Batteries 10 00302 g005
Figure 6. The impact of d d p and d c p on T c , where d d p and d c p are equal and range from 2.5 mm to 20 mm.
Batteries 10 00302 g006
Figure 7. T max of the system and V max at the cross-sectional position of the system in the X-axis.
Batteries 10 00302 g007
Figure 8. The velocity cloud map located in the X-axis cross-section, where d d p and d c p are equal. (a) d d p = 2.5 mm; (b) d d p = 3 mm; (c) d d p = 5 mm; (d) d d p = 5.5 mm; (e) d d p = 6 mm; (f) d d p = 7 mm; (g) d d p = 10 mm; (h) d d p = 20 mm.
Batteries 10 00302 g008aBatteries 10 00302 g008b
Figure 9. The heat dissipation performance of Y-type BTMS when d d p and d c p are not equal; the sum of d d p and d c p is set to 11 mm.
Batteries 10 00302 g009
Figure 10. The system’s heat dissipation performance when the d d p was kept at 8.0 mm.
Batteries 10 00302 g010
Figure 11. The air flow velocity in the X-axis cross-section, where d d p is 8.0 mm. (a) d c p = 1.5 mm; (b) d c p = 2.0 mm; (c) d c p = 2.5 mm; (d) d c p = 3.0 mm; (e) d c p = 3.5 mm; (f) d c p = 4.0 mm; (g) d c p = 4.5 mm; (h) d c p = 5.0 mm.
Batteries 10 00302 g011aBatteries 10 00302 g011b
Figure 12. The effect of d c p on T max and V max at the cross-section in the X-axis. d d p is 8.0 mm.
Batteries 10 00302 g012
Figure 13. The influence of d 1 and d 9 on the temperature of the battery pack.
Batteries 10 00302 g013
Figure 14. The system flow velocity cloud map with changes in d 1 and d 9 , with the cross-section taken from the middle section of the battery pack in the Y-axis direction. (a) d 1 = d 9 = 1.7 mm; (b) d 1 = d 9 = 1.9 mm; (c) d 1 = d 9 = 2.1 mm; (d) d 1 = d 9 = 2.2 mm; (e) d 1 = d 9 = 2.3 mm; (f) d 1 = d 9 = 2.5 mm; (g) d 1 = d 9 = 2.7 mm; (h) d 1 = d 9 = 3.0 mm.
Batteries 10 00302 g014aBatteries 10 00302 g014b
Figure 15. The maximum flow velocities of cooling channel 1 and all cooling channels when d 1 and d 9 change, with d 1 and d 9 ranging from 1.7 mm to 3.0 mm.
Batteries 10 00302 g015
Figure 16. The impact of d i n on system performance.
Batteries 10 00302 g016
Figure 17. The effect of d o u t on system performance.
Batteries 10 00302 g017
Figure 18. T c of battery cell 4 at different discharge rates. The ambient temperature is 25 °C.
Batteries 10 00302 g018
Table 1. Physical properties of air.
PropertiesUnitAir
Density k g · m 3 1.165
Specific   Heat   Capacity   C P J · k g 1 · K 1 1005
Thermal Conductivity W · m 1 · K 1 0.0267
Viscosity kg · m 1 · s 1 1.86 × 10 5
Table 2. Physical properties of a battery cell when the discharge rate is 2.5 C.
PropertiesUnitCell
Density k g · m 3 2136.8
Specific Heat Capacity C P J · k g 1 · K 1 1633
Thermal ConductivityW · m 1 · K 1 λ z = 1 , λ x = λ y = 29
Heat Generation RateW · m 3 60,439.56
Table 3. Cooling performance and energy consumption.
StageFactorsResults
1 d d p   = d c p (mm) T max (°C) Δ T max (°C) W p (W)
2.541.2310.2660.0942
3.040.8540.2810.0766
5.040.4920.510.0458
5.5 40.486 0.501 0.0425
6.0 40.515 0.551 0.0396
7.0 40.558 0.555 0.0355
10.0 40.829 0.619 0.0299
20.0 41.048 0.380 0.0258
2 d d p (mm) d c p (mm) T max (°C) Δ T max   ( ° C ) W p   ( W )
4.56.540.645 0.469 0.0447
5.06.040.552 0.487 0.0432
5.55.540.486 0.501 0.0425
6.05.040.426 0.52 0.0422
6.54.540.383 0.528 0.0423
7.04.040.327 0.476 0.0441
7.53.540.307 0.427 0.0464
8.03.040.269 0.392 0.0501
3 d d p  = 8 mm
d c p (mm)
T max (°C) Δ T max (°C) W p   ( W )
1.540.060.266 0.0768
2.040.1660.302 0.0647
2.540.250.352 0.0563
3.040.2690.392 0.0501
3.540.3110.447 0.0457
4.040.3460.501 0.0426
4.540.3820.549 0.0400
5.040.4380.597 0.0383
4 d d p   = 8   mm ,   d c p  = 1.5 mm
d 1   = d 9 (mm)
T max (°C) Δ T max (°C) W p   ( W )
1.740.080.533 0.0866
1.939.9560.3 0.0844
2.139.8620.129 0.0831
2.239.840.066 0.0825
2.339.8560.083 0.0805
2.539.9070.193 0.0800
2.739.9670.225 0.0788
3.040.060.266 0.0768
Table 4. Safety analysis.
Ambient Temperature (°C)Discharge Rate
(C)
Results
T max (°C) Δ T max (°C) W p (W)
252.539.840.0660.0833
25342.9670.0670.0833
25449.0770.0640.0833
302.544.840.0660.0833
30347.9670.0670.0833
30454.0770.0640.0833
352.549.840.0660.0833
35352.9670.0670.0833
35459.0770.0640.0833
Disclaimer/Publisher’s Note: The statements, opinions and data contained in all publications are solely those of the individual author(s) and contributor(s) and not of MDPI and/or the editor(s). MDPI and/or the editor(s) disclaim responsibility for any injury to people or property resulting from any ideas, methods, instructions or products referred to in the content.