Article

Fluorinated Hollow Porous Carbon Spheres as High-Performance Cathode Material for Primary Battery

1
College of Chemistry, Fuzhou University, Fuzhou 350108, China
2
State Key Laboratory of Structural Chemistry, Fujian Institute of Research on the Structure of Matter, Chinese Academy of Sciences, Fuzhou 350002, China
3
Xiamen Key Laboratory of Rare Earth Photoelectric Functional Materials, Xiamen Institute of Rare Earth Materials, Haixi Institutes, Chinese Academy of Sciences, Xiamen 361021, China
*
Authors to whom correspondence should be addressed.
Batteries 2024, 10(9), 310; https://doi.org/10.3390/batteries10090310
Submission received: 24 July 2024 / Revised: 28 August 2024 / Accepted: 30 August 2024 / Published: 31 August 2024

Abstract

:
Fluorinated carbon cathode materials have extremely high theoretical specific energy among known cathode materials of lithium primary batteries. Nevertheless, current fluorinated carbon cannot meet the performance demands of future applications due to the rate performance. This work innovatively applies hollow carbon spheres with a porous structure as carbon sources to prepare fluorinated hollow porous carbon spheres (FHPCS) with high energy density and power density. The porous structure provides more reaction sites for the fluorination process and also shortens the diffusion path of lithium ions during the discharge. Additionally, the hollow porous structure offers more interfacial contact areas and reduces volumetric expansion during discharge reactions. The Li/CFx primary battery has a maximum specific energy of 2007 Wh kg−1 and a maximum power density of 30,400 W kg−1 and can have a capacity retention rate of 80.8% at a current density of 16 A g−1. In addition, FHPCS also has the highest specific energy of 1999 Wh kg−1 and 1711 Wh kg−1 in Na/CFx and K/CFx primary batteries, respectively. The diffusion efficiency of an alkali metal ion is analyzed by the different discharge depths with electrochemical impedance spectroscopy and galvanostatic intermittent titration technique. This effort introduces a new high-performance fluorinated carbon featuring a hollow porous structure and puts forward an innovative approach to designing fluorinated carbon materials.

1. Introduction

Fluorinated carbon is an interlayer compound in which carbon atoms form a type with fluorine atoms. It is obtained by grafting a F atom to the surface of a carbon material under certain conditions [1,2,3]. Since the Li/CFx batteries were commercialized in the 1970s because of their numerous advantages, including ultra-high theoretical specific energy, elevated discharge voltage, minimal annual self-discharge rate, broad operational temperature range, environmental friendliness, and non-toxicity, fluorinated carbon cathodes have garnered significant attention [4,5,6]. As the cathode material in Li/CFx batteries, fluorinated carbon boasts a remarkable theoretical energy density of 2180 Wh kg−1, outperforming traditional primary battery cathode materials like SOCl2, MnO2, and I2 [7,8]. Consequently, CFx materials have been used in extensive applications in the military, aviation, and medical sectors over the years, owing to their exceptional properties [9,10]. However, the CFx material has poor conductivity. It has a large polarization phenomenon when discharging, resulting in the CFx material being lower than its theoretical specific energy [11,12]. The advancing era prompts growth in energy demand, yet the current energy density and rate performance of CFx materials are insufficient to meet the rapidly growing production needs. Recent research has proposed multiple strategies to optimize the performance of CFx materials. Among the myriad strategies proposed for enhancing performance, modifying the carbon source structure has emerged as a particularly effective approach, demonstrating notable improvements in material properties.
The structural configuration of CFx materials is influenced by the architecture of the carbon source, wherein variations in particle dimensions and porosity dictate the reaction rate and ion diffusion process [13]. Yazami et al. were the first to fluoridate nanofibers as a carbon source for the CFx materials, attaining an elevated F/C ratio while simultaneously attaining high energy and power density in lithium primary batteries [14]. Yasser et al. prepared fluorinated nanosheets and fluorinated few-walled carbon nanotubes as positive electrode materials, with both exhibiting a specific capacity higher than their respective theoretical F/C ratios [15,16]. Subsequently, other carbon source materials, including biomass carbon [17], carbon nanohorns [18], and ketjenblack [19], exhibited good discharge properties after fluorination. This shows that the change in carbon source structure can affect the electrochemical properties of the materials. On this basis, Luo et al. prepared the fluorinated graphene microspheres, which have a good rate performance [10]. The porous structure affords a substantial enhancement in specific surface area, facilitates better electrochemical reaction contact, shortens the ion diffusion path, and improves the discharge-rate performance. Hu et al. prepared the fluorinated carbon spheres with a microporous structure, which exhibited excellent electrochemical performance and high specific energy [20]. The superior performance observed can be attributed to the abundant porosity within the material structure, which facilitates the uniform and isotropic diffusion of ions toward the active material. The pore structures also increase the specific surface area by providing more electrode reaction sites, thereby enhancing the overall electrochemical dynamics and significantly contributing to the material’s enhanced performance capabilities.
Due to lithium scarcity and rising prices, sodium and potassium, abundant and economical, are gradually gaining popularity. Since Na+ and K+ dissolve in solvents, their Stokes radius may change depending on solvent properties. The smaller Stokes radius of K+ compared to Na+ results in a more efficient diffusion process and accelerated reaction kinetics during the discharge phase [21]. Zhou et al. adopted fluorinated multi-wall carbon nanotubes with the F/C ratio of 0.81 as the positive electrode material of a lithium primary battery (LPB) and a sodium primary battery (SPB) [22]. At a current density of 10 mA g−1, the LPB cathode demonstrates a peak energy density of 2006 Wh kg−1, while the SPB cathode attains a maximum energy density of 1733 Wh kg−1, respectively, Wang et al. used fluorinated graphite as the positive electrode materials of LPB, SPB, and PPB (potassium primary battery). The maximum energy densities in LPB, SPB, and PPB are 1824 Wh kg−1, 1640 Wh kg−1, and 1869 Wh kg−1, respectively. The dissolution and recrystallization mechanisms of CFx cathodes during discharge are proposed [23]. Luo et al. synthesized accordion-like fluorinated graphite nanosheets and evaluated their performance in both SPB and PPB batteries. It exhibited a maximum energy density of 1960.5 Wh kg−1 in SPB and an even higher value of 2144.6 Wh kg−1 in PPB [24]. Despite advancements, notable disparities in energy and power densities persist between SPB/PPB and LPB batteries, as reported in the literature. Specifically, the performance exhibited by SPB and PPB falls short of fulfilling the stringent demands of high-power equipment, which require high-rate performance, highlighting the need for further improvements in these battery systems.
The electrochemical properties, specifically the voltage plateau and rate performance, of Li/CFx batteries are sensitive to variations in the type of C–F bond within the cathode material. Jiang et al. synthesized fluorinated ketjenblack with varying concentrations of semi-ionic C–F bonds, and it has been demonstrated that the incorporation of these bonds enhances both the discharge voltage plateau and the rate performance of the material [19]. The structural configuration of the carbon plays a pivotal role in determining the proportion of various C–F bond types that are generated during the fluorination process. The structure of the carbon source can influence the content of the different types of the C–F bonds produced during fluoridation. Yasser et al. prepared fluorinated DWCNTs, FWCNTs, and CNFs, and their study showed that the concentration of covalent C–F bonds increased with the increasing temperature. However, the presence of a high lattice curvature inhibited the formation of these covalent C–F bonds, leading to an increased abundance of sp2 hybridized carbon atoms, which facilitated the preferential formation of semi-ionic C–F bonds. This structural transformation was particularly advantageous for enhancing the electrical conductivity of the material, significantly improving its performance in electrochemical applications [15,16,25].
There are many methods for preparing porous carbon, among which the hard template method has attracted much attention due to its advantages of controllable morphology, pore size, and morphology. Pei et al. designed a kind of hollow carbon sphere using silica nanospheres as templates and polybenzoxazine as a precursor system. The silica nanospheres used in this method are not easy to prepare as templates and cannot be prepared in large quantities [26]. Xia et al. adopted poly tetraffuoroethylene and SiO2 nanospheres mixed and reacted at a high temperature under Ar atmosphere. The method is simple to operate but not easy to produce on a large scale [27].
In this work, hollow porous carbon spheres (HPCS) were prepared by the template method and used as a carbon source for fluorination. HPCS has a cavity structure and abundant pores in carbon, which offer an abundance of potential reactive sites that are conducive to efficient fluorination. The fluorinated hollow porous carbon spheres (FHPCS), when employed in LPB systems, demonstrate a remarkable specific capacity of 780 mA h g−1 at a current density of 8 mA g−1. The electrode material, with its distinctive hollow porous architecture, facilitates efficient ion diffusion across its surface, resulting in superior rate performance and a peak power density of up to 30,400 W kg−1, while retaining 80.8% capacity at a current density of 16 A g−1. This underscores the material’s potential for high-performance energy-storage applications. In addition, FHPCS still has good performance in other alkali metal batteries. The SPB exhibits impressive performance characteristics, including a specific capacity of 910 mA h g−1 and a maximum specific energy of 1999 Wh kg−1. Furthermore, it achieves a peak power density of 1073 W kg−1, highlighting its viability for energy-storage applications requiring high energy density. The PPB displays a notable specific capacity of 694 mA h g−1 and attains a substantial maximum specific energy of 1771 Wh kg−1. Additionally, it achieves a remarkable peak power density of 4440 W kg−1. Therefore, the prepared FHPCS not only has good rate performance in alkali metal batteries but also exhibits promising capabilities for energy-storage applications requiring both a high energy density and a high power output.

2. Materials and Methods

2.1. Materials Preparation

For the preparation of hollow porous carbon spheres (HPCS) [28], first, stir 3 mL ammonia (Sinopharm Chemical Reagent Co., Ltd., Shanghai, China, 25~28%), 70 mL ethanol (Sinopharm Chemical Reagent Co., Ltd., 99.7%), and 10 mL deionized water at room temperature for 10 min and add 3.5 mL tetraethylorthosilicate (TPOS, Adamas, Milos, Greece, 98%) and dissolve 0.4 g resorcinol (Sinopharm Chemical Reagent Co., Ltd., 99.5%) into 3 mL ethanol. After 15 min, the prepared resorcinol–ethanol solution and 0.56 mL formaldehyde (Sinopharm Chemical Reagent Co., Ltd., 37~40%) solution were added and kept stirring at 30 °C for 24 h. The SiO2/SiO2@RF was collected by centrifugation and cleaned with ethanol and deionized water several times. After vacuum drying at 60 °C, the intermediate product was carbonized at 700 °C in Ar atmosphere for 4 h to obtain SiO2/SiO2@C. After the SiO2 template was removed with 15% HF (Greagent, 40%) solution, the HPCS was collected by centrifugation.
For the preparation of fluorinated hollow porous carbon sphere (FHPCS), by attempting the possible effect experimental conditions including fluorination pressure (0.25 MPa and 0.5 MPa), fluorination temperature (200 °C and 400 °C) and fluorination time (24 h and 36 h), the optimal fluorination conditions were determined. The fluorination process involved placing the HPCS sample in a Ni reactor and subjecting it to fluorination with a mixture of F2 and N2 for 24 h at 400 °C and 0.25 MPa. The resulting product was labeled as FHPCS.

2.2. Materials Characterization

The morphological and microstructural characterizations of the materials under investigation were conducted utilizing advanced imaging techniques. Specifically, field-emission transmission electron microscopy (FETEM), employing the JEOL JEM-F200 instrument, and field-emission scanning electron microscopy (FESEM), utilizing the Apreo S LoVac system (Thermo Corporation, Waltham, MA, USA) were used. The crystalline configuration of the sample was meticulously examined using an X-ray diffractometer of the Miniflex 600 model (Rigaku, Tykyo, Japan) which was equipped with a Cu Kα radiation source. The operational parameters were set to λ = 1.5406 Å, 40 kV, and 15 mA, ensuring high precision and accuracy in the analysis of the lattice structure. Chemical-bonding investigations were conducted via Fourier-transform infrared spectroscopy (Nicolet iS 50, Thermo Corporation), while Raman sp, ectroscopic analysis was conducted utilizing the LabRAM HR Evolution instrument (Horiba, Kyoto, Japan), equipped with a laser source operating at a wavelength of 325 nm. The measurement was executed over a wavenumber span of 100–3000 cm−1. X-ray photoelectron spectroscopy (XPS) measurements were conducted utilizing a state-of-the-art Thermo Scientific (Thermo Corporation, Waltham, MA, USA) K-Alpha analyzer, which featured a monochromated Al Kα source. Preceding the acquisition of N2 adsorption–desorption isotherms on the Autosorb-iQ2-MP gas-adsorption analyzer (Quantachrome Instruments, Boynton Beach, FL, USA), the sample underwent rigorous degassing procedures at an elevated temperature of 150 °C. This process was maintained until a residual pressure of 2 mm Hg (equivalent to 267 Pa) was achieved, ensuring the removal of any adsorbed contaminants or gases. Subsequently, the specific surface area of the sample was quantitatively determined employing the well-established Brunauer–Emmett–Taylor (BET) methodology.

2.3. Electrochemical Measurements

The cathode was prepared by spreading a slurry of FHPCS (80 wt.%), conductive carbon black (10 wt.%), and carboxymethyl cellulose sodium (CMC, 10 wt.%) in deionized water onto Al foil. The electrodes were dried in a vacuum oven at 80 °C overnight to remove the solvent and were cut into 14 mm small disks. The loading capacity of the active substance is about 0.85 mg cm−2. The button batteries (CR2016) use lithium metal as the negative electrode of the battery, 1.0 M LiFSI in propylene carbonate (PC) and dimethoxyethane (DME) (1:1 vol.%) as the electrolyte, and Celgard 2500 as the separator. The button batteries (CR2025) use sodium and potassium metal as the negative electrode of the battery, 1.0 M NaPF6 in PC and ethylene carbonate (EC) (1:1 vol.%), and 1.0 M KPF6 in EC and diethyl carbonate (DEC) (1:1 vol.%) as the electrolyte, and glass microfiber filters as the separator. The button batteries were assembled in an argon-filled glovebox (H2O < 0.01 ppm, O2 < 0.01 ppm) and discharged on the MIHW-200-160CH (Neware Electronics Co., Shenzhen, China) battery testing system at a temperature of 25 °C. The cut-off voltage is set at 1.5 V. The electrochemical impedance spectroscopy (EIS) was performed by a CHI760E electrochemical workstation (Chenhua Instrument Co., Shanghai, China), with a frequency span from 100 kHz to 0.01 Hz, with the amplitude set at 5 mV. For the galvanostatic intermittent titration technique (GITT), the battery was discharged at a current density of 20 mA g−1 for a duration of 10 min, subsequently followed by a relaxation period of 50 min.

3. Results and Discussion

3.1. Structural and Physicochemical Properties of FHPCS

Using the Stöber method, SiO2 microspheres were synthesized. Subsequently, phenolic resin microspheres were synthesized from these SiO2 microspheres as templates. Finally, the HPCS was prepared by carbonization and HF removal of the SiO2 templates. The fluorination of HPCS was accomplished through exposure to a gaseous mixture of F2 and N2 at a temperature of 400 °C for a duration of 24 h. The process of synthesizing FHPCS is shown in Figure 1a.
The scanning electron microscope (SEM) image of hollow carbon porous spheres (HPCS) reveals a distinctly spherical morphology characterized by a roughened surface. As shown in Figure 1b, the diameters of these carbon spheres range from 250 to 400 nm. And Figure S1a shows that the diameter of the carbon spheres exhibits a relatively uniform distribution and randomly distributed structure and that the structure appears randomly distributed. Additionally, the presence of broken carbon spheres within the image allows for the judgment that they possess a hollow structure. The accompanying transmission electron microscope (TEM) image (Figure 1c) further confirms that these carbon spheres indeed have a hollow structure characterized by a cavity with a diameter of approximately 200 nm and a shell thickness of 50 nm, thereby confirming their porous and hollow nature. The surface of the carbon sphere exhibits a distinct pore structure, as demonstrated by the analysis. Additionally, the high-resolution transmission electron microscopy (HRTEM) image (Figure 1d) uncovers a mesoporous shell configuration, featuring radially aligned open channels that further underscore its porous nature. The inset of Figure 1d shows a disordered structure, and the diffraction ring in the corresponding selected area of electron diffraction patterns (SAED, Figure S2a) also reflects that HPCS is amorphous. Furthermore, the analysis (Figure 1e) shows that only C and O elements are distributed on the surface of the material. Upon fluorination, the uniform distribution of the F element across the material’s surface, as depicted in Figure 1i, signifies the successful achievement of fluorination. Concurrently, the SEM image (Figure 1f) reveals that, despite the preservation of the spherical morphology, the average diameter of the fluorinated carbon spheres undergoes a notable reduction under the influence of the elevated fluorination temperature. The SEM with low multiples (Figure S1b) shows that some spherical structures were destroyed during fluorination. During the fluorination process, fluorine gas initially reacts with surface carbon atoms on the carbon sphere, then diffuses into their cavities, and continues to react with carbon atoms within the carbon shells. This sequential reaction enables a higher degree of fluorination to be achieved, thereby enhancing the properties of the material. The TEM images of the prepared FHPCS (Figure 1g) show that the pore structure of the surface disappears. The corresponding HRTEM images (Figure 1h) demonstrate a reduction in the thickness of the carbon shell, accompanied by the absence of pore structures that were previously visible on its surface. This observation validates the intense reactivity of fluorine gas with carbon atoms within the shell, resulting in the disruption of the original porous architecture.
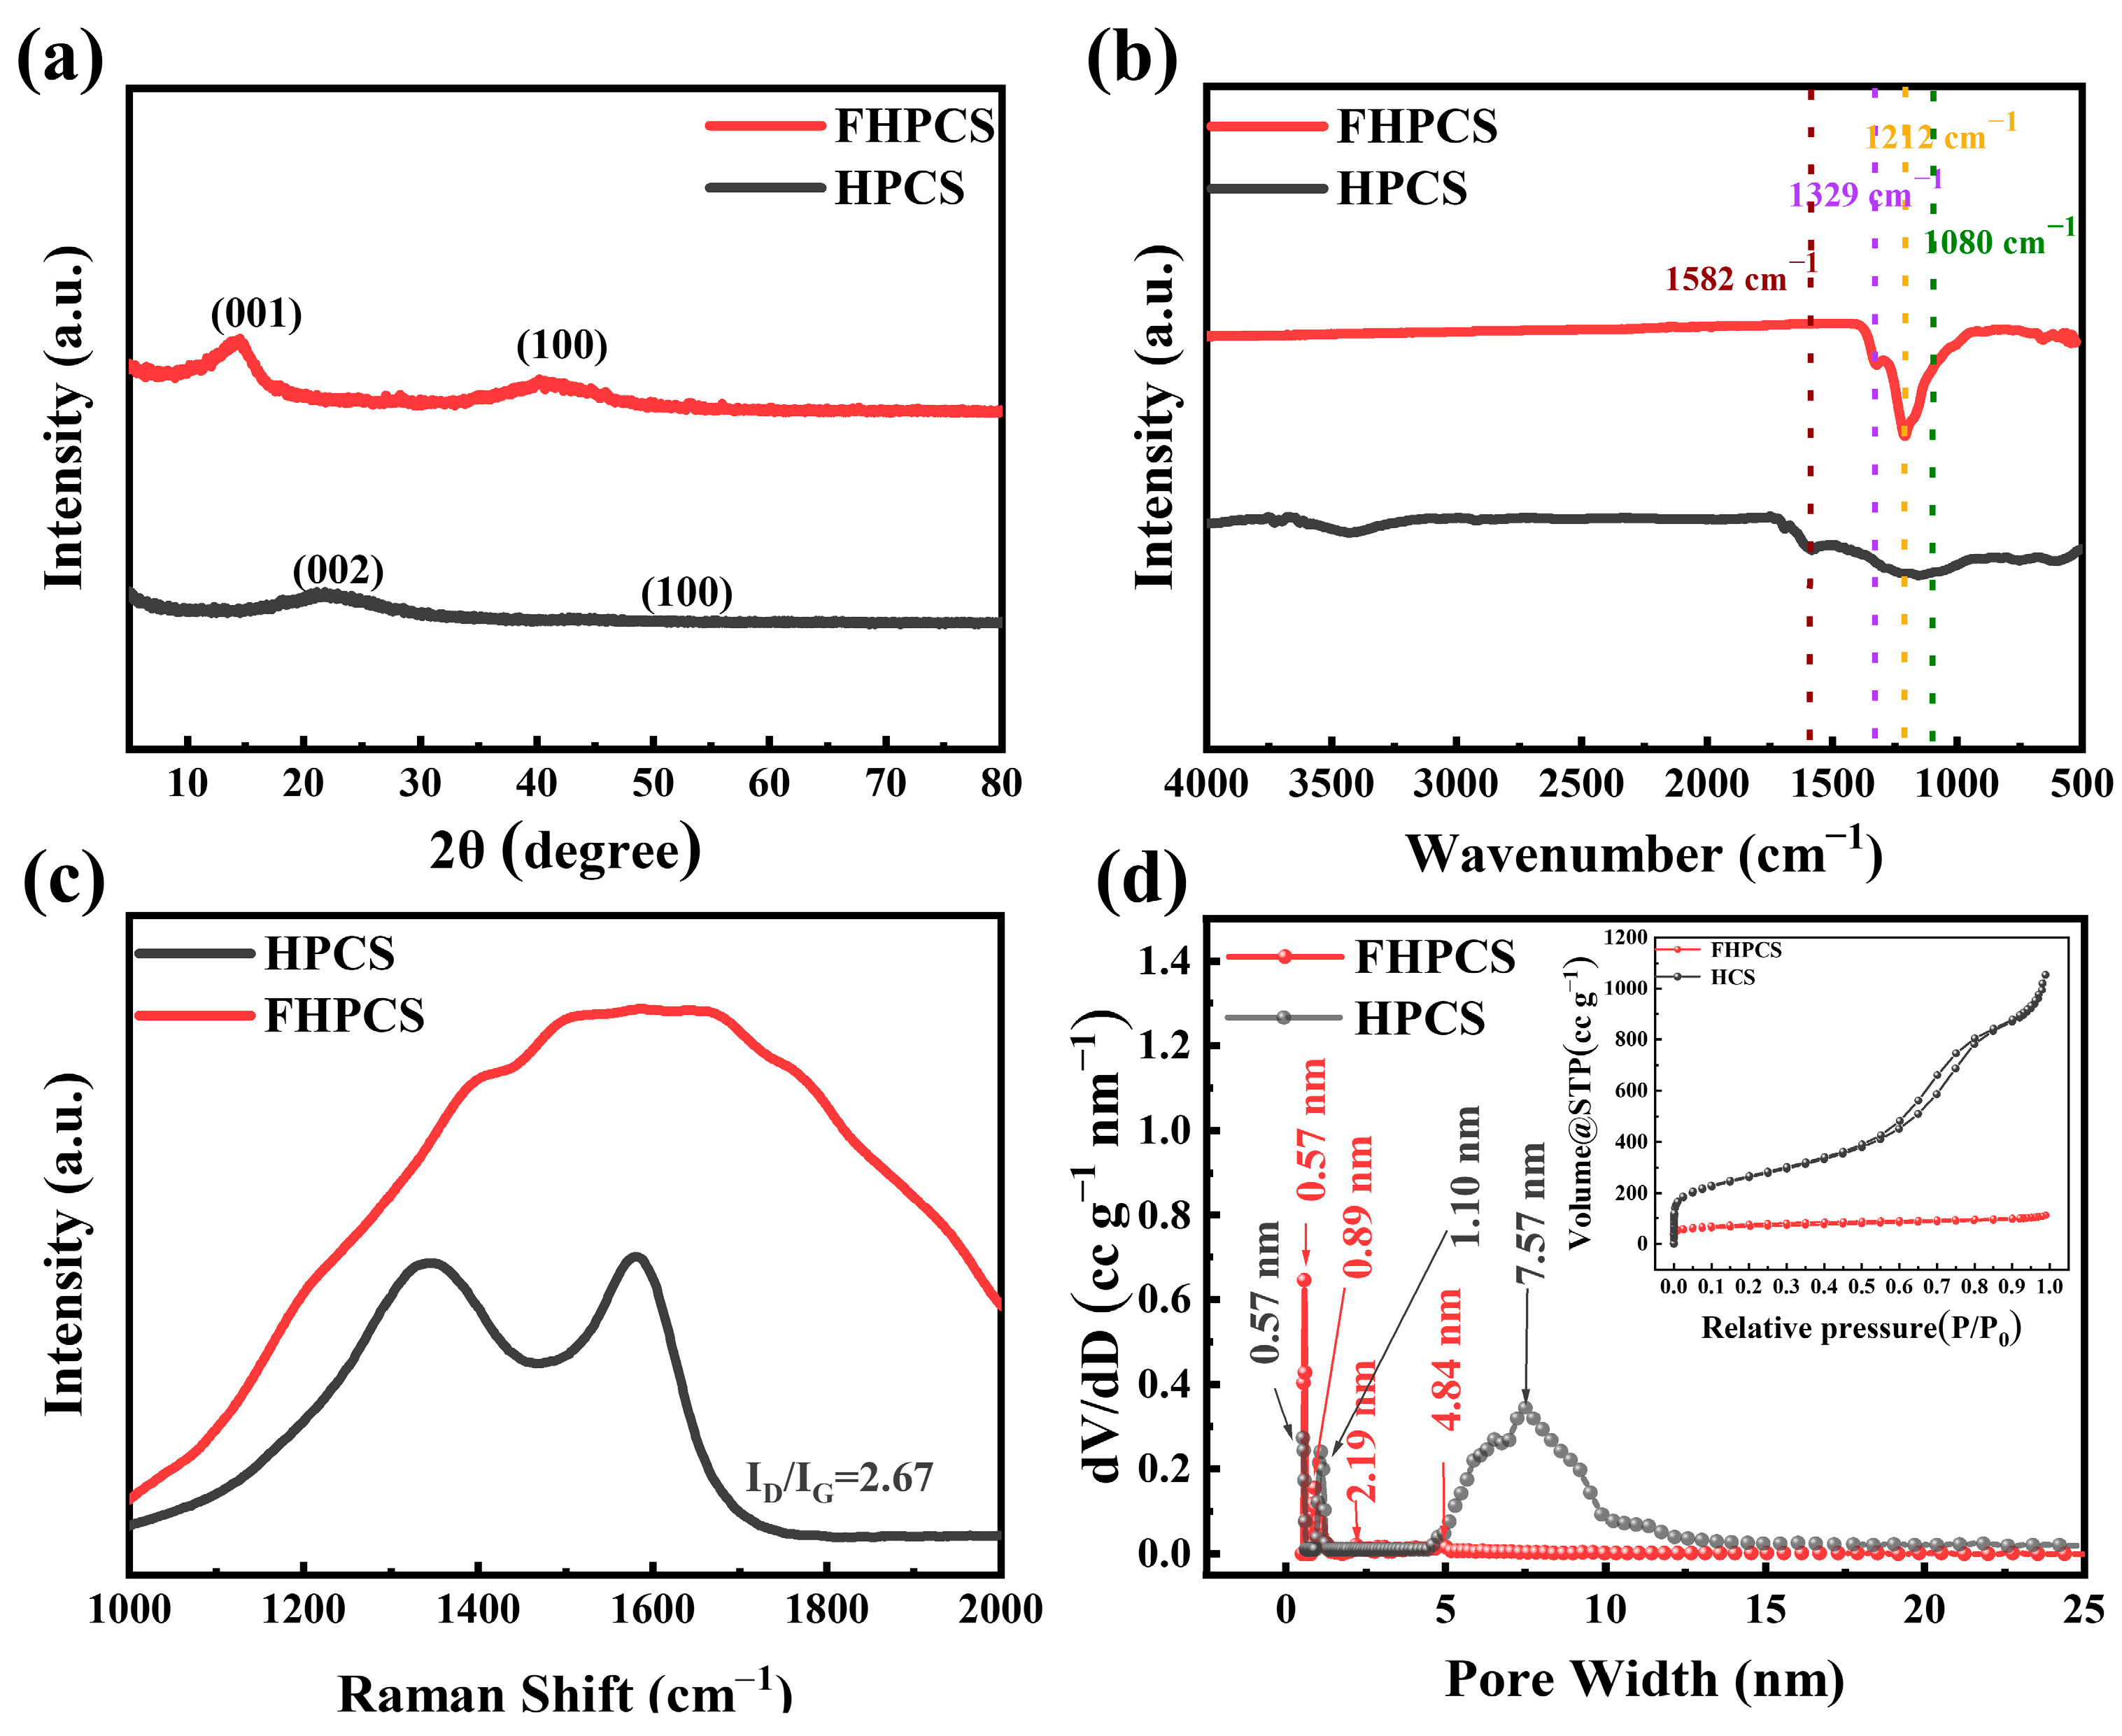
The X-ray diffraction (XRD) patterns (Figure 2a) of both the HPCS and FHPCS reveal two broad peaks centered at the 2θ values of 21.1° and 42.8°, respectively. These peaks correspond to the (002) and (100) crystal planes, which align with the characteristic diffraction peaks typically observed in hard carbon materials, thereby confirming their structural similarities [29,30]. The XRD analysis of the FHPCS exhibits two prominent broad peaks positioned near the 2θ angles of 14.1° and 41.1°, respectively. These peaks are attributed to the (001) and (100) crystal planes of CFx compounds, indicating the formation of fluorinated carbon structures within the material [31]. Utilizing the Bragg equation, the interplanar spacings for HPCS and FHPCS are calculated to be 0.421 nm and 0.628 nm, respectively. The crystal face spacing increases after fluorination, which indicates that F2 diffuses into the graphene matrix during fluorination and the insertion of the F atom enlarges the layer spacing of FHPCS.
To gain further insights into the chemical structure of both HPCS and FHPCS, Fourier-transform infrared (FTIR) spectroscopy was employed. The corresponding FTIR spectra, presented in Figure 2b, reveal two notable absorption peaks for the HPCS, located approximately at 1162 cm−1 and 1582 cm−1. These peaks are attributed to the stretching vibrations of C–O and C=O bonds, respectively, indicating the presence of oxygen-containing functional groups within the material [32]. Upon fluorination, the disappearance of the absorption peaks corresponding to oxygen-containing functional groups is observed, indicating the substitution of oxygen atoms by fluorine atoms during the fluoridation process. In the FTIR spectrum of FHPCS, two prominent peaks are observed, located approximately at 1080 cm−1 and 1212 cm−1, and are assigned to the stretching vibrations of semi-ionic C–F and covalent C–F bonds, respectively. Additionally, the peak at 1329 cm−1 is attributed to the asymmetric stretching vibration band of the CF2 and CF3 groups, further confirming the successful fluorination and the presence of fluorinated bonds within the material [33].
The Raman spectrum of HPCS and FHPCS (Figure 2c) are used to investigate the defective structures of the sample. The spectrum of the HPCS exhibits two distinct peaks. The first peak, located at 1350 cm−1, is indicative of the presence of lattice defects within the material, while the second peak at 1580 cm−1 corresponds to the vibrational mode associated with crystalline graphite structures [20,34]. The ratio of the intensities of the two aforementioned peaks, typically denoted as ID/IG, functions as a quantitative measure to evaluate the extent of disorder within the carbon material. However, owing to the pronounced fluorescence properties of FHPCS, no clear Raman peaks are discernible in its corresponding spectra.
The pore-size distributions of both HPCS and FHPCS were investigated using the N2 adsorption–desorption technique. The adsorption–desorption curve of the HPCS, as shown in the inset of Figure 2d, conforms to type-IV isotherm, characterized by a rapid rise at low pressures, saturated adsorption platforms, and a hysteresis loop. It is further determined that the hysteresis loop of HPCS corresponds to type H1 of type IV adsorption isotherm, indicating that the pore-size structure consists of cylindrical holes with a uniform diameter distribution throughout. The corresponding aperture distribution (Figure 2d) further confirms that HPCS has a micropore structure, and further verifies that the microporous structure of carbon spheres is consistent with the TEM results. Upon fluorination, the adsorption–desorption isotherm of FHPCS retains a characteristic type IV profile, accompanied by a type H4 hysteresis loop. This observation underscores the persistence of the microporous architecture within the material, while simultaneously revealing alterations in the pore-size distribution. These modifications suggest that the pore-size structure undergoes etching by fluorine gas during the fluorination process, resulting in a transformation of the pore structure [35].
The chemical composition and surface functionalization of FHPCS were characterized utilizing X-ray photoelectron spectroscopy (XPS). The XPS survey spectrum (Figure S3a) and high-resolution C1s spectrum (Figure S3b) of HPCS indicated the C–C and C–O bonds. As shown in Figure 3a, after fluoridation, a distinct F1 peak is shown at about 690 eV, which serves as definitive evidence for the successful fluorination of the sample surface. Using the elemental composition analysis, the molar ratio of fluorine to carbon (F/C ratio) in FHPCS has been calculated to be 1.33. The high-resolution C1s spectra of FHPCS, presented in Figure 3b, distinctly show peaks at 284.8 eV and 286.0 eV, which are assigned to the C=C and C–C bonds, respectively. Additionally, within the energy range of 289.0 eV to 292.0 eV, three discernible peaks are observed, which are attributed to semi-ionic C–F, covalent C–F, –CF2, and –CF3 bonds. The absence of oxygen-bearing functional groups within FHPCS is confirmed, aligning with the conclusions drawn from FTIR spectroscopy.
Table S3 lists the content of each peak in the C1s spectrum. The percentage of semi-ionic C–F is 7.06%, so FHPCS has better conductivity and excellent rate performance. The high-resolution F1 spectrum of FHPCS, as depicted in Figure 3c, exhibits a spectral profile that can be deconvoluted into three distinct peaks. These peaks are attributed to, respectively, the semi-ionic C–F bond, the covalent C–F bond, and a composite peak that encompasses contributions from both the –CF2 and –CF3 groups [18,20,36].

3.2. Electrochemical Properties of FHPCS

The FHPCS sample was prepared into the positive electrode material of a lithium primary battery (LPB). The discharge mechanism in LPB is elaborated as outlined below [37]:
CF x + x Li + + e = C + x LiF
The discharge curves of the FHPCS electrode at different current densities are shown in Figure 4a. Additionally, Figure 4b presents the specific capacity and energy of the battery at varying discharge-current densities. As the current density increases, the specific capacity and the discharge potential plateau of the LPB exhibit a noticeable decline. The LPB exhibits optimal electrochemical performance in terms of specific capacity, achieving a notable capacity of 780 mA h g−1 and a specific energy of 2007 Wh kg−1 at a low current density of 8 mA g−1. The FHPCS cathode material, on the other hand, maintains a substantial discharge specific capacity of 631 mA h g−1, even at a higher current density of 16 A g−1, with a capacity retention rate of 80.8%. This high capacity retention rate may be attributed to the microporous structure present on the surface of FHPCS, which offers an abundance of reaction sites and a rich pore structure that facilitates ion transport and enhances electrochemical performance [38]. The exceptional performance characteristics of the FHPCS cathode materials can be attributed to the strategic design of its hollow spherical and microporous architectures, coupled with the presence of semi-ionic C–F bonds, which are effectively introduced through low-temperature fluorination techniques. This combination of structural and chemical attributes synergistically enhances their overall properties [18]. The presence of a microporous structure within the FHPCS cathode materials offers an efficient and continuous pathway for the fast diffusion of Li+, thereby facilitating enhanced electrochemical kinetics. Furthermore, the cavities can provide more reaction sites and accommodate a greater number of Li+.
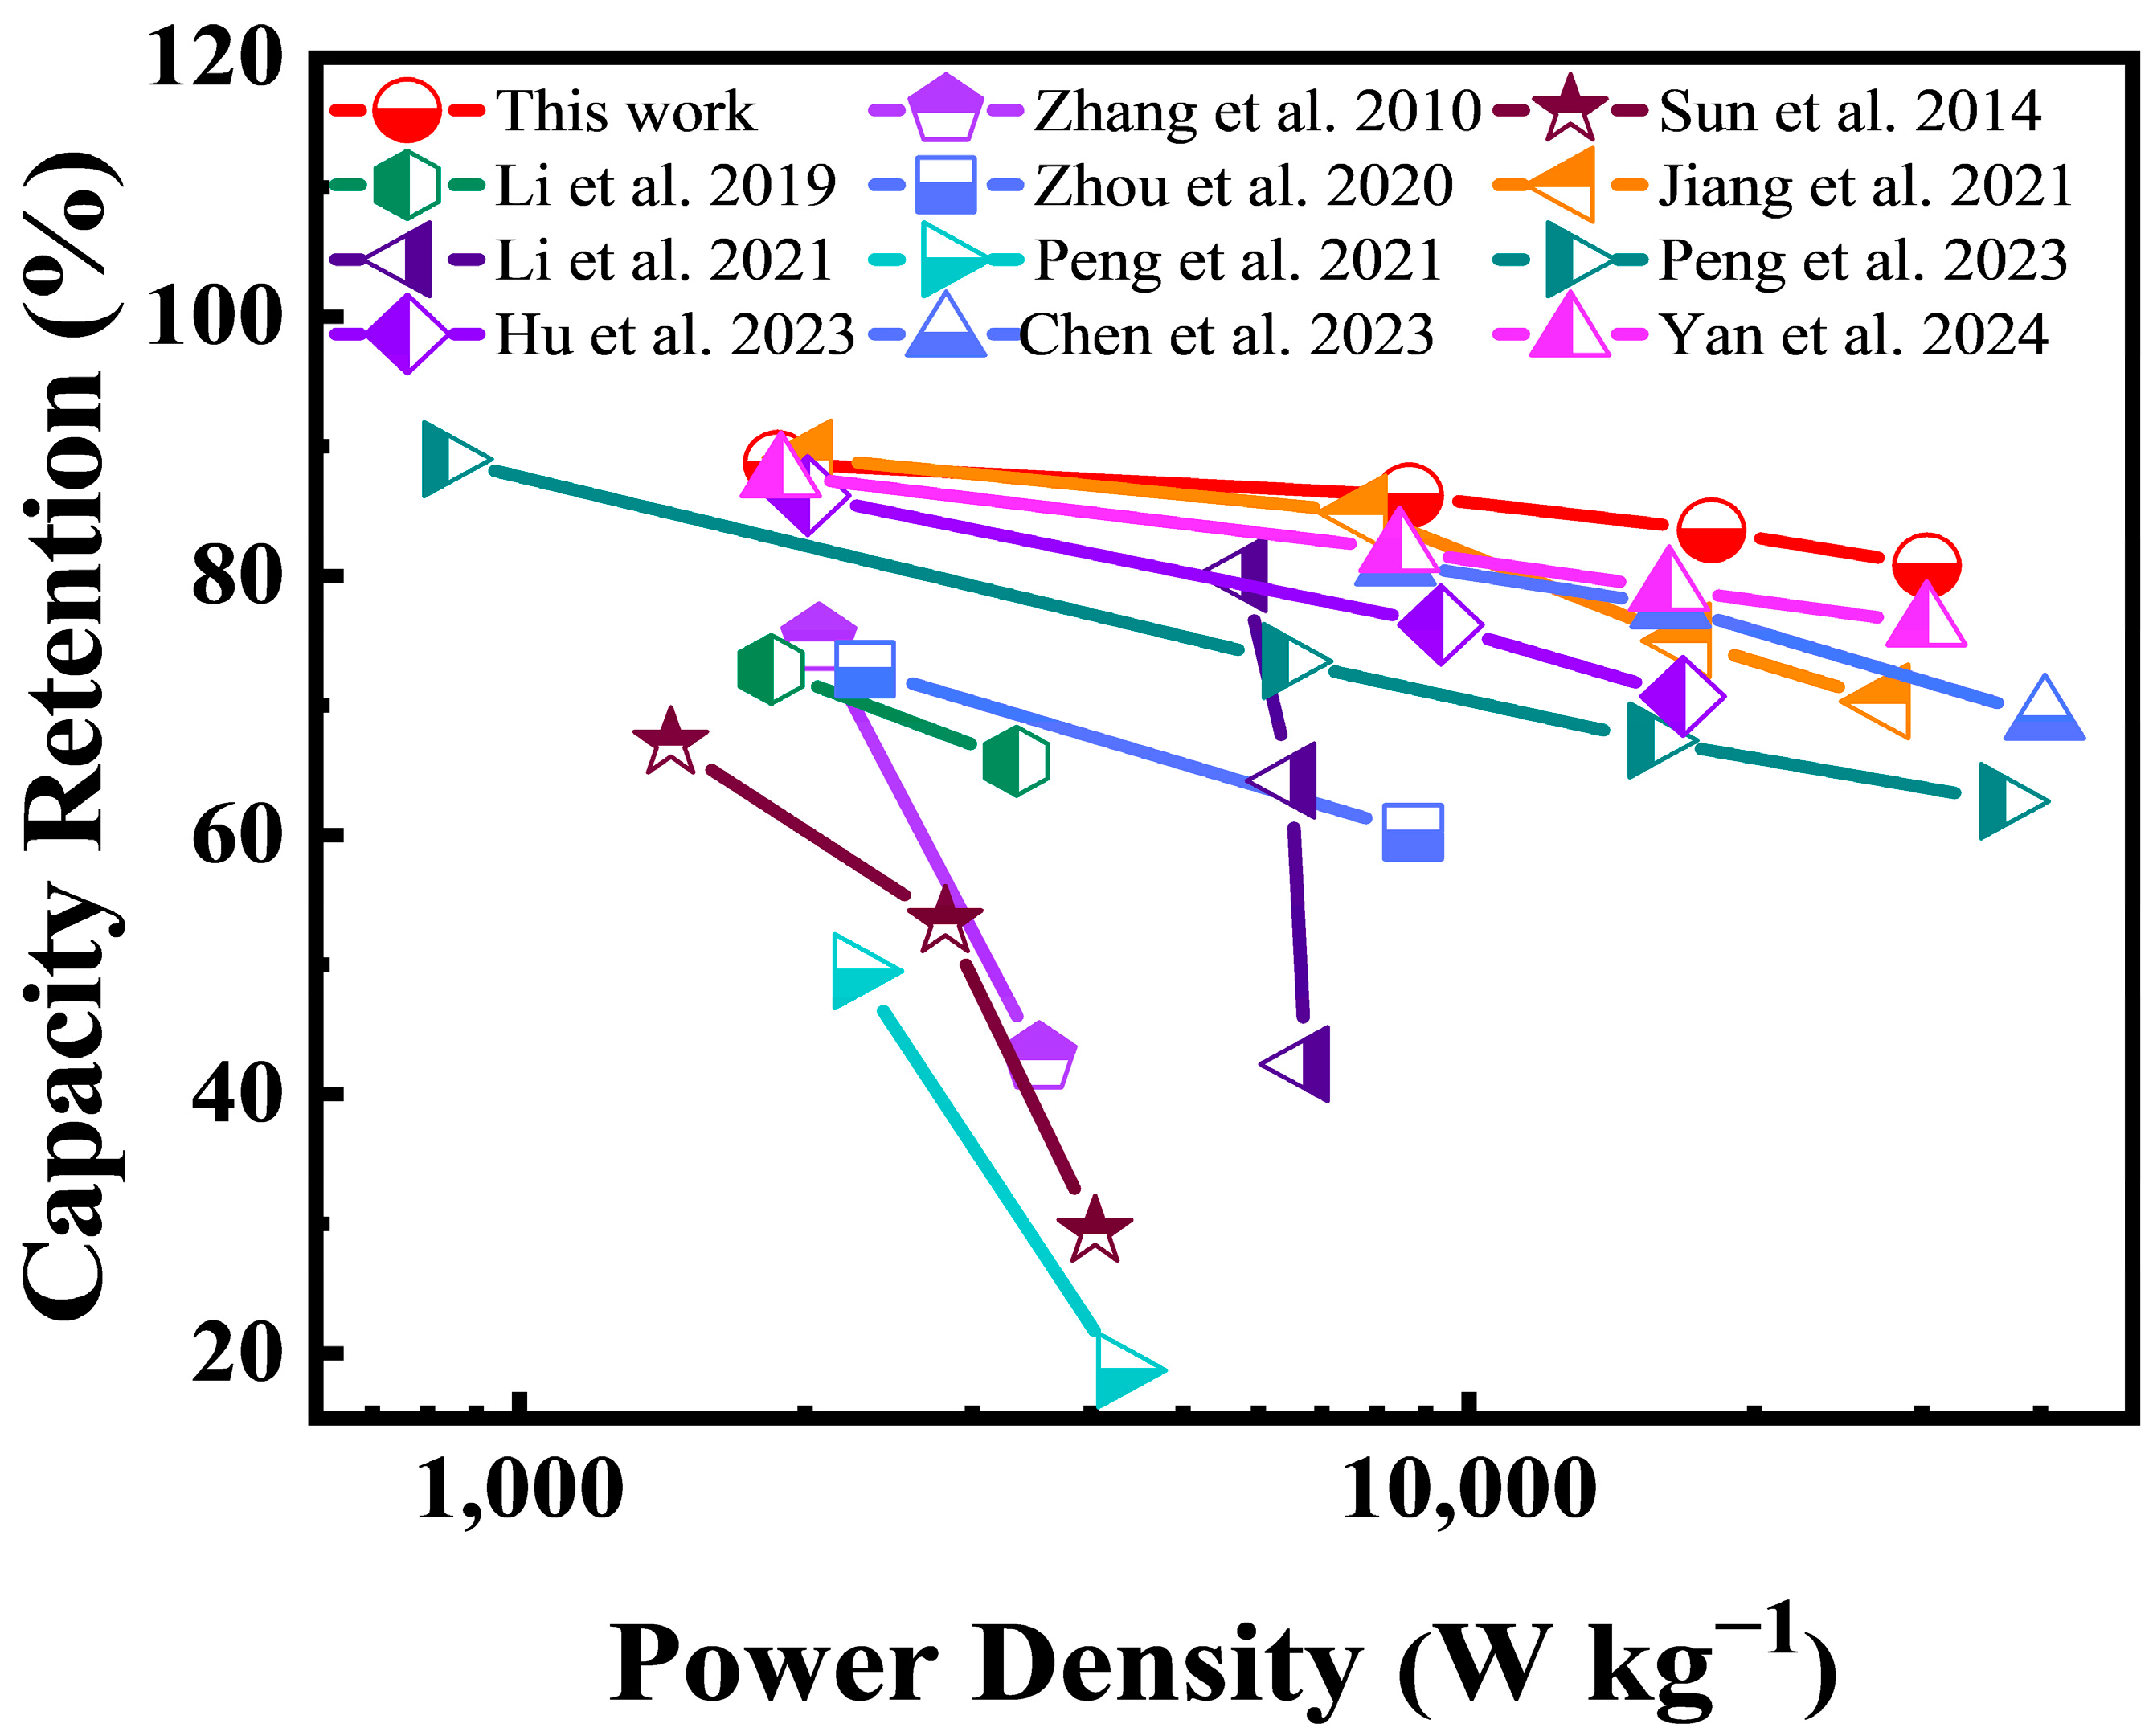
The performance comparison between the FHPCS and CFx prepared in the literature is shown in Figure 5 [18,19,20,22,36,37,38,39,40,41,42]. For most of these materials, the capacity retention rate decreases as the power density increases. Compared with other CFx that had been reported, FHPCS not only has high power density but also a lower capacity loss under high power conditions. Therefore, FHPCS is promising in energy-storage applications that require both high energy density and high power output. The exceptional rate capability and capacity retention exhibited by the material can be attributed primarily to its unique hollow porous architecture. This structural feature can not only increase the electrochemical reaction point but also make the reaction product LiF evenly distributed on the surface of the material, reducing the influence of LiF on ion diffusion. Hence, FHPCS has faster ion diffusion dynamics and better electrochemical performance.
Employing the galvanostatic intermittent titration technique (GITT) to quantify the diffusion coefficient of Li+ ( D Li + ), the study reveals the exceptional rate capability exhibited by the FHPCS positive electrode. According to the GITT discharge curve of the positive electrode of FHPCS (Figure 4d), its D Li + is calculated, and the formula is as follows [23]:
D M + = 4 π I 0 V m S F Z i 2 d E / d x d E / d τ 1 2 2   τ     L 2 D M +
As the discharge process progresses, the variation trend of D Li + is shown in Figure 4d. At the onset of discharge, the inherently low conductivity of the CFx material results in a Li+ diffusion coefficient ( D Li + ) within the range of 10−13 to 10−14 cm2 S−1.
During the discharge process, when the voltage falls within the range of 2.6 V to 2.2 V, the subsequent reduction of CFx into conductive carbon leads to a notable enhancement in the material’s conductivity. Consequently, the D Li + gradually escalates and eventually stabilizes at approximately 10−12 cm2 S−1 when the voltage reaches 2.0 V. At the voltage of 2.0 V to 1.6 V, D Li + does not decrease due to the accumulation of LiF crystals with poor conductivity, which indicates that FHPCS can make the LiF crystals produced by the reaction evenly distributed in the cavity structure of the material so that the crystal LiF does not affect the diffusion of Li+ to the electrode [10].
To investigate the interfacial dynamics of the synthesized FHPCS cathode material throughout the reaction sequence, electrochemical impedance spectroscopy (EIS) measurements were conducted at a current density of 80 mA g−1, with a focus on the varying discharge depths. The Nyquist diagram of FHPCS cathode materials with different discharge depths is shown in the inset of Figure S5a, which exhibits a semicircular arc in the high-frequency region and a linear trend in the low-frequency domain, reflecting charge transfer and ion diffusion dynamics, respectively. Based on the equivalent circuit model depicted in the inset of Figure S5a, the components Rs, Rct, W0, and CPE are assigned to represent the ohmic resistance, charge-transfer resistance, Warburg impedance, and double-layer capacitance, respectively.
The evolution of Rs and Rct as a function of varying discharge depths is shown in Figure 4e. The small variation of Rs is related to the manufacturing process of the battery, while the value of Rct gradually increases at the initial stage of discharge and becomes stable when the discharge depth reaches 30%. The increase in Rct at the initial stage of discharge is attributed to the accumulation of LiF crystals, which have poor conductivity. Furthermore, the accumulation of conductive carbon during discharge can effectively mitigate the impact of LiF crystals on the Rct value [19]. To delve deeper into the kinetics of the electrode–electrolyte interface, the electrochemical impedance data corresponding to various discharge depths were subjected to further analysis using the distribution of the relaxation time (DRT) plot. The DRT contour map (Figure 4f) reveals a response at a time scale of 1–10 s ( 0     log   ( τ )     1 ), a range that corresponds to the charge-transfer process [43]. At the initial stage of the discharge reaction, the strongest intensity exists, the intensity is at its strongest, and the intensity gradually diminishes, ultimately reaching a plateau at the discharge depth of approximate 30%. This indicates the stabilization of the underlying electrochemical processes, which is in line with the above conclusion.
In order to evaluate the performance of the synthesized FHPCS material in diverse alkali metal battery systems, FHPCS samples were processed into sodium primary battery (SPB) and potassium primary battery (PPB) configurations. Subsequently, the discharge mechanism in SPB was examined, which proceeds as follows [22]:
CF x + x Na + + e = C + x Na
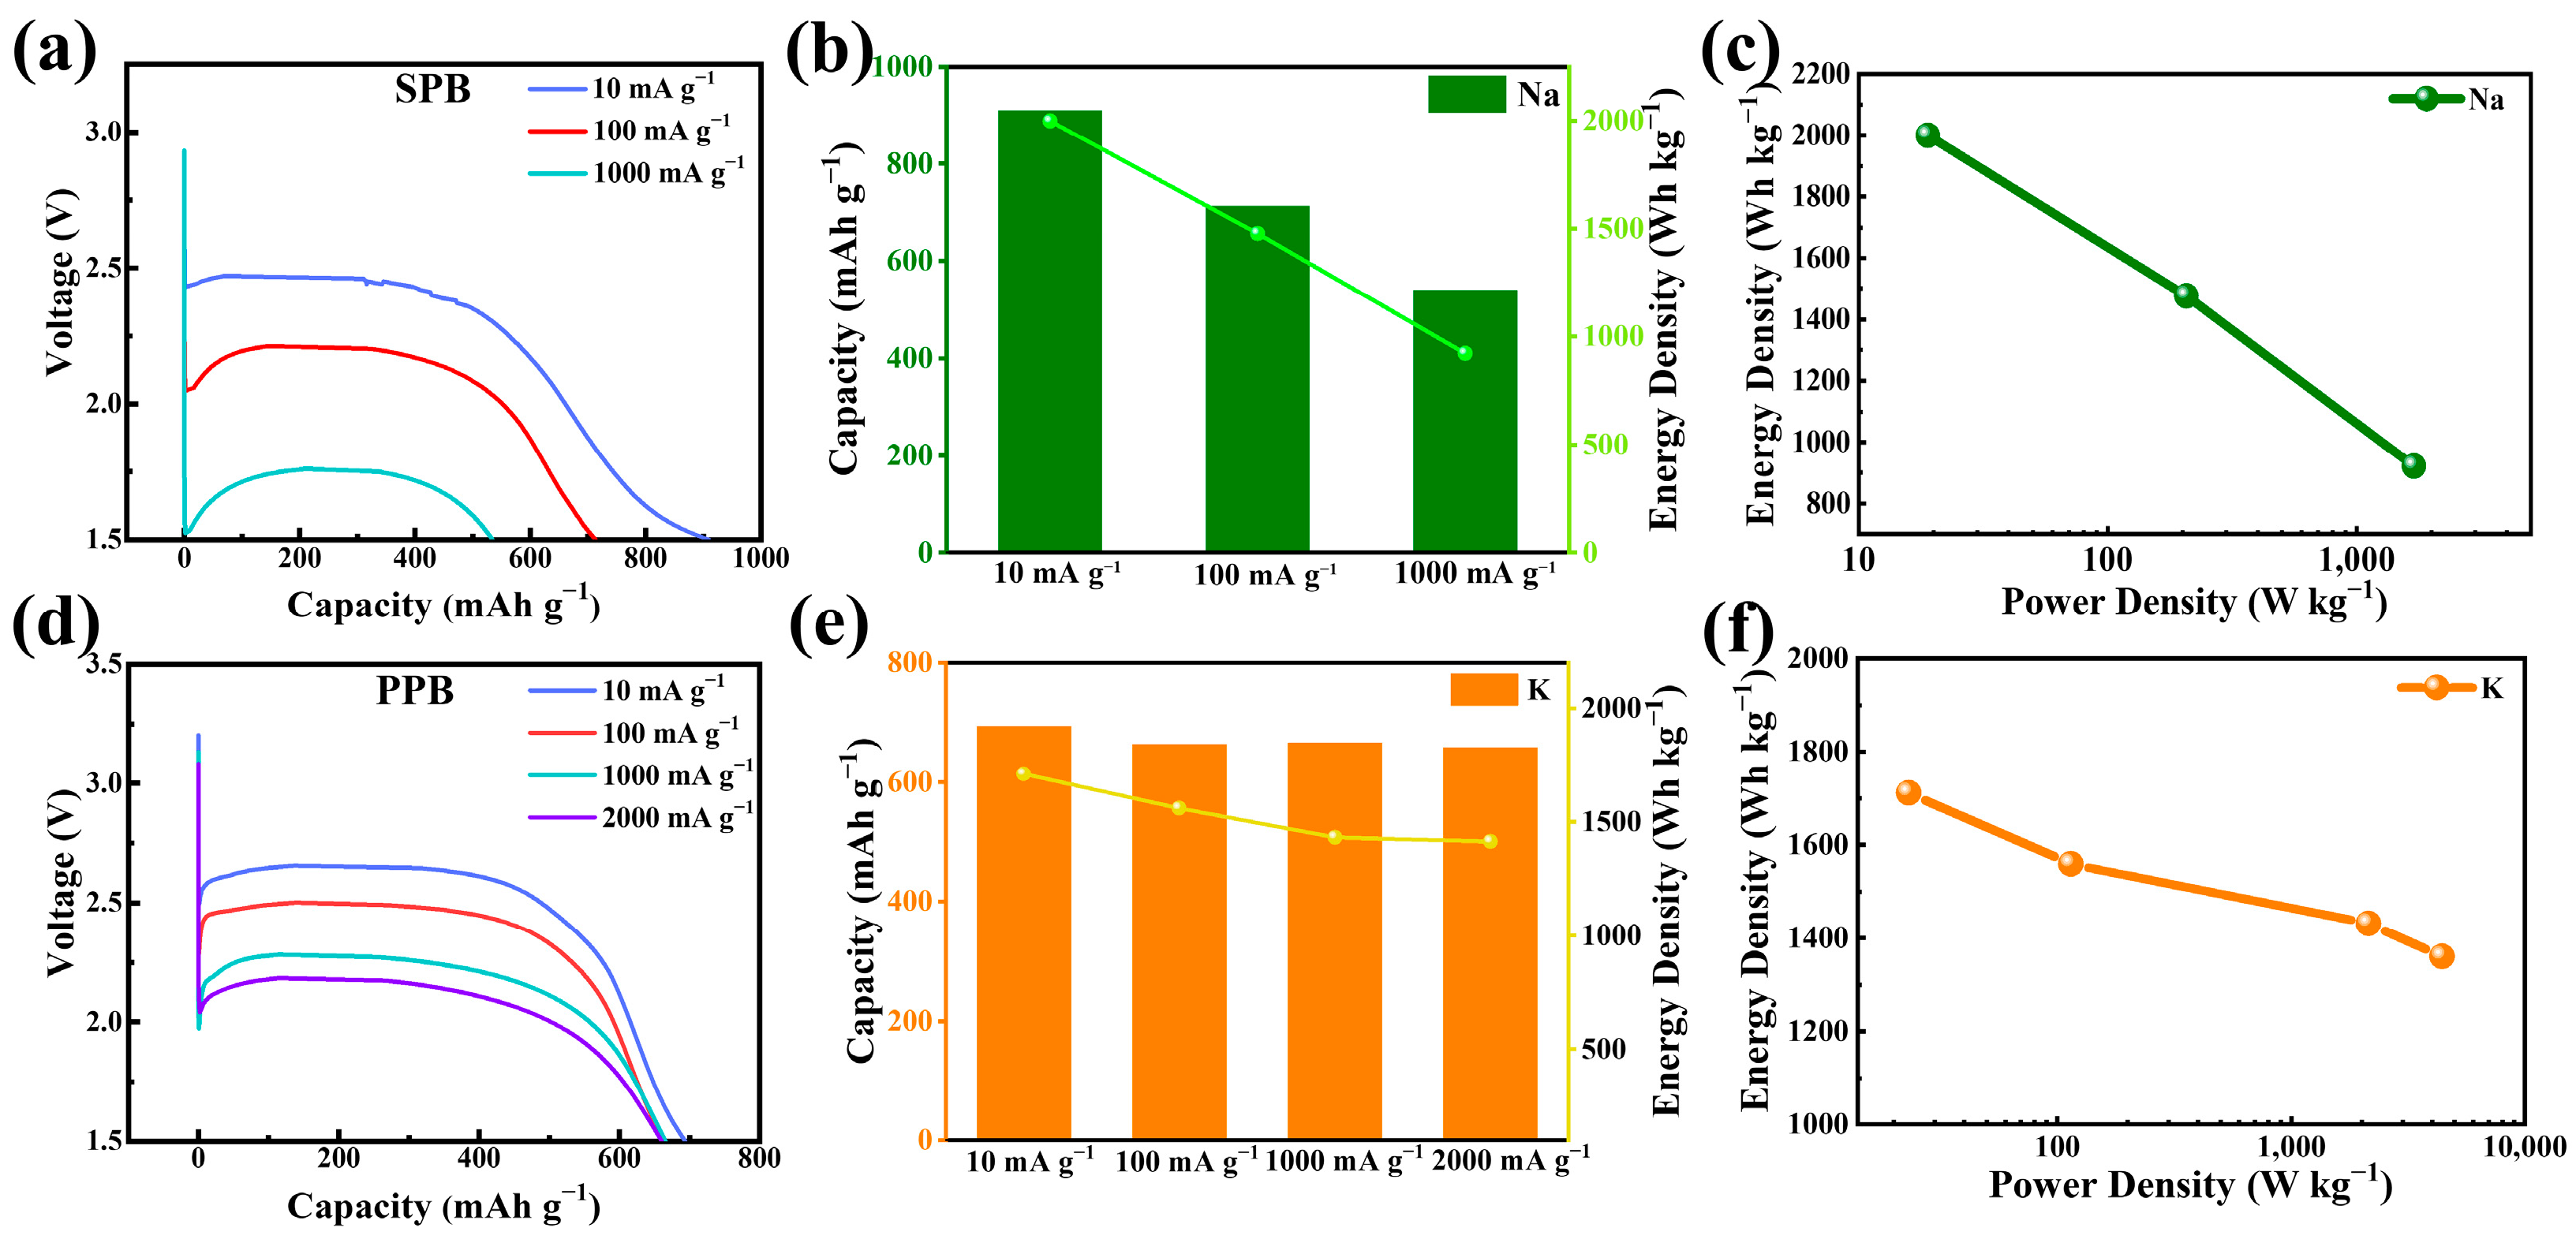
The discharge curve of the FHPCS cathode in the SPB is underscored by Figure 6a, which shows an exceptional electrochemical performance. As evident from Figure 6b, the battery delivers an impressive specific capacity of 910 mA h g−1 at a modest current density of 10 mA g−1, accompanied by a stable discharge platform of 2.39 V. Remarkably, even under rigorous testing conditions at a significantly higher current density of 1 A g−1, the FHPCS cathode maintains a substantial specific capacity of 621 mA h g−1, retaining an outstanding 68.2% of its initial capacity. As depicted in the Ragone plot (Figure 6c), the peak power density attained is 1730 W kg−1, while the corresponding energy density stands at 1999 Wh kg−1. The rate performance exhibited by the SPB configuration is limited, with a maximum current density of merely 1 A g−1. This limitation stems from the inherent electrochemical properties of sodium, as the standard potential for Na+/Na (−2.71 V vs. SHE, standard hydrogen electrode) is inferior to those of Li+/Li and K+/K, which are −3.02 V and −2.97 V vs. SHE, respectively [23]. Consequently, the lower standard potential of sodium results in a diminished rate capability within the SPB system. Furthermore, due to the inherent low electrical conductivity of CFx materials, a pronounced polarization phenomenon is induced at high discharge rates, resulting in a voltage reduction to less than 1.5V, which prohibits the discharge reaction, thereby limiting the utilization of FHPCS in SPB systems. Given that the standard potential of K+/K surpasses that of Na+/Na, FHPCS is anticipated to exhibit superior rate performance in the PPB configuration. The electrochemical reaction underpinning the discharge process in PPB proceeds as outlined below [23]:
CF x + x K + + e = C + x KF
The discharge mechanism observed in PPB is analogous to that in LPB and SPB. As depicted in Figure 6d, the discharge curve exhibited by the PPB closely mirrors those observed in its LPB and SPB counterparts. Remarkably, at a current density of 10 mA g−1 (Figure 6e), the battery attains its peak electrochemical performance, showcasing a prominent discharge platform of 2.64 V, alongside a specific capacity of 694 mA h g−1. Furthermore, even at an elevated current density of 2 A g−1, the FHPCS cathode retains a substantial specific capacity of 658 mA h g−1, demonstrating an impressive capacity retention rate of up to 94.8%. The Ragone plot (Figure 6f) shows the peaking power density at 4530 W kg−1, and the energy density is 1711 Wh kg−1, respectively.
The diffusion coefficients of Na+ ( D Na + ) and K+ ( D K + ) during the discharge process were quantitatively assessed utilizing the GITT. This method offers insights into the ion transport properties within the electrochemical system. D Na + and D K + are calculated as shown in Formula (2).
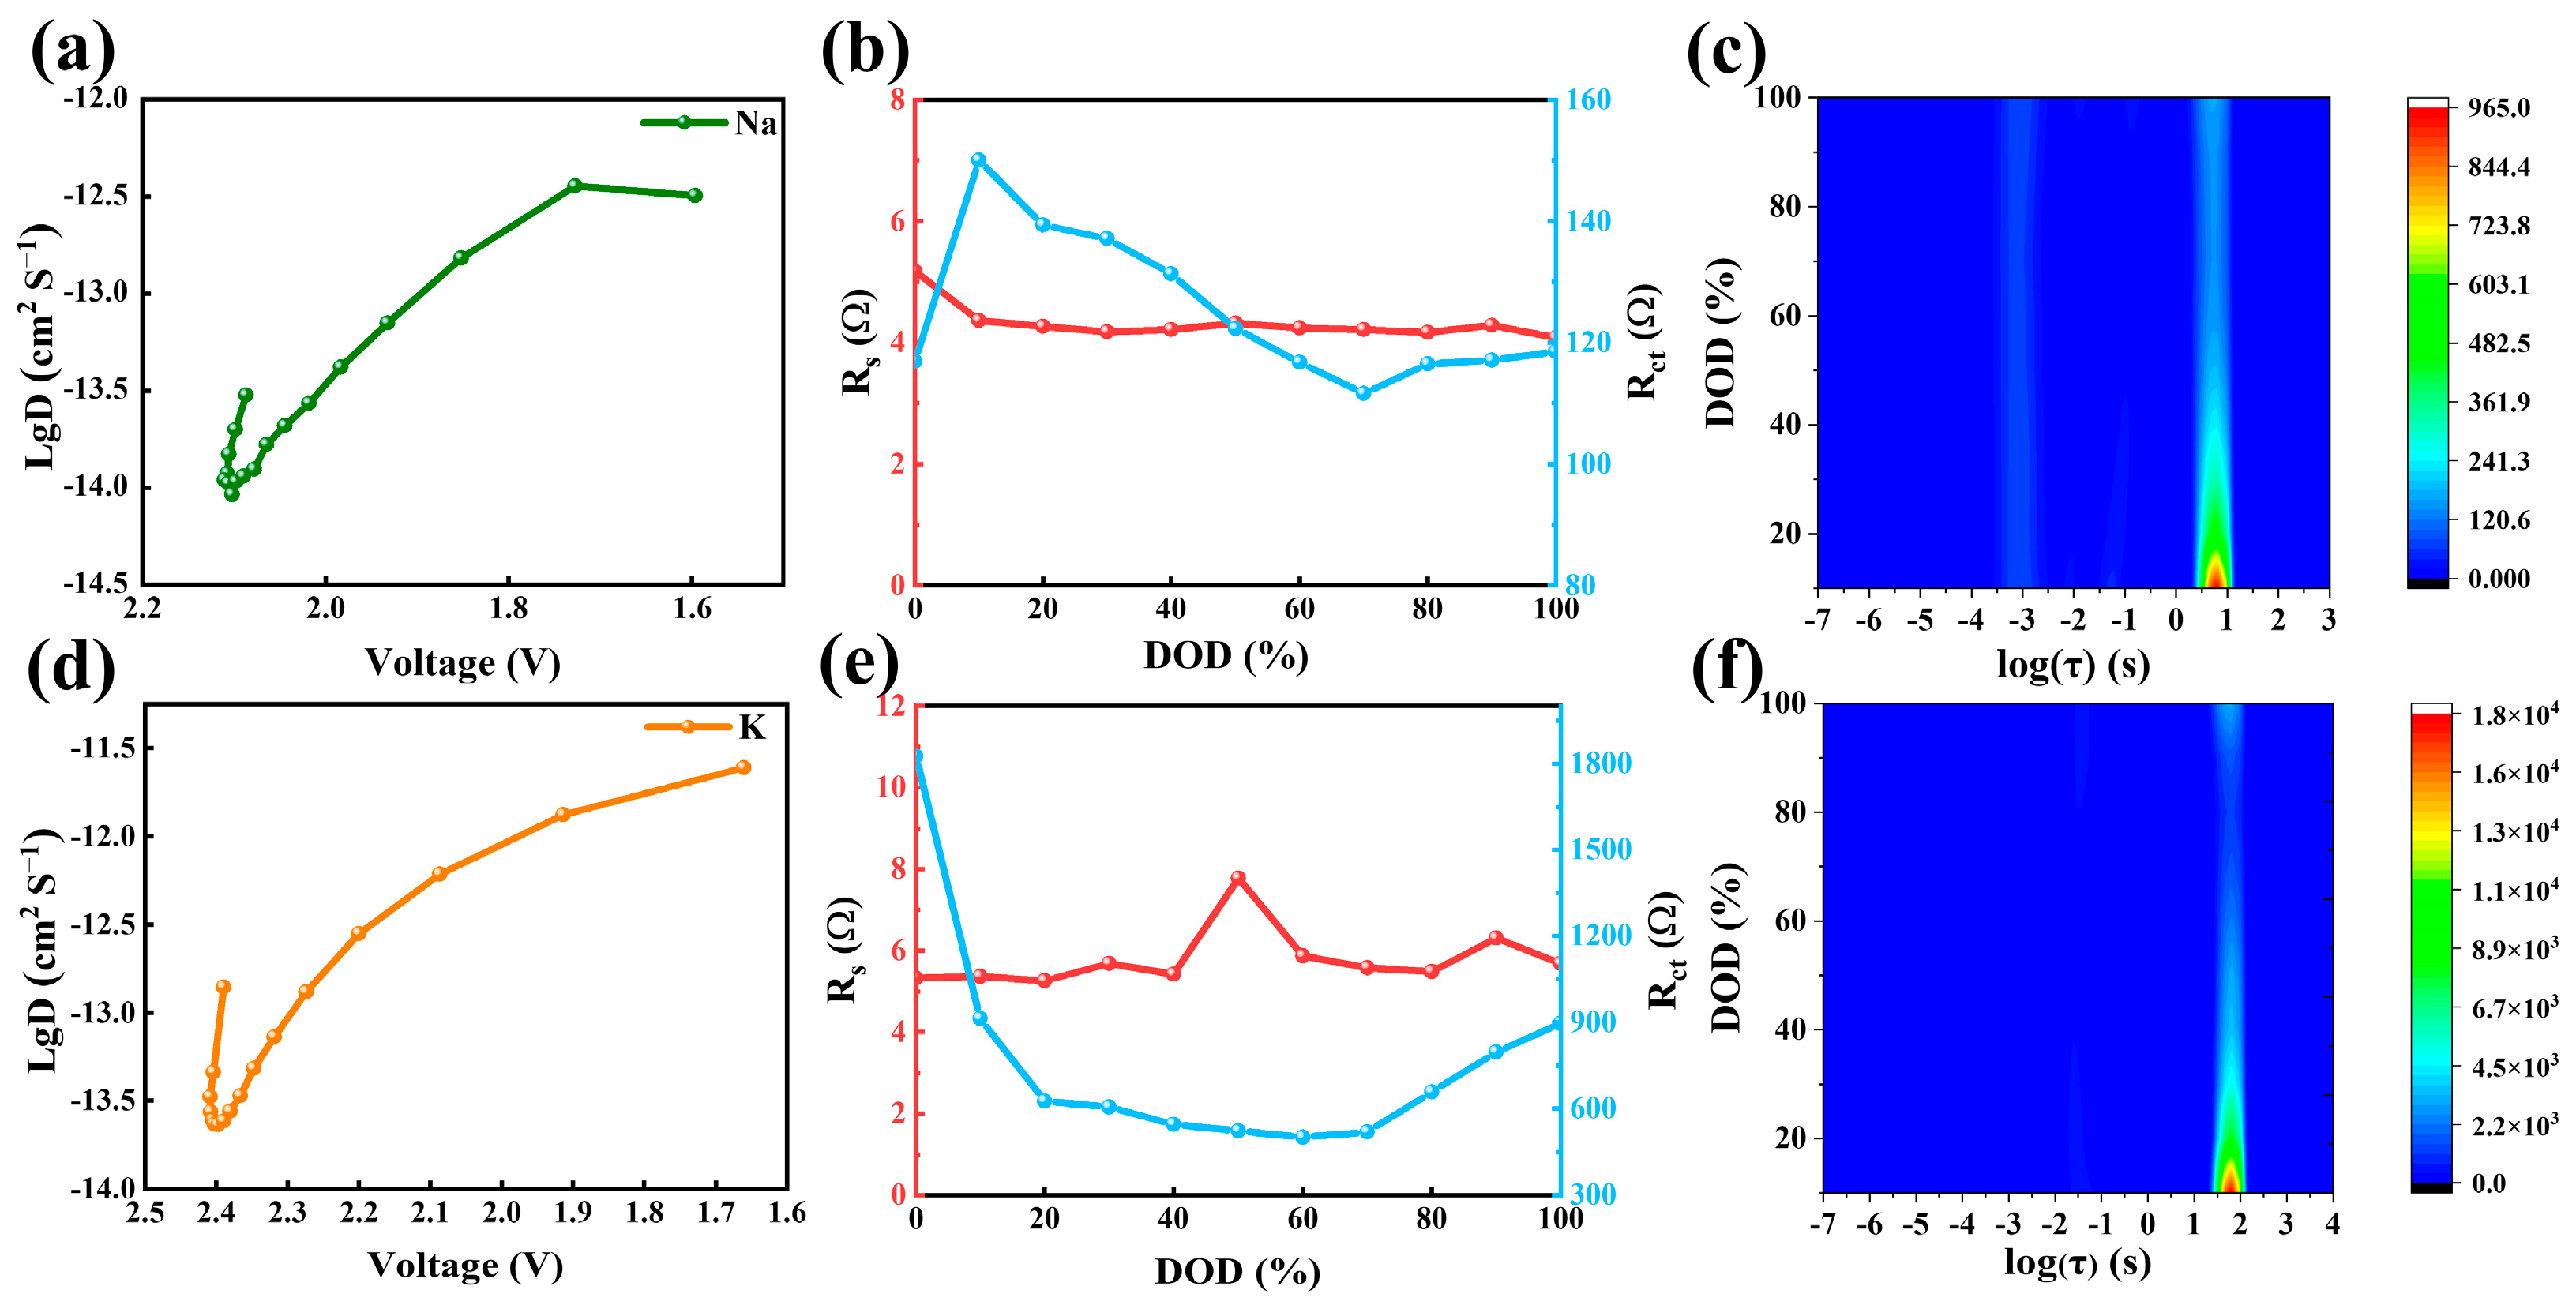
The evolution of D Na + as the discharge process proceeds is depicted in Figure 7a, and the trend of D Na + change is similar to that of D Li + . Initially, at the onset of discharge, the value of D Na + lies within the range of 10−13 to 10−14 cm2 S−1. With the discharge process, when the voltage is between 2.1 V and 1.7 V, the conductivity of the material experiences an enhancement attributed to the reduction of CFx into conductive carbon and NaF. This transformation leads to improved ion transport properties within the system. So, D Na + gradually increases, and finally,   D Na + is stable at about 3.98 × 10⁻¹³ cm2 S−1 when the voltage is about 1.7 V. The change trend of D K + in PPB (Figure 7d) is similar to that of D Na + . The D K + shows an upward trend at a voltage between 2.4 V and 1.6 V, and the final D K + is at about 2.51 × 10⁻¹² cm2 S−1. In liquid electrolytes, alkali metal ions exist in a solvated state, where the Stokes radius of K+-solvated species is smaller than that of Na+ across various electrolyte solvents. Consequently, K+-solvent complexes can diffuse more efficiently through the porous material structure, reaching the electrode surface at a faster rate. This facilitates a higher ionic diffusion coefficient compared to SPB [23,44].
To investigate the interfacial dynamics of the synthesized FHPCS cathode material within SPB and PPB during the course of the electrochemical reactions, EIS measurements were conducted at various discharge depths, employing a current rate of 80 mA g−1. The Nyquist diagram of FHPCS cathode materials with different discharge depths, shown in Figure S5b,c, shows the variation trend of Rs and Rct of the SPB and PPB at different discharge depths. As depicted in Figure 7b, during the initial phases of the discharge process, a discernible trend of increasing Rct is evident. Nevertheless, as the discharge depth progresses further, Rct undergoes a gradual decrease, culminating in a stabilized value when the discharge depth attains approximately 70% of its total capacity. The impedance variation in the discharge process is similar to that in LPB, and because NaF has a higher conductivity than LiF, the Rct in SPB has an earlier rising trend than that in LPB. The variation of Rct in PPB (Figure 7e) is similar to that in SPB. The DRT contour map (Figure 7c,f) shows that there is a response at a time scale of 1–10 s ( 0     log   ( τ )     1 ), a position corresponding to the charge-transfer process in SPB and PPB, and these are consistent with the above conclusion. The trend mirrors the behavior observed in SPB and PPB during the discharge process, suggesting similar underlying mechanisms governing the interfacial dynamics within these battery systems.
Compared with the diffusion coefficient of the Li+, Na+, and K+ (Figure S4b), D Na + is the lowest. So, its rate performance is the worst, and it can only discharge normally under the maximum current density of 1000 mA g−1. Meanwhile, LPB and PPB can be discharged at a higher current density due to their higher diffusion coefficients. In PPB, due to its higher Rct during discharge, its maximum discharge-current density is 2000 mA g−1. In addition, KF crystals with larger particles are generated during the discharge process, hindering the diffusion of ions and, thus, affecting its discharge performance.
To investigate the structural stability of the electrode during the discharge process, a thorough analysis is conducted. Therefore, we examined the morphological changes of FHPCS before and after cathode discharge. Figure S6 presents SEM images of the electrode before and after the discharge process. As evident from Figure S6a,b, the cathode material retains its original spherical morphology after discharge, indicating structural integrity in LPB. Additionally, the uniform distribution of LiF and NaF on the surface of the carbon shell further underscores the stability of FHPCS [20]. Owing to the significantly larger particle size of NaF crystals compared to that of the active LiF substance, FHPCS retains a relatively intact spherical morphology post-discharge. Conversely, the spherical shape of the KF crystals (Figure S6c) is disrupted following discharge, which is attributed to the particle size of KF being notably larger than that of both NaF and LiF. In conclusion, the FHPCS shows good structural stability during the discharge of alkali metal primary batteries.

4. Conclusions

In this comprehensive investigation, HPCS was synthesized via the hard template methodology, employing phenolic resin as the precursor. Subsequently, the HPCS was utilized as a carbon source for FHPCS materials. The nanosphere morphology and inherent cavity structure of the fabricated FHPCS materials contributed significantly to an enhancement in their specific surface area. This augmentation not only facilitated the exposure of numerous active sites but also promoted the occurrence of electrode reactions, thereby enhancing the overall performance of the material in energy-storage applications. The porous structure of the carbon shell offers a fast pathway for ion diffusion. The maximum specific energy and power density of the FHPCS cathode material in LPB are 2007 Wh kg−1 and 30,400 W kg−1, respectively. The FHPCS materials exhibit commendable electrochemical performance in both SPB and PPB. In the context of SPB, the material delivers a remarkable specific capacity of 910 mA h g−1 and achieves a peak specific energy of 1999 Wh kg−1. The FHPCS exhibits commendable electrochemical performance in both SPB and PPB. In contrast, when employed in PPB, the FHPCS demonstrates superior power performance compared to SPB, achieving a maximum specific energy of 1711 Wh kg−1, alongside an impressive energy density of 4030 W kg−1. In summary, our research underscores the pivotal role of structural design in carbon sources, which serves as a crucial factor in enhancing the electrochemical performance of fluorocarbon materials within the field of alkali metal primary batteries. This study provides valuable insights into the optimization of material properties for improved energy-storage capabilities.

Supplementary Materials

The following supporting information can be downloaded at https://www.mdpi.com/article/10.3390/batteries10090310/s1. Figure S1: SEM images of (a) HPCS and (b) FHPCS; Figure S2: SAED patterns of (a) HPCS and (b) FHPCS; Figure S3: (a) XPS survey spectrum and (b) high-resolution C1s spectrum of HPCS; Figure S4: (a) GITT discharge profiles of LPB, SPB, and PPB at 200 mA g−1 (b) Comparison of diffusion coefficients of Li+, Na+, and K+; Figure S5: Nyquist plots of FHPCS cathode under different DODs (a) in LPB, (b) in SPB, and (c) in PPB; Figure S6: SEM images of FHPCS cathode (a) before discharge, (b) after discharge in LPB, (c) after discharge in SPB, and (d) after discharge in PPB; Table S1:The obtained parameters from the N2 adsorption–desorption isotherms of HPCS and FHPCS; Table S2: Element contents and F/C ratios of HPCS and FHPCS; Table S3: C1s peak and F1s peak assignments and proportions of FHPCS; Table S4: Comparison of the discharge performances of the FHPCS in this study and previously reported CFx cathodes.

Author Contributions

Conceptualization, Y.Z. and K.Y.; methodology, Y.Z. and L.B.; validation, Y.Z. and Q.X.; formal analysis, Y.Z. and K.Y.; investigation, Y.Z., K.Y., L.B., Q.X., H.C. and H.Y. resources, H.C. and H.Y.; data curation, Y.Z., K.Y. and L.B.; writing—original draft preparation, Y.Z.; writing—review and editing, H.C.; visualization, Y.Z. and K.Y.; supervision, H.C. and H.Y.; project administration, H.C. and H.Y.; funding acquisition, H.C. and H.Y. All authors have read and agreed to the published version of the manuscript.

Funding

This research was funded by the Fujian Science and Technology Planning Projects of China (Nos. 2023H0045 and 2022T3067), the Self-deployment Project Research Programs of Haixi Institutes, Chinese Academy of Sciences (No. CXZX-2022-JQ12), and the XIREM autonomously deployment project (No. 2023GG02).

Data Availability Statement

The data are contained in the article and are available from the corresponding authors on reasonable request.

Acknowledgments

The research leading to these results received funding from the Fujian Science and Technology Planning Projects of China (Nos. 2023H0045 and 2022T3067), the Self-deployment Project Research Programs of Haixi Institutes, Chinese Academy of Sciences (No. CXZX-2022-JQ12), and the XIREM autonomously deployment project (No. 2023GG02). The relevant testing is provided by the infrastructure of Xiamen Institute of Rare Earth Materials, Haixi Institutes, Chinese Academy of Sciences, and Fuzhou University.

Conflicts of Interest

The authors declare no conflicts of interest.

References

  1. Chen, X.; Fan, K.; Liu, Y.; Li, Y.; Liu, X.; Feng, W.; Wang, X. Recent Advances in Fluorinated Graphene from Synthesis to Applications: Critical Review on Functional Chemistry and Structure Engineering. Adv. Mater. 2022, 34, 2101665. [Google Scholar] [CrossRef] [PubMed]
  2. Wang, T.; Zang, X.; Wang, X.; Gu, X.; Shao, Q.; Cao, N. Recent advances in fluorine-doped/fluorinated carbon-based materials for supercapacitors. Energy Storage Mater. 2020, 30, 367–384. [Google Scholar] [CrossRef]
  3. Feng, W.; Long, P.; Feng, Y.; Li, Y. Two-Dimensional Fluorinated Graphene: Synthesis, Structures, Properties and Applications. Adv. Sci. 2016, 3, 1500413. [Google Scholar] [CrossRef]
  4. Zhang, Y.; Zhang, X.; Silva, S.R.P.; Ding, B.; Zhang, P.; Shao, G. Lithium-Sulfur Batteries Meet Electrospinning: Recent Advances and the Key Parameters for High Gravimetric and Volume Energy Density. Adv. Sci. 2022, 9, 2103879. [Google Scholar] [CrossRef] [PubMed]
  5. Li, X.; Wang, M.; Li, R.; Li, C.; He, J.; Qiu, M.; Xiao, L.; Wen, Z.; Qian, Q.; Li, X.; et al. Functionalized N-doped hollow graphitic carbon-nanotube/carbon -nanosphere composite. Compos. Commun. 2021, 23, 100578. [Google Scholar] [CrossRef]
  6. Zhang, W.; Spinelle, L.; Dubois, M.; Guerin, K.; Kharbache, H.; Masin, F.; Kharitonov, A.P.; Hamwi, A.; Brunet, J.; Varenne, C.; et al. New synthesis methods for fluorinated carbon nanofibres and applications. J. Fluor. Chem. 2010, 131, 676–683. [Google Scholar] [CrossRef]
  7. Schonberg, W.P.; Hull, S.M. Current Design Criteria for MMOD Impact of Metallic Pressurized Tanks. J. Aerosp. Eng. 2016, 29, 06016004. [Google Scholar] [CrossRef]
  8. Guerin, K.; Dubois, M.; Houdayer, A.; Hamwi, A. Applicative performances of fluorinated carbons through fluorination routes: A review. J. Fluor. Chem. 2012, 134, 11–17. [Google Scholar] [CrossRef]
  9. Zhang, S.; Kong, L.; Li, Y.; Peng, C.; Feng, W. Fundamentals of Li/CFx battery design and application. Energy Environ. Sci. 2023, 16, 1907–1942. [Google Scholar] [CrossRef]
  10. Luo, Z.; Wang, X.; Chen, D.; Chang, Q.; Xie, S.; Ma, Z.; Lei, W.; Pan, J.; Pan, Y.; Huang, J. Ultrafast Li/Fluorinated Graphene Primary Batteries with High Energy Density and Power Density. ACS Appl. Mater. Interfaces 2021, 13, 18809–18820. [Google Scholar] [CrossRef]
  11. Wang, K.; Feng, Y.; Kong, L.; Peng, C.; Hu, Y.; Li, W.; Li, Y.; Feng, W. The Fluorination of Boron-Doped Graphene for CFx Cathode with Ultrahigh Energy Density. Energy Environ. Mater. 2023, 6, e12437. [Google Scholar] [CrossRef]
  12. Fan, R.; Yang, B.; Li, Z.; Ma, D.; Yuan, W.; Ma, J.; Ren, H. First-principles study of the adsorption behaviors of Li atoms and LiF on the CFx (x=1.0, 0.9, 0.8, 0.5,∼0.0) surface. RSC Adv. 2020, 10, 31881–31888. [Google Scholar] [CrossRef] [PubMed]
  13. Liu, Y.; Jiang, L.; Wang, H.; Wang, H.; Jiao, W.; Chen, G.; Zhang, P.; Hui, D.; Jian, X. A brief review for fluorinated carbon: Synthesis, properties and applications. Nanotechnol. Rev. 2019, 8, 573–586. [Google Scholar] [CrossRef]
  14. Yazami, R.; Hamwi, A.; Guérin, K.; Ozawa, Y.; Dubois, M.; Giraudet, J.; Masin, F. Fluorinated carbon nanofibres for high energy and high power densities primary lithium batteries. Electrochem. Commun. 2007, 9, 1850–1855. [Google Scholar] [CrossRef]
  15. Ahmad, Y.; Guérin, K.; Dubois, M.; Zhang, W.; Hamwi, A. Enhanced performances in primary lithium batteries of fluorinated carbon nanofibers through static fluorination. Electrochim. Acta 2013, 114, 142–151. [Google Scholar] [CrossRef]
  16. Ahmad, Y.; Dubois, M.; Guerin, K.; Hamwi, A.; Flahaut, E. High energy density of primary lithium batteries working with sub-fluorinated few walled carbon nanotubes cathode. J. Alloys Compd. 2017, 726, 852–859. [Google Scholar] [CrossRef]
  17. Peng, C.; Li, Y.; Yao, F.; Fu, H.; Zhou, R.; Feng, Y.; Feng, W. Ultrahigh-energy-density fluorinated calcinated macadamia nut shell cathodes for lithium/fluorinated carbon batteries. Carbon 2019, 153, 783–791. [Google Scholar] [CrossRef]
  18. Peng, C.; Zhang, S.; Kong, L.; Xu, H.; Li, Y.; Feng, W. Fluorinated Carbon Nanohorns as Cathode Materials for Ultra-High Power Li/CFx Batteries. Small Methods 2023, 8, 2301090. [Google Scholar] [CrossRef]
  19. Jiang, S.; Huang, P.; Lu, J.; Liu, Z. The electrochemical performance of fluorinated ketjenblack as a cathode for lithium/fluorinated carbon batteries. RSC Adv. 2021, 11, 25461–25470. [Google Scholar] [CrossRef]
  20. Hu, Y.; Kong, L.; Li, W.; Sun, L.; Peng, C.; Qin, M.; Zhao, Z.; Li, Y.; Feng, W. Fluorinated microporous carbon spheres for Li/CF batteries with high volumetric energy density. Compos. Commun. 2023, 40, 101607. [Google Scholar] [CrossRef]
  21. Matsuda, Y.; Nakashima, H.; Morita, M.; Takasu, Y. Behavior of Some Ions in Mixed Organic Electrolytes of High-Energy Density Batteries. J. Electrochem. Soc. 1981, 128, 2552–2556. [Google Scholar] [CrossRef]
  22. Li, Y.; Wu, X.; Liu, C.; Wang, S.; Zhou, P.; Zhou, T.; Miao, Z.; Xing, W.; Zhuo, S.; Zhou, J. Fluorinated multi-walled carbon nanotubes as cathode materials of lithium and sodium primary batteries: Effect of graphitization of carbon nanotubes. J. Mater. Chem. A 2019, 7, 7128–7137. [Google Scholar] [CrossRef]
  23. Jiang, C.; Wang, B.; Wu, Z.; Qiu, J.; Ding, Z.; Zou, J.; Chen, S.; Gao, P.; Niu, X.; Wang, L.; et al. Electrolyte-assisted dissolution-recrystallization mechanism towards high energy density and power density CF cathodes in potassium cell. Nano Energy 2020, 70, 104552. [Google Scholar] [CrossRef]
  24. Luo, Z.; Chen, D.; Wang, X.; Huang, J.; Pan, Y.; Lei, W.; Pan, J. Accordion-Like Fluorinated Graphite Nanosheets with High Power and Energy Densities for Wide-Temperature, Long Shelf-Life Sodium/Potassium Primary Batteries. Small 2021, 17, 2008163. [Google Scholar] [CrossRef]
  25. Ahmad, Y.; Dubois, M.; Guérin, K.; Hamwi, A.; Zhang, W. Pushing the theoretical limit of Li–CFx batteries using fluorinated nanostructured carbon nanodiscs. Carbon 2015, 94, 1061–1070. [Google Scholar] [CrossRef]
  26. Pei, F.; An, T.; Zang, J.; Zhao, X.; Fang, X.; Zheng, M.; Dong, Q.; Zheng, N. From Hollow Carbon Spheres to N-Doped Hollow Porous Carbon Bowls: Rational Design of Hollow Carbon Host for Li-S Batteries. Adv. Energy Mater. 2016, 6, 1502539. [Google Scholar] [CrossRef]
  27. Xia, Q.; Zou, Y.; Yan, K.; Bao, L.; Chen, H.; Yue, H. In-situ texturing hollow carbon host anchored with Fe single atoms accelerating solid-phase redox for Li-Se batteries. J. Colloid Interface Sci. 2024, 667, 282–290. [Google Scholar] [CrossRef]
  28. Wan, X.K.; Wu, H.B.; Guan, B.Y.; Luan, D.; Lou, X.W. Confining Sub-Nanometer Pt Clusters in Hollow Mesoporous Carbon Spheres for Boosting Hydrogen Evolution Activity. Adv. Mater. 2019, 32, 1901349. [Google Scholar] [CrossRef]
  29. Xiao, L.; Lu, H.; Fang, Y.; Sushko, M.L.; Cao, Y.; Ai, X.; Yang, H.; Liu, J. Low-Defect and Low-Porosity Hard Carbon with High Coulombic Efficiency and High Capacity for Practical Sodium Ion Battery Anode. Adv. Energy Mater. 2018, 8, 1703238. [Google Scholar] [CrossRef]
  30. Wei, Z.; Sarwar, S.; Azam, S.; Ahasan, M.R.; Voyda, M.; Zhang, X.; Wang, R. Ultrafast microwave synthesis of MoTe2@graphene composites accelerating polysulfide conversion and promoting Li2S nucleation for high-performance Li-S batteries. J. Colloid Interface Sci. 2023, 635, 391–405. [Google Scholar] [CrossRef]
  31. Kong, L.; Li, Y.; Peng, C.; Sun, L.; Wang, K.; Liu, Y.; Feng, W. Defective nano-structure regulating C-F bond for lithium/fluorinated carbon batteries with dual high-performance. Nano Energy 2022, 104, 107905. [Google Scholar] [CrossRef]
  32. He, Q.; Chen, H.; Chen, X.; Zheng, J.; Que, L.; Yu, F.; Zhao, J.; Xie, Y.; Huang, M.; Lu, C.; et al. Tea-Derived Sustainable Materials. Adv. Funct. Mater. 2024, 34, 2310226. [Google Scholar] [CrossRef]
  33. Giraudet, J.; Delabarre, C.; Guerin, K.; Dubois, M.; Masin, F.; Hamwi, A. Comparative performances for primary lithium batteries of some covalent and semi-covalent graphite fluorides. J. Power Sources 2006, 158, 1365–1372. [Google Scholar] [CrossRef]
  34. Azam, S.; Wei, Z.; Wang, R. Cerium oxide nanorods anchored on carbon nanofibers derived from cellulose paper as effective interlayer for lithium sulfur battery. J. Colloid Interface Sci. 2022, 615, 417–431. [Google Scholar] [CrossRef] [PubMed]
  35. Bettinger, H.F. Experimental and computational investigations of the properties of fluorinated single-walled carbon nanotubes. Chemphyschem 2003, 4, 1283–1289. [Google Scholar] [CrossRef]
  36. Chen, N.; Zhang, G.; Chen, H.; Yue, H. Conductive Carbon-Wrapped Fluorinated Hard Carbon Composite as High-Performance Cathode for Primary Lithium Batteries. Coatings 2023, 13, 812. [Google Scholar] [CrossRef]
  37. Yan, K.; Zou, Y.; Bao, L.-X.; Xia, Q.; Meng, L.-Y.; Lin, H.-C.; Chen, H.-X.; Yue, H.-J. Fluorinated N,P co-doped biomass carbon with high-rate performance as cathode material for lithium/fluorinated carbon battery. Rare Met. 2024. [Google Scholar] [CrossRef]
  38. Li, X.; Zhang, H.; Liu, C.; Qiao, J.; Zhou, X. A MOF-derived multifunctional nano-porous fluorinated carbon for high performance lithium/fluorinated carbon primary batteries. Microporous Mesoporous Mater. 2021, 310, 110650. [Google Scholar] [CrossRef]
  39. Zhang, Q.; D’Astorg, S.; Xiao, P.; Zhang, X.; Lu, L. Carbon-coated fluorinated graphite for high energy and high power densities primary lithium batteries. J. Power Sources 2010, 195, 2914–2917. [Google Scholar] [CrossRef]
  40. Sun, C.; Feng, Y.; Li, Y.; Qin, C.; Zhang, Q.; Feng, W. Solvothermally exfoliated fluorographene for high-performance lithium primary batteries. Nanoscale 2014, 6, 2634–2641. [Google Scholar] [CrossRef]
  41. Zhou, R.; Li, Y.; Feng, Y.; Peng, C.; Feng, W. The electrochemical performances of fluorinated hard carbon as the cathode of lithium primary batteries. Compos. Commun. 2020, 21, 100396. [Google Scholar] [CrossRef]
  42. Peng, C.; Kong, L.; Li, Y.; Fu, H.; Sun, L.; Feng, Y.; Feng, W. Fluorinated graphene nanoribbons from unzipped single-walled carbon nanotubes for ultrahigh energy density lithium-fluorinated carbon batteries. Sci. China Mater. 2021, 64, 1367–1377. [Google Scholar] [CrossRef]
  43. Lu, Y.; Zhao, C.-Z.; Huang, J.-Q.; Zhang, Q. The timescale identification decoupling complicated kinetic processes in lithium batteries. Joule 2022, 6, 1172–1198. [Google Scholar] [CrossRef]
  44. Yue, H.; Chen, H.; Zhao, C.; Zheng, Z.; Zhou, K.; Zhang, Q.; Zhong, G.; Lu, C.-Z.; Yang, Y. Reversible potassium storage in ultrafine CF: A superior cathode material for potassium batteries and its mechanism. J. Energy Chem. 2021, 53, 347–353. [Google Scholar] [CrossRef]
Figure 1. (a) Preparation scheme of FHPCS, (b) SEM, and (c) TEM image of HPCS, (d) HRTEM image of FHPCS, (e) HAADF-STEM image and elemental mapping images of HPCS, (f) SEM and (g) TEM image of FHPCS, (h) HRTEM image of FHPCS, and (i) HAADF-STEM image and elemental mapping images of FHPCS.
Batteries 10 00310 g001
Figure 2. (a) XRD patterns, (b) FTIR spectra, (c) Raman spectra, and (d) aperture distribution curve. The inset in (d) is the N2 absorption–desorption curve.
Batteries 10 00310 g002
Figure 3. (a) XPS survey spectra for FHPCS; high-resolution XPS spectra of FHPCS (b) C1s and (c) F1s.
Batteries 10 00310 g003
Figure 4. (a) Discharge curve of FHPCS cathode material in LPB at different current densities. (b) Electrochemical performance diagram of FHPCS cathode material in LPB. (c) Ragone plot of FHPCS cathode material in the LPB. (d) D Li + of FHPCS at a current density of 200 mA g−1. (e) The variation curves of Rs and Rct obtained by fitting under different discharge depths in the LPB. (f) The DRT diagram was obtained by fitting under different discharge depths in the LPB. Note: Three batteries were simultaneously tested, and all results showed good repeatability.
Batteries 10 00310 g004
Figure 5. Comparison of capacity retention and power density in this work with previously reported CFx cathodes [18,19,20,22,36,37,38,39,40,41,42].
Batteries 10 00310 g005
Figure 6. Discharge curve of FHPCS cathode material at different current densities in (a) SPB and (d) PPB. Electrochemical performance diagram of FHPCS cathode material (b) in SPB and (e) in SPB. Ragone plot of FHPCS cathode material (c) in the SPB and (f) in the PPB. Note: Three batteries were simultaneously tested, and all results showed good repeatability.
Batteries 10 00310 g006
Figure 7. (a,d) D Na + and D K + of FHPCS at the current density of 200 mA g−1. (b,e) The variation curves of Rs and Rct obtained by fitting under different discharge depths in the SPB and PPB. (c,f) The DRT diagram was obtained by fitting under different discharge depths in the SPB and PPB. Note: Three batteries were simultaneously tested, and all results showed good repeatability.
Batteries 10 00310 g007
Disclaimer/Publisher’s Note: The statements, opinions and data contained in all publications are solely those of the individual author(s) and contributor(s) and not of MDPI and/or the editor(s). MDPI and/or the editor(s) disclaim responsibility for any injury to people or property resulting from any ideas, methods, instructions or products referred to in the content.