Article

Analysis of the Effect of Motor Waste Heat Recovery on the Temperature and Driving Range of Electric Heavy Truck Batteries

1
School of Mechanical and Automotive Engineering, Qingdao University of Technology, Qingdao 266520, China
2
State Key Laboratory of Automotive Safety and Energy, Tsinghua University, Beijing 100084, China
3
Ordos Carbon Neutrality Research Institute, Ordos 017010, China
*
Author to whom correspondence should be addressed.
Batteries 2024, 10(9), 328; https://doi.org/10.3390/batteries10090328
Submission received: 12 August 2024 / Revised: 6 September 2024 / Accepted: 13 September 2024 / Published: 15 September 2024
(This article belongs to the Section Battery Modelling, Simulation, Management and Application)

Abstract

:
In some scenarios, electric heavy-duty trucks with battery swapping mode (ETBSm) are more cost-effective than battery charging mode. The viability of battery swapping stations is contingent upon the operational requirements and range capabilities of the ETBSm. Low temperatures have the effect of reducing the range of the ETBSm, thereby creating difficulties for battery swapping. This article proposes the use of motor waste heat recovery (MWHR) to heat batteries, which would improve range. A number of subsystem models have been established, including the ETBSm, battery, motor, and thermal management system (TMS). The calibration of battery temperature and motor efficiency is achieved with a model error of less than 5%. Comparison of performance, such as temperature, energy consumption, and range, when using only positive temperature coefficient (PTC) heating and when using both PTC heating and motor waste heat. The results indicate a 15% increase in the rate of rise in battery temperature and a 10.64 kW·h reduction in energy consumption under Chinese heavy-duty vehicle commercial vehicle test cycle (CHTC) conditions. Then, the motor waste heat percentage, energy consumption, and range are analyzed at different ambient temperatures. At an ambient temperature of −20 °C, −10 °C, and 0 °C, the percentage of the motor waste heat is 32.1%, 35%, and 40.5%; when 75% of the state of charge (SOC) is consumed, the range is improved by 6.55%, 4.37%, and 4.49%. Additionally, the effect of the PTC heater on temperature characteristics and power consumption is investigated by changing the target temperature of the coolant at the battery inlet. In accordance with the stipulated conditions of an ambient temperature of −20 °C and a target coolant temperature of 40 °C at the battery inlet, the simulation results indicated a battery temperature rise rate of 0.85 °C/min, accompanied by a PTC power consumption of 15.6 kW·h. This study demonstrates that as the ambient temperature increases, the utilization of motor waste heat becomes more effective in reducing PTC heating power consumption. At the lowest ambient temperature tested, the greatest improvement in driving range is observed. It is important to note that while an increase in the target heating temperature of the PTC helps to raise the battery temperature more rapidly, this is accompanied by a higher energy consumption. This article provides a reference for the ETBSm with MWHR.

1. Introduction

Electrification of the heavy truck industry is one of the fundamental measures to address the high carbon emissions of this industry [1]. In recent years, electric heavy-duty trucks equipped with battery swapping mode (ETBSm) have entered a phase of rapid development, achieving a market share of 1.9% in 2022 [2,3].
Compared with heavy-duty diesel trucks and hybrid heavy trucks, ETBSm have the lowest operating cost per kilometer [4]. Unlike passenger cars, electric heavy-duty trucks have a larger battery capacity and require longer charging times, so research into battery swapping needs to be improved. ETBSm are more economical, not only in the cost of use, but also in the cost of acquisition. Due to it permitted to purchase only the vehicle, and the battery is used in the mode of leasing [5]. Additionally, in-station batteries acting as energy-storage devices for grid. The battery swapping mode can promote the electrification of heavy trucks.
However, the promotion of ETBSm still faces some challenges. Battery swapping operation scenarios are more applicable to closed areas or industrial parks. In order to promote the development of ETBSm. It is hoped that by accurately identifying the location of the trucks and quickly accessing the batteries, a reduction in battery swapping time can be achieved [5]. One of the major problems is the low number of battery swapping stations, which need to be found quickly when a truck is about to run out of power. The driving range degradation of trucks is serious at cold temperatures, and the performance of lithium iron phosphate batteries used in ETBSm is poor at cold temperatures [6]. When the power is exhausted, it is difficult to reach the next battery swapping station or swap the battery in advance, which reduces the operational efficiency of the ETBSm. Thus, it is highly significant to focus on performance optimization and systematic research of the ETBSm thermal management system operating in cold regions. In addition, the efficiency of battery charging is reduced at low temperatures. And rapid charging leads to severe lithium plating of the battery, which reduces the capacity of the battery. Lithium plating may also cause the battery’s internal positive and negative short circuits and, in serious cases, the battery to enter a thermal runaway state, resulting in fire or explosion [7]. In a low-temperature environment, the charging multiplier should be reduced, which prolongs the charging time [8]. Battery awapping mode can avoid the above problems. This aids in reducing the degradation of the winter driving range of ETBSm and enhancing their performance [9,10].
Under cold temperature conditions in winter, the main ways to heat the battery are internal heating and external heating [11,12,13]. The safety of internal heating still needs to be improved [14,15,16]. External heating is divided into convective heat transfer and heat conduction. Convective heating is mainly divided into air heating, liquid heating, and heat pump heating [17]. PTC can be used to heat the liquid [18]. An increase in the temperature of the heat transfer fluid can facilitate an accelerated rate of temperature rise within the cells. Yet, excessively high temperatures of the fluid can increase the temperature difference between the cells. The optimal inlet temperature for the heat transfer fluid has been demonstrated to be 30 °C [19]. Min et al. used a fuzzy control strategy to control the PTC heater to meet the battery temperature requirements, reducing the average heating energy consumption of the PTC by up to 3.35% [20]. The purpose of the above study is to reduce PTC energy consumption. This effect is important to address since, in cold climates, a large portion of the energy from the battery is spent on heating itself and the cabin, thus shortening the driving range by more than 30~40% [21].
Many scholars have researched heating strategies. Jeffs et al. create a dynamic optimization strategy that can control battery heating time and heating target temperatures at different ambient temperatures. Balance heating energy consumption and range. Compared to no battery heating, the result was a 6.2% increase in range [22]. Guo et al. used the cabin heat load, the battery heat generation, and the motor heat generation as the reference variables to establish a model predictive control strategy to control the power consumption of the PTC heater, and compared to the traditional switching control strategy, the battery heating time reduced from 6515 s to 4078 s and the heating power consumption was reduced by 20.95% [23]. Ma et al. propose a non-linear model predictive control heating strategy to heat batteries and analyze battery heat production in conjunction with vehicle speed prediction. Heat pump air conditioning systems can save about 45% of energy consumption compared to the electric heater alone [24]. There are fewer studies on strategies for utilizing waste heat from motors in this research on heating strategies.
Facing the problem of high power consumption of the heating system, waste heat recovery has been adopted by many scholars, such as the combination of PTC heating and motor waste heat, and they have examined its influence on reducing heating power consumption and extending the vehicle’s driving range [25]. However, motor waste heat recovery is often utilized in passenger cars to assist with cabin heating [21]. Tian et al. add a heat exchanger to the cooling circuit of the motor, which is connected in parallel with the evaporator of the air conditioning system. It is possible that the thermal management system of the entire vehicle could be enhanced by 13.2% in terms of performance, while the driving range of the entire vehicle could be increased by 33.64% relative to the strategy of heating the cabin with PTC [26]. Peng et al. use the residual heat to set up air vents in the front, center, and rear of the coach cabin. The heating of the cabin is more evenly distributed. Compared with that, heat pump air conditioning and PTC heating reduced power consumption by 31.1% and 63.6% [27]. Shelly et al. researched waste heat recovery at extremely low operating temperatures. At ambient temperatures of −20 °C, heating the cabin using this method resulted in a 2% increase in driving range [28].
There is limited research on the heating of heavy-duty truck batteries. Different from passenger cars, ETBSm require a larger battery capacity than passenger cars [29]. In research on high-capacity batteries, Babu et al. studied the heat production characteristics of large-capacity batteries in a low-temperature environment. It is helpful to predict the average temperature of the battery and provides a reference for battery preheating [30]. In order to reduce the energy consumption of heating batteries in electric heavy trucks, Babu also adds insulation to the outside of the battery in order to save heating energy at low temperatures. The results showed a 9% increase in energy consumption for heavy trucks at −25 °C [31]. Research on waste heat recovery from fuel cell trucks can provide a reference for waste heat recovery on ETBSm. Mohamed et al. have demonstrated the possibility of waste heat recovery from a fuel cell system using a thermoelectric generator under varying vehicle speed and powertrain configurations with up to 2% heat [32] recovery. Lee et al. apply a novel triple-fluid heat exchanger to recover waste heat from the fuel cell stack and electric devices at different temperatures. Its driving range can be increased by about 10.8% [33]. Hu et al. use waste heat from fuel cells to heat the cabin, with a maximum saving of about 4.27% of total hydrogen consumption [34]. At present, there are few studies on thermal management systems for ETBSm with MWHR.
This paper presents a novel integrated thermal management framework that incorporates MWHR into ETBSm. Additionally, a thermal management control strategy is proposed for the framework of this paper. In different thermal management systems, simulation modes are set to compare to understand the influence of the MWHR mode. To further analyze the temperature adaptability of waste heat utilization, it is necessary to adjust the ambient temperature. Analyzing the motor waste heat as a percentage of the total heat gain aids in understanding the heat distribution throughout the entire vehicle. The driving range improvement at different ambient temperatures is analyzed. PTC heating is known to consume significant amounts of power, and its power consumption is closely related to the target temperature set for the heater. At an ambient temperature of −20 °C, −10 °C, and 0 °C, the percentage of the motor waste heat is 32.1%, 35%, and 40.5%; when 75% of the state of charge (SOC) is consumed, the range is improved by 6.55%, 4.37%, and 4.49%. The findings presented in this paper offer valuable insights for optimizing the thermal management system of ETBSm in cold climates. They also contribute to a deeper understanding of the MWHR mode’s performance across varying ambient temperatures.
Section 1 describes the battery swapping for electric heavy-duty trucks. Based on the original truck, the thermal management system is modified. Section 2 describes the structure and function of the thermal management system of the ETBSm. And the thermal management strategy is developed. Section 3 establishes the whole vehicle, battery, and motor models of the battery-swapping heavy truck and verifies the accuracy of the models. Section 4 analyzes the temperature characteristics and the performance of the motor waste heat utilization at different ambient temperatures and then analyzes the effect of the PTC heater target temperature. Section 5 summarizes this paper.

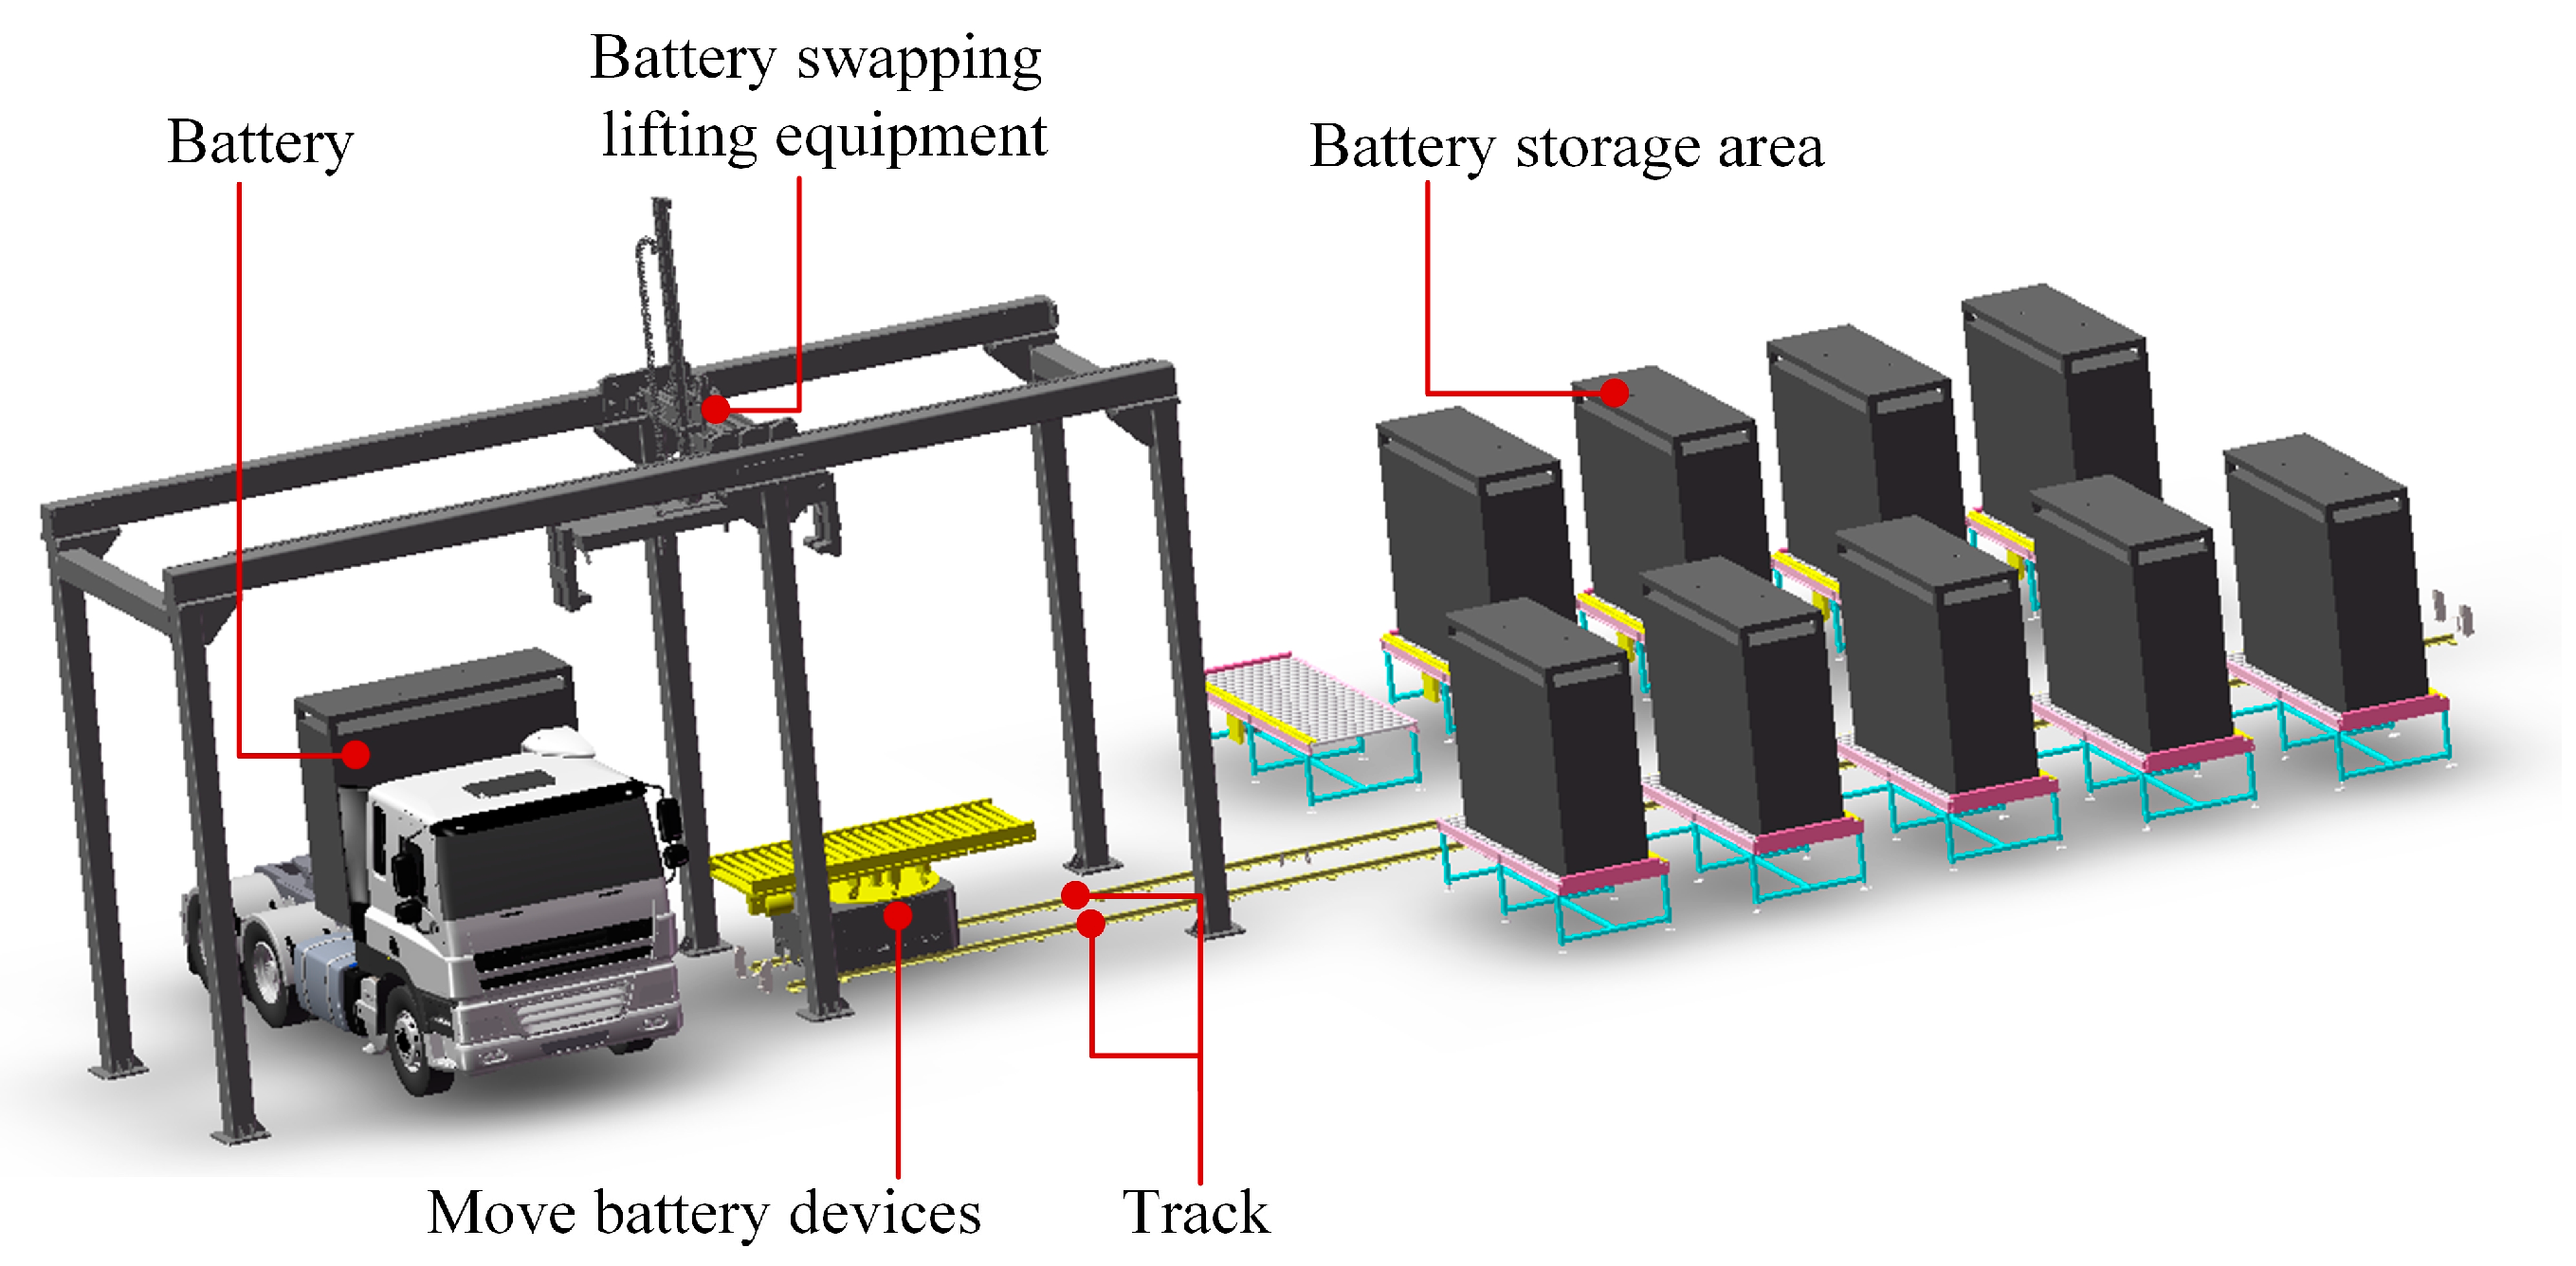
2. Battery Swapping ETBSm Design and Parameters

2.1. Structural Design

The schematic diagram of the battery-swapping ETBSm inside the swapping station is shown in Figure 1. The battery is arranged on the back of the front of the ETBSm. The lifting device removes the battery of low SOC from above the ETBSm, and the move battery device moves the fully charged battery to below the lifting device. Then, the suspension device replaces the fully charged battery in the heavy truck.
The ETBSm selected for the experiment is shown in Figure 2. The ETBSm includes a battery pack, PTC heater, pipelines in the thermal management system (wrapped in a silver insulation layer), waste heat recovery exchanger 1 (WHE), etc. The parameters of the ETBSm are shown in Table 1.

2.2. BSHT Dynamic Parameter

In this paper, the lithium iron phosphate (Li-FePO4) battery is selected for the ETBSm, and its parameters are shown in Table 2.

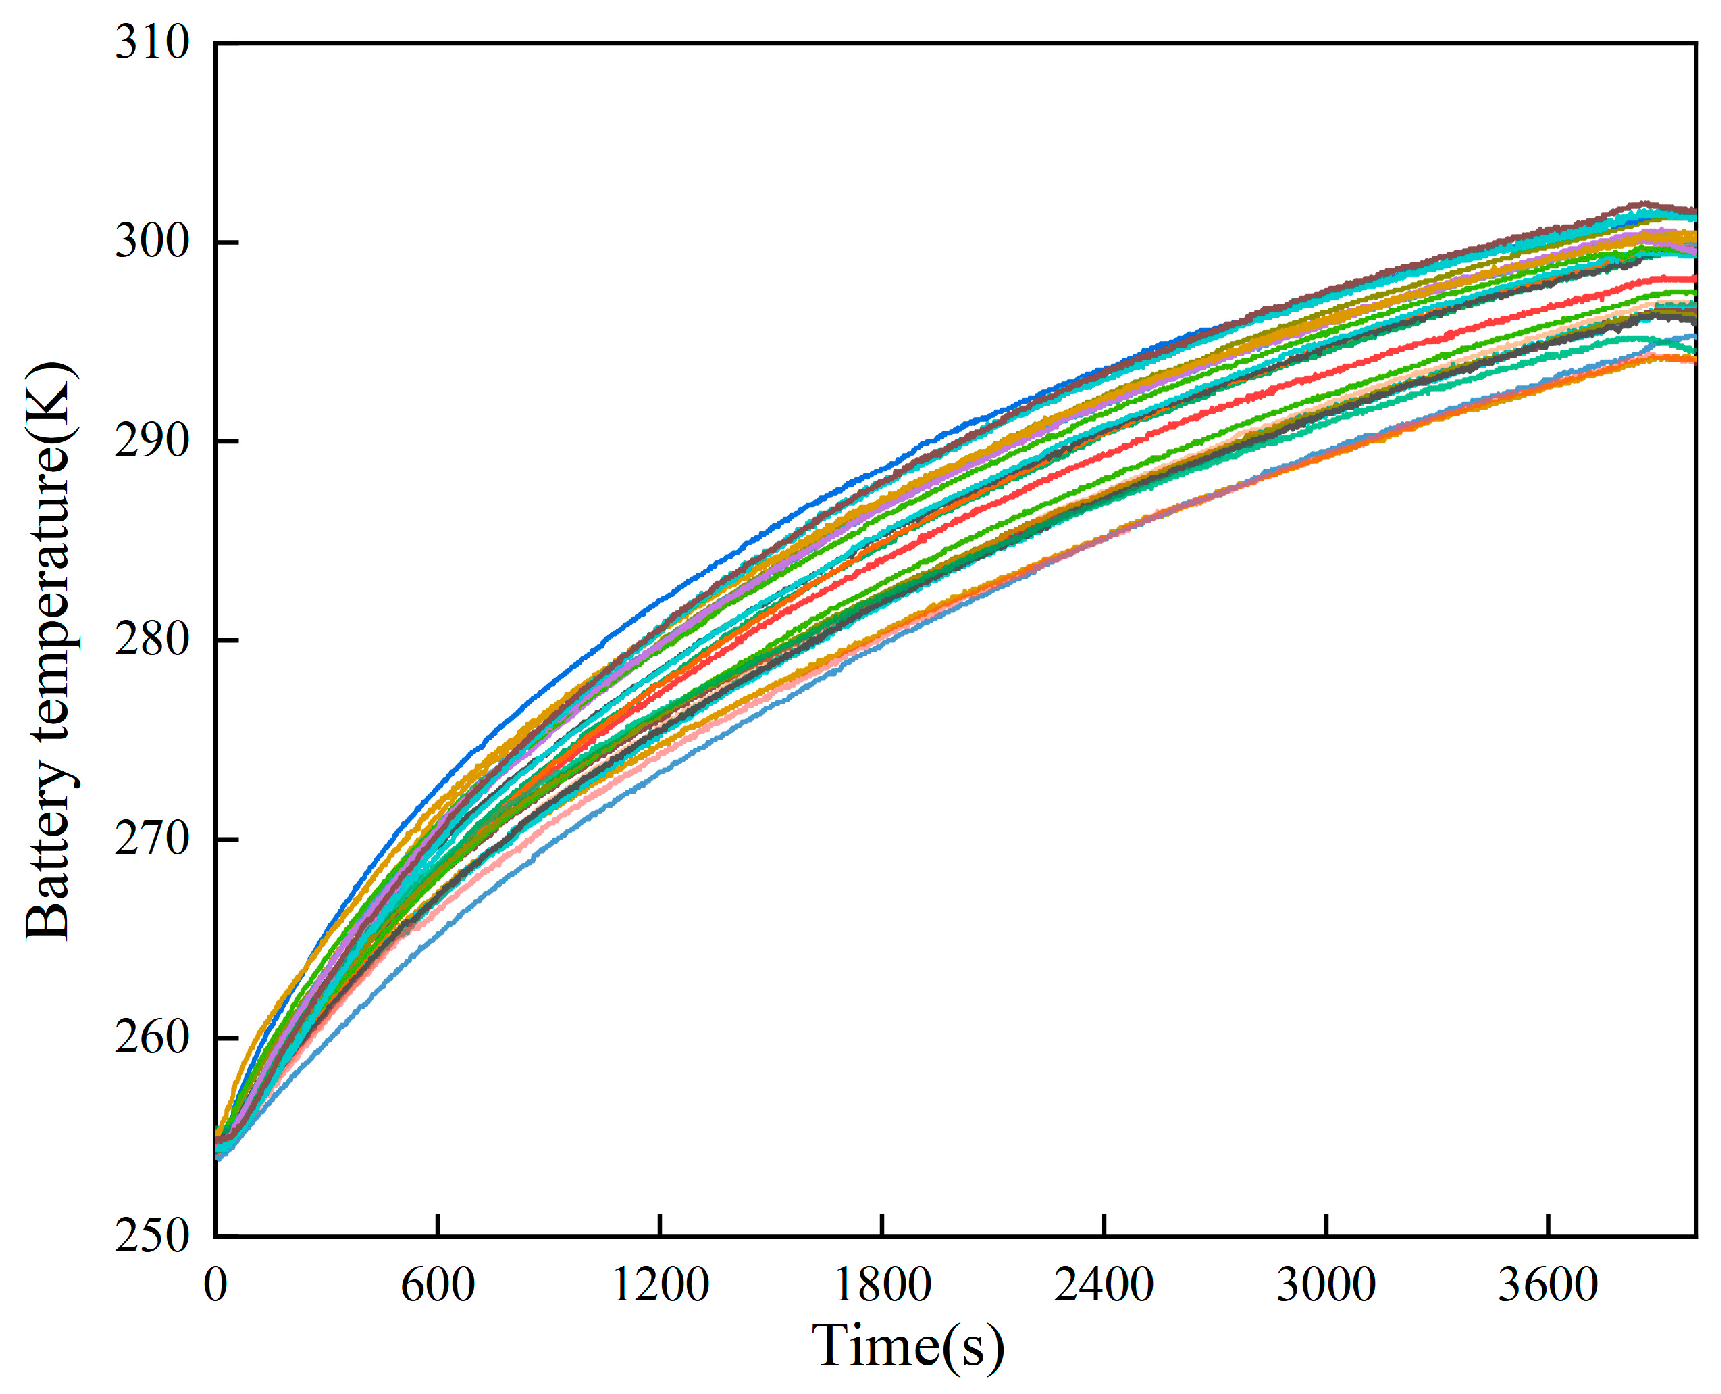
2.3. Testing for Battery

In total, 32 cells are tested without charging or discharging at an ambient temperature of 253 K. The experimental data of the battery temperature is shown in Figure 3. The experimental data show the coolant flow rate at the inlet of the battery liquid-cooling plate is 6 L/min and the temperature is 318 °C. The average battery temperature rises from 254.6 K to 296 K in 64 min, and the average temperature rate is 0.65 K/min.

3. Heat Transfer Frameworks and Temperature Control Strategy

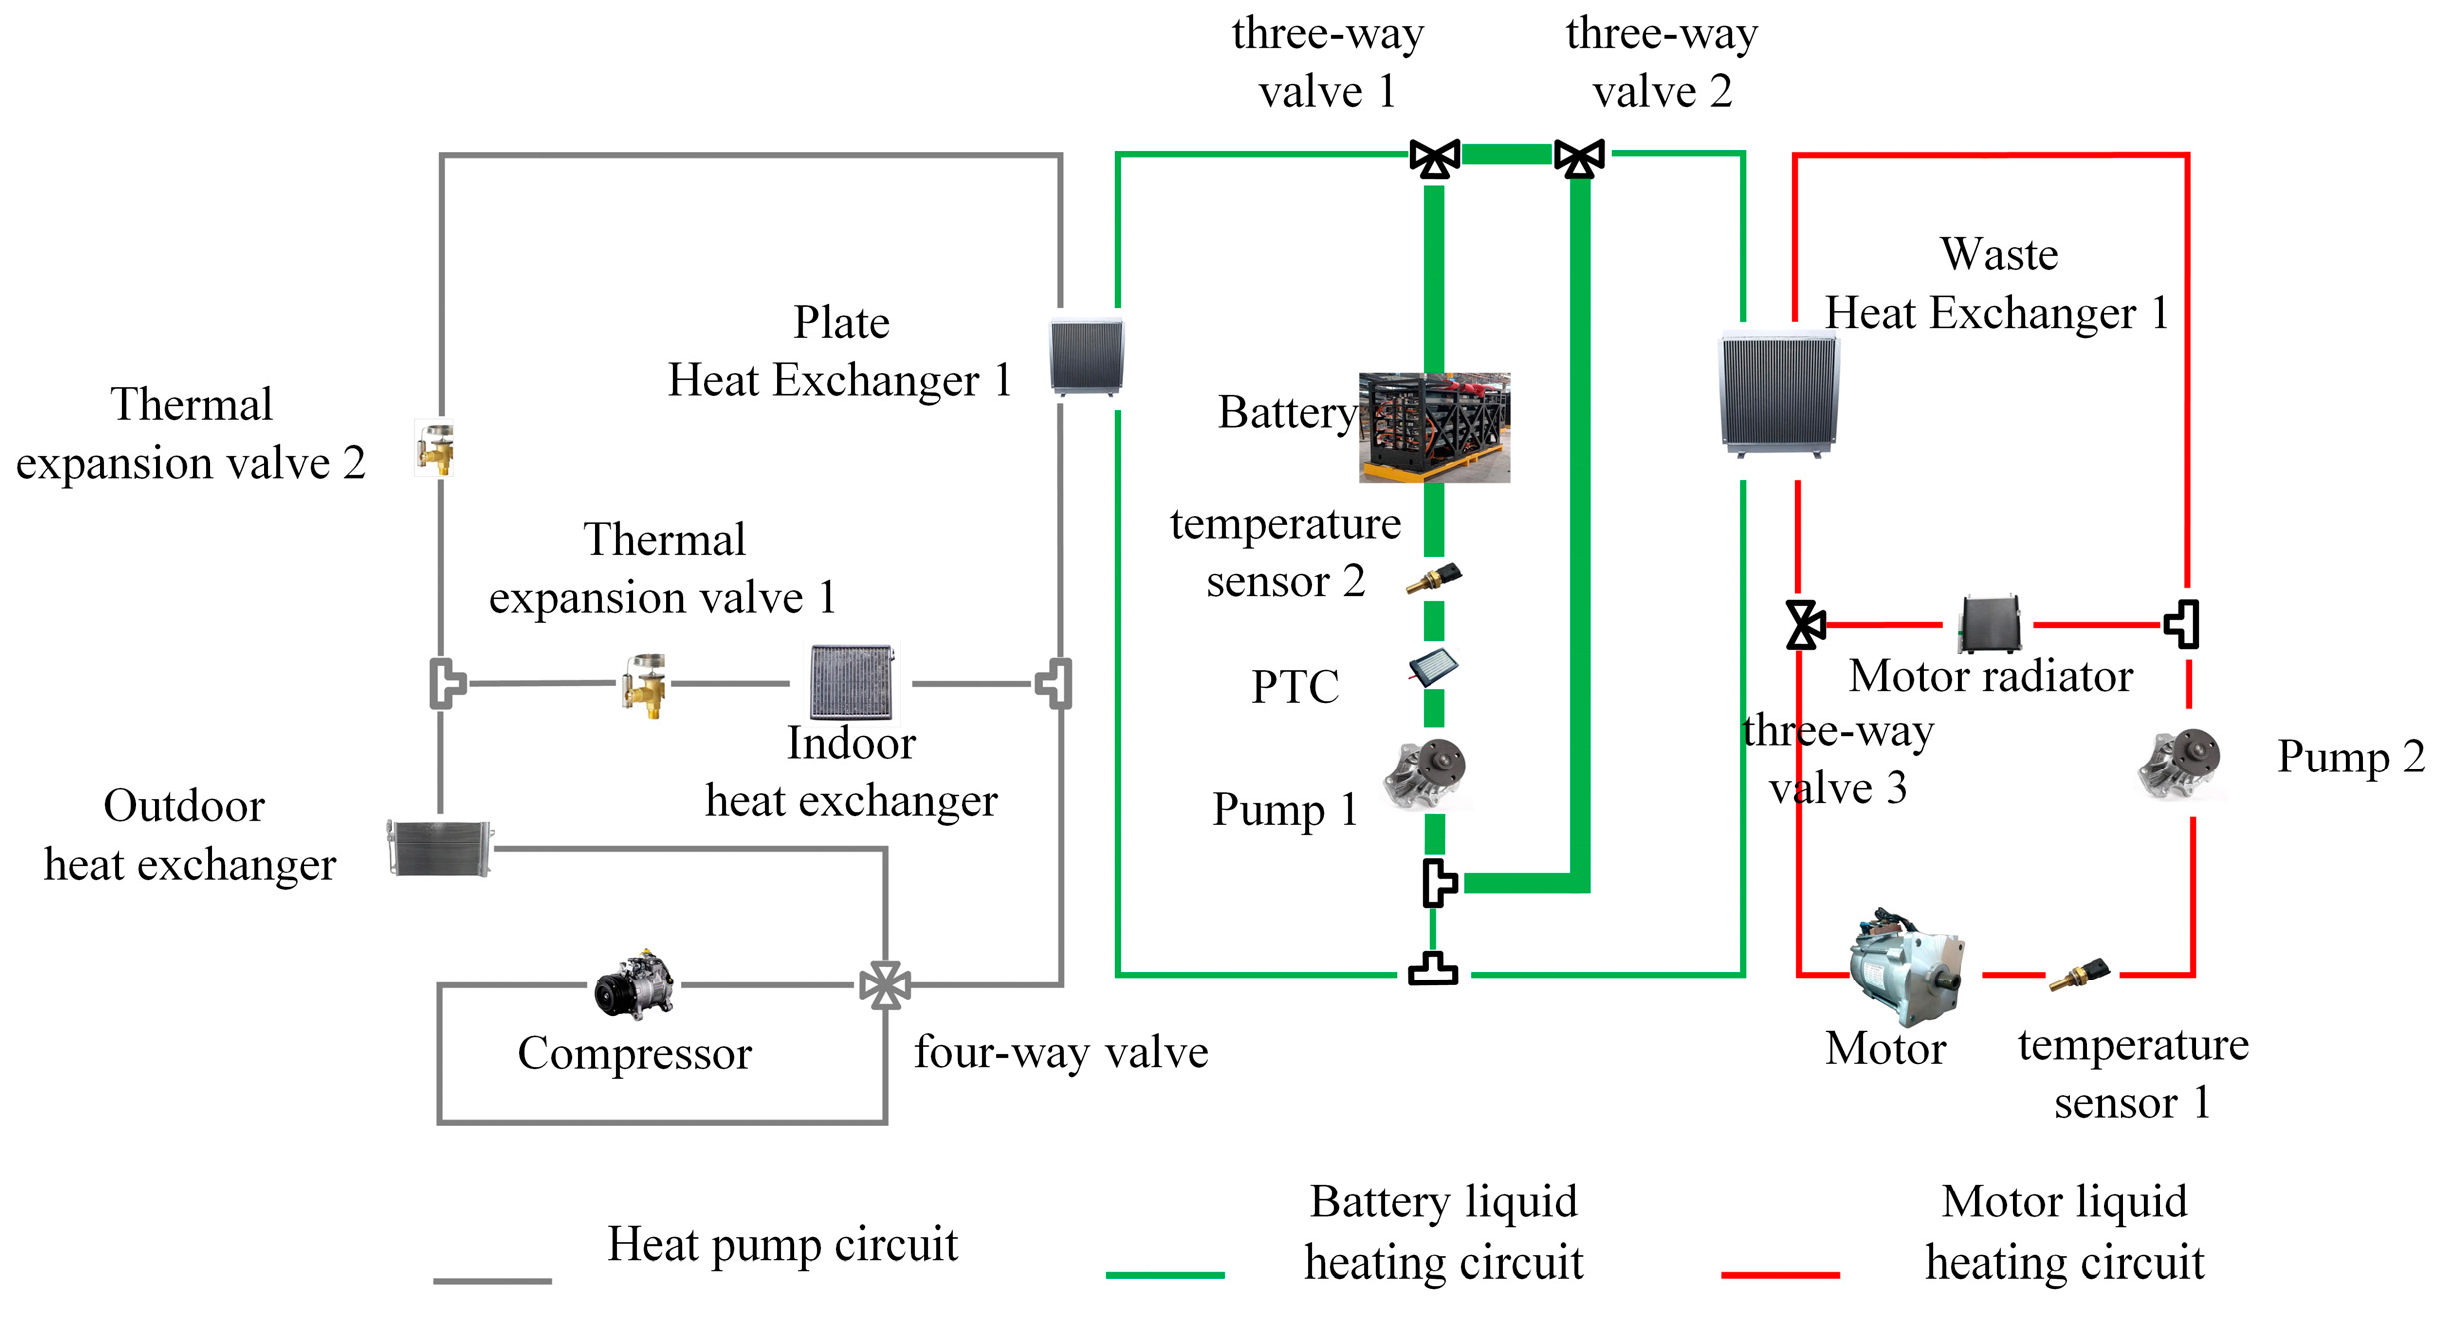
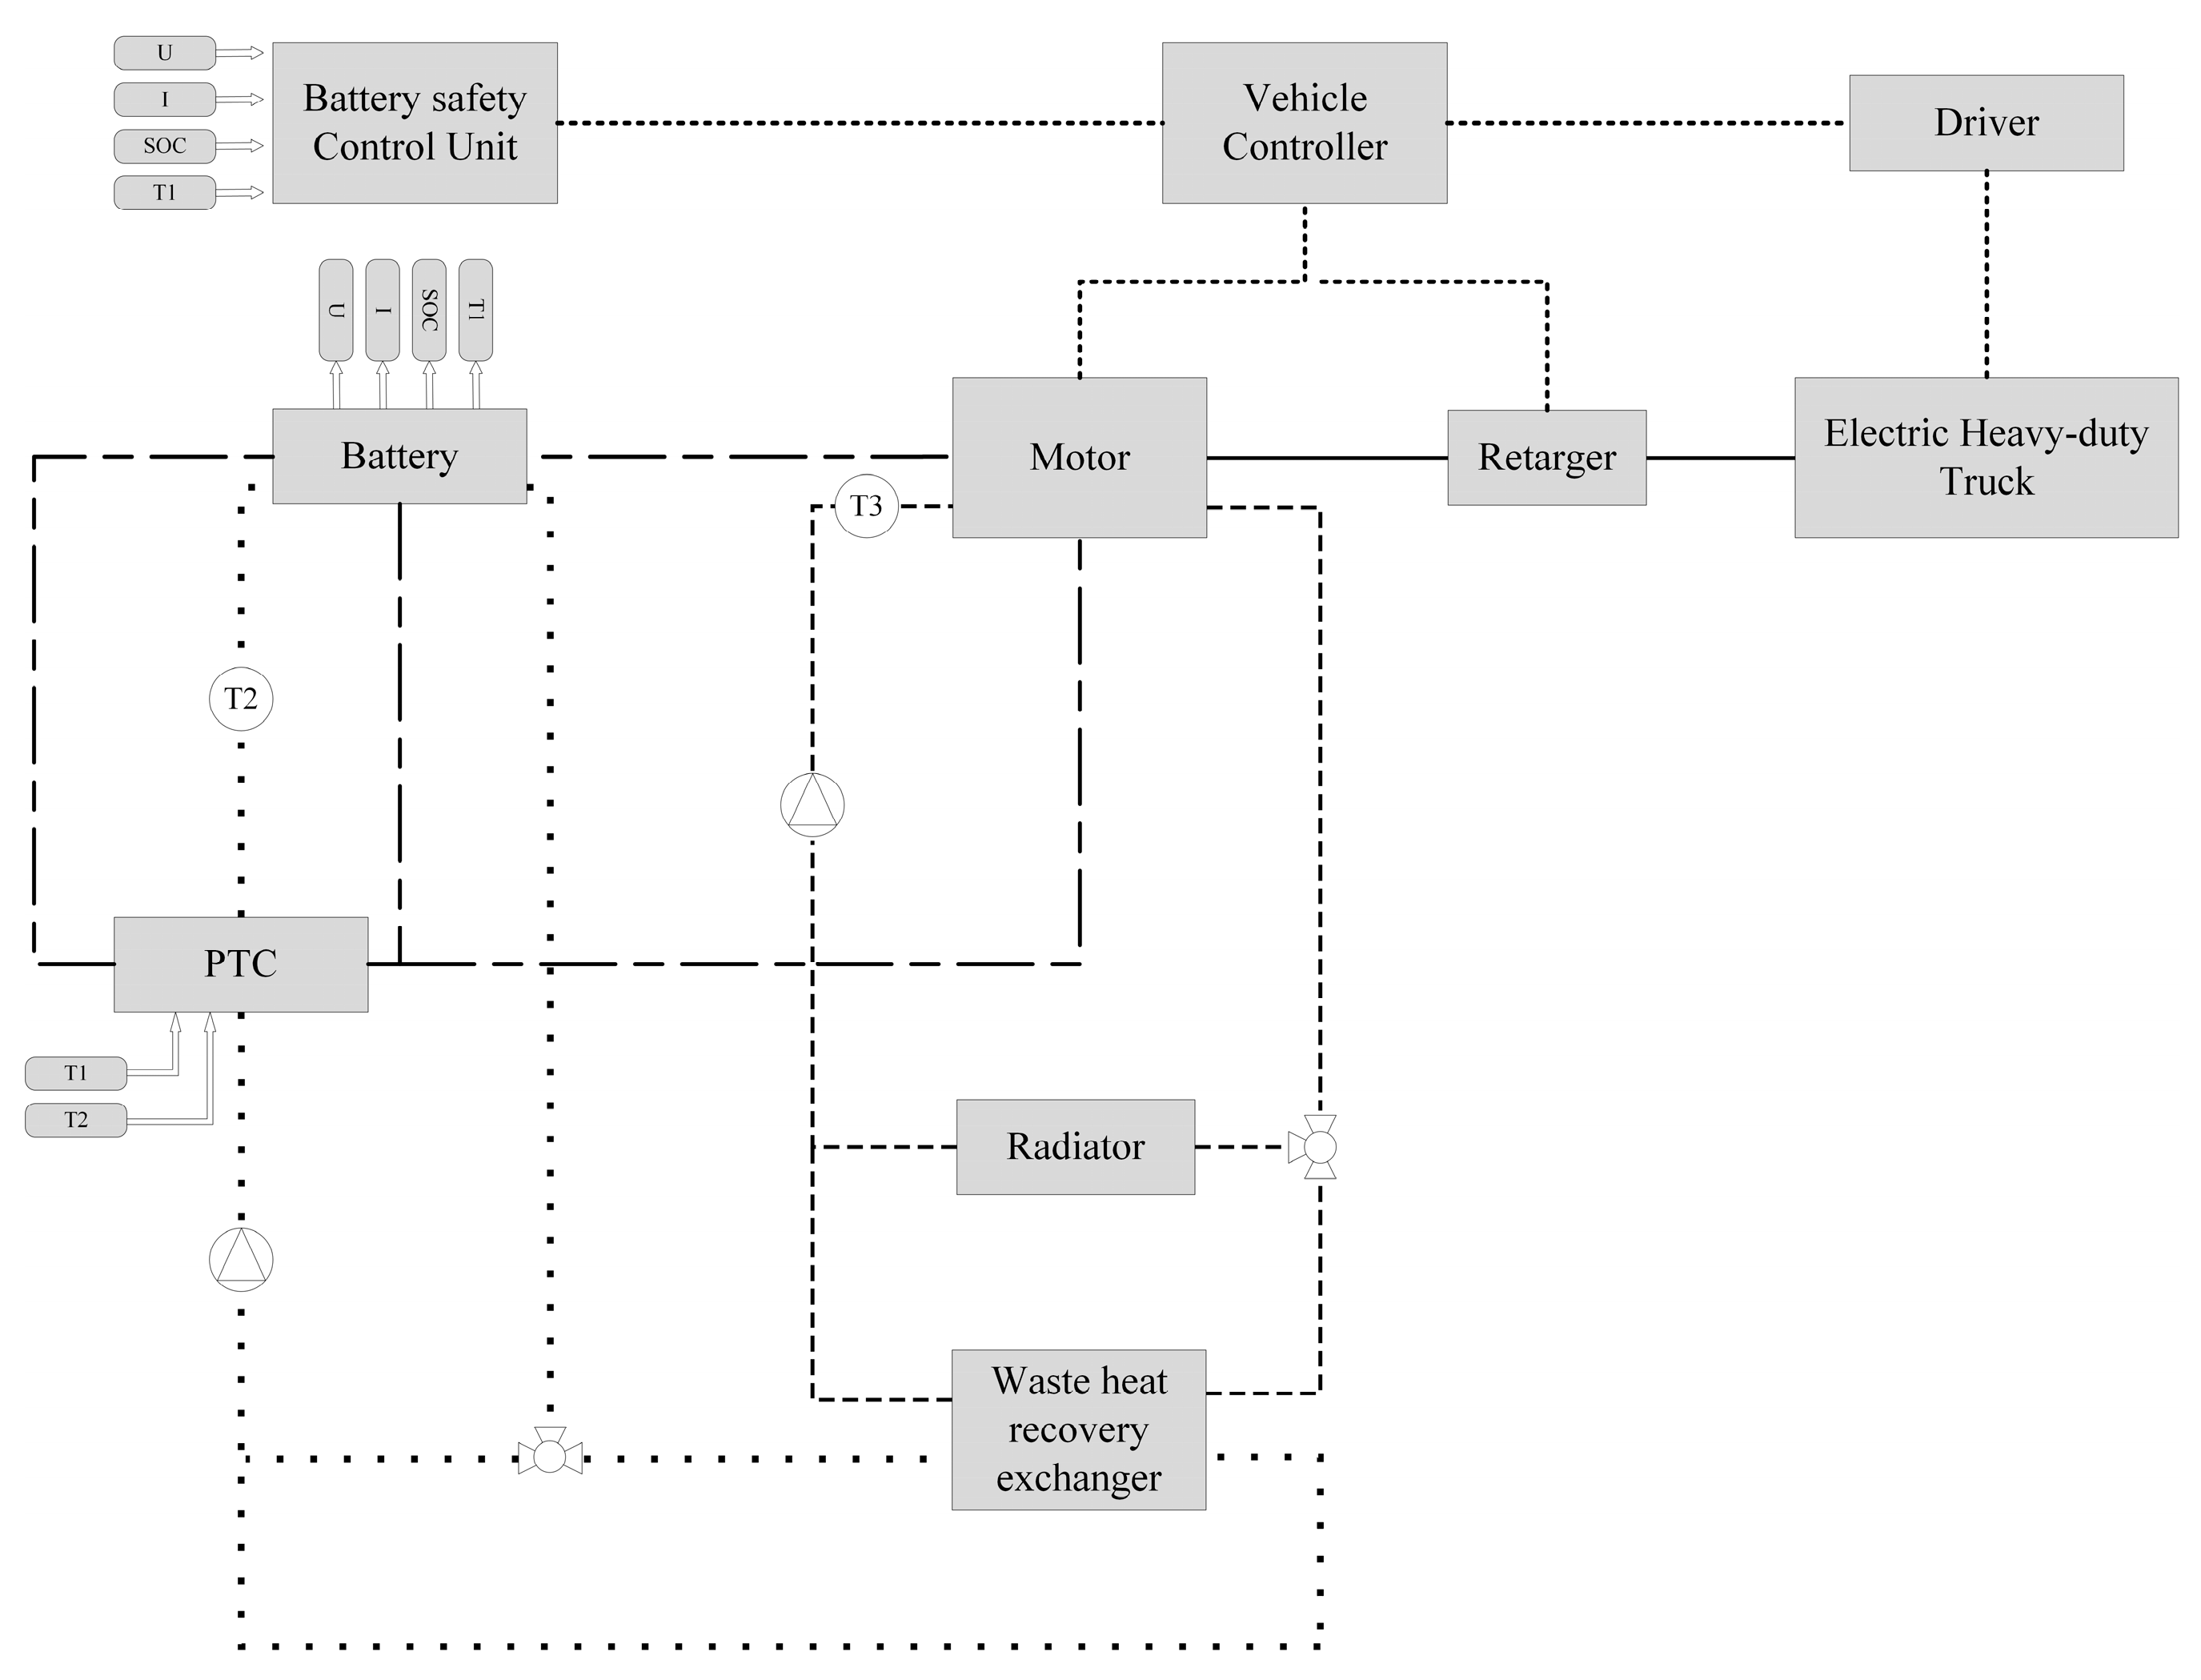
3.1. Integrated TMS Framework

Based on the distributed thermal management framework, an integrated thermal management system framework with MWHR is proposed to enhance the utilization efficiency of motor heat, as shown in Figure 4. Electronic three-way valves have been added to the battery coolant and motor coolant circuits, respectively. A waste heat recovery exchanger1 is added to enable the motor coolant to exchange heat with the battery coolant, and the motor waste heat is utilized to heat the battery with the coolant as the transfer medium, and the heat generated by the motor is used to heat the battery through the coolant instead of being emitted to the external environment.

3.2. Operation Mode

When the ETBSm is driven under the Chinese heavy-duty vehicle commercial vehicle test cycle (CHTC), the simulation mode is set as shown in Table 3: A. Motor waste heat is used to heat the battery; B. PTC is used to heat the battery; C. PTC and motor waste heat are used together to heat the battery. The control strategy of an integrated thermal management system is used in both working modes A and C. In working mode B, only the PTC is used to heat the battery up to 28 °C.
There are three different ways the coolant circulates in the integrated thermal management system during the heating process. These are illustrated in Figure 5a, which shows the PTC independent heating mode; Figure 5b, which shows the MWHR independent heating mode; and Figure 5c, which shows the PTC and MWHR cooperative heating mode.

3.3. Thermal Management System Control Strategy

The control strategy of the integrated thermal management system is shown in Figure 6. Battery target temperature 1 (TBtar1) is set to 20 °C, and battery target temperature 2 (TBtar2) is set to 28 °C.
When the battery temperature (TBAT) is lower than TBtar1, the PTC heater starts to work, and the power of the PTC heater is controlled according to the coolant temperature at the inlet of the battery liquid-cooling plate; when the coolant temperature at the inlet of the motor (TMc) is greater than 25 °C, the coolant in the battery circuit is controlled to flow through the WHE through a valve, and the WHE starts to work; otherwise, the WHE does not work. When the TBAT is greater than or equal to TBtar1, the PTC heater is turned off, and the motor waste heat is used as an independent heat source to provide heat. When the TBAT is greater than or equal to TBtar2, the heating system does not work.
It is important to note that when the motor waste heat is on, the PTC heating is also on. At this point, the two work in tandem to heat the battery together. When the temperature of the motor reaches the threshold, it damages the motor performance and affects the motor life. Therefore, when the motor temperature is greater than 65 °C, the motor needs to be cooled.

4. Modeling and Validation

4.1. Simulation Model

According to the motor waste heat recovery heating system, the simulation model is built, including the ETBSm model, battery model, TMS model, and so on.

4.1.1. ETBSm Model

The output torque and efficiency of the drive motor are determined from the data files obtained. The total power of the motor is:
P motorelec = v 3600 n ( C d A v 2 21.15 + m g f + m d v d t )
where, P motorelec is the total electric power of the motor (W), and v is velocity (Km·h−1).
The output speed and output torque of the reducer are:
w 2 = w 1 i
T 2 = T 1 × i
where, w 1 is input speed of the reducer (r·min−1), T 1 is input torque of the reducer (N·m−1), w 2 is output speed of the reducer (r·min−1), T 2 is output torque of the reducer (N·m−1).

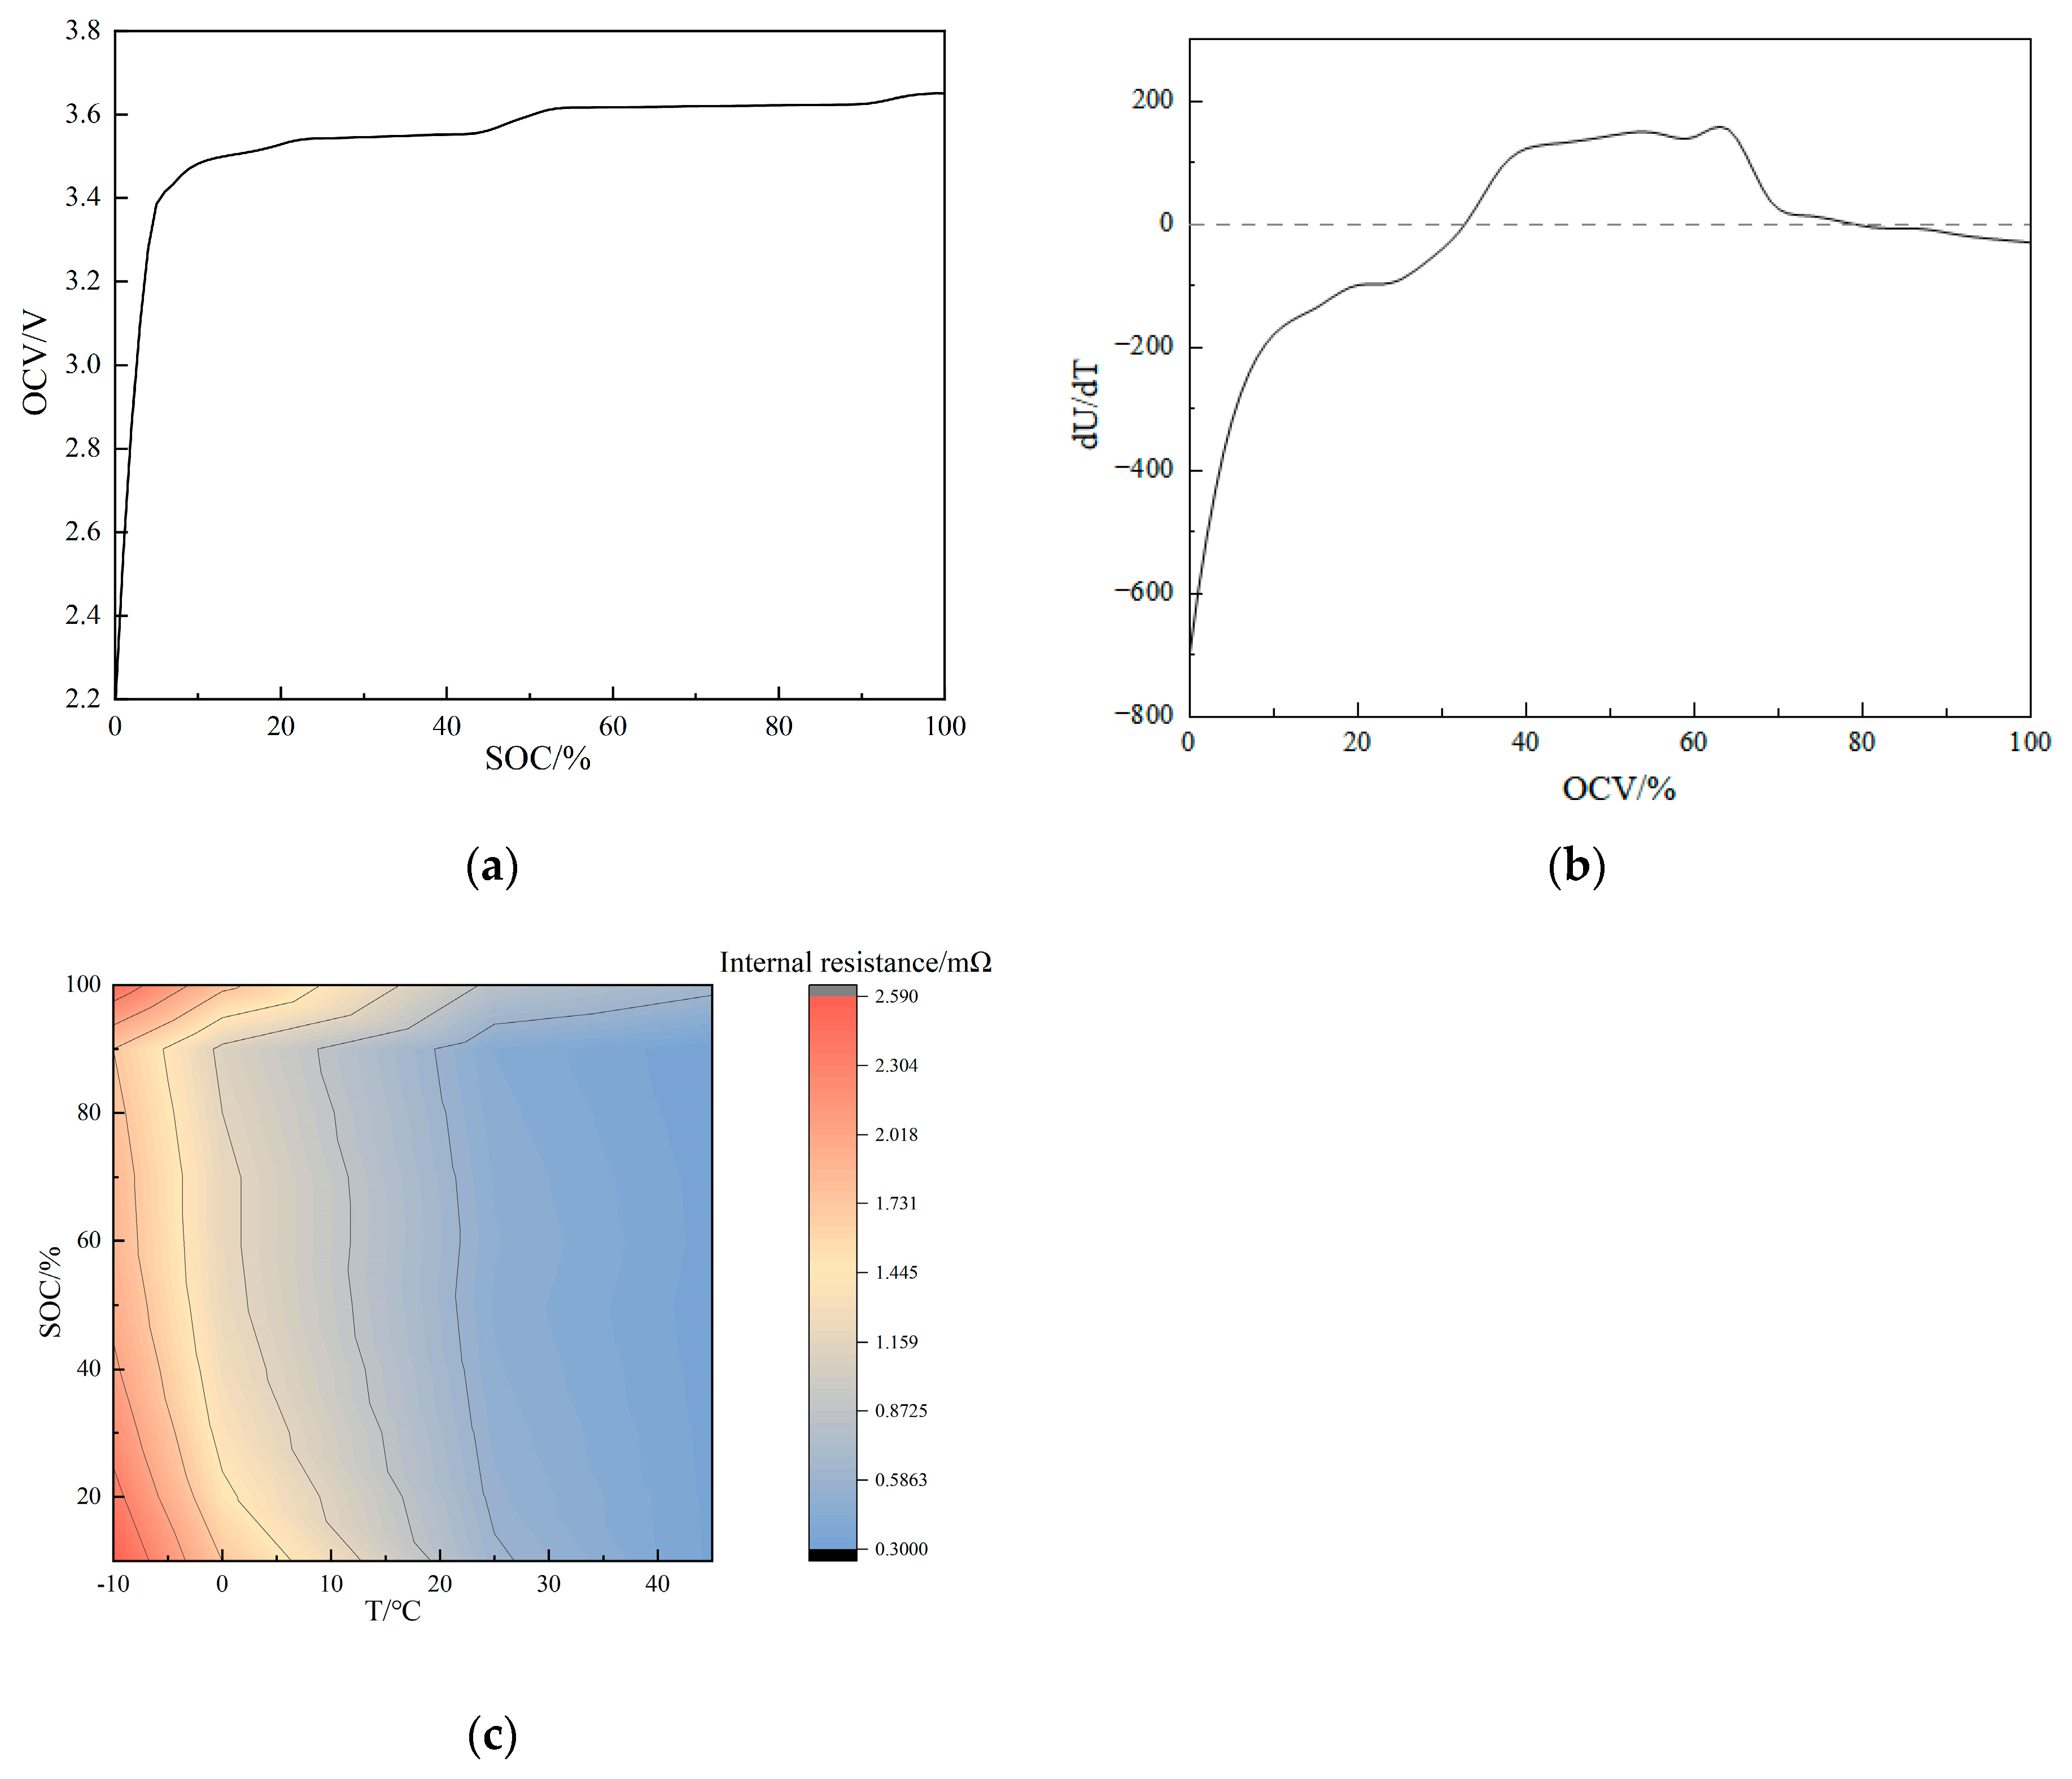
4.1.2. Battery Model

The battery is modeled using an equivalent resistance model. and entropy coefficients are chosen to model the entropic heat flow and open circuit voltage at different temperatures. The battery open-circuit voltage (OCV) varies with SOC, and the curve is shown in Figure 7a. The battery terminal voltage is:
U = U O C V I R 0
where, U is the battery terminal voltage (V), U O C V is the battery open circuit voltage (V), I is the battery Current (A), R 0 is the ohmic internal resistance of the battery (Ω).
Batteries need to meet power needs and heating needs with battery power:
P bat = P m o t o r e l e c + P P T C = U I
where, P bat is total electric power of the battery (W), P P T C is electric power of the PTC.
The battery is modeled using the entropy heat coefficient, where the entropy heat coefficient varies with open circuit voltage as shown in Figure 7b. The ohmic internal resistance changes with temperature and SOC value during battery discharge [35]. The internal resistance of the battery was measured by a hybrid pulse power characterization (hppc) experiment [36]. Throughout the experiment, data such as voltage and current of the battery were recorded. As shown in Figure 7c, the internal resistance of the battery ranges from 0.300 to 2.590 mΩ at different SOCs under the temperature range of −10 °C to 45 °C.
The internal resistance equation can be fitted as:
R 0 = ( 0.00274 × ( S O C 100 ) 3 + 0.00571 × ( S O C 100 ) 2 0.00373 × ( S O C 100 ) + 0.00149 ) ( 0.456 + 1.71 × e ( T B A T 17.4 ) )
Modeling of heat production during battery discharge from battery characteristics such as voltage and resistance [37]:
Q bat = I 2 R 0 I T 1 d U O C V d T
where, Q bat is battery self-generated heat (W), T 1 is the battery temperature (K).
In the cold temperature environment, the battery pack exchanges heat with the external environment in the form of convective heat transfer and radiant heat transfer, and the heat transfer amount is:
Q bat _ air = h 1 s ( T W a l l T a i r ) + σ ε s ( T W a l l 4 T a i r 4 )
where, Q bat _ air is heat transfer amount (W), h 1 is the heat transfer coefficient between battery pack shell and air (W·(m−2·K−1)), s is the contact area of the battery pack casing with air (m2), T W a l l is the temperature of the battery pack housing (K), T a i r is air temperature (K), σ is Stephan Boltzmann constant (5.67 × 10⁻⁸ W·m2·K4), ε is emissivity of the battery enclosure (take a value of 0.5).

4.1.3. Electric Motor Model

The mechanical power of the motor satisfied:
P m o t o r m e c = T m × w
where, T m is motor torque (N·m), w is motor speed (r·min).
Assuming that all of the motor’s lost power is converted to heat, the relationship between the motor’s lost power and the motor’s efficiency is:
n = P m o t o r l o s t P m o t o r e l e c
where, n is the motor’s efficiency.
The principle of heat exchange between the motor and the external environment is the same as that of the battery and is not repeated.

4.1.4. TMS Model

In this paper, the liquid is chosen as the medium to heat the battery. The liquid cooling plate is arranged at the bottom of the battery, and the source of liquid heat is divided into PTC and motor waste heat utilization. The heating power of the PTC is mainly related to the internal resistance of the PTC and also to the output voltage and current of the battery. The heating power of PTC is:
P P T C = R P T C I 2
where, R P T C is the resistance of the PTC heater (Ω). I is the current of the PTC heater (A). Set the target temperature of the PTC heater to 30 °C. When the coolant temperature at the inlet of the battery liquid cooling plate is lower than 30 °C, the PTC resistance value is 20~25 Ω. When the coolant temperature is greater than or equal to 30 °C, the resistance value rises rapidly, and the PTC heating power decreases to zero, which ensures that the PTC heats the battery coolant temperature with a maximum value of 30 °C.
The heat source for the battery-side coolant is PTC heating and motor waste heat. The way to utilize motor waste heat is for the motor liquid circuit coolant to absorb motor heat, then the motor coolant exchanges heat with the battery coolant, and finally, the battery coolant heats the battery. The value of motor heat absorbed by the motor circuit coolant is:
ϕ m o t o r = h m A m ( t m t m c )
where, ϕ m o t o r is the heat transmission (W). h m is the convective heat transfer coefficient between motor heat transfer surface and fluid (W/(m2·K)). A m is the heat transfer area in the motor (m2). t m is the temperature of the motor liquid circuit (K), t m c is the temperature of the coolant at the motor liquid circuit (K).
The motor circuit coolant and the battery circuit coolant exchange heat in the WHE. The amount of heat exchanged is:
ϕ e x = k A e x ( t f m t f b )
where, ϕ e x is the amount of the WHE (W), k is the heat transfer coefficient (W/(m2·K)), A e x is the heat transfer area in the WHE (m2), t f m is the temperature of the coolant at the motor liquid circuit in the WHE (K), t f b is the temperature of the coolant at the battery liquid circuit in the WHE (K).
The battery coolant exchanges heat with the battery’s heat at the liquid cooling plate. In summary, the heat absorbed by the battery satisfied:
Q b = Q P T C + Q m o t o r + Q b a t Q b a t _ a i r Q m o t o r _ a i r
The temperature of the battery can be calculated:
T b 1 = T b 2 + Q b c ρ m
where, T b 1 is the current battery temperature (K), T b 2 is the initial battery temperature (K), c p is the specific heat capacity of a battery (J/(kg·K)), and m is the quality of the battery (kg).

4.2. Validation of the Simulation Model

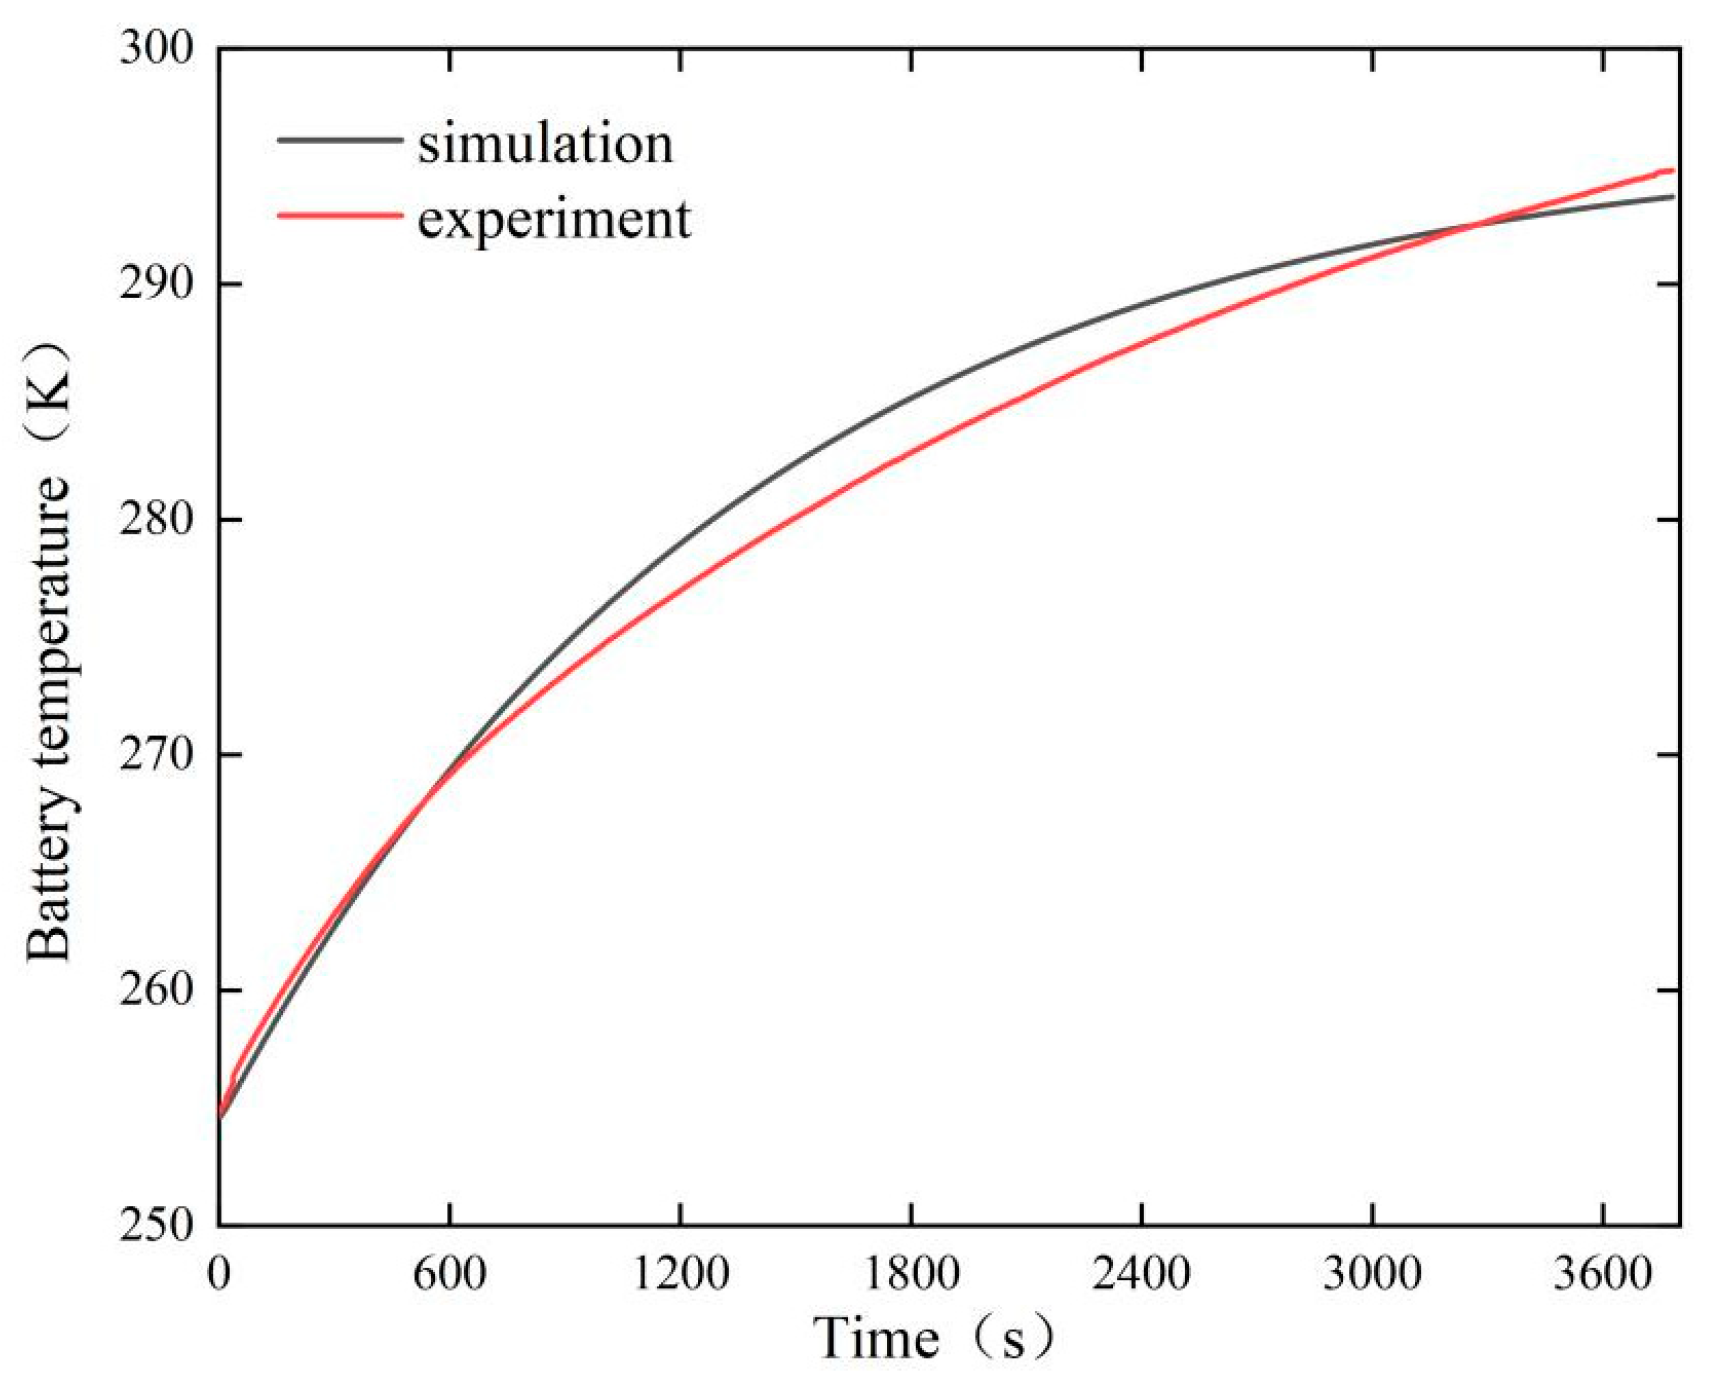
4.2.1. Battery Temperature Rise Rate

The simulation validation of the battery’s temperature rise rate is displayed in Figure 8. The simulation shows that the cells average temperature rise rate is 0.61 °C/min over 64 min. Compare this with the average temperature of the cells in the experiment shown in Figure 3. The maximum value of the relative error of the cell’s temperature is less than 2%. This proves the accuracy of the heating area and heat transfer coefficient of the battery liquid cooling plate model.

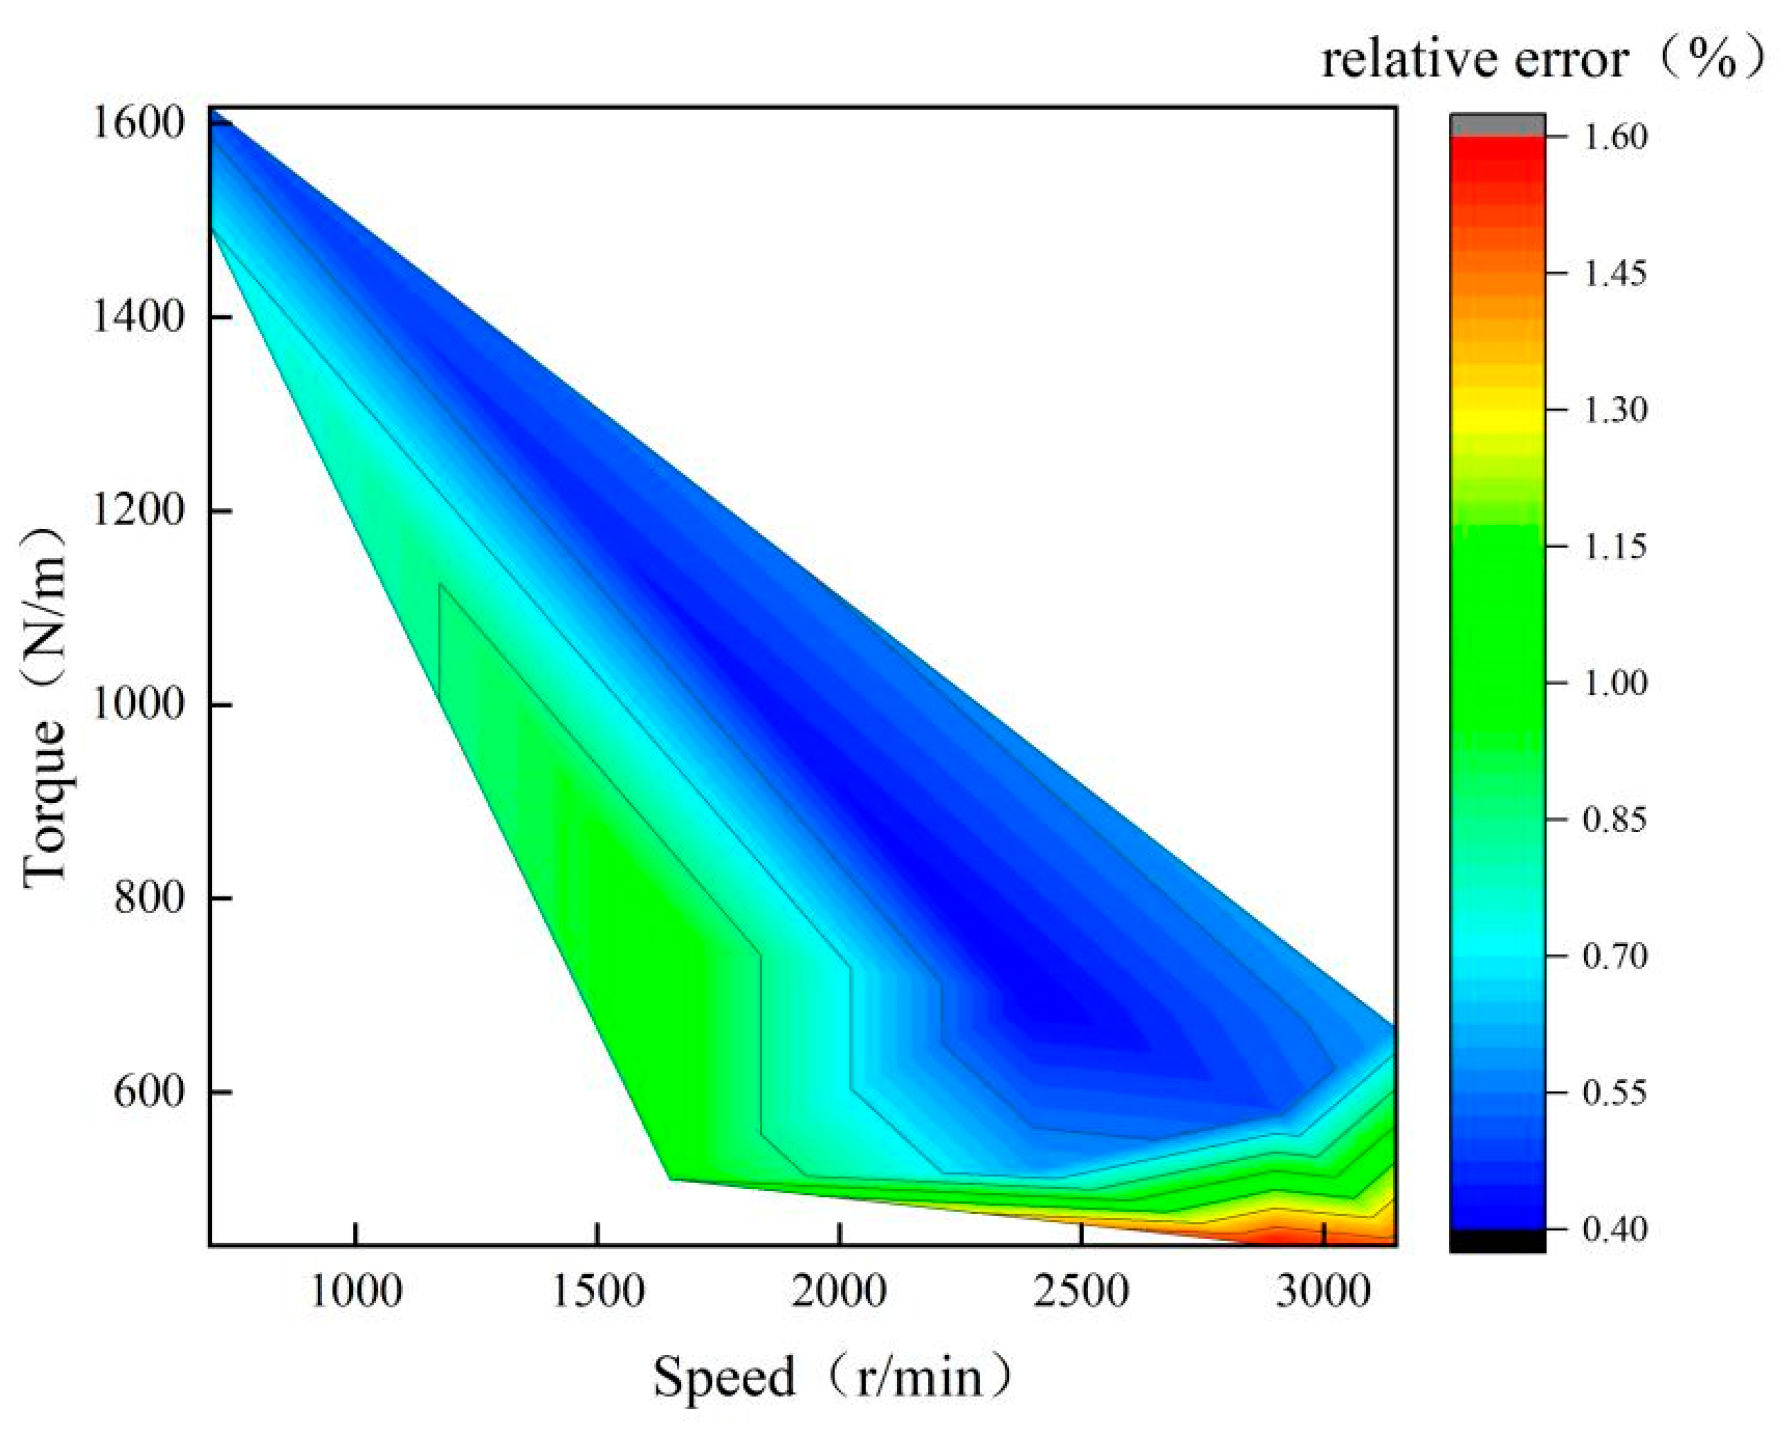
4.2.2. Motor Efficiency

The motor efficiency is related to the heat production of the motor and the simulation verification of the motor efficiency as shown in Figure 9. The results show that the maximum value of the relative error of the simulation is less than 2% with the same rotational speed and torque. It proves that the motor efficiency and motor heat production are within the allowable error.

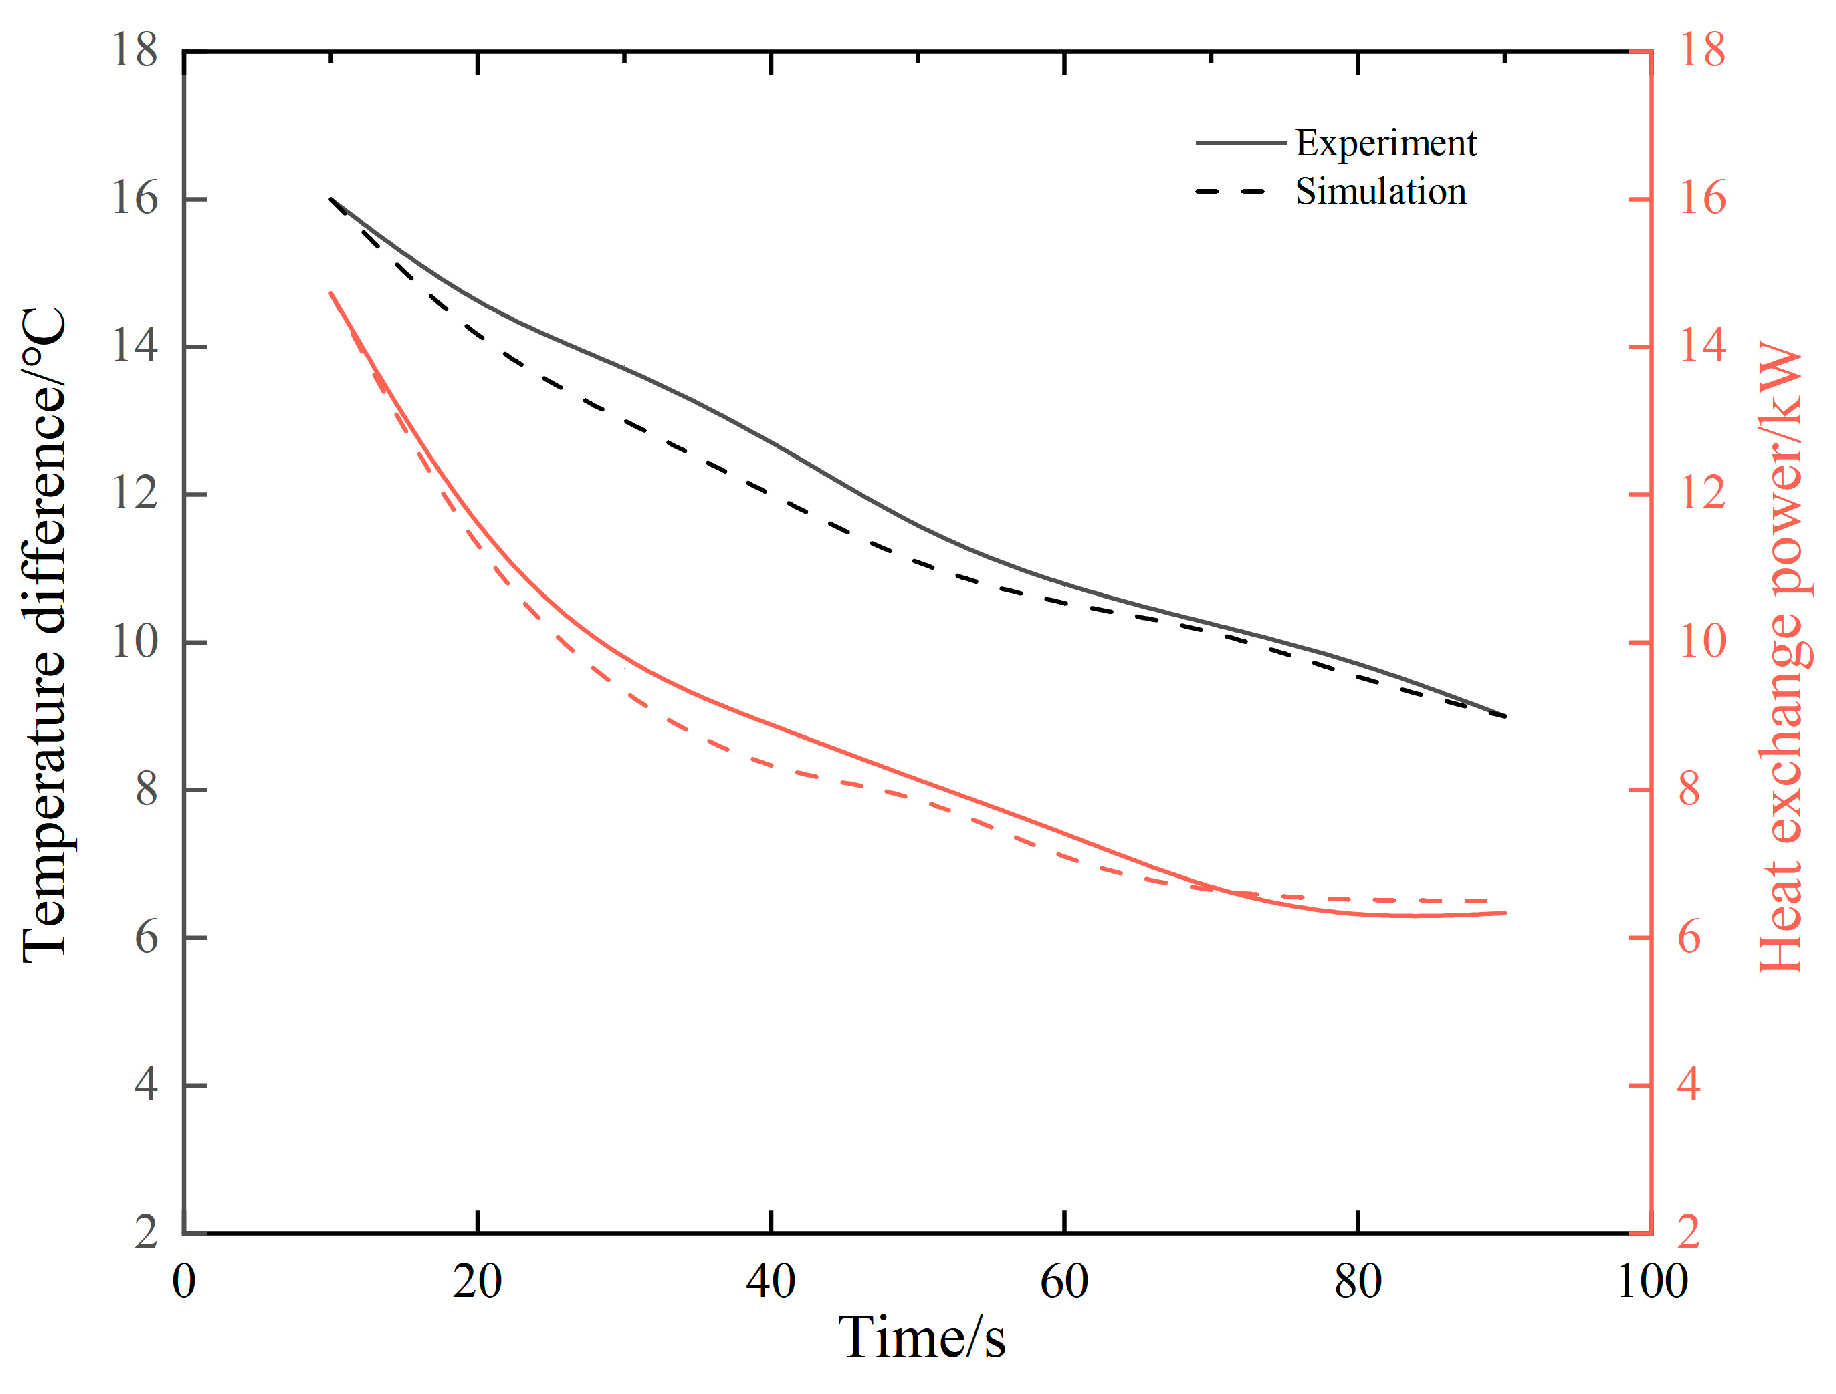
4.2.3. Waste Heat Recovery Exchanger

Figure 10 shows the temperature difference between the hot and cold ends of the WHE and the heat transfer power with time during the experiment and simulation. The initial conditions of the experiment and simulation are consistent. The inlet temperature of the coolant at the motor liquid circuit and the inlet temperature of the coolant at the battery liquid circuit in the WHE are set to be 30 °C and 21 °C, respectively. The experimental time is 90 s, and finally the outlet temperatures of the coolant at the motor liquid circuit and the battery section are measured to be 28 °C and 25 °C, respectively. From Equation (13), the finally average heat exchange is about 6.3 kW. The error between experiment and simulation is less than 5%. This experiment can provide a reference for the efficiency of the WHE.

4.3. Simulation Model Framework

After verifying the modeling accuracy, the ETBSm simulation model built by associating the ETBSm, battery, motor, and thermal management system is shown in Figure 11.
The Chinese heavy-duty vehicle commercial vehicle test cycle (CHTC) is used, and the driving speeds under this condition are shown in Figure 12. When analyzing battery temperature and coolant temperature, 4 CHTC cycles are performed. About 10 CHTC cycles are performed when analyzing power consumption and driving range.

5. Results and Discussions

5.1. TMS Performance for ETBSm

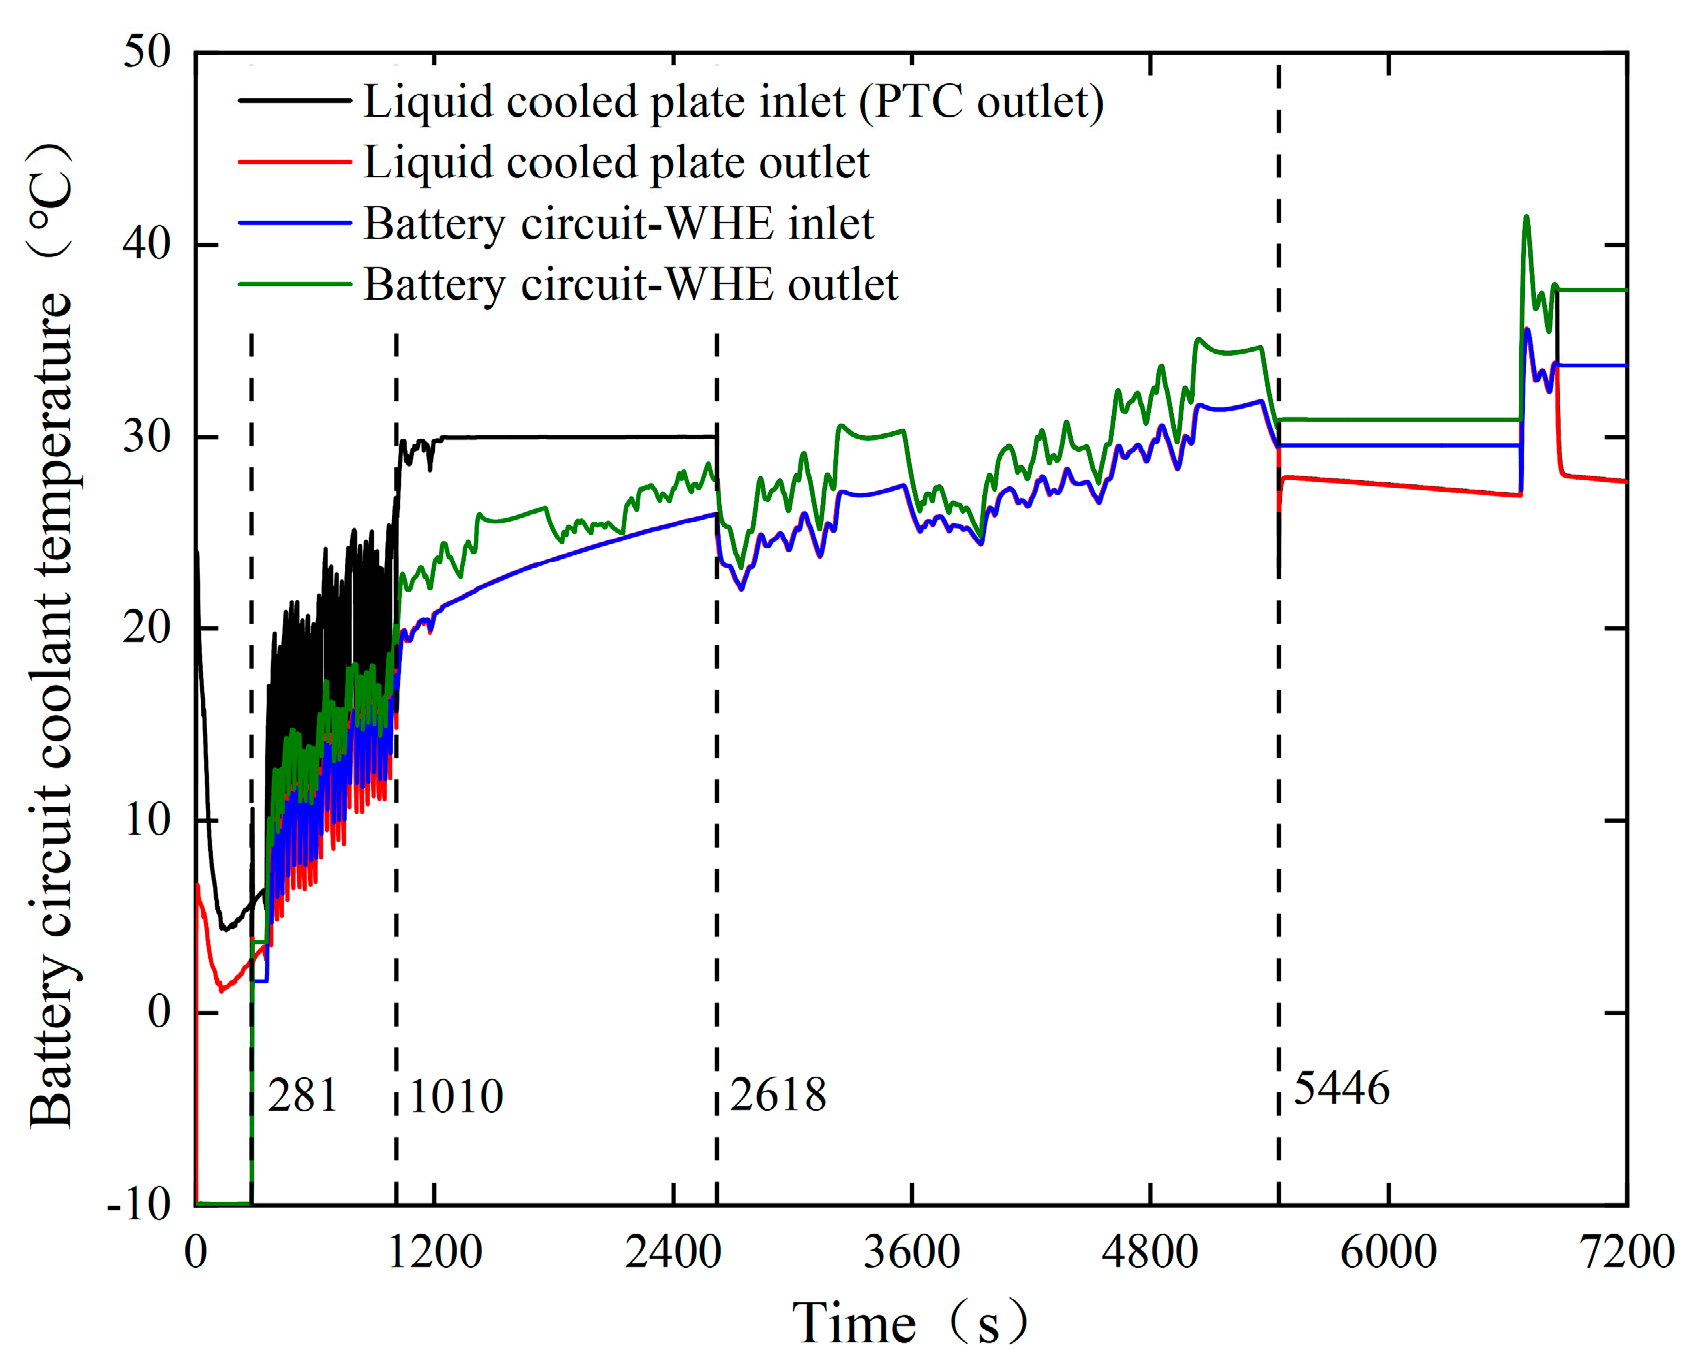
5.1.1. Coolant Temperature

The coolant temperature in the battery circuit in working mode C is shown in Figure 13. Because Tptctar is 30 °C, the coolant temperature at the inlet of the battery liquid cooling plate in the early stage (before 2618 s) is the highest Tptctar. However, in the late stage of heating, the PTC heater does not work, and the motor residual heat alone heats the battery, at which time the coolant temperature at the inlet of the battery liquid-cooling plate changes, showing a trend of decreasing and then increasing, and it cannot be stabilized at Tptctar.
The status of the PTC and MWHR at different times for working mode C is shown in Table 4. In Period 1, the MWHR mode is off, and the PTC heater provides all the coolant heat in the battery circuit. After Period 1, the MWHR mode is turned on. In Period 2, the MWHR mode is in the cycle of intermittently turning on or off. After Period 2, the MWHR is in the state of always on. Especially in Period 4, the PTC heating is turned off and the MWHR is used as an independent heat source to heat the coolant.
The temperatures of the coolant in the motor circuit and the coolant in the battery circuit in the WHE are shown in Figure 14. The temperature of the coolant in the battery circuit at the inlet of the WHE is approximately equal to the temperature at the outlet of the liquid cooling plate. The temperature fluctuation trend of the coolant in the motor circuit at the inlet of the WHE is indirectly related to the driving conditions of the vehicle. In Period 1, the temperature of the coolant in the motor circuit rises gradually. After Period 1, the temperature of the coolant at the inlet of the WHE in the motor circuit reaches 25 °C, and the waste heat recovery mode is turned on, and the temperature of the coolant in the battery circuit at the inlet of the WHE shows a relatively uniform rising trend.

5.1.2. Battery Temperature and Temperature Rise Rate

The battery temperatures under working modes A to C are shown in Figure 15, and the maximum temperature of the battery is 15.3 °C, 27.3 °C, and 28 °C, respectively. Among them, both working modes B and C can make the battery temperature reach TBtar1, and the heating time is 2980 s and 2618 s. Working mode C makes the battery temperature reach TBtar2 in 5446 s.
The batteries generate heat spontaneously when the ETBSm are driven in the CTHC condition. Working mode A has the slowest temperature rise rate at 0.21 °C/min.
In working mode B, the battery temperature rise rate is 0.6 °C/min in 0~2980 s; in 2980~7200 s, the temperature rise rate of the battery decreases to 0.1 °C/min. The reason for the decrease in the temperature rise rate is the decrease in the temperature difference between the coolant at the battery end and the battery. Working mode C has the fastest battery temperature rise rate within 0~2681 s when the temperature rise rate is about 0.69 °C/min. Within 2681~5446 s, the battery temperature rise rate decreases to 0.17 °C/min when the motor waste heat is used as an independent heat source to heat the battery. The comparison reveals that the temperature rise rate of working mode B is increased by 185.7% relative to that of working mode A within the time of heating the battery to 20 °C. The temperature rise rate of working mode C is increased by 15% relative to that of working mode B.
In summary, at an ambient temperature of −10 °C, the battery cannot be heated to the target temperature only by relying on the waste heat of the motor. The PTC heater has the most obvious effect on improving the temperature rise rate of the battery, and the utilization of the waste heat of the motor based on PTC heating can further improve the temperature rise rate.

5.1.3. Power Consumption and Driving Range

This paper compares and analyzes the heating power consumption in three different working modes in the 18,000 s. The power consumption of the entire vehicle can be broadly classified into driving power and heating power. Under CHTC, the difference in driving power is small and not the primary objective of the analysis, and thus, only the difference in heating power is analyzed. The comparison of heating power is shown in Figure 16, and the heating power of working mode C is further divided into PTC power and WHRE heat power, as shown in Figure 17.
Working modes B and C are compared to determine their impact on PTC heating power. The analysis showed that both modes exhibited a general downward trend in PTC heating power. However, the initial state of PTC heating power is higher in working mode B, and its trend showed a linear decline. On the other hand, working mode C showed an increase in PTC heating power in some stages. This is due to the utilization of residual heat from the WHRE power, which declined during that time. To meet the heating demand, PTC heating power increased. The final energy consumption of PTC in working mode B is approximately 21.77 kW·h, while the final energy consumption of PTC in working mode C is approximately 11.13 kW·h. This means that the energy consumption in working mode C reduced relatively by 10.64 kW·h, which accounts for about 95.6%.
The driving range of the ETBSm is directly affected by the power consumption of its PTC. Figure 18 shows a comparison of the driving range under different modes. Mode A offers the largest driving range, followed by mode C and then mode B. Mode A has a maximum driving range improvement of 11.9 km as compared to mode B, but the battery temperature rise rate has not been taken into consideration. For mode C compared to mode B, the driving range improvement is approximately 3.7 km, 5.6 km, and 5.6 km at 25%, 50%, and 75% SOC consumption. The relative proportion of the improvement value is 10.2%, 6.8%, and 4.4%.
To summarize, among the different working modes, working mode A has the lowest power consumption and the longest driving range. However, it has a slower battery temperature rise rate and is not compared to the other modes further. During the heating phase, working mode B has the highest power consumption, whereas working mode C can fulfill both the heating rate and power consumption requirements simultaneously. The driving range improvement of working mode C increases with time in absolute value, but the percentage of driving range improvement decreases with time.

5.2. Ambient Temperature

5.2.1. Temperature Characteristics

Based on working mode C, the characteristics of the influence of ambient temperature on the battery temperature and temperature rise rate are analyzed. It is assumed that the initial battery temperature is the same as the ambient temperature. The battery temperatures at ambient temperatures set to 0 °C, −10 °C, and −20 °C are shown in Figure 19. The results show that the battery temperature all rises faster in the initial stage and then slows down. The time for the battery to reach TBtar1 at initial temperatures of 0 °C, −10 °C, and −20 °C is 1918 s, 2618 s, and 3217 s, respectively, and the temperature rise rates are 0.63 °C/min, 0.69 °C/min, and 0.75 °C/min. The time for the battery temperature to reach TBtar2 is 4826 s, 5446 s, and 6844 s, respectively, and the temperature rise rates of the battery in the time from TBtar1 to TBtar2 are 0.17 °C/min, 0.17 °C/min, and 0.13 °C/min, respectively.
The lower the ambient temperature, the longer it takes for the battery to rise to the target temperature, but the greater the rate of temperature rise in the time it takes for the battery to reach the initial temperature of TBtar1. After the ambient temperature is lowered from 0 °C to −10 °C, the heating time is relatively extended by 36.5% and the temperature rise rate is relatively increased by 9.5%; after the ambient temperature is lowered from −10 °C to −20 °C, the heating time is relatively extended by 22.9% and the temperature rise rate is relatively increased by 8.7%.
Because the thermal management control strategy formulates the same maximum value of coolant temperature at the inlet of the battery liquid cooling plate, the lower the initial temperature of the battery, the greater the temperature difference between the coolant and the battery, and the greater the temperature rise rate.

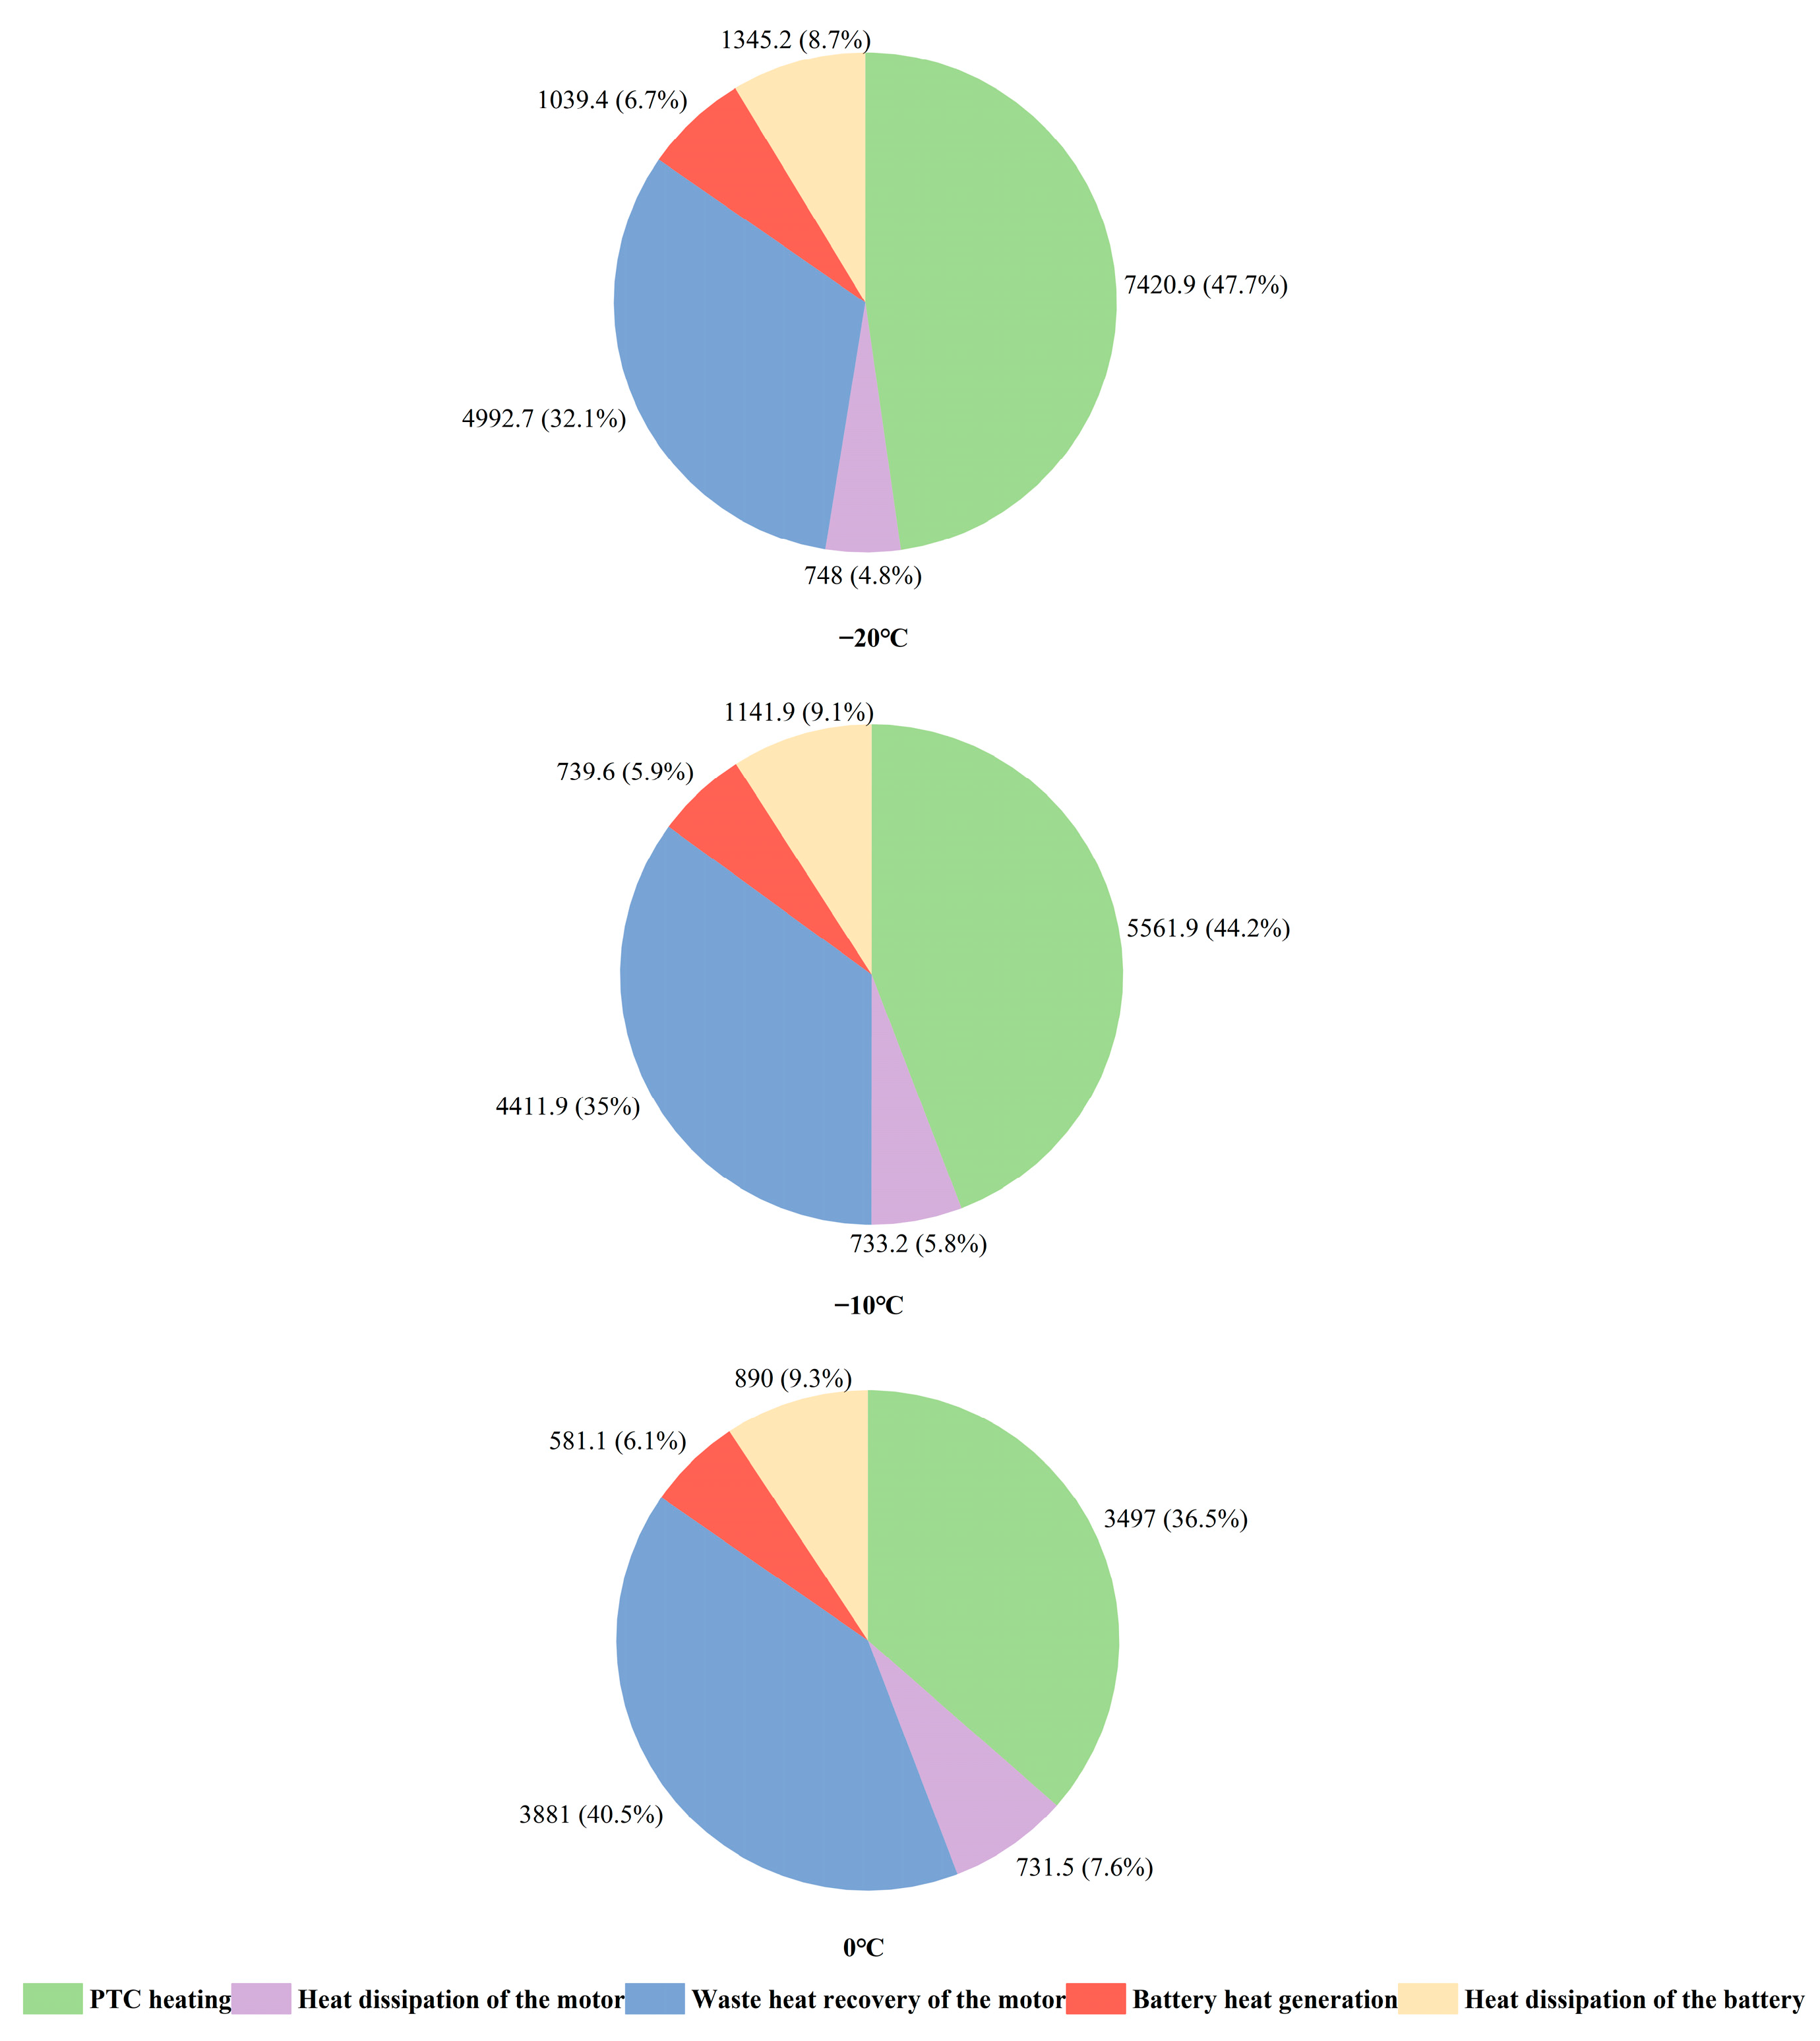
5.2.2. Heat Flow Chart

At different ambient temperatures, the performance of MWHR varies. To analyze this difference, the average values of a total of five heats, namely, PTC heating, heat dissipation of the motor, waste heat utilization of the motor, battery heat generation, and heat dissipation of the battery, are taken to form a pie chart as shown in Figure 20, in which the average value of the individual heats and the ratio of the percentage of heat is also given in the chart.
Lower ambient temperature and increased heating demand cause changes in the heat of each part. The larger driving range of changes is the PTC heating capacity and the waste heat utilization of the motor; the law is as follows: The ambient temperature decreases from 0 °C to −10 °C and −20 °C; the PTC heating capacity increases, from 3497 W to 5561.9 W and 7420.9 W, respectively; the proportion of all the heat increases, from 36.5% to 44.2% and 47.7%, respectively; the waste heat utilization of the motor increases, from 3881 W to 4411.9 W and 4992.7 W, respectively; but the proportion of all heat decreases, from 40.5%, 35%, and 32.1%, respectively. The absolute value of the spontaneous heat production of the battery increased due to the increase of the internal resistance of the battery when the ambient temperature decreased. Moreover, the temperature difference between the battery and the environment is larger, and the heat emitted from the battery to the air also increases.

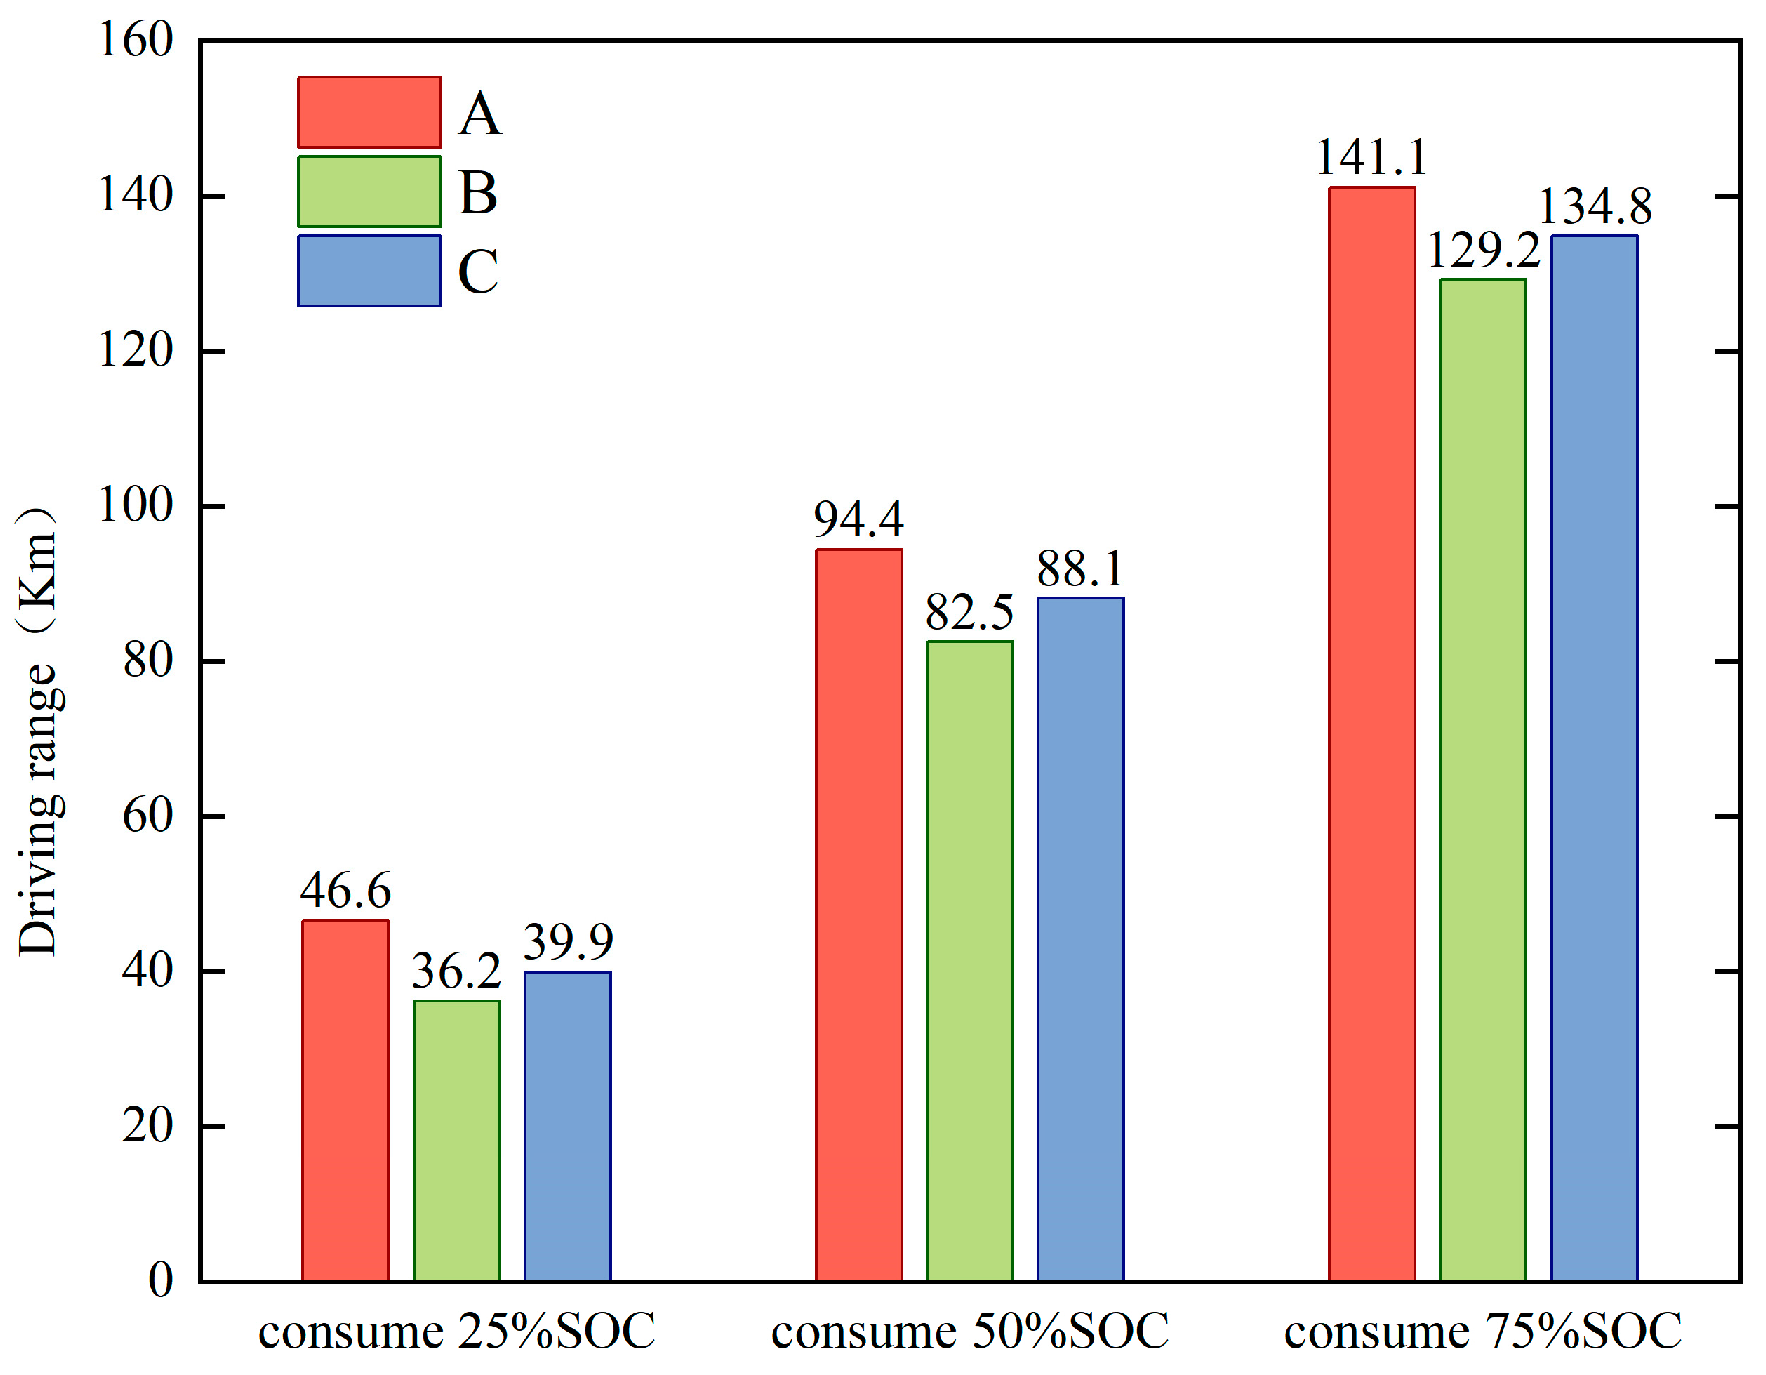
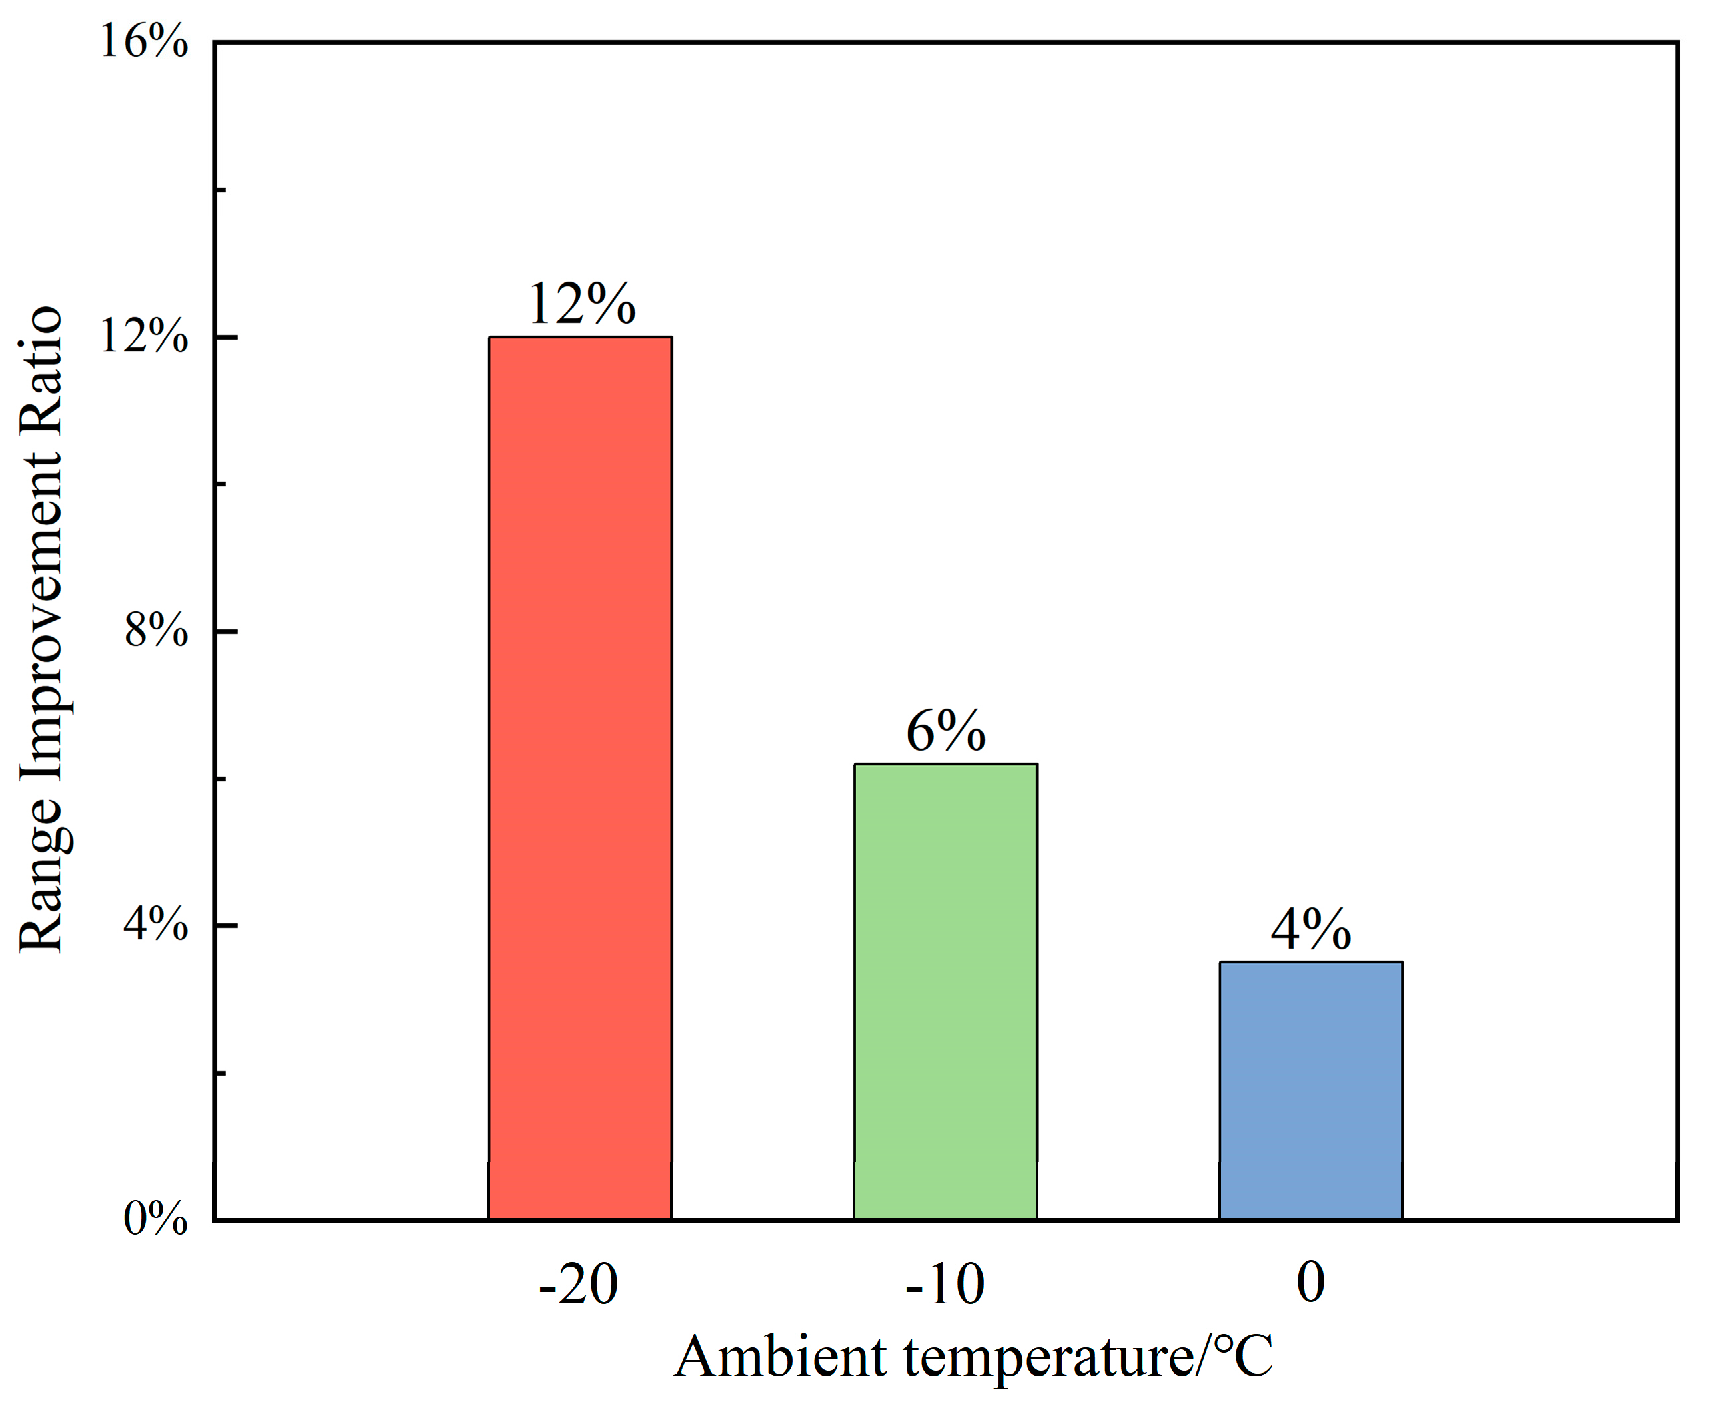
5.2.3. Driving Range

To compare the characteristics of ambient temperature on the driving range, the driving range of ETBSm is analyzed after changing the ambient temperature at the same discharge depth. The driving ranges of working modes B and C at different ambient temperatures are shown in Figure 21. At ambient temperatures of −20 °C, −10 °C, and 0 °C, with the same SOC consumed by the batteries, the driving range of ETBSm can be effectively increased by mode C compared with mode B. The driving range of ETBSm can be increased by mode B when the ambient temperature increases. When the ambient temperature increases, the driving range of both mode C and mode B increases to different degrees.
Analyzing the percentage of driving range enhancement for mode C relative to mode B, when the depth of discharge is the same but the ambient temperature is different is shown in Table 5. When the depth of discharge of the battery is 25%, the most significant improvement in the driving range is 10.21% at an ambient temperature of −10 °C. When the battery discharge depth is 50% and the ambient temperature is −20 °C, −10 °C, and 0 °C, the range improvement ratio is 7.89%, 6.79%, and 5.85%, respectively; at this time, the lower the ambient temperature is, the more obvious the effect of the driving range improvement is. When the depth of discharge of the battery is 75%, the difference in the percentage of driving range improvement between ambient temperatures of −10 °C and 0 °C is small, only 0.12%; the most significant improvement in the driving range is 6.55% when the ambient temperature is −20 °C. Therefore, when the battery is discharged to a greater depth, the greatest improvement in driving range is achieved by using the residual heat of the motor at an ambient temperature of −20 °C.

5.3. PTC Heater Target Temperature

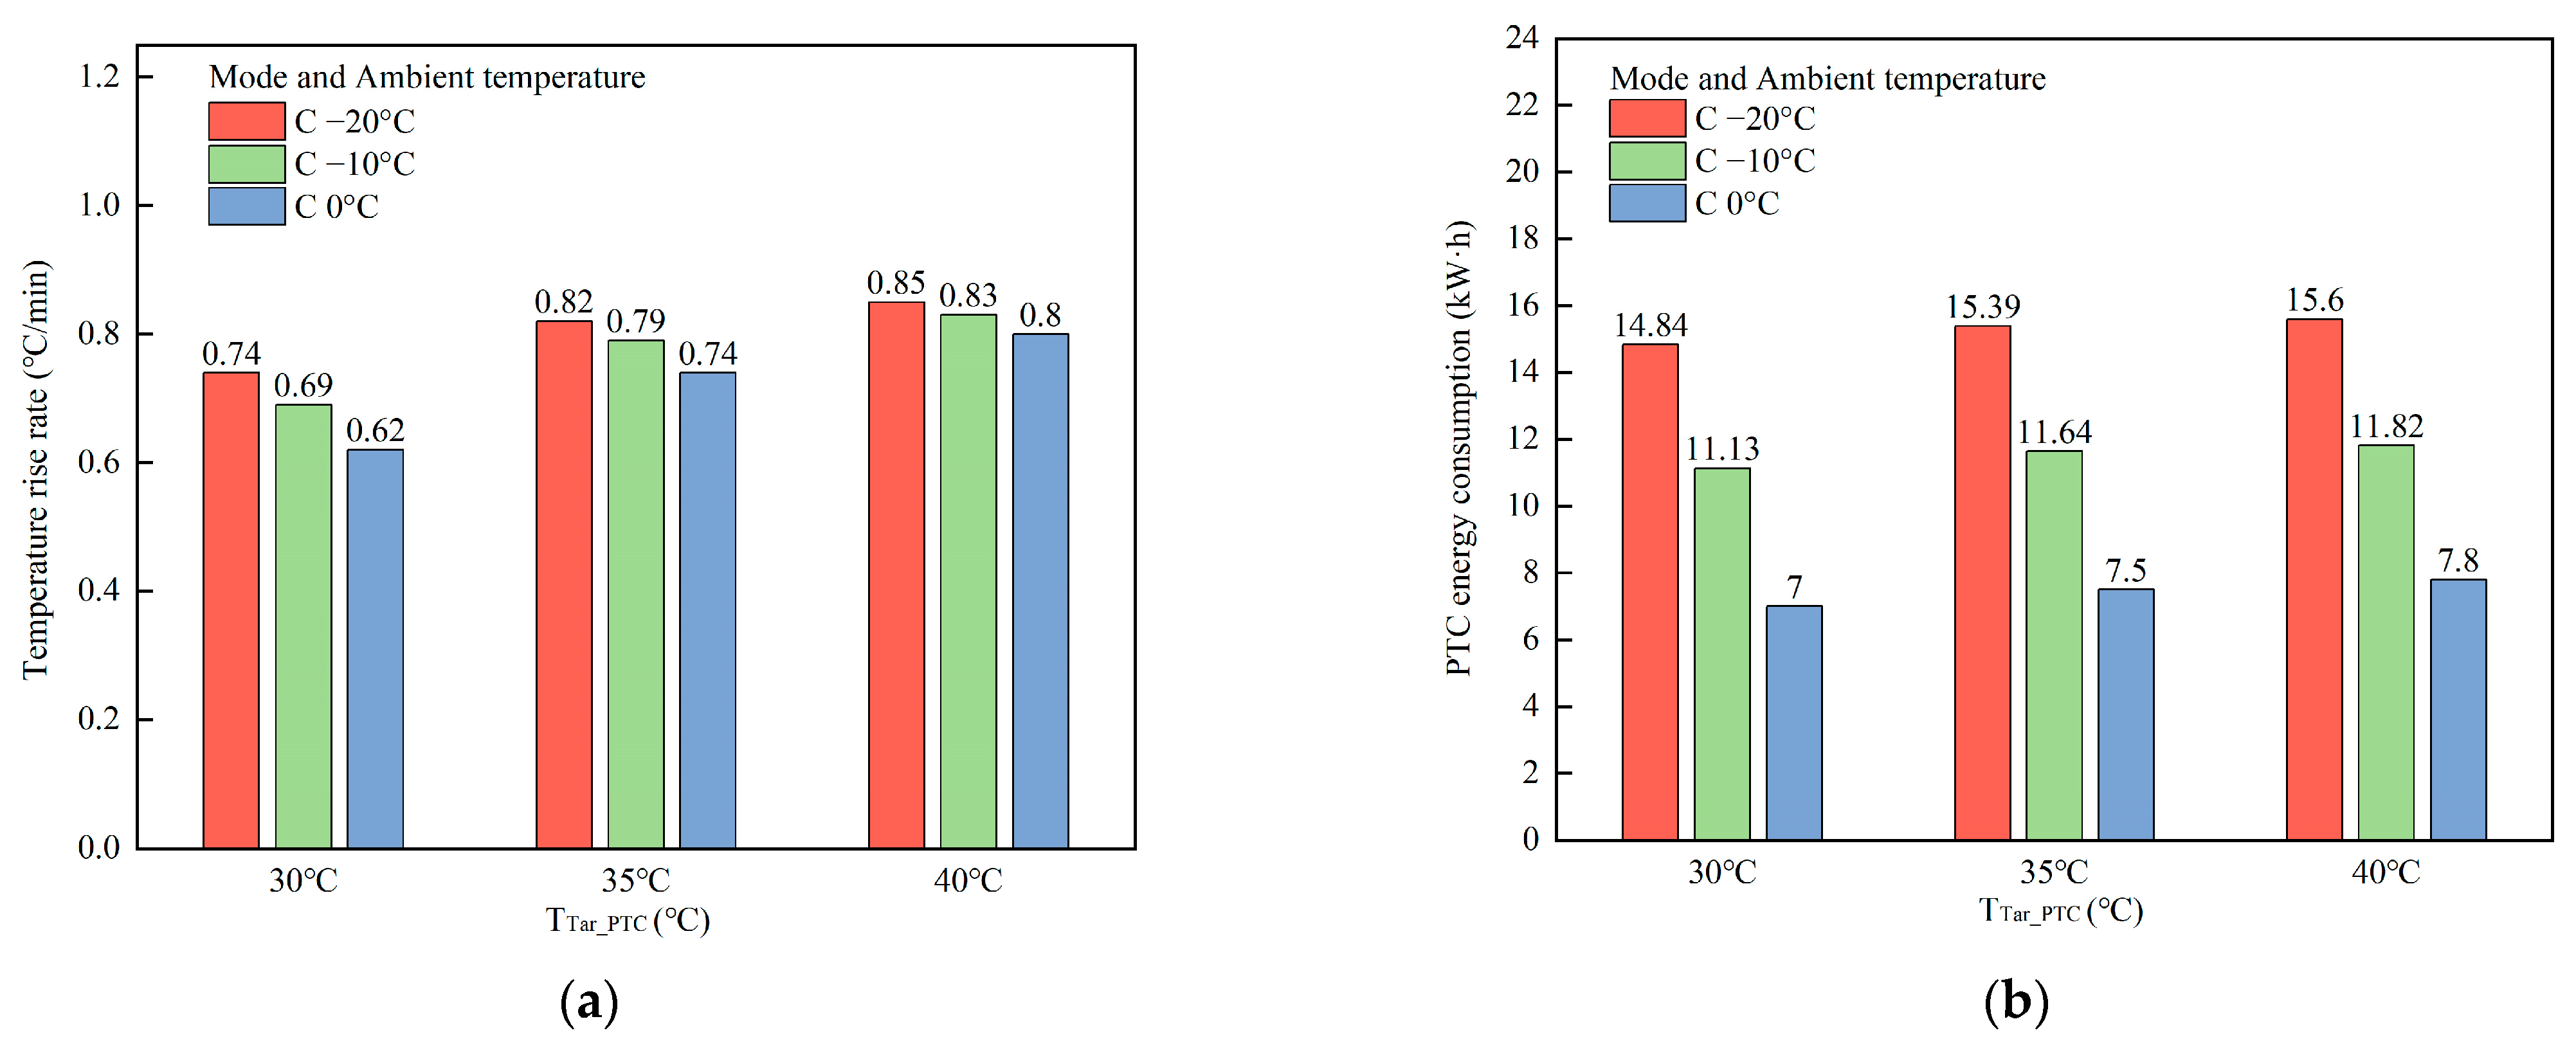
5.3.1. Temperature Rise Rate

The PTC heater target temperature (Tptctar) directly determines the coolant temperature at the inlet of the battery liquid-cooling plate during the time driving range when the battery temperature is heated from the initial temperature to TBtar1, and the temperature of the coolant has a large influence on the battery temperature and the temperature rise rate. The Tptctar is set to 30 °C (Tptctar1), 35 °C (Tptctar2), and 40 °C (Tptctar3), and the temperature rise rate of the battery temperature in the time driving range of initial temperature heating to TBtar1 is shown in Figure 22a.
Firstly, for a given ambient temperature, increasing the Tptctar increases the rate of temperature rise. However, the size of the temperature rise rate increase is affected by the ambient temperature. When the ambient temperature is −20 °C, −10 °C, and 0 °C, the temperature rise rate increases by 10.8%, 14.5%, and 19.5% when the target temperature of PTC heating is changed from Tptctar1 to Tptctar2, and the temperature rise rate increases by 3.7%, 5.1%, and 8.1% when the target temperature of PTC heating is changed from Tptctar2 to Tptctar3. The higher the ambient temperature, the more obvious the increase in temperature rise rate by increasing the Tptctar. Therefore, when the ambient temperature is high, to improve the temperature rise rate of the battery, the Tptctar can be increased appropriately.

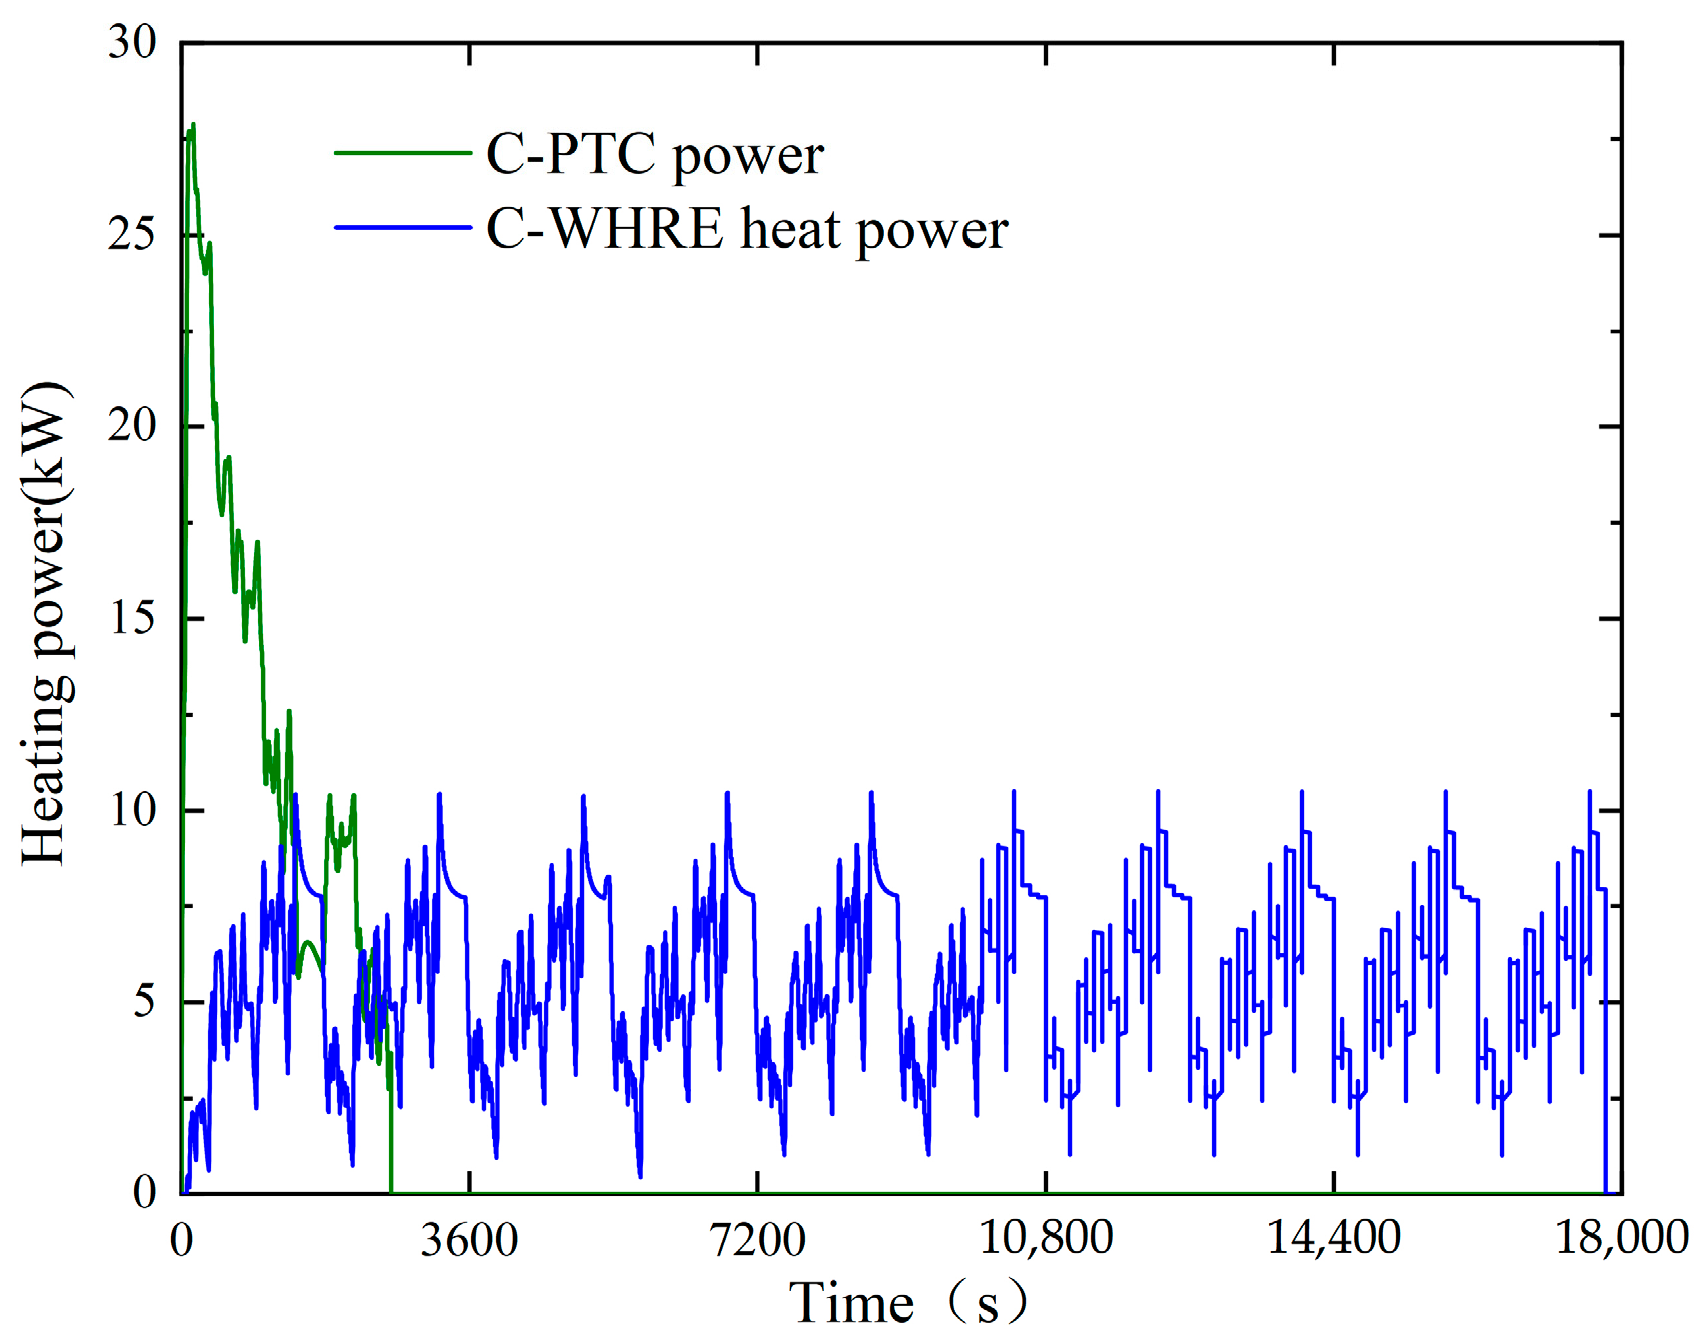
5.3.2. Power Consumption

The PTC power consumption of a cell heated to TBtar1 at an initial temperature at different Tptctar is shown in Figure 22b.
Firstly, for a given ambient temperature, increasing the Tptctar also increases the power consumption. The magnitude of the increase in power consumption is also affected by the ambient temperature. When the ambient temperature is −20 °C, −10 °C, and 0 °C, changing the Tptctar from Tptctar1 to Tptctar2 raises the power consumption by 3.71%, 4.58, and 7.14%, and changing the target temperature of PTC heating from Tptctar2 to Tptctar3 raises the power consumption by 1.36%, 1.55%, and 4%. Therefore, the higher the ambient temperature, the higher the percentage of power consumption, which is also more obvious.
The results show that the effect of power consumption needs to be considered while increasing the battery temperature rate by increasing Tptctar.

5.4. Route Test

To demonstrate the effectiveness of the MWHR in ETBSm, experimental tests were carried out on real roads, and the test route is shown in Figure 23. Cycling between start point A and end point B, the route length is about 24 km, and the average time consumed is about 36 min. The SOC of the battery was 100% at the beginning of the experiment, and the experiment ended when the SOC reached 20%. The test speed is determined by actual road conditions. Characteristics such as driving range and energy consumption of the ETBSm are recorded. The ratio of range improvement is shown in Figure 24. The results show that the maximum increase in driving range is about 12% when comparing the use of waste heat from the motor to PTC heating alone.

6. Conclusions

The ETBSm thermal management system with motor waste heat recovery was designed and its simulation model built and verified. The impact of MWHR on battery temperature and ETBSm performance was analayzed. Theain conclusions are as follows:
Simultaneous use of PTC heating and MWHR increases the battery temperature rise rate by 15% compared to PTC heating aone under CHTC. At an ambient temperature of −10 °C, PTC heating energy consumption is reduced by about 10.64 kW·h.
The improvement in driving range through waste heat recovery was analyzed at different ambient temperatures. At ambient temperatures of −20 °C, −10 °C, and 0 °C, when 75% of the SOC is consumed, the range is improved by 6.55%, 4.37%, and 4.49%, respectively.
At initial temperatures of 0 °C, −10 °C, and −20 °C, the battery reaches 20 °C in 1918 s, 2618 s, and 3217 s, respectively. The temperature rise rates are 0.63 °C/min, 0.69 °C/min, and 0.75 °C/min. At −20 °C, −10 °C, and 0 °C ambient temperatures, the proportion of MWHR to total heat increases with rising ambient temperature, reaching 32.1%, 35%, and 40.5%.
This research could be further improved. At the outset of the truck’s operational cycle in a low temperatures, the motor produces less waste heat. Thus, the temperature of the coolant within the motor circuit rises at a slower rate. As a result, the improvement in battery temperature is not significant. Currently, waste heat from electric motors is only used to heat batteries. However, the waste heat generated by the motors could also be used to heat the cabin; the comfort of the cabin can be improved, thus increasing the potential for waste heat utilization. In addition, further research is needed to improve the heating strategy used.

Author Contributions

Conceptualization, S.L. and Y.W.; methodology, L.L. (Liguo Li); resources, J.H., L.L. (Languang Lu), Y.L. and H.W.; project administration, X.S. and R.L.; Writing—original draft Z.S. All authors have read and agreed to the published version of the manuscript.

Funding

This research received no external funding.

Data Availability Statement

Data available on request due to restrictions privacy.

Acknowledgments

This work has been funded and supported by the Ordos-Tsinghua University Carbon Neutrality Collaborative Innovation Project. The author thanks ZHI LI WU LIAN’s company for providing the electric heavy-duty truck with battery swapping mode used in this study and assisting with the experiment.

Conflicts of Interest

The funders had no role in the design of this study, in the collection, analysis, or interpretation of data, in the writing of the manuscript, or in the decision to publish the results.

References

  1. Qiu, K.; Ribberink, H.; Entchev, E. Economic feasibility of electrified highways for heavy-duty electric trucks. Appl. Energy 2022, 326, 119935. [Google Scholar] [CrossRef]
  2. Zhang, X.; Hao, X.; Liu, Y.; Wu, R.; Shan, X.; Li, S. Contribution of potential clean trucks in carbon peak pathway of road freight based on scenario analysis: A case study of China. J. Clean. Prod. 2022, 379, 134669. [Google Scholar] [CrossRef]
  3. Khanna, N.; Lu, H.; Fridley, D.; Zhou, N. Near and long-term perspectives on strategies to decarbonize China’s heavy-duty trucks through 2050. Sci. Rep. 2021, 11, 20414. [Google Scholar] [CrossRef] [PubMed]
  4. Gunawan, T.A.; Monaghan, R.F. Techno-econo-environmental comparisons of zero- and low-emission heavy-duty trucks. Appl. Energy 2022, 308, 118327. [Google Scholar] [CrossRef]
  5. Li, Y.; Zhu, F.; Li, L.; Ouyang, M. Electrifying heavy-duty truck through battery swapping. Joule 2024, 8, 1556–1561. [Google Scholar] [CrossRef]
  6. Zhang, S.; Xu, K.; Jow, T. Low-temperature performance of Li-ion cells with a LiBF4-based electrolyte. J. Solid State Electrochem. 2003, 7, 147–151. [Google Scholar] [CrossRef]
  7. Bhide, S.; Shim, T. Development of improved Li-ion battery model incorporating thermal and rate factor effects. In Proceedings of the 5th IEEE Vehicle Power and Propulsion Conference, VPPC ‘09, Dearborn, MI, USA, 7–10 September 2009; IEEE Computer Society: Washington, DC, USA, 2009; pp. 544–550. [Google Scholar]
  8. Fan, J.; Tan, S. Studies on Charging Lithium-Ion Cells at Low Temperatures. J. Electrochem. Soc. 2006, 153, A1081–A1092. [Google Scholar] [CrossRef]
  9. Al-Wreikat, Y.; Serrano, C.; Sodré, J.R. Effects of ambient temperature and trip characteristics on the energy consumption of an electric vehicle. Energy 2022, 238, 122028. [Google Scholar] [CrossRef]
  10. Zhu, T.; Min, H.; Yu, Y.; Zhao, Z.; Xu, T.; Chen, Y.; Li, X.; Zhang, C. An Optimized Energy Management Strategy for Preheating Vehicle-Mounted Li-ion Batteries at Subzero Temperatures. Energies 2017, 10, 243. [Google Scholar] [CrossRef]
  11. Jiang, Z.; Qu, Z.; Wang, Q. Experimental and numerical investigation of fast preheating of lithium ion pouch cell via low-power inductive heating in cold climate. Int. J. Heat Mass Transf. 2023, 214, 124381. [Google Scholar] [CrossRef]
  12. Lei, S.; Xin, S.; Liu, S. Separate and integrated thermal management solutions for electric vehicles: A review. J. Power Sources 2022, 550, 232133. [Google Scholar] [CrossRef]
  13. Qu, Z.; Jiang, Z.; Wang, Q. Experimental study on pulse self–heating of lithium–ion battery at low temperature. Int. J. Heat Mass Transf. 2019, 135, 696–705. [Google Scholar] [CrossRef]
  14. Li, J.; Sun, D.; Chai, Z.; Jiang, H.; Sun, C. Sinusoidal alternating current heating strategy and optimization of lithium-ion batteries with a thermo-electric coupled model. Energy 2019, 186, 115798. [Google Scholar] [CrossRef]
  15. Longchamps, R.S.; Yang, X.-G.; Ge, S.; Liu, T.; Wang, C.-Y. Transforming rate capability through self-heating of energy-dense and next-generation batteries. J. Power Sources 2021, 510, 230416. [Google Scholar] [CrossRef]
  16. Ruan, H.; Barreras, J.V.; Steinhardt, M.; Jossen, A.; Offer, G.J.; Wu, B. The heating triangle: A quantitative review of self-heating methods for lithium-ion batteries at low temperatures. J. Power Sources 2023, 581, 233484. [Google Scholar] [CrossRef]
  17. Hu, X.; Zheng, Y.; Howey, D.A.; Perez, H.; Foley, A.; Pecht, M. Battery warm-up methodologies at subzero temperatures for automotive applications: Recent advances and perspectives. Prog. Energy Combust. Sci. 2020, 77, 100806. [Google Scholar] [CrossRef]
  18. Sun, X.; Xu, X.; Fu, J.; Tang, W.; Yuan, Q. Research on thermal equilibrium performance of liquid-cooled lithium-ion power battery system at low temperature. Therm. Sci. 2020, 24, 4147–4158. [Google Scholar] [CrossRef]
  19. Zhang, C.; Huang, J.; Sun, W.; Xu, X.; Li, C.; Li, Y. Research on liquid preheating performance for battery thermal management of electric vehicles at low temperature. J. Energy Storage 2022, 55, 105497. [Google Scholar] [CrossRef]
  20. Min, H.; Zhang, Z.; Sun, W.; Min, Z.; Yu, Y.; Wang, B. A thermal management system control strategy for electric vehicles under low-temperature driving conditions considering battery lifetime. Appl. Therm. Eng. 2020, 181, 115944. [Google Scholar] [CrossRef]
  21. Zhang, X.; Li, Z.; Luo, L.; Fan, Y.; Du, Z. A review on thermal management of lithium-ion batteries for electric vehicles. Energy 2022, 238, 121652. [Google Scholar] [CrossRef]
  22. Jeffs, J.; Dinh, T.Q.; Widanage, W.D.; McGordon, A.; Picarelli, A. Optimisation of Direct Battery Thermal Management for EVs Operating in Low-Temperature Climates. Energies 2020, 13, 5980. [Google Scholar] [CrossRef]
  23. Guo, R.; Li, L.; Sun, Z.; Xue, X. An integrated thermal management strategy for cabin and battery heating in range-extended electric vehicles under low-temperature conditions. Appl. Therm. Eng. 2023, 228, 120502. [Google Scholar] [CrossRef]
  24. Ma, Y.; Ding, H.; Liu, Y.; Gao, J. Battery thermal management of intelligent-connected electric vehicles at low temperature based on NMPC. Energy 2022, 244, 122571. [Google Scholar] [CrossRef]
  25. He, L.G.; Gu, Z.H.; Zhang, Y.; Jing, H.D.; Li, P.P. Control Strategy Analysis of Vehicle Thermal Management System Based on Motor Heat Utilization. Energy Technol. 2023, 11, 2300495. [Google Scholar] [CrossRef]
  26. Tian, Z.; Gu, B.; Gao, W.; Zhang, Y. Performance evaluation of an electric vehicle thermal management system with waste heat recovery. Appl. Therm. Eng. 2020, 169, 114976. [Google Scholar] [CrossRef]
  27. Ding, P.; Gu, X.Y.A.; Wang, Y.; Xi, J.C.; Song, M.Q.; Li, K.Y. Distributed multi-heat-source hybrid heating system based on waste heat recovery for electric vehicles. Appl. Therm. Eng. 2023, 235, 121352. [Google Scholar]
  28. Shelly, T.J.; Weibel, J.A.; Ziviani, D.; Groll, E.A. Comparative analysis of battery electric vehicle thermal management systems under long-range drive cycles. Appl. Therm. Eng. 2021, 198, 117506. [Google Scholar] [CrossRef]
  29. Schneider, J.; Teichert, O.; Zähringer, M.; Balke, G.; Lienkamp, M. The novel Megawatt Charging System standard: Impact on battery size and cell requirements for battery-electric long-haul trucks. eTransportation 2023, 17, 100253. [Google Scholar] [CrossRef]
  30. Babu, A.R.; Andric, J.; Minovski, B.; Sebben, S. System-Level Modeling and Thermal Simulations of Large Battery Packs for Electric Trucks. Energies 2021, 14, 4796. [Google Scholar] [CrossRef]
  31. Babu, A.R.; Minovski, B.; Sebben, S. Thermal encapsulation of large battery packs for electric vehicles operating in cold climate. Appl. Therm. Eng. 2022, 212, 118548. [Google Scholar] [CrossRef]
  32. Mohamed, W.; Singh, B.; Mohamed, M.; Aizuwan, A.; Zubair, A. Effects of fuel cell vehicle waste heat temperatures and cruising speeds on the outputs of a thermoelectric generator energy recovery module. Int. J. Hydrogen Energy 2021, 46, 25634–25649. [Google Scholar] [CrossRef]
  33. Lee, H.; Lee, D.; Kim, Y. Heating performance of a coolant-source heat pump using waste heat from stack and electric devices in fuel cell electric vehicles under cold conditions. Energy Convers. Manag. 2022, 252, 115092. [Google Scholar] [CrossRef]
  34. Hu, D.; Hou, W.; Xiang, C.; Lu, D.; Yang, Q.; Li, J.; Wang, J. Waste heat utilization performance verification of Heat Exchanger Only Thermal Management System for fuel cell vehicle. J. Clean. Prod. 2023, 428, 139479. [Google Scholar] [CrossRef]
  35. Li, C.; Zhang, H.; Zhang, R.; Lin, Y.; Fang, H. On the characteristics analysis and tab design of an 18650 type cylindrical LiFePO4 battery. Appl. Therm. Eng. 2021, 182, 116144. [Google Scholar] [CrossRef]
  36. Białoń, T.; Niestrój, R.; Skarka, W.; Korski, W. HPPC Test Methodology Using LFP Battery Cell Identification Tests as an Example. Energies 2023, 16, 6239. [Google Scholar] [CrossRef]
  37. Bernardi, D.; Pawlikowski, E.; Newman, J. A General Energy Balance for Battery Systems. J. Electrochem. Soc. 1985, 132, 5–12. [Google Scholar] [CrossRef]
Figure 1. Schematic diagram of battery swapping process.
Batteries 10 00328 g001
Figure 2. Integrated TMS Framework in Vehicles.
Batteries 10 00328 g002
Figure 3. The experimental data of the battery temperature.
Batteries 10 00328 g003
Figure 4. Integrated TMS Framework.
Batteries 10 00328 g004
Figure 5. (a) MWHR independent heating mode PTC (b) PTC independent heating mode (c) PTC and MWHR cooperative heating mode.
Batteries 10 00328 g005
Figure 6. Thermal management system control strategy.
Batteries 10 00328 g006
Figure 7. (a) OCV curve (b) Entropy heat coefficient (c) Internal resistance.
Batteries 10 00328 g007
Figure 8. The simulation verification of the battery temperature rate.
Batteries 10 00328 g008
Figure 9. The simulation verification of motor efficiency.
Batteries 10 00328 g009
Figure 10. WHE.
Figure 10. WHE.
Batteries 10 00328 g010
Figure 11. The ETBSm simulation model.
Batteries 10 00328 g011
Figure 12. CHTC.
Figure 12. CHTC.
Batteries 10 00328 g012
Figure 13. The coolant temperature in the battery circuit in working mode C.
Batteries 10 00328 g013
Figure 14. The temperatures of the coolant in the WHE.
Batteries 10 00328 g014
Figure 15. The battery temperatures.
Batteries 10 00328 g015
Figure 16. Heating power.
Batteries 10 00328 g016
Figure 17. Mode C heating power.
Batteries 10 00328 g017
Figure 18. The driving range comparison.
Batteries 10 00328 g018
Figure 19. The battery temperatures at different ambient temperatures.
Batteries 10 00328 g019
Figure 20. Heat analysis at different ambient temperatures.
Batteries 10 00328 g020
Figure 21. The driving range at different ambient temperatures.
Batteries 10 00328 g021
Figure 22. (a) Battery temperature rise rate (b) PTC energy consumption.
Batteries 10 00328 g022
Figure 23. The road test.
Batteries 10 00328 g023
Figure 24. Range improvement ratio.
Batteries 10 00328 g024
Table 1. The characteristic parameters of the ETBSm.
SymbolParametersValues
mMass (kg)35,000
fRolling resistance coefficient0.01
C d Aerodynamic drag coefficient0.7
AWindward area (m2)7.8
RWheel rolling radius (mm)542.5
iGear ratio5.286
ndrive efficiency0.98
Table 2. Battery parameters.
Cell CharacteristicsValue
Nominal capacity (Ah)228
Nominal voltage (V)3.22
Cut-off voltage (V)2.5~3.65
Size (mm × mm × mm)54 × 174 × 205
Specific heat capacity (J·kg·k)961
Thermal conductivity (W·m·k)3
Number2P192S
Table 3. Simulation mode Setting.
Heating ModeABC
PTC
MWHR
Table 4. The status of the PTC and motor waste heat on at different times. √ is for on, × is for off.
Time Period1234
Time0~281 s281~1010 s1010~2618 s2616~5446 s
PTC
MWHR √ or ×
Table 5. Percentage of driving range improvement at different ambient temperatures.
Consume 25% SOCConsume 50% SOCConsume 75% SOC
−20 °C8.51%7.89%6.55%
−10 °C10.21%6.79%4.37%
0 °C8.85%5.85%4.49%
Disclaimer/Publisher’s Note: The statements, opinions and data contained in all publications are solely those of the individual author(s) and contributor(s) and not of MDPI and/or the editor(s). MDPI and/or the editor(s) disclaim responsibility for any injury to people or property resulting from any ideas, methods, instructions or products referred to in the content.

