Abstract
Solar energy is considered the major source of clean and ubiquitous renewable energy available on various scales in electric grids. In addition, solar energy is harnessed in various electronic devices to charge the batteries and power electronic equipment. Due to its ubiquitous nature, the corresponding market for solar-charged small-scale batteries is growing fast. The most important part to make the technology feasible is a portable battery charger and the associated controllers to automate battery charging. The charger should consider the case of charging to be convenient for the user and minimize battery degradation. However, the issue of slow charging and premature battery life loss plagues current industry standards or innovative battery technologies. In this paper, a new pulse charging technique is proposed that obviates battery deterioration and minimizes the overall charging loss. The solar-powered battery charger is prototyped and executed as a practical, versatile, and compact photovoltaic charge controller at cut rates. With the aid of sensor fusion, the charge controller is disconnected and reconnects the battery during battery overcharging and deep discharging conditions using sensors with relays. The laboratory model is tested using a less expensive PV panel, battery, and digital signal processor (DSP) controller. The charging behavior of the solar-powered PWM charge controller is studied compared with that of the constant voltage–constant current (CV–CC) method. The proposed method is pertinent for minimizing energy issues in impoverished places at a reasonable price.
1. Introduction
One of the main issues facing the modern civilized world is the global energy crisis and the threats posed by climate change. The primary identified causes of the aforementioned concern are the depletion of fossil fuel reserves and the release of greenhouse gases. Solar, wind, and tidal energy are types of renewable energy sources (RES) that are the solution to these problems. Solar energy is one of these RES that is considered to have the potential to resolve the crisis because it is abundant and cost-free [1,2]. Due to its emergency qualities and affordability, solar power has emerged as among the world’s primary sustainable power sources [3]. Solar energy is transformed into controlled electrical energy using photovoltaic (PV) cells and a power electronics converter. These PV solar cells have nonlinear properties; the reliability of solar PV is dramatically decreased because of the intermittent properties of solar power and environmental circumstances [4]. As a result, the solar PV system’s maximum power output varies according to changes in irradiance and weather. In different climatic conditions, such as partial shade, the characteristics of solar cells grow more complex [5,6]. These problems make it necessary for researchers to enhance the power output of solar PV cells under fluctuating atmospheric conditions. The writers of [7,8] have thoroughly detailed several optimum power tracking approaches to attain maximum power. A charge controller-equipped battery charger is also essential for maximizing the transmission of electricity from solar PV to the battery bank.
A charger for batteries with a charge controller’s primary job is to (1) aid in extracting the maximum available energy from the solar panel and operate the panel at possible maximum voltage and current conditions by adjusting the duty ratio in the charging algorithm. (2) shorten the battery charge duration and support the photovoltaic arrays. Moreover, it prevents the battery from being overcharged and discharged, extending its life. A PV charge controller’s algorithm controls the efficiency of PV array usage and battery charging, enhancing the system’s capacity to fulfill the demand for electrical load.
Charge controllers in series, shunt, pulse width modulation (PWM), and maximum power point tracker (MPPT) comprise the varieties of charge controllers for solar PV that are employed most frequently [9]. The series controller uses a control component that connects the batteries and a solar panel in a series. Due to the existing limits of shunt controllers, this charge regulator is frequently employed with compact PV systems and can be employed for effective systems. The shunt regulator controls the battery charging using the solar panel by impeding the PV array inward to the regulator. This charge controller is primarily employed to control current or voltage to prevent storage batteries from being overcharged and deeply discharged, which might harm the batteries [9].
1.1. Background and Motivation
Research is focused on PV-powered battery charging systems to create an effective and optimal control mechanism. Most 12-volt panels generate around 16 to 20 volts; thus, if there is no regulation, overcharging will cause harm to the batteries [10]. The primary role of a charge regulator is to sustain the battery at the maximum potential energy state. Charge-controller device preserves the battery from overcharging and detaches the load to obstruct the deep discharge. The ideal scenario is for the charge controller to directly regulate the battery’s condition, equivalent to constant potential charging [10]. In the absence of a charge controller, depending on the irradiance, power from the PV module will flow into a battery, whether or if the battery has to be charged. Uncontrolled charging will result in an extremely high battery voltage if the battery is fully charged, which hastens grid corrosion, electrolyte loss, internal heating, and severe gassing [11,12]. The charge controller maintains the battery in good condition and increases its lifespan.
The charge controller adjusts charge rates depending on battery capacity and monitors battery temperature to prevent overheating [12,13]. The charge controller uses the PWM technique to generate pulses to the battery with multiple duty ratios [14]. In essence, it performs the function of an intelligent switch between solar cells and batteries, managing the voltage and current flowing into the batteries. The benefits of PWM charge regulators are as follows: (i) increased battery life, (ii) increased recharge effectiveness, (iii) lessens the battery’s stress, (iv) battery overheating is less frequent, and (v) the capacity of a battery to be restored. Here the charge controller acts as a switch that connects the battery with the PV panel through PWM operation. When the switch is closed, the battery and panel will be at almost matching voltage. Additionally, it can power a DC load that is straitly attached to the battery. MPPT is most effective when the weather is cold, cloudy, or foggy and when the battery is thoroughly discharged. The benefits of MPPT in this kind of system would be substantially lower. However, there would be no drawbacks to utilizing an MPPT regulator on a solar module with a voltage near the battery potential [15,16].
The PWM protocol algorithm integrated with the solar charge controller improves the amount of current from the PV module into the battery. To precisely match the PV module to the battery, the PWM charge regulator is a DC/DC adapter that accepts DC as input from the solar module, turns it to AC, and then changes it to stabilize to a different DC potential and current. Solar charge controllers benefit standalone PV systems, solar housing systems, off-grid PV power systems, and some rural places [17,18]. It extracts the maximum accessible energy from the PV component by composing them to run at the most effective voltage. It inspects the yield of the PV component, compares it to the battery voltage, and then finalizes the admirable power that the PV module can initiate to charge the battery and change it to the best voltage to obtain the utmost Amperes into the battery.
Various charging technologies have been developed to improve lithium-ion batteries’ condition, life cycle, charging time, and charging efficiency [19,20]. Among various technologies, constant current (CC) and constant voltage (CV) charging methods are widely used [3]. CC-CV charging technology charges with CC below the threshold voltage. The current gradually falls when the threshold voltage is reached, charging to a constant voltage. The magnitude of the CC and CV depends on the battery specifications. The disadvantage of this charging technique is that it reduces the charge current in the CV section to prevent battery damage owing to overvoltage. Therefore, the charging time is extended in this section [20]. In the case of CC-CV charging, the charging time is long because the charging speed is slow. The sluggish charging period of distributed battery cells has been acknowledged as a drawback, and a quick and effective solution is the pulse-based charging approach.
Pulse-based charging offers low impedance, which enhances power transfer by enabling the subsequent charge pulse to enter the battery more effectively and prevents overheating and overvoltage gassing [21,22]. The increased discharge capacity of the pulse-charged battery shows that the pulse technique may effectively utilize the battery’s active components without overcharging while still providing a long cycling existence [21,23]. The effect of the pulse method charging on the cycle period of Li-ion batteries was investigated, and it proved that the pulse technique enhanced the lifespan of batteries as to DC imposing techniques [21,24]. Although there has been much research on battery charging, there is still a need to optimize battery charging performance.
1.2. Contributions and Novelties
By taking into account the key benefits of the charge controller, the authors are concerned with building an appropriate charge controller that enhances the charging ability and effectively extends battery existence with optimal charging speed.
The pulse frequency for controlling the battery charge duration will dynamically change within a specific range to inject the maximum charge current into the battery cells. To furnish the battery pack with a long life cycle, we designed a quick method for charging batteries according to the recommended frequency and workload cycle while defending against over-voltage or overheating situations for battery cells. In addition, a comparative analysis has been performed by contrasting the charge regulators suggested by the different authors in the existing compositions.
The contributions of this paper are summarized as follows.
- (1)
- A literature review on the existing pulse controller for battery chargers is provided, and their performance and shortcomings are analyzed.
- (2)
- A sensor-fusion-based pulse charging technique is proposed for the battery charger that minimizes charging losses and battery degradations to increase battery lifetime.
- (3)
- With the aid of sensor fusion, the charge controller is disconnected and reconnects the battery during battery overcharging and deep discharging conditions using sensors with relays.
- (4)
- A prototype solar-powered battery charger with the proposed technique is developed and tested using a less expensive PV panel, battery, and digital signal processor (DSP) controller.
- (5)
- The comparative study is presented by comparing the charging performance of the solar-powered PWM charge controller with the constant current-constant voltage method. The proposed method is pertinent for minimizing energy issues in impoverished places at a reasonable price.
2. Revolution of Pulse Charging (Current) Mode Technique
For the pulse charging protocol, a pulsed current charging technique was previously proposed to improve the cycle life of lead-acid batteries [25,26,27,28]. Then, it was extended to the Li-ion batteries [29]. Pulse protocol that consists of charging the battery pack with current pulses. This introduces relaxation periods during the charging process, which permits deep intercalation of the lithium ions inside the electrode. Consequently, the effect of concentration polarization decreased, and the Li-ions diffusion rate was, respectively, increased. The main parameters of this method are the pulse frequency, the duty cycle, and the charging current amplitude. The current pulse and voltage pulse are the two types of pulse modes. The difference between the two pulse modes is mainly reflected in different control methods during the charging process. Generally, the pulsed current is implemented by charging the battery cell using a charging protocol defined in advance, while the voltage pulse mode is implemented by controlling the duty cycle or frequency of the switching device to achieve the required average current. L. R. Chen proposed several voltage pulse charging strategies to reduce the charging time [30,31]. Several studies in the literature use different values of these parameters and report different results. The authors in [32,33,34] adopt a fixed pulse frequency and a given duty cycle. The result of these studies is higher degradation of the electrodes in the case of the pulse protocol. However, by adapting the pulse frequency, this protocol’s effectiveness has been demonstrated in comparison with the constant current constant voltage (CCCV) method in terms of charging time and battery lifetime [14,35,36,37]. It can also be observed that by modifying the relaxation time and current amplitude during the charging stage, it is possible to minimize the concentration polarization and optimize the charging process [14]. Furthermore, by expanding the relaxation time and reducing the current amplitude at the end of the charging action, it is possible to obtain better results than what would have been with a pulse charging employing constant parameters. Finally, other authors have shown that the charging efficiency can be increased by altering the pulse frequency to minimize the internal battery impedance [14,34].
The primary battery failure mechanism is over currents that buckle the battery electrodes, leading to short-circuiting in the cell, which is not repairable. The proposed charger will dump high-frequency currents within a very short period into the battery. These high-frequency currents are low enough duty cycles to prevent any buckling of the battery electrodes. The time between two pulses allows the battery capacitive reactance to decrease, leading to decreases in the complex impedance of the battery. If battery impedance is lower, the next charge pulse is more effectively observed because of this battery being charged accurately [27,38].
3. The Proposed Pulse Charging Protocol
Figure 1 depicts the structural illustration of the preferred system, in which PV panel output current and voltage are sensed and provided to the microcontroller. The microcontroller is set up to carry out the Pulse width modulation operation to maintain the system operating at the highest power level to extract the total power from the PV source. The DSP controller produces pulses, whose frequency changes to monitor the solar panel’s maximum voltage point, and the metal oxide field effect transistor (MOSFET) switch of the DC-to-DC converter receives this pulse. ACS712 module is utilized here as a current sensor, while the LM358 op-amp is used as a voltage sensor, and the DSP TMS32028027F is for regulating. The power generated by the DC converter is given to the solar charge controller. The proposed system comprises three circuits: a front-end DC-DC converter, isolation circuits, an intermediate battery charging circuit, and a sensor and control circuit. AC loads are connected to the battery through inverting output.
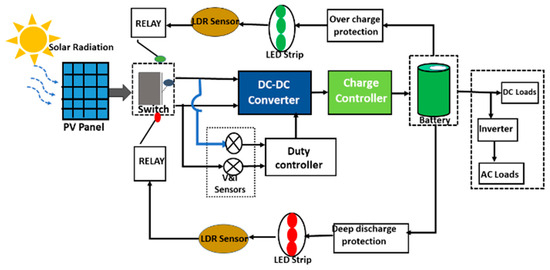
Figure 1.
Schematic illustration of the proposed charge controller.
The size of the PV panel is 36 cells 12 V/5 W has been used to charge two cells in a series of 1200 mAh ratings for a wide selection of input voltages from 5 to 22 V. The final accepted charging current is limited to 250 mA. For longer battery life, it also has overcharge and reverses polarity protections.
3.1. PV Equivalent Circuit Analysis
Generally, a current source and a reverse diode analogous can represent a solar cell. It has its own internal parallel and series resistance. Parallel resistance is caused by leakage current, while series resistance is caused by obstructions in the movement of electrons from the N to P union. When irradiance strikes its surface, an electrical field is created inside the solar PV cell [39,40]. This development can generate power for an outermost circuit when an electric field is present. The strength of the incident radiation affects the produced current. More electrons can be released from the surface at higher light intensities, which results in a more significant current generation [40,41,42]. The source current Ipv indicates the unit photocurrent and Rsh is used to indicate the solar unit’s intrinsic shunt and series resistance, respectively. Generally, Rsh and RS have very high and low values; therefore, it is feasible to omit them to simplify the analysis. PV array is simplified by using mathematical Formulation (1)–(4), and PV characteristics are shown in Table 1. An equivalent circuit model of the proposed charge controlled is shown in Figure 2. It is the composition of advanced protection circuits using sensors, and TIP42C is used to discharge the high currents to the grounds. A current source connected simultaneously to a diode simulates the ideal PV cell. The resistances in series and shunts are added to the model, as shown in Figure 3 because no solar cell is perfect.
- Here, Io is the PV module’s current.
- PV module voltage is Vo.
- The reference temperature in Kelvin is Trk.
- Tak is the operating temperature in Kelvin.
- 1.380649 × 10⁻²³ J/k is the Boltzmann constant [43].
- Electron charge (q) = 1.602 × 10⁻¹⁹ C [44].
- Rs is a PV module’s series resistance.
The short-circuit and current temperature co-efficient (Ki) at Iscr is defined as Iscr, the PV module short-circuit current at 25 °C, and 1000 W/m2 = 2.55 A.

Figure 2.
Equivalent circuit diagram.
Figure 2.
Equivalent circuit diagram.


Figure 3.
The PV cell model.
Figure 3.
The PV cell model.


Table 1.
Electrical Characteristics of Data of JIGHISOL System Pvt Limited: 12V 5W, Model No: 0117003479.
Table 1.
Electrical Characteristics of Data of JIGHISOL System Pvt Limited: 12V 5W, Model No: 0117003479.
| PV Module Electrical Parameters and Ratings: 5 W/12 V | |
|---|---|
| Maximum Power (MPmax) | 5 W/12 V |
| Potential at Ultimate. Power (Vmp) | 17.40 V |
| Current at Optimum Power (Imp) | 0.26 A |
| The voltage at Open Circuit (Voc) | 21.50 V |
| Panel current at short circuit (Isc) | 0.32 A |
| Tolerance | +5% |
| Specifications are at STC 1000 W/m Irradiance AM 1.5, Cell Temp 25 °C | |
3.2. DC-DC Converter and Power Stage Design
By adjusting the duty period (D) of the converter, the switching regulator is used to match the maximum power and voltages (VMPP) at all climatic circumstances with the load voltage (VPV) seen by the PV panel. The load is connected to the module by a DC-to-DC converter through a charge controller that facilitates the delivery of the PV module’s maximum possible power to the load. This chopper circuit is controlled with a pulse width modulation technique using a DSP TMS32028027F [43]. The equivalent circuit model of the chopper converter is shown in Figure 4.
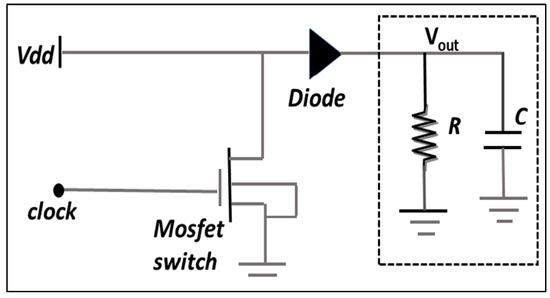
Figure 4.
Illustration of DC-DC converter equivalent circuit.
The control circuit’s time ratio is the proportion of a switch’s on-pulse to the duration of one full course.
OFF Duty period (1 − D) = TOFF/T, Switch OFF period TOFF = ((1 − D)/f)
Here, Ii denotes the input current, and Io denotes the output current. TON stands for turn-on time, TOFF for turn-off time, and Ts for total switching time.
In this article, the converter system comprises the power stage, the compensator, and the pulse width modulator (PWM); the converter is assumed to be in continuous conduction mode (CCM) operation.
From the equivalent circuit of a DC-to-DC converter
The gain of the system at is 1.
Using averaging and linearization techniques, the transfer function of the DC-to-DC converter can be obtained as
where , , and .
The power stage has the following parameters are shown in Table 2. VS = 16.5 V, IS = 65 mA, Vo = 14.3 V, Io = 50 mA, Resistors = 1.2 Ω, 100 Ω, the peak value of PWM is Vp = 5 V DC, Switching Frequency = 25 kHz. The compensator network consists of R1, R2, R3, Rbias, C1, C2, C3 and Vref. We assumed that the Value of Vref is 2.5 V Rbias is 10 KΩ the rest are design parameters.
Table 2.
Solar charge controller circuit design parameters.
3.3. Control System Based on PID
The main objective of the proportional integral derivative (PID) controller is tuning the converter circuit to track the total amount of energy from the PV source, considering the potential and current of the PV array. The PID controller receives the error waveform produced by comparing the quoted potential with the output potential of the switching regulator. The switch’s gate pulse is activated using the PID controller’s output to increase the solar cell’s power. Figure 5 and Figure 6 illustrate the functional block diagram and the PID controller’s construction of the proposed method, which may be written as follows.
where e(t) denotes error to the controller input, u(t) denotes regulator output, Kp denotes potential gain, Ki denotes Integral gain, and Kd is the derivative gain.
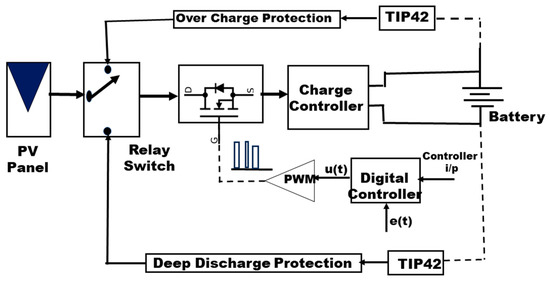
Figure 5.
Illustration of the proposed method functional blocks.
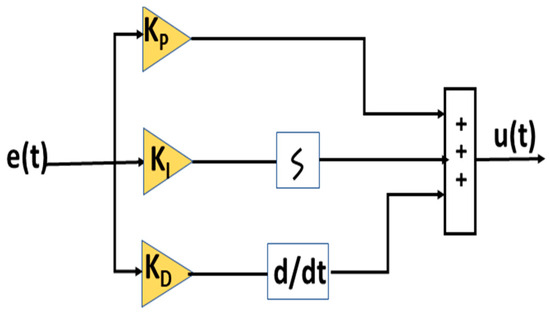
Figure 6.
PID controller block diagram.
3.4. Solar Charge Regulator
A charge monitor, further known as a charge regulator, controls the current and voltage to prevent batteries from overcharging. It controls the solar panels’ voltage and current as they feed the battery [35]. Shunt and series regulation are the two fundamental techniques for managing or regulating battery charging [10,45]. Although both techniques are helpful, each may include several variants that change its fundamental functionality and usefulness. The controller is a series type when the MOSFET IC (integrated circuit) component is linked sequentially with the PV layout and the battery. It is referred to as Shunt form when combined in parallel over the PV array or the battery. When the battery is fully charged, the MOSFET switch is kept open in the series type. During this time, the PV Array stops delivering current. When the battery is completely charged, the MOSFET IC is kept shut in the shunt type to shunt (switch) the entire PV array short circuit current away from the battery [45].
3.5. Sensor Fusion Process
Implementing sensors in the proposed solar charge controller is crucial to achieving the system’s desired functionality. In this work, we used two voltage detection sensors module 25 V, one current sensor (ACS712 5A), and two LDR [46] sensors. The current sensor is used to monitor the battery charging (60 mA) and discharging currents (50 mA) during the battery cycling period. Among the two voltage sensors, one is used to sense the battery maximum cut of voltage (Vmax = 3 V), and the second is used to measure the (Vmin = 1.4 V). Once the battery obtains full charge voltage sensor is activated and sends a signal to TIP42 IC through which the LED becomes powered ON, and LDR senses the light and provides a signal to the relay coil; the relay will break the supply to open the switch. In a similar way second voltage sensor is operated and makes the connection when the battery reaches Vmin level, i.e., 14 V. With this sensor fusion process, the battery can be protected from overcharge and deep discharge.
4. Assessment of the Experiment and Test Results
To comprehend and research how well the proposed charge controller, nickel metal hydride (NiMH) batteries employed for charge–discharge investigations were the type of battery used in this research. The tested battery cells’ specifications are 1.2 V, 600 mAh, an anode composed of hydrogen-absorbing alloys (MH-metal hydride), a cathode made of nickel hydroxide (Ni (OH)2), and an electrolyte made of caustic potash (KOH) comprised the NiMH batteries [47]. The test was conducted over a while and examined under both charging methods. These batteries are all fully charged using constant amperage and constant voltage [48] by utilizing a charge controller board. The PV panel, filter capacitor, and voltage regulator make up the charger circuit, LDR sensors, and relay coils, as depicted in Figure 7. The solar panel is the primary power source linked to the charge controller circuit by a DC-to-DC converter.
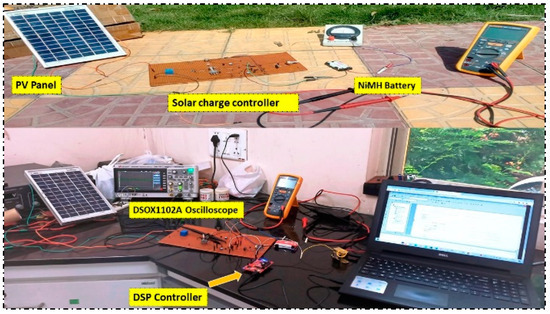
Figure 7.
Experimental setup for determining the impact of charge algorithms on battery.
The optocoupler (Photocoupler 817), a crucial component of the power regulation circuit and a source of 5 V input for the DSP TMS32028027F, receives a 12 V supply from the 12 V regulator. The voltage controller IC, which continues the voltage stability and provides a continual DC potential, is connected to the capacitor’s power output. The 78xx category includes the voltage regulators that are utilized. The regulator code number might change conditional on the utilization and needed potentiality. For instance, the regulator utilized is 7812 if the controller supply voltage requirement is 12 V. The power circuit is made up of the specified components put together. According to Figure 7, the power control circuit consists of an Opto-isolator (PC817), a DSP TMS32028027F, and an isolation circuit.
In a short circuit over the semiconductor switch, the optocouplers serve as safety circuits to the PWM controller and power circuit. The optocoupler’s collector is connected to a 12 V regulated DC. The gate terminal of the semiconductor switch and the photocoupler emitter pins are interconnected. These can be employed as shifting resistors and have specified values of 48 Ohms and 1.5 k ohms in the circuit. The digital signal processor (DSP) controller manages the timing of the gate signals. The triggering pulse for the power switch is provided by a selected output pin grounded to the earth plane. The proposed controller circuit is forged and proven with a NiMH battery group of cells. By stepping down the battery potential to the requisite voltage proportion and rectification, this charging circuit is also used for electrical circuits for AC. Then, it is immediately connected to the charging circuit. We must employ an amp meter and potentiometer to adjust stable voltage and current during this charging procedure and keep track of voltage and current fluctuations. The charger circuit receives power directly from the solar panel, and the duty proportion, which is configured in the Code Composer Studio software 8.1, controls the output voltage [49]; here, NiMH battery packs P and Q are charged using a 60 mA steady current approach, then drained using origalysis electrochemical workstation with 50 mA loads shown in Figure 8. Table 3 displays the prototype outcome (charge; discharge) and battery cell capability for pairing pulse and traditional methods. Currently, the TL431 is used as a variable selector; it operates critically combined to divert the over currents to the common ground and guard against the continually charged battery. Figure 9 and Figure 10 indicate input voltage firing pulses to the semiconductor switch.
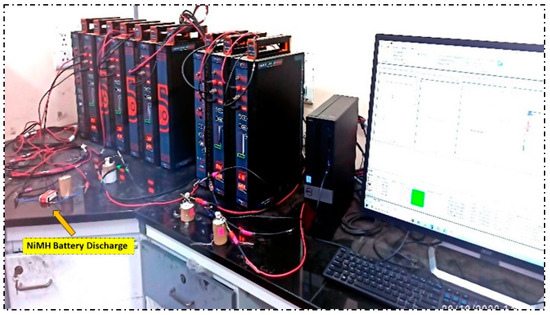
Figure 8.
Origalysis electrochemical workstation.
Table 3.
NiMH Battery charge–discharge study with 60 mA CC and 50 mA loads.
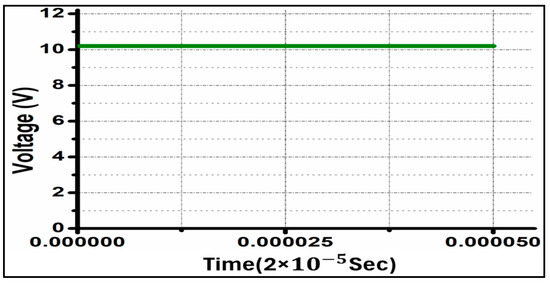
Figure 9.
Input Voltage.
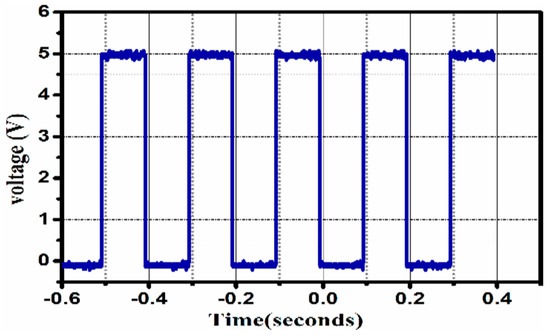
Figure 10.
Standard protocol with an equal duty cycle.
4.1. Traditional Charging Strategy
First, a common technique for charging energy storage devices is constant current constant voltage (CCCV). With the constant current mode, as Voc rises, the terminal voltage gradually rises until it exceeds the voltage limit. The charger then changes to constant-voltage mode to fix the terminal voltage and cut down the amplitude of the current. This is due to the internal potential, Voc, rising when energy is charged, and it is advised for battery safety during charging. The charger must make sure the charging current is less than the highest charging current the battery can tolerate. Due to this technique, chargers disperse energy inequitably, unbalance energy distribution, and experience a higher capacity decrease. The battery charger switches to constant voltage (CV) mode from constant current (CC) mode, where the moving charge rapidly drops [50,51]. These techniques have been widely used for inverters [52,53]. The result of the current and terminal force is the injected power. As a result, changing the charging strategy to accommodate a continuous power supply is essential because the increase in injected power in the CC mode is noticeable.
4.2. Proposed Efficient Pulse Charging Protocol
Pulse magnitude modulation (PMM) and pulse width modulation (PWM) are two alternative ways that the pulse approach can be used [54,55]. The pulsed current’s duration is changeable, while its amplitude is constant in the PWM mode, as depicted in Figure 11. The proposed pulse charging approach is the constant current with the relaxation time, as illustrated in Figure 10 and Figure 11. In contrast, in the PMM mode, the length of the pulsed current is constant, but the pulsed current amplitude varies. The high-frequency current pulse’s amplitude is constant, and during the relaxation period, the current is zero. The following formula calculates the current pulse’s frequency: T being the pulse period, f = 1/T. Ton is the current pulse’s duration, and Toff is the relaxation time. Equation no. 20 can be used to calculate the duty cycle of the given pulse. According to the results of the experiments, pulse mode charging can increase battery capacity and extend battery life by increasing the number of cycles when compared with CC-CV charging. The optimal conditions for pulse mode charging are fZmin (around 25 kHz), 50% duty cycle, and 28 °C ambient temperature. Moreover, the charging speed can be improved by 24% compared with the CC-CV charging.
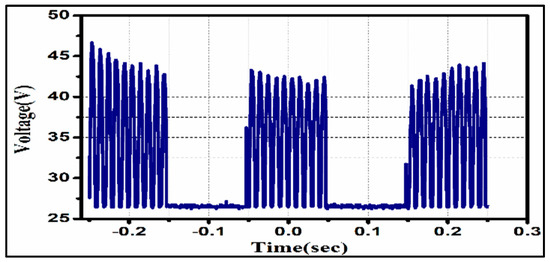
Figure 11.
Output high-frequency Pulse Current.
5. Comparative Evaluation and Results with Discussions
In this part, a comparison between the CC-CV and the fixed pulse was made. In both methods, the total charging duration is 7:30 hours maximum, based on solar sunlight availability daily, as shown in Figure 12a and Figure 13a. With a total discharge capacity of 498 mAh, the CC-CV technique uses 60 mA constant current charging that lasts for 10:06 h, as shown in Figure 12a–c. The proposed charging method fed to the battery with the same C-rate as the CC-CV method and lasted 13:45 h with a discharging capacity of 678 mAh, as shown in Figure 13a–c. This demonstrates that continuous current in the CC stage keeps the charging process and capacity gains from being sped up. Meanwhile, increasing the parameters of battery impedance and temperature as shown in the thermal and impedance analysis section. The proposed pulse charging current, with optimum performance characteristics, is manifested in Table 2. The research findings demonstrate that the suggested charge technique accomplishes rapid charging at operational temperature. This is particularly appropriate for the charge of PV-powered batteries and EVs or PHEVs from 15% state of charge (SOC) to 82% SOC levels [56].
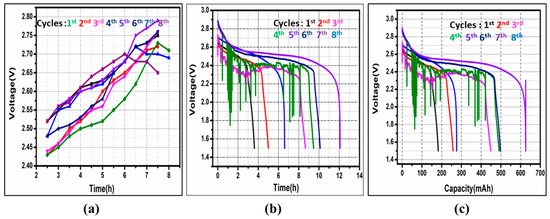
Figure 12.
Charge–discharge studies of NiMH batteries using conventional methods with respect to voltages: (a) Total charge time; (b) Total discharge time; (c) Total discharge capacity.
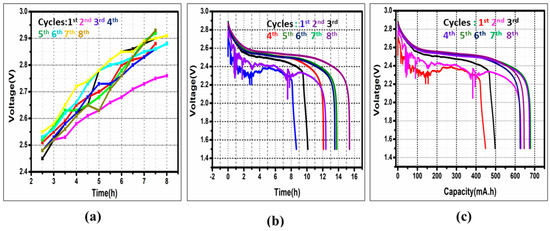
Figure 13.
Charge–discharge studies of NiMH batteries using pulse methods with respect to voltages: (a) Total charge time; (b) Total discharge time; (c) Total discharge capacity.
5.1. Impedance Study
Electrochemical impedance spectroscopy is a method used to measure the complex impedance of an electrochemical cell. Different impedance components can be identified by applying a small AC excitation signal of various frequencies and with an amplitude typically of about 5–10 mV. The fundamental theory of EIS is the linear system theory [57], which enables simplifications and easier analysis of the measurement results. For the linear system theory to apply, the battery response must be linear, stable, and casual, and the impedance must be finite [57]. The battery is a nonlinear device; however, the battery can be assumed as a linear system with a sufficiently small current and voltage range. By utilizing this characteristic, the battery impedance can be measured by perturbing the battery with a small-step current at a specific frequency (f) and measuring the related voltage response, as given by:
where Vpeak (f) is the peak amplitude of the battery voltage, Ipeak (f) is the peak amplitude of the battery current, and θz is the phase between the battery voltage and current. The equivalent circuit model [58] is a powerful approach to the numerical analysis of battery behavior, which describes the characteristics of the battery as capacitive and resistant. This model consists of an ideal voltage source, a resistor–capacitor block (R1, C1), and an internal resistance R0. These fundamental parameters describing the status of the battery cells depend on the cell’s dynamically changed temperature and SOC [59]. The capacitive characteristic of the battery cell causes different responses at different frequency pulses, which are activated when the battery is charging. Figure 14 shows that the battery impedance is the summation of Z0 and Z1, as described as follows:
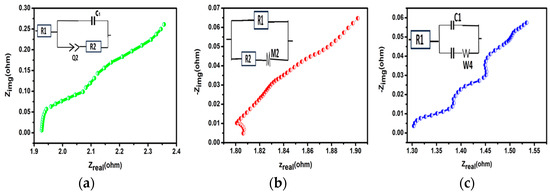
Figure 14.
A Nyquist graph of an EIS study with NiMH battery: (a) Battery impedance before charging; (b) Impedance with conventional charging; (c) Impedance with pulse charging.
Here, the impedance study was conducted by using dynamic electrochemical spectroscopy (EIS), and we measured the overall impedance by applying an AC of 5 mA root mean square (RMS) at a frequency range of 20 kHz to 100 mHz, using an electrochemical measurement unit (origamaster-OGFEIS). These output data can be mapped in different ways. The most popular methods are Nyquist plots, which show a comparison of the imaginary and actual impedances (Zimag and Zreal).
Figure 14a–c shows the impedance studies of NimH batteries with different charging protocols and the subsequent Nyquist plot of an EIS. The overall impedance before charging was reported as 1.93 Ω, as shown in plot Figure 14a, and impedance with conventional charging, i.e., 1.8 Ω, as shown in plot Figure 14b, impedance reported with pulse charging, i.e., 1.3 Ω, see Figure 14c. The electrochemical cell’s charge transfer resistance (Rct) rises due to the decreased electron transport. The Nyquist plot demonstrates the growth in Rct with an increment in the boundary of the curve’s semicircle.
5.2. Thermal Study
The maximum rising temperature is related to the safe operation and lifetime of the batteries. Therefore, the maximum rising temperature during the charging process is one of the important indicators for evaluating charging methods. The rising temperature of the battery cell mainly results from the over potential heat QP [60], which is determined as:
where R is the resistance of the battery cell, and Irms is the RMS value of the current mode. The maximum rising temperature ∆Tmax of the cell during the charging process can be obtained as follows:
where Tinit and Tmax are the initial and maximum temperatures of the battery cell, respectively, for the CC mode, the RMS value of the current is the same as the constant current amplitude:
The RMS value of the pulse mode can be determined as follows:
It can be observed that the rising temperature increases with the increase in the value of Irms. Two variables that impact the cell temperature are the Irms of the current mode and the resistance R of the battery cell. Two variables that impact the cell temperature are the Irms of the current mode and the resistance R of the battery cell [38]. The value of Irms is set to be constant according to Equations (19)–(22). Therefore, the battery resistance varies with frequency and results in the different rising temperatures of the battery cell. To determine the resistance of the battery cell at different frequencies, the EIS test was performed, where the real part of the impedance can be regarded as the resistance of the battery to analyze the heat generation. The measured battery AC-impedance was between 20 kHz and 100 mHz. The real impedance Zreal (f) of the battery cell increases as the frequency decreases in the predefined frequency range. Therefore, a lower frequency will result in a higher maximum rising temperature within the considered frequency range.
To examine the battery’s thermal behavior [61] during charging and discharge cycles, we use an 80BK-A integrated digital multi-meter (DMM) temperature probe to monitor the surface body temperature in both charging methods. Figure 15a shows the experimental comparison of the two methods. The thermal study was conducted at room temperature, i.e., tr 26 °C, and the temperature reported in both the charging methods is tp = 29 °C, tc = 32.5 °C as depicted in Figure 15b.
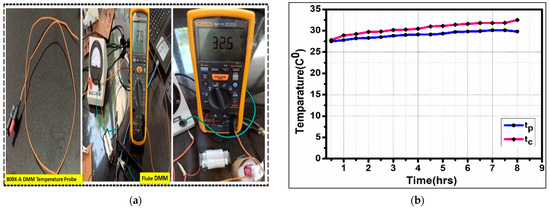
Figure 15.
Thermal analysis of NiMH battery: (a) Temperature measurements using sensor probe; (b) Temperature variations in CCCV and Pulse charging methods (tc & tp).
5.3. Theoretical Analysis and Numerical Results
The complex impedance of the battery is expressed as
where R denotes the resistance in ohms, and X denotes the reactance in ohms
Numerical results of the conventional method:
DOD of commercial NiMH batteries is 4% [62].
where
Numerical results for pulse method verifications
DOD of commercial NiMH batteries is 4% [62].
Numerical results of 50% Duty Effect and CC-CV Method
Vin = 12 V, Ii = 60 mA,
Vo = 12 V, Io = 60 mA
Power delivered to the load (battery) Po = Vo×Io = 12 V × 60 mA = 12 v × 0.06 A
Po = 0.72 watts
Numerical results of 50% Duty Effect and Pulsed Method
Vin = 12 V, Ii = 60 mA,
Vo = Vi/(1 − D) = 12/(1–50% of D) = 12/0.5 = 24 V
Vo = 24 V.
Io = (1 − D) ×Ii = (1–50% of D) × 60 mA = 0.5 × 60 mA
Io = 0.03 A
Power delivered to the battery (Po) = Vo × Io = 24 V × 0.03 A
Po = 0.72 watts
The mathematical verification shows that, for instance, the average power delivered to the battery in the CCCV and pulse mode is 0.72 watts. Due to the low impedance offered by the battery during the rest period, the next charge pulse is effectively observed, which leads to a cut down in the total charging time. Without overheating, the battery is charged optimally. At the same time, the power delivered to the battery with a 30% duty is quite low, and with a duty of 70% battery temperature is raised, as we observed.
5.4. Discussions
The purpose of this work is to provide an overview of the methods that can be used for generating current pulses, regardless of whether they provide charging benefits or not. The duty cycle can considerably impact the battery capacity. For instance, the pulse mode with a duty cycle of 50% can increase the capacity by 36.14% compared with the CC mode at the same current amplitude level. With an increase in duty cycles, the effects of the pulse mode on the capacity decreases. When the duty cycle is higher than 70%, the obtained capacity is lower than that of CC mode, as we observed in this research, and independent of the current amplitude. The impact factors chosen were frequency (0.1 kHz, 1 kHz, 10 kHz, 25 kHz (fZmin), 50 kHz), duty cycle (30%, 50%, and 70%), and ambient temperature (0 °C, 26 °C, and 32 °C), where fZmin is the frequency at the minimum impedance point of the battery cell. It was observed that the cycle life at higher frequencies (fZmin, 50 kHz) was higher than the cycle life obtained at lower frequencies (0.1 kHz, 1 kHz, and 10 kHz), and the best result was obtained at fZmin. However, in general, the impedance value of the battery operated in the Pulse strategy was slightly higher than the impedance value obtained by the traditional CC-CV strategy. The optimal set of parameters for the Pulse strategy was the pulsed current with fZmin frequency (25 kHz) and 50% duty cycle at 28 °C, which could improve the cycle life by 69 cycles compared with the CC-CV strategy as mentioned in Table 4. In this pulse protocol, the charging pulse amplitude is maintained at a 60 mA positive constant current discharging with a 50 mA amplitude.
Table 4.
Comparison of evaluation results.
Future works may consider utilizing deep (machine) learning techniques to improve the performance of the controller [63,64].
6. Conclusions
In this article, the performance and analysis of the solar charge controller with the proposed charging protocol were studied; the system is tested with two charging protocols: the conventional CC-CV method and the proposed pulse protocol. Using two charging methods encapsulates the impact of the pulse charging parameters, i.e., duty ratio, pulse frequency, charge–discharge time, battery cycle life, and the charge and discharge efficiencies of the battery. This work has demonstrated that selecting the optimum pulse charging parameters can prolong the cycle life of the NiMH battery, reduce charge time, and improve the battery charge and discharge capacities, thereby increasing battery runtime. The solar charge controller circuit’s lab model is put into practice. NiMH battery cells are used as the load to evaluate the charge controller circuit. The experimental outcomes reported in this study, the NiMH cell’s charge and discharge potential are substantially increased with pulse charging compared with the traditional charging technique; simultaneously, it delivers a more extended discharge period. The results of the experiments indicate that the suggested approach may end up at nearly 70% of its final capacity in 7:30 h and 13:45 h of discharge time with a battery temperature decrease of roughly 3 °C. This technique will provide low impedance during charging, and the battery cycle life will be improved by 339 cycles. Investigations into the effects of different combinations of these factors revealed that a 50% duty cycle was essential for extending cycle life and guaranteeing faster charge times.
Author Contributions
Conceptualization, V.R.J., and S.Y.; methodology, V.R.J., and S.Y.; software, S.Y., V.K.A.; validation, S.Y., V.K.A., and V.R.J.; formal analysis, S.Y., and M.E.; investigation, S.Y., and M.E.; resources, V.R.J.; data curation, S.Y., and V.K.A.; writing—original draft preparation, S.Y., and V.K.A.; writing—review and editing, V.K.A., and M.E.; supervision, V.R.J., and M.E.; All authors have read and agreed to the published version of the manuscript.
Funding
This research received no external funding.
Data Availability Statement
The original contributions presented in the study are included in the article, further inquiries can be directed to the corresponding author.
Acknowledgments
The author acknowledges CSIR for providing a research fellowship and is also thankful to the Director, CSIR-IICT (Manuscript No. IICT/Pubs./2023/077), for providing all the required facilities to carry out the work. The author gratefully thanks Pratyay Basak for his valuable suggestions.
Conflicts of Interest
The authors declare no conflict of interest.
References
- Asadi, Y.; Eskandari, M.; Mansouri, M.; Moradi, M.H.; Savkin, A.V. A universal model for power converters of battery energy storage systems utilizing the impedance-shaping concepts. Int. J. Electr. Power Energy Syst. 2023, 149, 109055. [Google Scholar] [CrossRef]
- Chetan Singh, S. Solar Photovoltaics: Fundamentals, Technologies and Applications; PHI Learning Private Limited: Delhi, India, 2015. [Google Scholar]
- Sun, Z.; Eskandari, M.; Zheng, C.; Li, M. Handling Computation Hardness and Time Complexity Issue of Battery Energy Storage Scheduling in Microgrids by Deep Reinforcement Learning. Energies 2023, 16, 90. [Google Scholar] [CrossRef]
- Zheng, C.; Eskandari, M.; Li, M.; Sun, Z. GA–Reinforced Deep Neural Network for Net Electric Load Forecasting in Microgrids with Renewable Energy Resources for Scheduling Battery Energy Storage Systems. Algorithms 2022, 15, 338. [Google Scholar] [CrossRef]
- Bouselham, L.; Hajji, M.; Hajji, B.; Bouali, H. A new MPPT-based ANN for photovoltaic system under partial shading conditions. Energy Procedia 2017, 111, 924–933. [Google Scholar] [CrossRef]
- Chhipa, A.A.; Kumar, V.; Joshi, R.R.; Chakrabarti, P.; Jasinski, M.; Burgio, A.; Leonowicz, Z.; Jasinska, E.; Soni, R.; Chakrabarti, T. Adaptive neuro-fuzzy inference system-based maximum power tracking controller for variable speed WECS. Energies 2021, 14, 6275. [Google Scholar] [CrossRef]
- Alzayed, M.; Chaoui, H.; Farajpour, Y. Maximum power tracking for a wind energy conversion system using cascade-forward neural networks. IEEE Trans. Sustain. Energy 2021, 12, 2367–2377. [Google Scholar] [CrossRef]
- Tian, X.; Chau, K.T.; Liu, W.; Pang, H.; Lee, C.H. Maximum Power Tracking for Magnetic Field Editing-Based Omnidirectional Wireless Power Transfer. IEEE Trans. Power Electron. 2022, 37, 12901–12912. [Google Scholar] [CrossRef]
- LokeshReddy, M.; Kumar, P.P.; Chandra, S.A.M.; Babu, T.S.; Rajasekar, N. Comparative study on charge controller techniques for solar PV system. Energy Procedia 2017, 117, 1070–1077. [Google Scholar] [CrossRef]
- Osaretin, C.A.; Edeko, F.O. Design and implementation of a solar charge controller with variable output. Electr. Electron. Eng. 2015, 12, 40–50. [Google Scholar]
- Koehler, U. General overview of non-lithium battery systems and their safety issues. In Electrochemical Power Sources: Fundamentals, Systems, and Applications; Garche, J., Brandt, K., Eds.; Elsevier: Amsterdam, The Netherlands, 2019; pp. 21–46. [Google Scholar]
- Eskandari, M.; Rajabi, A.; Savkin, A.V.; Moradi, M.H.; Dong, Z.Y. Battery energy storage systems (BESSs) and the economy-dynamics of microgrids: Review, analysis, and classification for standardization of BESSs applications. J. Energy Storage 2022, 55, 105627. [Google Scholar] [CrossRef]
- Chao, K.-H.; Huang, B.-Z. Quantitative Design for the Battery Equalizing Charge/Discharge Controller of the Photovoltaic Energy Storage System. Batteries 2022, 8, 278. [Google Scholar] [CrossRef]
- Yin, M.D.; Cho, J.; Park, D. Pulse-based fast battery IoT charger using dynamic frequency and duty control techniques based on multi-sensing of polarization curve. Energies 2016, 9, 209. [Google Scholar] [CrossRef]
- Eltawil, M.A.; Zhao, Z. MPPT techniques for photovoltaic applications. Renew. Sustain. Energy Rev. 2013, 25, 793–813. [Google Scholar] [CrossRef]
- Chen, K.; Tian, S.; Cheng, Y.; Bai, L. An improved MPPT controller for photovoltaic system under partial shading condition. IEEE Trans. Sustain. Energy 2014, 5, 978–985. [Google Scholar] [CrossRef]
- Bhandari, B.; Lee, K.T.; Lee, C.S.; Song, C.K.; Maskey, R.K.; Ahn, S.H. A novel off-grid hybrid power system comprised of solar photovoltaic, wind, and hydro energy sources. Appl. Energy 2014, 133, 236–242. [Google Scholar] [CrossRef]
- Taslimi, M.S.; Maleki Dastjerdi, S.; Bashiri Mousavi, S.; Ahmadi, P.; Ashjaee, M. Assessment and multi-objective optimization of an off-grid solar based energy system for a Conex. Energy Equip. Syst. 2021, 9, 127–143. [Google Scholar]
- Chen, L.R.; Chen, J.J.; Ho, C.M.; Wu, S.L.; Shieh, D.T. Improvement of Li-ion battery Discharging Performance by pulse and Sinusoidal current strategies. IEEE Trans. Ind. Electron. 2013, 60, 5620–5628. [Google Scholar] [CrossRef]
- Kwak, B.; Kim, M.; Kim, J. Add-on type pulse charger for quick charging Li-ion batteries. Electronics 2020, 9, 227. [Google Scholar] [CrossRef]
- Amanor-Boadu, J.M.; Guiseppi-Elie, A. Improved performance of li-ion polymer batteries through improved pulse charging algorithm. Appl. Sci. 2020, 10, 895. [Google Scholar] [CrossRef]
- Goldammer, E.; Kowal, J. Determination of the distribution of relaxation times by means of pulse evaluation for offline and online diagnosis of lithium-ion batteries. Batteries 2021, 7, 36. [Google Scholar] [CrossRef]
- Yadasu, S.; Jetti, V.R.; Awaar, V.K.; Gorle, M. Development of Novel Pulse Charger for Next-Generation Batteries. Energy Technol. 2023, 11, 2200894. [Google Scholar] [CrossRef]
- Amanor-Boadu, J.M.; Guiseppi-Elie, A.; Sánchez-Sinencio, E. The impact of pulse charging parameters on the life cycle of lithium-ion polymer batteries. Energies 2018, 11, 2162. [Google Scholar] [CrossRef]
- Serhan, H.A.; Ahmed, E.M. Effect of the different charging techniques on battery life-time. In Proceedings of the 2018 International Conference on Innovative Trends in Computer Engineering (ITCE), Aswan, Egypt, 19–21 February 2018; pp. 421–426. [Google Scholar]
- Praisuwanna, C.; Khomfoi, S. A pulse frequency technique for a quick charger. In Proceedings of the 2013 10th International Conference on Electrical Engineering/Electronics, Computer, Telecommunications and Information Technology, Krabi, Thailand, 15–17 May 2013; pp. 1–6. [Google Scholar]
- Gumera, X.D.G.; Caberos, A.B.; Huang, S.C.; Liou, W.R.; Lin, J.C. A Variable Duty Cycle Pulse Train Charger for Improving Lead-Acid Battery Performance. In Proceedings of the 2017 Asian Conference on Energy, Power and Transportation Electrification (ACEPT), Singapore, 24–26 October 2017; pp. 1–4. [Google Scholar]
- Chu, Y.; Chen, R.; Liang, T.; Changchien, S.; Chen, J. Positive/negative pulse battery charger with energy feedback and power factor correction. In Proceedings of the Twentieth Annual IEEE Applied Power Electronics Conference and Exposition, Austin, TX, USA, 6–10 March 2005; Volume 2, pp. 986–990. [Google Scholar]
- Shen, W.; Vo, T.T.; Kapoor, A. Charging algorithms of lithium-ion batteries: An overview. In Proceedings of the 2012 7th IEEE Conference on Industrial Electronics and Applications (ICIEA), Singapore, 18–20 July 2012; pp. 1567–1572. [Google Scholar]
- Chen, L.R. A design of an optimal battery pulse charge system by frequency-varied technique. IEEE Trans. Ind. Electron. 2007, 54, 398–405. [Google Scholar] [CrossRef]
- Chen, L.R. Design of duty-varied voltage pulse charger for improving Li-ion battery-charging response. IEEE Trans. Ind. Electron. 2008, 56, 480–487. [Google Scholar] [CrossRef]
- Keil, P.; Jossen, A. Charging protocols for lithium-ion batteries and their impact on cycle life—An experimental study with different 18650 high-power cells. J. Energy Storage 2016, 6, 125–141. [Google Scholar] [CrossRef]
- Shaoqing, L.; Wu, Q.; Zhang, D.; Liu, Z.; He, Y.; Wang, Z.L.; Sun, C. Effects of pulse charging on the performances of lithium-ion batteries. Nano Energy 2019, 56, 555–562. [Google Scholar]
- Franco, F.L.; Ricco, M.; Mandrioli, R.; Viatkin, A.; Grandi, G. Current pulse generation methods for li-ion battery chargers. In Proceedings of the 2020 2nd IEEE International Conference on Industrial Electronics for Sustainable Energy Systems (IESES), Cagliari, Italy, 1–3 September 2020; IEEE: Piscataway, NJ, USA, 2020; Volume 1. [Google Scholar]
- Li, J.; Murphy, E.; Winnick, J.; Kohl, P.A. The effects of pulse charging on cycling characteristics of commercial lithium-ion batteries. J. Power Sources 2001, 102, 302–309. [Google Scholar] [CrossRef]
- Purushothaman, B.K.; Morrison, P.W.; Landau, U. Reducing mass-transport limitations by application of special pulsed current modes. J. Electrochem. Soc. 2005, 152, J33. [Google Scholar] [CrossRef]
- Jampeethong, P.; Khomfoi, S. An EV Quick Charging Station Using a Pulse Frequency Current Control Technique. In Proceedings of the 2015 12th International Conference on Electrical Engineering/Electronics, Computer, Telecommunications and Information Technology (ECTI-CON), Hua Hin, Thailand, 24–27 June 2015; IEEE: Piscataway, NJ, USA, 2015; pp. 1–5. [Google Scholar]
- Huang, X.; Liu, W.; Acharya, A.B.; Meng, J.; Teodorescu, R.; Stroe, D.I. Effect of pulsed current on charging performance of lithium-ion batteries. IEEE Trans. Ind. Electron. 2021, 69, 10144–10153. [Google Scholar] [CrossRef]
- Zhao, X.; Mu, G.; Tang, X.; Chen, M. Mid-IR Intraband Photodetectors with Colloidal Quantum Dots. Coatings 2022, 12, 467. [Google Scholar] [CrossRef]
- Al-Ezzi, A.S.; Ansari, M.N.M. Photovoltaic Solar Cells: A Review. Appl. Syst. Innov. 2022, 5, 67. [Google Scholar] [CrossRef]
- Carrasco, M.; Laudani, A.; Lozito, G.M.; Mancilla-David, F.; Riganti Fulginei, F.; Salvini, A. Low-cost solar irradiance sensing for pv systems. Energies 2017, 10, 998. [Google Scholar] [CrossRef]
- Bayod-Rújula, A.A. Solar photovoltaics (PV). In Solar Hydrogen Production; Academic Press: Cambridge, MA, USA, 2019; pp. 237–295. [Google Scholar]
- Zhang, T.; Fan, S.; Zhao, J.; Jiang, L.; Liu, H. Design and control of a multisensory five-finger prosthetic hand. In Proceedings of the 11th World Congress on Intelligent Control and Automation, Shenyang, China, 29 June–4 July 2024; IEEE: Piscataway, NJ, USA, 2014. [Google Scholar]
- Eldahab, Y.E.A.; Saad, N.H.; Zekry, A. Enhancing the design of battery charging controllers for photovoltaic systems. Renew. Sustain. Energy Rev. 2016, 58, 646–655. [Google Scholar] [CrossRef]
- Al-Quraan, A.; Al-Qaisi, M. Modelling, design, and control of a standalone hybrid PV-wind microgrid system. Energies 2021, 14, 4849. [Google Scholar] [CrossRef]
- Marinho, F.; Carvalho, C.M.; Apolinário, F.R.; Paulucci, L. Measuring light with light-dependent resistors: An easy approach for optics experiments. Eur. J. Phys. 2019, 40, 035801. [Google Scholar] [CrossRef]
- Fetcenko, M.A.; Ovshinsky, S.R.; Reichman, B.; Young, K.; Fierro, C.; Koch, J.; Zallen, A.; Mays, W.; Ouchi, T. Recent advances in NiMH battery technology. J. Power Sources 2007, 165, 544–551. [Google Scholar] [CrossRef]
- Xiong, X.; Wang, S.L.; Fernandez, C.; Yu, C.M.; Zou, C.Y.; Jiang, C. A novel practical state of charge estimation method: An adaptive improved ampere-hour method based on composite correction factor. Int. J. Energy Res. 2020, 44, 11385–11404. [Google Scholar] [CrossRef]
- Nichols, D. Arduino-based data acquisition into Excel, LabVIEW, and MATLAB. Phys. Teach. 2017, 55, 226–227. [Google Scholar] [CrossRef]
- Arabsalmanabadi, B.; Tashakor, N.; Javadi, A.; Al-Haddad, K. Charging techniques in lithium-ion battery charger: Review and new solution. In Proceedings of the IECON2018—44th Annual Conference of the IEEE Industrial Electronics Society, Washington, DC, USA, 21–23 October 2018; IEEE: Piscataway, NJ, USA, 2018. [Google Scholar]
- Berliner, M.D.; Jiang, B.; Cogswell, D.A.; Bazant, M.Z.; Braatz, R.D. Fast charging of lithium-ion batteries by mathematical reformulation as mixed continuous-discrete simulation. In Proceedings of the 2022 American Control Conference (ACC), Atlanta, GA, USA, 8–10 June 2022; IEEE: Piscataway, NJ, USA, 2022. [Google Scholar]
- Heidari, S.; Hatami, A.; Eskandari, M. An intelligent capacity management system for interface converter in AC-DC hybrid microgrids. Appl. Energy 2022, 316, 119112. [Google Scholar] [CrossRef]
- Asadi, Y.; Eskandari, M.; Mansouri, M.; Savkin, A.V.; Pathan, E. Frequency and Voltage Control Techniques through Inverter-Interfaced Distributed Energy Resources in Microgrids: A Review. Energies 2022, 15, 8580. [Google Scholar] [CrossRef]
- Nerubatskyi, V.; Plakhtii, O.; Hordiienko, D. Efficiency analysis of DC-DC converter with pulse-width and pulse-frequency modulation. In Proceedings of the IEEE 41st International Conference on Electronics and Nanotechnology (ELNANO), Kyiv, Ukraine, 10–14 October 2022; IEEE: Piscataway, NJ, USA, 2022. [Google Scholar]
- Vedith, S.; Bhanu Tej, J.N.; Sampath, S.; Usha Sree, M.; Nithin Rao, P.; Neelima, K. Review on Pulse Width Modulation and Optimization Techniques for Multilevel Inverters. In International Conference on Artificial Intelligence and Sustainable Engineering: Select Proceedings of AISE 2020; Sanyal, G., Travieso-Gonzáles, C.M., Awasthi, S., Purushothama, B.R., Eds.; Springer Nature: Singapore, 2022; Volume 1, p. 1. [Google Scholar]
- Tushar, W.; Yuen, C.; Huang, S.; Smith, D.B.; Poor, H.V. Cost minimization of charging stations with photovoltaics: An approach with EV classification. IEEE Trans. Intell. Transp. Syst. 2015, 17, 156–169. [Google Scholar] [CrossRef]
- Single, F.; Horstmann, B.; Latz, A. Theory of impedance spectroscopy for lithium batteries. J. Phys. Chem. C 2019, 123, 27327–27343. [Google Scholar] [CrossRef]
- Song, S.; Zhang, X.; Li, C.; Wang, K.; Sun, X.; Huo, Q.; Wei, T.; Ma, Y. Equivalent circuit models and parameter identification methods for lithium-ion capacitors. J. Energy Storage 2019, 24, 100762. [Google Scholar] [CrossRef]
- Chang, W.Y. The State of Charge Estimating Methods for Battery: A Review. ISRN Appl. Math. 2013, 24, 100762. [Google Scholar] [CrossRef]
- Onda, K.; Ohshima, T.; Nakayama, M.; Fukuda, K.; Araki, T. Thermal behavior of small lithium-ion battery during rapid charge and discharge cycles. J. Power Sources 2006, 158, 535–542. [Google Scholar] [CrossRef]
- Khan, M.R.; Swierczynski, M.J.; Kær, S.K. Towards an ultimate battery thermal management system: A review. Batteries 2017, 3, 9. [Google Scholar] [CrossRef]
- Zhu, W.H.; Zhu, Y.; Tatarchuk, B.J. Self-discharge characteristics and performance degradation of Ni-MH batteries for storage applications. Int. J. Hydrogen Energy 2014, 39, 19789. [Google Scholar] [CrossRef]
- Eskandari, M.; Savkin, A.V.; Fletcher, J. Convolutional Neural Network with Reinforcement Learning for Trajectories Boundedness of Fault Ride-Through Transients of Grid-Feeding Converters in Microgrids. IEEE Trans. Ind. Inform. 2024, 20, 4906–4918. [Google Scholar] [CrossRef]
- Eskandari, M.; Savkin, A.V.; Fletcher, J. A Deep Reinforcement Learning-Based Intelligent Grid-Forming Inverter for Inertia Synthesis by Impedance Emulation. IEEE Trans. Power Syst. 2023, 38, 2978–2981. [Google Scholar] [CrossRef]


Disclaimer/Publisher’s Note: The statements, opinions and data contained in all publications are solely those of the individual author(s) and contributor(s) and not of MDPI and/or the editor(s). MDPI and/or the editor(s) disclaim responsibility for any injury to people or property resulting from any ideas, methods, instructions or products referred to in the content. |
© 2024 by the authors. Licensee MDPI, Basel, Switzerland. This article is an open access article distributed under the terms and conditions of the Creative Commons Attribution (CC BY) license (https://creativecommons.org/licenses/by/4.0/).