Abstract
The rapid adoption of electric vehicles (EVs) has increased the demand for efficient methods to assess the state of health (SoH) of lithium-ion batteries (LIBs). Accurate and prompt evaluations are essential for safety, battery life extension, and performance optimization. While traditional techniques such as electrochemical impedance spectroscopy (EIS) are commonly used to monitor battery degradation, acoustic emission (AE) analysis is emerging as a promising complementary method. AE’s sensitivity to mechanical changes within the battery structure offers significant advantages, including speed and non-destructive assessment, enabling evaluations without disassembly. This capability is particularly beneficial for diagnosing second-life batteries and streamlining decision-making regarding the management of used batteries. Moreover, AE enhances diagnostics by facilitating early detection of potential issues, optimizing maintenance, and improving the reliability and longevity of battery systems. Importantly, AE is a non-destructive technique and belongs to the passive method category, as it does not introduce any external energy into the system but instead detects naturally occurring acoustic signals during the battery’s operation. Integrating AE with other analytical techniques can create a comprehensive tool for continuous battery condition monitoring and predictive maintenance, which is crucial in applications where battery reliability is vital, such as in EVs and energy storage systems. This review not only examines the potential of AE techniques in battery health monitoring but also underscores the need for further research and adoption of these techniques, encouraging the academic community and industry professionals to explore and implement these methods.
1. Introduction
The rapid expansion of demand for various types of batteries, particularly lithium-ion batteries (LIBs) in electric vehicles (EVs), has necessitated continuous advancements in our understanding of these energy storage systems. In 2022, automotive LIB demand surged by approximately 65%, reaching 550 GWh compared to 330 GWh in 2021. This spike was primarily fueled by the increase in electric passenger car sales, with new registrations rising by 55% in 2022 relative to the previous year [1]. As the adoption of EVs and portable electronic devices grows, so does the imperative to improve battery safety and longevity. A comprehensive understanding of the processes that occur within batteries during cycling is crucial, especially those processes that can lead to degradation and eventual failure, including catastrophic safety incidents [2].
Acoustic emission (AE), originally used for monitoring homogenous materials in fields such as construction to detect cracks, fractures, and other structural changes in materials such as concrete or metals, has gained attention as a highly effective non-destructive technique (NDT) for monitoring the health of batteries. Its innovative application in battery health monitoring allows acoustic methods to detect early signs of degradation and provide insights into internal processes. By capturing acoustic signals generated by chemical, mechanical, and electrochemical events such as particle cracking, electrode fractures, solid electrolyte interphase (SEI) formation, and dendrite growth, acoustics offers a more precise understanding of the structural changes and potential failures that can compromise battery performance. This early detection of subtle internal changes enhances both the safety and longevity of battery systems, making AE a valuable tool for assessing the state of health (SoH) of batteries while ensuring their reliability throughout their lifecycle [3,4,5,6].
The strength of acoustics lies in its ability to detect mechanical changes, which can be complemented by other diagnostic methods, such as electrochemical impedance spectroscopy (EIS). Although acoustics identifies mechanical failures early, EIS assesses electrochemical properties, providing a more comprehensive view of battery health. This combination improves the precision of battery monitoring, contributing to safer and more reliable energy storage systems [7,8].
This comprehensive literature review focuses on the application of AE for monitoring the health of LIBs. The purpose of this paper is to synthesize the current state of knowledge, identify key challenges, and highlight areas for future research. This review presents an introduction to acoustic emission and its principles and discusses experimental setup, measurement components, and evaluated parameters. It also explores the use of acoustic methods for monitoring degradation processes in batteries and compares its effectiveness with traditional methods. Due to its non-destructive, rapid, and relatively inexpensive nature, the acoustic method is a valuable alternative or complement to more complex techniques. This review also highlights the potential of AE for monitoring larger assemblies, such as multiple cells connected in series or entire modules. Such capabilities could be beneficial, for instance, in making decisions about the future use of second-life batteries.
2. Non-Destructive Acoustic Methods
In general, the principle of non-destructive methods can be divided into two experimental setups: active and passive. In the active setup, a source of waves, such as ultrasound, is attached to the material being tested, and the internal structure of the material influences the propagation of the emitted waves, with the results being captured by a sensor. In contrast, the passive setup relies on the material itself as the source of the waves, where its internal structure generates waves through degradation processes, and these waves are recorded by a sensor [9].
2.1. Active Acoustic Non-Destructive Methods
In the realm of NDTs, the active approach based on acoustic phenomena represents one of the earliest variants. This testing process involves sending a signal from an external source, during which various changes occur as the signal passes through the material being examined. These changes are subsequently captured by a sensor that is placed in direct contact with the analyzed sample. In Figure 1, there is a schematic representation of the active connection used in NDTs [9].

Figure 1.
Principle of an active non-destructive technique (NDT) method [9].
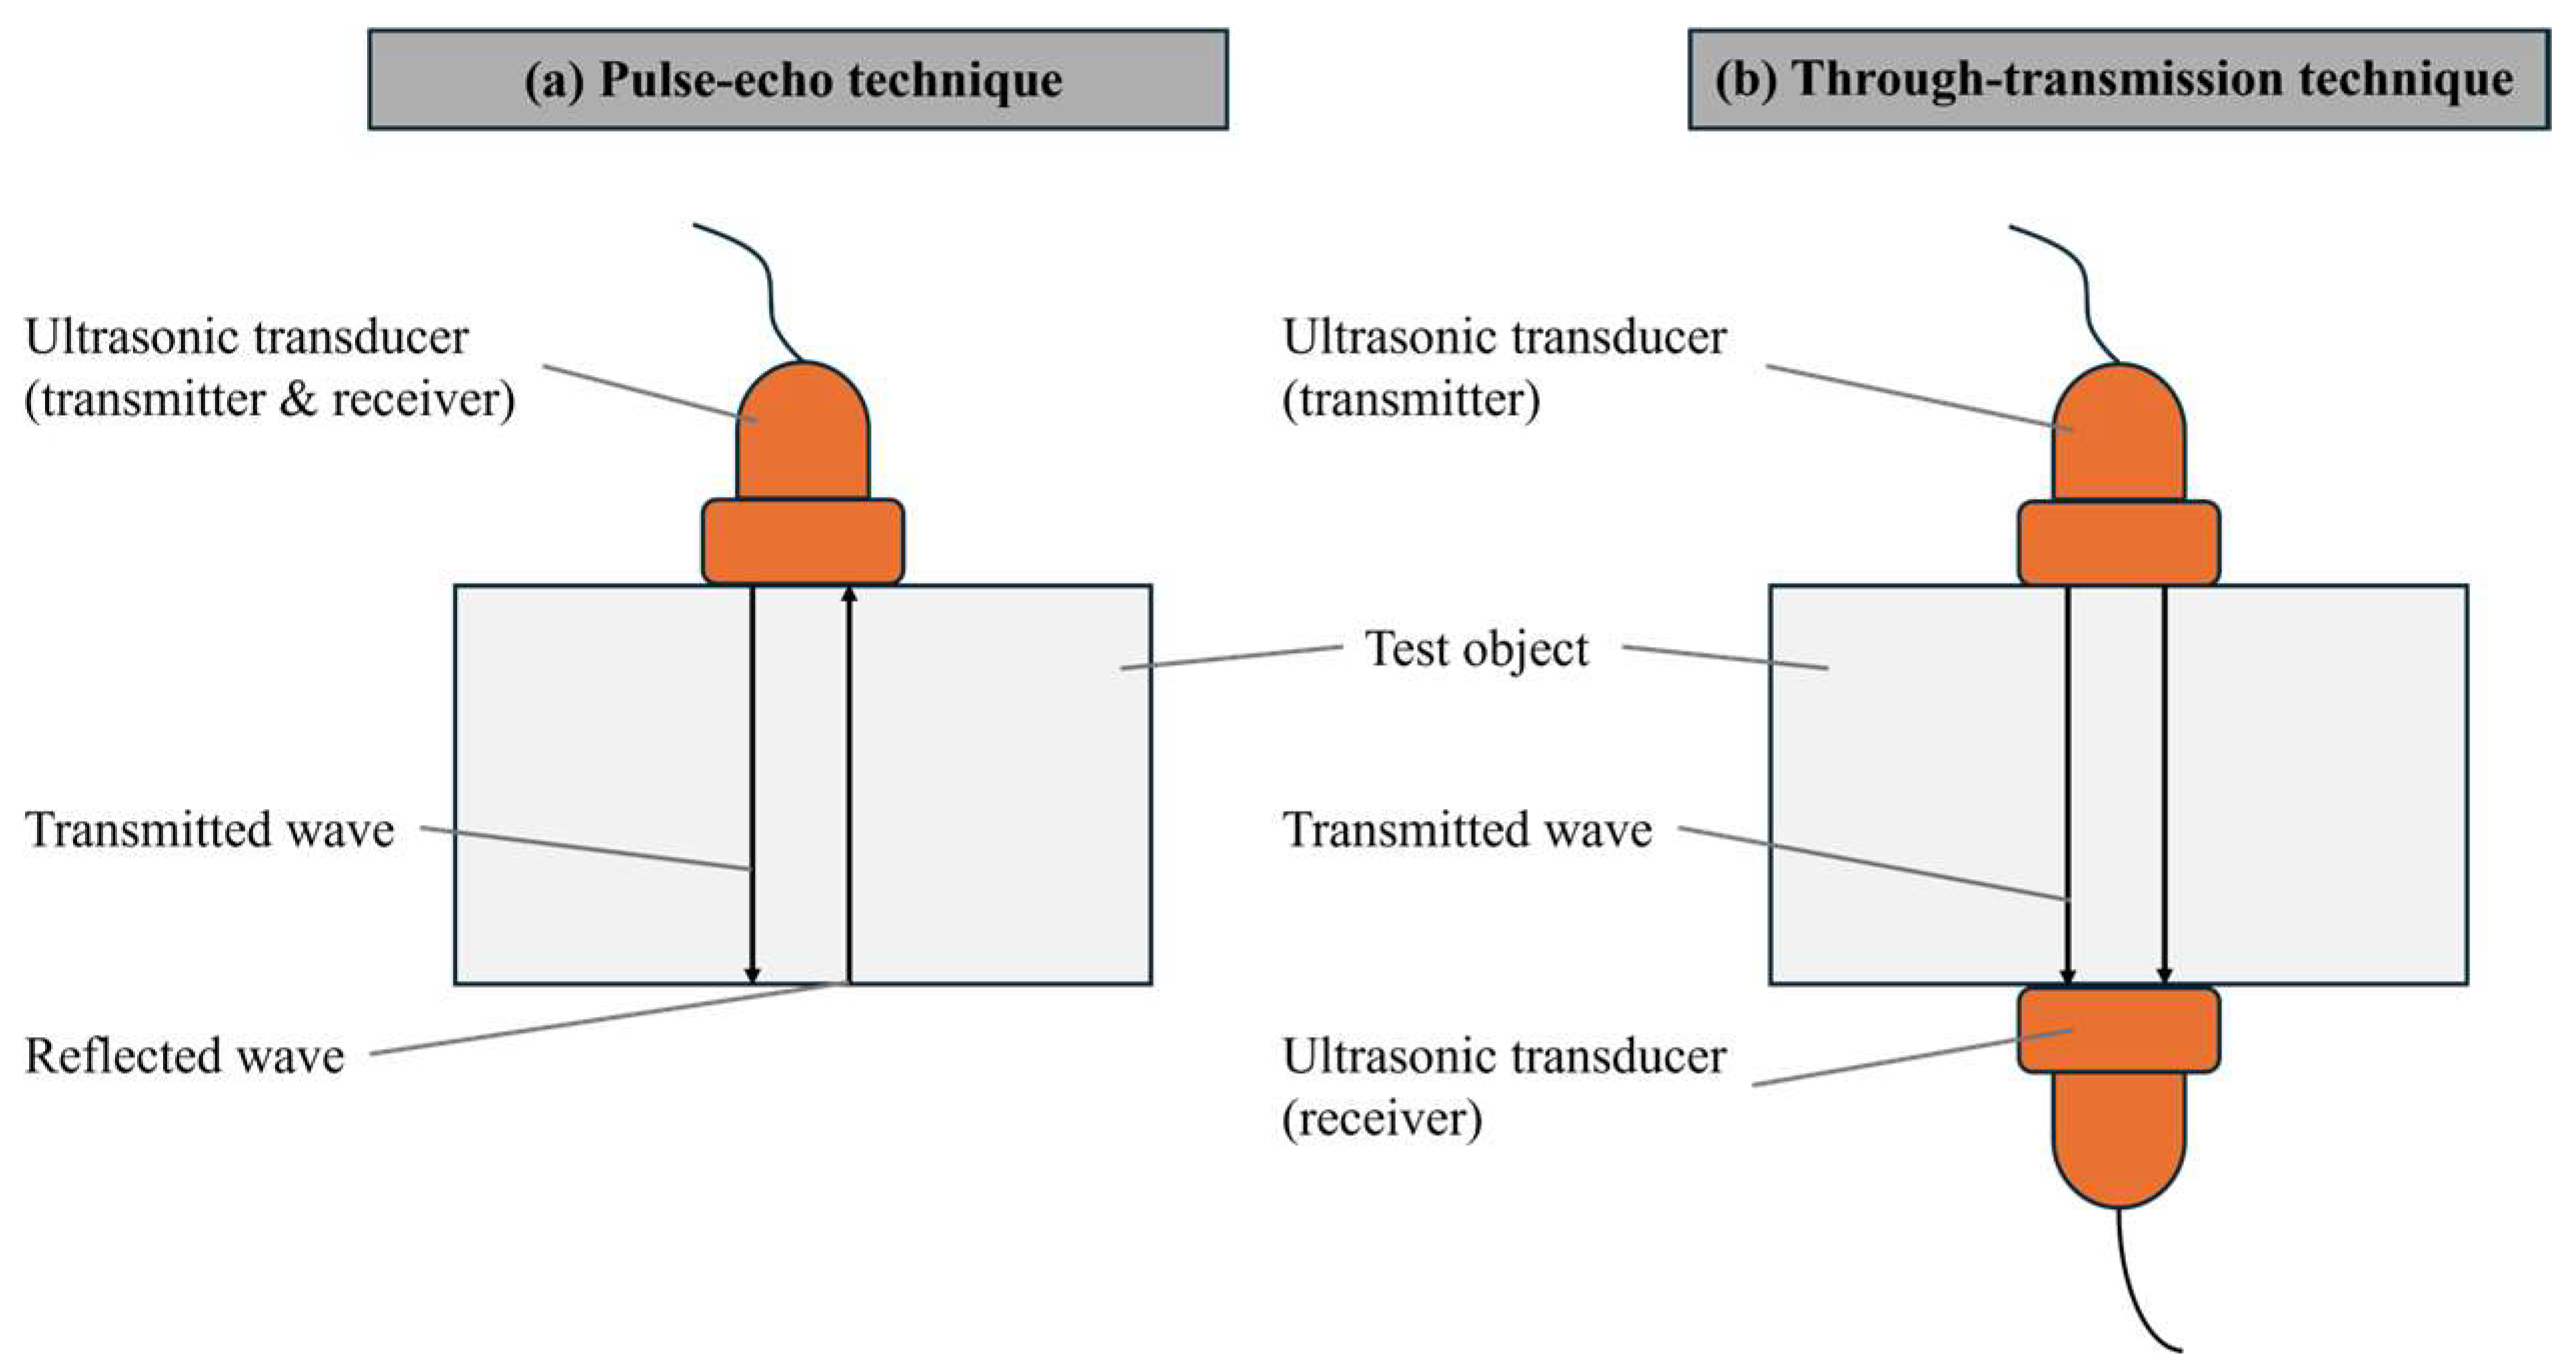
In active acoustic analysis, there are two primary signal detection arrangements: pulse-echo and through-transmission techniques. The pulse-echo method (Figure 2a) involves sending a signal into the material and detecting the echoes that return, while the through-transmission technique (Figure 2b) measures the signal that passes through the material from one side to the other [10,11].
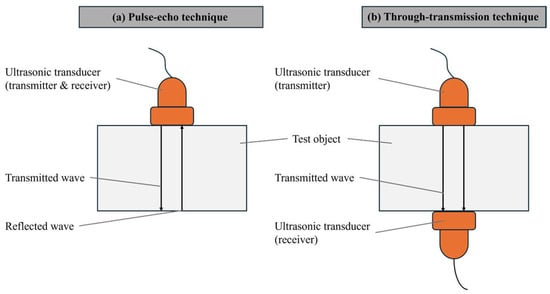
Figure 2.
Ultrasound signal detection techniques in batteries: (a) pulse-echo and (b) through-transmission [10,12].
This method has a wide range of applications, not only in material analysis but also in ecological studies, such as assessing the number of living organisms in marine ecosystems. This approach facilitates effective monitoring and evaluation of both physical and biological parameters in various environments [13,14].
The ultrasonic system typically includes an ultrasonic generation device, transducers, a receiving device, and cables. The pulse-echo technique involves a single transducer placed on one side of the battery, responsible for both transmitting and receiving high-frequency waves, making it suitable for situations where only one side of the battery is accessible. This technique was utilized, for example, by Wu et al. and Hsieh et al. [15,16]. On the other hand, the through-transmission technique, applicable when both sides of the battery are accessible, uses one transducer to transmit sound waves and another on the opposite side to receive them. This method, used by Davies et al., allows for more comprehensive material detection within the battery [17].
2.2. Passive Acoustic Non-Destructive Methods
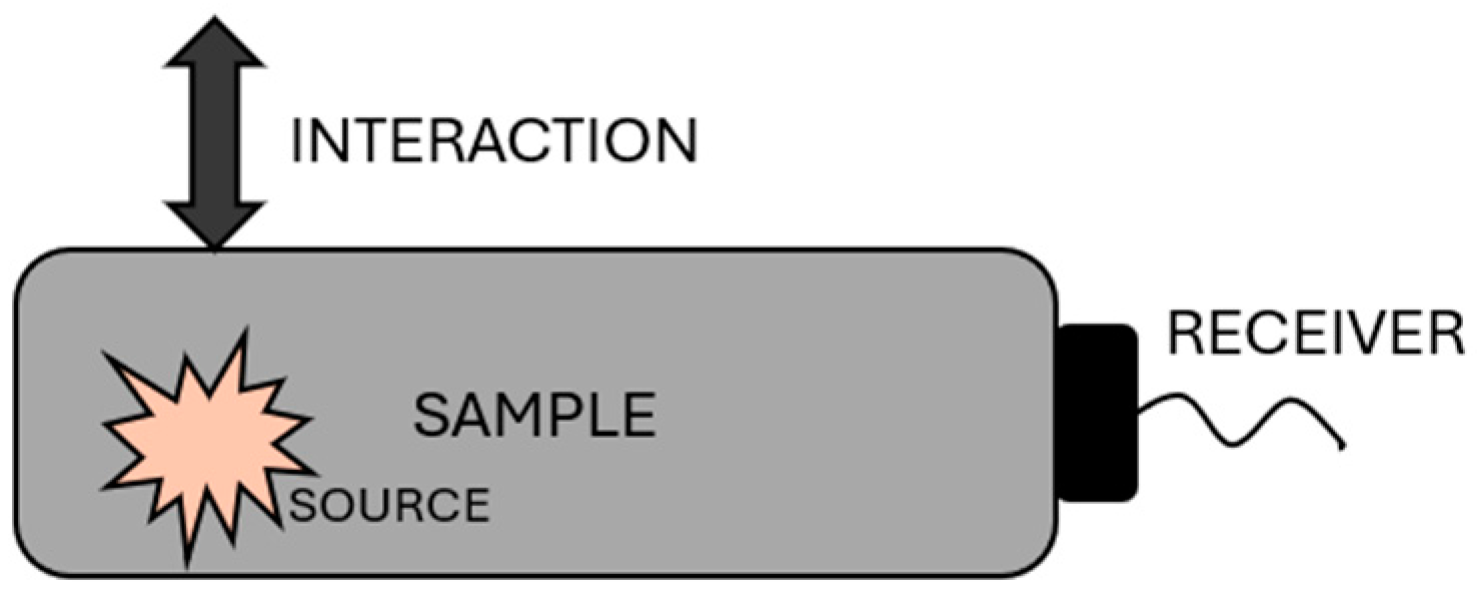
Passive acoustic NDT methods are based on monitoring signals emitted from the inspected sample or environment. This method focuses on observing the intrinsic waves that originate from the inspected sample, which means that no transmitter is required. For example, when monitoring material degradation, it is possible to track acoustic emissions and determine the nature of degradation phenomena, providing valuable information about the material’s condition. Generally, this method is referred to as AE. The principle schematic of this NDT method can be seen in Figure 3 [9].
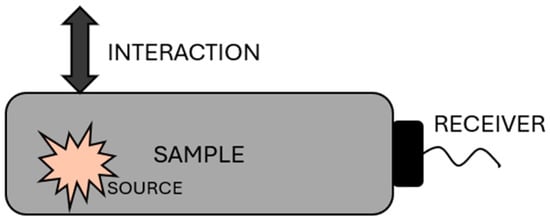
Figure 3.
Principle of a passive non-destructive technique (NDT) method [9].
Although AE has traditionally been applied to monitor damage in various materials, its application to energy storage systems such as LIBs has been limited. Rhodes et al. [3], Etiemble et al. [18], and Beganovic et al. [19] have begun to explore AE as a method for in situ monitoring of mechanical damage in LIB electrode materials, correlating AE activity with phenomena such as particle fracture and bubble formation during cycling. Advances in AE equipment and computational analysis now enable more rigorous waveform analysis, offering the potential for deeper insights into material behavior under stress in energy storage applications.
3. Acoustic Emission
As previously mentioned, AE belongs to the group of passive NDTs. It is commonly used for monitoring structural materials, such as detecting crack formation. Over time, it has found applications in various other technical fields, particularly in monitoring different manufacturing processes. Its most recent use, however, has emerged in connection with battery condition analysis.
It is used to monitor real-time damage in materials under stress by capturing transient elastic waves generated during events such as cracking, yielding, or fracturing [4,18,19,20]. The history of NDTs dates back to around the 1950s when they began to be widely used, particularly in the construction industry. In this field, AE allows for long-term monitoring of processes in materials such as concrete or other structural elements. It not only enables the detection of degradation events but also provides the ability to analyze the geometric shape of defects, thus improving the accuracy and efficiency of structural diagnostics [9].
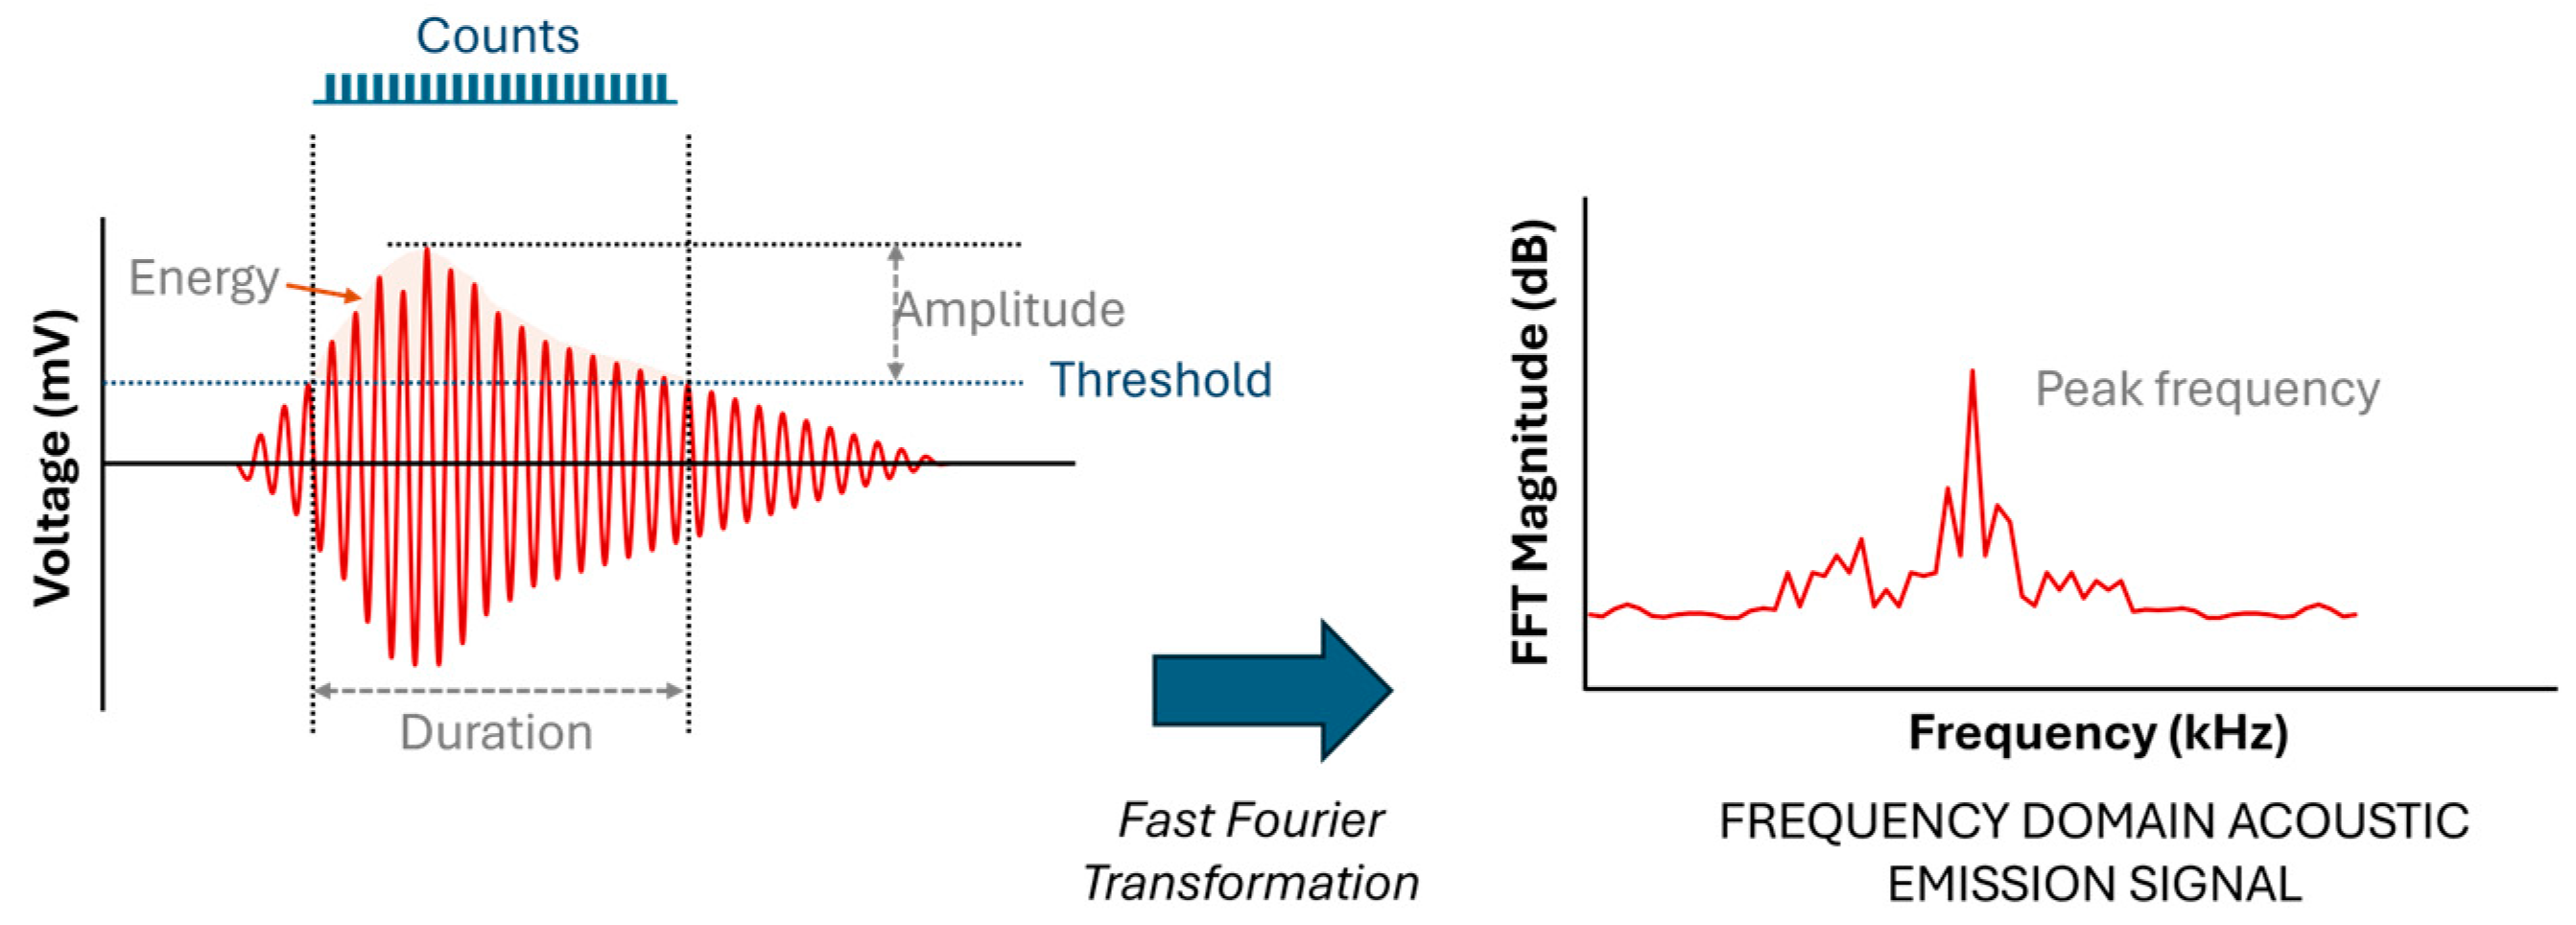
When a material deforms, localized strain energy is released and propagates through the material as an elastic stress wave, which is detected by a piezoelectric sensor coupled to the surface. The resulting waveforms, as illustrated in Figure 4, are characterized by parameters such as duration, amplitude, counts, and frequency, which provide valuable insights into the nature of the damage [20].
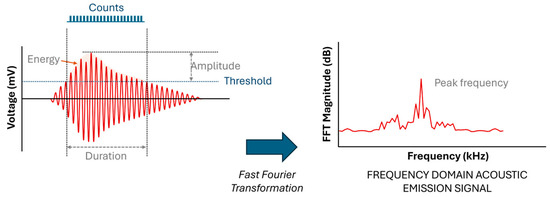
Figure 4.
Waveforms with parameters of duration, amplitude, counts, and frequency describing the nature of the damage [4,20].
3.1. Applications of Acoustic Emission in Material Engineering
AE is a highly adaptable and versatile technique used in material engineering and structural health monitoring to detect microstructural failures such as crack propagation, fiber breakage, and matrix delamination across materials such as composites, ceramics, and metals. As a passive method, AE monitors stress changes without external excitation, making it ideal for the real-time, non-intrusive detection of defects such as micro-cracks, fractures, and delaminations. Its high sensitivity allows early identification of emerging issues, enabling timely intervention before they worsen. With its ability to continuously monitor dynamic processes without disrupting operations, AE enhances safety, reliability, and efficiency across various fields by reducing downtime and ensuring long-term equipment health [21,22,23]. Ospitia et al. highlighted AE’s effectiveness in detecting early damage in structural materials, enabling real-time monitoring to prevent failure [24]. Trojanová et al. demonstrated its use in studying plastic deformation in magnesium alloy composites, where AE detected key processes such as dislocation slip and fiber–matrix debonding during loading [25]. Additionally, Zhang et al. explored AE’s ability to analyze the fatigue and tensile properties of carbon fiber-reinforced polymers, revealing how AE can capture early-stage damage and provide crucial data on stress distribution [26]. This versatility makes AE an essential tool for improving material performance and reliability across various engineering applications.
3.2. Acoustic Emission Setup
Acoustic testing monitors mechanical events in batteries during charge and discharge cycles by detecting elastic waves emitted as the material undergoes stress or deformation. The laboratory setup, shown in Figure 5, includes a cell tester, such as a potentiostat, to control the charging and discharging of the battery cell [4]. AE sensors detect the high-frequency waves generated by these events, and the signals are then amplified, filtered to remove noise, and recorded for analysis. These data reveal critical information about the mechanical behavior of the material, for example, the battery, such as crack formation, delamination, or phase changes, providing insights into failure mechanisms and enhancing battery safety and reliability. This setup is commonly used not only for batteries but also in the testing of a wide range of materials, where the test chamber with the battery is replaced by an appropriate material based on the specific experiment [3,27,28].

Figure 5.
The sensor chain for detecting and analyzing acoustic emissions from battery cells in research and development. Reprinted from [4] under the terms and conditions of the CC BY NC ND 4.0 license, Copyright (2024).
During cycles, mechanical events within the cell, such as microcracking, phase changes, or other stress-induced phenomena, generate elastic waves propagating through the material. These waves are then detected by an AE sensor, which converts the mechanical energy into an electrical signal [8]. The signal is subsequently amplified, often in stages, and may be filtered to reduce noise and enhance the clarity of the signal. Finally, a detection system monitors the signal, recording significant events based on predetermined trigger conditions. To ensure accurate data collection, the entire set-up is often isolated from external noise and vibrations, either through the use of an acoustic chamber or a vibration-isolated pad.
The AE sensor typically consists of a piezoelectric material, such as lead zirconate titanate (PZT), known for its high sensitivity and cost-effectiveness [29]. These sensors can be resonant, have high sensitivity in a specific frequency range, or be wideband, with a flatter response across a broader frequency spectrum. Depending on the type of battery cell, the sensor is carefully positioned to maximize the detection of acoustic waves, often with the aid of silicone grease or pressure-enhancing devices, to ensure optimal contact between the sensor and the cell [8,30].
Preamplifiers increase the voltage of signals and are positioned at the beginning of the sensing chain to minimize noise interference and improve the signal-to-noise ratio by amplifying weak AE signals, typically in the millivolt range, ensuring effective capture of even very weak signals. They can be integrated directly with the sensor or placed on a separate printed circuit board, depending on the design of the device; they are sometimes part of a module that connects to a battery management system (BMS) or another system. Popular choices include preamplifiers from Physical Acoustics Co., known for their high sensitivity and reliability [4].
An analog filter is applied to suppress aliasing effects and low-frequency noise before analog-to-digital conversion. This filtering ensures that the signal is sampled at least twice with the highest frequency present in the signal. By effectively removing unwanted noise and artifacts, the filter enhances the quality of the digital representation of the signal [4,29].
Depending on the voltage range of the data acquisition system, additional amplification may be necessary to fully utilize the analog-to-digital converter (ADC). If the signal needs to be increased to higher voltage levels prior to reaching the ADC, a supplementary amplifier can be placed after the analog filter. This extra amplification ensures the signal is properly scaled for optimal digitization, enhancing the ADC’s dynamic range and accuracy. This configuration allows for precise monitoring of internal mechanical activities within the battery, providing valuable information on the material’s behavior during operation [4].
3.3. Components and Signal Processing in Acoustic Emission Systems
The initial conversion of the charge signal from the piezoelectric transducer takes place within a composite system, which consists of the sensor itself, the connection cable, and the input stage of a preamplifier. The charge signal, in this context, refers to the electrical signal generated by the piezoelectric material due to mechanical deformation, which is then processed and can also be utilized in reverse to transform an electrical signal into a mechanical wave when operating as an actuator. This system determines how the mechanical vibrations detected by the piezoelectric material are converted into an electrical signal suitable for subsequent amplification and processing. The cable between the AE sensor and the preamplifier plays a crucial role in maintaining the system’s sensitivity, with most of the capacitance arising from the cable itself. Keeping the cable as short as possible is recommended to minimize resistance and reduce signal attenuation, especially at higher frequencies. Some sensors are designed with built-in preamplifiers and filters within the housing to mitigate issues related to electromagnetic interference and radio frequency interference [4]. Preamplifiers, located early in the sensing chain, increase signal voltage, thereby improving the signal-to-noise ratio and increasing the transmission distance for data acquisition [29]. These preamplifiers typically have a high input impedance to prevent sensor loading, while their output has a lower impedance, which matches the acquisition hardware for optimal signal transmission. Typical preamplifier gains range around 40 dB, although values from 34 to 60 dB are also reported, depending on the application [3,6,30,31]. Preamplifiers with bandwidths greater than those of the sensors are used in AE testing to ensure that the amplified signal retains all relevant information captured by the sensors, preserving the integrity of the data across the entire frequency range. Analogue bandpass filters are applied after amplification to refine the signal further to remove unwanted noise frequencies and prevent aliasing effects, which occur when high-frequency components are incorrectly represented as lower frequencies during digital sampling. This combination of broader bandwidth preamplifiers and targeted filtering helps maintain a clean, accurate signal, enabling precise analysis of the mechanical events occurring within the material [29]. These filters typically set the lower frequency limit at 20 or 100 kHz [6,27,31], while the upper limit can reach 1 MHz or 2 MHz [3,27,28,32], ensuring that the signal is sampled at a rate that complies with the Nyquist criterion. If necessary, an additional amplifier may be used after the filter to match the voltage range required by the data acquisition system, ensuring full utilization of the analogue-to-digital converter range [33,34]. The system monitors and records AE events, or hits, when the signal exceeds a predefined detection threshold, usually measured in decibels (dB) [4].
3.4. Parameters
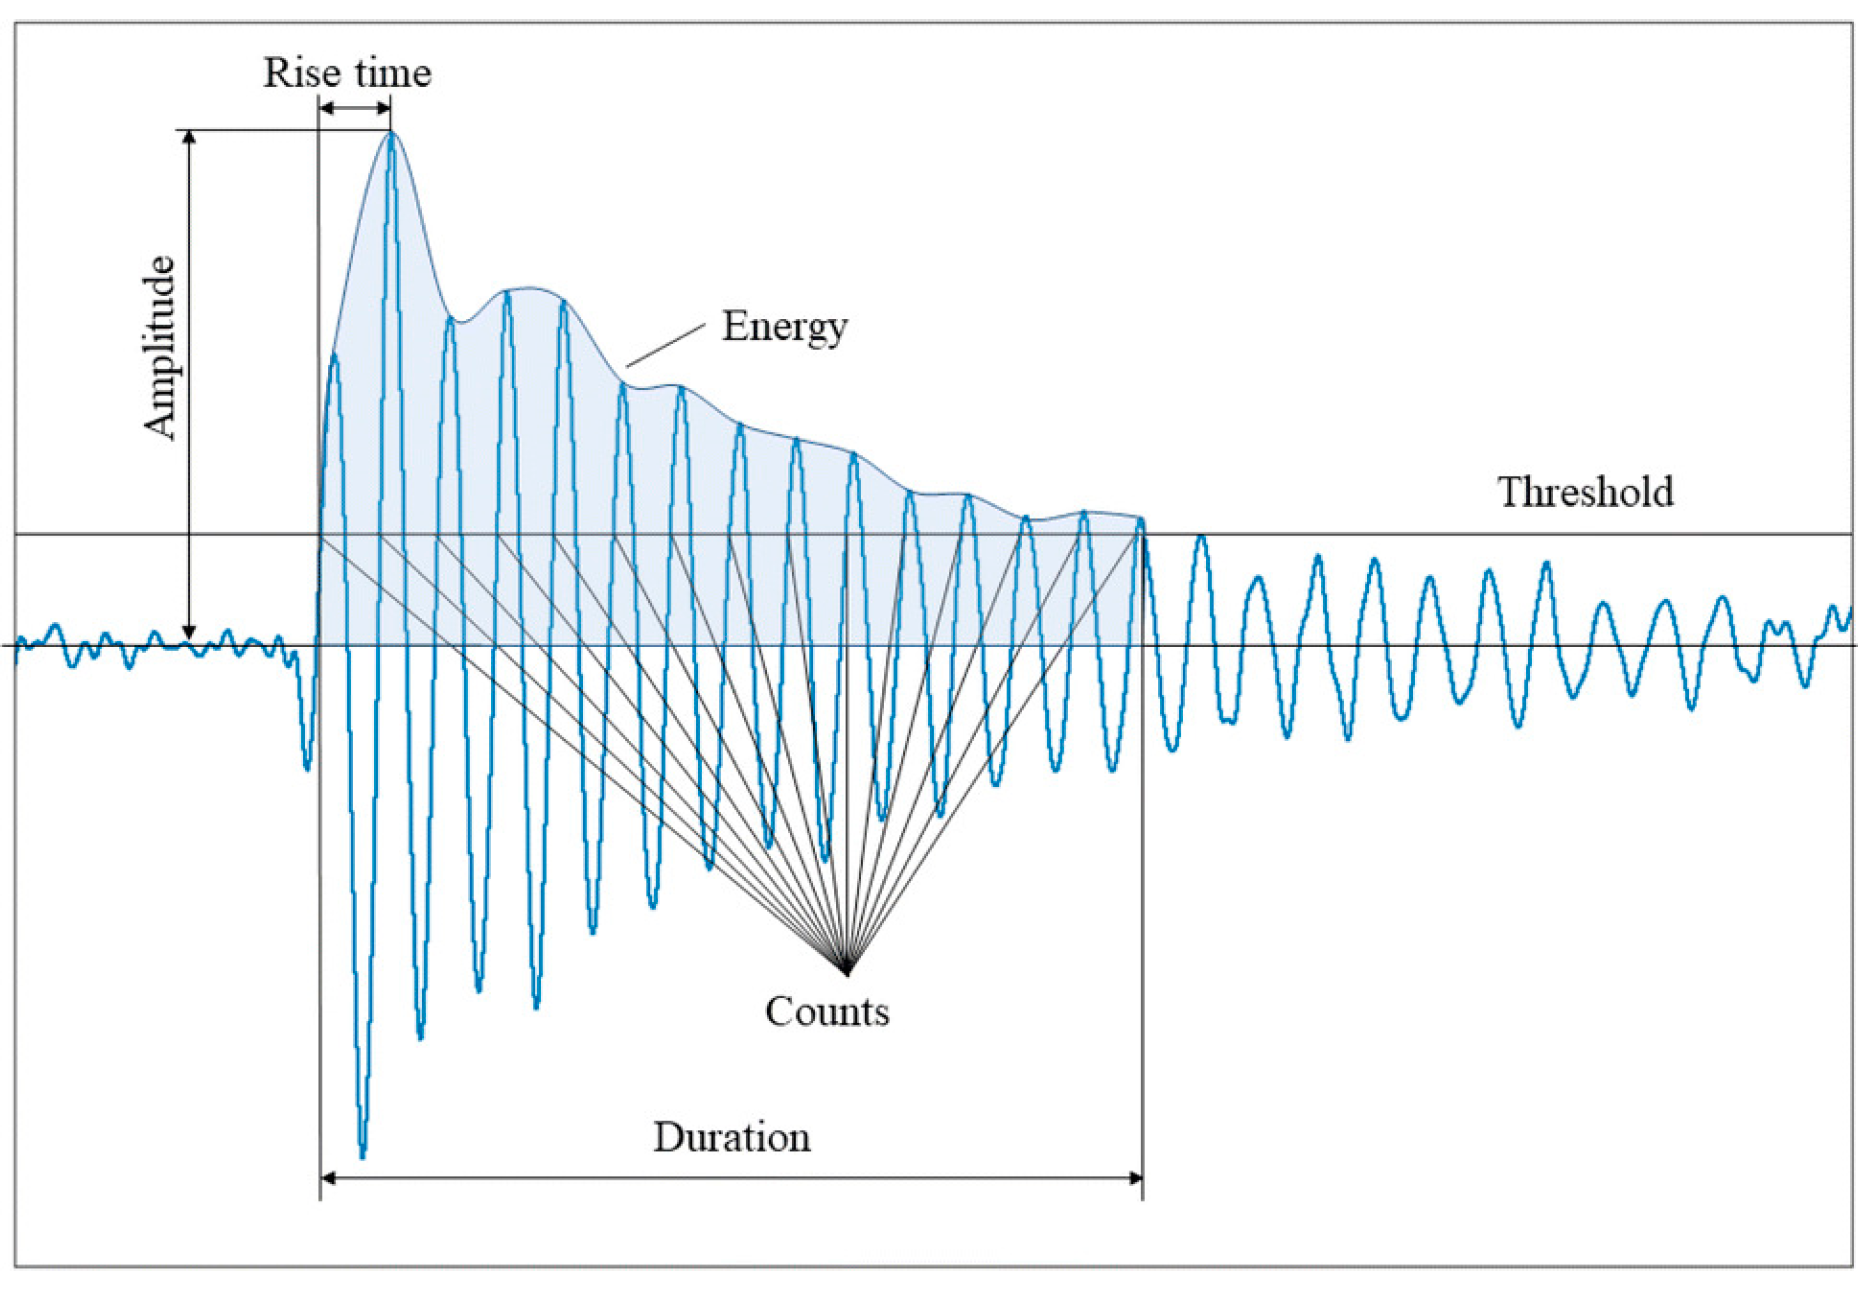
Once the AE data are recorded, they are digitally filtered and then analyzed in both the time and frequency domains. A typical filtered waveform is characterized by the parameters in Table 1 [4].

Table 1.
Acoustic emission signal parameters [4,35].
In Figure 6, the parameters are described in Table 1, with some being potentially distorted for several reasons. According to Ghadarah and Ayre, the amplitude and energy released from the AE source depend on the speed and size of the source event. A theory states that the AE amplitude is proportional to the crack’s velocity, while the AE energy released is proportional to the area of the new surface created. For example, a discrete, sudden crack will release high energy and produce a stronger energy signal, whereas a slowly propagating crack will release less energy over the same distance [36].
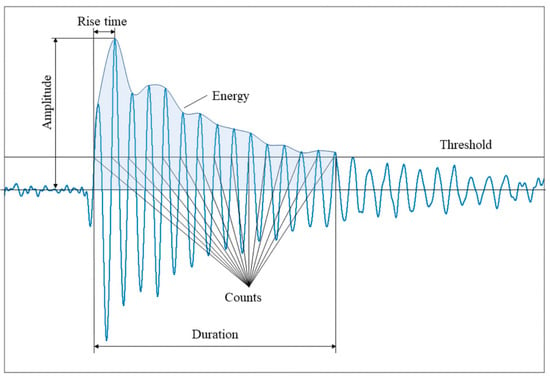
Figure 6.
Features of a typical AE waveform. Reprinted from [4] under the terms and conditions of the CC BY NC ND 4.0 license, Copyright (2024).
4. Acoustic Impedance
Acoustic impedance is a crucial parameter when using acoustics to monitor the condition of materials, as it represents the resistance of a medium (such as the electrolyte or electrode) to the passage of acoustic waves. Acoustic impedance (Za) is defined by the equation:
where is the density of the medium (kg/m3) and is the speed of sound in the medium (m/s). The formula can be rewritten as follows:
which makes it clearer to derive the unit (). In Equation (2), acoustic impedance is described as the ratio of acoustic pressure p (Pa) to volume velocity U (m3/s).
Changes in acoustic impedance can indicate alterations in material properties, such as density or structure, enabling the detection of defects, chemical composition changes, or mechanical damage within the battery. Monitoring acoustic impedance in real-time makes it possible to assess the condition of the analyzed material, contributing to enhanced safety [37].
The analogy between acoustic and electrical parameters can be used to explain acoustic impedance. Impedance consists of real and imaginary components. This relationship can generally be described as follows:
where the real component (Ra or Re) represents acoustic or electric resistance and the imaginary component (Xa or Xe) represents acoustic or electric reactance, with j being the imaginary unit. The reactance is composed of capacitive reactance (XCa or XCe) and inductive reactance (XLa or XLe).
where ω represents the angular frequency (rad/s), Ca is the acoustic compliance (m3/Pa), which is also reciprocal to the acoustic stiffness, and Ce is the electrical capacitance (F). Acoustic inertance is denoted as La (Pa∙s2/m3) and Le is the electrical inductance (H). An important parameter is the phase angle of the impedance, determined by the ratio of the imaginary and real components:
If the phase angle is positive, the impedance is inductive; if it is negative, the impedance is capacitive. Based on the nature of the phase angle of acoustic impedance and other parameters, it is possible to further specify the properties of the analyzed material [38]. The summarized analogy of acoustic and electrical parameters is summarized in Table 2 [39].

Table 2.
Analogy of acoustic and electrical parameters [40,41].
In the analogy between acoustics and electricity, several key parameters can be compared. Acoustic pressure in acoustics, which represents the difference in air pressure caused by the passage of a sound wave, is analogous to voltage in electrical circuits, which drives the movement of electrons. Acoustic velocity, the speed at which a sound wave propagates through a given medium, corresponds to current in electricity, which represents the flow of charges in a circuit. Furthermore, acoustic impedance is a parameter expressing a material’s resistance to the propagation of sound waves, similar to electrical impedance, which indicates a circuit’s resistance to electrical current. In both cases, impedance depends on the frequency of the wave and the material’s properties. Additionally, resistance in electricity, which represents energy losses as heat during the movement of current, has an acoustic counterpart in acoustic resistance, which influences sound absorption. Conversely, capacitance in an electrical circuit, which stores energy in the form of an electric field, is analogous to acoustic compliance, which relates to a medium’s ability to store acoustic energy. Acoustic inertance, representing the resistance of a medium to changes in acoustic velocity due to its inertia, corresponds to inductance in electricity, which resists changes in electrical current. Both phenomena involve energy storage: acoustic inertance in the kinetic energy of moving air, and inductance in the magnetic field generated by current flow [42,43].
5. Components of Lithium-Ion Batteries
Electrodes in modern LIBs are complex structures composed of active materials, additives, and binders. The active materials, typically metal oxides for the positive electrode and various carbons for the negative electrode, store lithium ions during operation. Usually, carbon-based additives enhance the electrode’s electronic conductivity, while binders maintain structural integrity by keeping the active materials in contact with each other and the current collector [44,45].
The electrolyte consists of a dissolved salt and a solvent, often a mixture of linear and cyclic carbonate solvents such as ethylene carbonate (EC) and dimethyl carbonate (DMC), which facilitate ion transport and ensure stability within the cell’s voltage range [45]. Lithium hexafluorophosphate (LiPF6) is the most common salt used in electrolytes, with various additives included to improve performance and stability [44].
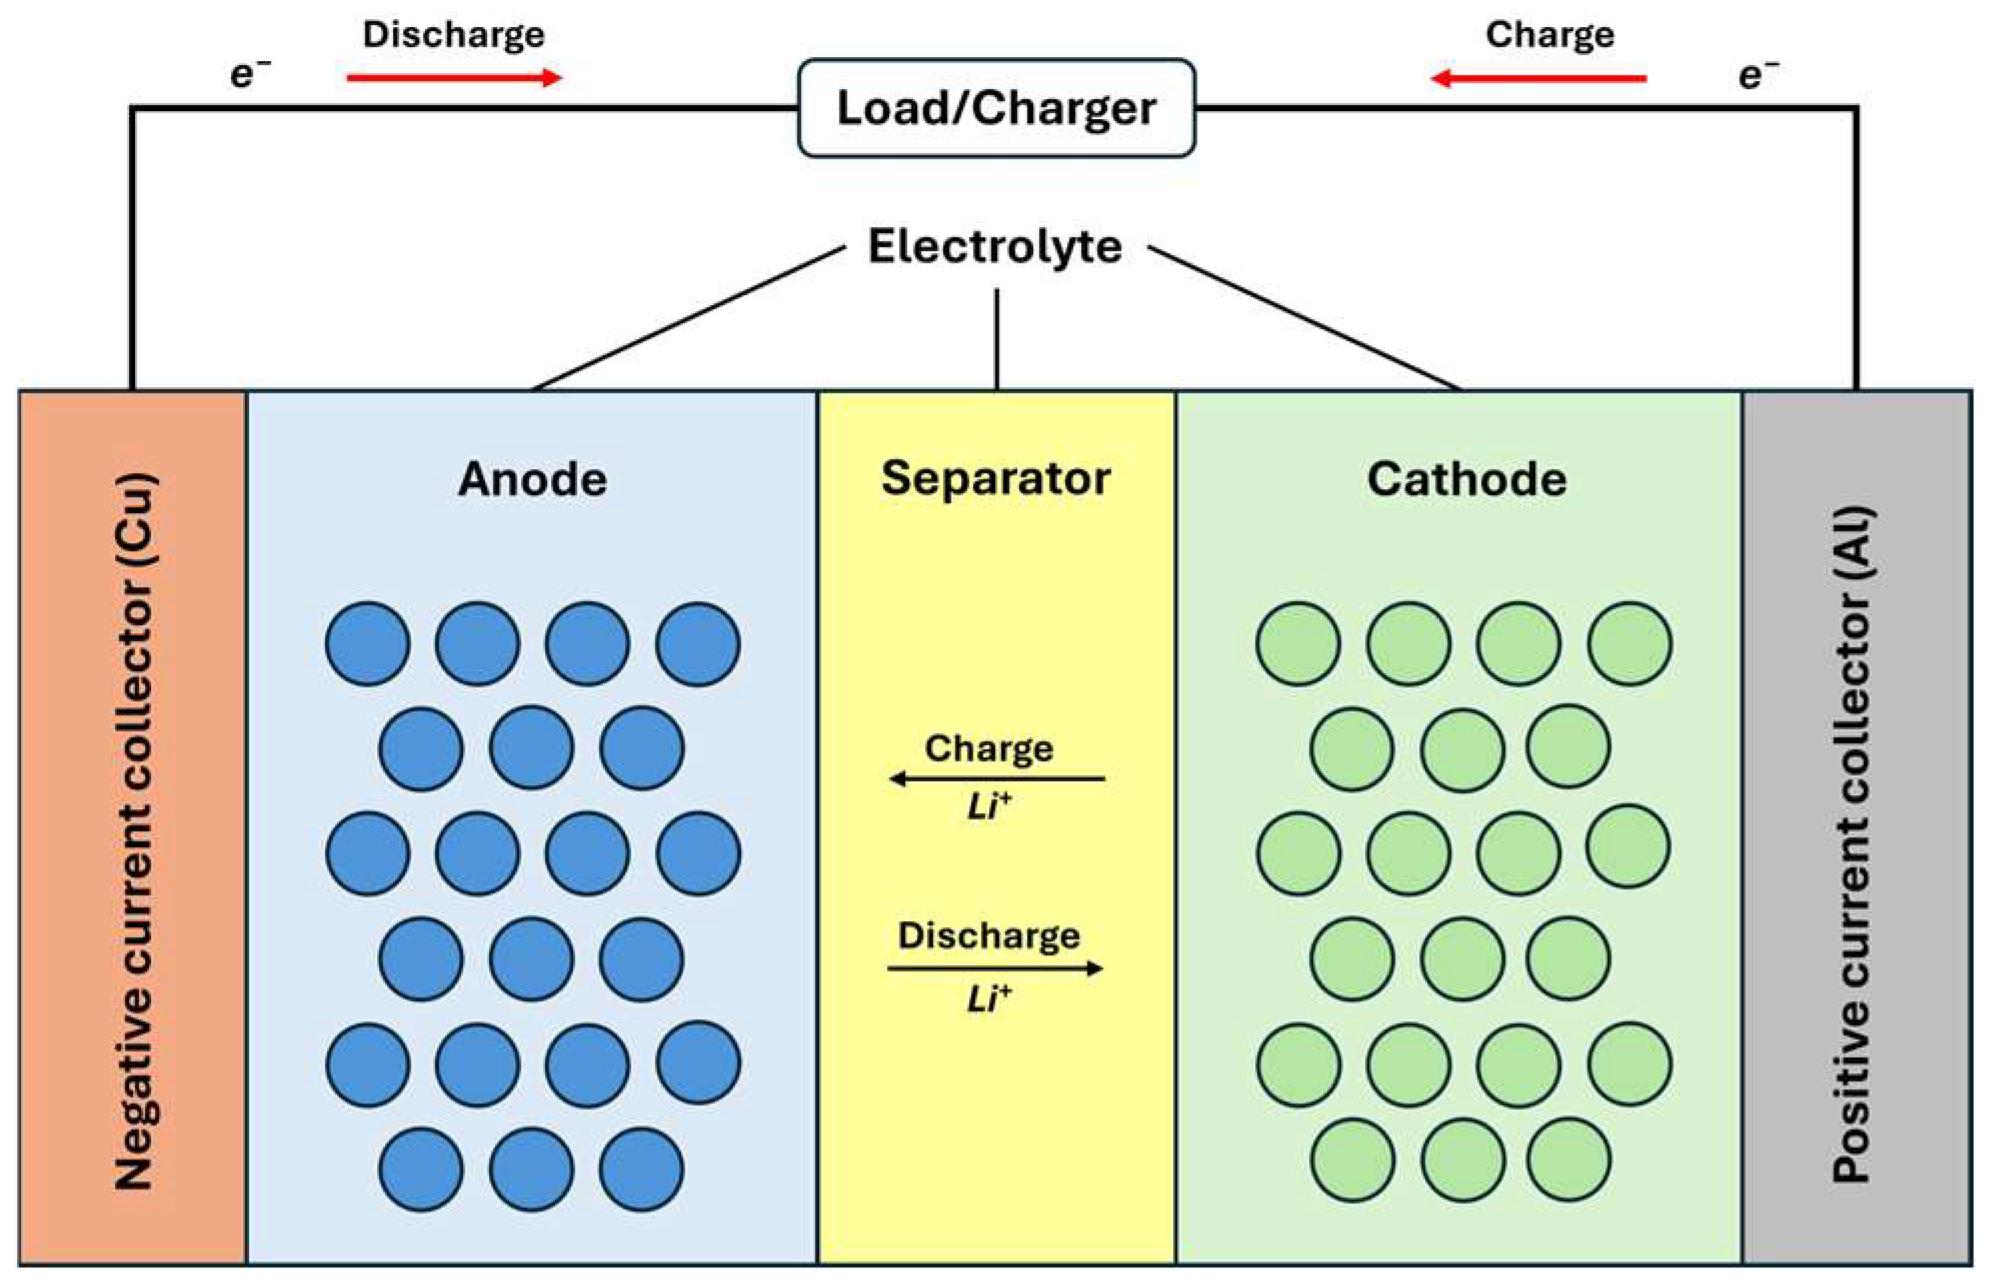
The separator is a porous membrane that physically separates electrodes while allowing lithium ions to pass through during the charge and discharge cycles. Critical considerations for separators include good electronic insulation, minimal ion transport resistance, and chemical and thermal stability. Microporous polyolefins, such as polypropylene (PP) and polyethylene (PE), are commonly used for separators in nonaqueous LIBs [45,46,47]. All of the described components are shown in Figure 7 [47].
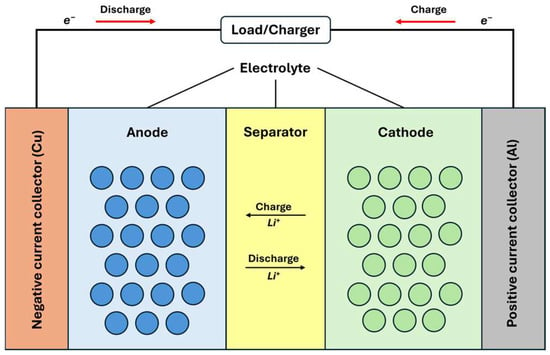
Figure 7.
Schematic of LIB operation: charge and discharge processes [47,48,49].
5.1. Mechanisms of Aging and Degradation in Lithium-Ion Batteries
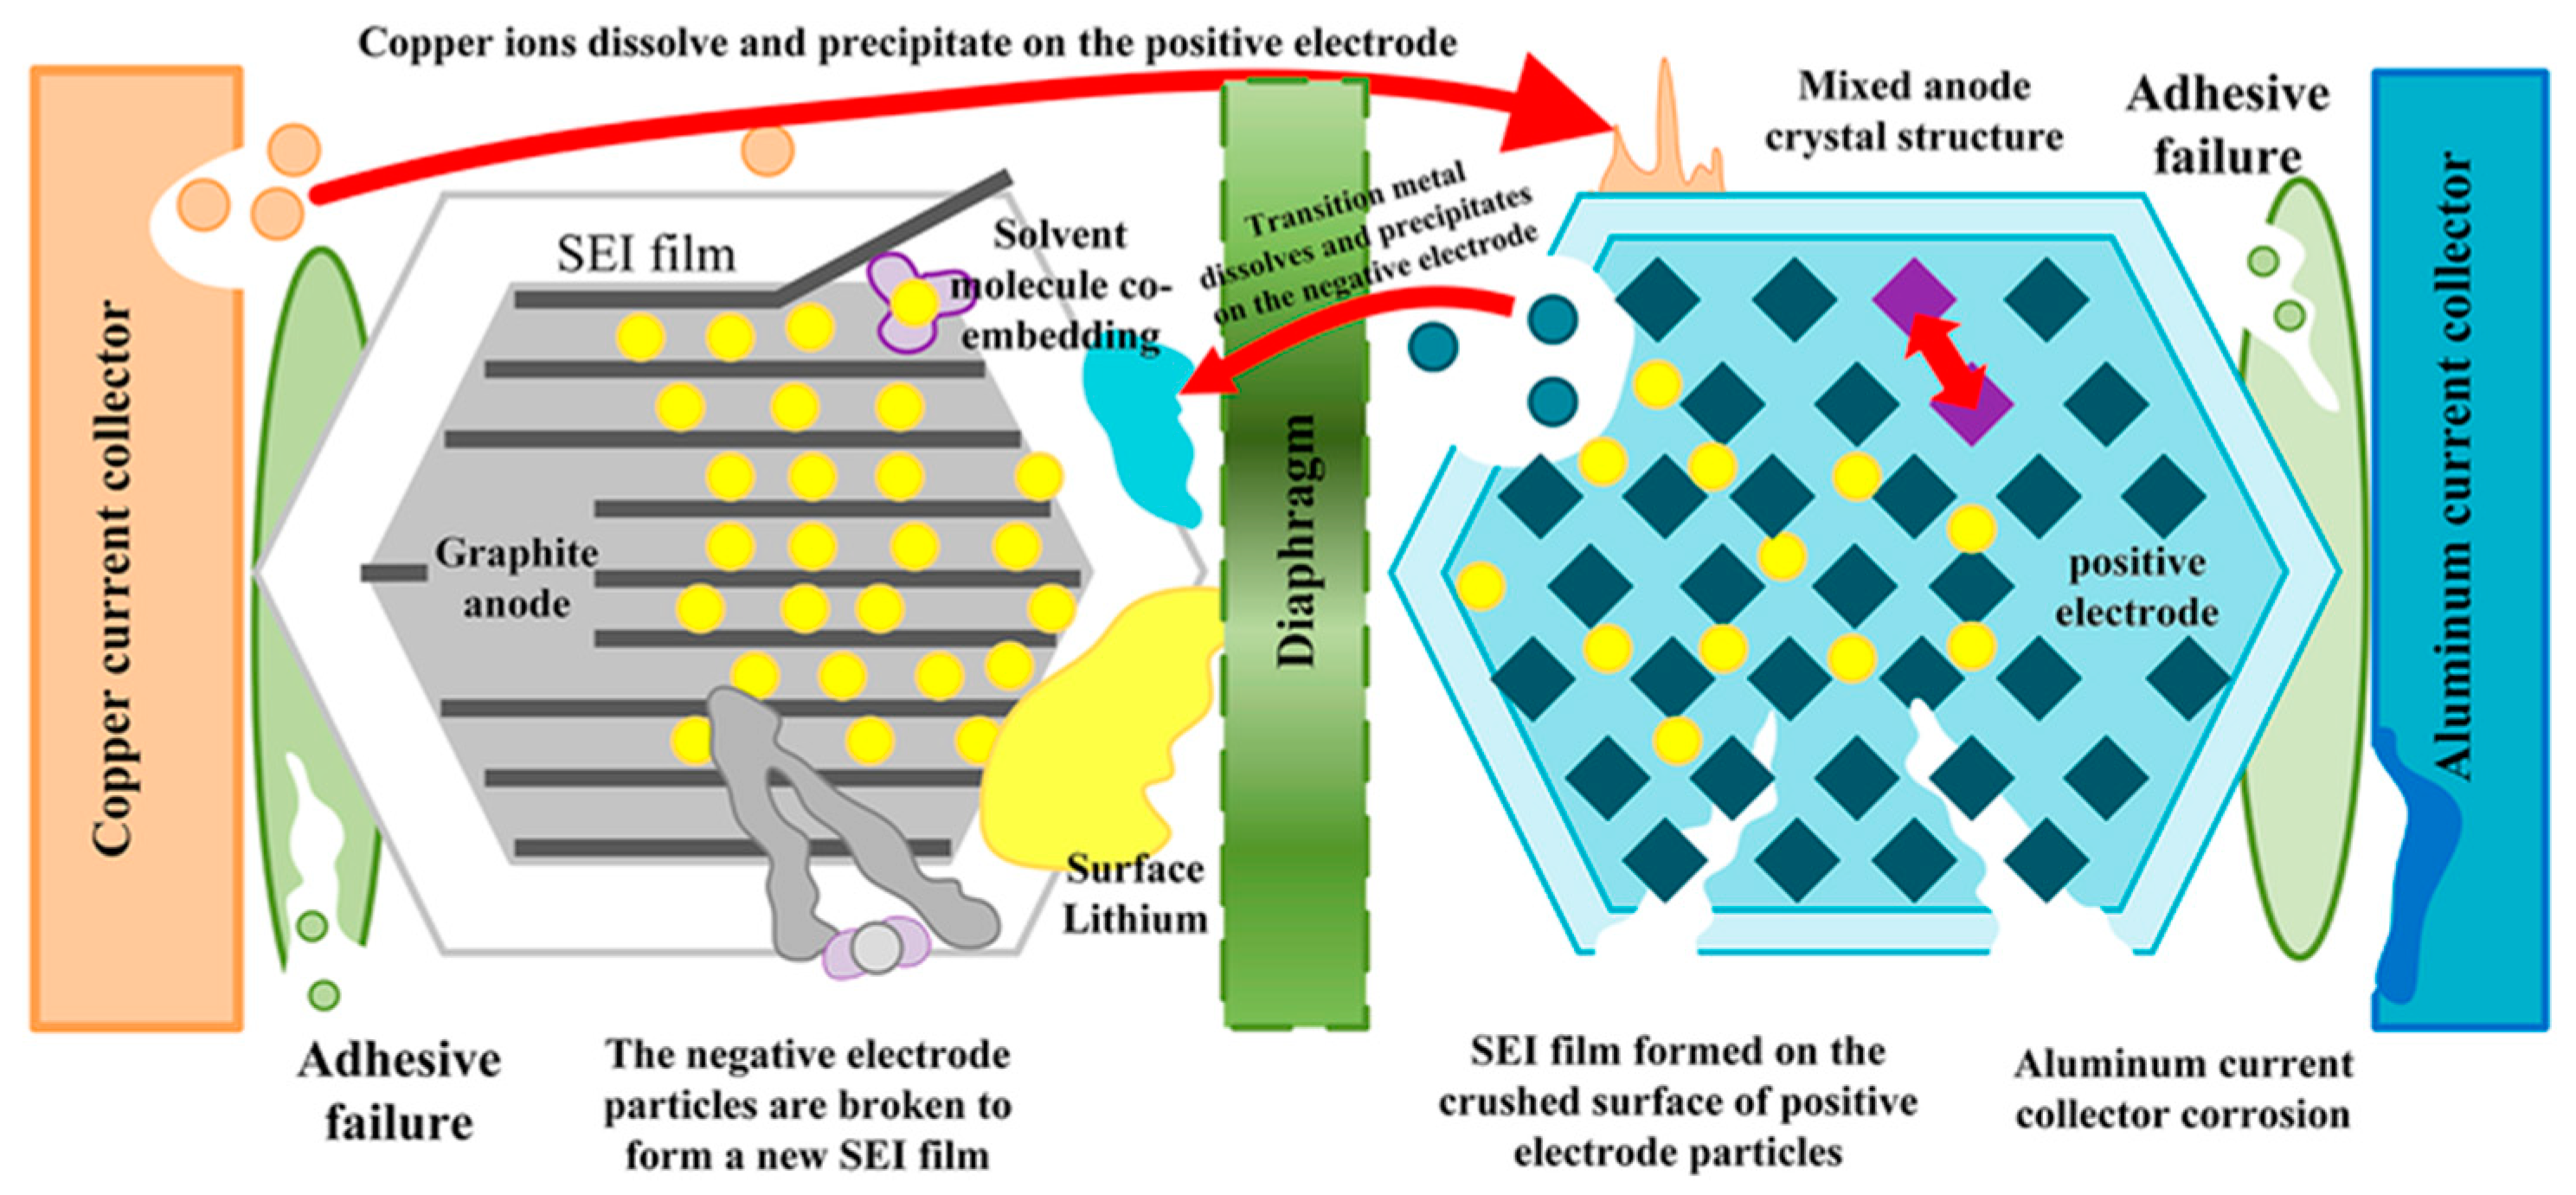
Battery aging manifests as a gradual decline in performance, lifespan, and reliability, with effects such as capacity fading (reduced ability to store charge) and power fading (diminished ability to deliver power). This degradation involves complex interactions among the battery’s components, including electrodes, electrolytes, separators, binders, and current collectors. Each component undergoes its own aging processes, which can influence others’ and accelerate overall deterioration. For example, the growth and decomposition of the SEI, along with electrolyte decomposition, can lead to lithium inventory losses, resulting in capacity fade. Corrosion of current collectors and cracking of electrode particles lead to losses of active material in the metal oxide electrode, which causes not only capacity fade but also power fade. Understanding these interconnected mechanisms is crucial for developing strategies to extend battery life and enhance performance, enabling more durable and reliable energy storage solutions across various applications. Examples of these degradation mechanisms are shown in Figure 8 [50,51].
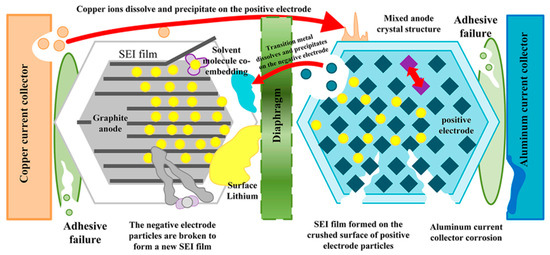
Figure 8.
Li-ion battery aging decay mechanism. Reprinted from [52] under the terms and conditions of the CC BY NC ND 4.0 license, Copyright (2022).
The formation and thickening of the SEI layer with each charge and discharge cycle is a well-documented degradation mechanism in LIBs. While crucial for protecting the graphite electrode from direct contact with the electrolyte and preventing further side reactions, the SEI layer evolves over time, becoming thicker and more resistive, which negatively impacts battery efficiency and contributes to capacity loss through the consumption of lithium ions (Li+). Mechanical and chemical damage, such as microcracking within electrode materials, disrupts the electron conduction pathway to the metal current collector, creating barriers that hinder the smooth flow of electrons and further exacerbating capacity decay. When the negative electrode or SEI cracks, it can come into contact with the electrolyte again, leading to the formation of a new SEI, which consumes additional lithium ions essential for charge and discharge processes. This ongoing loss of lithium ions, combined with parasitic reactions such as SEI growth, decomposition reactions, and lithium plating, renders them unavailable for cycling between the graphite and metal oxide electrodes, resulting in loss of lithium inventory (LLI) and gradual performance degradation over time. Understanding these intricate aging mechanisms is crucial for improving battery technology, as the SEI layer’s formation and growth underscore the need for advanced materials and strategies to enhance the longevity and efficiency of lithium-ion batteries, ultimately leading to more robust batteries with better performance and extended lifespans [53,54].
5.1.1. Solid Electrolyte Interphase
LIBs are assembled in a discharged state because of the instability of lithiated carbons in the air, using graphite and lithiated positive materials. The electrolyte is thermodynamically unstable at extreme potentials relative to Li/Li+, leading to its reduction on the graphite surface during the first charge and the formation of the SEI. This layer, composed of organic and inorganic decomposition products, stabilizes the electrolyte, preventing further reduction and ensuring electrode cyclability. The SEI also blocks solvent co-intercalation, which could otherwise cause graphite exfoliation. The stability window of the electrolyte in LIBs refers to the potential range within which the electrolyte remains stable without undergoing decomposition. For typical organic electrolytes, this window is usually between 0 and 4.5–5.0 V vs. Li/Li+. Beyond this range, the electrolyte begins to decompose, leading to side reactions that affect battery performance, such as the formation of the SEI. This process is crucial for the long-term stability and efficiency of LIBs, as it influences both the electrolyte’s stability and the battery’s overall performance [55,56,57].
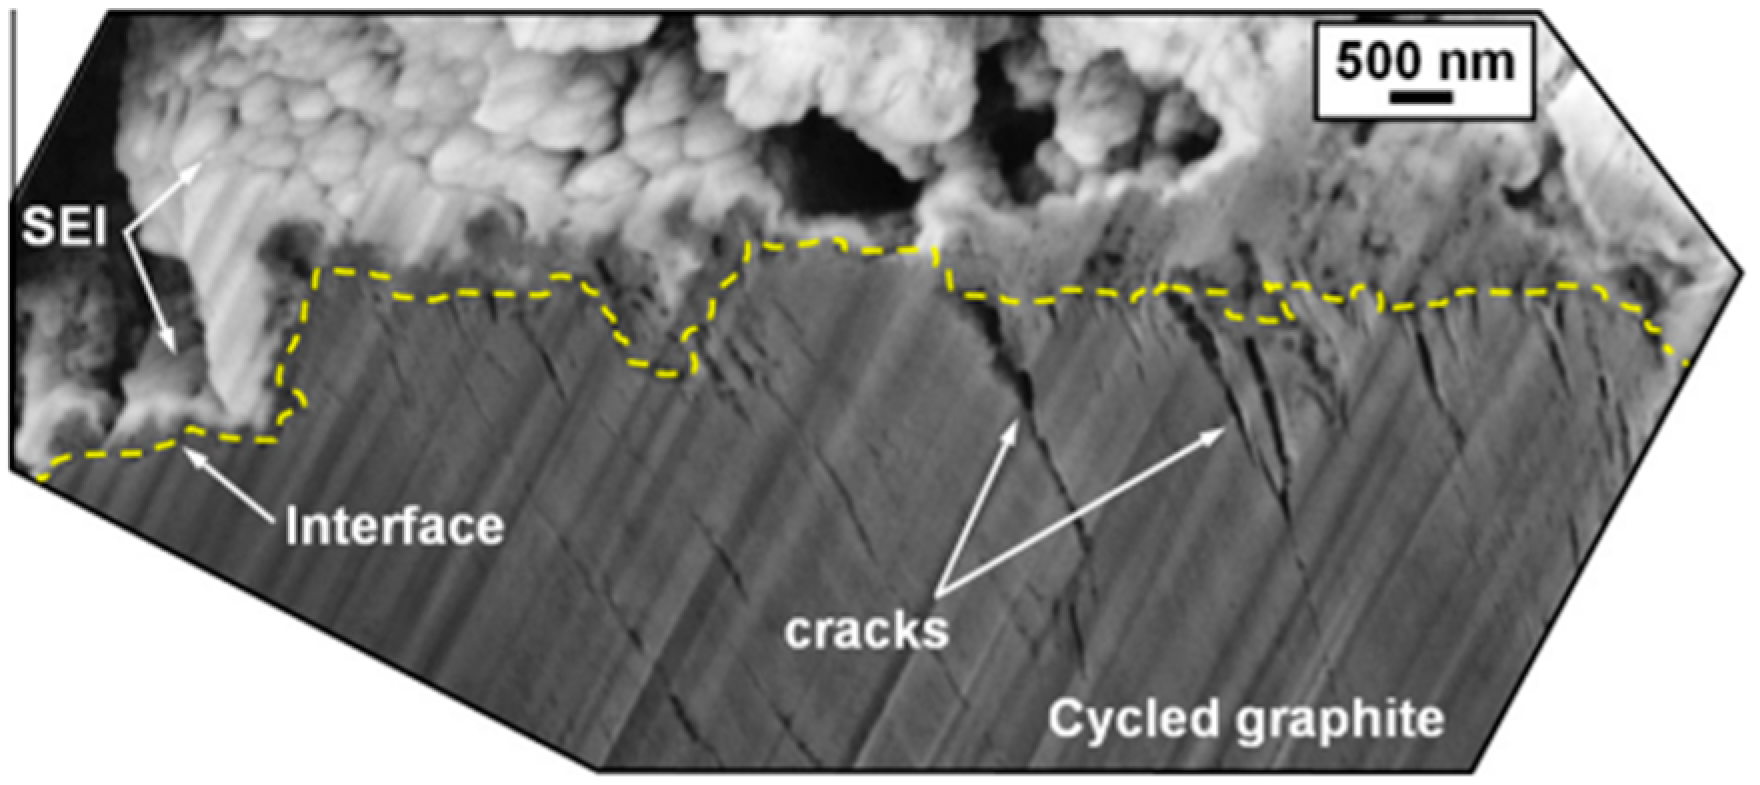
The onset potential for SEI formation at the negative electrode varies, with practical values around 0.8 V versus Li0/Li+. The SEI may continue to form over several cycles and is influenced by the composition of the electrolyte, additives, and other factors [58]. Ideally, SEI formation is completed before lithium-ion intercalation begins, typically at above 0.3 V [59]. The SEI is a complex structure with inorganic components near the carbon and a porous organic layer near the electrolyte. As seen in Figure 9, a cross-sectional scanning electron microscopy (SEM) image shows the SEI layer on a graphite electrode after 50 cycling cycles [60]. Its thickness, which is difficult to measure because of the component solubility, ranges from a few to hundreds of angstroms, with estimates often made using EIS. Models suggest a layered structure with a dense inorganic base and a porous organic top, sometimes containing lithium fluoride (LiF) crystals [56,61].
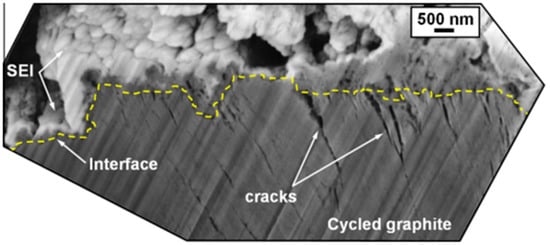
Figure 9.
Cross-sectional SEM image of the subsurface region of a graphite electrode showing the presence of cracks at the SEI/graphite interface. Reprinted from [60], with permission from Elsevier, Copyright (2012).
5.1.2. Microcracking
The effects of aging in LIBs primarily manifest within the bulk of the active material. Although volume changes in graphite due to lithium-ion insertion and extraction are typically less than 10% and generally insignificant, structural changes can still impose mechanical stresses on defects and carbon–carbon bonds [45,62]. This can lead to structural damage and cracking. Factors such as graphite particle cracking, exfoliation due to solvent co-intercalation, electrolyte reduction, and gas evolution contribute to accelerated electrode degradation, with gas evolution being particularly influential. Additionally, during the lithiation and delithiation processes, some positive electrode oxides may undergo phase transitions, causing distortions in the crystal lattice and inducing further mechanical stresses. Misfit strains at phase boundaries can result in discontinuities, leading to the formation of nanoparticle cracks. Srinivasan et al. have explored models of crack formation and propagation caused by mechanical stress and strain in nanoparticles in positive electrodes, providing insight into the complex mechanisms underlying electrode degradation [63].
The addition of silicon to graphite electrodes in LIBs can exacerbate these aging effects by introducing significant microcracking due to the large volumetric changes that silicon undergoes during lithiation. Unlike graphite, which expands by only about 10% upon lithiation, silicon experiences an expansion of over 300% [64]. This significant expansion and subsequent contraction during charge and discharge cycles create mechanical stress on electrode particles, potentially leading to cracking and detachment from the rest of the electrode, a phenomenon known as “island formation”. These electrically isolated particles can no longer contribute to the overall capacity of the cell, thereby hampering battery performance. Furthermore, the faster growth of the SEI on silicon compared to graphite means that new electrode surfaces are exposed to the electrolyte, leading to additional degradation processes [65,66].
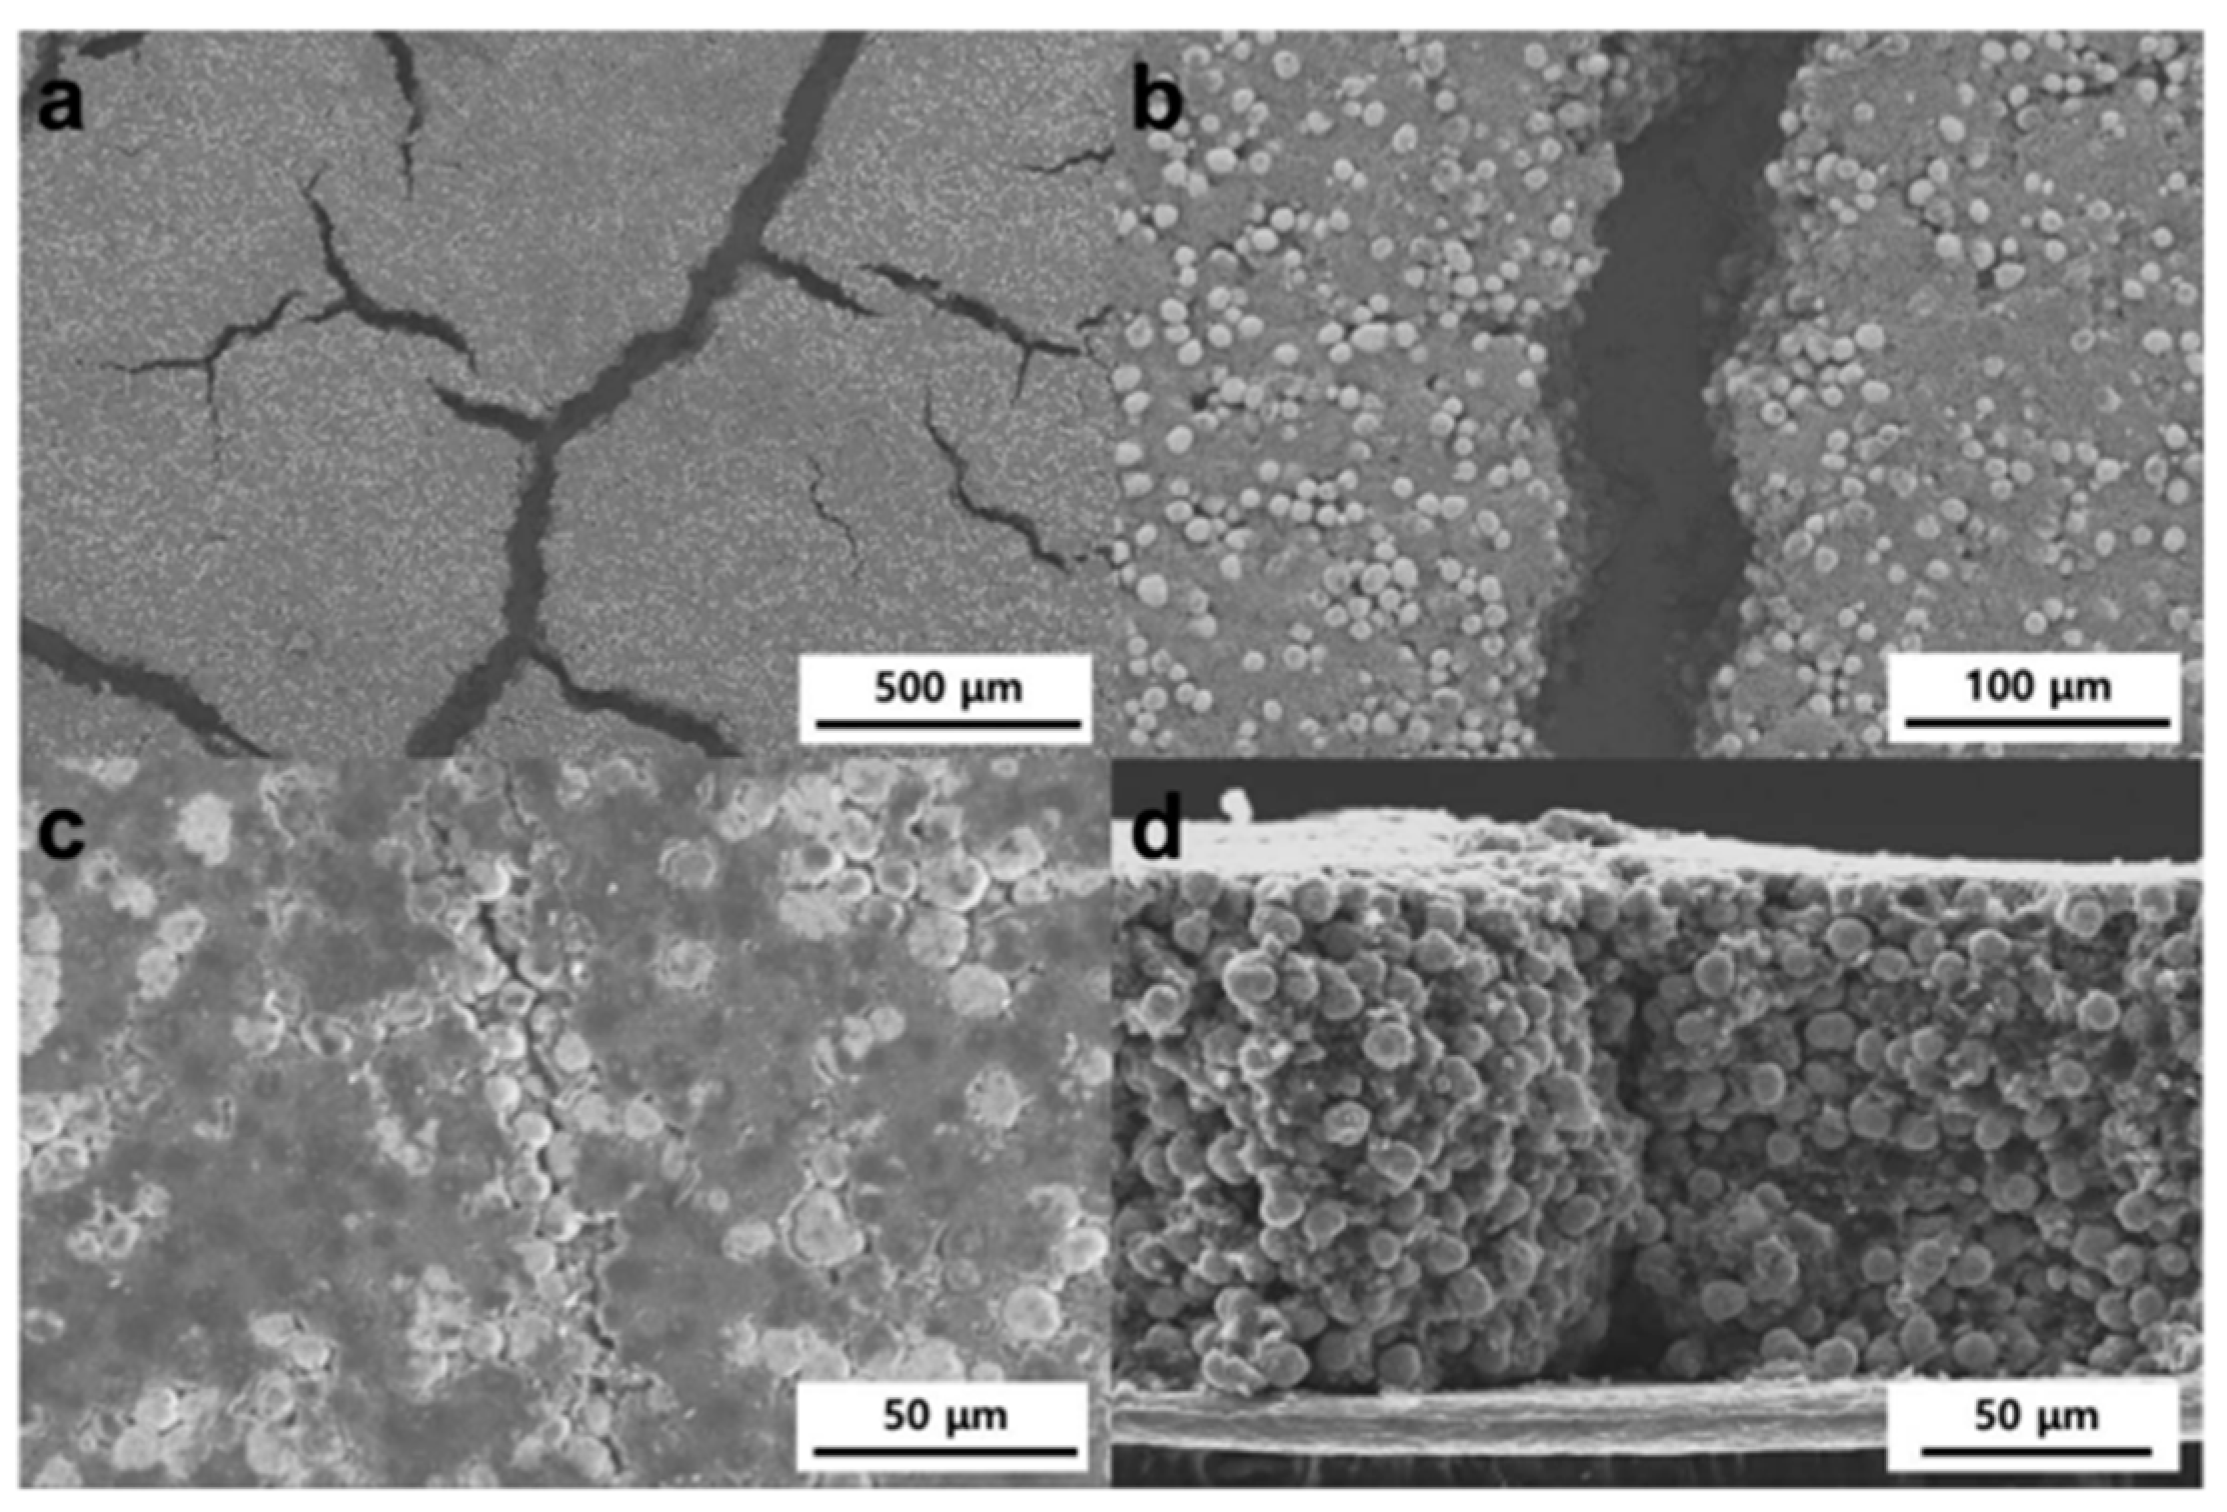
Figure 10a shows electrodes with “mud cracks” caused by a high ratio of carbon black and the binder, with initial crack widths reaching tens of microns. In Figure 10b, these cracks are displayed as straight channels. The SEM images in Figure 10c,d show that the channels remain as hairline cracks after calendaring, which are expected to facilitate ionic conduction. Narrower gaps are preferred to improve ionic conductivity and reduce tortuosity [67].
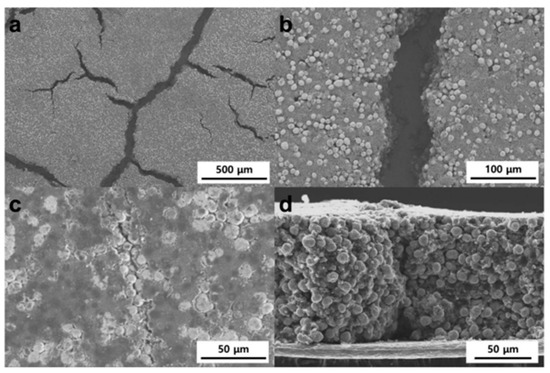
Figure 10.
SEM images of electrodes: top-view of as-dried electrodes with (a) low and (b) high magnifications, and (c) top-view and (d) cross-section of the pressed electrodes. Reprinted from [67] under the terms and conditions of the CC BY NC ND 4.0 license, Copyright (2018).
6. Monitoring and Analyzing Batteries Using Acoustic Emission
The use of AE for analyzing degradation processes and assessing battery health is becoming increasingly significant, particularly in laboratory settings. This technique detects sounds emitted by batteries, offering insights into internal damage and material fatigue, which makes it a valuable tool for ensuring battery reliability and longevity.
AE has been the subject of several scholarly publications, in which various types of batteries have been studied to examine different properties and parameters of battery health. For example, Zhou et al. used AE to analyze internal short circuits in cylindrical batteries with nickel–manganese–cobalt-based (NMC111)/graphite electrodes [68]. Guk et al. applied acoustic methods to observe the impact of calendaring processes on the microstructure of graphite electrodes in LIBs [69]. Additionally, Feiler et al. tested pouch cell batteries, exploring the relationship between the state of charge (SoC) and the response of the acoustic signal. These examples highlight the versatility of AE in improving our understanding of battery behaviors and improving their safety and performance [70].
Testing of batteries using AE is conducted under various conditions that depend on the type of batteries, their form factor, and the experimental parameters set during the tests. Commonly examined battery forms include coin cells [71,72,73,74], cylindrical cells [8,32,72], and, less frequently, pouch cells [16,75]. The most commonly tested chemistries involve lithium–cobalt–oxide (LCO)/graphite electrodes [76,77], followed by NMC electrodes [8,76] and silicon electrodes [78,79]. When setting the AE device parameters, the preamplifier is typically configured to 40 dB [71,76,80], though values of 34 dB and 60 dB are also reported in the literature [3,32,77]. The device’s frequency range is most commonly set between 100 kHz and 1 MHz [18,72,74,78], with less frequent usage of ranges between 50 kHz and 200 kHz [54,79]. Higher frequencies (above 1 MHz) are less common because most of the mechanical processes in the battery generate signals at lower frequencies. To ensure the accurate interpretation and relevance of the results, the threshold level is crucially set to 27 dB in most published experiments [3,18,19,20,27,32,54].
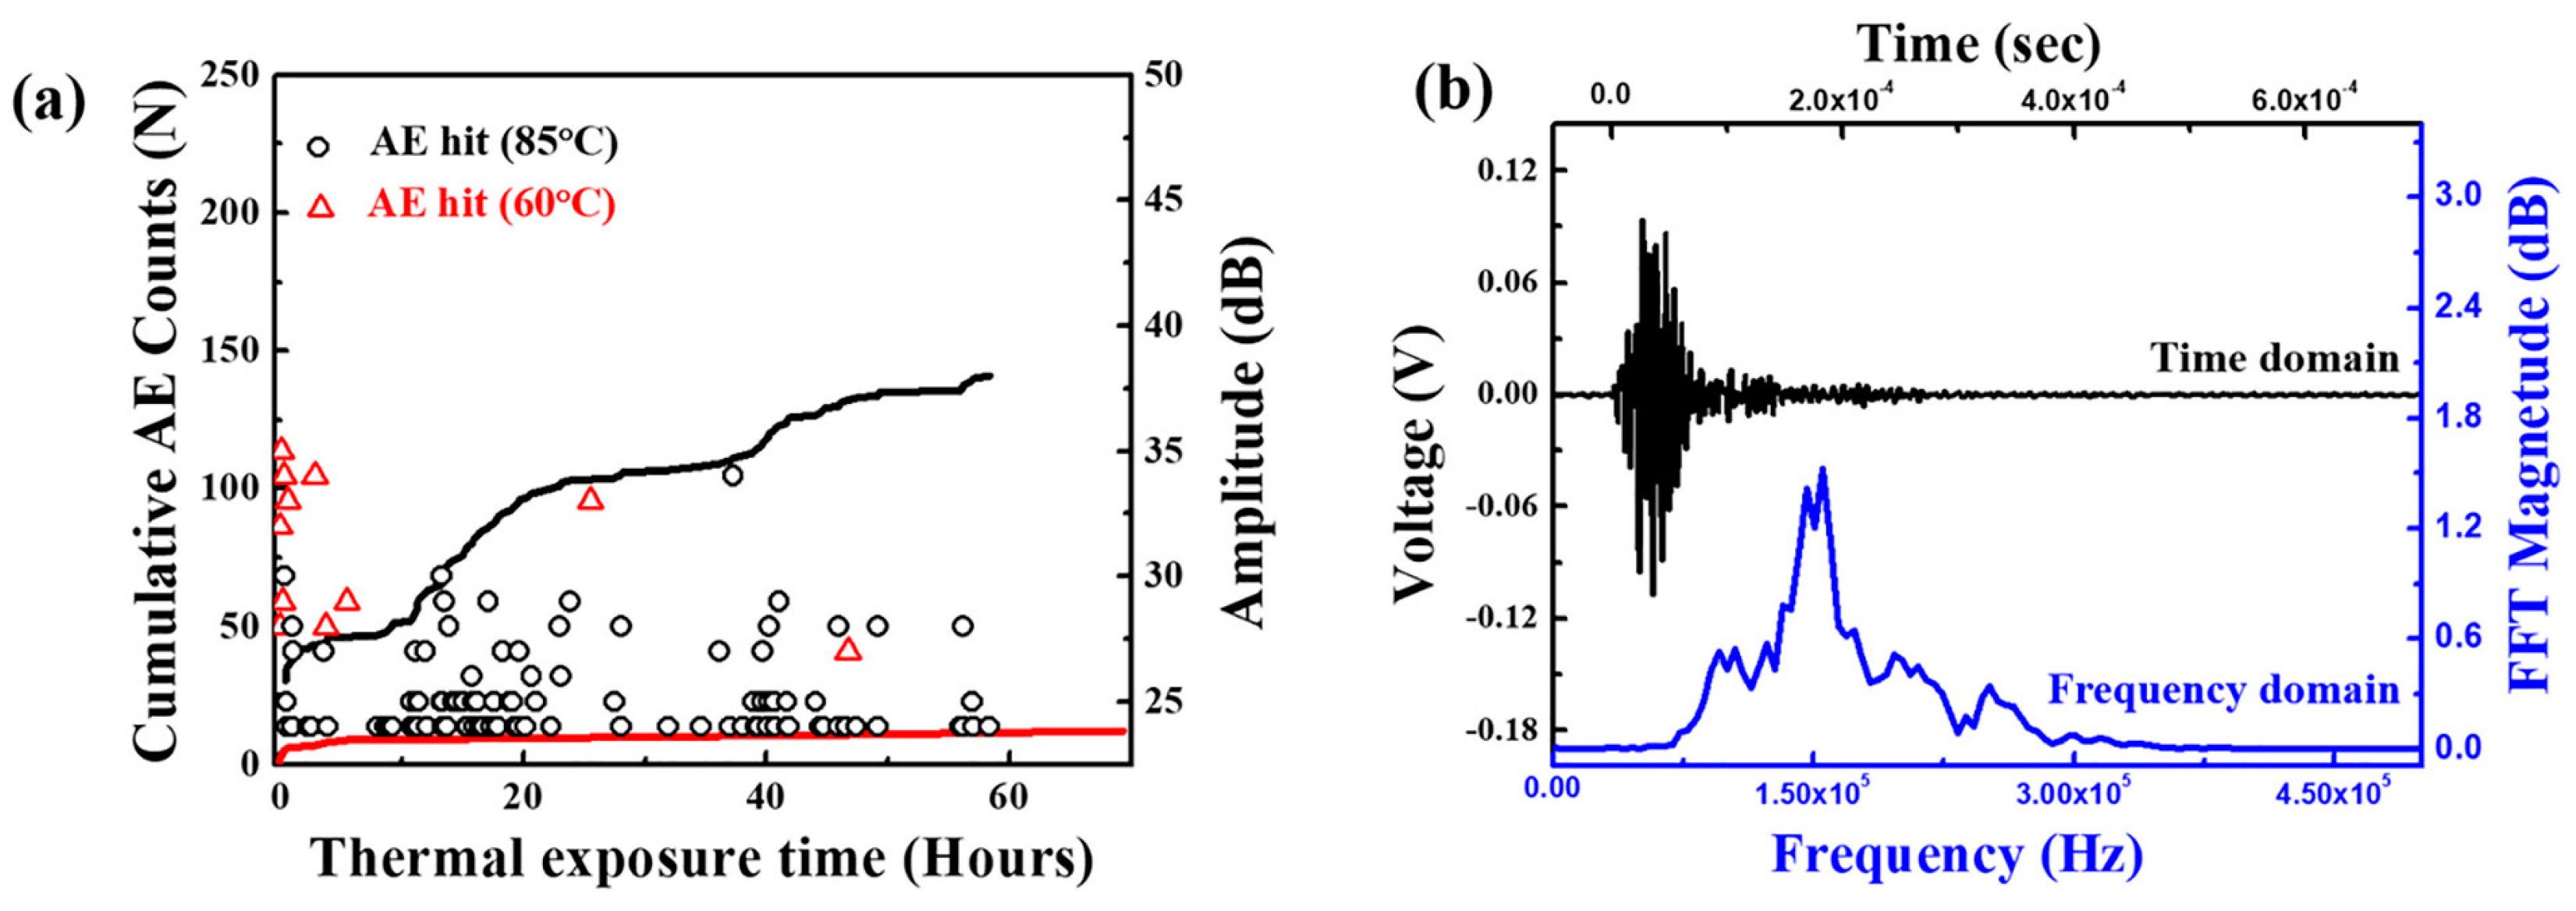
Kim et al. focused on the failure analysis of LIBs subjected to thermal abuse. The study explicitly investigates a coin-type LIB containing LCO and NMC electrodes, graphite electrodes, and a liquid electrolyte with LiPF6 salt. The batteries were exposed to elevated temperatures of 60 °C and 85 °C for up to 14 days [71]. The combination of AE, EIS, and microscopy techniques was used to monitor internal damage mechanisms in LIBs, specifically focusing on microcracking and chemical reactions within the battery components. AE proved particularly effective in detecting burst-type signals that indicated microcracks in the positive electrode material, especially when the battery was subjected to high temperatures such as 85 °C. As illustrated in Figure 11a, the cumulative AE count increased substantially over time at this elevated temperature, indicating an accelerated progression of internal damage. Furthermore, Figure 11b demonstrates a typical AE signal’s frequency spectrum, where a peak at around 150 kHz corresponds to microcracking events in the powder material of the battery. This AE analysis at 85°C was critical in identifying the onset and intensity of microcracks, which correlate with significant material degradation. These damages include the formation of LiF deposits on the negative electrode, microcracking in the positive electrode, and pore shielding in the separator, all of which contribute to accelerated capacity loss and heightened safety risks in thermally stressed LIBs [71].
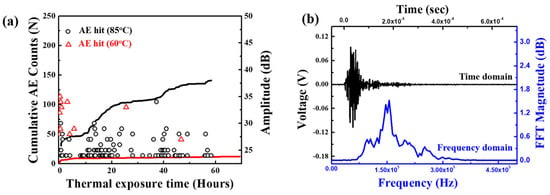
Figure 11.
(a) Occurrence of acoustic emission (AE) hits and the resulting cumulative AE count with thermal exposure temperature and time, and (b) a typical AE signal in the time domain and its fast Fourier transformed frequency spectrum. Reprinted from [71], with permission from Elsevier, Copyright (2019).
6.1. Degradation Mechanisms in Batteries and Their Analysis Using Acoustic Emission
Analyzing the characteristics of AE spectra allows for the identification and differentiation of various degradation phenomena within graphite electrodes in lithium-ion batteries (LIBs). The frequency, amplitude, and waveform of AE signals provide crucial insights into the specific types of damage or reactions occurring during battery operation, facilitating non-destructive monitoring of the internal state and the identification of potential failure modes. Notably, Matsuo et al. [81] have made significant contributions to this field, highlighting typical degradation processes associated with graphite electrodes and the corresponding features observed in AE spectra. However, their work is part of a broader landscape of research; studies by other authors also explore similar degradation mechanisms in graphite and other negative electrode materials, thereby enriching the understanding of acoustic emissions in LIBs [4,82].
6.1.1. Gas Evolution
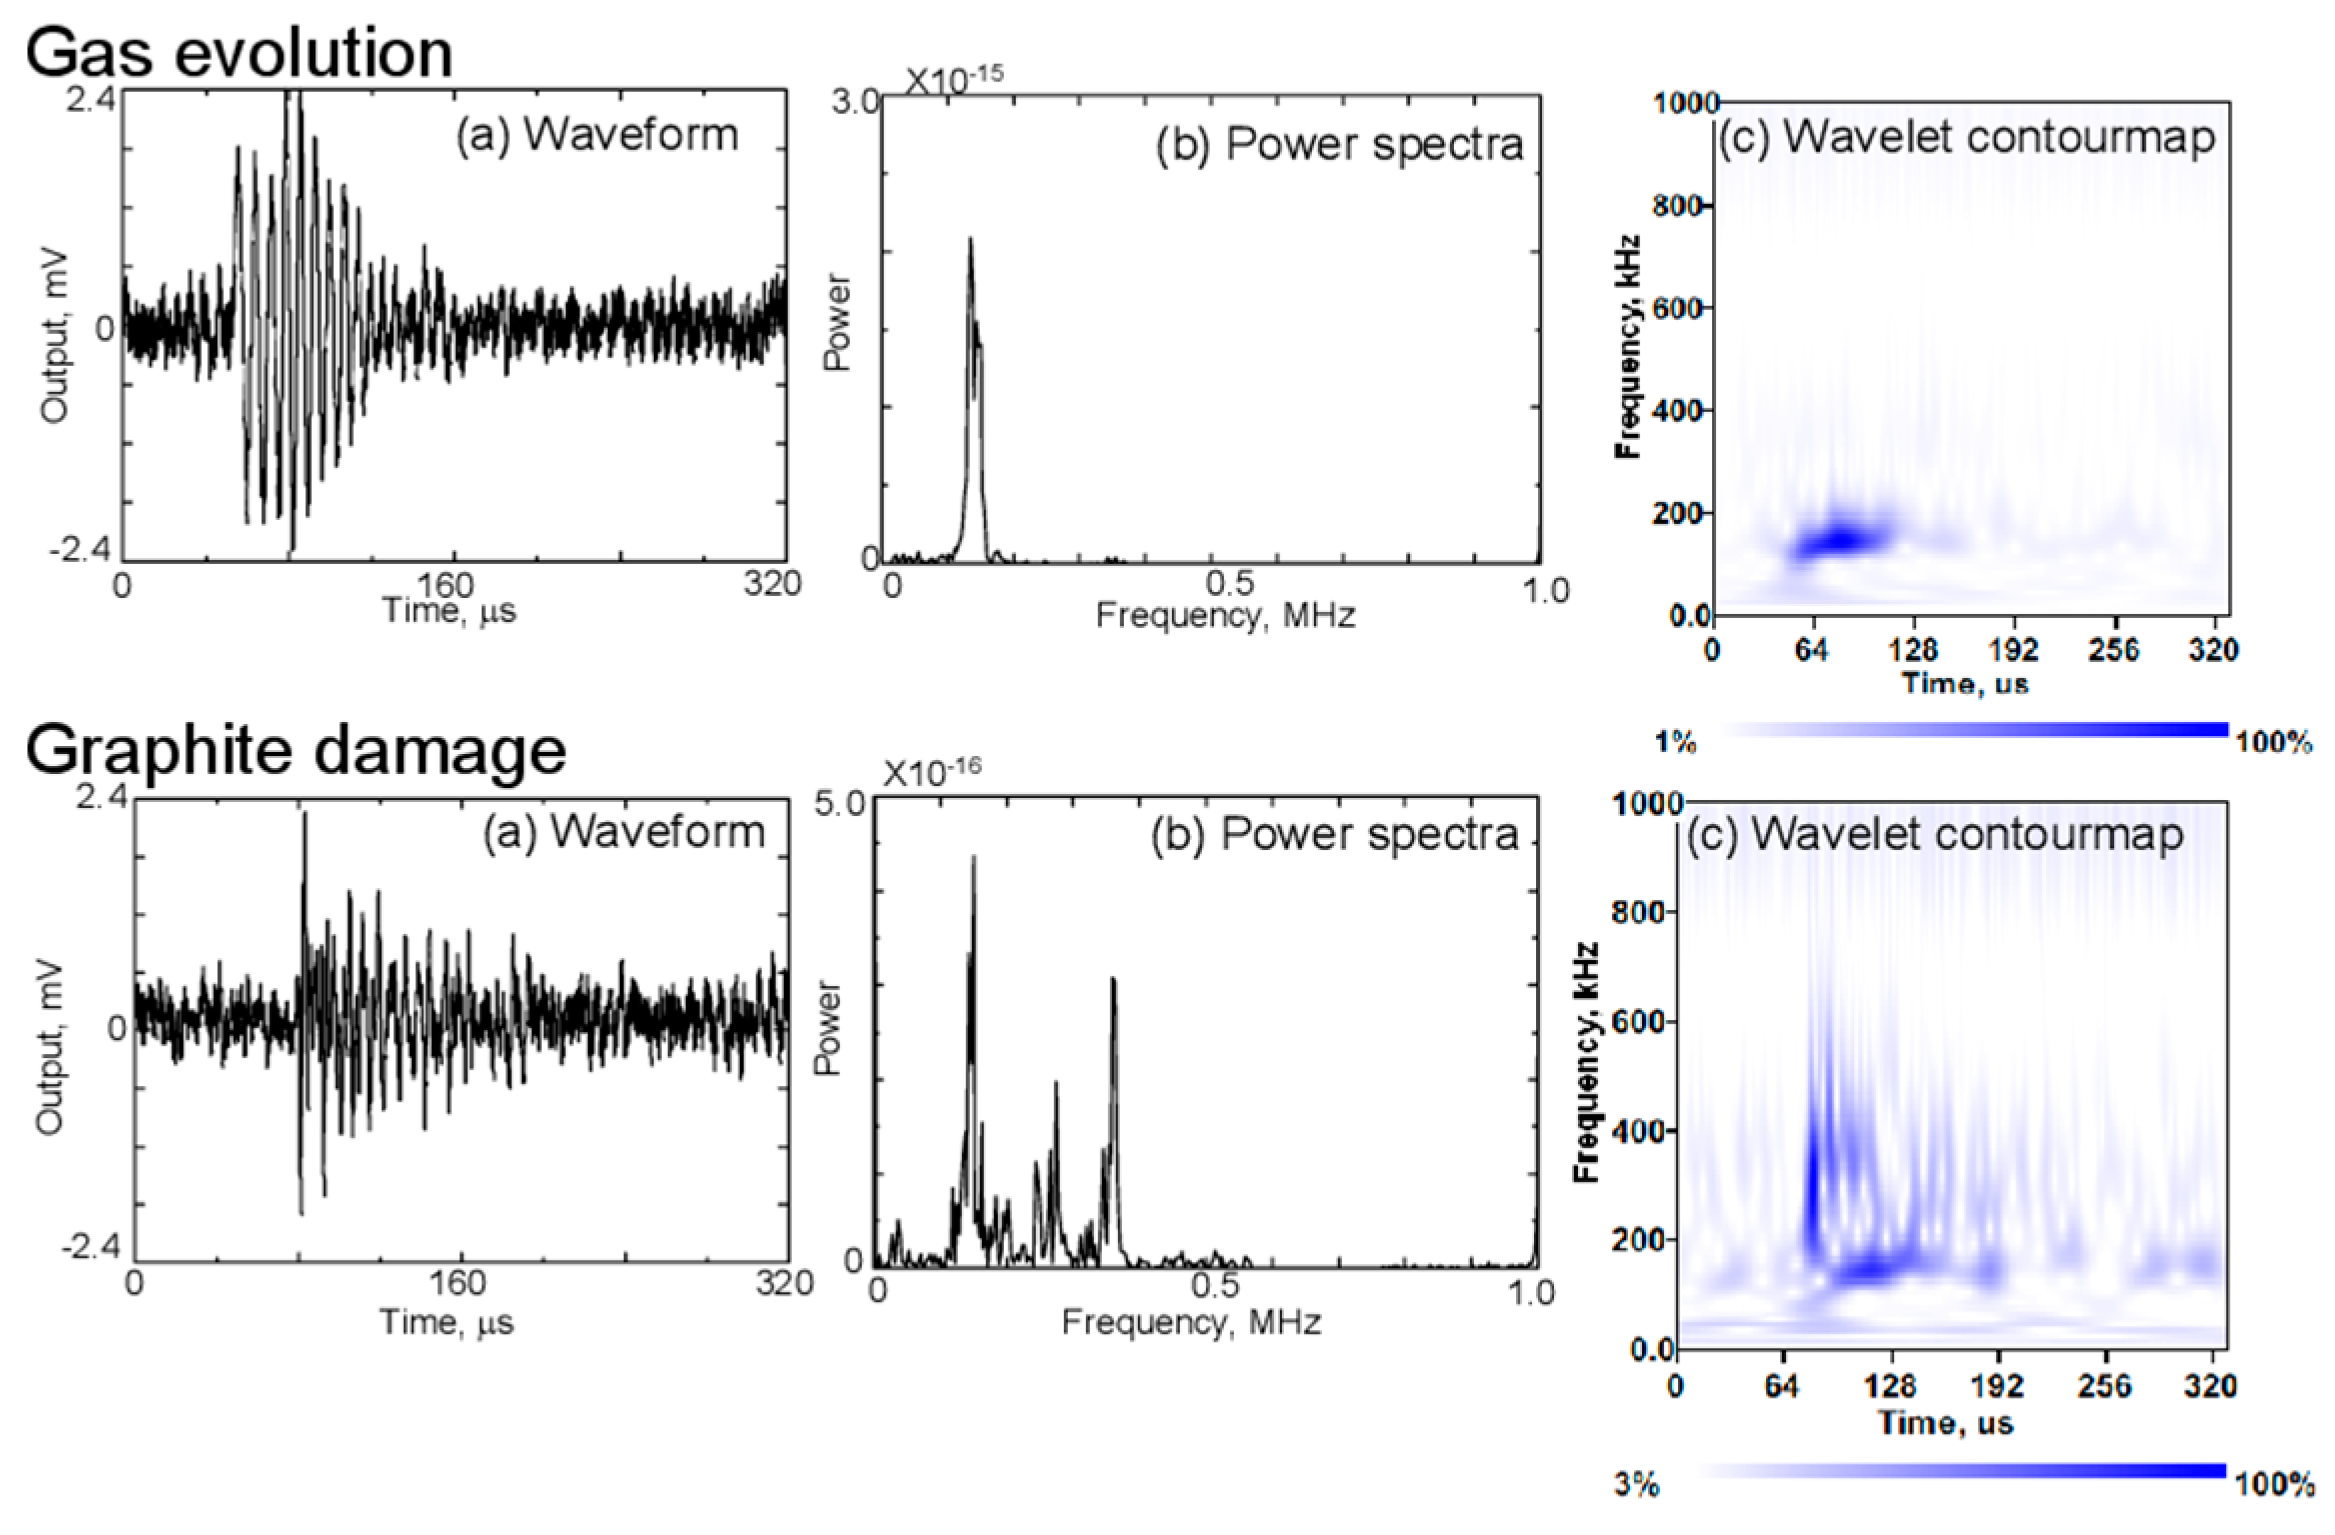
Gas evolution occurs due to solvent reduction during cycling, forming gas bubbles within the electrolyte. The AE signals associated with this process are characterized by low-frequency components, typically below 130 kHz, as shown in Figure 12. These signals are most prominent during the initial charge, correlating with the formation of the SEI layer. In the wavelet contour maps on the right, the energy of AE signals linked to gas evolution is concentrated in the lower frequency range [4,55,81].
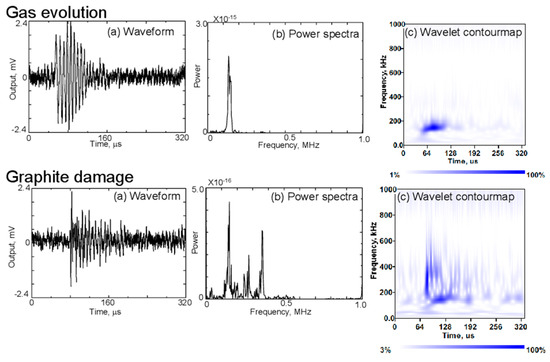
Figure 12.
Waveforms, (a) power spectra, (b) and contour maps (c) of AE signals clustered as gas evolution and graphite damages during charging and discharging of the battery. Reprinted from [81] under the terms and conditions of the Journal of Solid Mechanics and Materials Engineering permission, Copyright (2011).
6.1.2. Graphite Damage
Graphite damage, such as particle cracking or exfoliation, results in AE signals with a broader frequency spectrum, extending up to 500 kHz, as depicted in Figure 12. These signals have a short rise time, making them distinguishable from those caused by gas evolution. This type of damage is typically associated with the mechanical stress exerted on the graphite particles during cycling [4,81].
6.1.3. Expansion and Contraction of Graphite
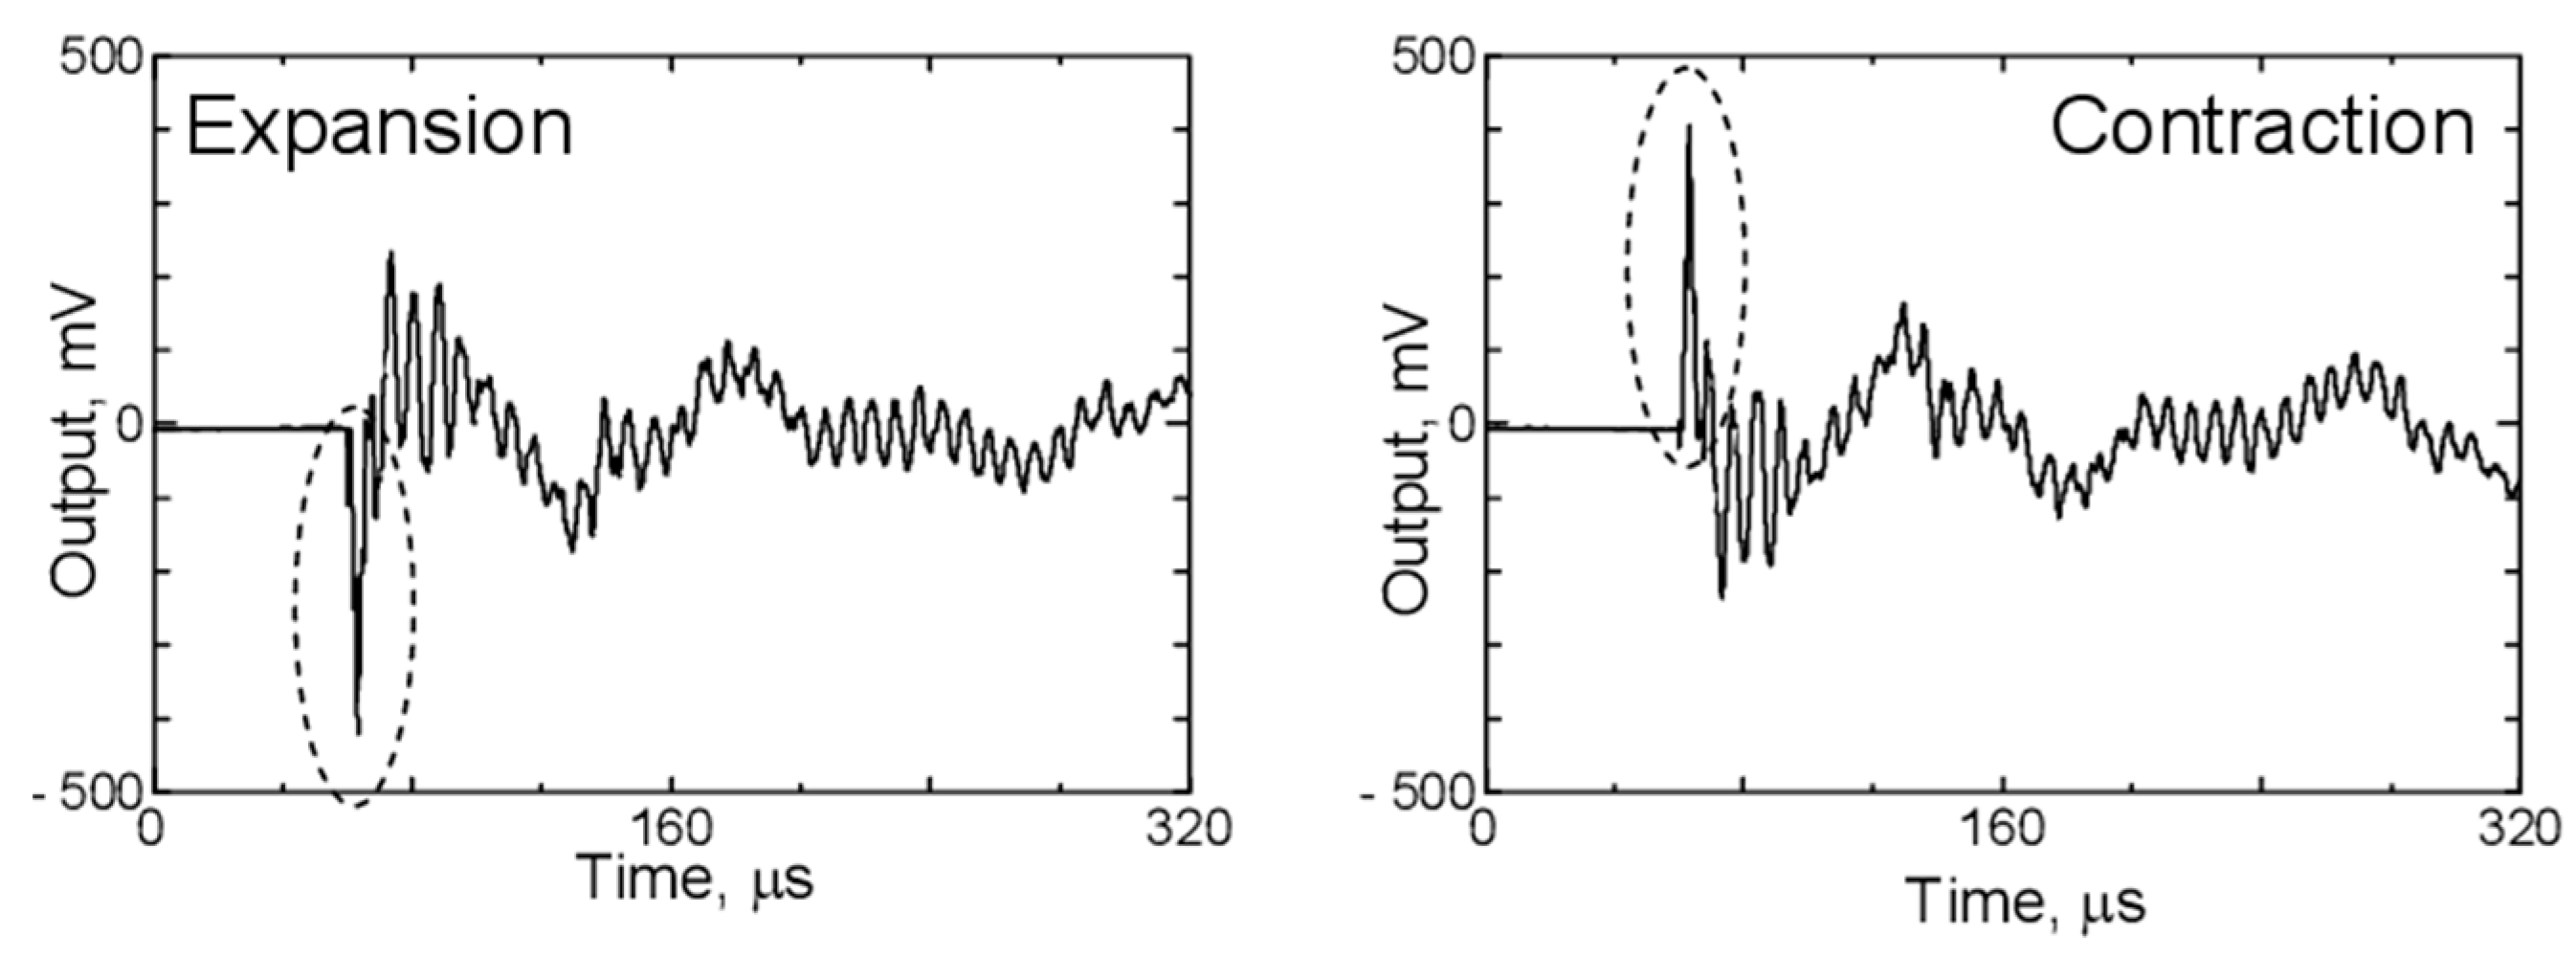
During charging and discharging, the graphite electrode undergoes volumetric changes, which also emit AE signals, albeit to a lesser extent compared to gas evolution or mechanical damage. Figure 13 shows the waveforms detected by the AE sensor when the PVDF film is excited by the application of positive and negative voltages. Upon applying a positive voltage, the laser interferometer detected a positive first peak, while the AE sensor recorded a negative first peak. In the case of graphite, negative peak signals are associated with its expansion, while positive peak signals indicate its contraction [4,81].
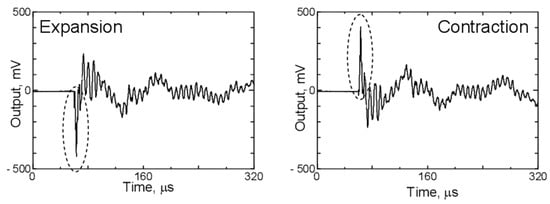
Figure 13.
Waveforms detected by the AE sensor produced by graphite distortion. Reprinted from [81] under the terms and conditions of the Journal of Solid Mechanics and Materials Engineering permission, Copyright (2011).
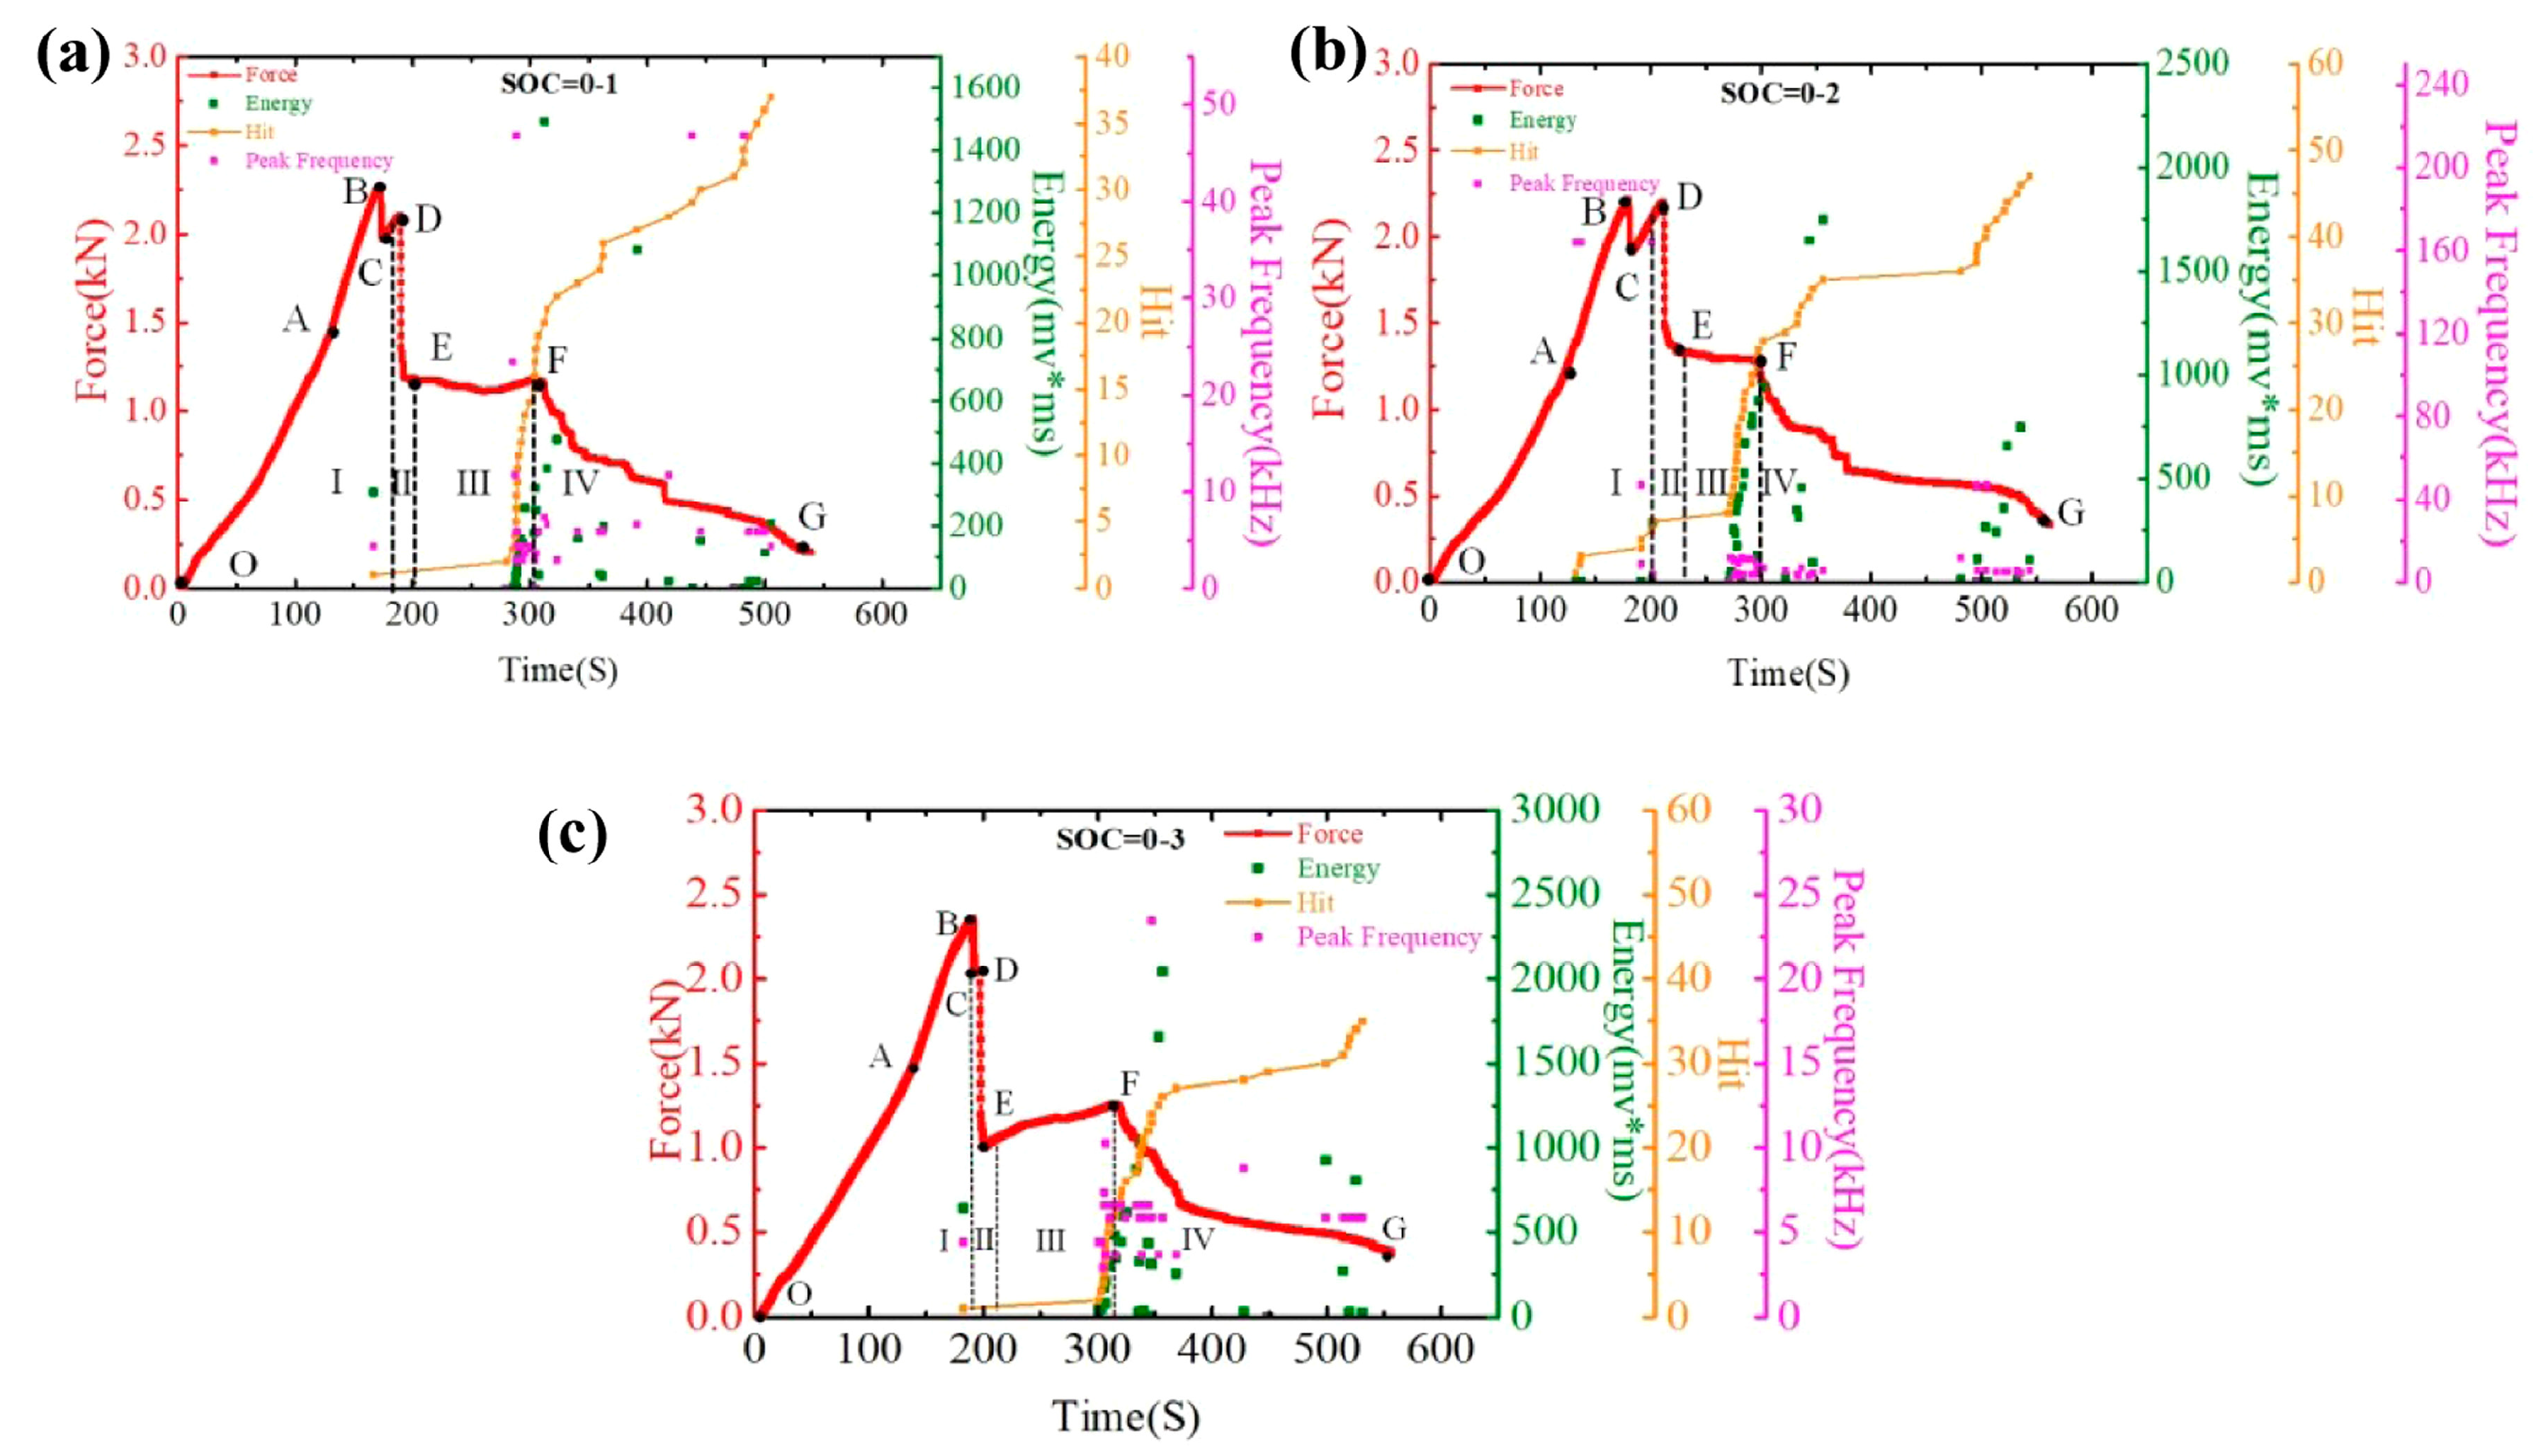
Hao et al. investigated the mechanical properties and failure mechanisms of cylindrical LIBs of the 18650 type subjected to three-point bending at room temperature [83]. The study utilized AE methods to monitor damage in real-time, focusing on key parameters such as hit count, signal energy, and peak frequency. The results revealed that the failure process could be divided into four distinct phases: during Phase I, the initial linear increase in load (OB section) was accompanied by the first AE signals with high energy, indicating delamination between electrode layers (BC section); in Phase II (DE section), a sharp drop in load occurred, dominated by interlayer slip with no significant AE signals. In Phase III (EF section), AE activity increased markedly, with a rapid rise in hit count and signal energy, reflecting extensive cracking and continued delamination. In Phase IV (FG section), AE activity gradually declined, indicating a slowdown of damage processes. These findings, as illustrated in Figure 14, provide valuable insights into the behavior of three groups of 18650-type batteries at a 0% state of charge (SOC). They identify the various stages of failure and offer a novel approach for monitoring and assessing the safety of these batteries under mechanical stress [83,84].
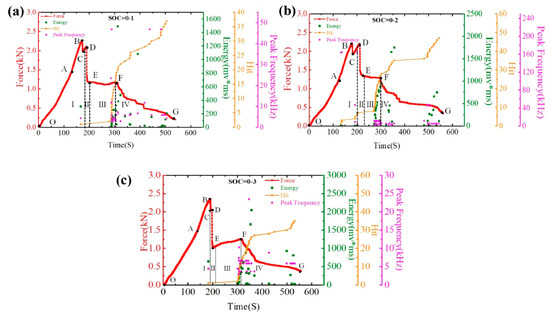
Figure 14.
Time–Force, Time–Hit, Time–Energy, and Time–Peak Frequency curves: (a) SOC = 0–1, (b) SOC = 0–2, and (c) SOC = 0–3. Reprinted from [83], with permission from Elsevier, Copyright (2021).
7. Complementary Techniques for Battery Analysis
Batteries are complex systems that require analysis from multiple perspectives, including their electrical properties and the materials used in their construction. Material analysis is essential for monitoring the condition, degradation, and changes in these materials during manufacturing and throughout the battery’s lifecycle. Techniques such as SEM enable detailed examination of surfaces at micro- and nanometer scales to detect defects, while X-ray diffraction (XRD) visualizes internal cell structures and tracks changes in material composition. EIS assesses electrical properties, identifying changes in internal resistance, and scanning acoustic microscopy (SAM) uses high-frequency sound waves to detect inhomogeneities within materials. In comparison, AE passively detects sound waves emitted by materials under stress, providing real-time monitoring of dynamic processes such as crack propagation. While techniques such as X-ray, SEM, EIS, and SAM focus on detailed, periodic inspections, AE excels at capturing real-time events, making it a valuable complement to comprehensive battery analysis [71,78,85].
7.1. Active Ultrasound NDT
Ultrasound techniques are used in battery diagnostics to monitor various physical and chemical changes during battery operation. The time-of-flight method tracks SoC and SoH by measuring shifts in ultrasonic signals caused by changes in the density and modulus of battery materials during cycling, offering a non-invasive and field-deployable tool for real-time monitoring. Ultrasound is also used to monitor the electrode drying process, analyzing changes in density and porosity during solvent evaporation, which provides valuable insights into the manufacturing process. Additionally, it is effective for detecting mechanical changes in the internal structure of battery materials, which can lead to reduced battery efficiency or potential safety issues [16,85,86]. One of the key differences between the active ultrasound NDT and AE is the state of the batteries being analyzed. With ultrasound, it is possible to test batteries without requiring any external or internal actions, making it easier to examine batteries that are not subjected to any force or interaction. In contrast, AE excels at detecting rapid mechanical events as they occur within the battery, allowing for the immediate identification of mechanisms such as cracking or delamination.
7.2. X-Ray Techniques
X-ray tomography is a crucial tool in LIB research, providing detailed 3D images of battery components without destruction. It reveals the internal structure, including the arrangement of electrodes and separators, helping optimize performance by identifying issues such as uneven material distribution. This technique also captures real-time changes during battery operation, such as electrode expansion and contraction, which help battery behavior and degradation to be understood. Additionally, X-ray tomography detects mechanical and structural failures, such as particle fractures and lithium dendrite growth, aiding in improving battery safety and longevity. The preparation of samples for X-ray techniques is a complex process that requires disassembly and, thus, destruction of the battery cell. This method can also be used for monitoring the state of batteries in real-time. Unfortunately, this method is quite expensive and time-consuming. The cost of this technique can pose challenges for its use in a laboratory setting, and it also presents limitations for industrial applications. Additionally, the lengthy duration of the analysis is another drawback that can restrict its practicality in industrial environments [87,88].
Rhodes et al. studied silicon particles as active materials in negative electrodes of coin cells using both AE and XRD. Their research indicates that these two techniques can be used complementarily, as the results from both methods yield highly similar findings. While acoustic signals captured changes in the silicon particles during the analysis, such as cracking and volume fluctuations, XRD simultaneously provided insights into the alterations in the internal structure [31].
7.3. Scanning Electron Microscopy
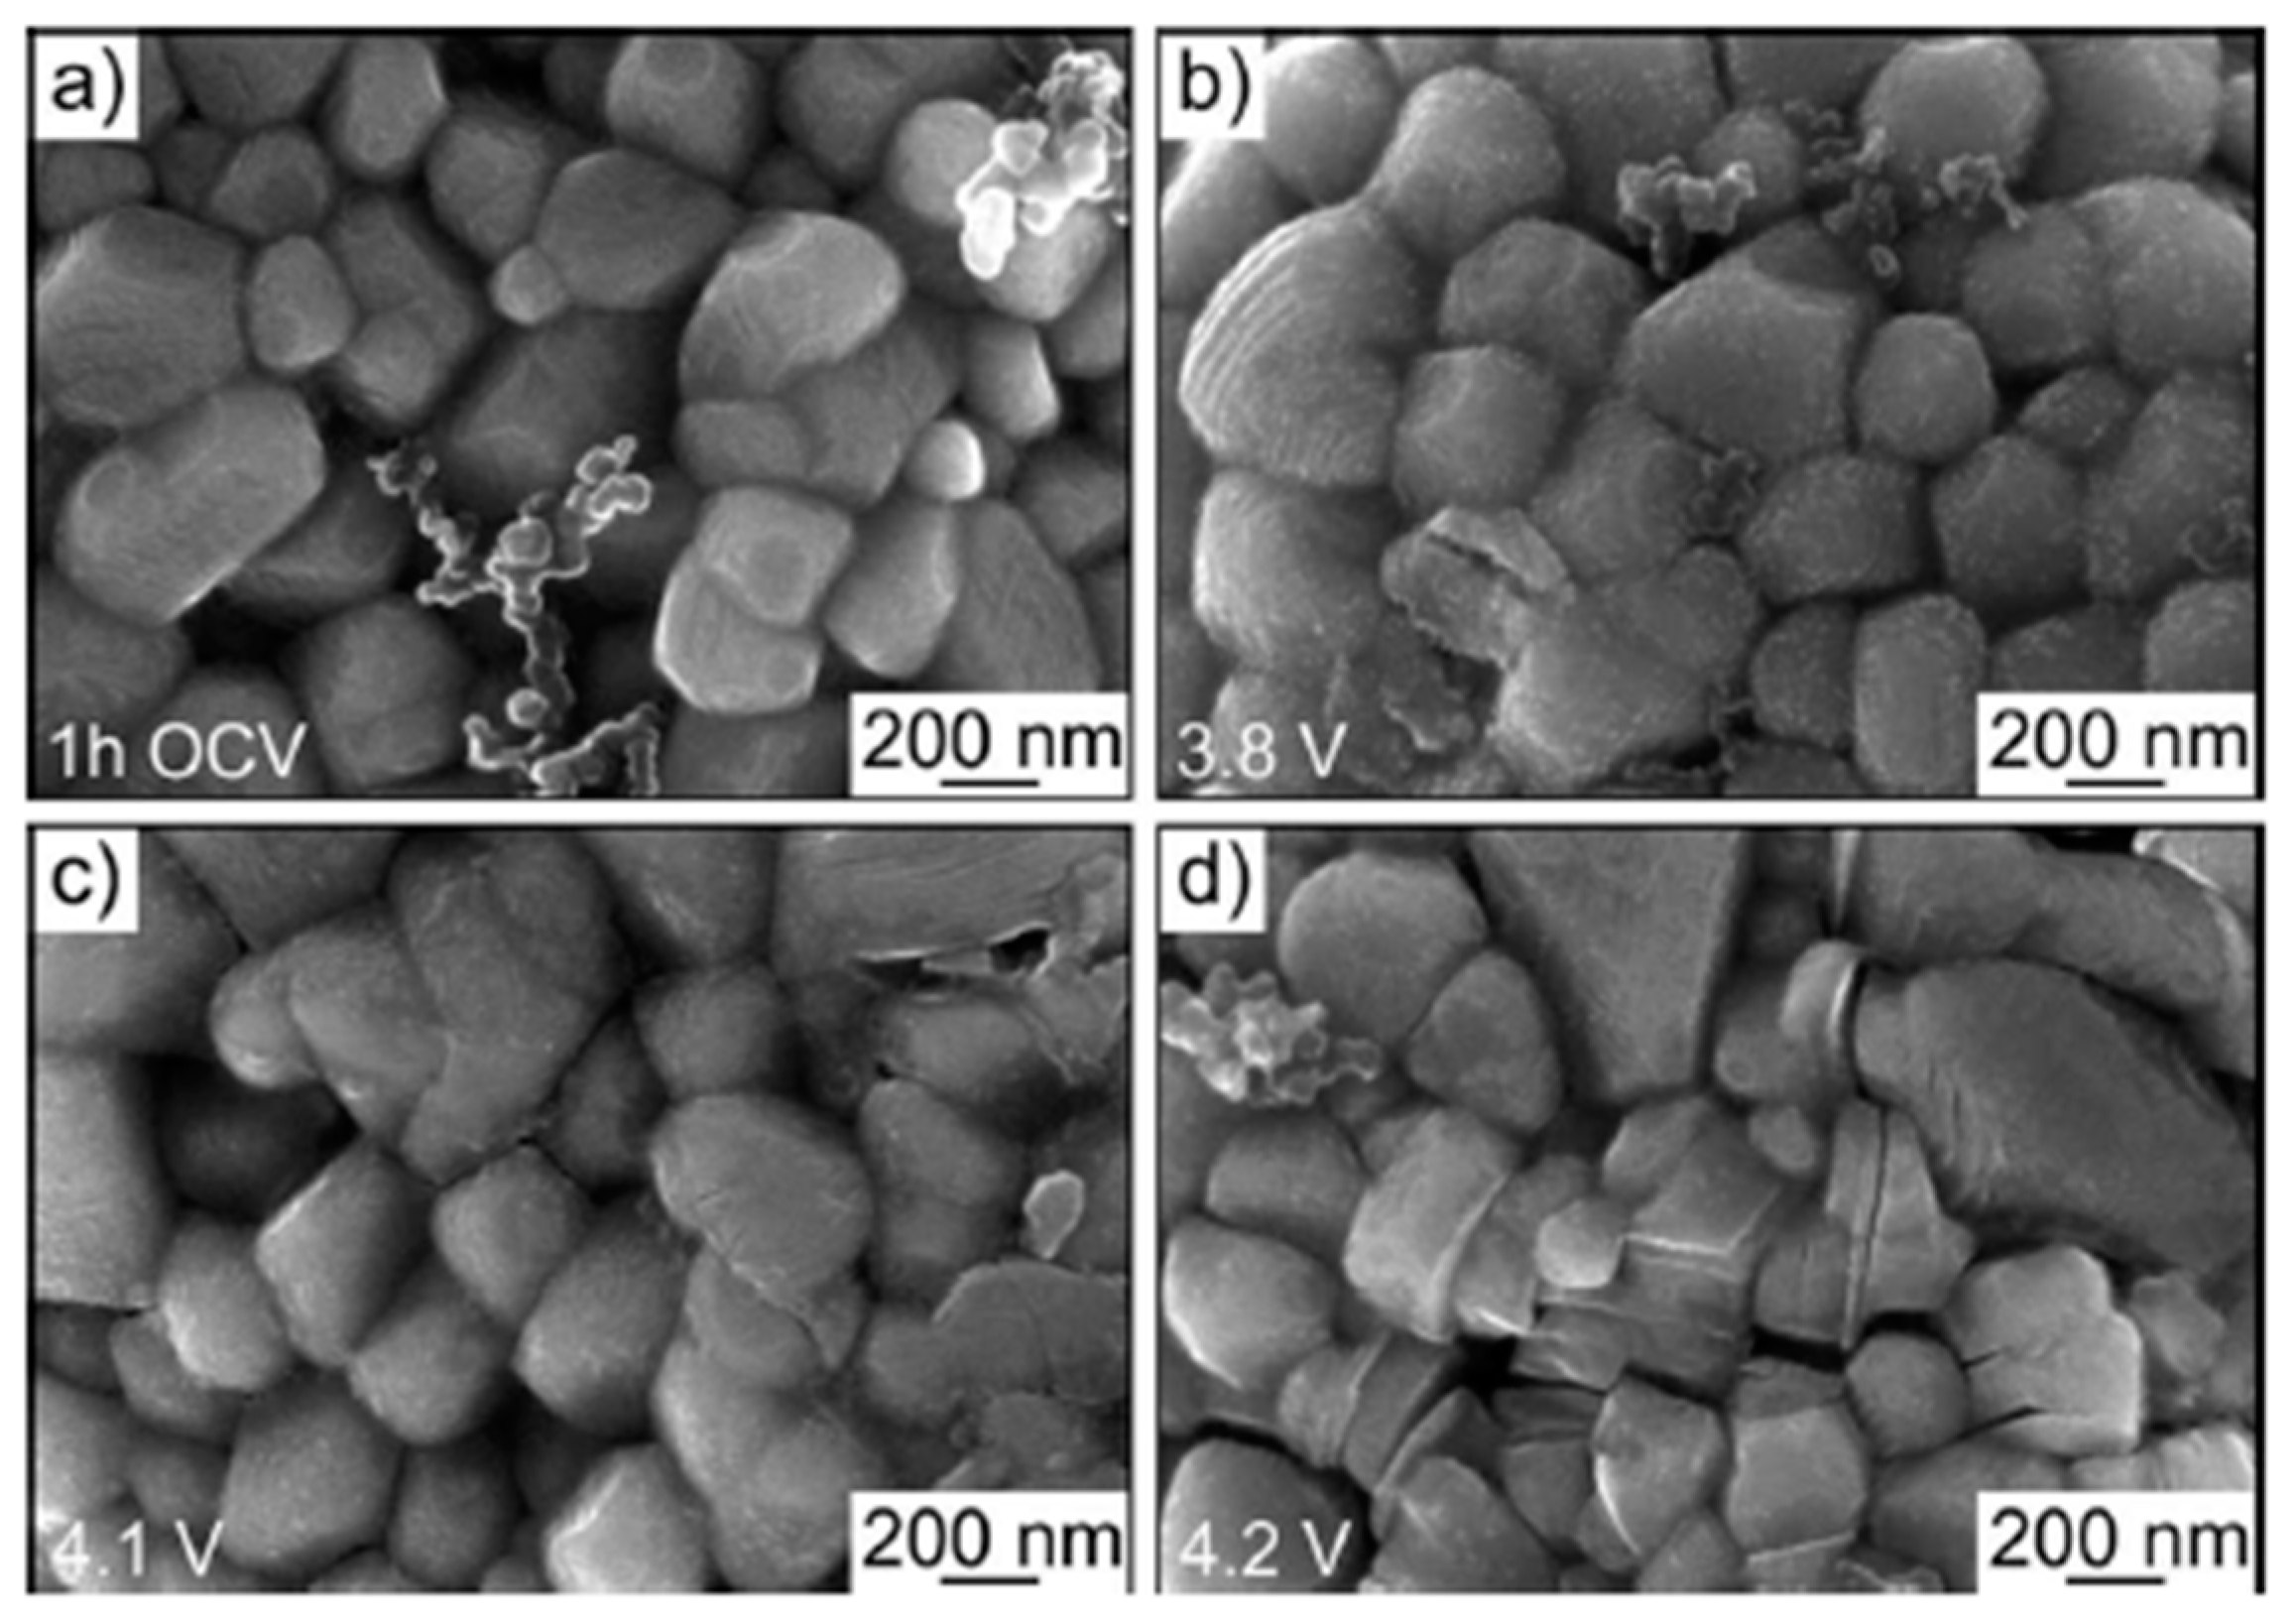
SEM is a widely used technique for investigating degradation processes in battery materials, as it provides high-resolution images that reveal microstructural changes and surface morphology. In the study by Schweidler et al., SEM was employed to comprehensively monitor the morphological evolution of lithium nickel oxide (LNO) electrodes under different voltage conditions, allowing for a detailed understanding of the degradation mechanisms affecting these materials. The results from SEM were complemented by AE analysis, which provided real-time insights into mechanical processes such as crack formation and propagation during delithiation. The combination of SEM and AE allowed the researchers to correlate acoustic signals with observed structural changes, offering a more complete picture of both surface and internal degradation processes in LNO electrodes under varying voltage conditions. This integration of AE and SEM proves valuable for identifying the onset and progression of degradation, enabling more accurate monitoring of battery performance [27]. The authors observed the formation of a rough SEI layer on the initially smooth surface of the LNO electrodes after the first charging cycle, with primary particles (200–400 nm) and secondary spherical particles (8–10 μm) undergoing significant surface changes. At voltages above 4.0 V, distinct cracking in both primary and secondary particles was noted, pointing to mechanical degradation linked to phase transformations in LNO. Additionally, SEM analysis demonstrated that the SEI layer became prominent at around 3.8 V, with further particle fracturing occurring at higher voltages, aligning with acoustic emission findings that indicated continued cracking during subsequent charging cycles. These morphological changes are clearly depicted in Figure 15, highlighting the utility of SEM in elucidating the complex degradation phenomena that compromise battery performance. The SEM method also requires careful sample preparation, which involves disassembling the entire cell. To accurately analyze degradation mechanisms, it is crucial to avoid contamination by air, as this could lead to additional degradation processes that might distort the analysis results. Therefore, SEM is also a destructive method, making it unsuitable if the intention is to reuse the analyzed sample [89].
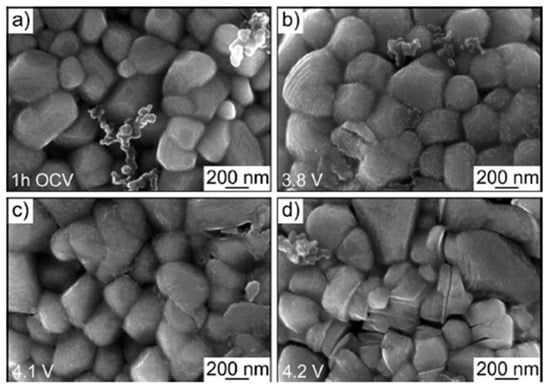
Figure 15.
Top-view SEM images of the LNO cathode recorded after 1 h OCV (a) and after charging to ~3.8 (b), ~4.1 (c), and ~4.2 V (d) versus Li+/Li in the initial cycle. Reprinted from [27] under the terms and conditions of the CC BY NC ND 4.0 license, Copyright (2020).
7.4. Electrochemical Impedance Spectroscopy
EIS is a technique used to analyze the material properties of batteries and their degradation mechanisms by measuring the battery’s impedance response to a high-frequency alternating current (AC) signal.
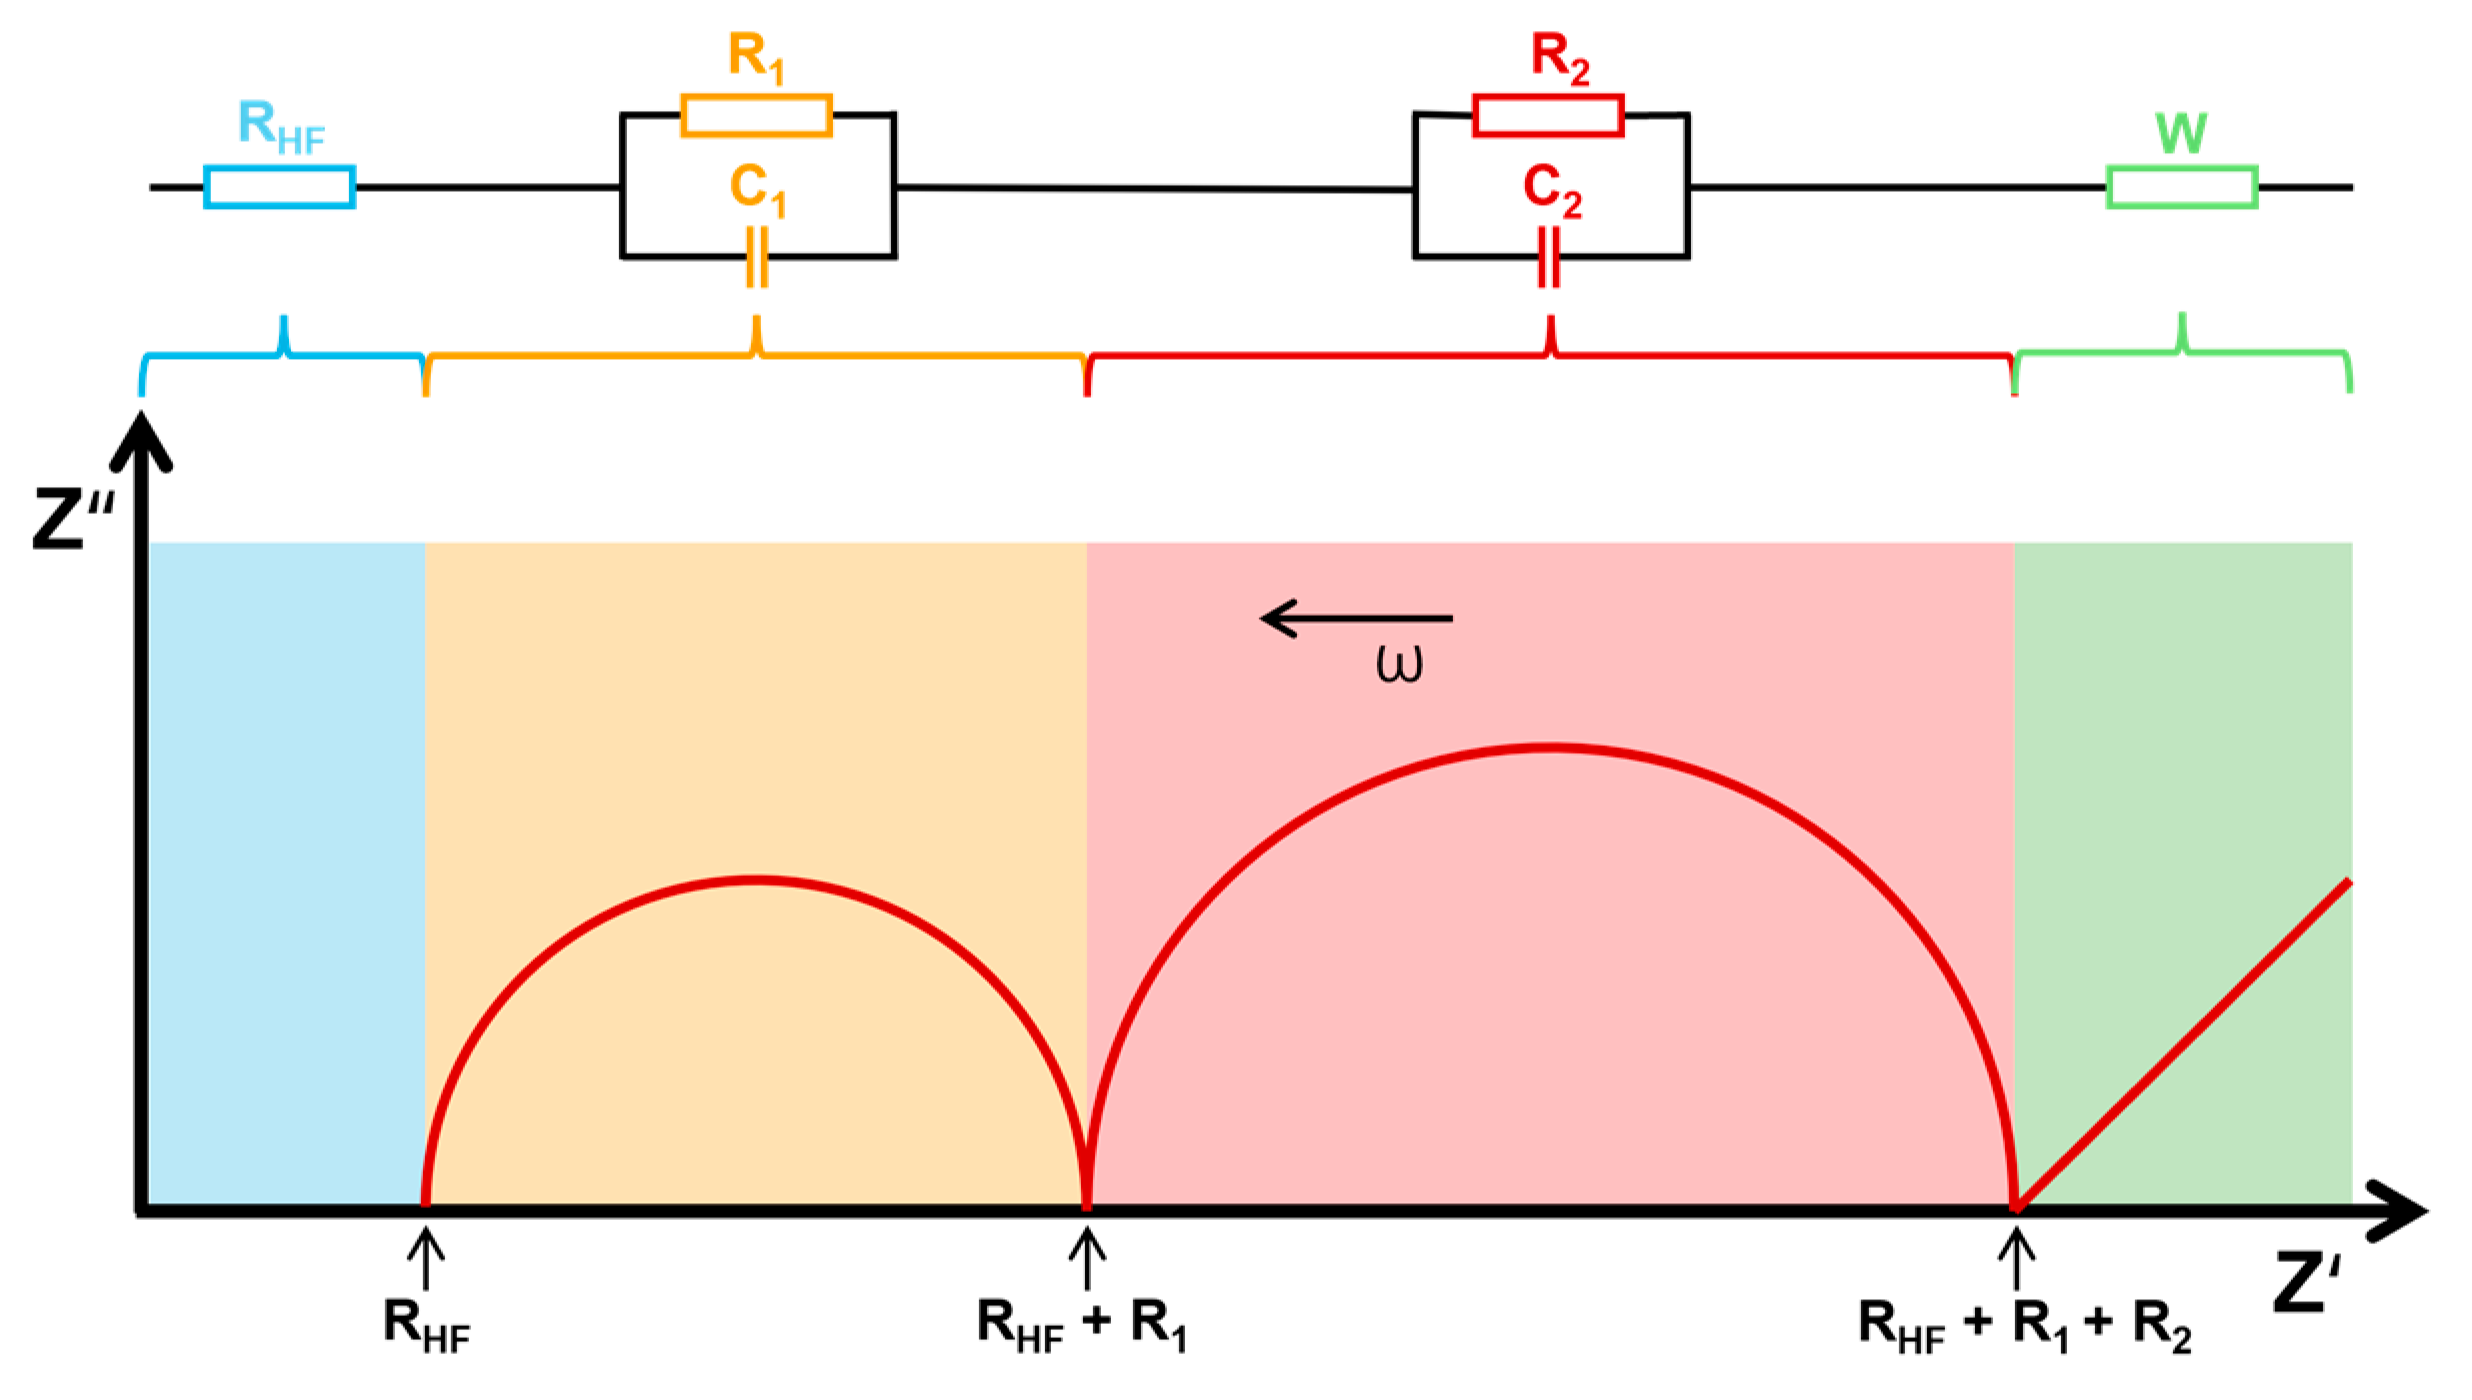
This impedance, represented as a complex number (Z*), is plotted on a Nyquist plot, where the real part (Z′) is shown on the x-axis and the imaginary part (Z″) on the y-axis. The plot typically features one or more semi-circular arcs, each associated with different electrochemical processes, such as charge transfer resistance and double-layer capacitance. This method does not require the disassembly of the entire sample and allows for monitoring the current state of batteries, which is why it is categorized as an NDT. However, despite its advantages, it also presents specific challenges. The interpretation of data from this method can be quite complex, requiring a deep understanding of electrochemical processes. Additionally, it is essential to carefully control experimental conditions during measurements to eliminate the influence of surrounding parameters, such as temperature, humidity, and electromagnetic interference. These factors can significantly affect the results and complicate accurate analysis. Another important point is that in the resulting spectrum of a full cell, the signals from different processes can overlap, making it difficult to clearly distinguish between processes occurring at the electrodes. To resolve this, it is often necessary to resort to destructive methods and create half-cells to better isolate and study these processes. Therefore, paying attention to details and ensuring a stable environment to achieve reliable outcomes is important. An example of such a plot is shown in Figure 16 [90,91].
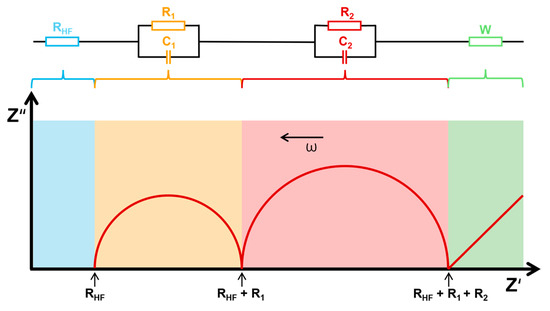
Figure 16.
Nyquist plot of battery impedance response for SoC and SoH assessment [22,91].
To model these processes accurately, equivalent circuit models are used, including resistors, capacitors, and constant phase elements (CPEs). A CPE accounts for non-ideal capacitor behavior, with its impedance given by
where Y0 is a constant, ω is the angular frequency (ω = 2πf), and n is an exponent between 0 and 1 that affects the shape of the semi-circle. When n = 1, the CPE behaves as a perfect capacitor, while n = 0 represents a resistor. The plot may also show an inclined linear trend at low frequencies, often modeled by a Warburg element (where n = 0.5) to account for diffusion-controlled processes [91].
In the study by Schweidler et al., the researchers tested the material of the LNO electrode during electrochemical cycling using a combination of AE and EIS to investigate its degradation processes and assess whether the techniques were complementary or supplementary. AE, a nondestructive method for detecting mechanical events, revealed that particle cracking occurred during the cycling process, particularly as a result of mechanical stress from lithium intercalation and phase transitions in the positive electrode material. These cracks, especially pronounced during the first charge cycle, were a key indicator of mechanical degradation. On the other hand, EIS provided insights into the chemical changes taking place, specifically the growth of the SEI layer on the surface of the positive electrode. While AE captured the mechanical breakdown of particles, EIS tracked the progressive formation and growth of the SEI, showing how the two techniques complement each other by offering a broader understanding of both mechanical and chemical degradation in the LNO electrode [27].
7.5. Scanning Acoustic Microscopy
A SAM is a sophisticated imaging device that combines an ultrasonic transducer, a mechanical scanner, and an image processor to achieve high-resolution internal inspection of samples. The ultrasonic transducer, typically made from piezoelectric materials such as lithium niobate or zinc oxide, generates and focuses ultrasonic waves using an integrated lens and a matching layer, ensuring efficient transmission through a sapphire cylinder. It operates with a mechanical scanner that systematically moves across the sample’s surface, often using water as a coupling medium to enhance wave transmission. SAM measures the time-of-flight (ToF) of ultrasonic pulses to determine the depth of internal features, capturing reflected waves in real-time to create detailed images of the structure. Its primary advantage lies in its ability to non-destructively inspect subsurfaces layer by layer, making it invaluable for materials science and quality control. Preparing samples for SAM is complex, requiring the careful disassembly of components in a protective argon atmosphere to avoid contamination. In comparison, AE detects elastic waves released during material deformation or fracture, providing real-time monitoring of structural damage such as cracks. While AE excels at tracking the initiation and progression of defects dynamically, SAM offers precise imaging of internal structures after damage has occurred. Together, these techniques complement each other by allowing AE to monitor ongoing damage while SAM enables detailed visualization of the material’s internal features [92].
By analyzing acoustic wave reflections, Bauermann et al. show that SAM detects defects in battery cells, such as leaks and faulty electrodes. SAM offers fast, non-destructive quality control and depth information, with potential for further development in battery analysis [93]. Morokov et al. combined AE and SAM to analyze damage in carbon fiber-reinforced polymer materials during three-point bending tests. AE monitored the initiation and progression of damage in real-time by detecting elastic waves generated by cracks, fiber breakage, or delamination, providing dynamic information on these processes. After an increase in AE signals indicating damage, SAM was employed to visualize the internal structure of the material, offering detailed images of microcracks, delaminations, and fiber fractures at different depths. Both methods were used complementarily: AE tracked the onset of damage, while SAM provided precise visualization of the extent and type of damage [94].
Table 3 summarizes various methods used for battery characterization, detailing their application, complexity, cost, and accuracy. Each method is assessed based on its specific use case, the level of difficulty in implementation, the financial investment required, and the precision of the results. The complexity is influenced by factors such as equipment and expertise, while cost covers both setup and operational expenses. Accuracy indicates how reliably each method can characterize battery performance or state.

Table 3.
Summary of techniques, including acoustic emission (AE), active ultrasound NDT, X-ray, scanning electron microscopy (SEM), electrochemical impedance spectroscopy (EIS), and scanning acoustic microscopy (SAM), used for battery analysis from both material and electrical perspectives [5,85,93,95].
SEM is ideal for examining surface structures and defects in detail but involves high costs and requires complex operation. SAM is effective for analyzing internal structures and porosity, though it demands more complex sample preparation and incurs moderate to high costs. X-ray techniques provide high accuracy in assessing internal structures and material compositions but are also associated with medium to high costs and require specialized equipment. The active ultrasound NDT has a lower resolution compared to X-rays or SEM but it offers good, fast, and relatively affordable accuracy for detecting internal mechanical issues. In terms of complexity, it is comparable to AE, making it easier to use than more advanced techniques such as SEM or SAM. In contrast, AE is a more cost-effective and straightforward option for quickly detecting cracks and defects, though it may offer lower accuracy compared to the other methods.
8. Limitations of AE in Battery Testing
Despite the numerous advantages of the AE method for battery testing, it is not used as frequently as techniques such as EIS, which is more commonly employed for monitoring battery health. Currently, AE is gaining interest in the field of battery analysis. However, certain limitations encountered during testing, such as signal complexity and interpretation challenges, have confined its use primarily to laboratory environments. Some of the most significant limitations of the AE method include:
- Difficulty in signal detection,
- Complex data interpretation,
- Inability to capture electrochemical processes accurately.
8.1. Difficulty in Signal Detection
The degradation processes occurring within the battery may not generate signals strong enough for detection by AE. Additionally, due to the complex structure of the battery cell, the results can be affected by external noise or signal attenuation. This can lead to inaccurate results that may not fully reflect the actual condition and degradation mechanisms taking place in the battery. One of the main challenges in applying AE technology on a large scale in the battery industry is the need for specialized testing conditions. Requirements such as acoustic chambers or anti-vibration tables, which can be easily implemented in a controlled laboratory setting, are much harder to integrate into an industrial production environment. These conditions are essential to minimize external noise and interference during AE analysis, but their incorporation into production lines poses significant logistical and cost-related challenges.
To address the issue of weak signal detection, recent advancements in signal amplification technologies can offer valuable solutions. For instance, high-sensitivity microphones and piezoelectric sensors, combined with advanced filtering techniques, can help capture and enhance weak acoustic signals generated by degradation processes. Additionally, the use of real-time signal processing, along with machine learning algorithms for noise reduction and pattern recognition, could improve the accuracy of AE detection, even in complex battery systems. These approaches, when integrated with optimized testing environments, may help mitigate some of the limitations associated with signal detection.
8.2. Complex Data Interpretation
Monitoring specific degradation phenomena from the AE spectrum is quite complex. The degradation processes influence each other, and the acoustic impedance of individual materials plays a crucial role in the overall process. When observing the battery, it can be very challenging to identify the mechanisms occurring during cycling or thermal stress accurately. It is also one of the challenging factors in industrial usage because one of the benefits of this method is the possibility of using it on complex units such as battery modules.
8.3. Inability to Capture Electrochemical Processes
The AE method is primarily used for analyzing mechanical failures in homogeneous materials, which makes its application in monitoring battery mechanisms quite challenging. Throughout a battery’s life cycle, the processes involved are mechanical and primarily electrochemical, critical to its operation and degradation. While mechanical changes, such as cracking or deformation, can be detected relatively accurately using AE, the electrochemical processes often accompanying or triggering these changes are not described in as much detail by AE. As a result, it is not easy to precisely correlate specific phenomena with the data obtained from this method. The interaction between mechanical and electrochemical processes generates complex acoustic signals, making them challenging to interpret. This complicates the identification of specific degradation mechanisms, such as dendrite growth, electrode structure changes, or separator failures. Consequently, AE does not provide a comprehensive picture of all the processes occurring within the battery and requires supplementation with other analytical methods to obtain a more accurate and complete understanding of the battery’s condition.
9. Discussion and Conclusions
As previously mentioned, AE is a traditional method used for analyzing various materials, especially in construction and material property monitoring. With the recent growth of the battery industry, AE’s potential for battery analysis has emerged. This review highlights the growing interest in this technique, with several studies focused on its application for monitoring battery degradation phenomena throughout their lifecycle. However, most research is still confined to laboratory settings due to the limitations discussed in Chapter 8, raising questions about its feasibility in industrial environments.
AE is particularly promising for monitoring second-life batteries and assessing their future use, but this remains an underexplored area requiring further research. A key area for future development is scaling AE from individual cells to entire battery modules, necessitating a deeper understanding of how different materials within modules interact and contribute to the acoustic response. Investigating the acoustic properties of components such as electrodes, electrolytes, and separators will help create models that correlate AE signals with specific degradation mechanisms. This could enable real-time monitoring of modules and improve diagnostic capabilities by assessing the health of multiple cells simultaneously. Currently, the use of AE in industry is limited due to insufficient data on its application in more complex systems such as modules, rather than individual cells. Established methods exist for testing individual cells or materials, reducing the immediate benefit of using AE at this level. However, AE’s true potential lies in its future application to larger systems, such as modules or multiple cells in series. Successfully implementing AE at this scale could significantly streamline battery status assessments.
For AE to be effectively utilized in battery systems, it is essential to establish conditions that induce mechanical stress, as the relaxation of this stress generates elastic waves that propagate through the material to the detector. Achieving this requires precise control over parameters such as current or cycling regimes, temperature, and applied pressure (both internal and external), all of which significantly impact the nature and characteristics of the detected signals. However, these variables also introduce considerable complexity to the interpretation and modeling of AE phenomena, complicating the translation of laboratory findings into practical industrial applications.
Despite these challenges, leveraging AE has the potential to revolutionize battery diagnostics. It can facilitate early detection of potential issues and optimize maintenance, thereby enhancing the reliability and longevity of battery systems. Integrating AE with other analytical techniques could further strengthen its utility, creating a robust framework for continuous battery condition monitoring and predictive maintenance. This approach is particularly critical in applications where battery reliability is paramount, such as in electric vehicles or energy storage systems. Future research should prioritize expanding the application of AE across both controlled laboratory environments and real-world scenarios, aiming to develop efficient and scalable methods for battery monitoring and evaluation.
Author Contributions
Conceptualization, E.S. and A.P.; methodology, E.S.; formal analysis, E.S. and A.P.; investigation, E.S.; resources, E.S.; data curation, E.S.; writing—original draft preparation, E.S., A.P., Z.P. and N.K.; writing—review and editing, E.S., A.P., Z.P., N.K., V.K. and K.D.; visualization, E.S., Z.P. and N.K.; supervision, A.P. and V.K.; project administration, V.K. and K.D. All authors have read and agreed to the published version of the manuscript.
Funding
This work was supported by the Grant Agency of the CTU in Prague, grant No. SGS24/136/OHK3/3T/13.
Data Availability Statement
The work data are presented within the publication in figures, tables, and text. Thus, no dataset sharing is stated.
Conflicts of Interest
The authors declare no conflicts of interest.
References
- IEA. Global EV Outlook 2024; IEA: Paris, France, 2024.
- Roy, H.; Roy, B.N.; Hasanuzzaman, M.; Islam, M.S.; Abdel-Khalik, A.S.; Hamad, M.S.; Ahmed, S. Global Advancements and Current Challenges of Electric Vehicle Batteries and Their Prospects: A Comprehensive Review. Sustainability 2022, 14, 16684. [Google Scholar] [CrossRef]
- Rhodes, K.; Dudney, N.; Lara-Curzio, E.; Daniel, C. Understanding the Degradation of Silicon Electrodes for Lithium-Ion Batteries Using Acoustic Emission. J. Electrochem. Soc. 2010, 157, A1354. [Google Scholar] [CrossRef]
- Espinoza Ramos, I.; Coric, A.; Su, B.; Zhao, Q.; Eriksson, L.; Krysander, M.; Ahlberg Tidblad, A.; Zhang, L. Online Acoustic Emission Sensing of Rechargeable Bat-Teries: Technology, Status, and Prospects. J. Mater. Chem. A 2024. [Google Scholar] [CrossRef]
- Majasan, J.O.; Robinson, J.B.; Owen, R.E.; Maier, M.; Radhakrishnan, A.N.P.; Pham, M.; Tranter, T.G.; Zhang, Y.; Shearing, P.R.; Brett, D.J.L. Recent Advances in Acoustic Diagnostics for Electrochemical Power Systems. J. Phys. Energy 2021, 3, 032011. [Google Scholar] [CrossRef]
- Schweidler, S.; Dreyer, S.L.; Breitung, B.; Brezesinski, T. Operando Acoustic Emission Monitoring of Degradation Processes in Lithium-Ion Batteries with a High-Entropy Oxide Anode. Sci. Rep. 2021, 11, 23381. [Google Scholar] [CrossRef]
- Patrizi, G.; Canzanella, F.; Ciani, L.; Catelani, M. Towards a State of Health Definition of Lithium Batteries through Electrochemical Impedance Spectroscopy. Electronics 2024, 13, 1438. [Google Scholar] [CrossRef]
- Zhang, K.; Yin, J.; He, Y. Acoustic Emission Detection and Analysis Method for Health Status of Lithium Ion Batteries. Sensors 2021, 21, 712. [Google Scholar] [CrossRef]
- Grosse, C.U.; Ohtsu, M. Acoustic Emission Testing: Basics for Research-Applications in Civil Engineering; Springer: Berlin/Heidelberg, Germany, 2008; ISBN 9783540698951. [Google Scholar]
- Wang, Z.; Zhao, X.; Fu, L.; Zhen, D.; Gu, F.; Ball, A.D. A Review on Rapid State of Health Estimation of Lithium-Ion Batteries in Electric Vehicles. Sustain. Energy Technol. Assess. 2023, 60, 103457. [Google Scholar] [CrossRef]
- Wróbel, G.; Pawlak, S. A Comparison Study of the Pulse-Echo and through-Transmission Ultrasonics in Glass/Epoxy Composites. J. Achiev. Mater. Manuf. Eng. 2007, 22, 51–54. [Google Scholar]
- Chacón, X.C.A.; Laureti, S.; Ricci, M.; Cappuccino, G. A Review of Non-Destructive Techniques for Lithium-Ion Battery Performance Analysis. World Electr. Veh. J. 2023, 14, 305. [Google Scholar] [CrossRef]
- Zhang, J.; Fan, T.; Ma, H.; Li, Z. Monitoring Setting and Hardening of Concrete by Active Acoustic Method: Effects of Water-to-Cement Ratio and Pozzolanic Materials. Constr. Build Mater. 2015, 88, 118–125. [Google Scholar] [CrossRef]
- Stein, P.J.; Edson, P. Active Acoustic Monitoring of Aquatic Life. Adv. Exp. Med. Biol. 2016, 875, 1113–1121. [Google Scholar] [PubMed]
- Wu, Y.; Wang, Y.; Yung, W.K.C.; Pecht, M. Ultrasonic Health Monitoring of Lithium-Ion Batteries. Electronics 2019, 8, 751. [Google Scholar] [CrossRef]
- Hsieh, A.G.; Bhadra, S.; Hertzberg, B.J.; Gjeltema, P.J.; Goy, A.; Fleischer, J.W.; Steingart, D.A. Electrochemical-Acoustic Time of Flight: In Operando Correlation of Physical Dynamics with Battery Charge and Health. Energy Environ. Sci. 2015, 8, 1569–1577. [Google Scholar] [CrossRef]
- Davies, G.; Knehr, K.W.; Van Tassell, B.; Hodson, T.; Biswas, S.; Hsieh, A.G.; Steingart, D.A. State of Charge and State of Health Estimation Using Electrochemical Acoustic Time of Flight Analysis. J. Electrochem. Soc. 2017, 164, A2746–A2755. [Google Scholar] [CrossRef]
- Etiemble, A.; Idrissi, H.; Meille, S.; Roué, L. In Situ Investigation of the Volume Change and Pulverization of Hydride Materials for Ni-MH Batteries by Concomitant Generated Force and Acoustic Emission Measurements. J. Power Sources 2012, 205, 500–505. [Google Scholar] [CrossRef]
- Beganovic, N.; Söffker, D. Estimation of Remaining Useful Lifetime of Lithium-Ion Battery Based on Acoustic Emission Measurements. J. Energy Resour. Technol. Trans. ASME 2019, 141, 041901. [Google Scholar] [CrossRef]
- Lee, S.M.; Kim, J.Y.; Lee, J.; Byeon, J.W. Evaluation of Cracking Damage in Electrode Materials of a LMO/Al-Lix Lithium-Ion Battery through Analysis of Acoustic Emission Signals. J. Mater. Res. Technol. 2023, 24, 5235–5249. [Google Scholar] [CrossRef]
- Sato, K.; Sakamoto, T.; Kaimai, A.; Yashiro, K.; Amezawa, K.; Hashida, T.; Mizusaki, J.; Kawada, T. In Situ Observation of the Deformation and Mechanical Damage of SOFC Cell/Stack. ECS Trans. 2011, 35, 225–229. [Google Scholar] [CrossRef]
- Amami, S.; Lemaitre, C.; Laksimi, A.; Benmedakhene, S. Characterization by Acoustic Emission and Electrochemical Impedance Spectroscopy of the Cathodic Disbonding of Zn Coating. Corros. Sci. 2010, 52, 1705–1710. [Google Scholar] [CrossRef]
- Zhou, N.; Wang, K.; Shi, X.; Chen, Z. Detection and Analysis of Abnormal High-Current Discharge of Cylindrical Lithium-Ion Battery Based on Acoustic Characteristics Research. World Electr. Veh. J. 2024, 15, 229. [Google Scholar] [CrossRef]
- Ospitia, N.; Korda, E.; Kalteremidou, K.A.; Lefever, G.; Tsangouri, E.; Aggelis, D.G. Recent Developments in Acoustic Emission for Better Performance of Structural Materials. Dev. Built Environ. 2023, 13, 100106. [Google Scholar] [CrossRef]
- Trojanová, Z.; Száraz, Z.; Chmelík, F.; Lukáč, P. Acoustic Emission from Deformed Magnesium Alloy Based Composites. Mater. Sci. Eng. A 2011, 528, 2479–2483. [Google Scholar] [CrossRef]
- Wu, L.; Sun, B.; Yang, Z. Proceedings of the 2019 Symposium on Piezoelectricity, Acoustic Waves and Device Applications (13th): SPAWDA19: Jan. 11–14, 2019, Harbin Engineering University; IEEE: Piscataway, NJ, USA, 2019; ISBN 9781728106137. [Google Scholar]
- Schweidler, S.; Bianchini, M.; Hartmann, P.; Brezesinski, T.; Janek, J. The Sound of Batteries: An Operando Acoustic Emission Study of the LiNiO2 Cathode in Li–Ion Cells. Batter. Supercaps 2020, 3, 1021–1027. [Google Scholar] [CrossRef]
- Schweidler, S.; Dreyer, S.L.; Breitung, B.; Brezesinski, T. Acoustic Emission Monitoring of High-Entropy Oxyfluoride Rock-Salt Cathodes during Battery Operation. Coatings 2022, 12, 402. [Google Scholar] [CrossRef]
- He, Y.; Li, M.; Meng, Z.; Chen, S.; Huang, S.; Hu, Y.; Zou, X. An Overview of Acoustic Emission Inspection and Monitoring Technology in the Key Components of Renewable Energy Systems. Mech. Syst. Signal Process. 2021, 148, 107146. [Google Scholar] [CrossRef]
- Kircheva, N.; Genies, S.; Brun-Buisson, D.; Thivel, P.-X. Study of Solid Electrolyte Interface Formation and Lithium Intercalation in Li-Ion Batteries by Acoustic Emission. J. Electrochem. Soc. 2011, 159, A18–A25. [Google Scholar] [CrossRef]
- Rhodes, K.; Kirkham, M.; Meisner, R.; Parish, C.M.; Dudney, N.; Daniel, C. Novel Cell Design for Combined in Situ Acoustic Emission and X-Ray Diffraction Study during Electrochemical Cycling of Batteries. Rev. Sci. Instrum. 2011, 82, 075107. [Google Scholar] [CrossRef] [PubMed]
- Villevieille, C.; Boinet, M.; Monconduit, L. Direct Evidence of Morphological Changes in Conversion Type Electrodes in Li-Ion Battery by Acoustic Emission. Electrochem. Commun. 2010, 12, 1336–1339. [Google Scholar] [CrossRef]
- Komagata, S.; Kuwata, N.; Baskaran, R.; Kawamura, J.; Sato, K.; Mizusaki, J. Detection of Degradation of Lithium-Ion Batteries with Acoustic Emission Technique. ECS Trans. 2010, 25, 163–167. [Google Scholar] [CrossRef]
- Fukushima, T.; Kato, S.; Kuwata, N.; Kawamura, J. In-Situ Acoustic Emission Study of Sn Anode in Li Ion Battery. ECS Trans. 2014, 62, 215–222. [Google Scholar] [CrossRef]
- Zhao, L.; Kang, L.; Yao, S. Research and Application of Acoustic Emission Signal Processing Technology. IEEE Access 2019, 7, 984–993. [Google Scholar] [CrossRef]
- Ghadarah, N.; Ayre, D. A Review on Acoustic Emission Testing for Structural Health Monitoring of Polymer-Based Composites. Sensors 2023, 23, 6945. [Google Scholar] [CrossRef] [PubMed]
- Lin, D.K.; Xiao, X.W.; Yang, C.C.; Ho, S.Y.; Chou, L.C.; Chiang, C.H.; Chen, J.S.; Liu, C.H. An Acoustic Impedance Design Method for Tubular Structures with Broadband Sound Insulations and Efficient Air Ventilation. Appl. Acoust. 2024, 220, 109983. [Google Scholar] [CrossRef]
- Gross, C.A.; Roppel, T.A. Fundamentals of Electrical Engineering; CRC Press: Boca Raton, FL, USA, 2012; ISBN 9781439898079. [Google Scholar]
- Brandão, E.; Fonseca, W.D.; Mareze, P.H. An Algorithmic Approach to Electroacoustical Analogies. J. Acoust. Soc. Am. 2022, 152, 667–678. [Google Scholar] [CrossRef]
- Tavakolpour-Saleh, A.; Zare, S. Justifying Performance of Thermo-Acoustic Stirling Engines Based on a Novel Lumped Mechanical Model. Energy 2021, 227, 120466. [Google Scholar] [CrossRef]
- Liu, X.; Wu, H.; Dong, L. Methodology and Applications of Acousto-Electric Analogy in Photoacoustic Cell Design for Trace Gas Analysis. Photoacoustics 2023, 30, 100475. [Google Scholar] [CrossRef]
- Bertuccio, G. On the Physical Origin of the Electro-Mechano-Acoustical Analogy. J. Acoust. Soc. Am. 2022, 151, 2066–2076. [Google Scholar] [CrossRef] [PubMed]
- Zoontjens, L.; Howard, C.; Zander, A.; Cazzolato, B. Modelling and Optimisation of Acoustic Inertance Segments for Thermoacoustic Devices. In Proceedings of the ACOUSTICS, Christchurch, New Zealand, 20–22 November 2006. [Google Scholar]
- Nagpure, S.C.; Bhushan, B.; Babu, S.S. Multi-Scale Characterization Studies of Aged Li-Ion Large Format Cells for Improved Performance: An Overview. J. Electrochem. Soc. 2013, 160, A2111–A2154. [Google Scholar] [CrossRef]
- Kabir, M.M.; Demirocak, D.E. Degradation Mechanisms in Li-Ion Batteries: A State-of-the-Art Review. Int. J. Energy Res. 2017, 41, 1963–1986. [Google Scholar] [CrossRef]
- Arora, P.; Zhang, Z. Battery Separators. Chem. Rev. 2004, 104, 4419–4462. [Google Scholar] [CrossRef]
- Park, J.; Yoo, D.; Moon, J.; Yoon, J.; Park, J.; Lee, S.; Lee, D.; Kim, C. Reliability-Based Robust Design Optimization of Lithium-Ion Battery Cells for Maximizing the Energy Density by Increasing Reliability and Robustness. Energies 2021, 14, 6236. [Google Scholar] [CrossRef]
- Wang, H.; Lu, S.-H.; Wang, X.; Xia, S.; Chew, H. A Review of the Multiscale Mechanics of Silicon Electrodes in High-Capacity Lithium-Ion Batteries. J. Phys. D Appl. Phys. 2021, 55, 063001. [Google Scholar] [CrossRef]
- Wang, X.; Zhang, Y.; Deng, Y.; Yuan, Y.; Zhang, F.; Lv, S.; Zhu, Y.; Ni, H. Effects of Different Charging Currents and Temperatures on the Voltage Plateau Behavior of Li-Ion Batteries. Batteries 2023, 9, 42. [Google Scholar] [CrossRef]
- Demirocak, D.E.; Bhushan, B. Probing the Aging Effects on Nanomechanical Properties of a LiFePO4 Cathode in a Large Format Prismatic Cell. J. Power Sources 2015, 280, 256–262. [Google Scholar] [CrossRef]
- Birkl, C.R.; Roberts, M.R.; McTurk, E.; Bruce, P.G.; Howey, D.A. Degradation Diagnostics for Lithium Ion Cells. J. Power Sources 2017, 341, 373–386. [Google Scholar] [CrossRef]
- Chen, C.; Lai, J.; Guan, M. A Collaborative Design and Modularized Assembly for Prefabricated Cabin Type Energy Storage System With Effective Safety Management. Front. Energy Res. 2022, 10. [Google Scholar] [CrossRef]
- Popp, H.; Koller, M.; Jahn, M.; Bergmann, A. Mechanical Methods for State Determination of Lithium-Ion Secondary Batteries: A Review. J. Energy Storage 2020, 32, 101859. [Google Scholar] [CrossRef]
- Choe, C.Y.; Jung, W.S.; Byeon, J.W. Damage Evaluation in Lithium Cobalt Oxide/Carbon Electrodes of Secondary Battery by Acoustic Emission Monitoring. Mater. Trans. 2015, 56, 269–273. [Google Scholar] [CrossRef]
- Chen, C.F.; Barai, P.; Mukherjee, P.P. An Overview of Degradation Phenomena Modeling in Lithium-Ion Battery Electrodes. Curr. Opin. Chem. Eng. 2016, 13, 82–90. [Google Scholar] [CrossRef]
- Verma, P.; Maire, P.; Novák, P. A Review of the Features and Analyses of the Solid Electrolyte Interphase in Li-Ion Batteries. Electrochim. Acta 2010, 55, 6332–6341. [Google Scholar] [CrossRef]
- Chen, L.; Venkatram, S.; Kim, C.; Batra, R.; Chandrasekaran, A.; Ramprasad, R. Electrochemical Stability Window of Polymeric Electrolytes. Chem. Mater. 2019, 31, 4598–4604. [Google Scholar] [CrossRef]
- Bryngelsson, H.; Stjerndahl, M.; Gustafsson, T.; Edström, K. How Dynamic Is the SEI? J. Power Sources 2007, 174, 970–975. [Google Scholar] [CrossRef]
- Aurbach, D. Review of Selected Electrode-Solution Interactions Which Determine the Performance of Li and Li Ion Batteries. J. Power Sources 2000, 89, 206–218. [Google Scholar] [CrossRef]
- Bhattacharya, S.; Alpas, A.T. Micromechanisms of Solid Electrolyte Interphase Formation on Electrochemically Cycled Graphite Electrodes in Lithium-Ion Cells. Carbon 2012, 50, 5359–5371. [Google Scholar] [CrossRef]
- Zaban, A.; Aurbach, D. POWER SOlIllCES Impedance Spectroscopy of Lithium and Nickel Electrodes Propylene Carbonate Solutions of Different Lithium Salts A Comparative Study. J. Power Sources 1995, 54, 289–295. [Google Scholar] [CrossRef]
- Vetter, J.; Novák, P.; Wagner, M.R.; Veit, C.; Möller, K.C.; Besenhard, J.O.; Winter, M.; Wohlfahrt-Mehrens, M.; Vogler, C.; Hammouche, A. Ageing Mechanisms in Lithium-Ion Batteries. J. Power Sources 2005, 147, 269–281. [Google Scholar] [CrossRef]
- Srinivasan, V. Batteries for Vehicular Applications. AIP Conf. Proc. 2008, 1044, 283–296. [Google Scholar]
- Ashuri, M.; He, Q.; Shaw, L.L. Silicon as a Potential Anode Material for Li-Ion Batteries: Where Size, Geometry and Structure Matter. Nanoscale 2016, 8, 74–103. [Google Scholar] [CrossRef]
- Bonkile, M.P.; Jiang, Y.; Kirkaldy, N.; Sulzer, V.; Timms, R.; Wang, H.; Offer, G.; Wu, B. Is Silicon Worth It? Modelling Degradation in Composite Silicon–Graphite Lithium-Ion Battery Electrodes. J. Power Sources 2024, 606, 234256. [Google Scholar] [CrossRef]
- Kirkaldy, N.; Samieian, M.A.; Offer, G.J.; Marinescu, M.; Patel, Y. Lithium-Ion Battery Degradation: Measuring Rapid Loss of Active Silicon in Silicon–Graphite Composite Electrodes. ACS Appl. Energy Mater. 2022, 5, 13367–13376. [Google Scholar] [CrossRef] [PubMed]
- Lee, B.-S.; Wu, Z.; Petrova, V.; Xing, X.; Lim, H.-D.; Liu, H.; Liu, P. Analysis of Rate-Limiting Factors in Thick Electrodes for Electric Vehicle Applications. J. Electrochem. Soc. 2018, 165, A525–A533. [Google Scholar] [CrossRef]
- Zhou, N.; Cui, X.; Han, C.; Yang, Z. Analysis of Acoustic Characteristics under Battery External Short Circuit Based on Acoustic Emission. Energies 2022, 15, 1775. [Google Scholar] [CrossRef]
- Guk, E.; Niri, M.F.; Vincent, T.A.; Apachitei, G.; Briggs, C.; Gulsoy, B.; Chao, S.; Guo, Z.; Sansom, J.E.H.; Marco, J. Investigation of Calendaring Parameters on the Microstructure of Graphite Anodes within Lithium-Ion Batteries: Insights from Ultrasonic Testing. J. Power Sources 2024, 614, 235063. [Google Scholar] [CrossRef]
- Feiler, S.; Gold, L.; Hartmann, S.; Giffin, G.A. Investigation of Acoustic Attenuation and Resonances in Lithium-Ion Batteries Using Ultrasound Spectroscopy. Batter. Supercaps 2024, 7, e202400212. [Google Scholar] [CrossRef]
- Kim, J.Y.; Wang, Z.L.; Lee, S.M.; Byeon, J.W. Failure Analysis of Thermally Abused Lithium-Ion Battery Cell by Microscopy, Electrochemical Impedance Spectroscopy, and Acoustic Emission. Microelectron. Reliab. 2019, 100–101, 113363. [Google Scholar] [CrossRef]
- Lemarié, Q.; Alloin, F.; Thivel, P.X.; Idrissi, H.; Roué, L. Study of Sulfur-Based Electrodes by Operando Acoustic Emission. Electrochim. Acta 2019, 299, 415–422. [Google Scholar] [CrossRef]
- Methani, W.; Pál, E.; Lipcsei, S.; Ugi, D.; Pászti, Z.; Groma, I.; Jenei, P.; Dankházi, Z.; Kun, R. Nanomechanical, Structural and Electrochemical Investigation of Amorphous and Crystalline MoO3 Thin-Film Cathodes in Rechargeable Li-Ion Batteries. Batteries 2022, 8, 80. [Google Scholar] [CrossRef]
- Hill, R.; Brooks, R.; Kaloedes, D. Characterization of Transverse Failure in Composites Using Acoustic Emission. Ultrasonics 1998, 36, 517–523. [Google Scholar] [CrossRef]
- Fordham, A.; Joo, S.-B.; Owen, R.E.; Galiounas, E.; Buckwell, M.; Brett, D.J.L.; Shearing, P.R.; Jervis, R.; Robinson, J.B. Investigating the Performance and Safety of Li-Ion Cylindrical Cells Using Acoustic Emission and Machine Learning Analysis. J. Electrochem. Soc. 2024, 171, 070521. [Google Scholar] [CrossRef]
- Gold, L.; Bach, T.; Virsik, W.; Schmitt, A.; Müller, J.; Staab, T.E.M.; Sextl, G. Probing Lithium-Ion Batteries’ State-of-Charge Using Ultrasonic Transmission—Concept and Laboratory Testing. J. Power Sources 2017, 343, 536–544. [Google Scholar] [CrossRef]
- Wang, K.; Chen, Q.; Yue, Y.; Tang, R.; Wang, G.; Tang, L.; He, Y. Cyclic Aging Monitoring of Lithium-Ion Battery Based on Acoustic Emission. Nondestruct. Test. Eval. 2023, 38, 480–499. [Google Scholar] [CrossRef]
- Tranchot, A.; Etiemble, A.; Thivel, P.X.; Idrissi, H.; Roué, L. In-Situ Acoustic Emission Study of Si-Based Electrodes for Li-Ion Batteries. J. Power Sources 2015, 279, 259–266. [Google Scholar] [CrossRef]
- Yoshida, N.; Sakamoto, T.; Kuwata, N.; Kawamura, J.; Sato, K.; Hashida, T. Electrochemical Degradation Caused by Mechanical Damage in Silicon Negative Electrodes. ECS Trans. 2017, 75, 31–37. [Google Scholar] [CrossRef]
- Fukui, K.; Sato, K.; Hashida, T.; Mizusaki, J.; Numao, M. Intelligent Analysis for Evaluating Physical Degradation Using Acoustic Emission. ECS Trans. 2013, 57, 571–580. [Google Scholar] [CrossRef]
- Matsuo, T.; Uchida, M.; Cho, H. Development of Acoustic Emission Clustering Method to Detect Degradation of Lithium Ion Batteries. J. Solid Mech. Mater. Eng. 2011, 5, 678–689. [Google Scholar] [CrossRef]
- Zhang, L.; Wang, L.; Lyu, C.; Li, J.; Zheng, J. Non-Destructive Analysis of Degradation Mechanisms in Cycle-Aged Graphite/LiCoO2 Batteries. Energies 2014, 7, 6282–6305. [Google Scholar] [CrossRef]
- Hao, W.; Yuan, Z.; Li, D.; Zhu, Z.; Jiang, S. Study on Mechanical Properties and Failure Mechanism of 18650 Lithium-Ion Battery Using Digital Image Correlation and Acoustic Emission. J. Energy Storage 2021, 41, 102894. [Google Scholar] [CrossRef]
- Huang, Z.X.; Zhang, X.C.; Liu, N.N.; Gu, L.R.; An, L.Q.; Zhou, W. Failure Mechanisms and Acoustic Responses of Cylindrical Lithium-Ion Batteries under Compression Loadings. Eng. Fail. Anal. 2024, 163, 108594. [Google Scholar] [CrossRef]
- Robinson, J.B.; Maier, M.; Alster, G.; Compton, T.; Brett, D.J.L.; Shearing, P.R. Spatially Resolved Ultrasound Diagnostics of Li-Ion Battery Electrodes. Phys. Chem. Chem. Phys. 2019, 21, 6354–6361. [Google Scholar] [CrossRef] [PubMed]
- Zhang, Y.S.; Pallipurath Radhakrishnan, A.N.; Robinson, J.B.; Owen, R.E.; Tranter, T.G.; Kendrick, E.; Shearing, P.R.; Brett, D.J.L. In Situ Ultrasound Acoustic Measurement of the Lithium-Ion Battery Electrode Drying Process. ACS Appl. Mater. Interfaces 2021, 13, 36605–36620. [Google Scholar] [CrossRef] [PubMed]
- McGrogan, F.P.; Bishop, S.R.; Chiang, Y.-M.; Van Vliet, K.J. Connecting Particle Fracture with Electrochemical Impedance in Li X Mn2O4. J. Electrochem. Soc. 2017, 164, A3709–A3717. [Google Scholar] [CrossRef]
- Pietsch, P.; Wood, V. X-Ray Tomography for Lithium Ion Battery Research: A Practical Guide. Annu. Rev. Mater. Res. 2024, 47, 451–479. [Google Scholar] [CrossRef]
- Gailani, A.; Mokidm, R.; El-Dalahmeh, M.; El-Dalahmeh, M.; Al-Greer, M. Analysis of Lithium-Ion Battery Cells Degradation Based on Different Manufacturers. In Proceedings of the UPEC 2020—2020 55th International Universities Power Engineering Conference, Proceedings, Torino, Italy, 1–4 September 2020; Institute of Electrical and Electronics Engineers Inc.: Piscataway, NJ, USA, 2020. [Google Scholar]
- Wang, Z.; Zhao, X.; Zhang, H.; Zhen, D.; Gu, F.; Ball, A. Active Acoustic Emission Sensing for Fast Co-Estimation of State of Charge and State of Health of the Lithium-Ion Battery. J. Energy Storage 2023, 64, 107192. [Google Scholar] [CrossRef]
- Middlemiss, L.A.; Rennie, A.J.R.; Sayers, R.; West, A.R. Characterisation of Batteries by Electrochemical Impedance Spectroscopy. Energy Rep. 2020, 6, 232–241. [Google Scholar] [CrossRef]
- Yu, H. Scanning Acoustic Microscopy for Material Evaluation. Appl. Microsc. 2020, 50, 25. [Google Scholar] [CrossRef]
- Bauermann, L.P.; Mesquita, L.V.; Bischoff, C.; Drews, M.; Fitz, O.; Heuer, A.; Biro, D. Scanning Acoustic Microscopy as a Non-Destructive Imaging Tool to Localize Defects inside Battery Cells. J. Power Sources Adv. 2020, 6, 100035. [Google Scholar] [CrossRef]
- Morokov, E.; Levin, V.; Ryzhova, T.; Dubovikov, E.; Petronyuk, Y.; Gulevsky, I. Bending Damage Evolution from Micro to Macro Level in CFRP Laminates Studied by High-Frequency Acoustic Microscopy and Acoustic Emission. Compos. Struct. 2022, 288, 115427. [Google Scholar] [CrossRef]
- Meddings, N.; Heinrich, M.; Overney, F.; Lee, J.S.; Ruiz, V.; Napolitano, E.; Seitz, S.; Hinds, G.; Raccichini, R.; Gaberšček, M.; et al. Application of Electrochemical Impedance Spectroscopy to Commercial Li-Ion Cells: A Review. J. Power Sources 2020, 480, 228742. [Google Scholar] [CrossRef]
Disclaimer/Publisher’s Note: The statements, opinions and data contained in all publications are solely those of the individual author(s) and contributor(s) and not of MDPI and/or the editor(s). MDPI and/or the editor(s) disclaim responsibility for any injury to people or property resulting from any ideas, methods, instructions or products referred to in the content. |
© 2025 by the authors. Licensee MDPI, Basel, Switzerland. This article is an open access article distributed under the terms and conditions of the Creative Commons Attribution (CC BY) license (https://creativecommons.org/licenses/by/4.0/).


