Article

Magnesium Alginate as an Electrolyte for Magnesium Batteries

by
Markus C. Kwakernaak
1,
Lindah K. Kiriinya
1,2,
Walter J. Legerstee
1,3,
Winok M. J. Berghmans
1,
Caspar G. T. Hofman
1 and
Erik M. Kelder
1,*
1
Department of Radiation Science & Technology, Delft University of Technology, Mekelweg 15, 2629 JB Delft, The Netherlands
2
Department of Electrical and Information Engineering, Faculty of Engineering, University of Nairobi, Harry Thuku Street, Nairobi 00100, Kenya
3
Institute for Engineering and Applied Sciences, Department Automotive, Rotterdam University of Applied Sciences, Heijplaatstraat 23, 3089 JB Rotterdam, The Netherlands
*
Author to whom correspondence should be addressed.
Batteries 2025, 11(1), 16; https://doi.org/10.3390/batteries11010016
Submission received: 8 November 2024 / Revised: 20 December 2024 / Accepted: 29 December 2024 / Published: 3 January 2025

Abstract

:
We present magnesium alginate as an aqueous polymer electrolyte for use in magnesium batteries. Alginates are polysaccharides extracted from algae, which form hydrogel materials upon interaction with divalent and trivalent cations. They are renewable, non-toxic, biocompatible materials that are widely used in the food and pharmaceutical industries. Mg2+ is weakly bound to an alginate polymer, which results in a hydrogel-like material that contains mobile magnesium ions. We propose that this is the ideal situation for an electrolyte that behaves in a similar way as a ‘water-in-salt’ system. Magnesium alginate was successfully synthesized and characterized by FTIR, XRD, and PDF. Ionic conductivity was measured with EIS measurements; a 2 wt% magnesium electrolyte shows a conductivity of 1.8 mS/cm. During conductivity experiments, we noticed the formation of a black layer on magnesium electrodes, which can improve the ionic conductivity between the electrodes. We carefully characterized this layer with XPS and saw that it mainly consists of alginate derivatives.

Graphical Abstract

1. Introduction

In recent decades, extensive research has been conducted on magnesium and magnesium ion batteries [1,2,3]. To date, this has not led to successful commercialization. Magnesium chemistry has promising properties that could bring a magnesium battery into direct competition with present lithium-ion batteries. Magnesium is the fifth most abundant element in the planet’s crust, and approximately 1000 times more abundant compared to lithium. It also provides additional mining locations, allowing for a more diversified supply chain [4,5]. The theoretical energy densities of lithium and magnesium metals are comparable. The success of lithium-ion batteries can be explained by a delicate interplay between the correct cathode, an intercalating graphite anode, and an electrolyte that is tolerant towards both, due to the solid electrolyte interphase (SEI) [6]. The development of an electrolyte that is stable against metallic magnesium is the main obstacle in the development of magnesium batteries. Most organic solvents and simple magnesium salts (e.g., Mg(SO3CF3)3 and Mg(ClO4)2) will form a surface film on the electrodes, which shows no conductivity for magnesium ions [7]. Ethereal electrolytes with Grignard reagents do not form surface films, but are strongly reducing and therefore have low anodic stability [8].
Salts play an integral role in liquid electrolytes. They allow for ionic conductivity and therefore the proper operation of a battery. A higher concentration of salts is generally considered good for both the oxidative and reductive stabilities of electrodes. This has been shown in conventional lithium-ion batteries [9]. The general principle behind this is that solvent molecules can coordinate to ions, thereby stabilizing water molecules when in close proximity to electrodes. In aqueous electrolytes, this has an extra dimension, since water needs to be stabilized enough to widen beyond the traditional electrochemical stability window of water of 1.23 V. When the concentration of salts is high enough, the water content becomes lower than the salt content, creating a ‘water in salt’ electrolyte. Suo et al. have demonstrated a successful application of the water-in-salt concept in a lithium-ion battery [10]. They dissolved LiTFSI to such an extent that for every Li+ ion there were only 2.6 water molecules on average. This widened the electrochemical stability window of water to ~3.0 V. The low water mobility reduced the degradation of water, and the SEI that was formed further reduced degradation. Leong et al. have demonstrated a similar approach in an aqueous water-in-salt magnesium battery [11]. They have shown that magnesium chloride can be used to stabilize the magnesium anode against water degradation. They were able to cycle their battery over 700 cycles with a discharge plateau at 2.4–2.0 V.
There is no clear definition of the concentration that constitutes a water-in-salt electrolyte. However, it is understood that water is bound and organized around ions in the solution to such an extent that little to no free water is present. A similar situation can occur in hydrogels, where water molecules are organized around hydrophilic polymer chains [12,13,14]. The water dynamics in hydrogels are very complex and change for different hydrogels, but water molecules are either tightly bound, loosely bound, or free.
Alginates are polysaccharides that can be harvested from algae. They are extensively used in the food and pharmaceutical industries since they exhibit biocompatibility and great mechanical properties for different applications [15]. Alginates are composed of two different monomers, which vary based on whether the carboxylate group is oriented in the same direction as the hydroxyl groups (M-monomer) or in the opposite direction (G-monomer). When these carboxylates are exposed to divalent or trivalent cations, they can form a crosslink [16]. Through this, the alginate can form a hydrogel. The best known example is calcium, which forms a strong and robust hydrogel, where calcium ions are in a dissolved-like state [17]. Magnesium ions cannot induce such strong gelation of alginate; the bonds between the ions and carboxylate are less strong, and the magnesium is therefore more mobile in the solution (see Figure 1 [18]). For an electrolyte, the ionic mobility must be maintained for its proper function.
Because of this convergence of properties, we investigate the use of magnesium alginate as an electrolyte in magnesium batteries. This work will explain the synthesis of magnesium alginate, explore its use as an electrolyte, and provide a computational understanding of its inner workings.

2. Results and Discussion

2.1. Synthesis and Characterization

2.1.1. Synthesis

Magnesium alginate (Mg-Alg) was synthesized by a reaction between alginic acid (Alg-acid) and magnesium hydroxide. G-monomers have a higher affinity for binding cations. This was used to synthesize two different magnesium alginates. One where only the G-monomers are bound to magnesium (standard ratio) and one where all monomers are bound to magnesium (extra Mg ratio). The materials are yielded as powders that are dissolved in distilled water for the experiments. When dissolved in a small amount (<15 wt%) the solution behaves as a liquid. When dissolved in a higher amount, the solution will be more viscous.

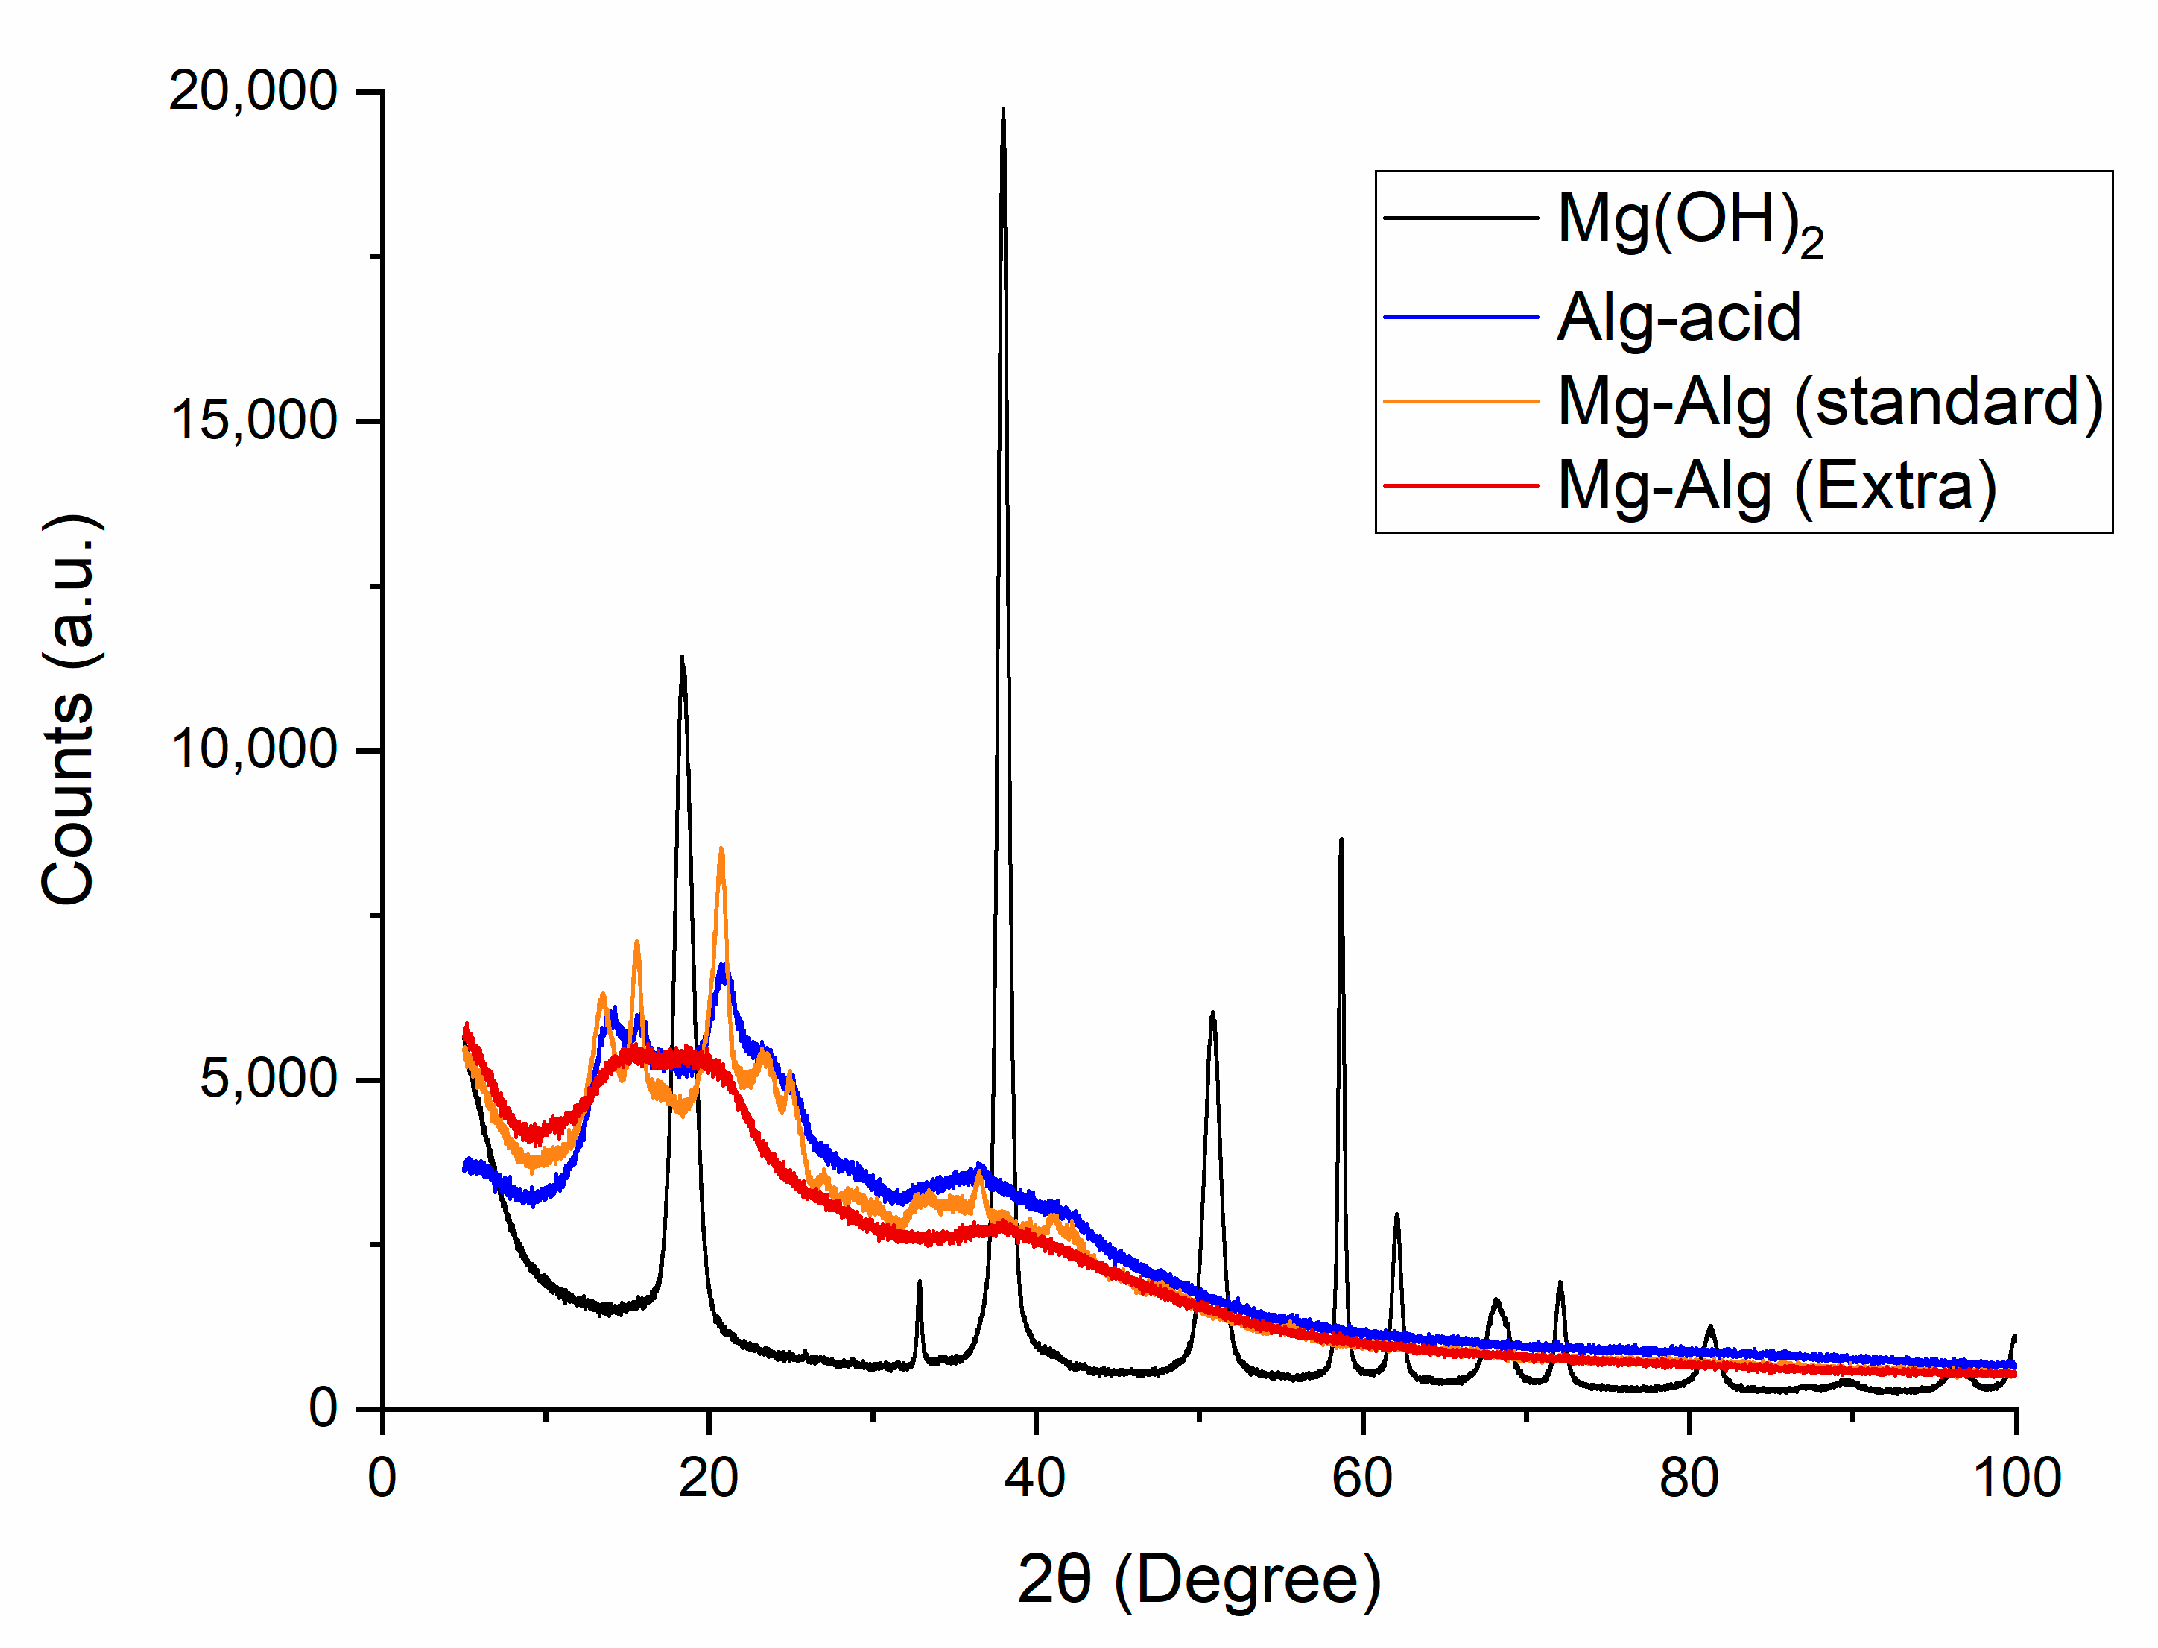
2.1.2. X-Ray Diffraction (XRD) Analysis

To check whether the reaction progressed to completion, XRD was used to determine whether Mg(OH)2 was still present in the synthesized Mg-Alg samples. This was achieved by analyzing both the synthesized products and the initial reagents. The results are presented in Figure 2.
Mg(OH)2 is crystalline and is characterized by peaks at 18.4°, 33.3°, 38.0°, 50.7°, 58.8°, 68.2°, and 72.0°, corresponding to the Mg(OH)2 brucite structure [19]. The diffractogram for Mg(OH)2 in Figure 2 shows distinct peaks that correspond to the Mg(OH)2 structure. The alginic acid (Alg-acid) precursor is mostly amorphous and so produces less sharp peaks. Since none of the synthesized Mg-Alg samples have the distinctive peaks that can be attributed to Mg(OH)2, it can be concluded that Mg(OH)2 is not present in the samples. The Mg-Alg samples produce a similar curve to that of the Alg-acid, suggesting that the alginate backbone has retained its structure. The Mg-Alg standard ratio (all G-monomer carboxylates are bound by magnesium) sample shows a good correlation with the Alg-acid compared to the Mg-Alg, extra Mg ratio (all G- and M-monomer carboxylates are bound by magnesium) sample, implying the amount of Mg influences the alginate structure.

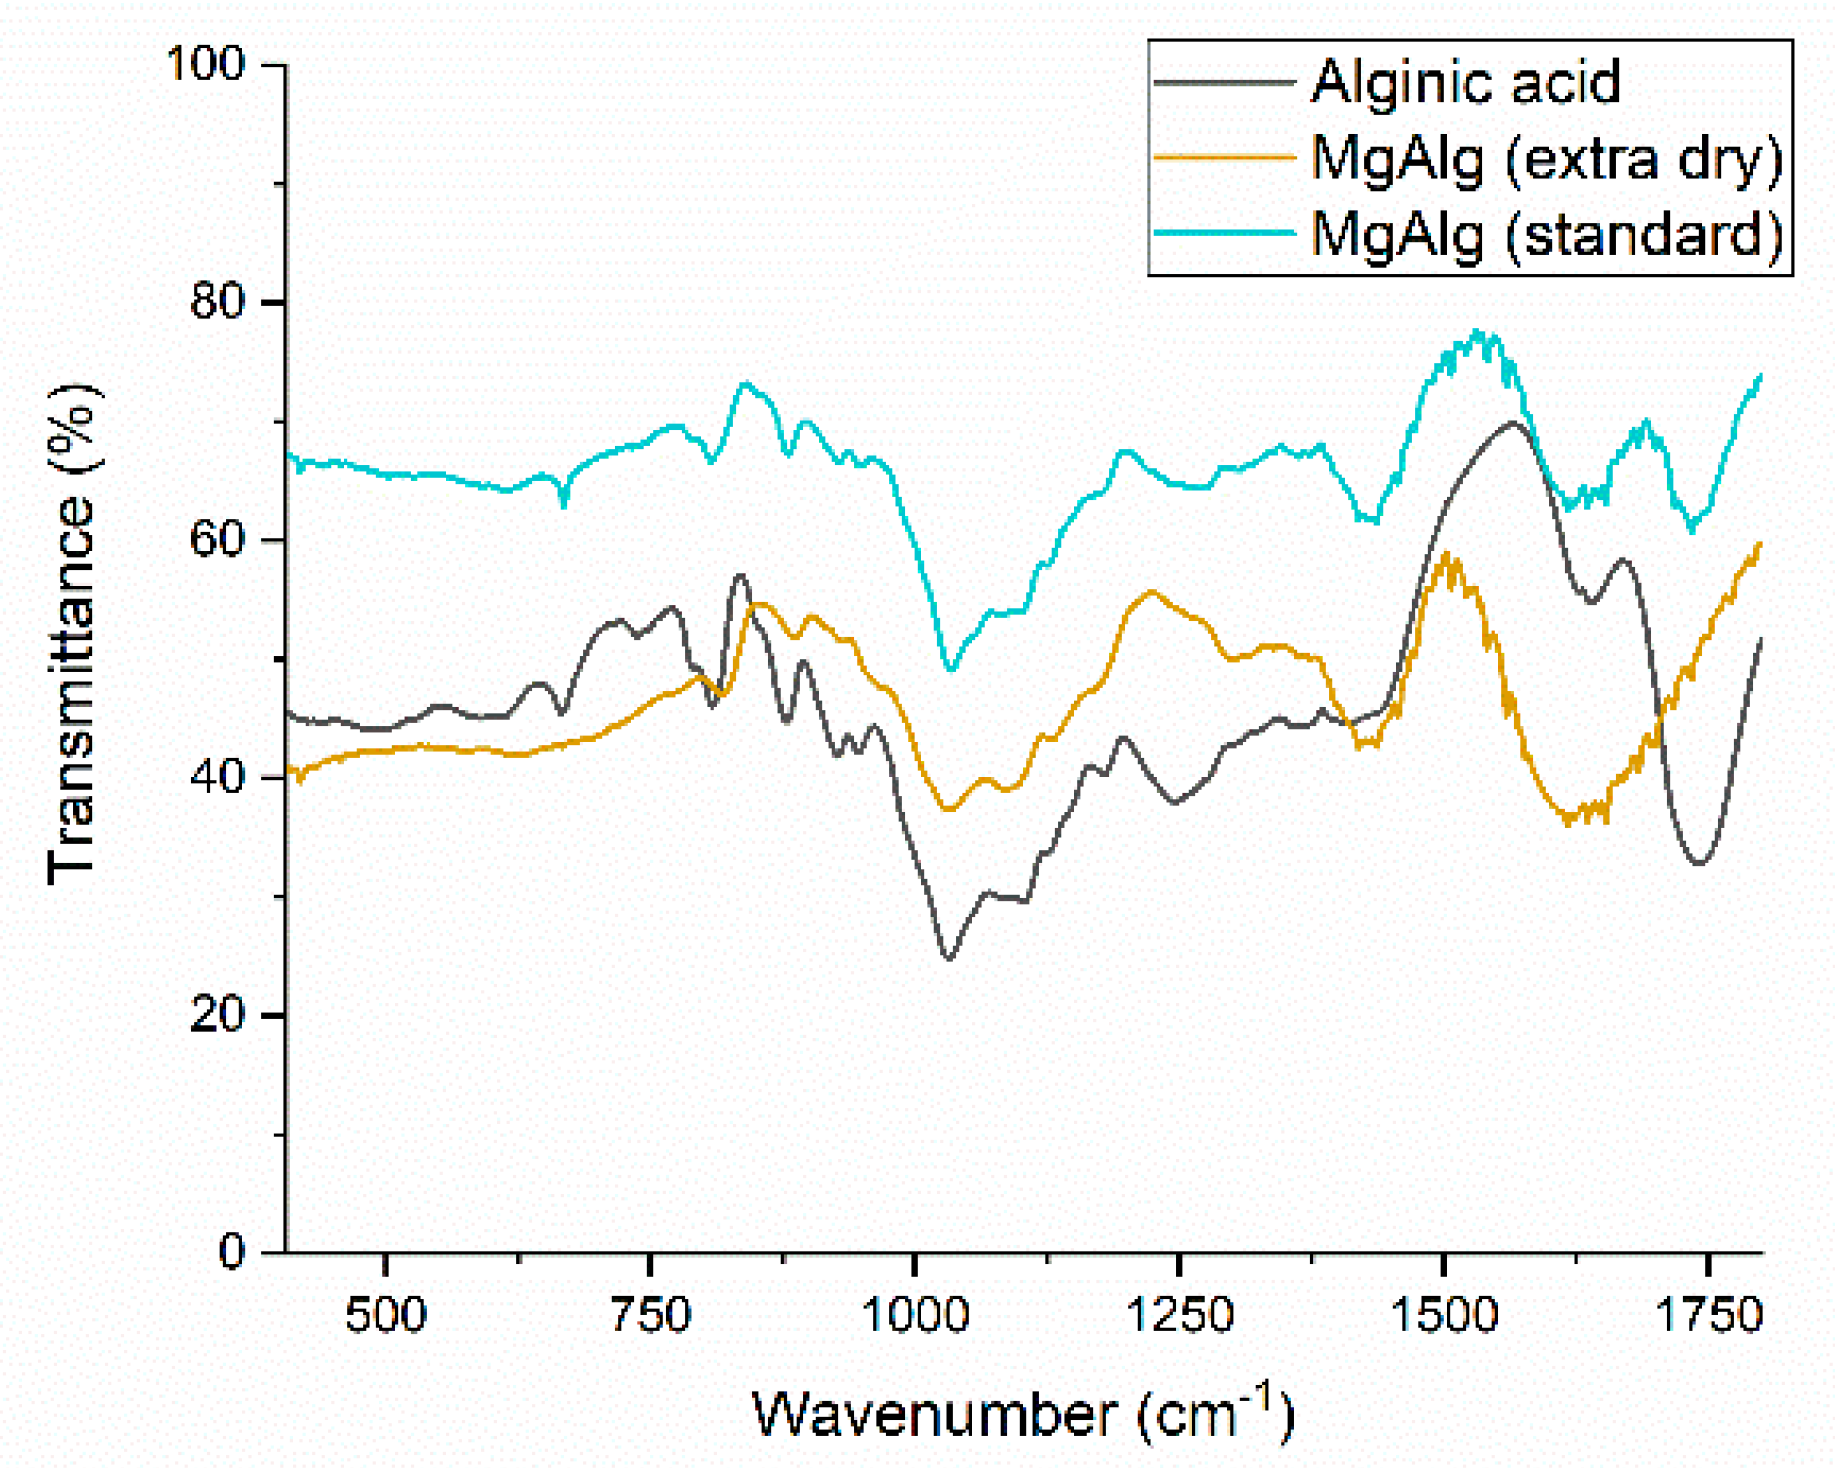
2.1.3. Characterization Using Fourier Transform Infrared Spectroscopy (FTIR)

To further understand the structure of Mg-Alg, FTIR (Thermo Scientific Nicolet iS50 FT-IR, Waltham, MA, USA) was used to investigate the chemical bonds that were present in the samples. Spectra were taken for Mg-Alg and Alg-acid, and these are shown in Figure 3. Several peaks were shifted or changed in intensity compared to Alg-acid [20], in particular the –C–O (~1000 cm−1) and –COO(~1400–1600 cm−1) bands. The Mg-Alg samples exhibit a peak at 1419 cm−1 that is absent in Alg-acid, likely representing -COO stretching due to the presence of Mg2+. Alg-acid and Mg-Alg (standard ratio) samples show a peak that corresponds to the free acid –C=O stretch (~1700 cm−1) which is absent in the Mg-Alg (extra Mg ratio) sample spectra. The “standard” Mg-Alg sample was prepared such that the amount of Mg was just enough to bind to the carboxylate group of the G-residue. The “extra’’ Mg-Alg sample had additional Mg to bind to the carboxylate group of both the G- and M-residues, which would explain why the sample has the free acid –C=O peak. All these stretch vibrations correspond to bonds that are involved in the binding of the metal to alginate polysaccharide.

2.1.4. Pair Distribution Function (PDF) Analysis

The pair distribution function was used to investigate the distance between Mg2+ and alginate. The results are shown in Figure 4a–d, where the X-ray diffraction data from Ca-Alg and Mg-Alg in 2θ-space are shown (Figure 4a and Figure 4c, respectively), and used for the calculations of the pair distribution function (Figure 4b and Figure 4d, respectively). The X-ray diffraction data from Ca-Alg and Mg-Alg in Q-space, with the background subtracted, and the reduced structure factor F(Q) of Ca-Alg and Mg-Alg, can be found in the Supporting Information. The results for Ca-Alg are used as a reference for the analysis of the distance of the Mg2+ ions to the carboxyl groups, as these are known. Typically, the M2+···O distance increases with the ionic radius—Mg2+ < Ca2+ < Sr2+—and were reported to be 2.156, 2.471, and 2.610 Å, respectively [21]. The Ca2+···O averaged distances are in good agreement with previously studied Ca2+-alginate interactions using force field computational methods [22]. In these works, six short Ca2+···O bond lengths of ~2.4 Å were reported.
The results show two main peaks for Ca-Alg and Mg-Alg at 1.44 Å and 2.40 Å, and 1.44 Å and 2.42 Å, respectively. The first peak can be attributed to the C-C and C-O distances, which are typically in this order. The peak at 2.42 Å is thus assigned by the distance between a Mg2+ ion and the carboxyl group. This number is longer than often seen for Mg2+-ligand bond lengths, which are typically in the order of 2.15 Å to 2.25 Å [23]. However, the elongation can be understood by the binding energy as discussed by Rutkowska-Zbik et al. [17]. They found that Mg2+-H2O bonds are longer and weaker in chelates than in complexes with water, which was explained by their binding energy being proportional to the electron density of the chelating ligand. The charge due to the electron in the carboxyl group in the alginate is delocalized over two oxygen molecules, reducing the electron density and thus creating an even longer bond length, as found here for the alginate ligand. The other peaks are then related to Mg2+···C and other Mg2+···O distances. This elongated bond length, and thus reduced binding energy toward the alginate ligand, gives rise to the solubility behavior of the magnesium alginate, hence, allowing magnesium ions to be dissociated from the alginate ligand once it is brought into contact with water.

2.1.5. Modeling

Molecular dynamics simulations with GROMOS showed that in all cases studied, the Mg2+ ion is surrounded by six oxygen atoms, but the origin of the oxygen is strongly dependent on the water content. In a dry system, the carboxyl group (O51 and O52; Table 1, Figure 5) provides the most ligand atoms (43%), followed by the hydroxyl group (15%). Small amounts have been found for O4 and O1 oxygen atoms.
Upon the introduction of water molecules, binding between the cation and alginate completely changes. In simulations with a water content of 21.1 and 34.8 wt%, all cations could still form crosslinks between polymers. However, at 51.6 wt%, all divalent cations were almost entirely surrounded by water molecules in their first hydration shell. Here, the oxygen ligands will come mainly from the water molecules, with a strong decrease in the carboxyl and hydroxyl groups as ligands. The oxygen ligands O4 and O1 do not participate as ligands anymore. The obtained results agreed quite well with earlier observed results where an alginate system containing Mg2+ did not show any gelation effects, which can be attributed to the cation’s high affinity for water (solvation free energy). The interaction with water is so strong that most cations will be entirely surrounded by water molecules or will only bind to a carboxylate anion in a monodentate configuration (mono complex). If the cation is bound in a monodentate configuration, crosslinks cannot be formed between alginate polymers [14]. Another study by Perić-Hassler and Hünenberger showed that Mg2+ might bind loosely to the carboxylate group [24]. The carboxylate oxygens molecules are positioned in the second hydration shell around the cation in a loose binding configuration. The carboxylate group and the cation share the same water molecule (which is positioned between them) as a solvation molecule. This means the cation is surrounded by water while maintaining a connection to the carboxylate group. The influence of loose binding on gelling properties is unclear.

2.2. Electrochemical Experiments

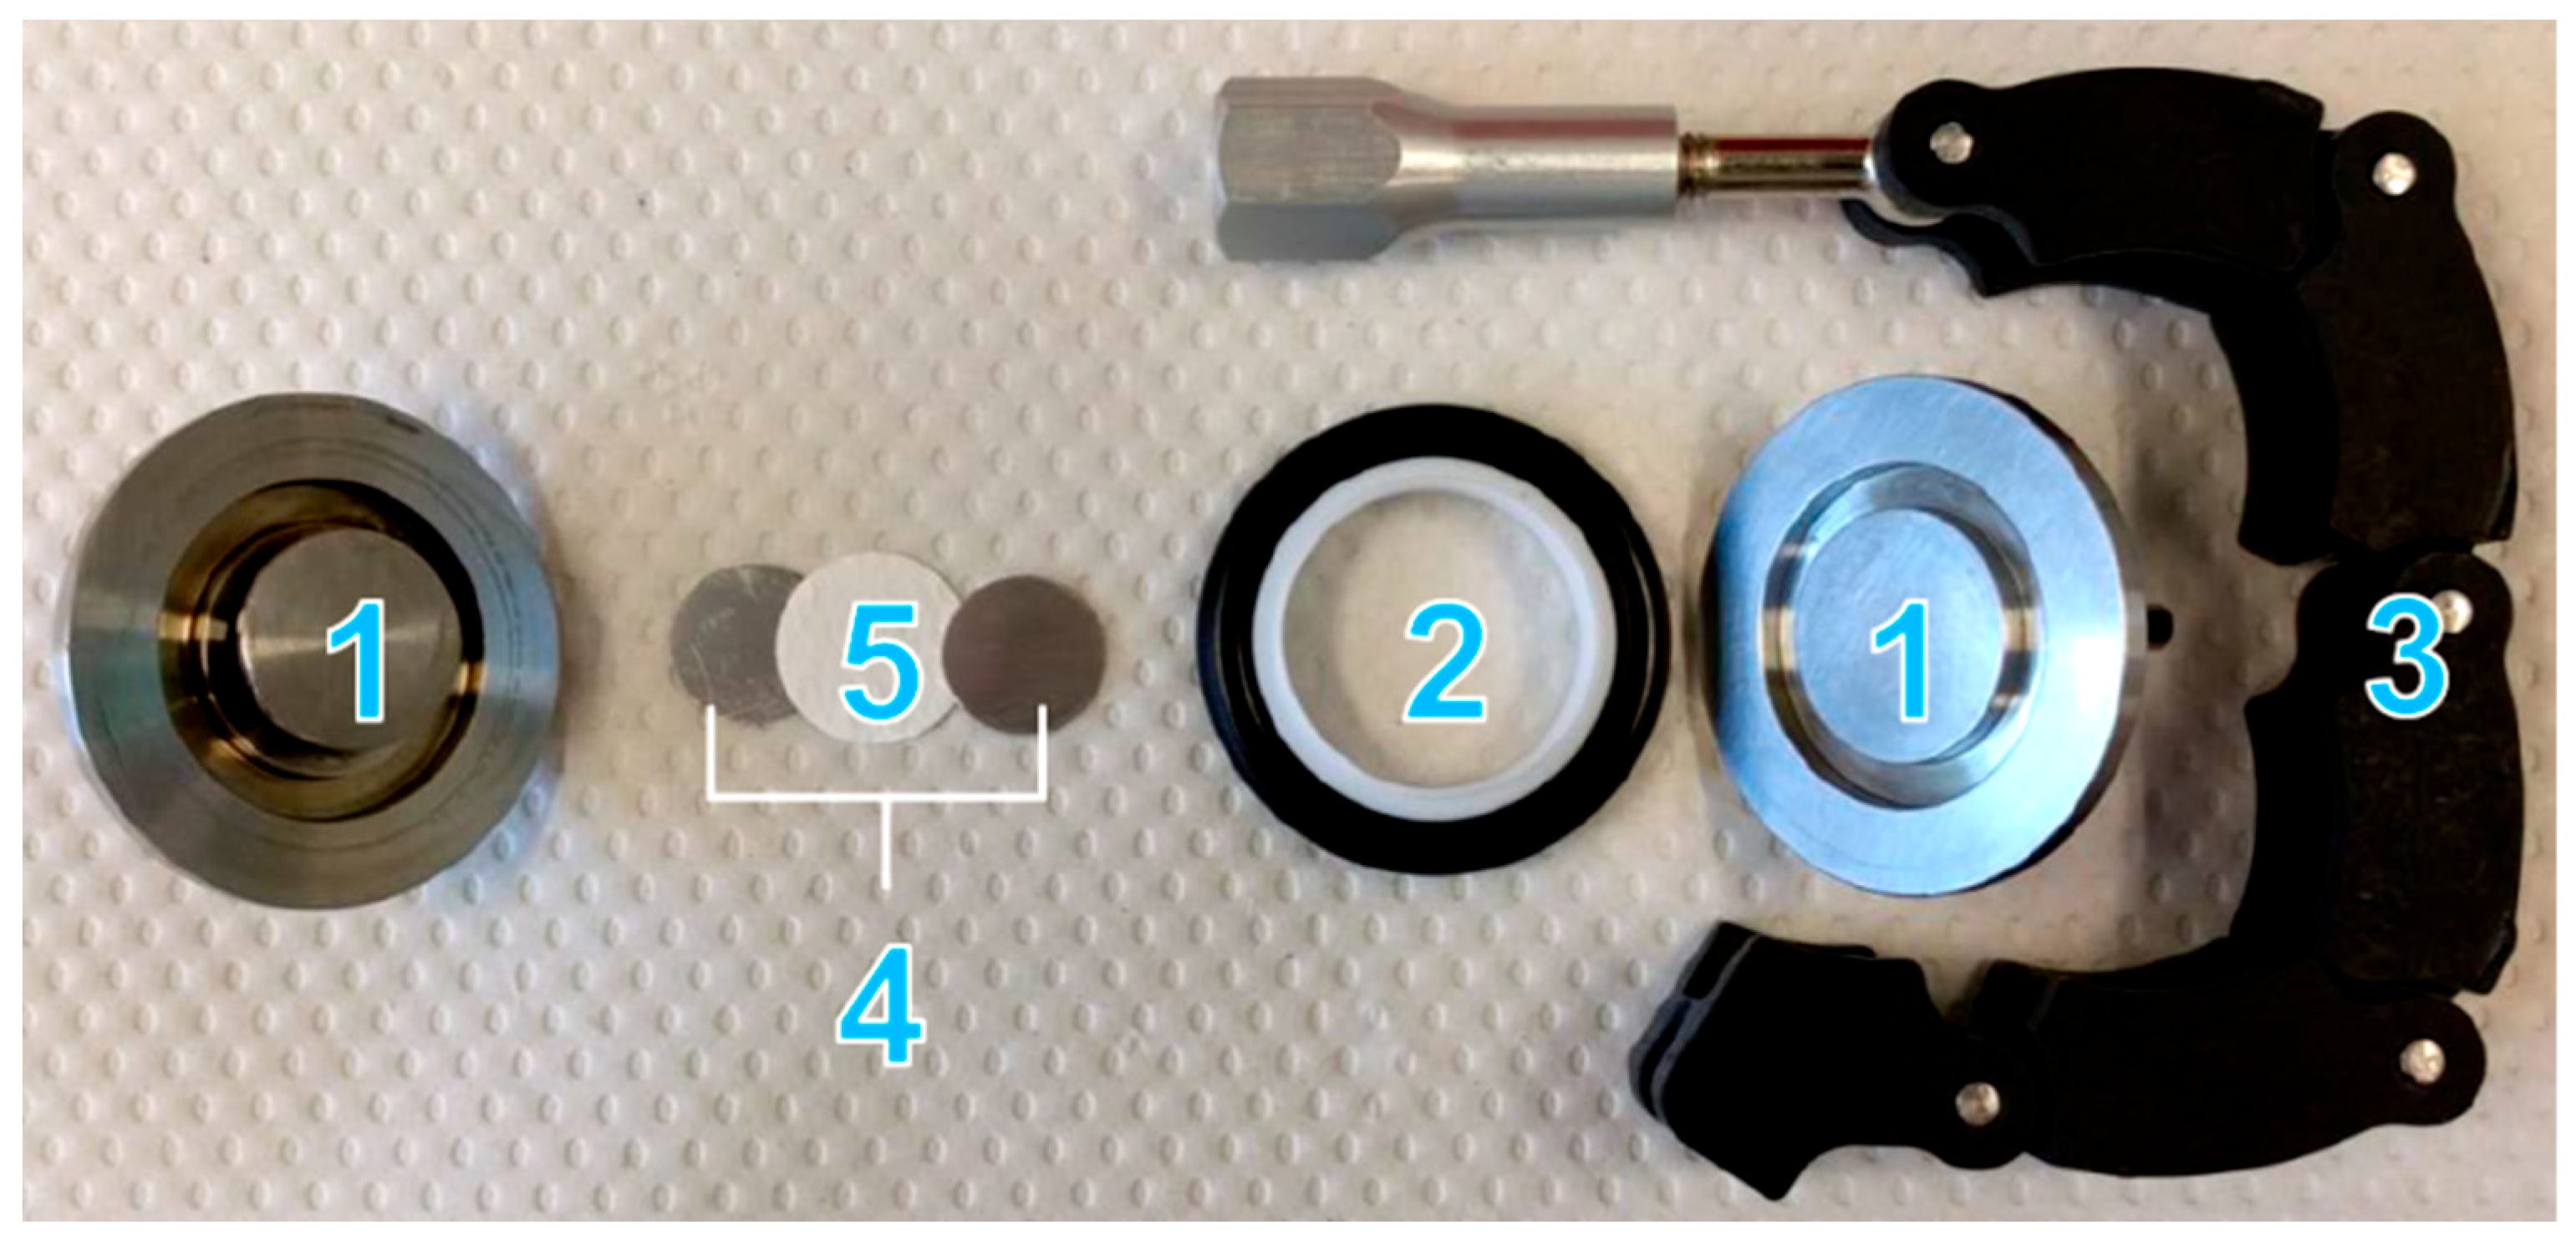
2.2.1. Electrolyte Preparation and Cell Assembly

To investigate the electrochemical performance of the Mg-Alg electrolyte, different concentrations of the electrolyte were prepared. The Mg-Alg powder that was obtained from the drying process was used to prepare the electrolyte. The concentrations of the electrolyte prepared were 2 wt%, 25 wt%, 50 wt%, 75 wt%, and 100 wt%. To prepare the 2 wt% and 5 wt% solutions, Mg-Alg was weighed, and a proportionate amount of water was added using a pipet to achieve the required concentration. This solution was then placed in a vial and allowed to mix overnight. For the 50 wt% and 75 wt% solutions, the proportionate amounts of powder and water were mixed in a mortar and pestle. The mixture was then pressed at 8 tons for 3 min, resulting in pellets of ~0.9 mm thickness and a diameter of 13 mm.
To assemble the test cells, magnesium plates were used as electrodes. The electrolyte solution was first placed onto one electrode (magnesium plate), the separator was then added (fiber glass separator), followed by some more electrolyte. This was then topped off by the second electrode (magnesium plate), after which the assembly was placed within the external housing. The rubber seal was then added so that the housing could be closed hermetically. This would then be connected to a galvanostat/potentiostat equipped with an impedance meter for testing. The electrodes were sanded before the experiment. The different components can be seen in Figure 6.

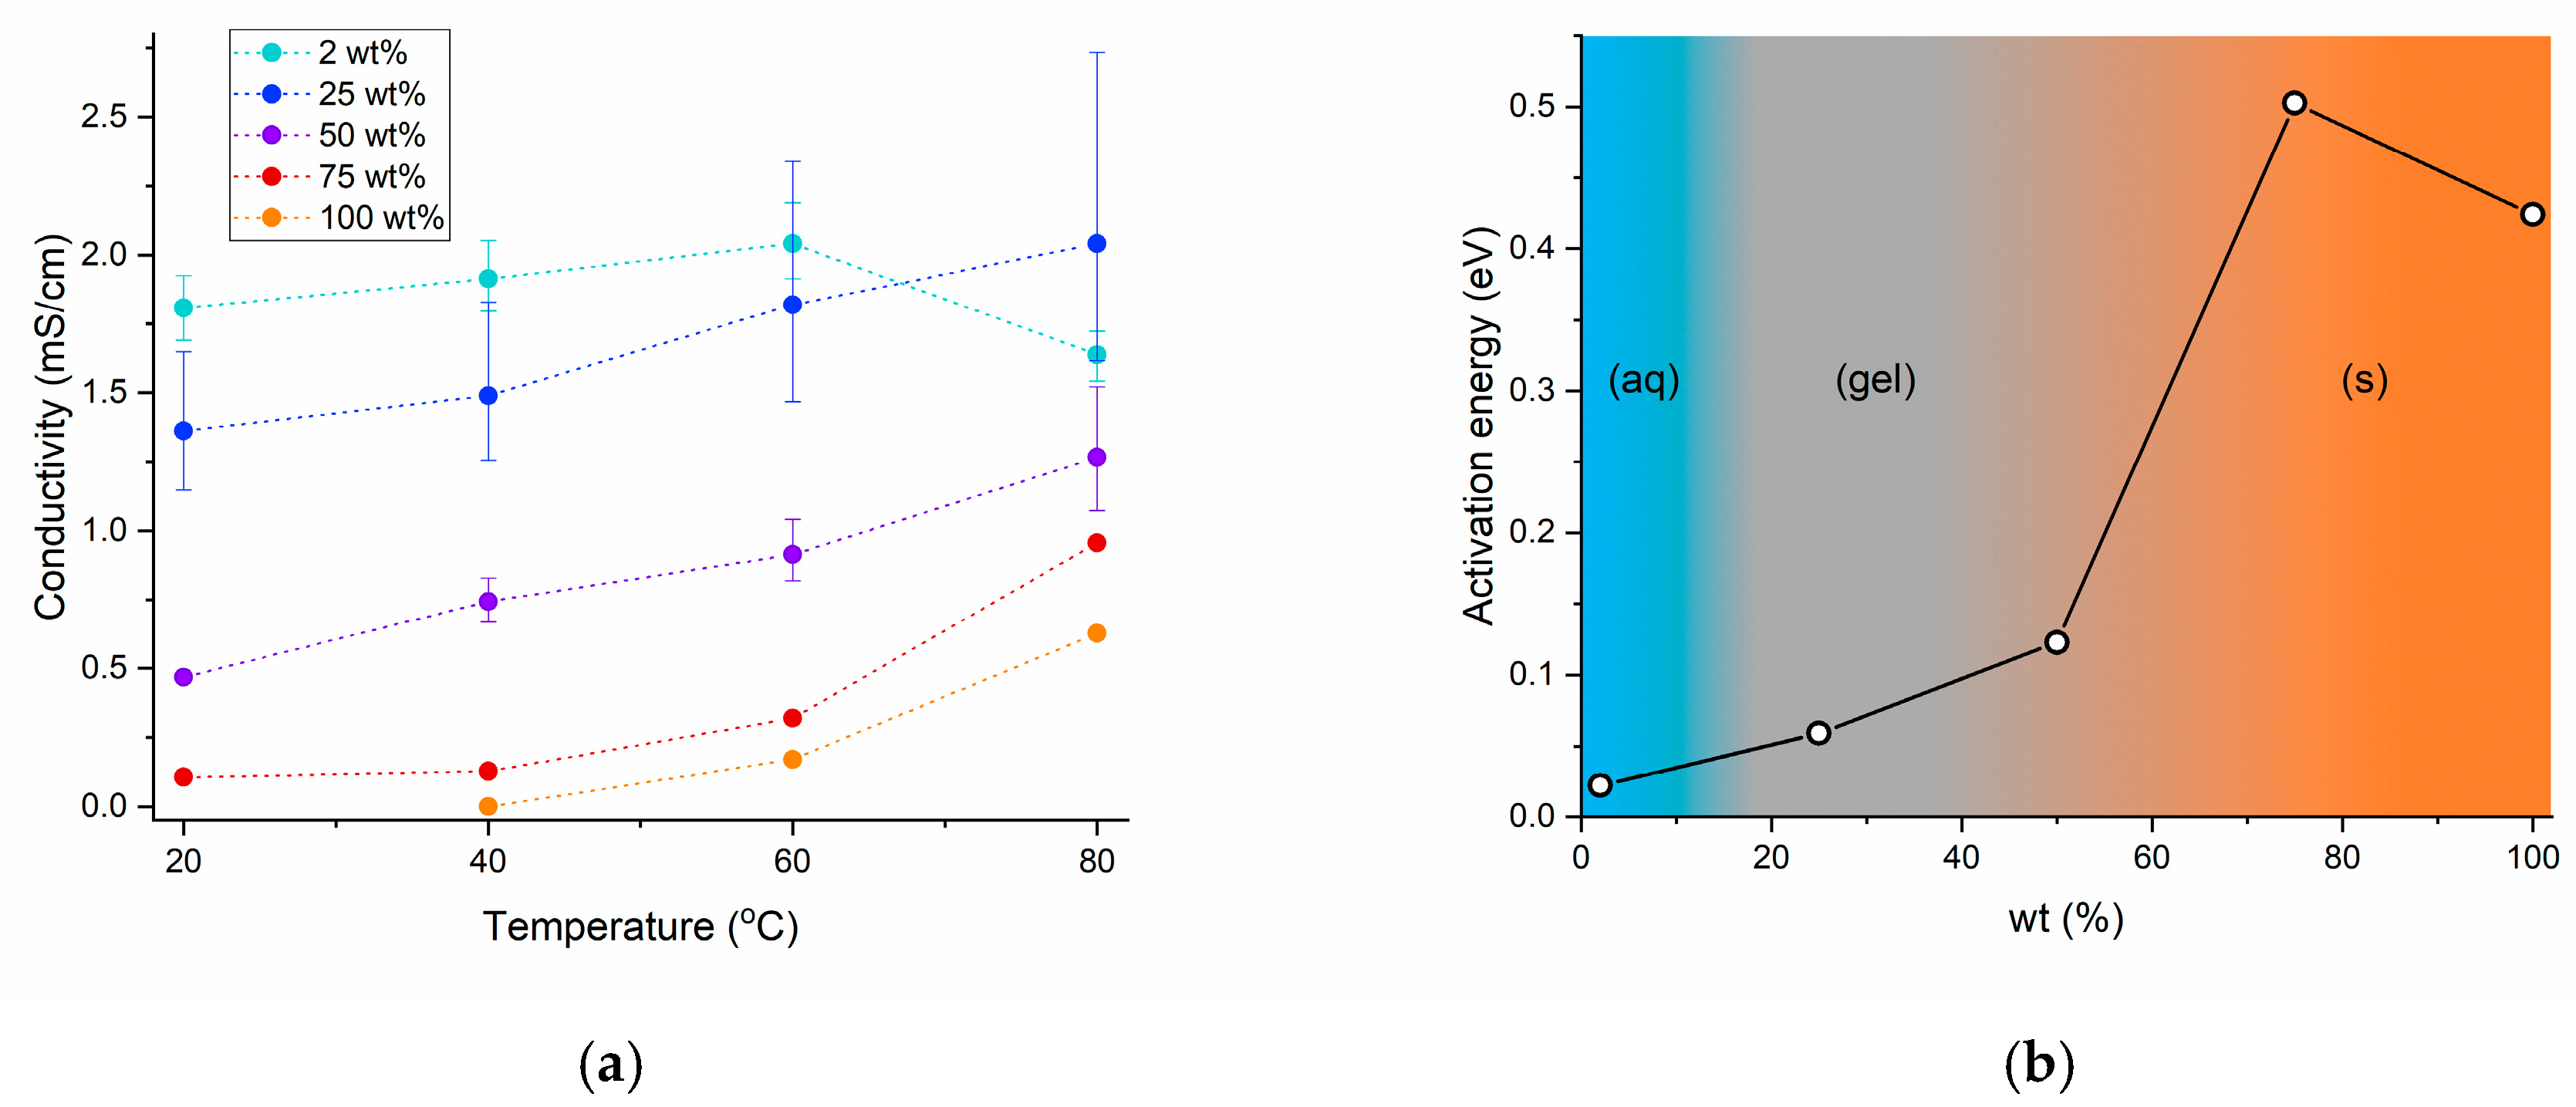
2.2.2. Electrolyte Conductivity

The cell assembly in Figure 6 was connected to the potentiostat (Metrohm Autolab PGSTAT12) to measure the resistance of the electrolyte. The conductivity ( σ ) was then calculated according to Equation (1) using the electrolyte resistance ( R e l ), the thickness of the electrolyte layer ( L ), and the active area ( A ). The conductivity was taken at different temperatures for the different concentrations of electrolyte (Figure 7a). The Mg-Alg concentration influences the electrolyte conductivity to a large extent, with lower concentrations (2 wt% and 25 wt%) exhibiting higher conductivities compared to the electrolyte with 50 wt%, 75 wt%, and 100 wt%. The conductivity of lower concentration electrolytes is not significantly influenced by an increase in temperature, while the conductivity of higher concentration electrolytes is. The conductivity of the electrolyte seems to be influenced largely by ionic conductivity as opposed to electronic conductivity. This is evidenced by the fact that the addition of more charge carriers (Mg-Alg) does not significantly improve the conductivity of the electrolyte. In Figure 7b, conductivity is converted to activation energy using the Arrhenius equation. A clear trend can be seen, where the activation energy changes according to the phase of the magnesium alginate. The Arrhenius plots can be seen in Figure S4.
σ = L A 1 R e l S cm

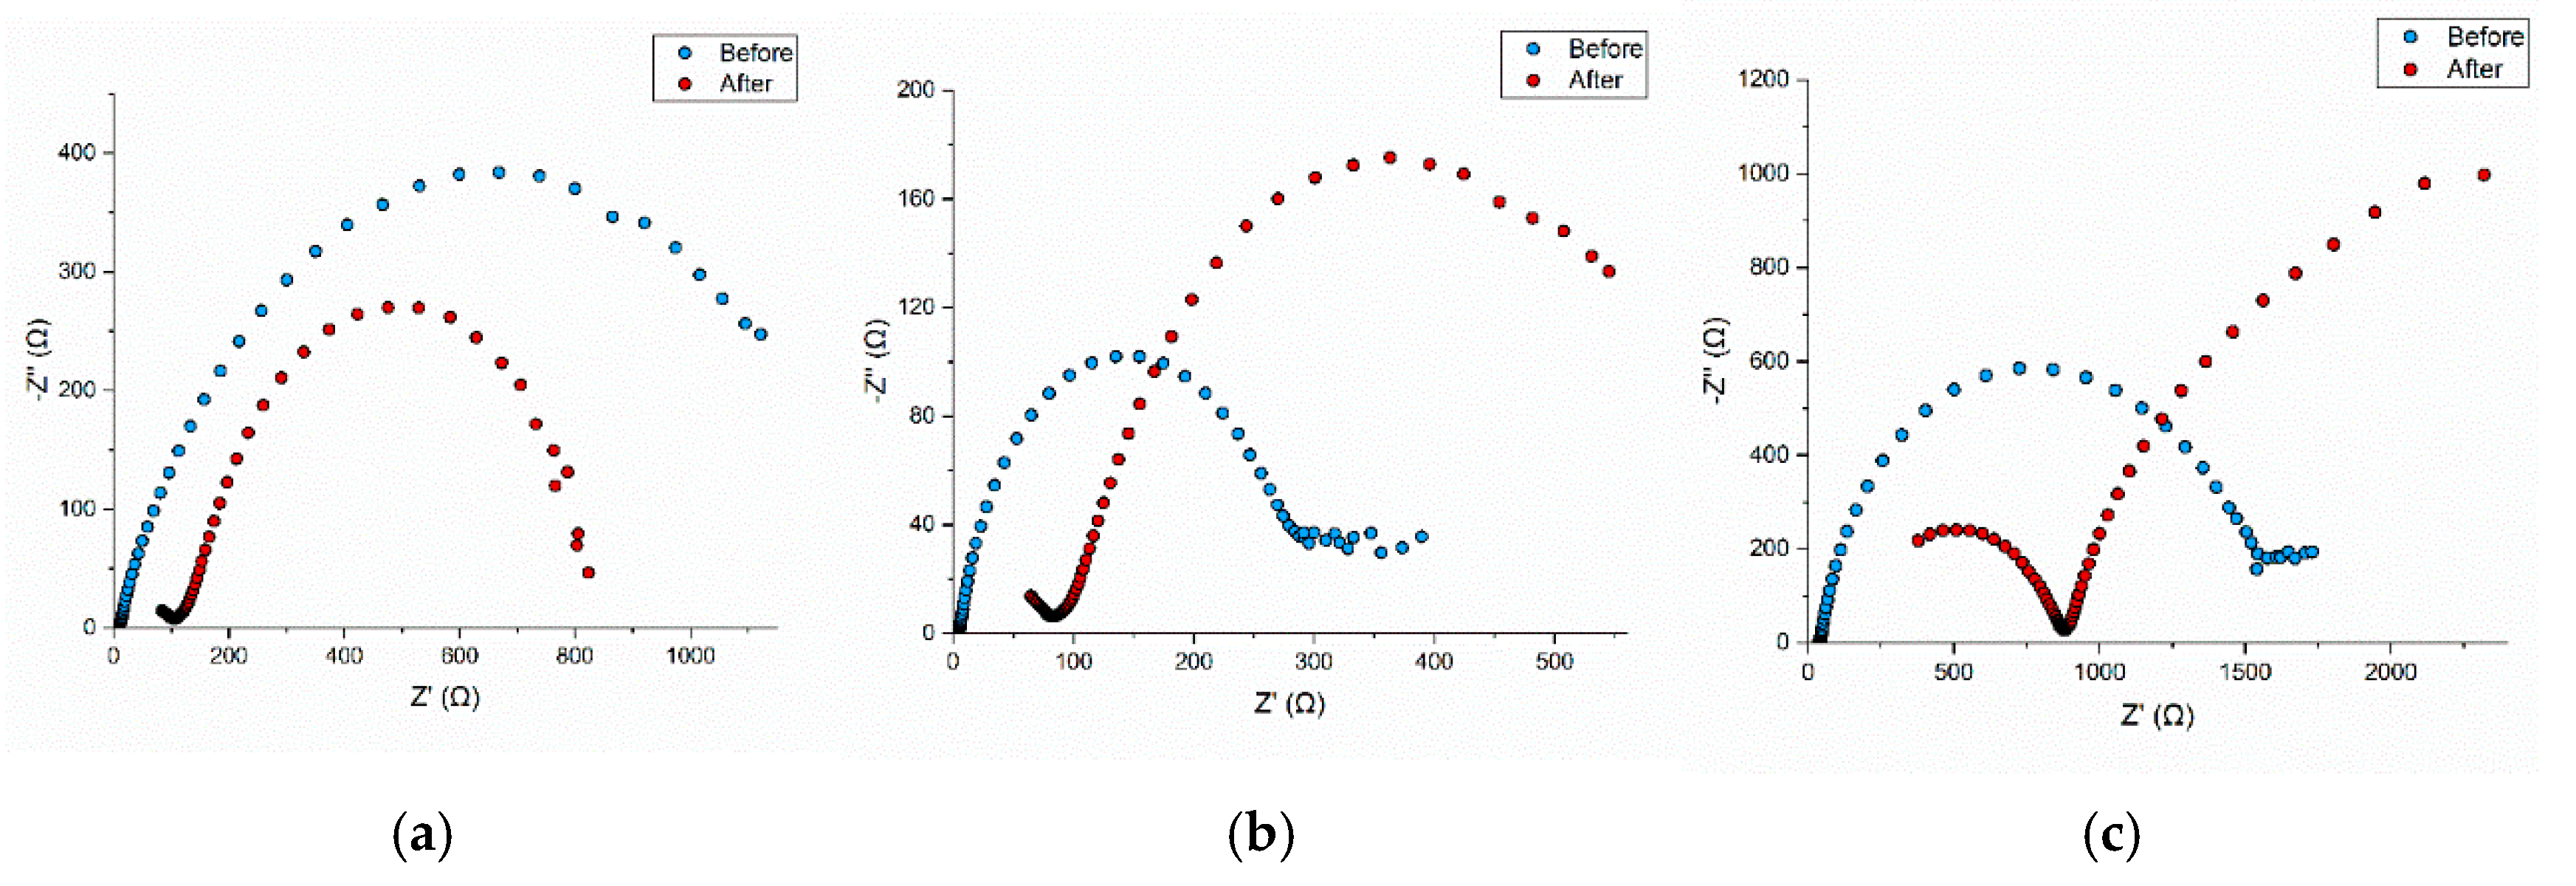
2.2.3. Electrochemical Impedance Spectroscopy (EIS) Profiles

EIS was carried out to measure the internal resistance of the electrolyte and the interfacial resistance between the electrolyte and the magnesium electrodes. While running one EIS experiment, a dark layer was observed on the pristine magnesium electrodes (Figure 8). This layer became more apparent with each experiment, and so, the effect the layer had on the system was investigated.
There is a significant change in the overall impedance due to the formation of the black coating in Figure 9a. The charge resistance before the formation of the black layer (~1200 Ω) is higher compared to resistance after the formation of the black layer (~700 Ω). The black layer seems to reduce the charge transfer resistance, causing a subsequent reduction in impedance but introducing a new process with its own time constant, which can be seen by the additional semicircle formed in the high-frequency range. This new process could be indicative of the black coating formation. In Figure 9b, the increased number of charge carriers (25 wt%) results in a general reduction in impedance compared to Figure 9a. However, there is an observed increase in charge transfer resistance after the formation of the layer. Here also, there is a noticeable new process in the higher frequency range. Further increasing the charge carriers (50 wt%; Figure 9c) causes a significant increase in both the charge transfer and interfacial resistance, with the new process becoming more prominent. It could be that this layer is made from the Mg-Alg in the electrolyte, which would reduce the amount of charge carriers, hence increasing the resistance. This would also explain why the layer seems to improve charge kinetics (decreasing interfacial resistance) in lower concentration (2 wt% and 25 wt%) electrolytes.
The blue EIS curves for 2 wt%, 25 wt%, and 50 wt% indicate that an increase in the amount of charge carriers (from 2 to 25 wt%) in the electrolyte to some extent is beneficial for reducing interfacial resistances; however, continued increase (50 wt%) in the amount of charge carriers causes a substantial increase in the ionic resistance, implying that the ionic conductivity of the electrolyte plays a major role in improving the interfacial resistances of the cell.

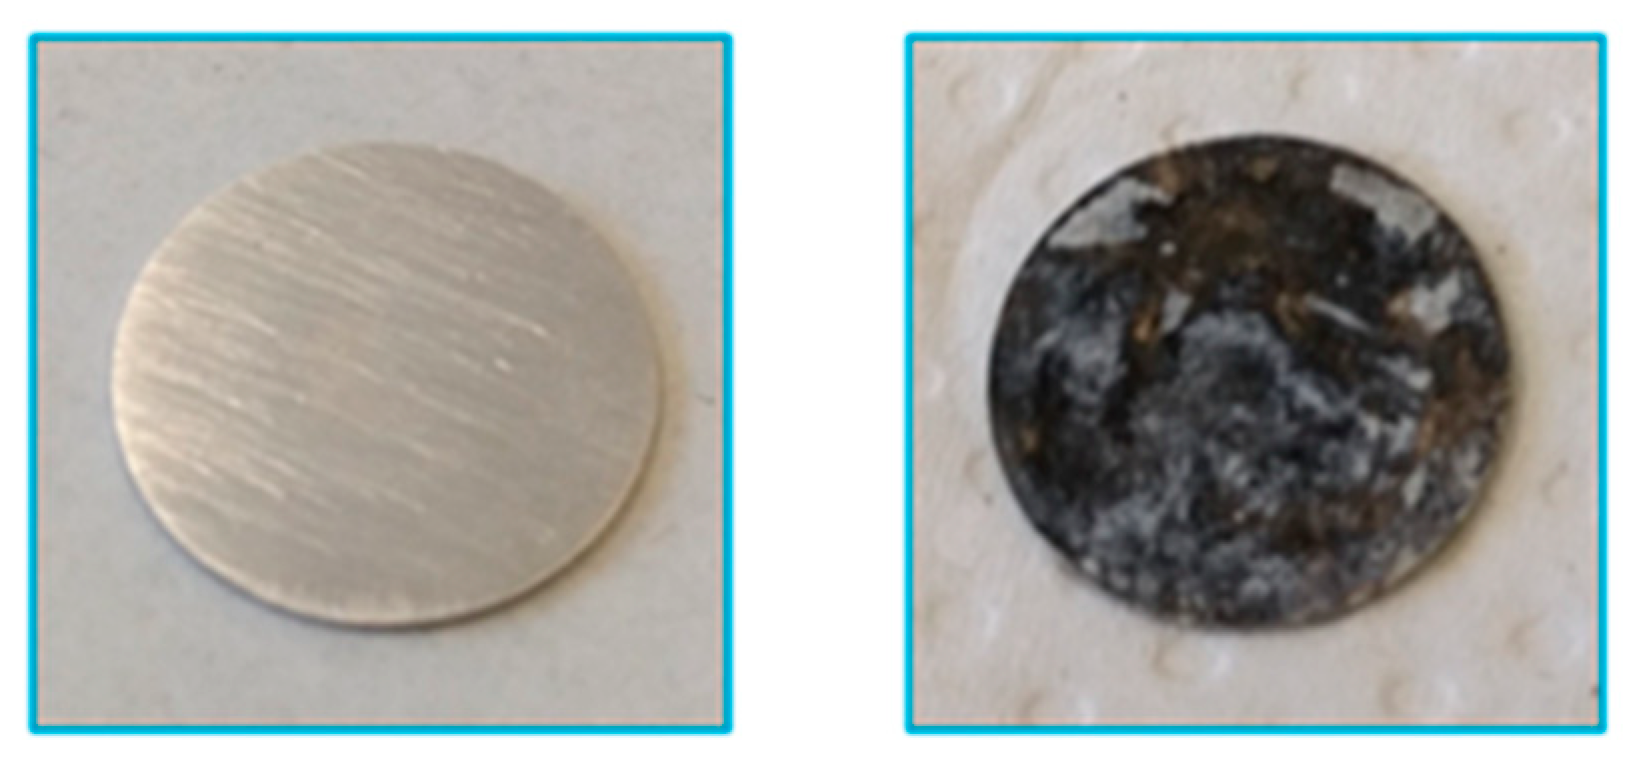
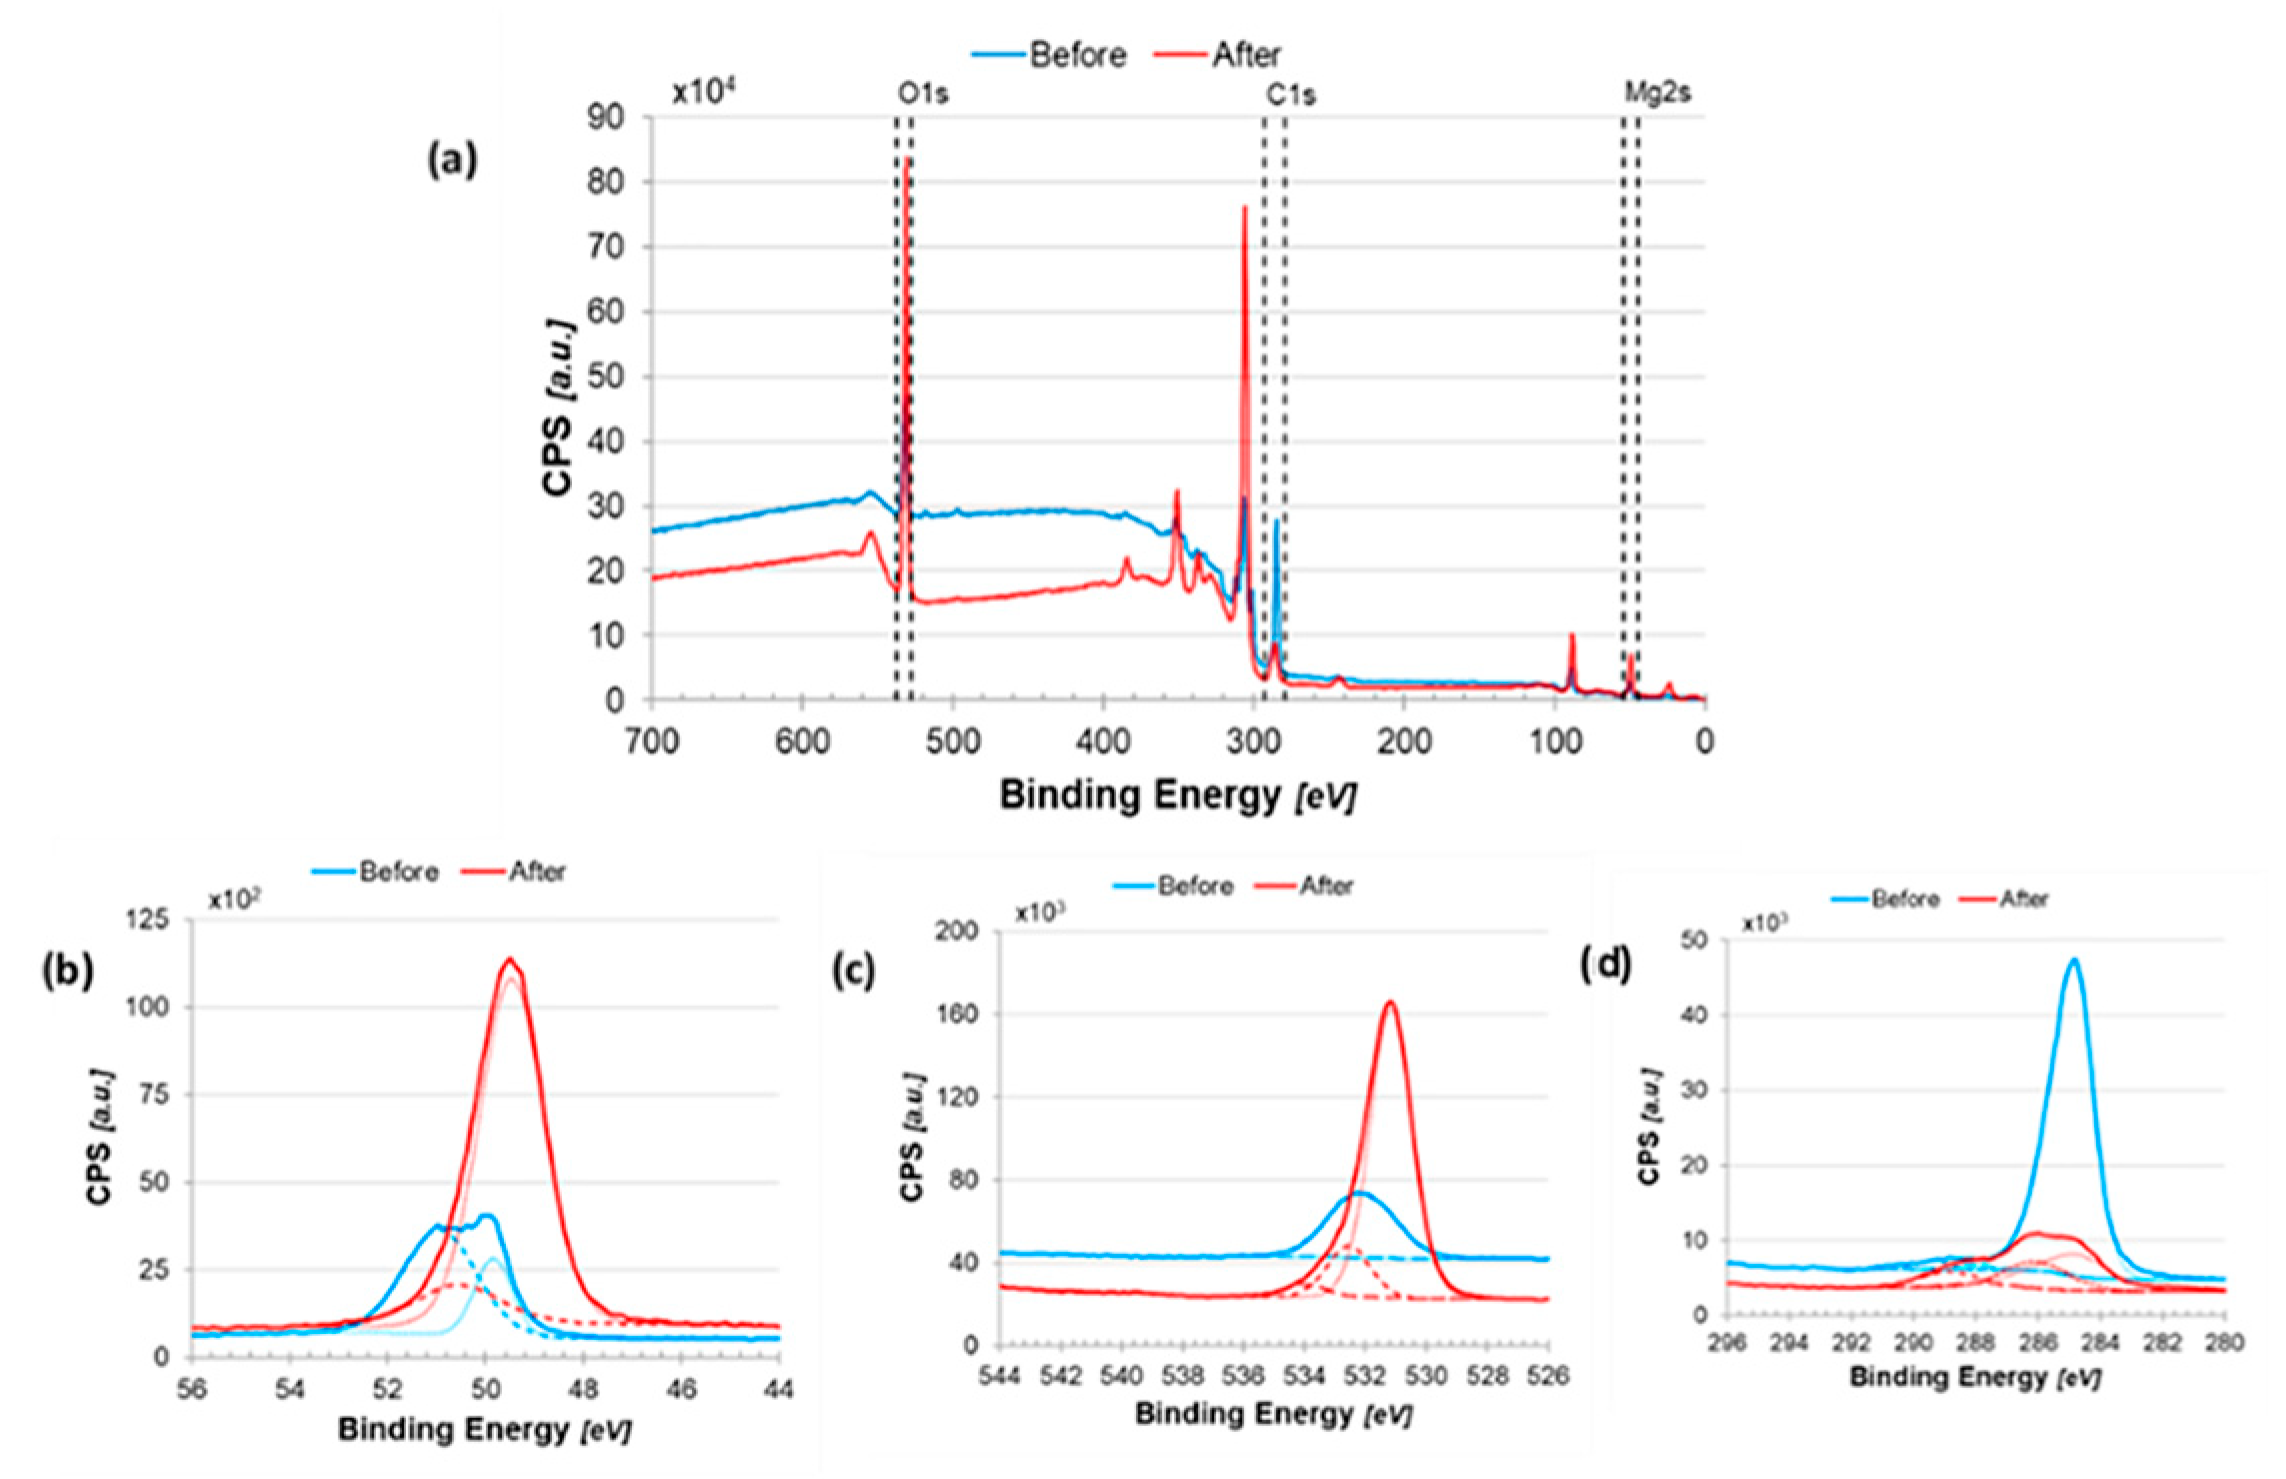
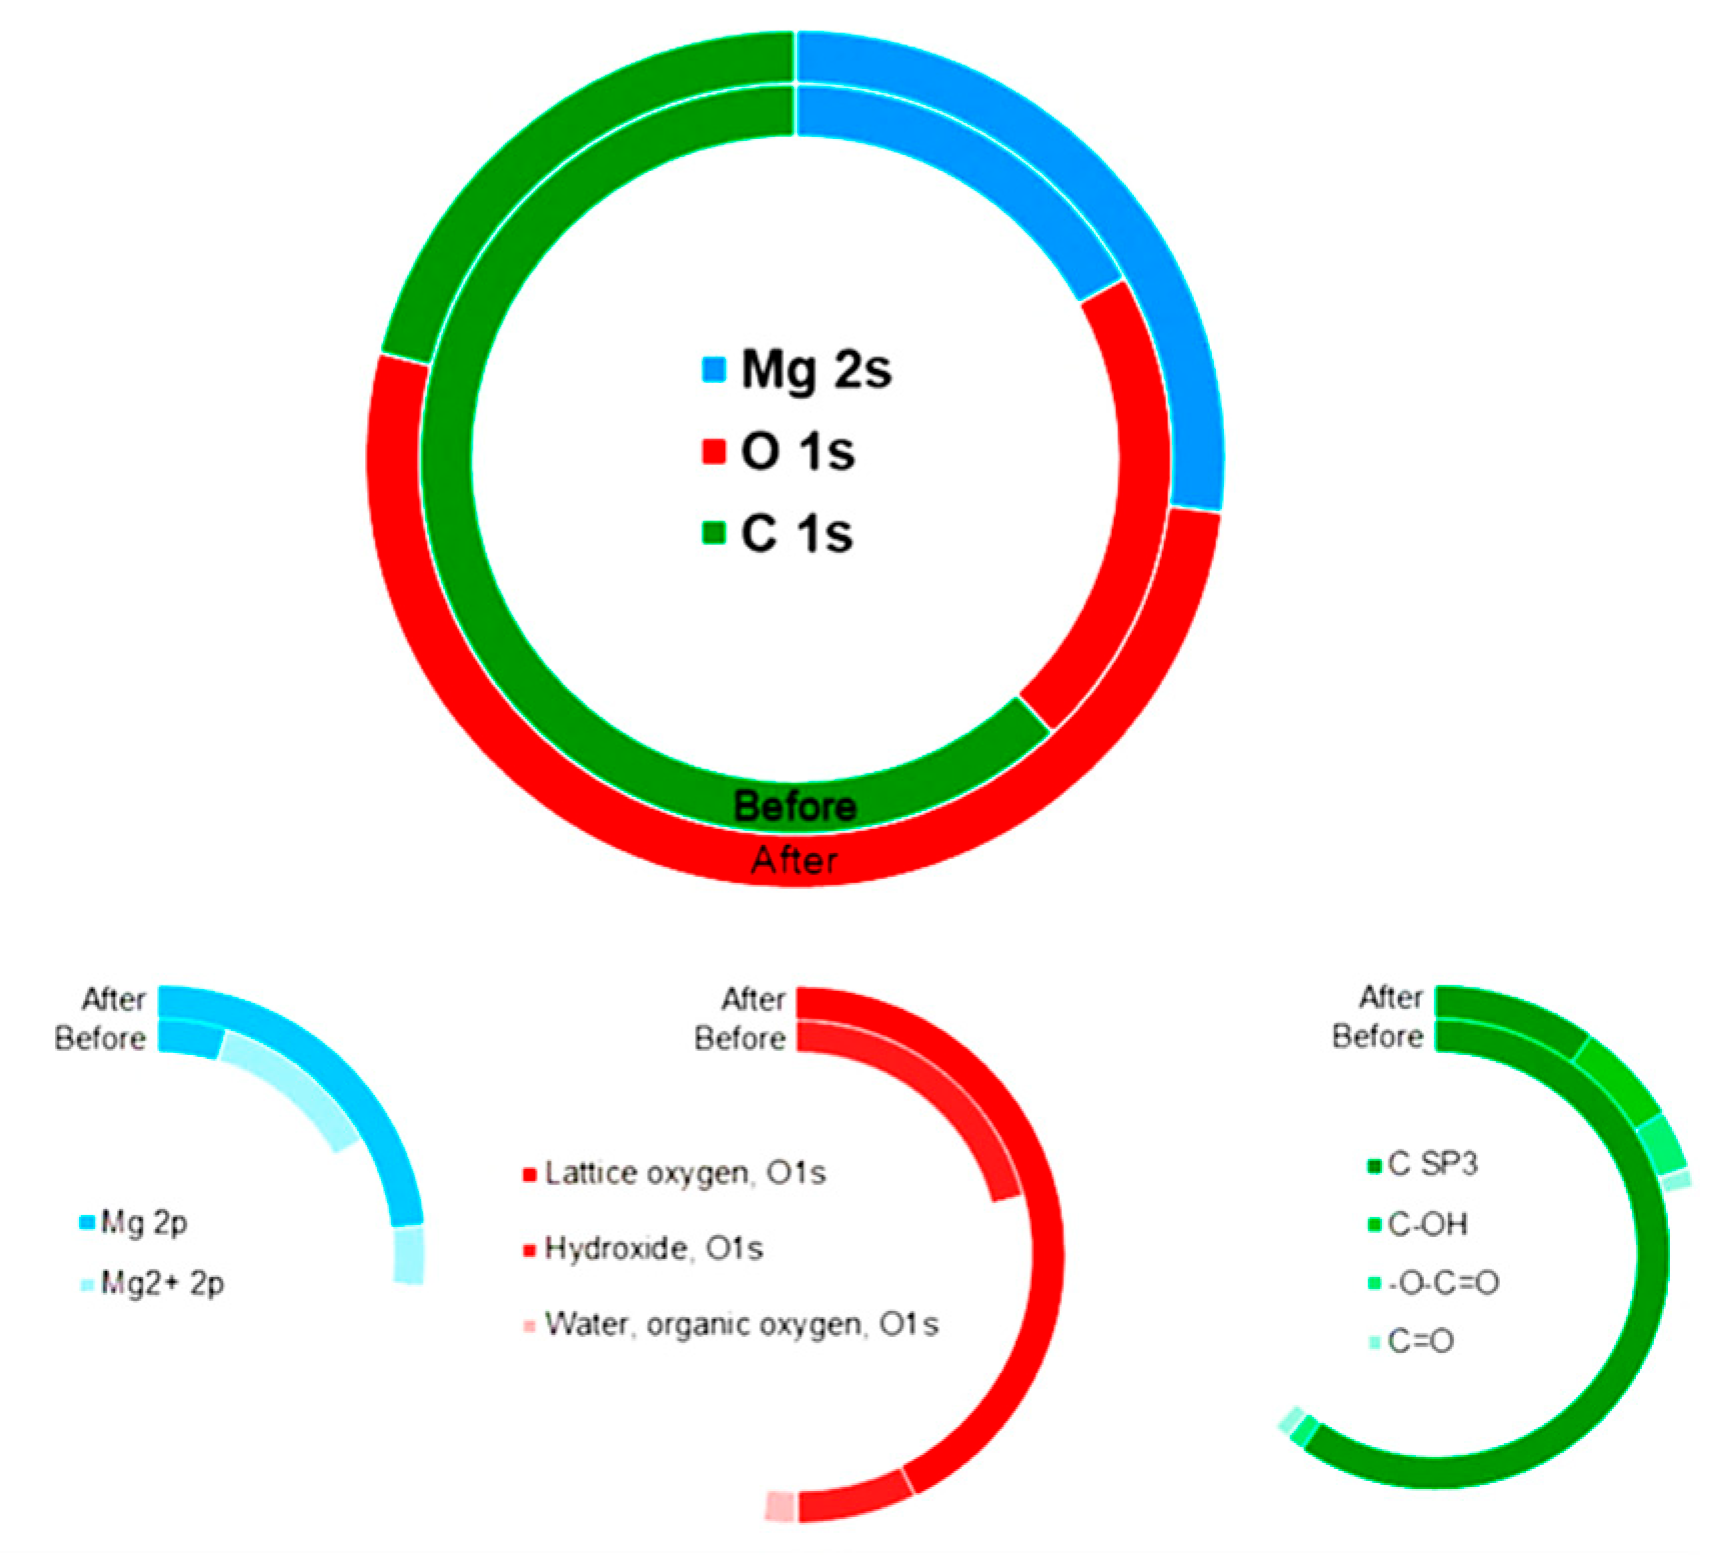
2.2.4. Surface Analysis Using X-Ray Photoelectron Spectroscopy (XPS)

XPS was used to determine the surface chemistry of the magnesium plate before black layer formation (blue) and then also after black layer formation (red) (Figure 10). A basic elemental analysis was performed as well as a more detailed analysis of the oxygen, magnesium, and carbon bonds on the layer (Figure 11).
The relative ratios of C 1s:O 1s:Mg 2s change drastically after EIS (before: 62:21:17 vs. after: 21:52:27) (Figure 11). The magnesium at the surface before black layer formation consists mainly of magnesium hydroxide bonds with a small amount of metallic magnesium, compared to after black layer formation, when it consists mainly of metallic magnesium with a small amount of magnesium bound to oxygen (more magnesium oxide than magnesium hydroxide). The carbon (bonded mainly in the ‘C-C’ configuration) present on the electrode before EIS is unexpected and may be due to some contamination during testing. Conversely, the carbon present on the electrode after EIS contains ‘C-C’, ‘O-C=O’, ‘C-OH’, which are bonds indicative of an alginic structure. This suggests that the black layer formed on the electrodes after EIS has an alginate structure and would explain the improved charge kinetics observed by the EIS experiments after the formation of the black layer. However, further analysis of the black layer is required to provide a definitive conclusion about its structure.

3. Experimental

3.1. Materials and Methods

XRD was performed with an X’Pert Pro PANalytical diffractometer. PDF analysis was conducted with PDF-getX3 and Highscore software. FTIR was performed with a Thermo Scientific Nicolet iS50 FTIR spectrometer. EIS was performed with a Metrohm Autolab PGSTAT12 potentiostat/galvanostat. XPS was performed with a Thermo Scientific K-Alpha spectrometer.
Magnesium alginate was synthesized using alginic acid (Alg-acid; Sigma Aldrich, Burlington, MA, USA) and magnesium hydroxide (Mg(OH)2; Sigma Aldrich). The Alg-acid used had a composition of 61% M-block residues and 39% G-block residues.

3.2. Synthesis of Magnesium Alginate

Alginic acid (1 g) was added to a round-bottom flask together with water. The solution was left to stir overnight. Following this, magnesium hydroxide (0.049 g for the ‘standard ratio’, 0.165 g for the ‘Extra Mg ratio’) was added to the solution. The solution was left to stir overnight again. After reaction completion, the solution was transferred to a beaker and left in an oven at 110 °C until all water had evaporated. The remaining solid was crushed with a mortar and pestle to yield a fine powder.
G-monomers have a higher affinity for binding cations. This was used to synthesize two different magnesium alginates. One where only the G-monomers are bound to magnesium (standard ratio) and one where all monomers are bound to magnesium (extra Mg ratio).

3.3. Pair Distribution Function (PDF)

The X-ray diffraction measurements were carried out with a PANalytical Empyrean Alpha 1 diffractometer, with a silver X-ray tube as a source with a wavelength (λ) of 0.559 Å, as this provides a large Q-window, compared to, for instance, a copper source. This is necessary to achieve a high-resolution pair distribution function, as the Fourier transform integral is thus conducted over a larger interval—a maximum 2θ of 140° and a λ of 0.559 Å result in Qmax = 21.1 Å−1.
Measurements were performed on Mg-Alg powder in a glass capillary and an empty capillary for subtracting the contribution of the glass. The measurements were conducted in a time span of 20 h. In order to obtain a pair distribution function (PDF), the X-ray diffraction measurement data are collected and then processed in the program ”PDFgetX3”. This program has a built-in option to subtract the background diffraction pattern, which in our case is the glass capillary.
When configuring the program ”PDFgetX3”, the following parameters were chosen: a minimum Q-value of 0.8 Å−1, as Q-values smaller than 0.8 showed too much noise. The maximum Q-value is determined by the wavelength of the X-rays and the maximum angle that is measured, which gave Qmax = 21.1 Å−1. The maximum frequency in the so-called F(Q) correction polynomial was set to 1.7.

3.4. Modeling

Modeling was then performed using the GROMOS software (GROMOS11), where Lennard-Jones parameters (LJ parameters) must be chosen such that the ion reproduces several structural and thermodynamic data sources, like ion-to-oxygen distance in water, first shell coordination number (CN), and hydration free energy [25]. The LJ parameter of Mg2+ is well defined by the GROMOS force field. A detailed description of the simulations is provided in the Supporting Information. The structure of an alginate chain used in the simulation consists of 12 G-monomers. M-monomers were not considered since they are not involved in the formation of the egg box structured cavities where the cation can reside. To avoid the presence of chain-end effects during the simulation, the chain is made infinitely long by linking the two terminal monomers, using periodic boundary conditions. This might eliminate chain-end effects, and may introduce restrictions regarding the longitudinal and torsional flexibility of the chain, where actually the longitudinal effects are expected to be limited since the persistence length of the polymer is about 40 residues [22]. Notice that the persistence length is defined as the distance over which the correlation in the direction of the tangent is lost and is exponentially decaying. Because the chain consists of only 12 monomers, which is significantly shorter than the persistence length, a rigid rod can approximate the chain’s behavior. Also, the effect on torsional flexibility is expected to be minimal since the 12 monomers are compatible with two- and three-fold helix structures [24]. The polymer structure was created using POLYS 2.0 software [26].
To determine the structural and ionic properties of Mg2+ in multiple aqueous environments, four simulations with different water contents were carried out. The H2O:Mg2+ ratios considered were: 0, 6, 12, and 24. As explained in the Supporting Information, three simulation boxes are used to cope with computational time.

4. Conclusions

We have investigated the use of magnesium alginate as an electrolyte for magnesium batteries. We have successfully synthesized and characterized magnesium alginate by FTIR and XRD; no residual magnesium hydroxide is in the samples. PDF measurements show an elongated bond length between Mg2+ and alginate, which already indicates a weaker bond. Calculations with the GROMOS force field confirm this; when water is introduced into the system, the magnesium almost completely dissociates from the alginate. Ionic conductivity of magnesium was proven with EIS (1.8 mS/cm for 2 wt% Mg-Alg); higher concentrations of alginate result in lower conductivities. When in a high-concentration regime, conductivity becomes temperature-dependent and increases with higher temperatures. The black layer that was formed during the conductivity experiments was analysed by XPS, which indicated that the layer comprised alginate derivatives. Overall, we can conclude that magnesium alginate is a promising and interesting electrolyte for magnesium batteries. It can be used in different concentrations, and we see the development of a passivation layer that can improve the performance of the electrolyte. The hydrogel-like material can be used as a ‘water-in-salt’ system. Although not discussed in this paper, we are currently already working on finding suitable electrode materials to produce the first batteries that use magnesium alginate as an electrolyte.

Supplementary Materials

The following supporting information can be downloaded at https://www.mdpi.com/article/10.3390/batteries11010016/s1, Figure S1: X-ray diffraction data from Mg-Alg in Q-space, with the background subtracted; Figure S2: The reduced structure function F(Q) of Mg-Alg; Table S1: Computational boxes used in MD simulations; Table S2: Simulation parameters for determination of structural and ionic properties of Mg2+ ions in alginate. The used box, H2O:Mg2+ ratio, timestep Δt, thermostat algorithm: Berendsen (B) or Nosé-Hoover (NH), thermostatic and barostatic relaxation times τT and τP and the reaction-field permittivity εRF; Figure S3: XRD result for magnesium hydroxide, brucite, 04-011-5938; Figure S4: Arrhenius plot of electrolytes at different concentrations; Figure S5. The conductivity measurements performed with non-blocking electrodes. Usually, the electrolyte conductivity is measured with blocking electrodes, but it is also possible with non-blocking electrodes. A simplified equivalent circuit for a non-blocking and blocking electrode is shown here, and the analysis of the electrolyte resistance (Re), reflecting the electrolyte conductivity, remains the same as measured at high frequencies as we did in our experiments.

Author Contributions

Methodology, M.C.K.; Software, C.G.T.H.; Formal analysis, M.C.K.; Investigation, M.C.K., W.M.J.B. and C.G.T.H.; Writing—original draft, M.C.K. and L.K.K.; Writing—review & editing, L.K.K., W.J.L. and E.M.K.; Supervision, L.K.K. and E.M.K. All authors have read and agreed to the published version of the manuscript.

Funding

This work was funded by the Netherlands Organization for Scientific Research (NWO) and by the Materials for Sustainability project SPEAR under Grant No. 739.017.012 in cooperation with Shell Global Solutions Int. BV, Amsterdam, Netherlands (Guy Verbist, Wouter Hamer, and Nick Menegazzo).

Data Availability Statement

The original contributions presented in the study are included in the article, further inquiries can be directed to the corresponding author.

Acknowledgments

The authors thank Theodosios Famprikis for the PDF measurements and Jouke Heringa for the GROMOS modeling.

Conflicts of Interest

The authors declare no conflict of interest.

References

  1. You, C.; Wu, X.; Yuan, X.; Chen, Y.; Liu, L.; Zhu, Y.; Fu, L.; Wu, Y.; Guo, Y.-G.; Van Ree, T. Advances in Rechargeable Mg Batteries. J. Mater. Chem. A 2020, 8, 25601–25625. [Google Scholar] [CrossRef]
  2. Kotobuki, M.; Yan, B.; Lu, L. Recent Progress on Cathode Materials for Rechargeable Magnesium Batteries. Energy Storage Mater. 2023, 54, 227–253. [Google Scholar] [CrossRef]
  3. Dominko, R.; Bitenc, J.; Berthelot, R.; Gauthier, M.; Pagot, G.; Di Noto, V. Magnesium Batteries: Current Picture and Missing Pieces of the Puzzle. J. Power Sources 2020, 478, 229027. [Google Scholar] [CrossRef]
  4. Johnson, I.D.; Ingram, B.J.; Cabana, J. The Quest for Functional Oxide Cathodes for Magnesium Batteries: A Critical Perspective. ACS Energy Lett. 2021, 6, 1892–1900. [Google Scholar] [CrossRef]
  5. Yoo, H.D.; Shterenberg, I.; Gofer, Y.; Gershinsky, G.; Pour, N.; Aurbach, D. Mg Rechargeable Batteries: An on-Going Challenge. Energy Environ. Sci. 2013, 6, 2265. [Google Scholar] [CrossRef]
  6. Winter, M.; Barnett, B.; Xu, K. Before Li Ion Batteries. Chem. Rev. 2018, 118, 11433–11456. [Google Scholar] [CrossRef] [PubMed]
  7. Lu, Z.; Schechter, A.; Moshkovich, M.; Aurbach, D. On the Electrochemical Behavior of Magnesium Electrodes in Polar Aprotic Electrolyte Solutions. J. Electroanal. Chem. 1999, 466, 203–217. [Google Scholar] [CrossRef]
  8. Yagi, S.; Tanaka, A.; Ichikawa, Y.; Ichitsubo, T.; Matsubara, E. Effects of Water Content on Magnesium Deposition from a Grignard Reagent-Based Tetrahydrofuran Electrolyte. Res. Chem. Intermed. 2014, 40, 3–9. [Google Scholar] [CrossRef]
  9. Shen, Y.; Liu, B.; Liu, X.; Liu, J.; Ding, J.; Zhong, C.; Hu, W. Water-in-Salt Electrolyte for Safe and High-Energy Aqueous Battery. Energy Storage Mater. 2021, 34, 461–474. [Google Scholar] [CrossRef]
  10. Suo, L.; Borodin, O.; Gao, T.; Olguin, M.; Ho, J.; Fan, X.; Luo, C.; Wang, C.; Xu, K. “Water-in-Salt” Electrolyte Enables High-Voltage Aqueous Lithium-Ion Chemistries. Science 2015, 350, 938–943. [Google Scholar] [CrossRef] [PubMed]
  11. Leong, K.W.; Pan, W.; Wang, Y.; Luo, S.; Zhao, X.; Leung, D.Y.C. Reversibility of a High-Voltage, Cl–-Regulated, Aqueous Mg Metal Battery Enabled by a Water-in-Salt Electrolyte. ACS Energy Lett. 2022, 7, 2657–2666. [Google Scholar] [CrossRef]
  12. Shapiro, Y.E. Structure and Dynamics of Hydrogels and Organogels: An NMR Spectroscopy Approach. Prog. Polym. Sci. 2011, 36, 1184–1253. [Google Scholar] [CrossRef]
  13. McConville, P.; Whittaker, M.K.; Pope, J.M. Water and Polymer Mobility in Hydrogel Biomaterials Quantified by 1H NMR:  A Simple Model Describing Both T1 and T2 Relaxation. Macromolecules 2002, 35, 6961–6969. [Google Scholar] [CrossRef]
  14. El Hariri El Nokab, M.; Lasorsa, A.; Sebakhy, K.O.; Picchioni, F.; van der Wel, P.C.A. Solid-State NMR Spectroscopy Insights for Resolving Different Water Pools in Alginate Hydrogels. Food Hydrocoll. 2022, 127, 107500. [Google Scholar] [CrossRef]
  15. Lee, K.Y.; Mooney, D.J. Alginate: Properties and Biomedical Applications. Prog. Polym. Sci. 2012, 37, 106–126. [Google Scholar] [CrossRef] [PubMed]
  16. Kiriinya, L.K.; Kwakernaak, M.C.; Van den Akker, S.C.D.; Verbist, G.L.M.M.; Picken, S.J.; Kelder, E.M. Iron and Manganese Alginate for Rechargeable Battery Electrodes. Polymers 2023, 15, 639. [Google Scholar] [CrossRef]
  17. Sikorski, P.; Mo, F.; Skjåk-Bræk, G.; Stokke, B.T. Evidence for Egg-Box-Compatible Interactions in Calcium−Alginate Gels from Fiber X-Ray Diffraction. Biomacromolecules 2007, 8, 2098–2103. [Google Scholar] [CrossRef]
  18. Topuz, F.; Henke, A.; Richtering, W.; Groll, J. Magnesium Ions and Alginate Do Form Hydrogels: A Rheological Study. Soft Matter 2012, 8, 4877. [Google Scholar] [CrossRef]
  19. Kurosawa, R.; Takeuchi, M.; Ryu, J. Fourier-Transform Infrared Analysis of the Dehydration Mechanism of Mg(OH)2 and Chemically Modified Mg(OH)2. J. Phys. Chem. C 2021, 125, 5559–5571. [Google Scholar] [CrossRef]
  20. Papageorgiou, S.K.; Kouvelos, E.P.; Favvas, E.P.; Sapalidis, A.A.; Romanos, G.E.; Katsaros, F.K. Metal–Carboxylate Interactions in Metal–Alginate Complexes Studied with FTIR Spectroscopy. Carbohydr. Res. 2010, 345, 469–473. [Google Scholar] [CrossRef] [PubMed]
  21. Agulhon, P.; Markova, V.; Robitzer, M.; Quignard, F.; Mineva, T. Structure of Alginate Gels: Interaction of Diuronate Units with Divalent Cations from Density Functional Calculations. Biomacromolecules 2012, 13, 1899–1907. [Google Scholar] [CrossRef] [PubMed]
  22. Perić, L.; Pereira, C.S.; Pérez, S.; Hünenberger, P.H. Conformation, Dynamics and Ion-Binding Properties of Single-Chain Polyuronates: A Molecular Dynamics Study. Mol. Simul. 2008, 34, 421–446. [Google Scholar] [CrossRef]
  23. Rutkowska-Zbik, D.; Witko, M.; Fiedor, L. Ligation of Water to Magnesium Chelates of Biological Importance. J. Mol. Model 2013, 19, 4661–4667. [Google Scholar] [CrossRef] [PubMed]
  24. Perić-Hassler, L.; Hünenberger, P.H. Interaction of Alginate Single-Chain Polyguluronate Segments with Mono- and Divalent Metal Cations: A Comparative Molecular Dynamics Study. Mol. Simul. 2010, 36, 778–795. [Google Scholar] [CrossRef]
  25. du Poset, A.M.; Zitolo, A.; Cousin, F.; Assifaoui, A.; Lerbret, A. Evidence for an Egg-Box-like Structure in Iron(II)–Polygalacturonate Hydrogels: A Combined EXAFS and Molecular Dynamics Simulation Study. Phys. Chem. Chem. Phys. 2020, 22, 2963–2977. [Google Scholar] [CrossRef] [PubMed]
  26. Engelsen, S.B.; Hansen, P.I.; Pérez, S. POLYS 2.0: An Open Source Software Package for Building Three-Dimensional Structures of Polysaccharides. Biopolymers 2014, 101, 733–743. [Google Scholar] [CrossRef]
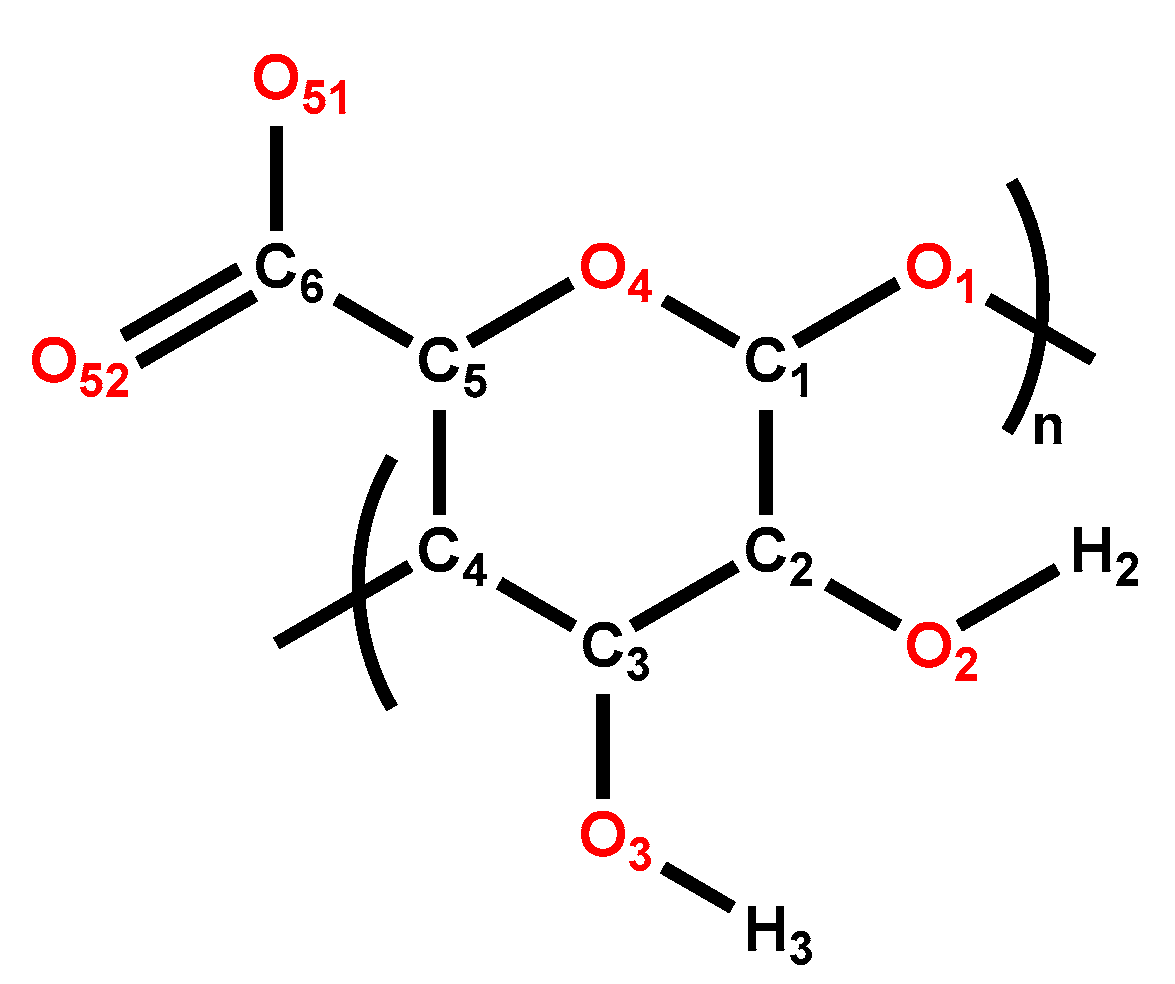
Figure 1. Schematic overview of Mg2+ ‘hopping’ between carboxylates.
Batteries 11 00016 g001
Figure 2. XRD results of Mg-Alg and the initial reagents.
Batteries 11 00016 g002
Figure 3. FTIR spectra of the Mg-Alg samples against the Alg-acid.
Batteries 11 00016 g003
Figure 4. (a) X-ray diffraction data from Ca-Alg in 2θ-space. (b) The pair distribution function G(r) of Ca-Alg. (c) X-ray diffraction data from Mg-Alg in 2θ-space. (d) The pair distribution function G(r) of Mg-Alg. The X-ray diffraction data from Ca-Alg and Mg-Alg in Q-space, with the background subtracted, and the reduced structure factor F(Q) of Ca-Alg and Mg-Alg, can be found in the Supporting Information.
Batteries 11 00016 g004
Figure 5. Chemical structure of an alginate residue with numbering of atoms.
Batteries 11 00016 g005
Figure 6. Cell Assembly: (1) External housing; (2) Rubber seal; (3) Clamp; (4) Two electrodes (magnesium plates); (5) Electrolyte and separator.
Batteries 11 00016 g006
Figure 7. (a) Conductivity of electrolytes at different concentrations. (b) Conductivities from Figure 7a converted to activation energies with the Arrhenius equation. Color scheme shows different phases of the material: in solution, hydrogel-like, and solid.
Batteries 11 00016 g007
Figure 8. Pristine magnesium surface compared with surface covered by the black layer after contact with alginate solution.
Batteries 11 00016 g008
Figure 9. EIS Curves: (a) EIS results for the 2 wt% Mg-alginate electrolyte before (blue) and after (red) forming of the black layer. (b) EIS results for the 25 wt% Mg-alginate electrolyte before (blue) and after (red) forming of the black layer. (c) EIS results for the 50 wt% Mg-alginate electrolyte before (blue) and after (red) forming of the black layer.
Batteries 11 00016 g009
Figure 10. (a) Survey analysis of the electrodes before (blue) and after (red) cycling; (b) magnesium 2s scan results; (c) oxygen 1s scan results; and (d) carbon 1s scan results.
Batteries 11 00016 g010
Figure 11. Relative ratios of C 1s: O 1s: Mg 2s found during the different scans with XPS. In the top centre is the survey analysis. The bottom from left to right: Mg2s scan, O1s scan, and C1s scan.
Batteries 11 00016 g011
Table 1. Distribution of the ligand oxygen atoms arising from water and alginate, see Figure 4 and Figure 5.
H2O:Mg2+
Ratio
O51
(Carboxyl)
O52
(Carboxyl)
O3 (Hydroxyl)O2
(Hydroxyl)
O4
(Ether)
O1
(Ether)
O
(H2O)
02.07 ± 0.052.09 ± 0.050.5 ± 0.030.95 ± 0.040.12 ± 0.020.05 ± 0.01-
60.86 ± 0.041.00 ± 0.030.034 ± 0.0070.103 ± 0.0140.007 ± 0.003-4.01 ± 0.01
120.27 ± 0.020.42 ± 0.030.041 ± 0.0090.146 ± 0.016--5.1 ± 0.08
240.062 ± 0.0080.062 ± 0.0080.027 ± 0.0110.094 ± 0.013--5.74 ± 0.07
Disclaimer/Publisher’s Note: The statements, opinions and data contained in all publications are solely those of the individual author(s) and contributor(s) and not of MDPI and/or the editor(s). MDPI and/or the editor(s) disclaim responsibility for any injury to people or property resulting from any ideas, methods, instructions or products referred to in the content.

