Article

Comparative Study on Environmental Impact of Electric Vehicle Batteries from a Regional and Energy Perspective

1
Hubei Key Laboratory of Advanced Technology for Automotive Components, Wuhan University of Technology, Wuhan 430070, China
2
Hubei Collaborative Innovation Center for Automotive Components Technology, Wuhan University of Technology, Wuhan 430070, China
3
Hubei Research Center for New Energy & Intelligent Connected Vehicle, Wuhan University of Technology, Wuhan 430070, China
4
Institute of Advanced Materials and Manufacturing Technology, Wuhan University of Technology, Wuhan 430070, China
*
Author to whom correspondence should be addressed.
Batteries 2025, 11(1), 23; https://doi.org/10.3390/batteries11010023
Submission received: 6 November 2024 / Revised: 2 January 2025 / Accepted: 7 January 2025 / Published: 11 January 2025

Abstract

:
Against the backdrop of the global goal of “carbon neutrality”, the advancement of electric vehicles (EVs) holds substantial importance for diminishing the reliance on fossil fuels, mitigating vehicular emissions, and fostering the transition of the automotive sector towards a sustainable, low-carbon paradigm. The wide application of electric vehicles not only reduces the dependence on non-renewable resources such as oil, but also concurrently effectuates a substantial reduction in carbon emissions within the transportation sector. In the realm of electric vehicles, ternary lithium batteries (NCM) and lithium iron phosphate batteries (LFP) are two widely used batteries. This study examines the resource utilization and environmental repercussions associated with the production of 1 kW ternary lithium batteries and lithium iron phosphate batteries, employing a life cycle assessment (LCA) framework. The importance of clean energy in reducing environmental pollution and global warming potential is revealed by introducing five different power generation types and the regional power generation structure in China into the power battery production process. The findings of the investigation indicate that lithium iron phosphate batteries exhibit pronounced superiority in terms of environmental sustainability, while ternary lithium batteries are more advantageous in terms of performance. The mitigation of environmental pollution associated with battery production can be significantly achieved by the holistic integration of clean energy sources and the systematic optimization of manufacturing processes. Specific interventions encompass enhancing the energy efficiency of the production process, incorporating renewable energy sources for power generation, and minimizing the utilization of hazardous materials. By implementing these strategies, the battery sector can advance towards a more environmentally benign and sustainable trajectory.

1. Introduction

As temporal progressions advance, the trajectory of global warming intensifies, rendering the challenges posed by climate change a paramount concern within the international discourse. To mitigate the environmental impacts associated with global warming, nations have formulated distinct carbon peak and carbon neutral developmental strategies congruent with their respective national contexts [1]. The European Union has already achieved peak carbon in 2000 and aims to achieve carbon neutrality in 2050; the United States aims to achieve net-zero emissions by 2050 [2,3,4,5]. In parallel, China will achieve peak carbon by 2030 and carbon neutrality by 2060 [6,7,8,9]. Against this background, the electric vehicle industry has flourished and become one of the important ways to reduce carbon emissions and promote green development [10]. The following Table 1 and Figure 1 present the historical data and projected trends for China’s new energy vehicle (NEV) production, sales, and market share over the past decade and the forthcoming decade.
Electrochemical energy storage systems, specifically power batteries, are pivotal in facilitating the widespread adoption of electric vehicles. Lithium-ion batteries have emerged as the predominant power source for new energy vehicles, owing to their superior energy density, minimal self-discharge rates, and extended operational lifespan. Among the various types of lithium batteries, ternary lithium batteries (NCM) and lithium iron phosphate batteries (LFP) dominate the lithium battery market [11]. By the end of 2022, ternary lithium batteries (NCM) accounted for 60% of the global electric vehicle battery market, while the use of lithium iron phosphate batteries (LFP) batteries has increased significantly, with their market share growing from 6% in 2020 to 30% in 2022. The extensive manufacturing and pervasive deployment of batteries have introduced significant challenges, particularly in the form of substantial emissions generated during the production process. These emissions exert a profound impact on both the environment and resource availability, necessitating the development of rational strategies by nations to address the concurrent demands of environmental preservation and resource optimization.
Throughout the battery’s life cycle, the energy consumed, particularly in the production phase, is responsible for the largest share of carbon emissions. Battery manufacturers’ data further reveal that the carbon emissions from the production of positive electrode materials are a significant contributor to the overall carbon footprint. Specifically, for NCM (nickel cobalt manganese) batteries, the positive electrode materials are responsible for over 40% of the total carbon emissions throughout the battery’s life cycle, while for LFP (lithium iron phosphate) batteries, this figure stands at 37%.
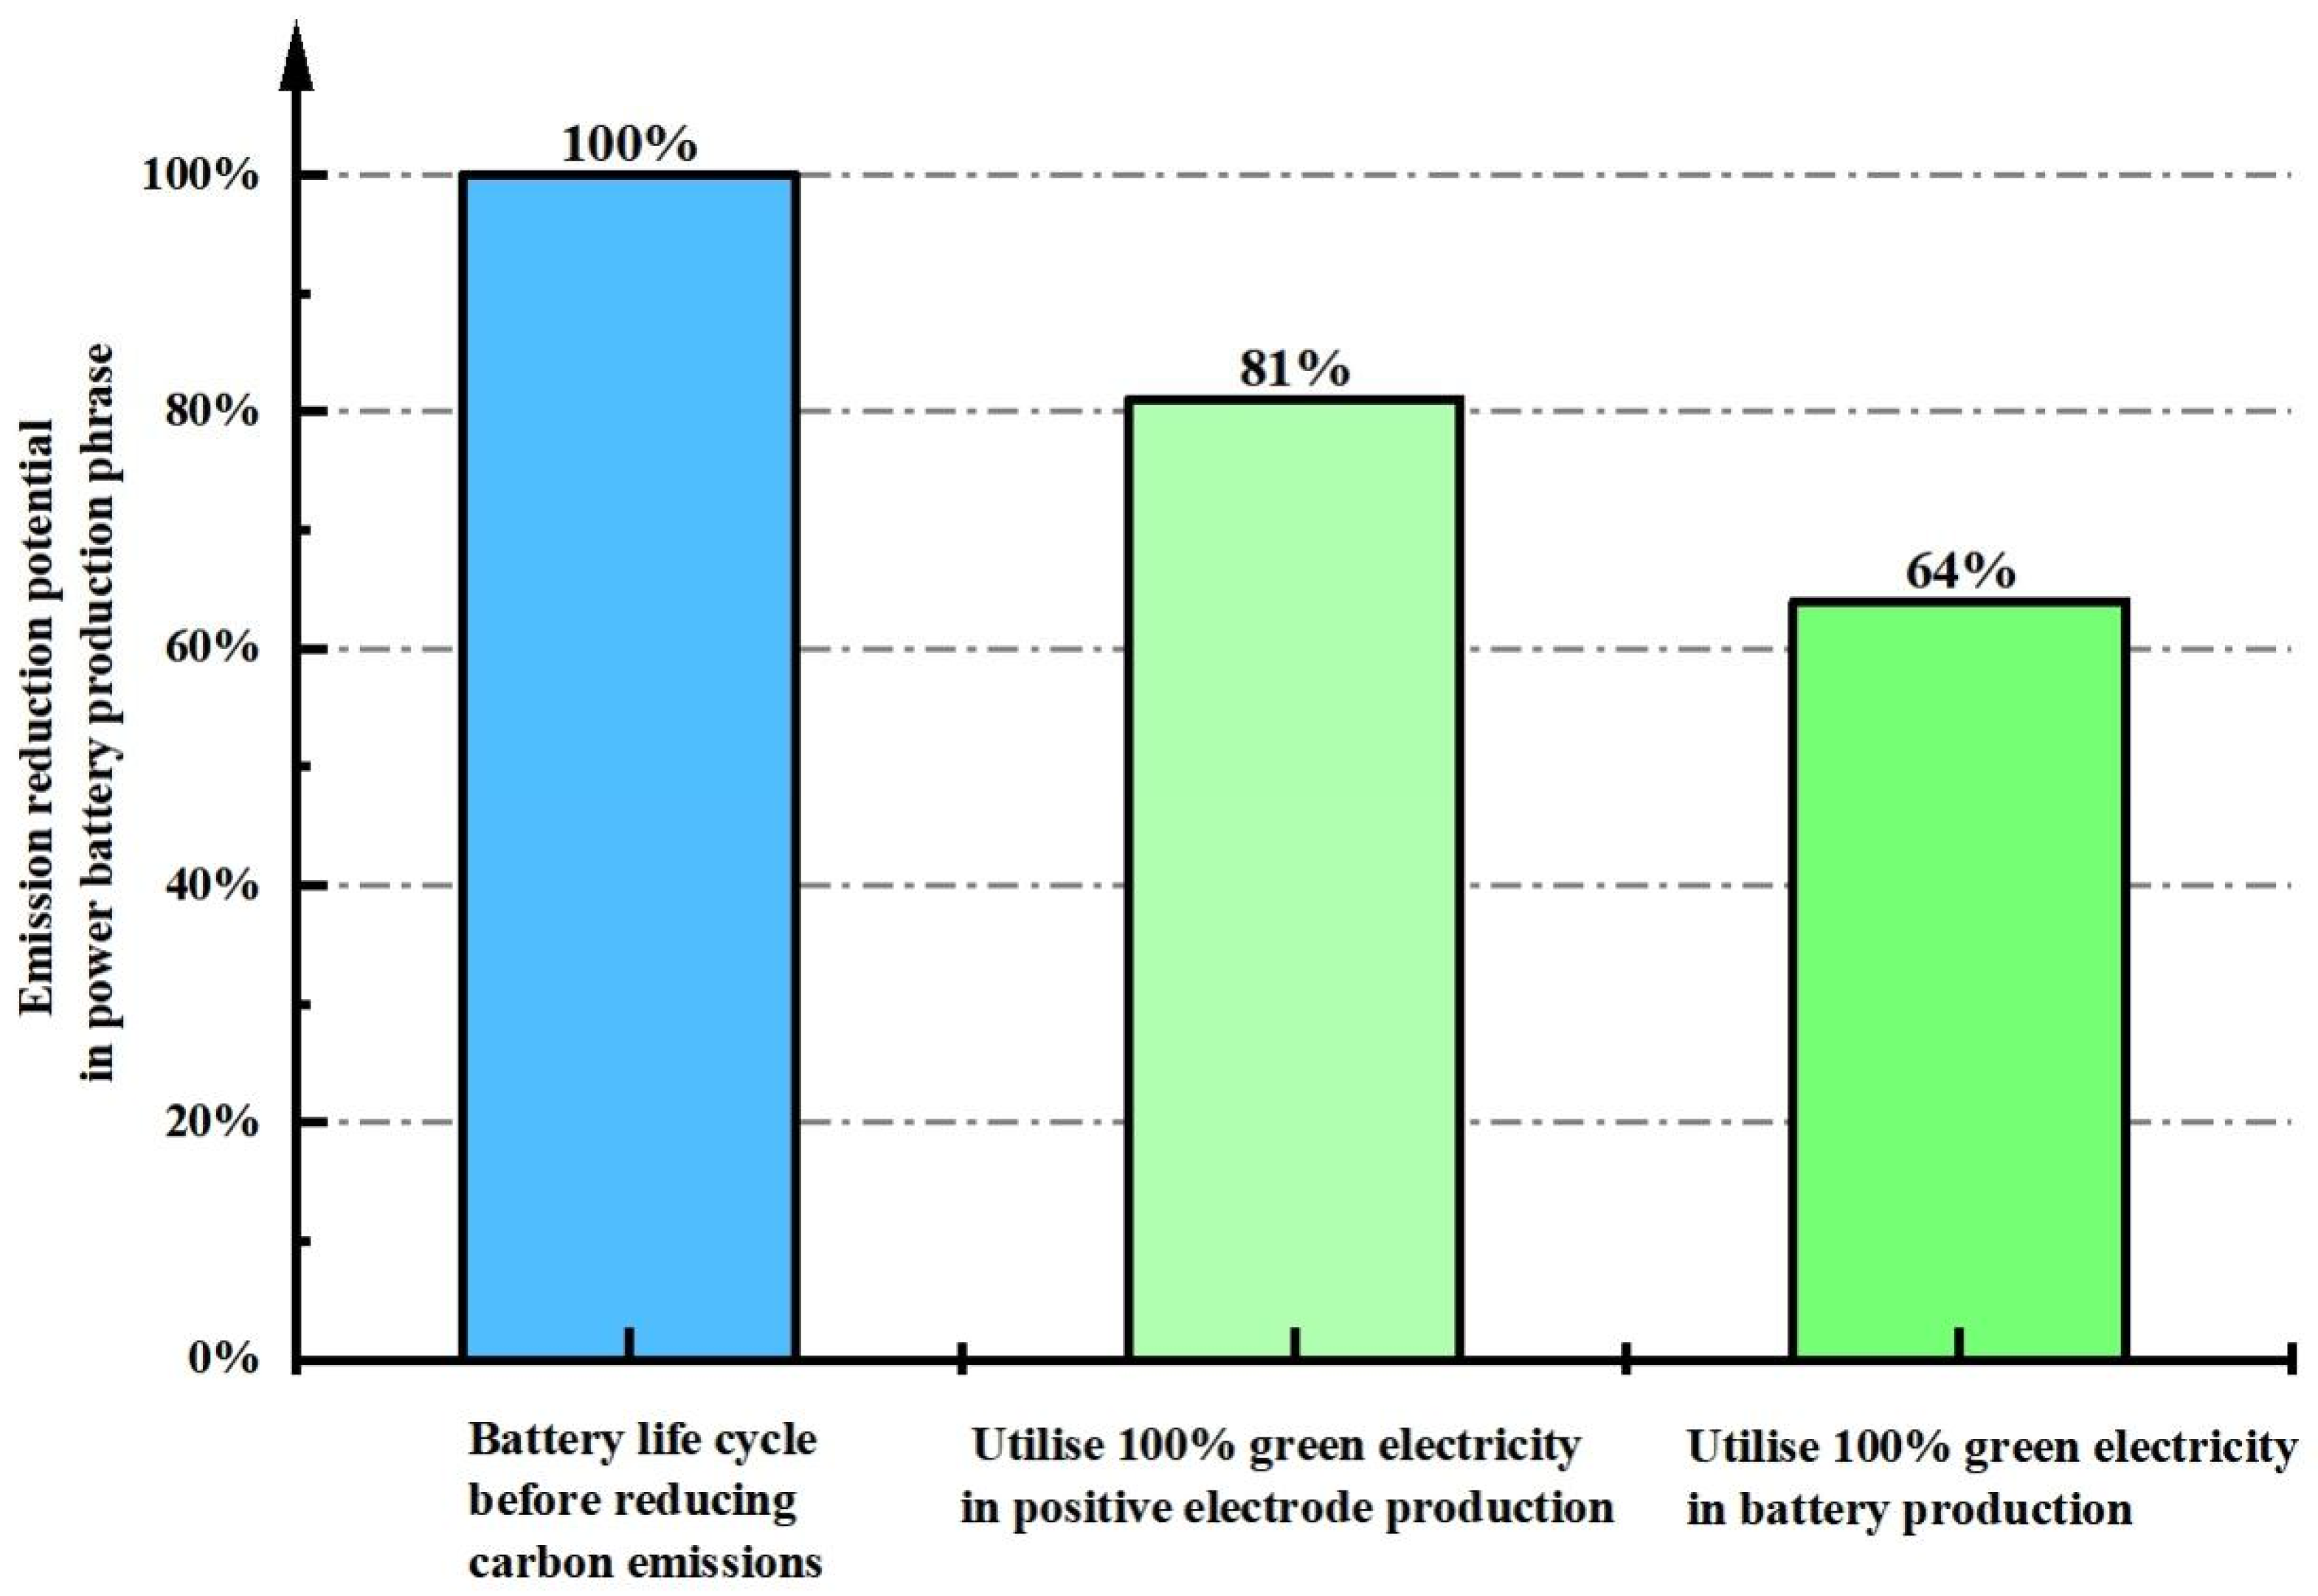
Referencing Figure 2, it becomes evident that integrating green energy into the production process can substantially lower carbon emissions across the entire life cycle. This highlights the production phase as having a more pronounced environmental impact compared to the usage and recycling phases, and it also indicates that the production phase offers the most significant opportunity for emission reductions.
Given these considerations, this study will place a focused emphasis on evaluating the environmental impact of the production process. By doing so, we aim to identify key areas for improvement and implement strategies that will lead to a more sustainable and eco-friendly battery manufacturing industry.
In the assessment of the environmental impacts associated with lithium iron phosphate batteries (LFP) and lithium ternary (NCM) batteries in the product phrase, it is imperative to consider a multifaceted array of factors, including energy consumption in the production process, sustainability of material sources, and battery life. Lithium iron phosphate (LFP) batteries present notable environmental benefits owing to their comparatively straightforward chemical composition, primarily consisting of iron and phosphorus. These materials are devoid of rare or toxic metallic elements, exhibit a relatively high abundance in terms of resource availability, and generate a diminished level of pollution during their manufacturing processes. Furthermore, lithium iron phosphate (LFP) batteries are characterized by an extended lifespan and enhanced tolerance to numerous charge/discharge cycles, thereby mitigating the demand for resources and minimizing waste production.
Conversely, lithium ternary (NCM) batteries exhibit superior energy density and performance metrics; however, their manufacturing process necessitates the utilization of scarce metals and hazardous materials, including nickel and cobalt. The extraction and purification of these metals exert substantial environmental pressures, thereby complicating and elevating the cost of the battery recycling process. The high energy density of NCM batteries provides extended range and enhanced performance, but the associated environmental repercussions necessitate critical consideration.
To address this issue, this study establishes models for a 1 kW-h lithium ternary battery (NCM) and a 1 kW-h lithium iron phosphate battery (LFP) life cycle assessment (LCA) methodology [12,13,14,15,16]. A meticulous examination is conducted to evaluate the resource and environmental impacts associated with the raw material acquisition and battery assembly production processes for both ternary lithium batteries and lithium iron phosphate batteries.
The environmental impacts associated with the production processes of various energy sources utilized in battery manufacturing exhibit substantial variability. The carbon emission coefficients for the five electricity generation techniques are presented in Table 2.
Thermal power, as a conventional method of generating electricity, predominantly relies on fossil fuels, including coal and natural gas, whose carbon dioxide and other pollutants released during the combustion process exert detrimental effects on the environment. In contrast, hydro power, as one of the clean energy sources, utilizes the principle of hydroelectricity generation, thereby eschewing direct greenhouse gas emissions and exhibiting a notably minimal environmental footprint. Wind power, solar power, and nuclear power, as representatives of renewable energy sources, generate negligible greenhouse gas emissions and minimal pollutant discharges, thereby exhibiting a high degree of environmental compatibility. In this study, five power generation structures (thermal, hydro, wind, solar, and nuclear) are integrated into the production framework of power batteries to systematically evaluate the environmental implications of varying energy sources.
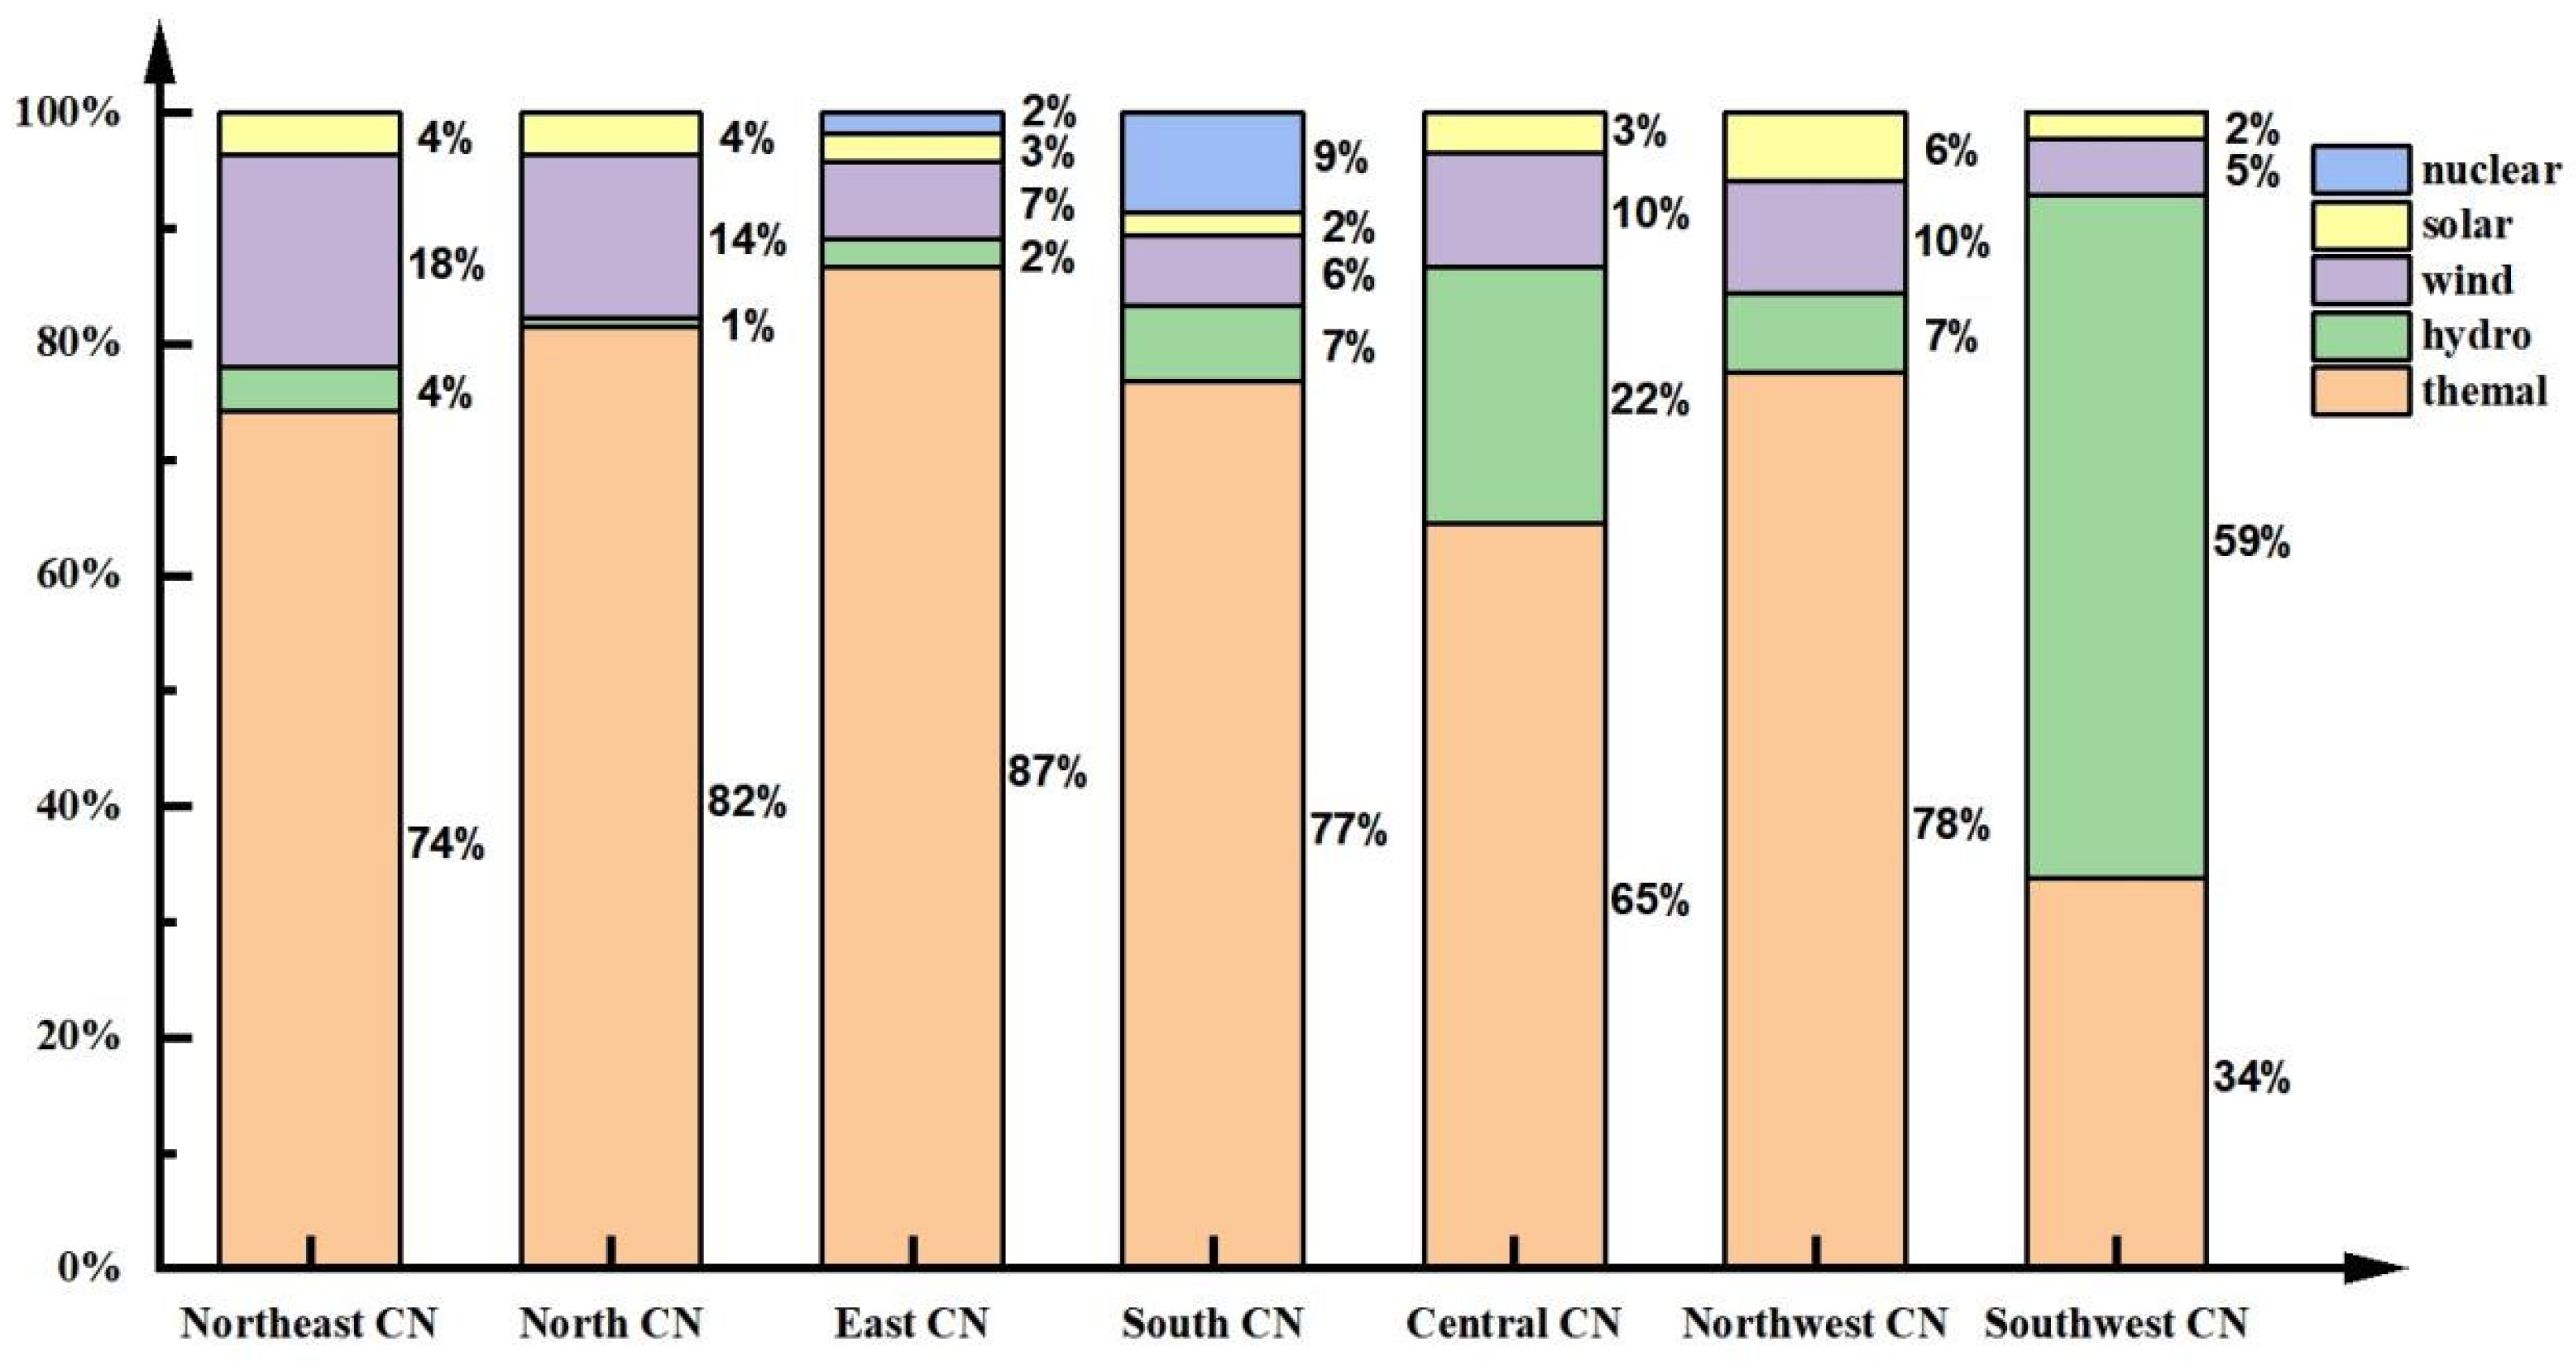
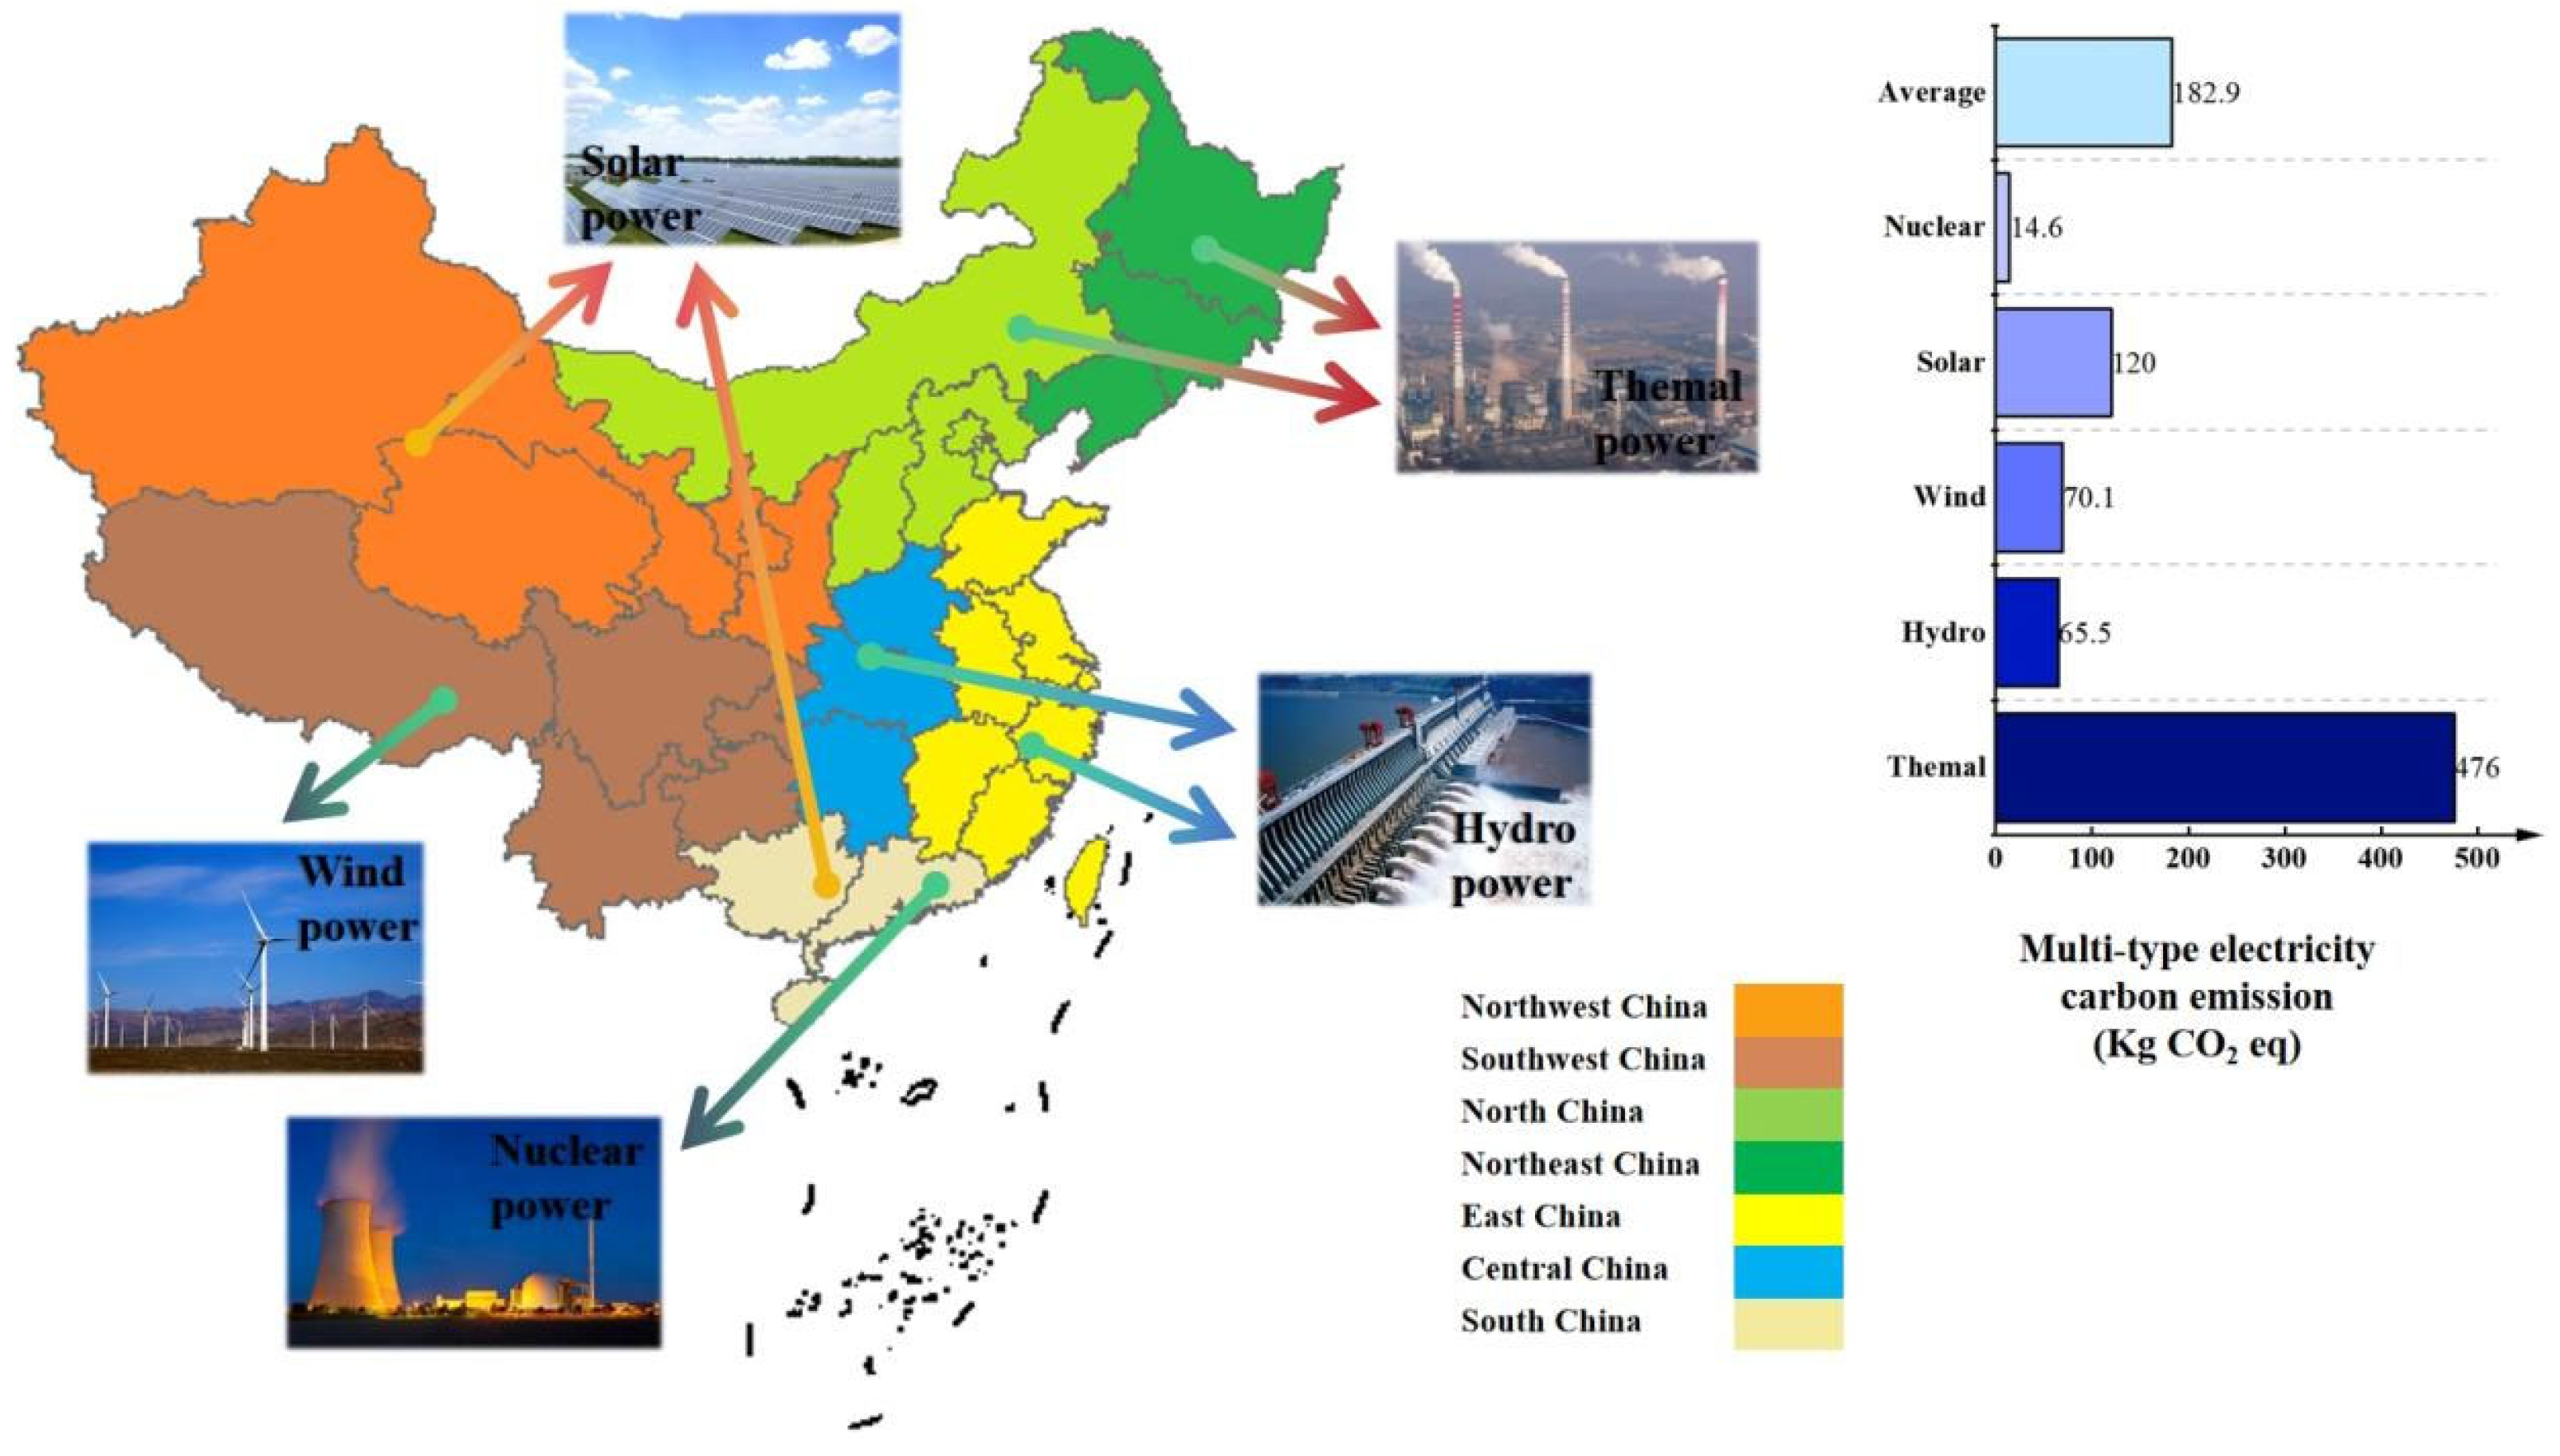
Variations in energy infrastructure and electricity generation methodologies exhibit pronounced regional disparities across diverse geographic zones within China [17]. Figure 3 illustrates the composition of the power generation infrastructure across various regions.
With large coal reserves and good quality, the Northeast and North China regions are important energy bases for thermal power generation. The system delivers consistent and reliable power infrastructure, thereby underpinning the stability and growth of the regional economic framework. Nevertheless, the extensive utilization of thermal power generation results in significant carbon dioxide emissions, as well as environmental degradation, including water and soil contamination. Owing to its strategic geographical positioning and advanced economic status, the eastern region of China exhibits a notably diverse energy portfolio, encompassing thermal, nuclear, and hydroelectric power sources. This diversification has been observed to undergo a consistent annual increase. The eastern region of China is characterized by a dense network of rivers and lakes, which serve as a rich repository for hydroelectric power generation. Notably, the Qingshan Hydroelectric Power Station in Jiangxi Province and its counterpart in Jiangsu Province exemplify significant contributors to the regional energy infrastructure. These facilities collectively generate substantial quantities of renewable energy, thereby supporting both local industrial activities and residential energy needs. Central China predominately relies on coal and natural gas; however, certain regions have successfully harnessed hydroelectric power, exemplified by the development of the Three Gorges Dam in Hubei Province. As one of the world’s most expansive hydroelectric facilities, the Three Gorges Dam is able to provide about 100 billion kilowatt-hours of electricity annually, which plays a key role in diminishing the reliance on coal and augmenting the proportion of renewable, clean energy within the energy mix. South China performs better in terms of environmental friendliness due to its favorable climatic conditions, the extensive proliferation of wind and solar energy infrastructure, and a significantly higher ratio of clean energy utilization. At the same time, the region is concurrently and proactively advancing nuclear power development with a focus on safety and orderliness. Nuclear power, recognized for its efficiency and cleanliness, boasts several key attributes: high energy density, substantial single-unit capacity, high land-use efficiency, and immunity to seasonal and climatic variations. It also offers the benefits of stable and relatively low power generation costs. The integration of nuclear power into the energy mix has significantly bolstered the cleanliness and reliability of South China’s energy infrastructure. This enhancement is instrumental in mitigating environmental pollution, curtailing carbon emissions, and addressing the challenges of climate change. The elevated topography and mountainous landscapes of Southwest China present optimal natural prerequisites for wind energy production. The highlands and mountainous terrain of Southwest China provide superior natural conditions for wind power generation, especially in the Sichuan Basin, the Yunnan Plateau, and the mountainous regions of Guizhou. As a clean energy source, wind power is pivotal in mitigating greenhouse gas emissions and diminishing reliance on conventional fossil fuels. The northwestern region of China presents an optimal locale for the advancement of solar energy infrastructure within the nation, attributable to its distinctive geographical and climatic attributes. Owing to their expansive territories, elevated altitudes, and prolonged durations of solar exposure, these regions exhibit pronounced potential for the exploitation of solar energy resources. China has established several large-scale solar (PV) power plants in Qinghai and Xinjiang, which have become one of the important solar power generation bases in China and the world. In the present investigation, the territorial expanse of China is delineated into seven distinct regions: Northeast China, North China, East China, South China, Central China, Northwest China, and Southwest China. This segmentation is predicated on the unique regional characteristics exhibited by each area. The power generation structure of each region is substituted into the production chain to analyze the environmental impact of carbon emissions from the electricity sources used for the production of EV batteries, respectively.
In the context of contemporary societal advancement, the pervasive issues of water pollution, soil contamination, and atmospheric degradation have elicited widespread concern within the scientific community. Battery production process pollutants directly lead to the destruction of the ozone layer, and the battery production stage of industrial wastewater causes nitrogen, phosphorus, and other nutrient salts in the water to rise, leading to eutrophication of the water body and serious ecological pollution. This paper focuses on the ozone depletion, eutrophication loss, and eco-toxicity loss aspects of the environmental impacts associated with power battery production, and carries out an in-depth analysis.
Through the implementation of a comprehensive structural, regional, and segmental analysis, a precise framework for the future industrial configuration of power batteries is established, thereby fostering the sustainability and green development of the battery industry. This study not only offers insights for producers to enhance their manufacturing methodologies, but also significantly contributes to the attainment of global climate targets and environmental goals.

2. Methodology

2.1. Definition of Objective and Scope

The primary aim of this research is to develop a life cycle assessment (LCA) framework for lithium iron phosphate (LFP) and lithium ternary (NCM) batteries, facilitating a thorough comparative analysis of their resource utilization efficiency and environmental impact profiles. The delineation of the life cycle system boundaries for both LFP and NCM batteries is depicted in Figure 4, encompassing the complete procedural spectrum from raw material extraction, through power battery manufacturing, to the eventual recycling phase process. The investigation centers on the comprehensive analysis of the respective impacts on resource utilization and environmental degradation attributable to various electricity generation sources, specifically thermal power, hydroelectric power, wind energy, solar energy, and nuclear energy, employed in the production process. In the context of China’s regional stratification, this investigation delineates the nation into seven distinct zones: Northeast, North, East, South, Central, Northwest, and Southwest. The study conducts a discrete analysis of the environmental and physiological impacts attributable to the electricity consumption associated with power battery production within each of these regions [18,19]. In the present investigation, both NCM and LFP battery types are examined utilizing 1 kW-h monomer units, with the electric vehicles achieving a cumulative mileage of 200,000 km, as reported in references [20,21,22].

2.2. Life Cycle Inventory Analysis

During the life cycle inventory analysis phase, this investigation incorporates a diverse array of empirical data sources. These encompass data furnished by local enterprises, findings from prior research endeavors, information derived from industry statistical yearbooks, and publicly accessible data originating from governmental regulations and standards. Furthermore, the backend data are predominantly derived from the SimaPro 9.0 software, utilizing the integrated Ecoinvent 3.5 database. Data utilization is categorized into three distinct segments:
(1)
Raw material acquisition and battery assembly production process: constructing LCA models for LFP and NCM power batteries.
(2)
The production process of power batteries: integration and impact analysis of diverse power generation sources (thermal, hydro, wind, and solar) regarding resource utilization and environmental impacts.
(3)
Regional power analysis in China: We substitute the power generation infrastructure of individual regions into the production framework of power batteries and evaluate its implications for resource utilization and environmental impact.
To guarantee the precision and representativeness of the data, meticulous and rigorous methodologies were employed in the organization and analysis processes. Relevant and representative data were systematically extracted, facilitating the construction of comprehensive life cycle assessment (LCA) models encompassing all stages of the life cycles of lithium iron phosphate batteries (LFPs) and ternary lithium batteries (NCMs).
Meanwhile, it is worth noting that during the life cycle impact assessment process of this study, part of the data analysis is aided by artificial intelligence (AI) techniques. AI algorithms are used for efficient screening, classification and preliminary analysis of a large number of complex environmental impact factors to assist in identifying key environmental impact factors and potential pattern associations. However, all preliminary AI-based analysis results have undergone rigorous manual review and in-depth interpretation by the research team to ensure their accuracy and reliability, and have been comprehensively evaluated in combination with expertise to meet the rigor of scientific research.

Power Cell Production

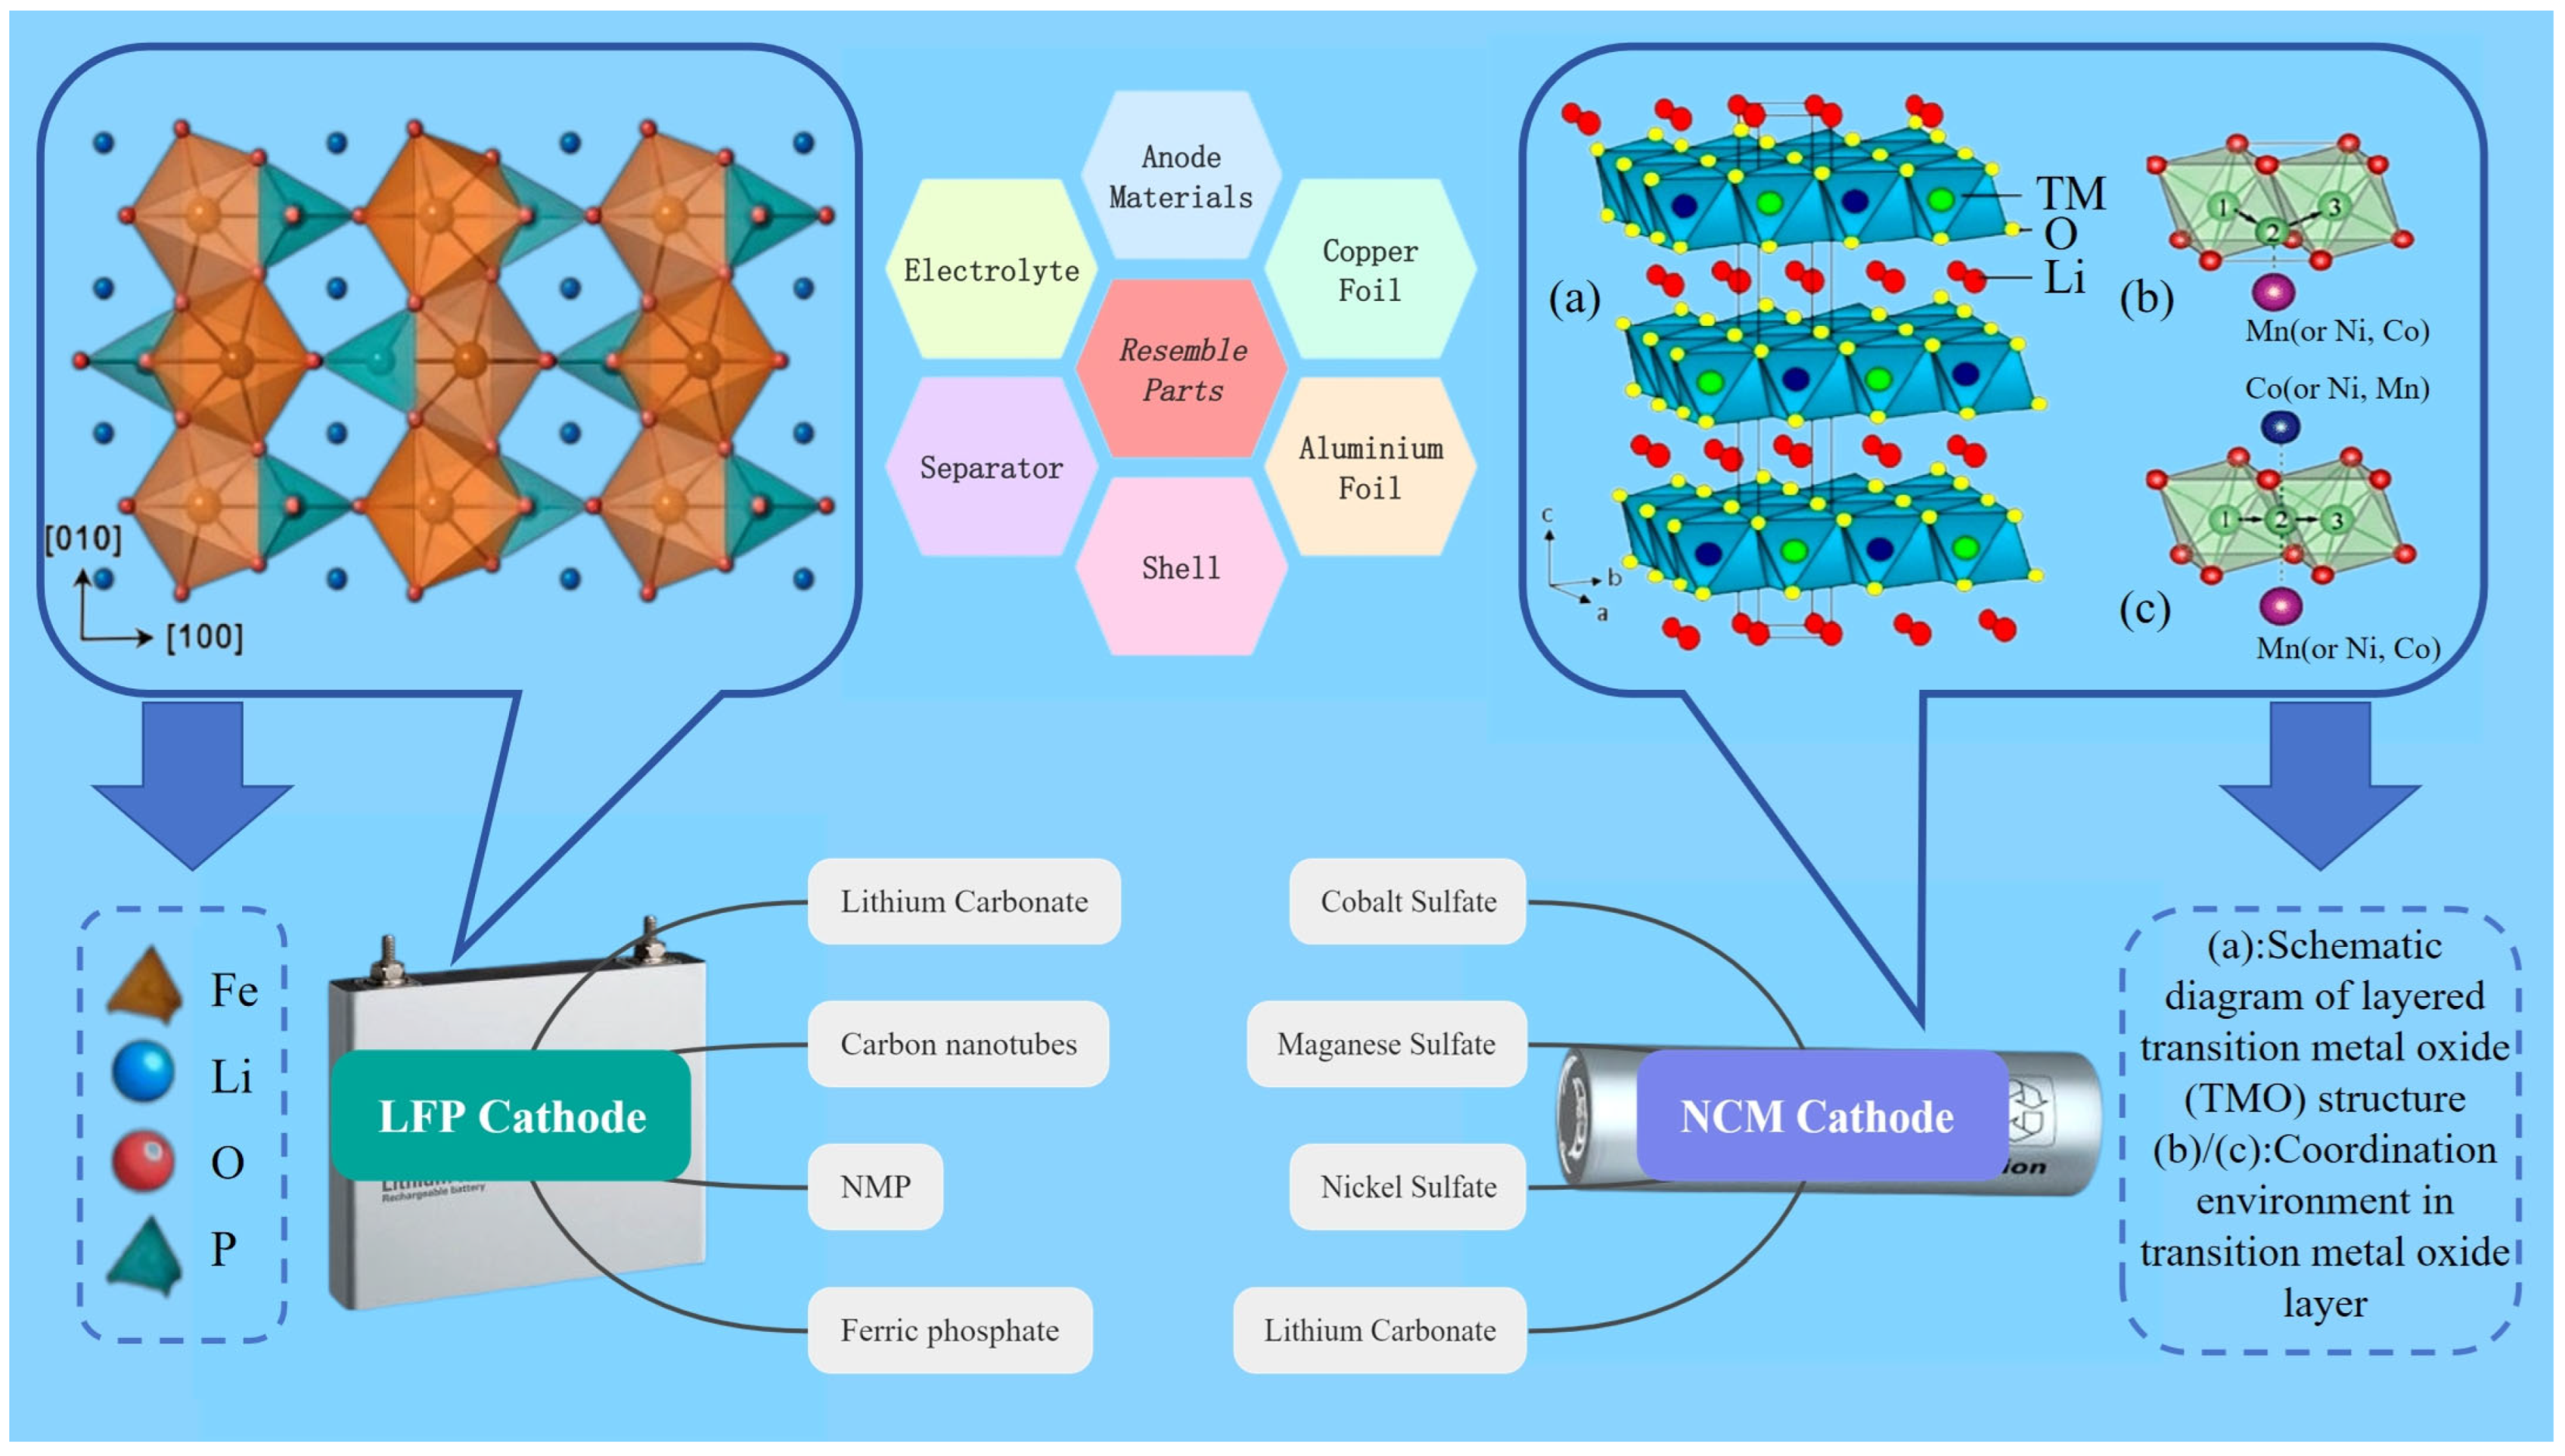
The life cycle inventory analysis of the battery production phase encompasses comprehensive data on the materials required, energy consumption, and emissions generated during the extraction of raw materials, manufacturing of components, and assembly and molding of the batteries. The production processes for LFP and NCM batteries in China exhibit substantial similarities, involving analogous components such as anodes, copper foil, aluminum foil, diaphragms, electrolytes, and casing components as shown in Figure 5. However, the cathode compositions differ distinctively: the LFP battery cathode is composed of an olivine-structured material primarily consisting of iron phosphate and lithium carbonate, which enhances battery safety and stability [23]. In contrast, the cathode of NCM batteries consists of ternary precursors of nickel, cobalt, and manganese metals; sulphate; and lithium carbonate, which form a hexagonal crystal layer structure of the α-NaFeO2 type, a structure that provides high energy density and excellent charging performance [23,24,25]. Additionally, the energy structure within the production phase is meticulously calculated, accounting for the power structure, material mass, and energy flow specific to China. All materials and energy inputs are proportionally aligned with the functional unit of the product. Comprehensive inventory data are provided in Supplementary Material Background Data S1–S25, which detail every facet of the process from mineral resource extraction and transportation and processing of raw materials to the fabrication of battery components and final assembly, ensuring thorough and detailed coverage of the entire life cycle.
A multitude of theoretical equations are integral to the battery production process. This investigation predominantly employs the subsequent pivotal equations to furnish a theoretical foundation for the life cycle model. The symbols pertinent to these equations are delineated in Table 3.
The theoretical capacitance of the electrode material, specifically, assumes that all lithium ions within the material are engaged in the electrochemical reaction. The capacity provision value is determined using the following mathematical expression:
C T = F × n L i M × 1 3.6
LiFePO4 molar mass 157.756 g/mol and its theoretical capacity:
C T 1 = 96500 ( C mol ) × 1 157.756 ( mol g ) × 1 3.6 ( mAh C ) = 170   mAh / g
Ternary material NCM(1:1:1)(Li; Ni; 1/3Co; 1/3Mn; 1/3O2) has a molar mass of 96.461 g/mol and the following theoretical capacity:
C T 2 = 96500 ( C mol ) × 1 96.461 ( mol g ) × 1 3.6 ( mAh C ) = 278   mAh / g
In the graphite anode, the maximum quantity of lithium is intercalated, resulting in the formation of lithium–carbon interlayer compounds, wherein six carbon atoms are associated with one lithium atom. The molar mass of graphite, at 72.066 g/mol, corresponds to a 6C stoichiometry, thereby yielding a maximum theoretical capacity.
C T 3 = 96500 ( C mol ) × 1 72.066 ( mol g ) × 1 3.6 ( mAh C ) = 372   mAh / g
The computed values represent the theoretical gram capacity. To ascertain the reversibility of the material’s structure and verify that the actual lithium-ion de-intercalation coefficient is subunitary, the material’s actual gram capacity is determined using the following formula:
C A = η L i × C T
The design capacity of a battery represents the theoretical maximal power storage and discharge capability under defined operational conditions.
Q d e s i g n = Γ coating × P × C a c t i v e × A
The N/P ratio represents the mass ratio of the cathode material (denoted as N for the negative electrode) to the anode material (denoted as P for the positive electrode) within a battery cell. The N/P ratio is pivotal for both the performance and safety of the battery. The calculation of this ratio is governed by the following formula:
R N / P = C n e g a t i v e × Γ n e g a t i v e × P n e g a t i v e C p o s i t i v e × Γ p o s i t i v e × P p o s i t i v e
The N/P ratio in graphite-negative-electrode-type batteries is recommended to exceed 1.0, typically ranging from 1.04 to 1.20, primarily to ensure safety. However, an excessively high N/P ratio can result in increased irreversible capacity loss, thereby reducing the battery’s overall capacity and diminishing its energy density.
Ultimately, the mass/volume energy density serves as a pivotal metric for assessing battery performance, quantifying the energy stored per unit mass of the battery. The mathematical expression is as follows:
Mass energy density formula: Γ m a s s = Q m × U
Volumetric energy density formula: Γ v o l u m e = Q V × U
In this study, the mass energy density formula is chosen to evaluate the battery performance.
Combining the background data and the above formulas, the mass energy density of LFP is about 95 Wh/Kg, whereas the mass energy density of NCM is about 120 Wh/Kg, and this result is appended in conjunction with the background data.

2.3. Life Cycle Impact and Sustainability Evaluation

During the life cycle assessment phase, this investigation executed an exhaustive evaluation of the battery’s life cycle in accordance with the ISO 14040 standard [26,27,28,29], with particular emphasis on the quantification of the carbon footprint associated with the battery’s production phase. Product modeling was conducted utilizing Simapro 9.0 software, while the assessment of carbon footprint and environmental impact was performed via the ReCiPe2016 methodology [29,30]. The ReCiPe2016 assessment methodology consists of 18 environmental indicators, which are categorized into three main categories, namely, atmospheric impacts, water impacts, and terrestrial impacts. This comprehensive categorization facilitates a detailed evaluation of the resource and environmental impacts throughout the entire life cycle of the battery.
This investigation offers an exhaustive and methodical evaluation of the resource and environmental implications associated with LFP and NCM batteries across various production scenarios. Additionally, it offers pivotal insights and directives to inform the sustainable progression and eco-friendly transition of the forthcoming electric vehicle power battery sector.

3. Results and Discussion

3.1. Carbon Footprint Results

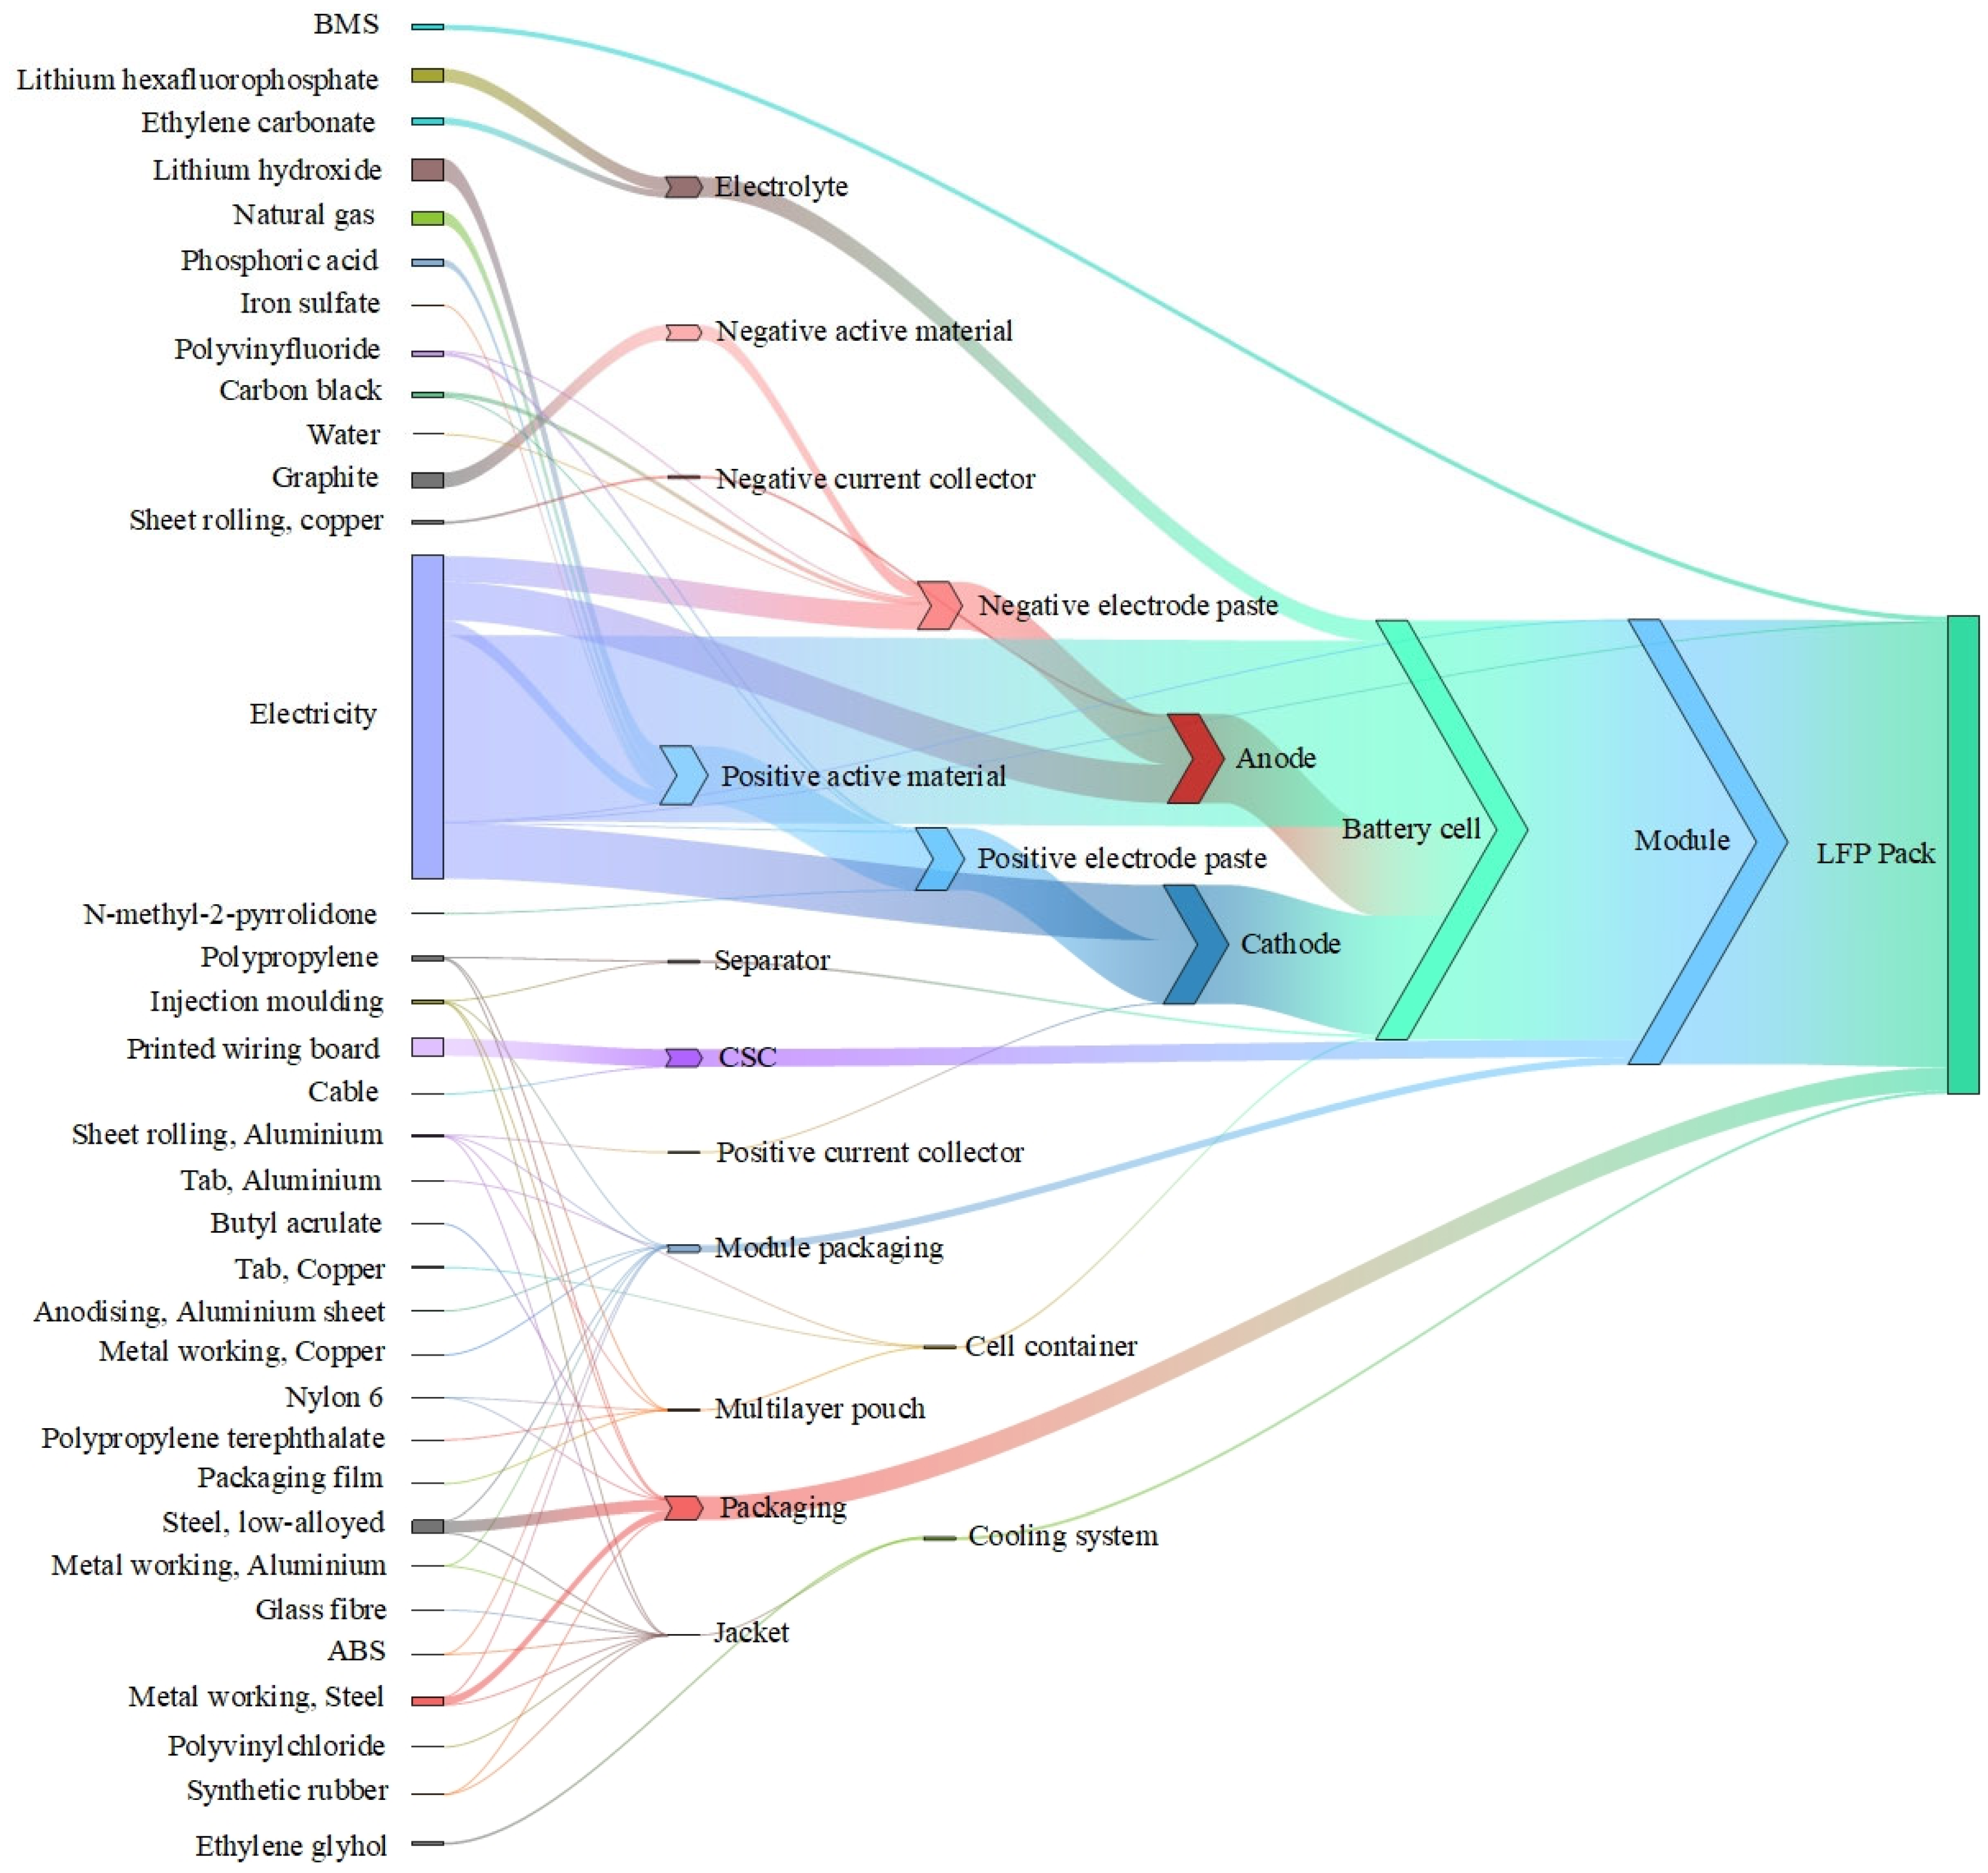
The comprehensive life cycle carbon emissions associated with battery production are predominantly accrued during the manufacturing stage. The intricate nature of production processes, coupled with substantial energy requirements during the manufacturing phase, renders the comprehensive assessment of the full-cycle carbon footprint of batteries inherently uncertain. This research conducts a comprehensive examination of the carbon footprint associated with the battery production phase, employing the Intergovernmental Panel on Climate Change (IPCC) 100-year methodology as a foundational framework. To elucidate the carbon emissions associated with the battery structure and primary component categories, this investigation examines the directional flow of carbon footprints during the production phase of power batteries, utilizing a modular segmentation approach. Carbon emission intensity and carbon footprint trend diagrams for NCM and LFP batteries were constructed, as illustrated in Figure 6 and Figure 7.
In general, the carbon emissions associated with the battery production process predominantly arise from energy consumption, the procurement of raw materials, and emissions generated during the production stages. Notably, the comprehensive carbon emissions of NCM (ternary lithium) batteries exceed those of LFP (lithium iron phosphate) batteries by a considerable margin. This discrepancy is primarily attributable to the elevated energy requirements and the substantial carbon footprint inherent in the extraction and processing of nickel, cobalt, and manganese, which are integral components of NCM batteries. Lithium iron phosphate (LFP) batteries exhibit a reduced carbon footprint during the refining and production processes, in contrast to nickel–cobalt–manganese (NCM) batteries, where the utilization of nickel and cobalt contributes to significantly higher carbon emissions. Electricity consumption during the manufacturing process constitutes a primary source of carbon emissions for both battery types. However, the utilization of distinct materials in their production results in significant variations in the overall carbon footprint.

3.2. Energy Analysis

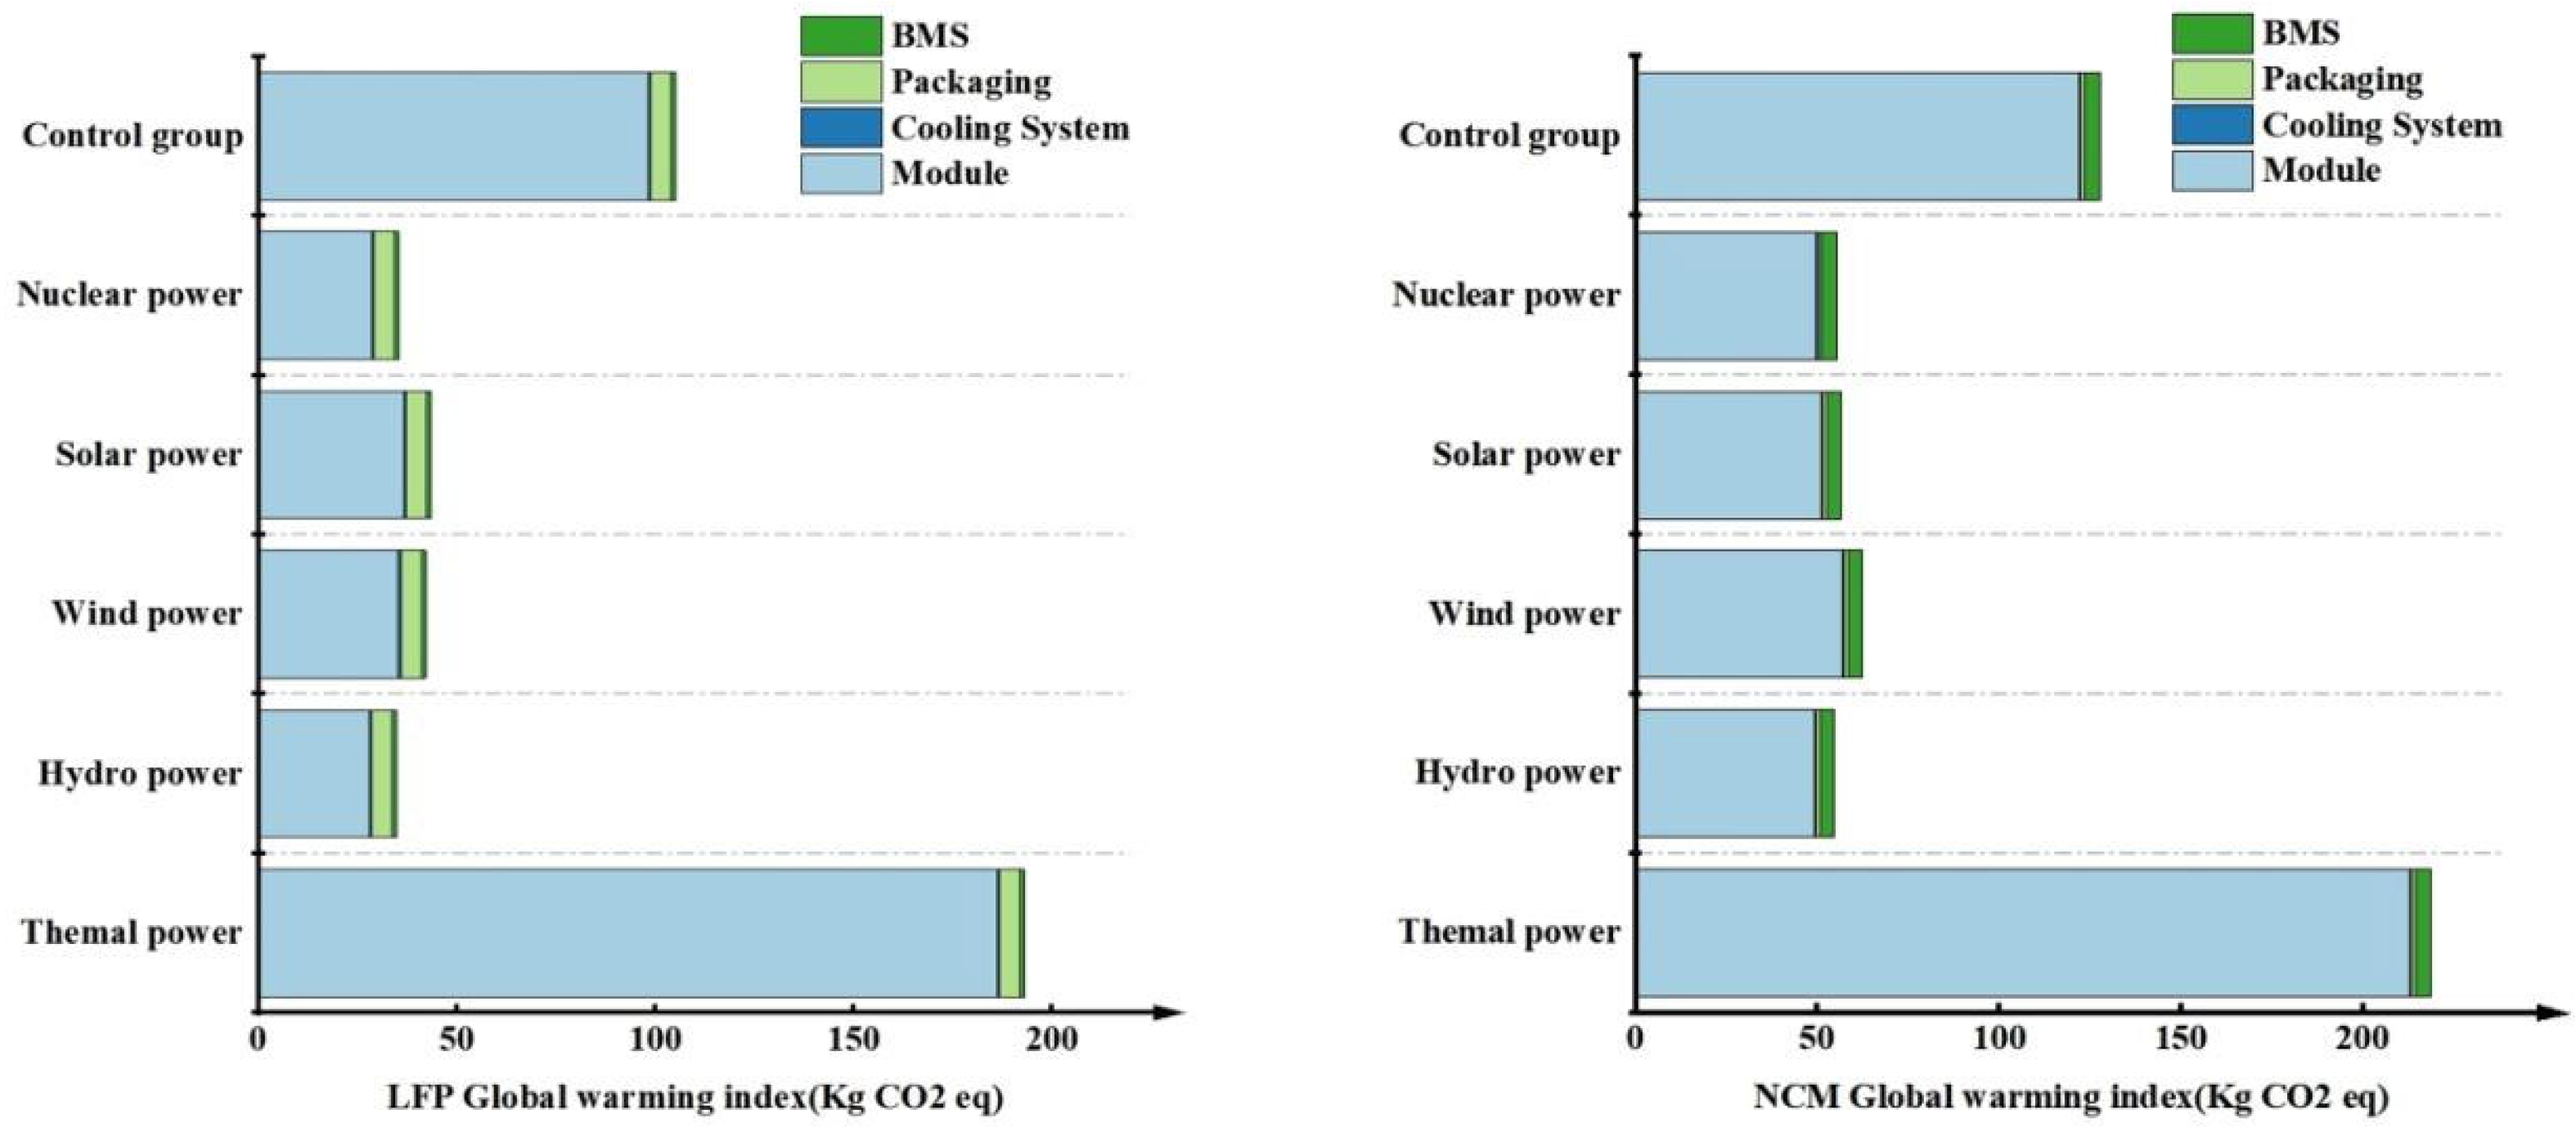
The electricity sources employed in the production process are categorized into five distinct types: control (derived from a nationwide power generation mix in China, incorporating thermal, hydro, wind, solar, and nuclear energy, each weighted according to a predefined ratio), nuclear, solar, wind, hydro, and thermal. Diverse electricity sources are employed to conduct energy analyses for the respective production processes of LFP and NCM batteries. Corresponding graphical representations are generated, as illustrated in Figure 8, Figure 9, Figure 10 and Figure 11. These figures delineate the comparative environmental impacts associated with the utilization of various energy sources in the manufacturing of the two battery types.

3.2.1. Carbon Emission Analysis

In Figure 8, the factors that influence global warming are systematically categorized into three distinct classes:
(1)
Effect of battery type on global warming potential:
The global warming potentials of LFP and NCM batteries exhibit negligible variation among different energy sources, displaying analogous overarching trends. This implies that the selection of a battery type for manufacturing exhibits minimal influence on global warming potential when carbon emissions are considered, with the predominant determinant of carbon emissions being the origin of the electrical power utilized.
(2)
The effect of energy type on global warming potential:
Thermal electricity exhibits the highest global warming potential among both battery types, succeeded by the control group, which similarly demonstrates a substantial global warming potential. Solar, wind, hydroelectric, and nuclear power exhibit notably reduced global warming potentials compared to thermal and conventional control methods. This evidence demonstrates that the utilization of solar, wind, hydroelectric, and nuclear energy sources can substantially mitigate global warming potential, thereby highlighting the pronounced efficacy of clean energy in diminishing carbon emissions.
(3)
Contribution of each component to global warming potential:
Among the various energy sources, the battery module component exhibits the highest contribution to global warming potential, constituting the predominant proportion of the overall impact. The section dedicated to the battery module, encompassing the integration of cathode and anode materials, electrolytes, and auxiliary agents, constitutes the most energy-intensive phase within the battery production workflow. The battery management system (BMS), packaging, and cooling systems collectively contribute a minor yet significant portion to the overall system. However, the energy consumption and environmental resource impacts associated with the materials utilized in these components necessitate meticulous consideration and optimization.
In conclusion, the utilization of renewable energy sources, including solar, wind, hydroelectric, and nuclear power, has been demonstrated to substantially mitigate carbon emissions, thereby constituting a viable strategy for the attainment of low-carbon production methodologies. By optimizing the power generation portfolio and diminishing the reliance on thermal power generation, China can expedite its progression towards achieving the objectives of carbon peak and carbon neutrality. Furthermore, this approach offers a more ecologically sustainable alternative for the manufacturing of power batteries, thereby fostering the advancement of the battery industry in alignment with sustainable development principles.
In prospective advancements, it is imperative to robustly advocate for and implement clean energy solutions, concurrently augmenting the contributions of solar, wind, and hydroelectric power within the overall energy generation portfolio. Concurrently, it is imperative to optimize all facets of battery production to enhance energy utilization efficiency, mitigate superfluous energy consumption, and further diminish carbon emissions throughout the production process. To effectively address the challenges posed by global warming and genuinely achieve the objectives of green and sustainable development, it is imperative to adopt a multifaceted approach encompassing open-source methodologies, substantial cost reduction, robust governance frameworks, and meticulous strategic planning.

3.2.2. Analysis of Ozone Depletion

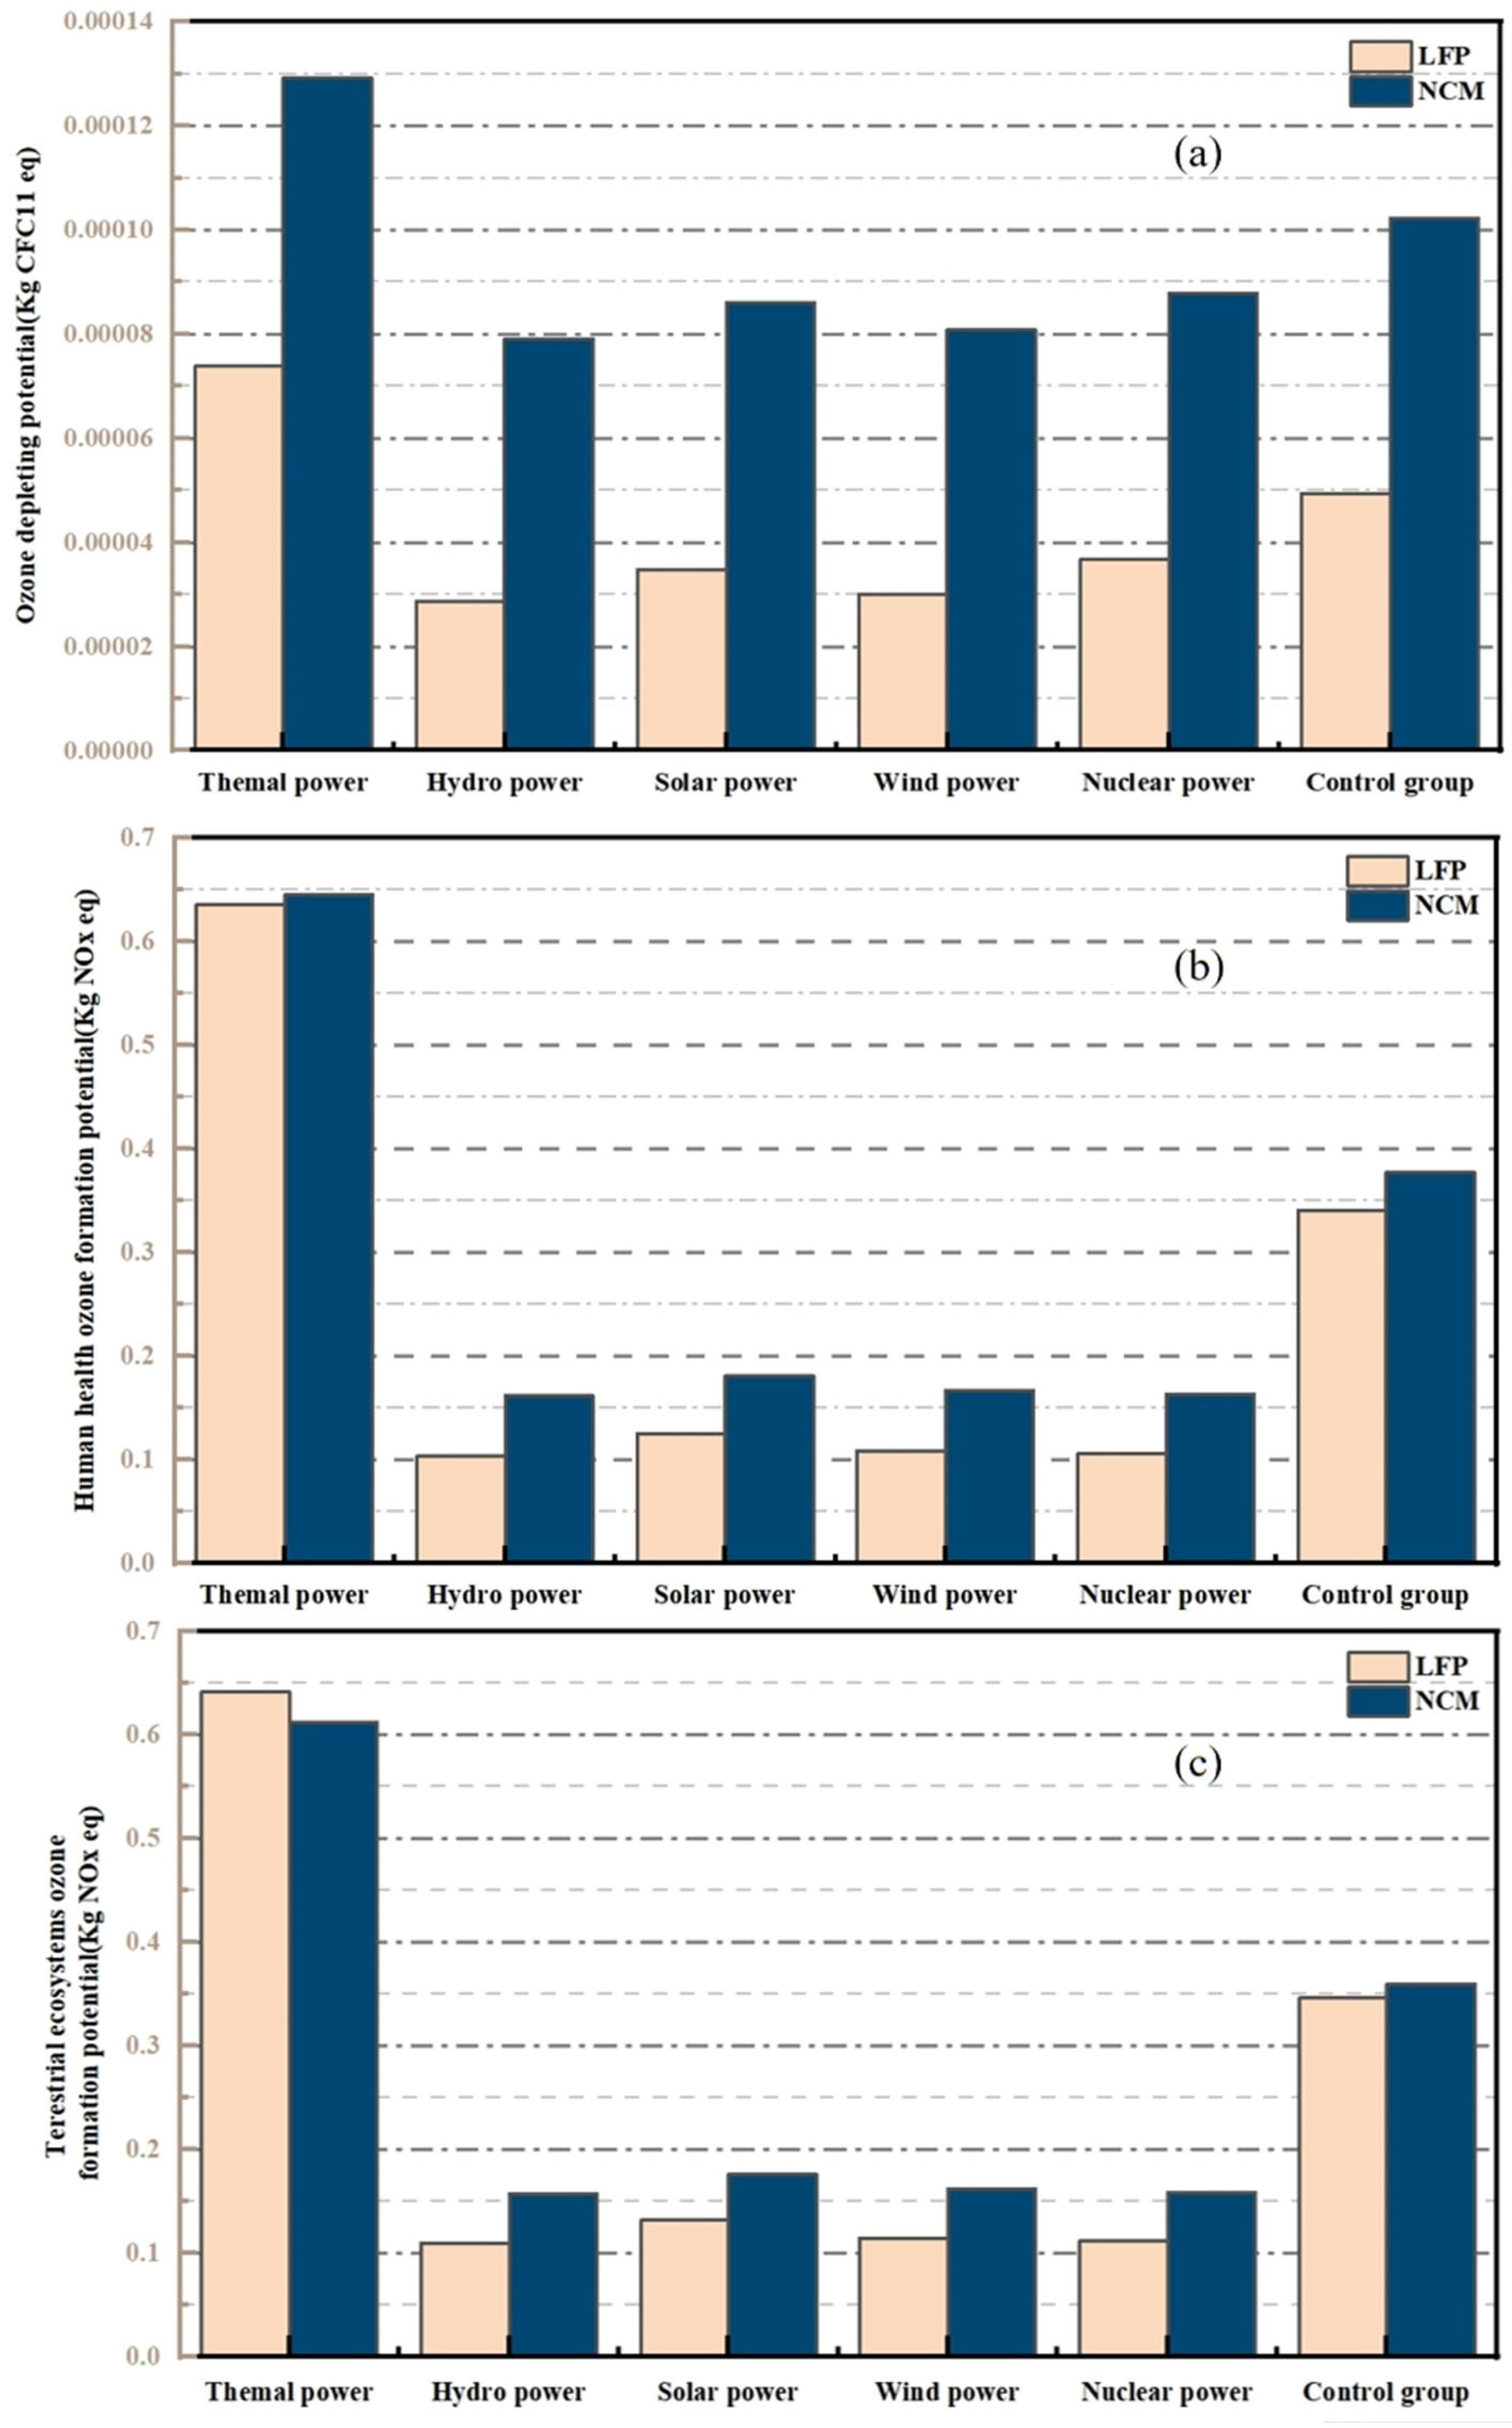
This research examines the influence of two distinct battery life cycle processes on the ozone layer, utilizing the ozone depletion potential (ODP), human health ozone formation potential (HOFP), and terrestrial ecosystem ozone formation potential (EOFP) metrics within the ReCiPe assessment framework. The comparison in Figure 9 clearly shows the different performances of different battery types (LFPs and NCMs) and different energy types (thermal, hydro, solar, wind, and nuclear) in terms of ozone depletion and formation potential.
Overall, thermal power exhibits the most substantial ozone impact potential among the five evaluated energy sources, demonstrating markedly elevated values for both ozone depletion potential and ozone formation potential compared to the other energy types. In particular, the thermal power data using NCM batteries showed a higher ozone impact potential than the thermal power data using LFP batteries in all three aspects of ozone depletion and formation.
In contrast, hydro, solar, wind, and nuclear power have lower data compared to thermal power, suggesting that these clean energy sources have significant advantages in reducing ozone layer depletion and are effective in mitigating negative environmental impacts. Significantly, the data set for NCM batteries exhibits elevated values across all evaluated metrics compared to LFP batteries, suggesting that, while NCM batteries may be superior in performance, they also have a greater environmental impact and pose a more significant environmental challenge. This underscores the necessity of evaluating the environmental implications associated with the advancement of high-performance battery technologies, emphasizing the imperative to strike a judicious equilibrium between optimizing performance and ensuring environmental stewardship.

3.2.3. Eutrophication Depletion Analysis

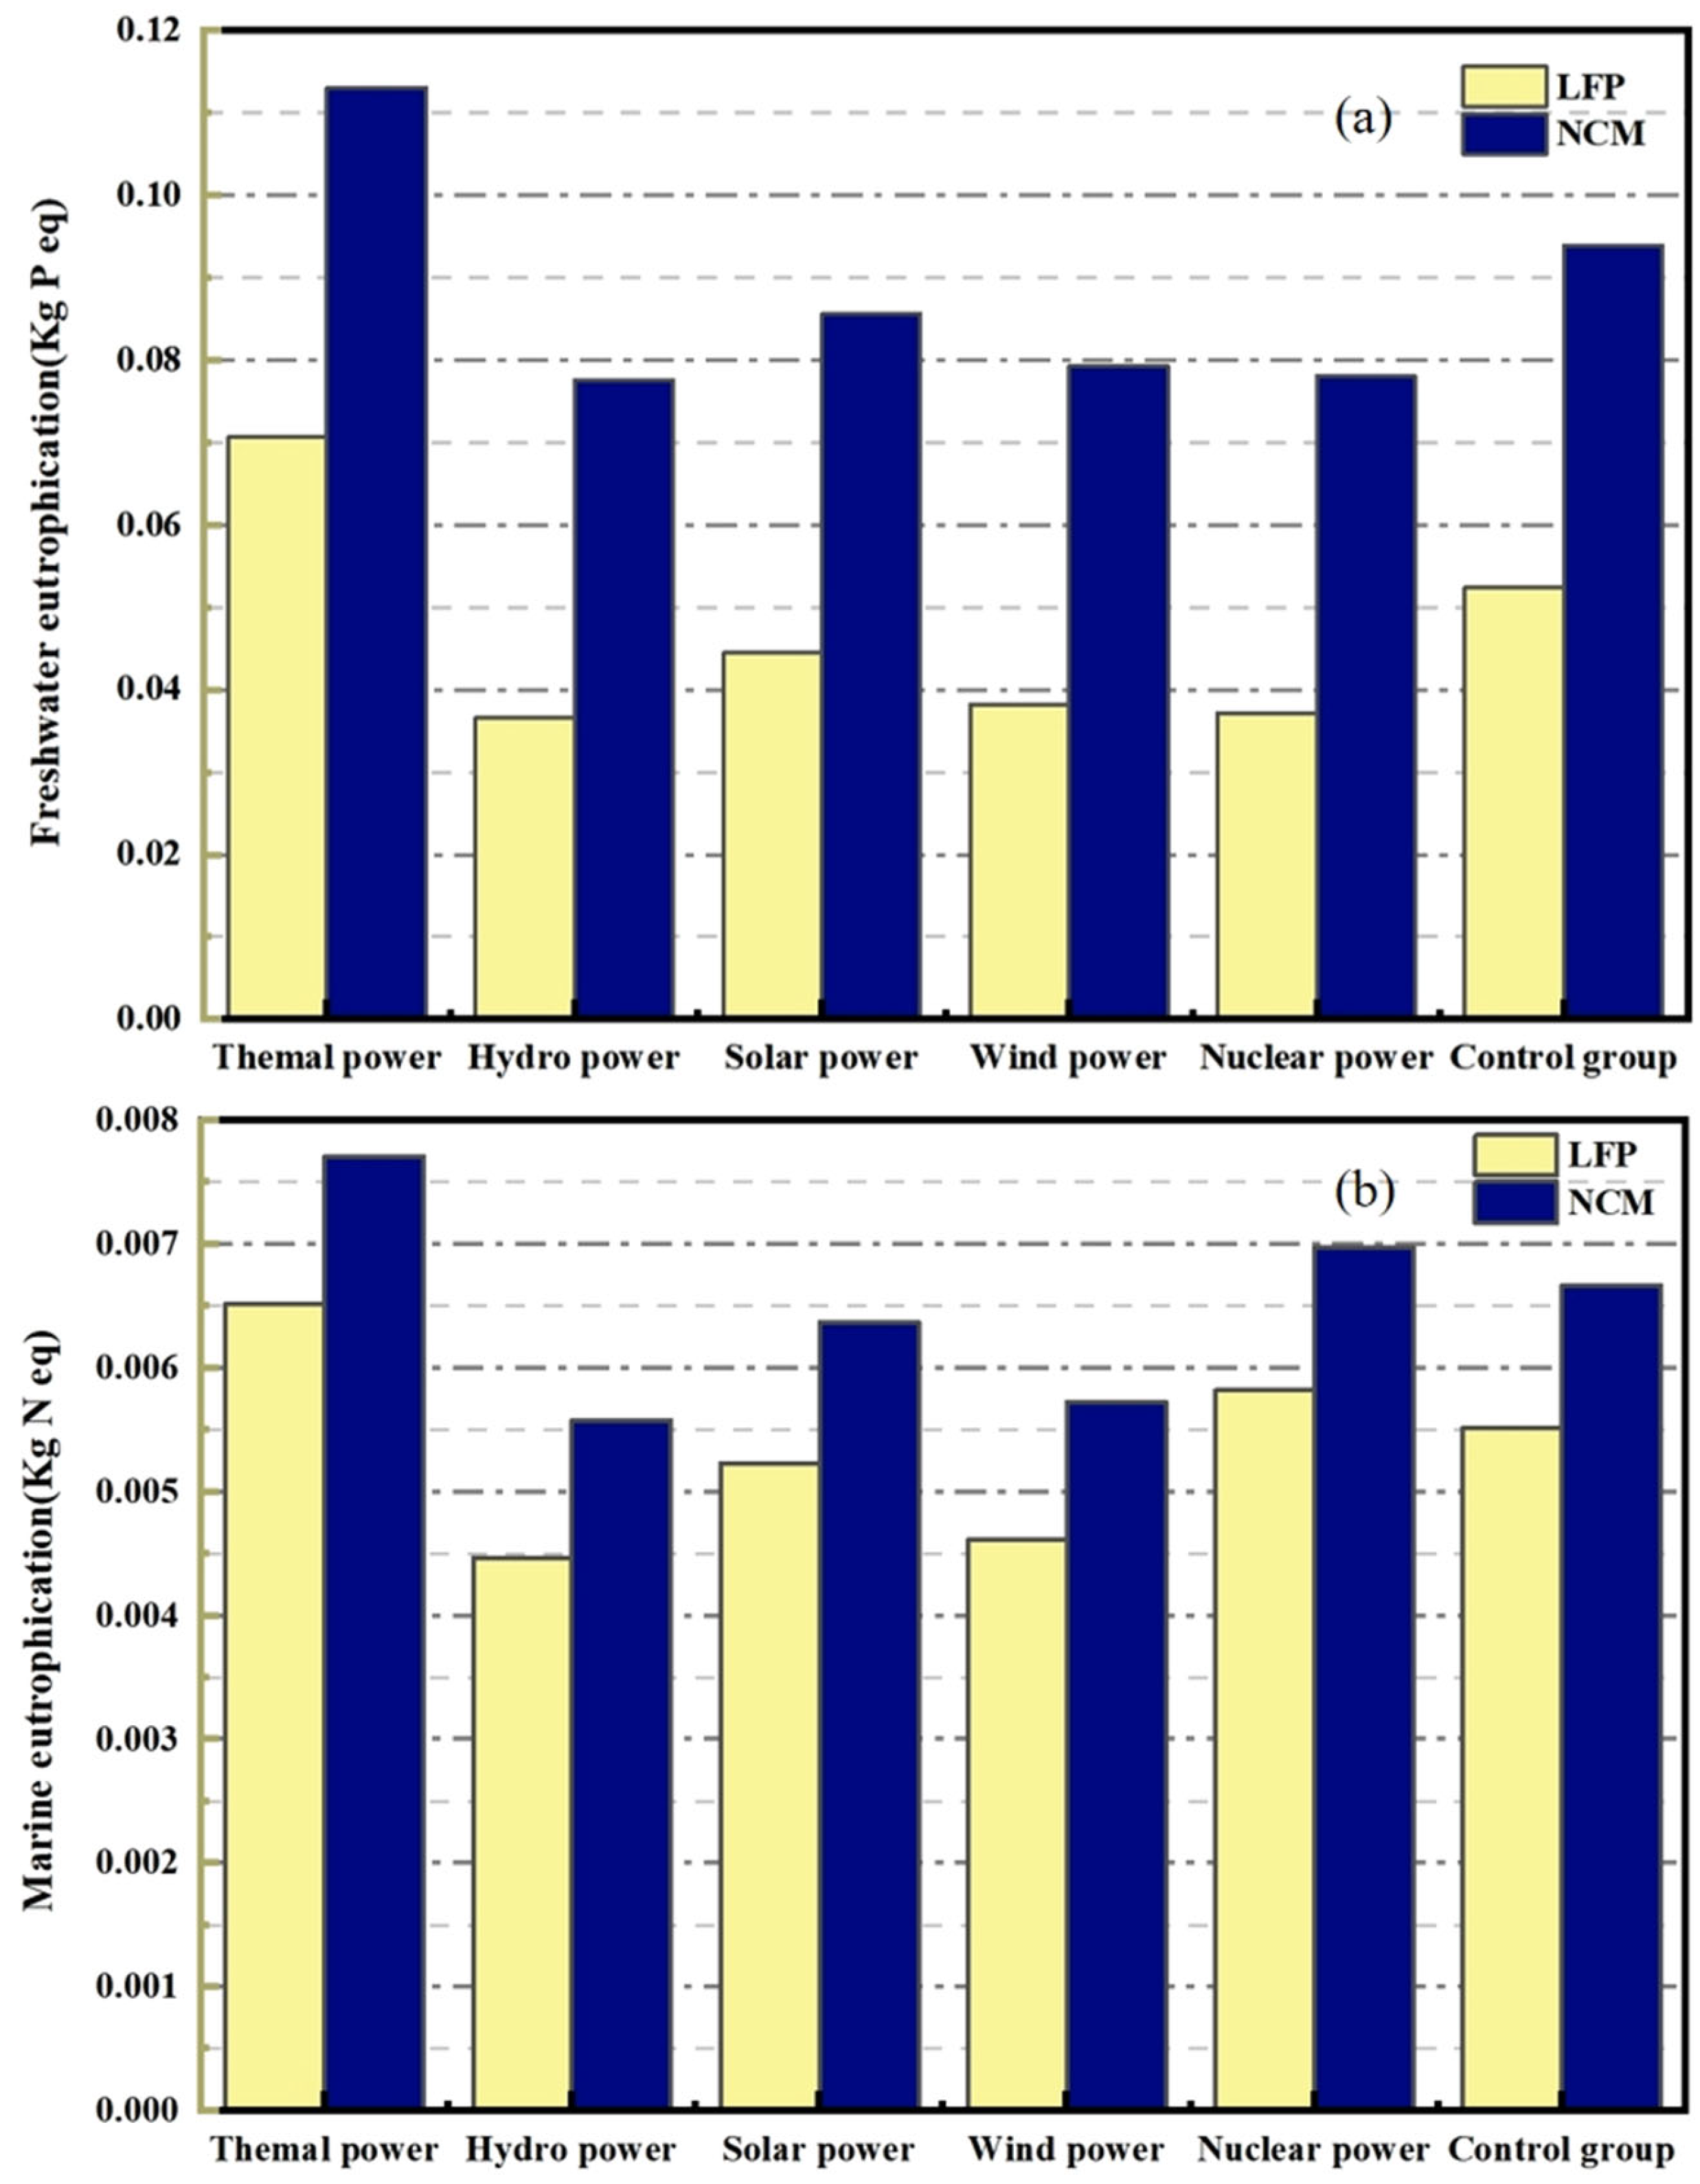
In the present investigation, a comprehensive eutrophication assessment is undertaken, employing both freshwater eutrophication potential (FEP) and marine eutrophication potential (MEP) metrics, to elucidate the impacts of lithium iron phosphate batteries (LFP) and ternary lithium batteries (NCM) on aquatic ecosystems. With the two graphs in Figure 10, the different performances of different battery types (LFPs and NCMs) and different energy types (thermal, hydro, solar, wind, and nuclear) can be clearly seen in terms of freshwater and marine eutrophication potential. This meticulous comparative analysis elucidates a holistic understanding of the respective influences exerted by the two distinct battery types and the quartet of energy sources on the aquatic ecosystem.
In summary, among the five evaluated energy types, thermal power exhibits the most pronounced influence on eutrophication, characterized by substantially elevated metrics for both freshwater eutrophication potential and marine eutrophication potential. In particular, the data for thermal power with NCM batteries are significantly higher than those for thermal power with LFP batteries for both freshwater and marine eutrophication potential, suggesting a more pronounced detrimental effect on the aquatic environment.
In contrast, hydro, solar, wind, and nuclear power have lower figures compared to thermal power, indicating that these clean energy sources have a significant advantage in reducing nitrogen and phosphorus emissions and are effective in mitigating water pollution. Utilization of LFP batteries notably diminishes the data associated with clean energy sources, thereby exemplifying their superior efficacy in environmental conservation. It is worth noting that the data of NCM batteries consistently surpass those of LFP batteries in all evaluated indicators, rendering them more appropriate for deployment in application scenarios characterized by stringent environmental standards.

3.2.4. Eco-Toxicity Loss Analysis

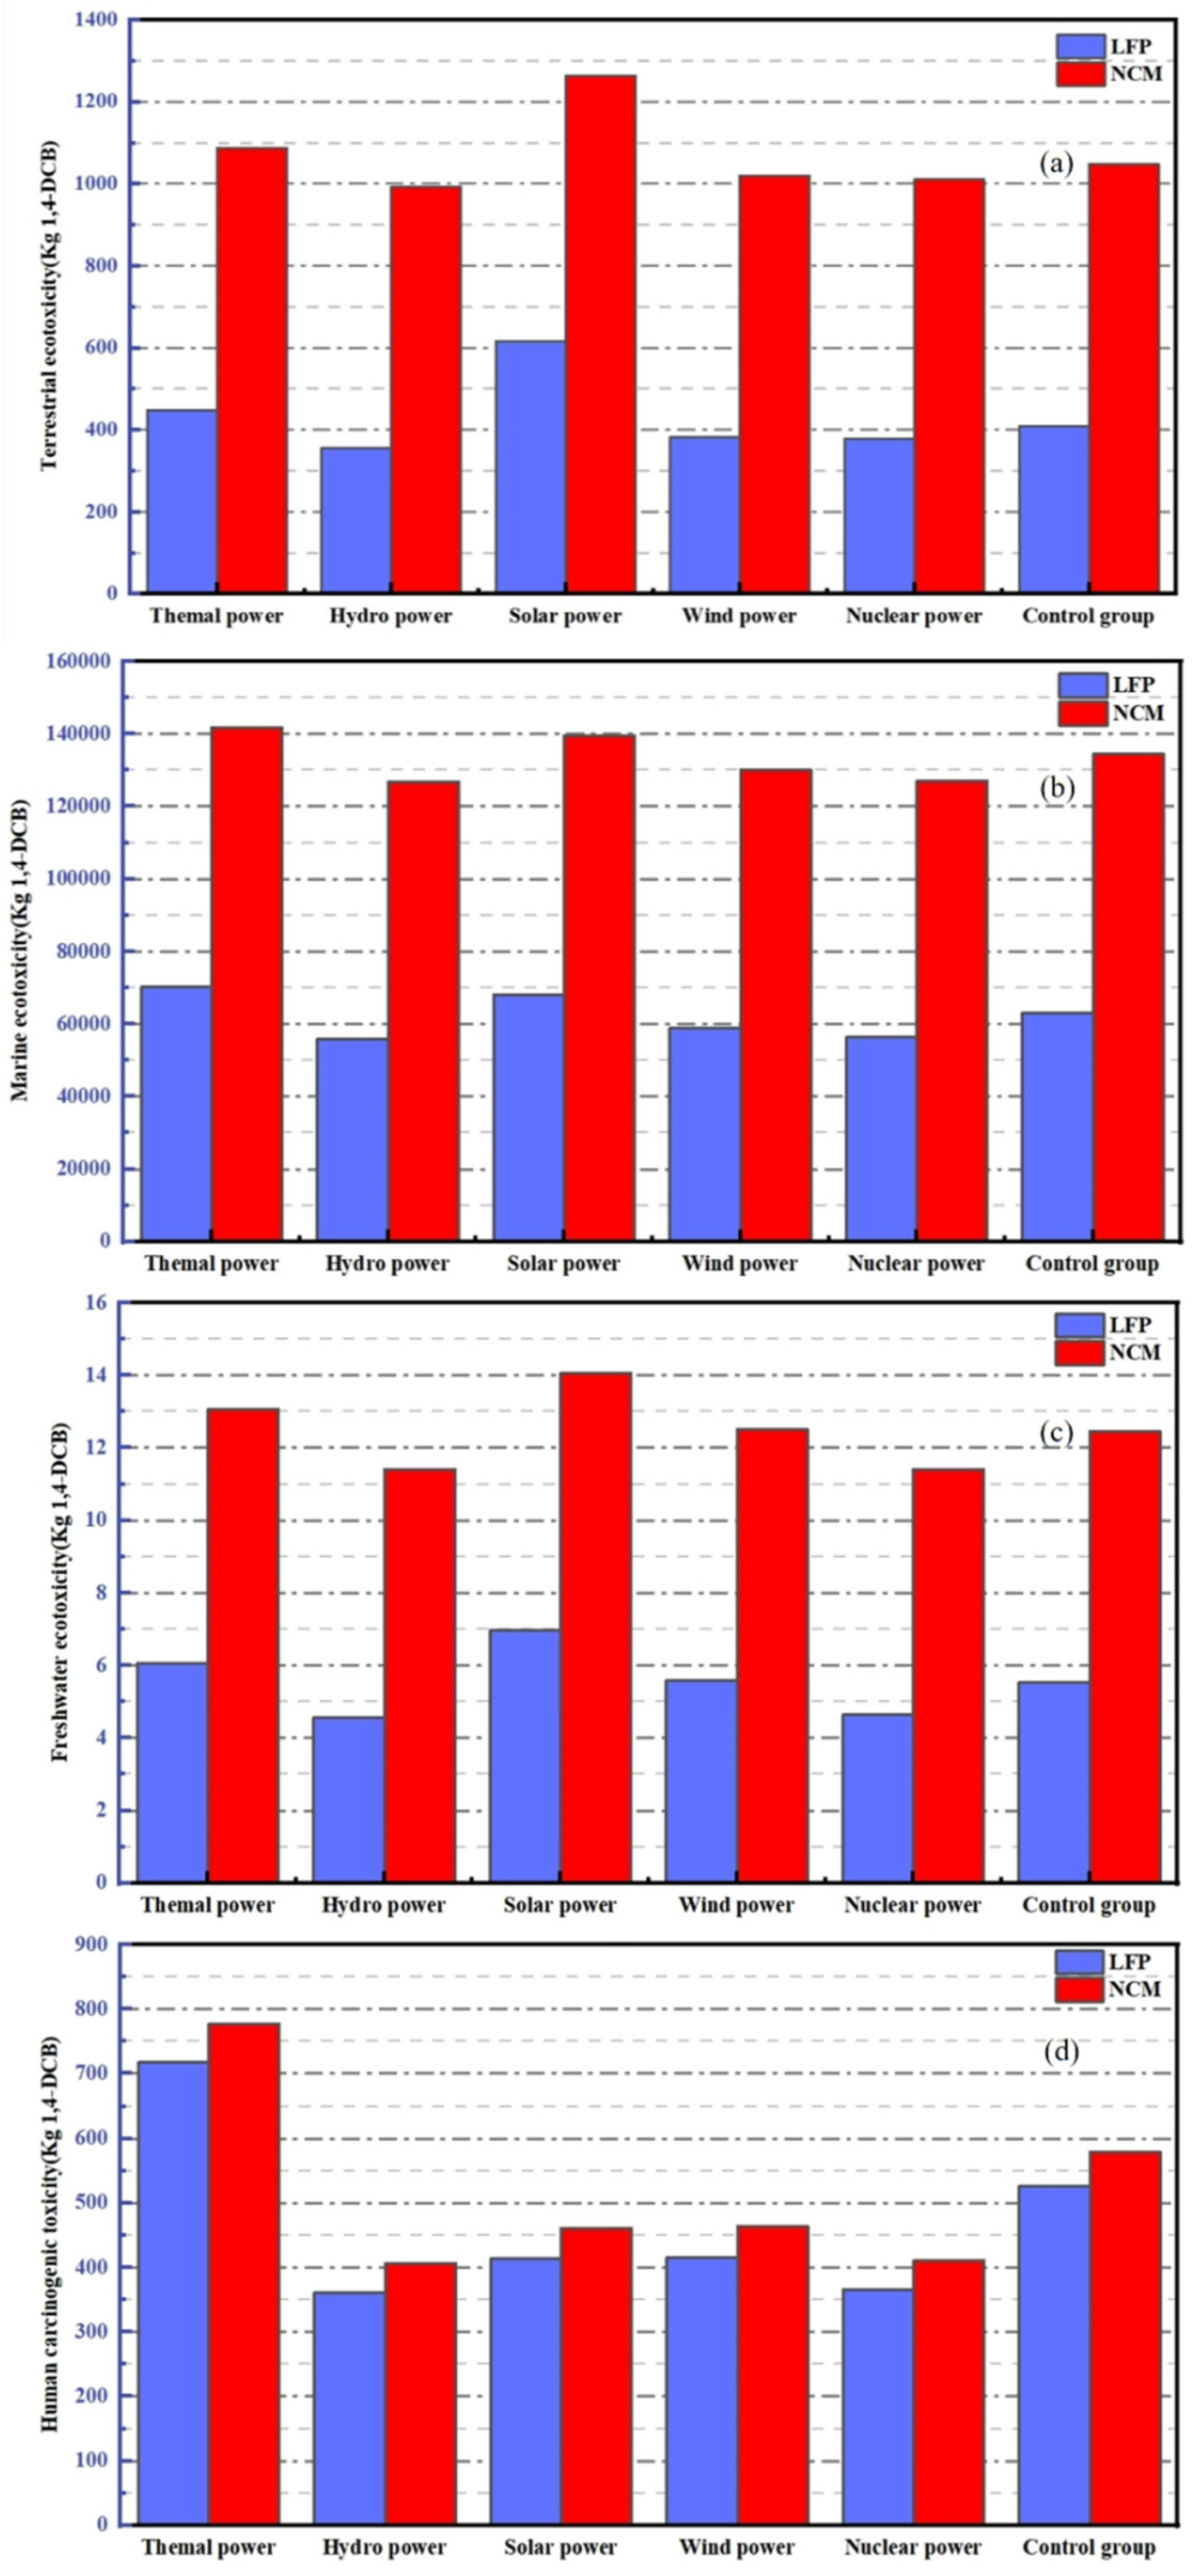
In the present investigation, the assessment of water-related eco-toxicity is categorized into two distinct components: freshwater eco-toxicity potential (FETP) and marine eco-toxicity potential (METP). Additionally, the evaluation of human eco-toxicity primarily focuses on the human carcinogenicity toxicity potential (HTPc). Terrestrial eco-toxicity is examined through the lens of terrestrial eco-toxicity potential (TETP). These graphs in Figure 11 facilitate the examination of the behavioral characteristics of various energy types with respect to terrestrial eco-toxicity, marine eco-toxicity, freshwater eco-toxicity, and human carcinogenicity. This facilitates a holistic comprehension of the potential ramifications of various energy sources on environmental resources and human health.
In terms of terrestrial eco-toxicity and freshwater eco-toxicity, solar power exhibits elevated values, predominantly attributable to the incorporation of toxic heavy metals, such as lead and cadmium, and other deleterious chemicals, including silicofluorocarbons, in the manufacturing process of solar cells, as well as the potential contamination of soils and bodies of water by improper recycling of panels at the end of the solar energy life cycle. In terms of marine eco-toxicity, the five energy types have a relatively even distribution of values and show similar levels of environmental impact. In the context of human carcinogenic eco-toxicity, the indices associated with thermal power generation significantly exceed those of the remaining four energy sources. This disparity underscores the advantages of adopting clean energy alternatives, not only for environmental sustainability but also for the enhancement of human health. Among the evaluated battery types, the values of NCM batteries are higher than those of LFP batteries, showing greater eco-toxicity, which indicates that NCM batteries need to be strictly controlled during the production process and the emission of pollutants should be strictly controlled to minimize their impact on the environment.

3.3. Regional Analyses

In the present investigation, the territorial expanse of China is delineated into seven distinct zones adhering to the established principles of regional segmentation: Northeast, North, East, South, Central, Northwest, and Southwest. The respective power generation frameworks of these regions are incorporated into the manufacturing processes of power batteries, thereby facilitating the quantification of carbon emissions associated with production. This analysis aims to elucidate the regional impacts of power battery production on resource utilization and environmental integrity, and Figure 12, Figure 13, Figure 14, Figure 15 and Figure 16 are employed to illustrate these impacts. By conducting a comprehensive regional assessment, it is feasible to discern the power generation configuration that minimizes environmental perturbations during power battery production. Consequently, this study provides a robust scientific foundation and proposes optimization strategies for the strategic planning and advancement of China’s power battery industry. The configuration and advancement of the power battery sector furnish a scientific foundation and refined optimization strategies, thereby fostering the green transition and sustainable progression of the battery industry.

3.3.1. Analysis of Carbon Emissions

To elucidate the characteristics and inherent biases of the energy generation infrastructure across various regions, a comprehensive regional power generation map of China was developed. This map aligns the geographical divisions of China with the predominant power generation modalities within each region. The objective was to evaluate the global warming potential associated with the production of two distinct battery types, LFPs and NCMs, in different regions. The resultant data are presented in Figure 12 [11].
Carbon emissions associated with the production of power batteries in various regions are modeled based on the distinct energy profiles of each region, as illustrated in Figure 13. The determinants influencing carbon emissions are categorized into three distinct groups:
(1)
General trends:
The overall trend of the global warming potentials of the two types of power cells, LFP and NCM batteries, demonstrates a consistent pattern across all geographical regions. The Northeast region has the highest global warming potential, which is close to 200 kg eq CO2 equivalent, while the global warming potentials of other regions are relatively low and more evenly distributed. This indicates that the composition of the regional energy portfolio exerts a substantial influence on the overall global warming potential.
(2)
Impact of battery type on regions:
The global warming potentials of the LFP and NCM batteries exhibit minimal regional variation, with their overall patterns and trends demonstrating substantial similarity. The primary disparity in carbon emissions between the two battery types is attributable to the distinct materials employed in their production processes. Specifically, the NCM battery exhibits a higher overall carbon footprint compared to the LFP battery, owing to the utilization of more energy-intensive materials in its manufacturing. This observation holds true under the condition that an identical regional power generation structure strategy is implemented.
(3)
Regional differences:
The Northeast and North China regions exhibit the highest global warming potential, a phenomenon likely attributable to their substantial dependence on thermal power generation, which consequently leads to elevated carbon emissions. Regions such as East China also have higher global warming potentials, but significantly lower than Northeast and North China. Conversely, regions such as Northwest, Central, Southwest, and South China have relatively low global warming potentials with a more balanced distribution. These regions potentially exhibit a heightened utilization of renewable energy sources, including hydroelectric, wind, and solar power. Consequently, this shift has facilitated a significant reduction in carbon emissions.
In conclusion, while the disparities in the impact of LFP and NCM battery types on global warming potential do not exhibit statistical significance, the variations in global warming potential across distinct geographical regions are statistically pronounced. These results indicate that Southwest China, known for its abundant wind power resources; Central China, possessing considerable hydroelectric potential; and Southern China, characterized by its rich solar and nuclear energy assets, demonstrate reduced carbon emissions compared to the national average. This discrepancy contributes effectively to the mitigation of carbon emissions related to electricity consumption during the battery production phase. In contrast, the north-eastern and northern regions have significantly higher levels of carbon emissions, suggesting that these regions are more reliant on thermal power generation.

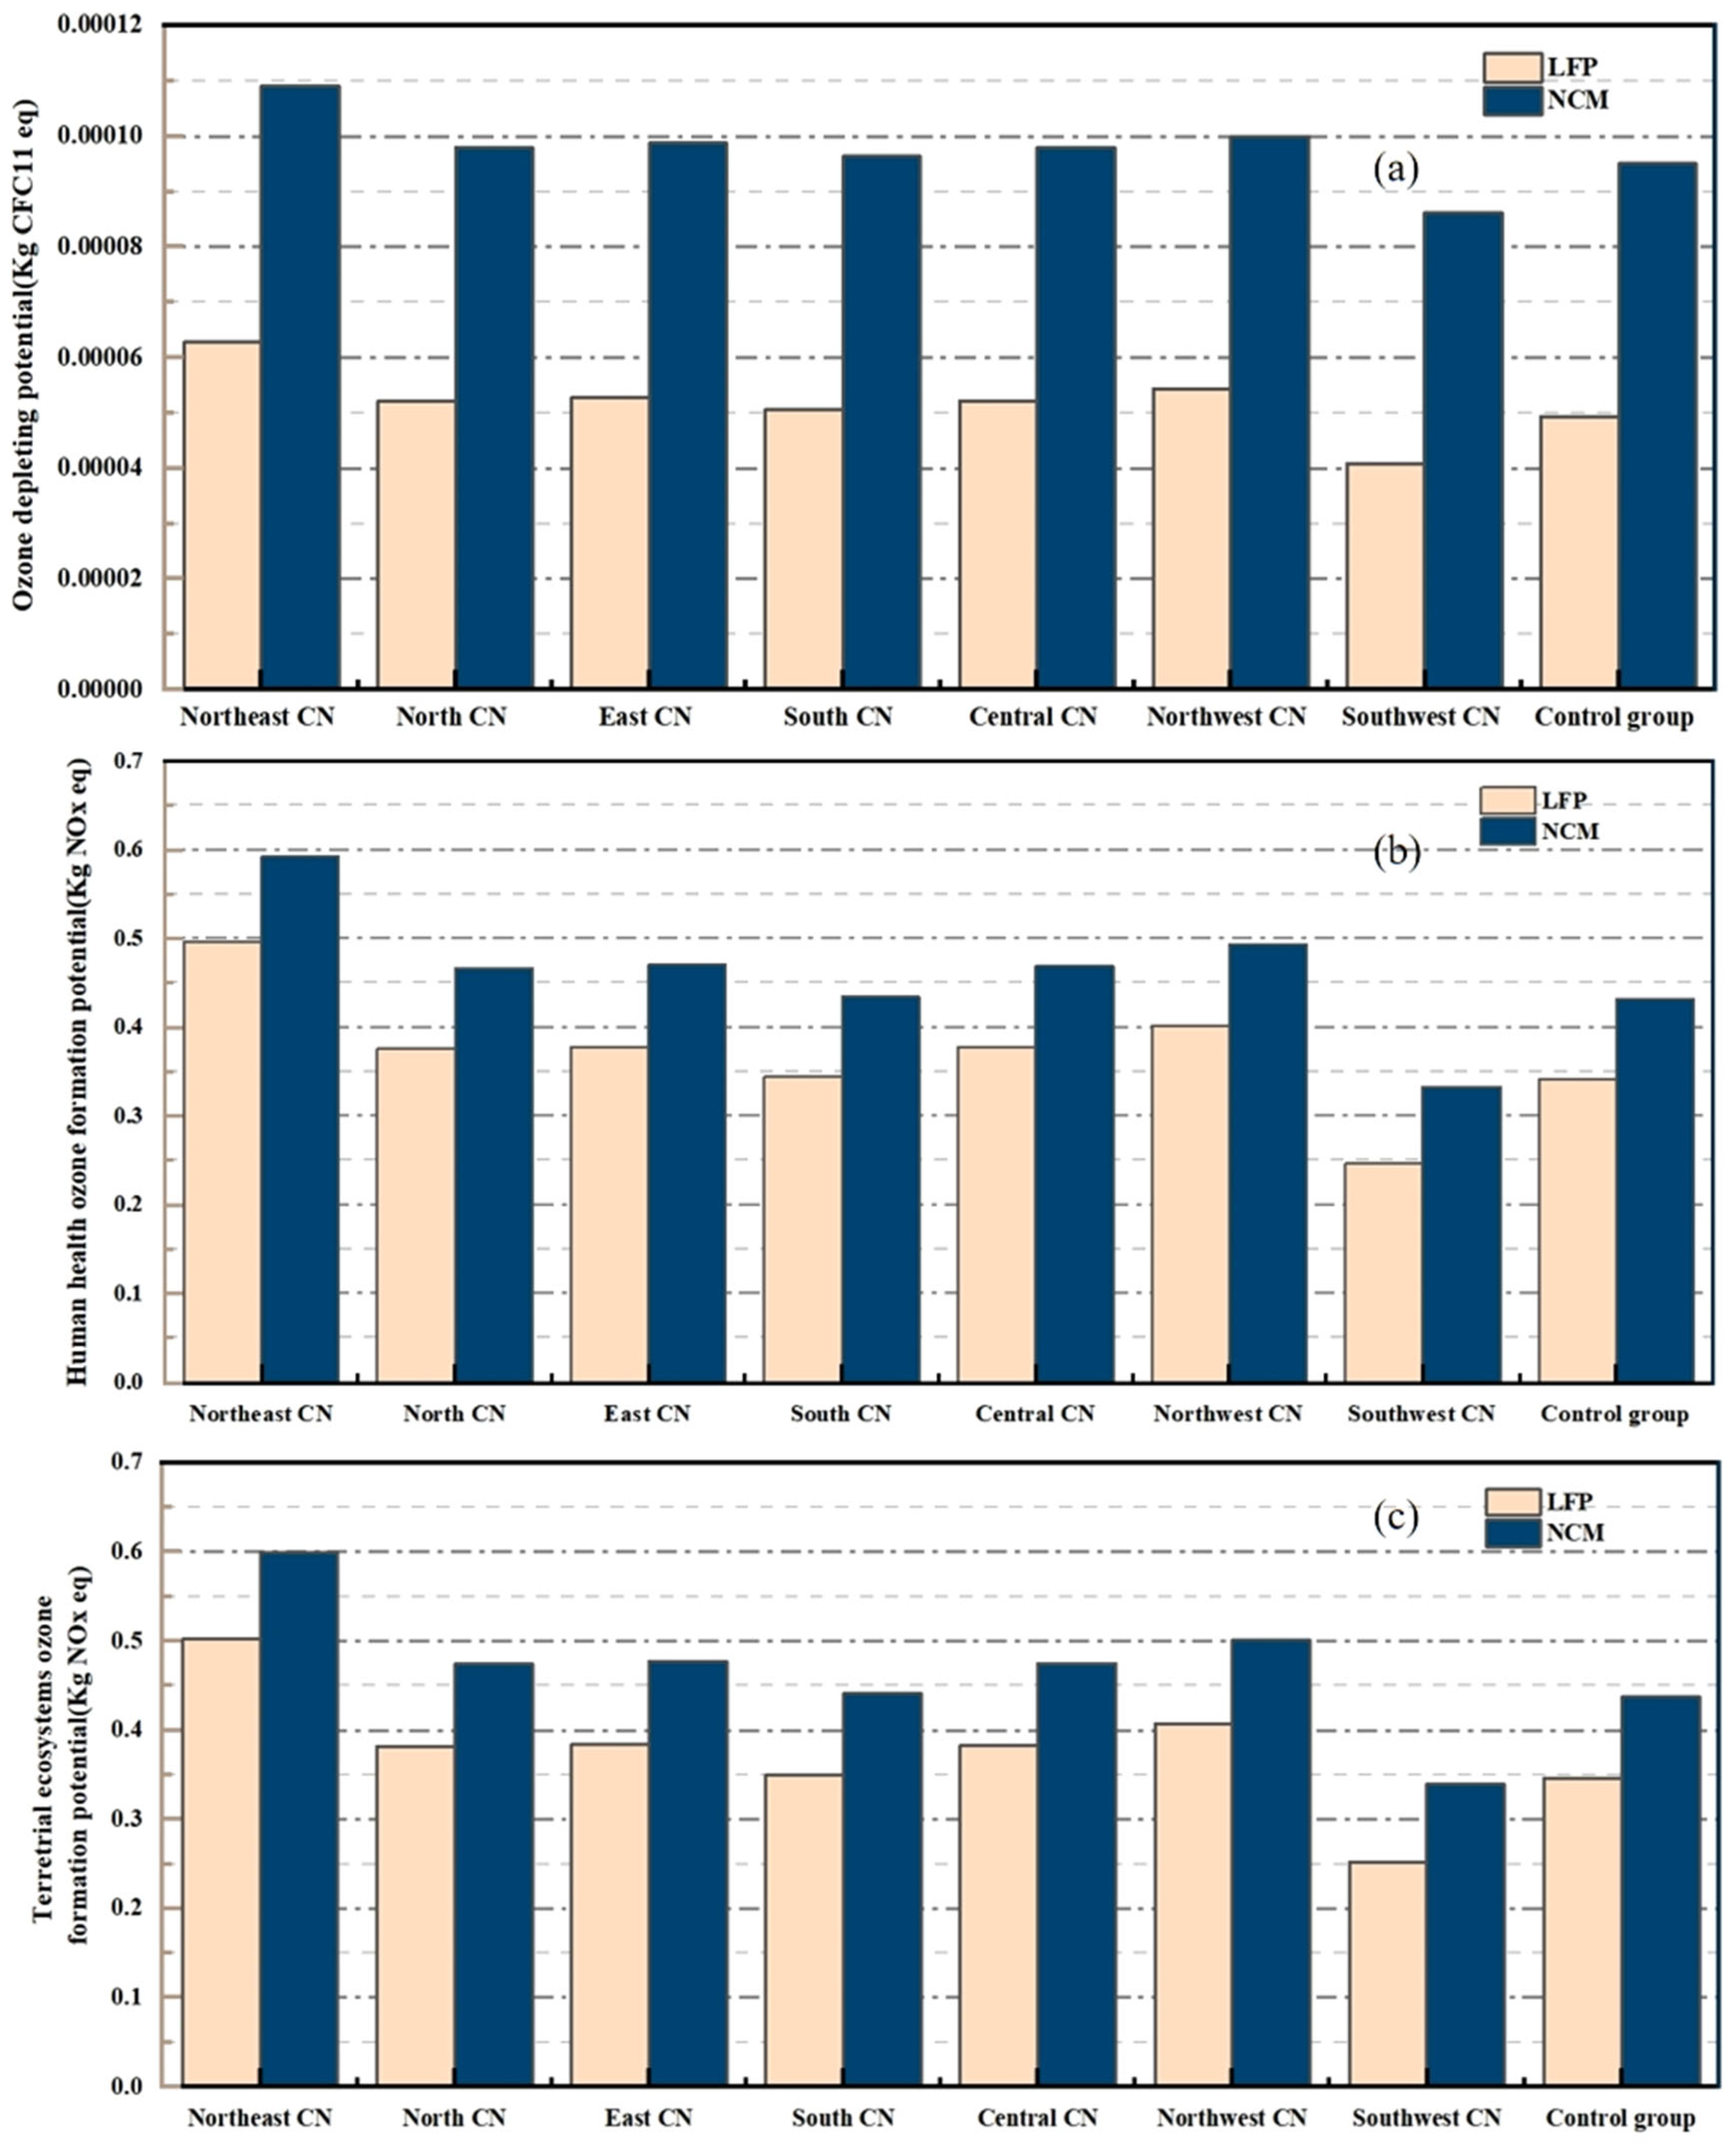
3.3.2. Ozone Depletion Analysis

This section investigates the influence of two battery life cycle processes on the ozone layer, utilizing the ozone depletion potential (ODP), human health ozone formation potential (HOFP), and terrestrial ecosystem ozone formation potential (EOFP) metrics derived from the ReCiPe assessment framework. By comparing the three graphs in Figure 14, it can be seen that the ozone depletion potential of the NCM battery surpasses that of the LFP battery across nearly all geographical regions. The disparity is notably pronounced in the Northeastern region, where the prevalent reliance on thermal power generation, in conjunction with the region’s specific energy production characteristics, indicates a substantial potential for adverse effects on the ozone layer. Concurrently, the ozone formation potential of terrestrial ecosystems is also slightly higher for NCM batteries than for LFP batteries in most regions, suggesting a more pronounced detrimental effect on ecosystems.
The human health ozone formation potential of NCM cells, akin to the ozone formation potential observed in terrestrial ecosystems, exceeds that of LFP cells across the majority of regions. This means that the use of NCM batteries not only has a greater ozone formation potential for ecosystems, but also poses a greater potential threat to human health. The comprehensive data set indicates that NCM batteries exhibit elevated values across all parameters related to ozone depletion and formation potential compared to LFP batteries. This suggests that despite their superior performance characteristics, NCM batteries exert a more pronounced detrimental effect on the environment. The eco-friendly attributes of LFP batteries confer a significant advantage in contexts necessitating rigorous environmental safeguards. Consequently, when environmental impact is a critical consideration, LFP batteries emerge as the preferable option.

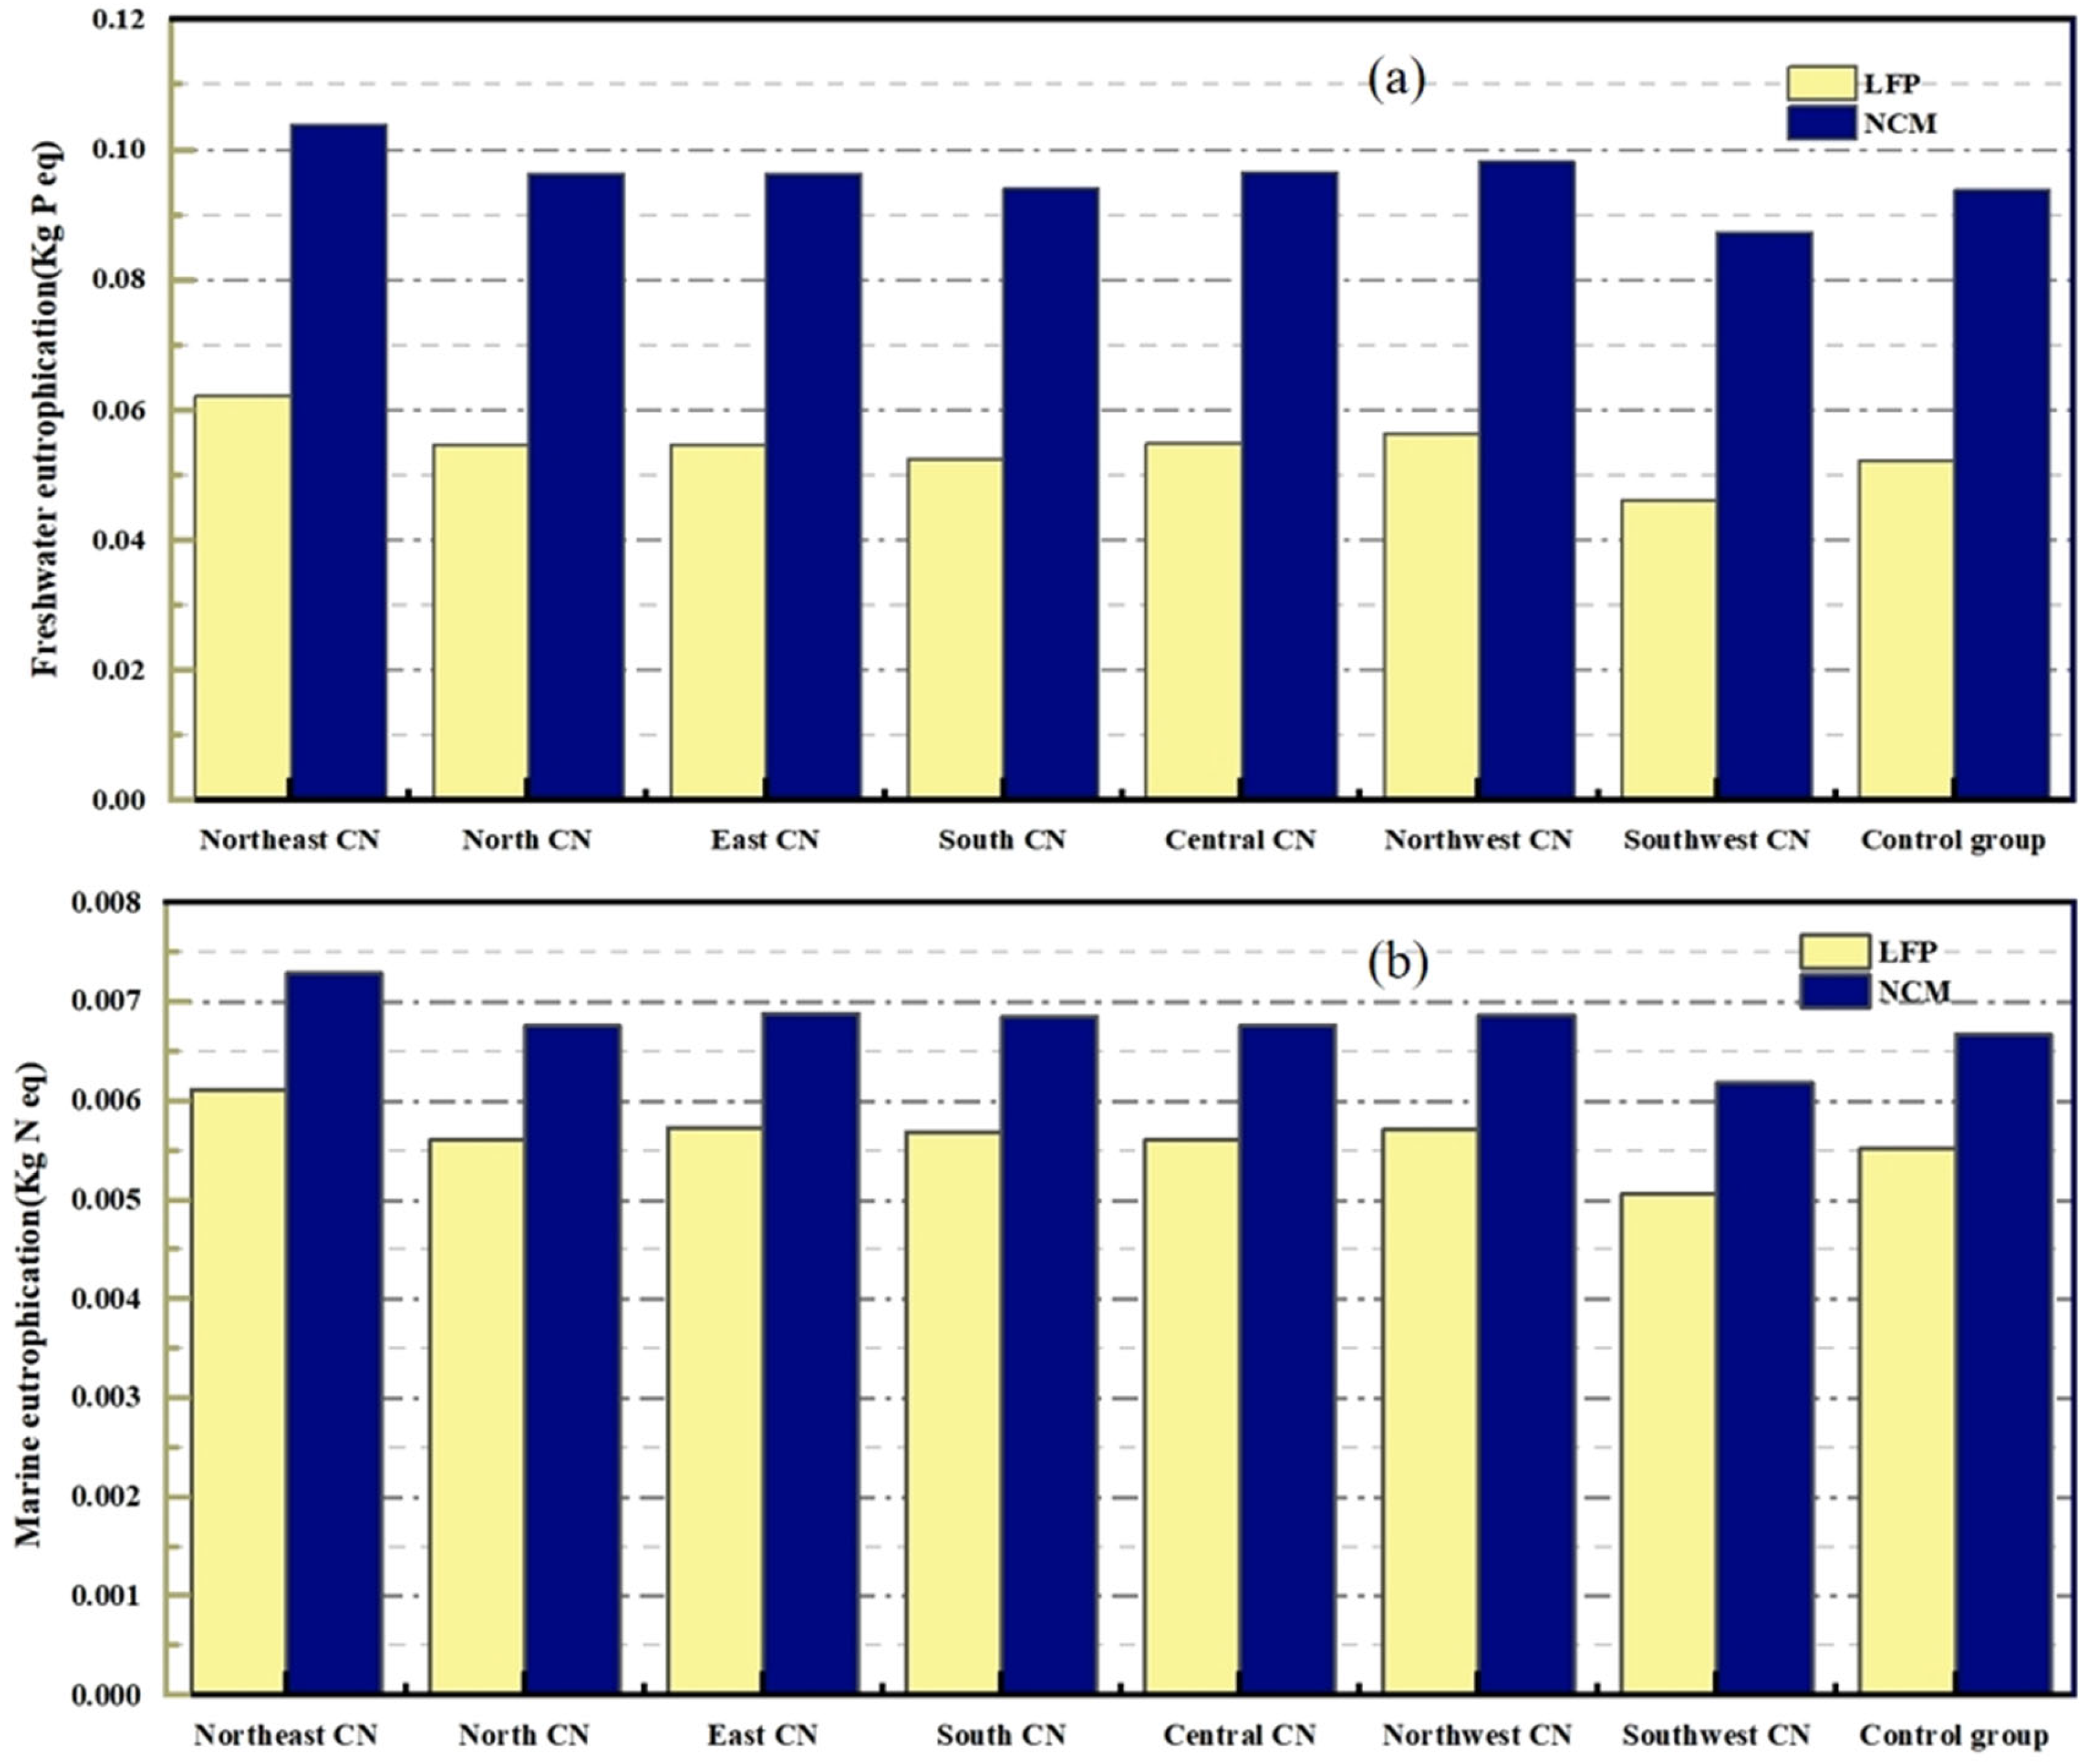
3.3.3. Eutrophication Depletion Analysis

This segment of the eutrophication investigation, grounded in the assessment of freshwater eutrophication potential (FEP) and marine eutrophication potential (MEP), examines the impacts of LFP and NCM cells on aquatic stratification. By comparing the two graphs in Figure 15, the eutrophication potential of NCM cells in the water body environment is higher than that of LFP cells in most of the regional factors, which can be clearly seen. This evidence indicates that although NCM batteries exhibit superior performance characteristics, they concurrently exert a more pronounced detrimental effect on aquatic ecosystems. In almost all regions, both freshwater eutrophication potential and marine eutrophication potential are higher for NCM cells than for LFP cells. Furthermore, NCM batteries exhibit elevated marine eutrophication potential, suggesting that the toxic and hazardous constituents within NCM exert a more pronounced detrimental effect on marine ecosystems.
In contrast, the eutrophication potential of LFP batteries is relatively low in these regions, particularly in the Southern, Central, Northwestern, and Southwestern regions, where the freshwater and marine eutrophication potentials of LFP batteries are substantially lower compared to those of NCM batteries. The observed performance underscores the efficacy of LFP batteries in mitigating water pollution, thereby positioning them as superior alternatives in terms of environmental sustainability.
From an environmental perspective, LFP batteries exhibit demonstrably superior compatibility with aquatic ecosystems. When evaluating the influence of the aqueous environment, LFP batteries emerge as a potentially more favorable option.

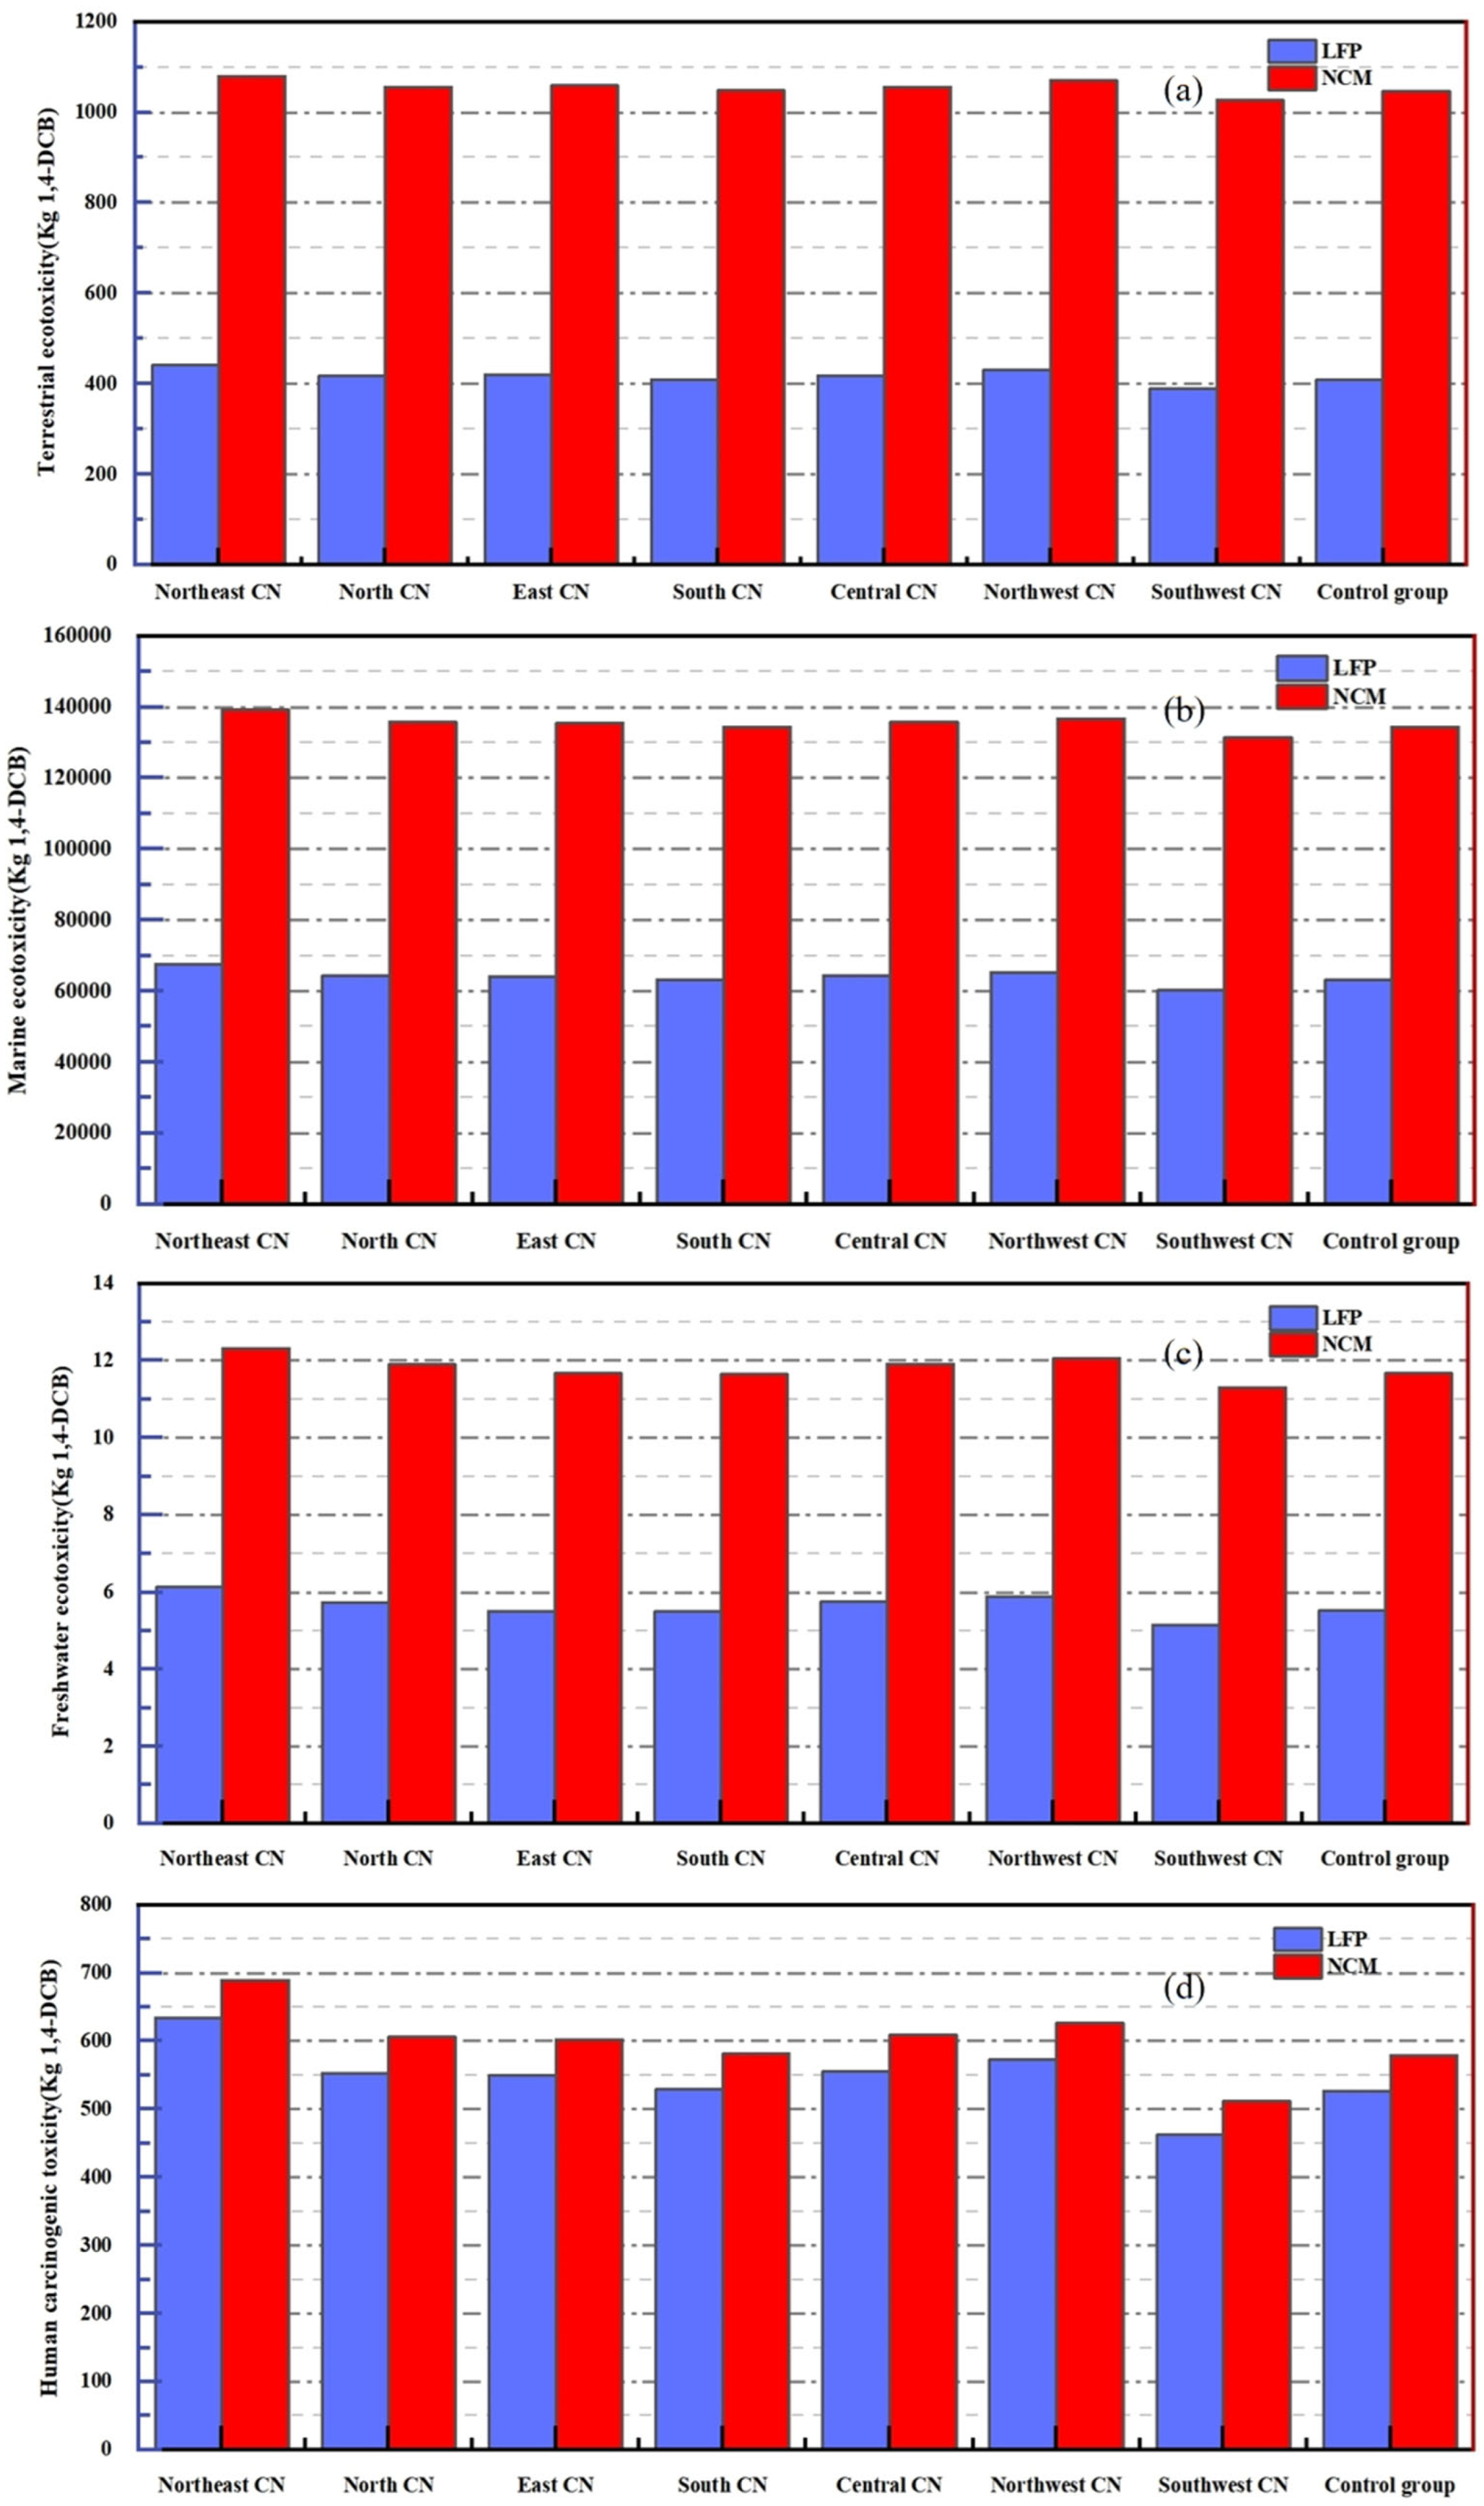
3.3.4. Eco-Toxicity Analyses

In the present investigation, the assessment of water eco-toxicity is categorized into two distinct components: freshwater eco-toxicity potential (FETP) and marine eco-toxicity potential (METP). Additionally, the evaluation of human eco-toxicity primarily focuses on the human carcinogenicity toxicity potential (HTPc). Terrestrial eco-toxicity is examined through the lens of terrestrial eco-toxicity potential (TETP). Upon meticulous examination of the four charts presented in Figure 16, it is evident that the regional disparities in terrestrial, marine, and freshwater ecosystem toxicity accounting are negligible. The variations in the recorded values are predominantly influenced by the specific type of battery under consideration. Notably, NCM batteries exhibit superior eco-toxicity and human carcinogenicity metrics compared to LFP batteries across all evaluated parameters. This suggests that, while NCM batteries may be superior in performance, they also have greater negative ecological impacts, particularly in terrestrial, marine, and freshwater ecosystems.
Conversely, LFP batteries exhibit superior environmental friendliness and enhanced safety profiles when evaluated in terms of their environmental impact. In the context of mitigating terrestrial eco-toxicity, marine eco-toxicity, freshwater eco-toxicity, and human carcinogenic toxicity, LFP batteries exhibit reduced numerical indices, thereby substantiating their diminished adverse environmental impact.
Such results are a reminder that when choosing a battery type, it is important to consider not only its performance advantages, but also to comprehensively assess its potential impact on the environment. Despite the superior performance metrics exhibited by NCM batteries, their elevated levels of eco-toxicity and human carcinogenic toxicity underscore a significant potential risk to both environmental integrity and public health, necessitating thorough consideration. Conversely, LFP batteries emerge as more viable environmentally friendly energy solutions, attributed to their reduced environmental toxicity.

4. Conclusions

The manufacturing of electric vehicle batteries exerts a substantial environmental footprint. In the present investigation, the environmental impacts associated with 1 kW-h NCM and LFP batteries are systematically assessed and juxtaposed utilizing a comprehensive component life cycle assessment model. NCM batteries exhibit superior energy density; however, they necessitate greater consumption of resources and incur a more pronounced environmental footprint. Conversely, LFP batteries demonstrate marginally reduced energy density but require fewer resources and present a comparatively diminished environmental impact, thereby aligning more favorably with eco-friendly principles. Nevertheless, irrespective of whether NCM or LFP batteries are employed, the deleterious effects on the resource environment and human health attributable to the waste generated and the energy consumption during the production process warrant significant consideration.
To mitigate these adverse effects, the extensive utilization of clean energy sources, including solar, wind, hydroelectric, and nuclear power, is imperative for diminishing reliance on fossil fuels and reducing carbon dioxide emissions. To ensure sustainable advancement, future battery production must integrate the extensive use of clean energy sources, strategically optimize facility siting to minimize carbon emissions, and actively foster the eco-friendly progression of the entire industry chain. Enhancing energy efficiency and the integration of low-carbon raw materials and advanced technologies are pivotal strategies for mitigating environmental impact.
The transition towards a green battery industry is imperative for the attainment of national carbon peak and carbon neutrality objectives. Enhancing the utilization of clean energy sources and refining production methodologies can significantly mitigate environmental pollution, thereby fostering sustainable economic and social advancement.
In conclusion, the augmentation of clean energy utilization coupled with the optimization of production methodologies can substantially mitigate the environmental repercussions associated with the manufacturing of electric vehicle (EV) batteries, thereby fostering the industry’s ecological sustainability and overall sustainable progression. This investigation offers a comprehensive reference for policymakers, industrial enterprises, and research organizations, facilitating the advancement of the green transition within the battery sector.

Supplementary Materials

The following supporting information can be downloaded at: https://www.mdpi.com/article/10.3390/batteries11010023/s1, Background Data.

Author Contributions

R.F. served as the primary author, responsible for the development of the assessment model and the composition of the initial manuscript. W.G., in the capacity of the corresponding author, provided conceptual guidance and undertook comprehensive revisions of the manuscript. C.Z. contributed to the refinement and revision of the manuscript. Y.N. participated in the construction of the model and the execution of data analysis. J.L. is involved in the revision of the manuscript, the visualization and the data curation. All authors have read and agreed to the published version of the manuscript.

Funding

This research was funded by the Key Research and Development Program of Guangxi (AB23026112), Nature Science Foundation of Hubei Province (2024AFD099), Guangxi Major Science and Technology Project (AA23062065), The 111 Project (B17034).

Data Availability Statement

The raw data supporting the conclusions of this article will be made available by the authors on request.

Acknowledgments

In the preparation of this manuscript, the author use ChatGPT4.0 to assist in data analysis to im-prove efficiency and accuracy. The authors have thoroughly reviewed and carefully edited the AI output and take full responsibility for the content of this publication.

Conflicts of Interest

The authors affirm the absence of any known competing financial interests or personal relationships that could potentially bias the findings presented in this study.

References

  1. Du, X. Thoughts on strategies and paths to achieve carbon peaking and carbon neutrality in China. Front. Energy 2023, 17, 324–331. [Google Scholar] [CrossRef]
  2. He, B.; Yuan, X.; Qian, S.; Li, B. Carbon Neutrality: A Review. J. Comput. Inf. Sci. Eng. 2023, 23, 060809. [Google Scholar] [CrossRef]
  3. Liu, M.; Wu, J.; Lang, Z.; Meng, X. Long-term energy-environment-economic programming under carbon neutrality target: A study on China’s regional energy transition pathways and CO2 mitigation strategies. Energy Sources Part B Econ. Plan. Policy 2023, 18, 2229321. [Google Scholar] [CrossRef]
  4. Liu, X. The impact of China’s high-quality development of energy on carbon neutrality. Energy Rep. 2023, 9, 2665–2675. [Google Scholar] [CrossRef]
  5. Zhan, J.; Wang, C.; Wang, H.; Zhang, F.; Li, Z. Pathways to achieve carbon emission peak and carbon neutrality by 2060: A case study in the Beijing-Tianjin-Hebei region, China. Renew. Sustain. Energy Rev. 2024, 189, 113955. [Google Scholar] [CrossRef]
  6. Dai, F.; Kahrl, F.; Gordon, J.A.; Perron, J.; Chen, Z.; Liu, Z.; Yu, Y.; Zhu, B.; Xie, Y.; Yuan, Y.; et al. US-China coordination on carbon neutrality: An analytical framework. Clim. Policy 2023, 23, 929–943. [Google Scholar] [CrossRef]
  7. Morris, J.; Chen, Y.H.H.; Gurgel, A.; Reilly, J.; Sokolov, A. Net Zero Emissions of Greenhouse Gases by 2050: Achievable and at What Cost? Clim. Chang. Econ. 2023, 14, 2340002. [Google Scholar] [CrossRef]
  8. Tang, W.; Mai, L.; Li, M. Green innovation and resource efficiency to meet net-zero emission. Resour. Policy 2023, 86, 104231. [Google Scholar] [CrossRef]
  9. Zickfeld, K.; Macisaac, A.J.; Canadell, J.G.; Fuss, S.; Jackson, R.B.; Jones, C.D.; Lohila, A.; Matthews, H.D.; Peters, G.P.; Rogelj, J.; et al. Net-zero approaches must consider Earth system impacts to achieve climate goals. Nat. Clim. Chang. 2023, 13, 1298–1305. [Google Scholar] [CrossRef]
  10. Arvidsson, R.; Svanstrom, M.; Sanden, B.A.; Thonemann, N.; Steubing, B.; Cucurachi, S. Terminology for future-oriented life cycle assessment: Review and recommendations. Int. J. Life Cycle Assess. 2024, 29, 607–613. [Google Scholar] [CrossRef]
  11. Guo, W.; Feng, T.; Li, W.; Hua, L.; Meng, Z.H.; Li, K. Comparative life cycle assessment of sodium-ion and lithium iron phosphate batteries in the context of carbon neutrality. J. Energy Storage 2023, 32, 885–889. [Google Scholar] [CrossRef]
  12. Peters, J.F. Best practices for life cycle assessment of batteries. Nat. Sustain. 2023, 6, 614–616. [Google Scholar] [CrossRef]
  13. Bulut, M.; Özcan, E. How to build a state-of-the-art battery energy storage market? Challenges, opportunities, and future directions. J. Energy Storage 2024, 86, 111174. [Google Scholar] [CrossRef]
  14. Parsons, D. The environmental impact of disposable versus re-chargeable batteries for consumer use. Int. J. Life Cycle Assess. 2007, 12, 197–203. [Google Scholar] [CrossRef]
  15. Picatoste, A.; Justel, D.; Mendoza, J.M.F. Circularity and life cycle environmental impact assessment of batteries for electric vehicles: Industrial challenges, best practices and research guidelines. Renew. Sustain. Energy Rev. 2022, 169, 112941. [Google Scholar] [CrossRef]
  16. Simaitis, J.; Allen, S.; Vagg, C. Are future recycling benefits misleading? Prospective life cycle assessment of lithium-ion batteries. J. Ind. Ecol. 2023, 27, 1291–1303. [Google Scholar] [CrossRef]
  17. Feng, T.; Guo, W.; Li, Q.; Meng, Z.H.; Liang, W.C. Life cycle assessment of lithium nickel cobalt manganese oxide batteries and lithium iron phosphate batteries for electric vehicles in China. J. Energy Storage 2022, 52, 104767. [Google Scholar] [CrossRef]
  18. Tang, W.; Xu, S.; Zhou, X.; Yang, K.; Wang, Y.; Qin, J.; Wang, H.; Li, X. Meeting China’s electricity demand with renewable energy over Tibetan Plateau. Sci. Bull. 2023, 68, 39–42. [Google Scholar] [CrossRef]
  19. Xiang, M.-Y.; Wang, S.; Lu, L.-H.; Zhang, N.; Bai, Z.-H. Synergistic Paths of Reduced Pollution and Carbon Emissions Based on Different Power Demands in China. Huan Jing Ke Xue = Huanjing Kexue 2023, 44, 3637–3648, (In Chinese with English Abstract). [Google Scholar] [CrossRef]
  20. Zhu, G.; Huan, H.; Yu, D.; Guo, X.; Tian, Q. Selective Recovery of Lithium from Spent Lithium-Ion Batteries. Prog. Chem. 2023, 35, 287–301. [Google Scholar] [CrossRef]
  21. Jin, S.; Mu, D.Y.; Lu, Z.; Li, R.H.; Liu, Z.; Wang, Y.; Tian, S.; Dai, C.S. A comprehensive review on the recycling of spent lithium-ion batteries: Urgent status and technology advances. J. Clean. Prod. 2022, 340, 130535. [Google Scholar] [CrossRef]
  22. Ma, L.W.; Xi, X.L.; Zhang, Z.Z.; Lyu, Z. Separation and Comprehensive Recovery of Cobalt, Nickel, and Lithium from Spent Power Lithium-Ion Batteries. Minerals 2022, 12, 425. [Google Scholar] [CrossRef]
  23. de Biasi, L.; Schwarz, B.; Brezesinski, T.; Hartmann, P.; Janek, J.; Ehrenberg, H. Chemical, Structural, and Electronic Aspects of Formation and Degradation Behaviour on Different Length Scales of Ni-Rich NCM and Li-Rich HE-NCM Cathode Materials in Li-Ion Batteries. Adv. Mater. 2019, 31, 1900985. [Google Scholar] [CrossRef] [PubMed]
  24. Ellis, B.L.; Lee, K.T.; Nazar, L.F. Positive Electrode Materials for Li-Ion and Li-Batteries. Chem. Mater. 2010, 22, 691–714. [Google Scholar] [CrossRef]
  25. Ellis, B.L.; Nazar, L.F. Reply to Comment on “Positive Electrode Materials for Li-Ion and Li-Batteries”. Chem. Mater. 2012, 24, 2244–2245. [Google Scholar] [CrossRef]
  26. Finkbeiner, M.; Inaba, A.; Tan, R.B.H.; Christiansen, K.; Klüppel, H.J. The new international standards for life cycle assessment: ISO 14040 and ISO 14044. Int. J. Life Cycle Assess. 2006, 11, 80–85. [Google Scholar] [CrossRef]
  27. Klöpffer, W. The critical review of life cycle assessment studies according to ISO 14040 and 14044. Int. J. Life Cycle Assess. 2012, 17, 1087–1093. [Google Scholar] [CrossRef]
  28. Pryshlakivsky, J.; Searcy, C. Fifteen years of ISO 14040: A review. J. Clean. Prod. 2013, 57, 115–123. [Google Scholar] [CrossRef]
  29. Huijbregts, M.A.J.; Steinmann, Z.J.N.; Elshout, P.M.F.; Stam, G.; Verones, F.; Vieira, M.; Zijp, M.; Hollander, A.; van Zelm, R. ReCiPe2016: A harmonised life cycle impact assessment method at midpoint and endpoint level. Int. J. Life Cycle Assess. 2017, 22, 138–147. [Google Scholar] [CrossRef]
  30. Dekker, E.; Zijp, M.C.; van de Kamp, M.E.; Temme, E.H.M.; van Zelm, R. A taste of the new ReCiPe for life cycle assessment: Consequences of the updated impact assessment method on food product LCAs. Int. J. Life Cycle Assess. 2020, 25, 2315–2324. [Google Scholar] [CrossRef]
Figure 1. New energy vehicle production, sale, and market share, 2014–2035 (10,000 units).
Batteries 11 00023 g001
Figure 2. Emission reduction potential in power battery production phrase.
Batteries 11 00023 g002
Figure 3. Regional distribution of China’s power generation as a percentage.
Batteries 11 00023 g003
Figure 4. System boundary of LFP and NCM cells.
Batteries 11 00023 g004
Figure 5. Composition of NCM and LFP cells.
Batteries 11 00023 g005
Figure 6. Carbon footprint of LFP battery production stage.
Batteries 11 00023 g006
Figure 7. Carbon footprint of NCM cell production stage.
Batteries 11 00023 g007
Figure 8. Comparison of carbon emissions from battery production processes.
Batteries 11 00023 g008
Figure 9. Comparative analysis of ozone layer impacts: (a) ozone depletion potential, (b) human health ozone formation potential, (c) terrestrial ecosystem ozone formation potential.
Batteries 11 00023 g009
Figure 10. Comparative analysis of eutrophication impacts in aquatic systems, (a) freshwater eutrophication potential, (b) marine eutrophication potential.
Batteries 11 00023 g010
Figure 11. Comparison of eco-toxicity effects: (a) terrestrial eco-toxicity potential, (b) marine eco-toxicity potential, (c) freshwater eco-toxicity potential, (d) human carcinogenicity potential.
Batteries 11 00023 g011
Figure 12. Mainstream power generation in China by region [11].
Batteries 11 00023 g012
Figure 13. Comparison of carbon emissions from battery production processes.
Batteries 11 00023 g013
Figure 14. Comparative analysis of ozone layer impacts: (a) ozone depletion potential, (b) human health ozone formation potential, (c) terrestrial ecosystem ozone formation potential.
Batteries 11 00023 g014
Figure 15. Comparative analysis of eutrophication impacts in aquatic systems, (a) freshwater eutrophication potential, (b) marine eutrophication potential.
Batteries 11 00023 g015
Figure 16. Comparison of eco-toxicity effects: (a) terrestrial eco-toxicity potential, (b) marine eco-toxicity potential, (c) freshwater eco-toxicity potential, (d) human carcinogenicity potential.
Batteries 11 00023 g016
Table 1. New energy vehicle production, sale, and market share, 2014–2035 (10,000 units).
Year2014201520162017201820192020
EVsProduct7.8534.0551.679.4127.2124.2136.6
Sale7.4833.1160.777.7125.6120.6136.7
Market share0.3%1.35%1.81%2.69%4.47%4.68%5.40%
Year2021202220232024202520302035
Product354.5705.8958.71200140033004000
Sale352.1688.7949.51150136032003800
Market share13.4%25.6%31.6%45.0%50%70%90%
Table 2. Comprehensive carbon emission factors across the entire life cycle of power generation systems.
MethodsNumerical Value/(g/(kW-h))Average Value/(g/(kW-h))
Thermal powerCoal838.6, 810.0, 973.4874.0
Gas522.4, 420.0, 392.0444.8
Oil710.0710.0
Hydro power3.3, 12.8, 3.5, 25.8, 18.5, 22.215.1
Wind power28.6, 17.8, 31.4, 2.720.1
Solar power92.0, 119.4, 28.8, 50.072.5
Nuclear power13.4, 10, 20, 1514.6
Table 3. Table of symbols and units.
Parameter NameNotationUnit
Theoretical (gram) capacityCtheoreticalmAh/g
Actual (gram) capacityCactualmAh/g
Faraday’s constantFC/mol
Molecular weightMg/mol
Lithium quantitynLimol
Li-ion removal coefficientµLiDimensionless,less than one
Battery design capacityQdesignmAh
Coating layer density Γcoatingg/m2
Proportion of active substance PactiveDimensionless,less than one
Gram capacity of active substanceCactivemAh/g
Electrode coating areaAm2
N/P ratioRN/PDimensionless,less than one
Gram capacity of negative active substanceCnegativemAh/g
Density of negative surfaceΓnegativeg/m2
Content ratio of negative active substancePnegativeDimensionless,less than one
Gram capacity of positive active substanceCpositivemAh/g
Density of positive surfaceΓpositiveg/m2
Content ratio of positive active substancePpositiveDimensionless,less than one
Battery mass energy densityΓmassWh/kg
Battery volumetric energy densityΓvolumeWh/L
Battery capacityQmAh
Battery massmkg
Battery volumeVL
Battery voltageUV
Disclaimer/Publisher’s Note: The statements, opinions and data contained in all publications are solely those of the individual author(s) and contributor(s) and not of MDPI and/or the editor(s). MDPI and/or the editor(s) disclaim responsibility for any injury to people or property resulting from any ideas, methods, instructions or products referred to in the content.