Article

Investigation of the Suitability of the DTV Method for the Online SoH Estimation of NMC Lithium-Ion Cells in Battery Management Systems

1
BorgWarner Battery Systems Technical Center GmbH, Kleyerstraße 20, 64295 Darmstadt, Germany
2
Institute for Materials Science and Engineering (IMaSE), Hochschule Mannheim, Paul-Wittsack-Straße 10, 68163 Mannheim, Germany
*
Authors to whom correspondence should be addressed.
These authors contributed equally to this work.
Batteries 2025, 11(1), 25; https://doi.org/10.3390/batteries11010025
Submission received: 7 November 2024 / Revised: 19 December 2024 / Accepted: 25 December 2024 / Published: 13 January 2025
(This article belongs to the Section Battery Performance, Ageing, Reliability and Safety)

Abstract

:
Investigating the temperature behavior of lithium-ion battery cells has become an important part of today’s research and development. The main reason for this is that the temperature profile of a battery cell changes during aging. By using Differential Thermal Voltammetry (DTV), new possibilities are opened up, especially since this diagnostic method is designed to work in operando by only requiring voltage and temperature readings. In this study, a batch of NMC-21700 cells were aged in calendar and cyclic manners. After a specified aging cycle was complete, a check-up measurement was performed. During this time, the cycler collected the electrical measuring values, while a negative temperature coefficient thermistor, which was located on the cell, was used to record the temperature fluctuations. The data were then evaluated by using the DTV analysis technique. By comparing the characteristic points of DTV, correlations between the changing curve characteristics and the capacity loss, and therefore the aging of the respective cell, were established. Based on these results, a simple model suitable for online State of Health (SoH) is derived and validated, showing an estimation accuracy of 1.1 %.

1. Introduction

To slow down global warming, it is essential to reduce worldwide CO2 emissions [1,2]. Therefore, the transportation sector is undergoing a transformation towards battery-electric propulsion concepts [3,4]. Typically, lithium-ion batteries are used in these propulsion configurations to store and provide electrical energy because they are characterized by high energy and power density, low self-discharge rates, and a long service life [5,6,7].
One main factor in the life cycle assessment of battery-electric propulsion concepts is the service life of the battery, which is limited, as the capacity and power performance of a battery decreases over time depending on the usage scenario. In particular, traction batteries are exposed to severe aging factors, e.g., long periods of use and high currents [8]. For these reasons and also for safety reasons, it is essential to be able to monitor the aging of traction batteries during application.
Batteries age due to various reasons. In general, battery aging can be divided into three main degradation modes: (1) a loss of the lithium inventory (LLI), (2) a loss of active material (LAM) of the anode, and (3) LAM of the cathode, whereby Birkl et al. [9] summarize the underlying degradation mechanisms for each mode. However, the individual aging mechanisms cannot be observed directly in the application. Only the effects of aging can be observed: first, the reduction in capacity, and second, the increase in the internal resistance. Therefore, to quantify the “age” of a battery, the State of Health (SoH) of a battery is typically either defined in terms of capacity or in terms of resistance.
In this work, we focus on the SoH in terms of capacity, S o H C , which is defined in agreement with Jossen et al. [10] and Börger et al. [11] by the following:
S o H C = C a c t C n o m ,
relating the battery’s actual capacity C a c t to its nominal capacity C n o m .
In most applications, it is not possible to directly measure C a c t to then calculate S o H C . Therefore, different methods exist to estimate S o H C based on the voltage, current, and temperature of the battery [12], as these can be measured directly. These can be grouped into “online methods”, “workshop methods” and “lab methods”.
Online methods are able to provide an S o H C estimate while the battery is in normal use. These are, for example, Kalman filter approaches [13], semi-empirical aging models [14], or approaches based on neural networks [15].
Workshop methods are characterized by the fact that a routine for measuring the capacity C a c t of the battery is carried out in a workshop, whereby the battery can typically remain installed on the vehicle without further modifications. The method is mostly used to validate an online estimated S o H C , as in practice, it is usually the only possibility to perform a validation with a reasonable effort.
Lab methods give the most accurate S o H C estimate and often also allow gaining more insights into the underlying aging modes a battery was subject to. However, these highly specialized methods can only be performed in a laboratory environment with specialized measurement equipment and thus are not usable in battery-electric applications directly. Typical laboratory measurement methods are, for example, differential voltage analysis (DVA) [16], differential thermal voltammetry (DTV) [17], slow-rate cyclic voltammetry (SRCV) [18], or electrochemical impedance spectroscopy (EIS).
In this article, we investigate how the DTV method can also be used for an online estimation of S o H C , so that it can be used as a new method for online S o H C estimation or could support existing online estimation methods. Additionally, the online DTV could yield insights into the aging mode at hand. For this reason, the DTV and the closely related DVA will be discussed in more detail below.
One method of identifying degradation mechanisms and determining their progression over the aging of a battery cell is to use the DVA evaluation method. This technique is characterized by a charging or discharging cycle that is carried out at a low, constant current while keeping the cell at a constant temperature and recording the voltage response of the cell. Then, the differential voltage D V is calculated by
D V = d V d Q ,
where V is the measured cell voltage and Q the electrical charge of the cell. Plotting D V over the State of Charge (SoC) then yields a characteristic curve that changes as the cell ages and, thus, reveals information on the aging modes of the cell. To be able to record a meaningful DVA curve, it is essential to use a low C rate.
According to Keil [16], a current of C 20 should be selected for such a measurement in order to achieve the most accurate sampling of the cell voltage. This is particularly important, as four phase changes occur in the graphite anode during the intercalation of lithium into the graphite structure. At these points, a voltage fluctuation can be seen in the measurement curve at low charging currents, which is not recognizable at high currents. Further information on the phenomenon of phase changes can be found in the article by Asenbauer et al. [19].
By contrast, Mitin [20] states that even a current of C 50 should be used. The reason given here is that a quasi-OCV line is measured in this way, allowing the characteristic features to be recorded. In a later paragraph it even is discussed to use C 100 instead, so as to have an even better probability of recording the voltage fluctuations.
According to the article by Lewerenz et al. [21], a current of C 4 is sufficient to record all important characteristics in the measurement and evaluate them with the DVA method. However, it should be noted that this article examines LFP cells, whose DVA curves have different peaks to look for and thus must be analyzed accordingly.
The DTV is very similar to the DVA. In this case, the quotient
D T = d T d V
is considered, where V is the measured cell voltage and T is the cell’s measured surface temperature. No distinction is made between the individual temperature gradients within the cell. Plotting D T over the Voltage V then yields a characteristic curve that changes as the cell ages. The changes again provide information about the aging state and the respective aging modes of the cell. According to Merla et al. [17] and Wu et al. [18], both a shift towards a higher voltage and flatter extreme points indicate a decreasing SoH.
In contrast to the low currents used in the DVA, the DTV method needs to be performed with much higher currents. The article by Merla et al. [17] shows that currents of 2 C can be used. Furthermore, gradation down to 0.5 C was tested. It was found that the measured cells would still have an acceptable heat generation, thus making the measured data still viable for a DTV analysis. This is also confirmed by the study of Shibagaki et al. [22], in which they cycled LFP cells at 0.5 C and 2 C. Furthermore, it is explained that a current of 3 C was defined as the upper limit. Beyond this limit, the enthalpic heat would mask the entropic heat, rendering the measurement results unusable.
In another work presented by Merla et al. [23], the DTV is placed in the context of different evaluation methods, such as EIS or SRCV. Although they are unable to specify the aging in a precise way, the results show that the graphs of the DTV evaluation provide an outlook on the aging of the cell. Thus, the DTV is seen as an extension of other analysis methods and not as a stand-alone option for accurately measuring the SoH.
Prosser et al. [24] show that the DTV analysis provides an insight into the degradation modes. Although the three variants LLI, LAM of the anode, and LAM of the cathode could be detected using the DTV, it was not possible to quantitatively evaluate the three modes. However, an outlook is given that it is possible to implement the DTV as a separate method for measuring the SoH on a battery management system (BMS). Together with the high possible current of 2 C, this would make it feasible to determine the SoH and also the degradation modes online.
Wang et al. [25] use the DTV to predict the SoH. At first, they extracted the peak positions, peak values, and valley values of the discharge curves of the DTV. Here, the tested cells were 18650-sized lithium-ion batteries composed of LiCoO2. Afterward, the sorted data points were used to establish a model by utilizing the Gaussian process regression. In the end, they proved their approach by testing the model with another set of cells and calculating the corresponding prediction error, which was under 2%.
Ma et al. [26] show similar ideas. In this article, charging cycles are analyzed using the DTV method. The resulting data are then used to train a long short-term memory neural network. This leads to the possibility of predicting the SoH as well as the remaining useful lifetime.
The fact that the DTV can be performed with high currents compared to most other lab methods, and the fact that constant-current phases occur during the normal charging operation of most traction batteries, is the motivation for the work presented here to investigate the suitability of the DTV for an online S o H C estimation. The contributions in this article include the groundwork for such an online estimator. That is: first, we present the identification and assessment of various features of the DTV curves of a 21700 NMC Li-ion cell that are suitable to estimate the S o H C . Second, we present the derivation of a simple formula suitable for an online implementation in a BMS based on the most significant feature. Third, we present the successful validation of the derived formula with a separate test dataset containing data of cells that have been aged with realistic driving profiles.
The remainder of this article is structured as follows. In Section 2, it is explained which cells and aging data serve as a basis for this work. In Section 3, the identification and assessment of various features that could be considered for SoH estimation are presented. Based on this assessment, a simple SoH estimation formula is derived and validated in Section 4. The conclusions are then summarized in Section 5.

2. Experimental Setup

In this section, the device under test, the utilized testbench, and the check-up cycle used are introduced. Then, the respective test matrices are explained, which are used for the calendar as well as the cyclic aging of the cells.

2.1. Device Under Test
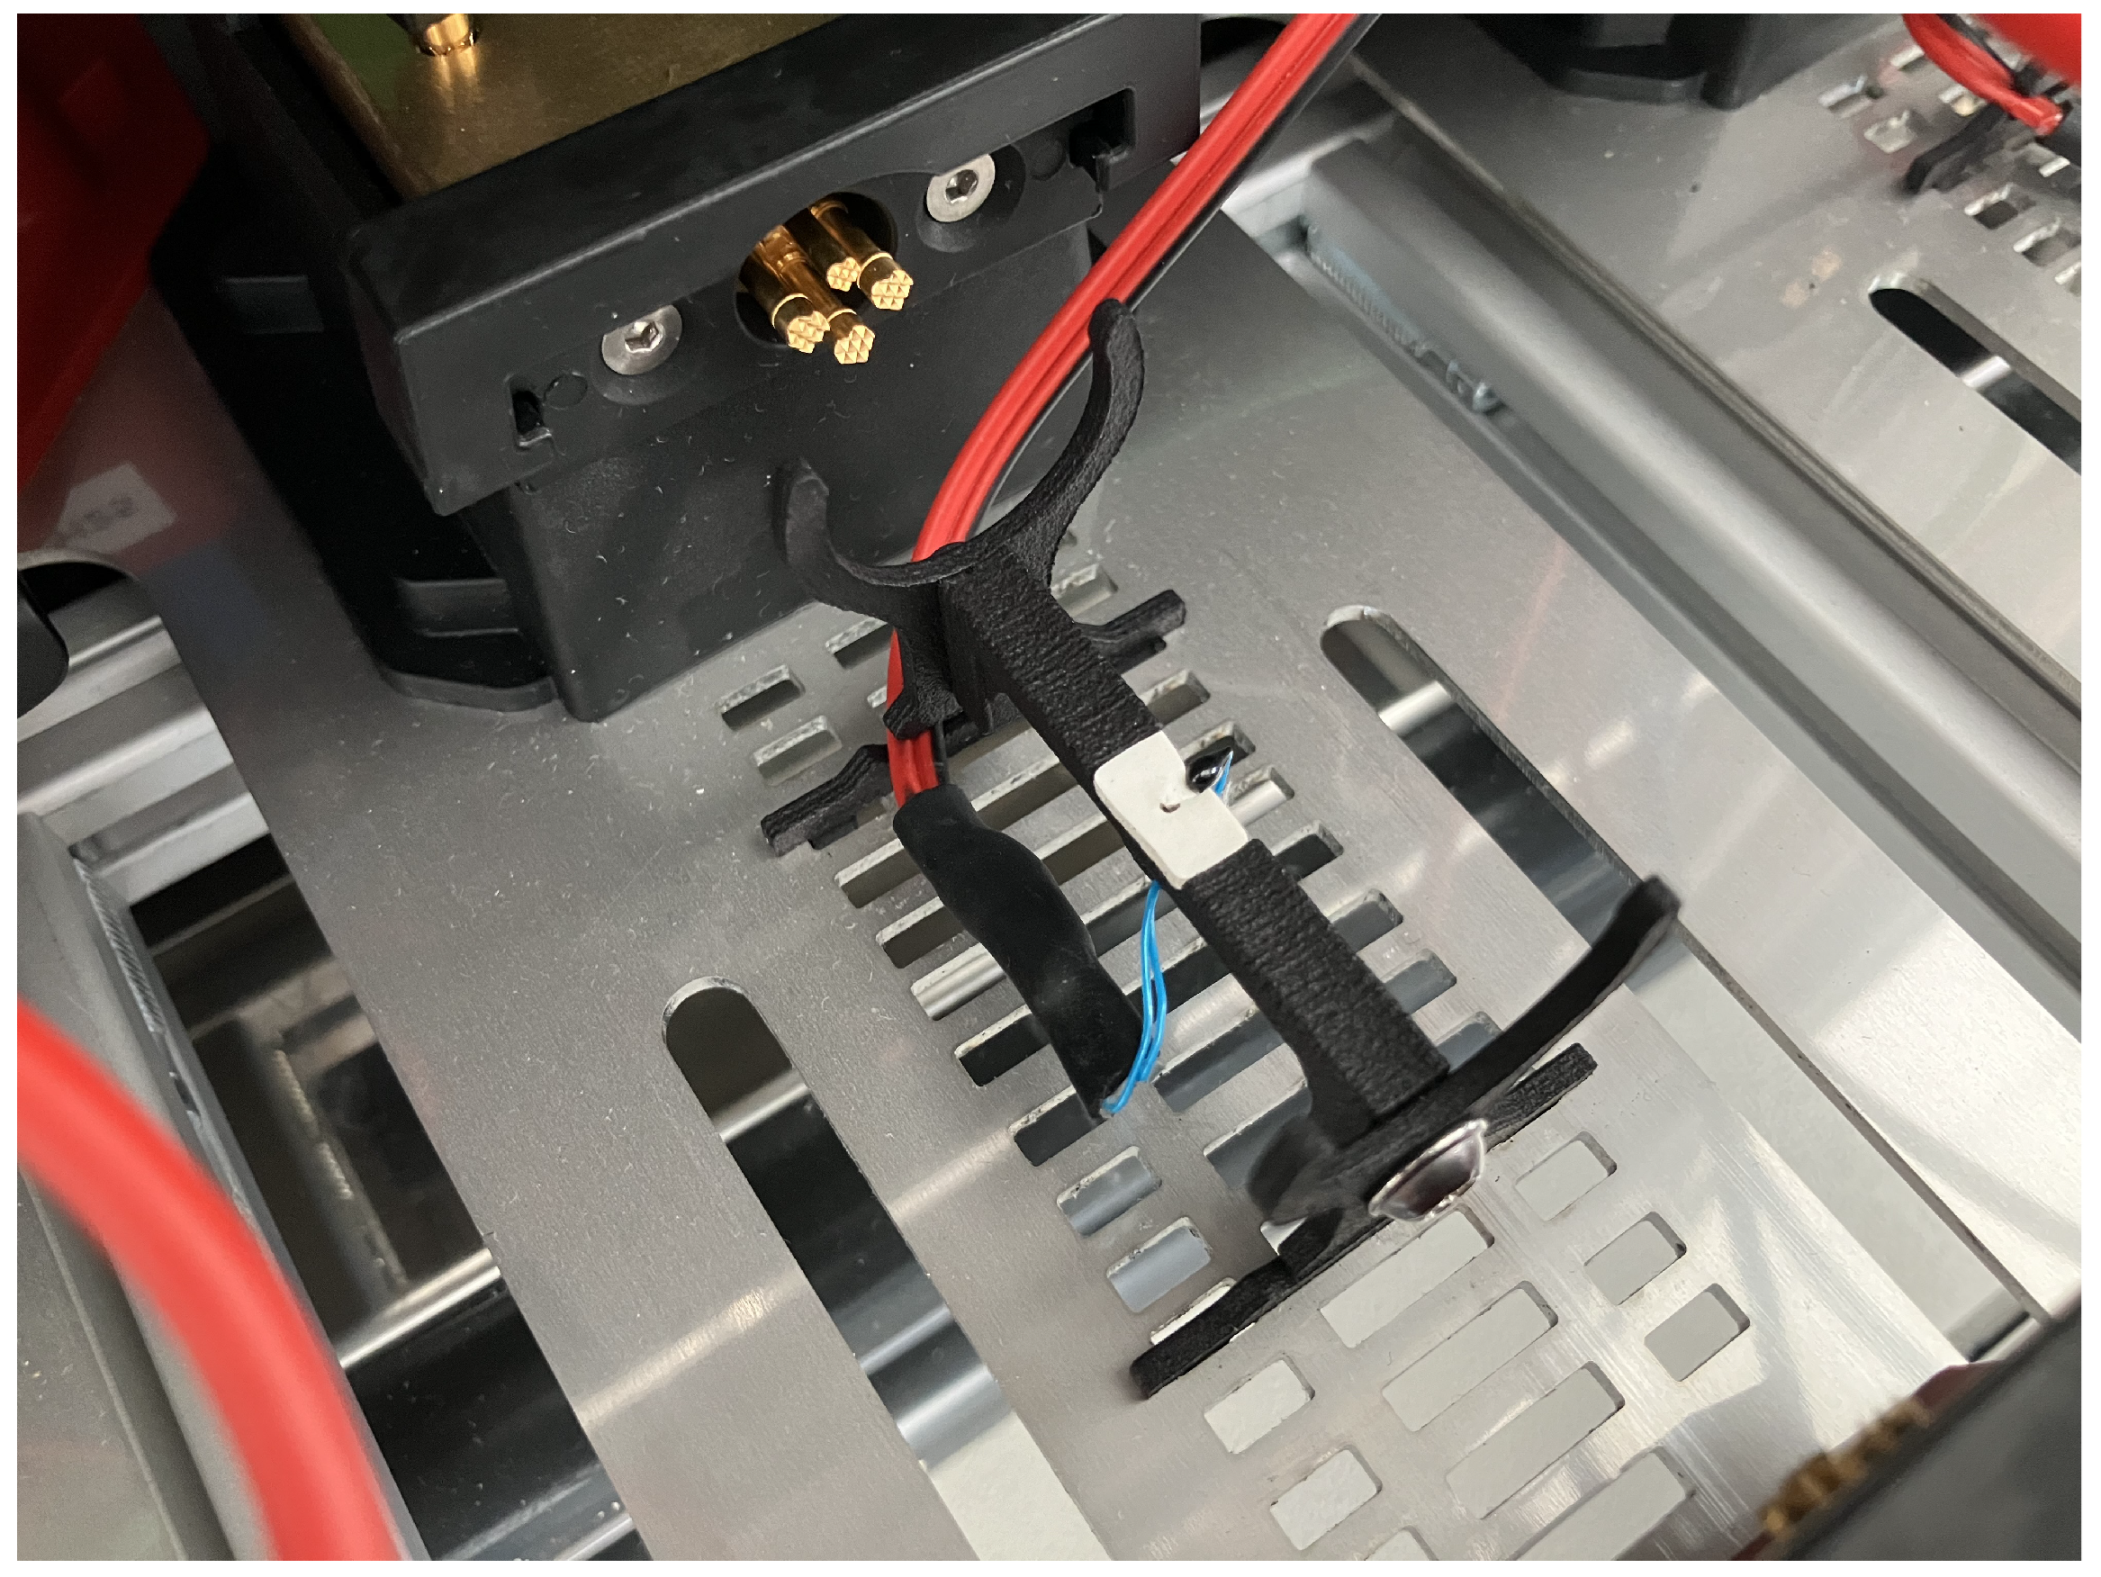
The cell under investigation is a 21700 cylindrical cell. The active material of the anode consists of graphite. The cathode consists of a nickel manganese cobalt oxide. The composition of the cathode is approximately eight parts nickel, one part manganese, and one part cobalt (NMC 8-1-1). Accordingly, the cell is classified as a high-energy cell. The technical specifications can be found in Table 1 below.

2.2. Testbench

The battery cells were cycled and characterized using several BaSyTec CTS (Cell Test System) (BaSyTec GmbH, Asselfingen, BW, Germany)potentiostats. These have 32 channels with a voltage range of 0–6 V. The maximum current is 5 A per channel. The measurement frequency is 16 bit, with an accuracy of 1 μm. The accuracy of the current measurement is 1 mA. The voltage measurement is accurate to 1 mV. An optional external NTC thermistor is connected to each cycling channel.
For reproducible clamping of the cells, the KSR 150 system from Voltavision (Voltavision GmbH, Bochum, NRW, Germany) was used, which can be loaded with up to 150 A. In addition to the electrical contacts, the KSR 150 also ensures that the temperature sensor is pressed onto the cell housing in the middle of the longitudinal axis, as seen in Figure 1.
The holder systems were installed in climate chambers from the manufacturer Weiss Technik (Weiss Technik GmbH, Reiskirchen, HE, Germany). The LabEvent T/210/40/3/M was used here. These were calibrated for a temperature range between −25 °C and 80 °C.

2.3. Check-Up Definition

In order to characterize the batteries initially and continuously during aging, a so-called Check-Up (CU) cycle must be defined. This ensures comparability between the individual measurement results. The CU was divided into six sections and is shown in Figure 2. Phase 1 was used to generate a standardized starting condition. The cells were heated to 25 °C and then charged with a current of 0.3 C to 4.2 V (incl. CV phase.) After a 15 min break, the first of two capacity measurements with 0.2 C took place in phase 2, followed by a 15 min break. Phase 3 comprised a complete CCCV charge with 0.3 C and a cut-off criterion of 50 mA for the CV phase, completed by a 15 min pause. Phase 4 was used for the second capacitance measurement, interrupted by a 15 min break. A C/10 charge was carried out in phase 5. After a final pause, a SoC of 50% was set in phase 6 by means of discharge with 0.3 C. Afterward, an internal resistance measurement was carried out by a pulse test. The current pulse had a duration of 30 s and a current amplitude of 0.5 C. The charge in phase 3 was used for the subsequent DTV method and phase 5 for the DVA method.

2.4. Test Matrix

A central element of this study is the aging tests. These tests serve as the foundation for subsequent evaluations using the presented methodology. To ensure a systematic approach, a categorization of the tests into two groups is necessary: calendar tests and cyclical tests. Within these groups, we deliberately introduce varying aging influences. Here, it is important to maintain consistency by altering only one influence from test point to test point. This design of the test matrix makes it possible to discern dependencies between aging effects and specific influences. Both test groups started with an initial CU cycle, followed by subsequent CU cycles at regular intervals. For the calendar test series, a measurement interval of 30 days was aimed for. By contrast, the cyclical tests were defined by 100 equivalent full cycles. During the intervals between CU cycles, individual cells underwent aging under carefully controlled boundary conditions. When selecting test points, the representing of the relevant areas of influence for future application in electrified commercial vehicles was prioritized. Boundary areas were additionally included to validate the general applicability.

2.4.1. Calendar Aging

Aging influences include temperature and the storage SoC. In order to determine the effects of the SoC and temperature, various cells with different T–SoC combinations were stored in climate chambers. The cells were not connected to any test device. An open circuit applies. The individual influencing combinations can be seen in the following Table 2. It should be mentioned that an attempt was made to form so-called axes of test points on which more than four test points lie within the variation of an aging influence, so that a physical mathematical relationship can be formulated later. The temperature variation at a 60% SoC is mentioned as an example. Five different temperatures are included here. A similar procedure should be followed for the SoC dependency. In order to gain an impression of the cell quality and scattering during aging, three cells were tested per test point. The generated dataset was later divided into a design dataset and a validation dataset. A total of 51 calendar-aged cells were examined over a period of several years.

2.4.2. Cyclic Aging

The same procedure applies to the cyclical aging tests. Cyclic aging focuses on the effects that can be observed due to the dependencies on the selected SoC window, i.e., the DoD and the associated average SoC as well as the charging and discharging current. The following Table 3 provides an overview of the selection of test points. An attempt was also made to include more than three points of a suspected dependency. Due to the availability of test capacities and costs, only simple redundancy was used at the test points examined. A total of 20 cells were also examined here. The test procedure was identical for all cells. At the end of the CU cycle, the cells were loaded onto the start SoC. The start SoC was Ah-controlled, based on the last measured capacity. Discharge to the lower SoC was also Ah-controlled. This procedure was repeated for five cycles. Lower and upper voltage limits were set in each case. These limits applied to the remaining cycles. This prevented the error based on the current sensor inaccuracy from being continuously accumulated and also corrected the OCV curve drift by constantly resetting the voltage limits after a CU. The specified currents were kept constant during charging and discharging. A temperature sensor constantly measured the temperature development on the housing of the battery cell.

3. Model Development

In the first step, the DTV phase described above was extracted from the check-up cycles. The recorded measurement data were then processed using a Gaussian algorithm and prepared for further evaluation. In the final step, the respective measurement data were then used to calculate and display the corresponding DTV curves.

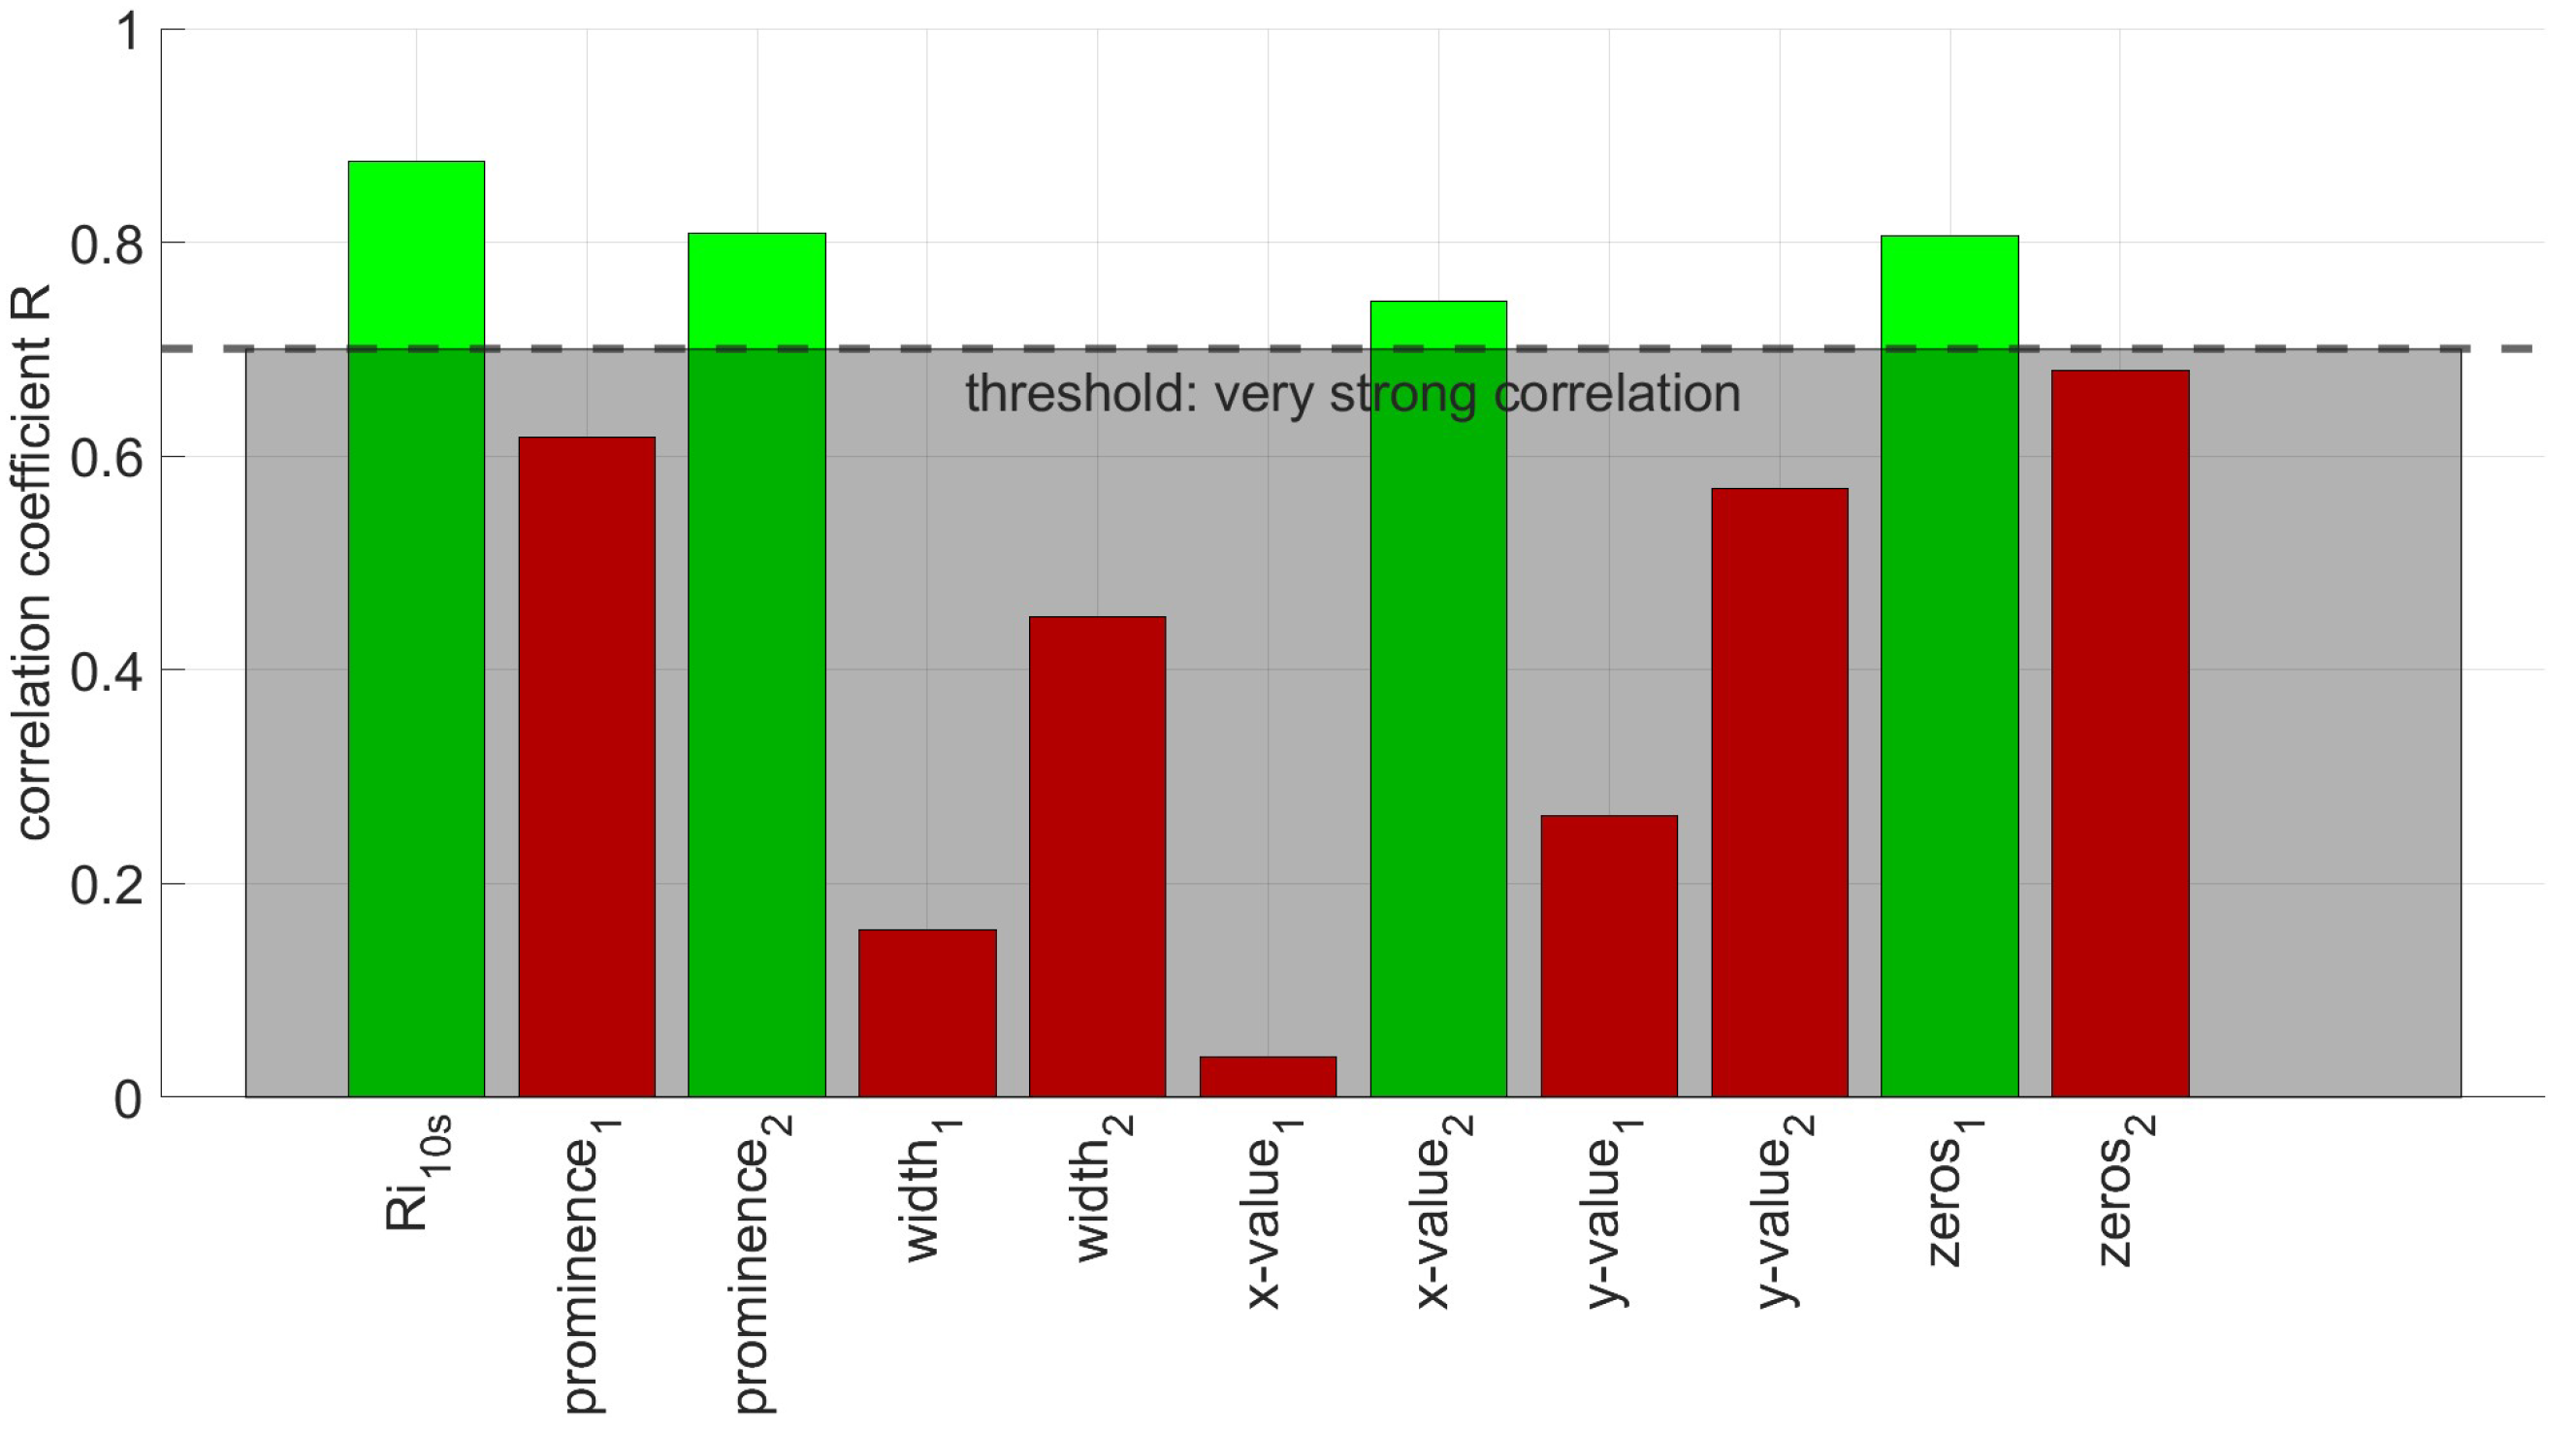
3.1. Distinctive Points

In order to be able to evaluate the curves, certain correlations and parameters of the measurement curves were sought. In the article by Keil [16], three extreme points are marked and named for the DVA. They then serve as comparable factors between the individual measurement curves, while also the distance between the extreme points is considered here. In the DVA, these three named distances provide an indication of the aging mechanisms taking place in the battery, namely the loss of lithium inventory or the loss of active anode or cathode material. Further information on this topic can be found in Zülke et al. [27] and Lewerentz et al. [28].
This principle of recognizing extreme points in the DVA now serves as a blueprint for the following evaluation carried out here. The DTV curves presented in this work have a maximum, a minimum, and two zero points. It is important to note that only charging phases are part of the investigation presented in this work. This is because of the steady current that is possible during those phases, which makes them a better fit for realistic application purposes. By contrast, discharging cycles in commercial vehicles often consist of rapidly changing currents and even small charging phases during recuperation, which renders them difficult to analyze. In the next step, these distinctive points (DiPos) are determined and compared with each other over the aging process of the cell. Merla et al. [17] and Wu et al. [18] show that the DiPos move towards a higher voltage range as the cell ages, while the extreme points also become flatter over time.
The following illustration in Figure 3 shows the DiPos in an exemplary manner.
In Figure 3a, the x- and y-values are demonstrated once using the first extreme point, as well as the zero points. In addition, the characteristic value of the prominence of a peak has been calculated and included in the evaluation as part of this work. This prominence represents a weighted height of the extremum. It takes into account the extent to which the extreme points are distributed in the graph. Specifically, the graph in Figure 3a shows that peak 1 has a much lower prominence value (yellow) than peak 2 (green area). This is because in this example, peak 2 is higher than peak 1 and therefore the base of the lower peak must also be considered here. In addition, the width of the extreme point is considered as well, which is calculated at the half point of the prominence.
The presented DiPos can now be seen in Figure 3b, where they are transferred to an exemplary DTV graph. In this presented charging cycle, a maximum ( p e a k 1 ) as well as a minimum ( p e a k 2 ) can be seen.

3.2. Model Structure

In order to create a suitable model, the cells relevant to the model must first be identified and grouped into different categories. The mentioned classification is based on the different parameter settings under which the cells in question were aged. For example, the cell cluster “DoD” can be formed for the cyclical-aged cells. In this case, all cells that have the same aging configuration, except the DoD, are considered. This single setting is the only difference between their aging parameters. The following cell clusters were formed for the cyclical measurement data as part of the evaluation:
  • DoD;
  • Mid-SoC;
  • Temperature;
  • Charging current;
  • Discharging current.
The calendar-aged cells only vary in the temperature and the corresponding SoC, which is why only two clusters are possible here:
  • SoC;
  • Temperature.
Now, the defined cell clusters together form the design dataset. In a later step, the model is created using this measurement data and the corresponding equations are calculated as well. The measurement data from the other cells that have not yet been used are then organized as the validation dataset. This opens up the opportunity of checking the reliability and accuracy of the model created with these measurements.
The cells of the design dataset are used to gain initial insights into the dependencies and correlations between the measurement data and the SoH. The various DiPos of the different measurement curves can now be determined and plotted against the SoH. Equations can be extracted from the resulting point clouds. In this way, a direct correlation between the distinctive points of the DTV and the SoH of the aged cells was established.

4. Results

In the following chapter, the equations of the regression lines used are first explained in more detail. Later, the different validation steps are shown and explained.

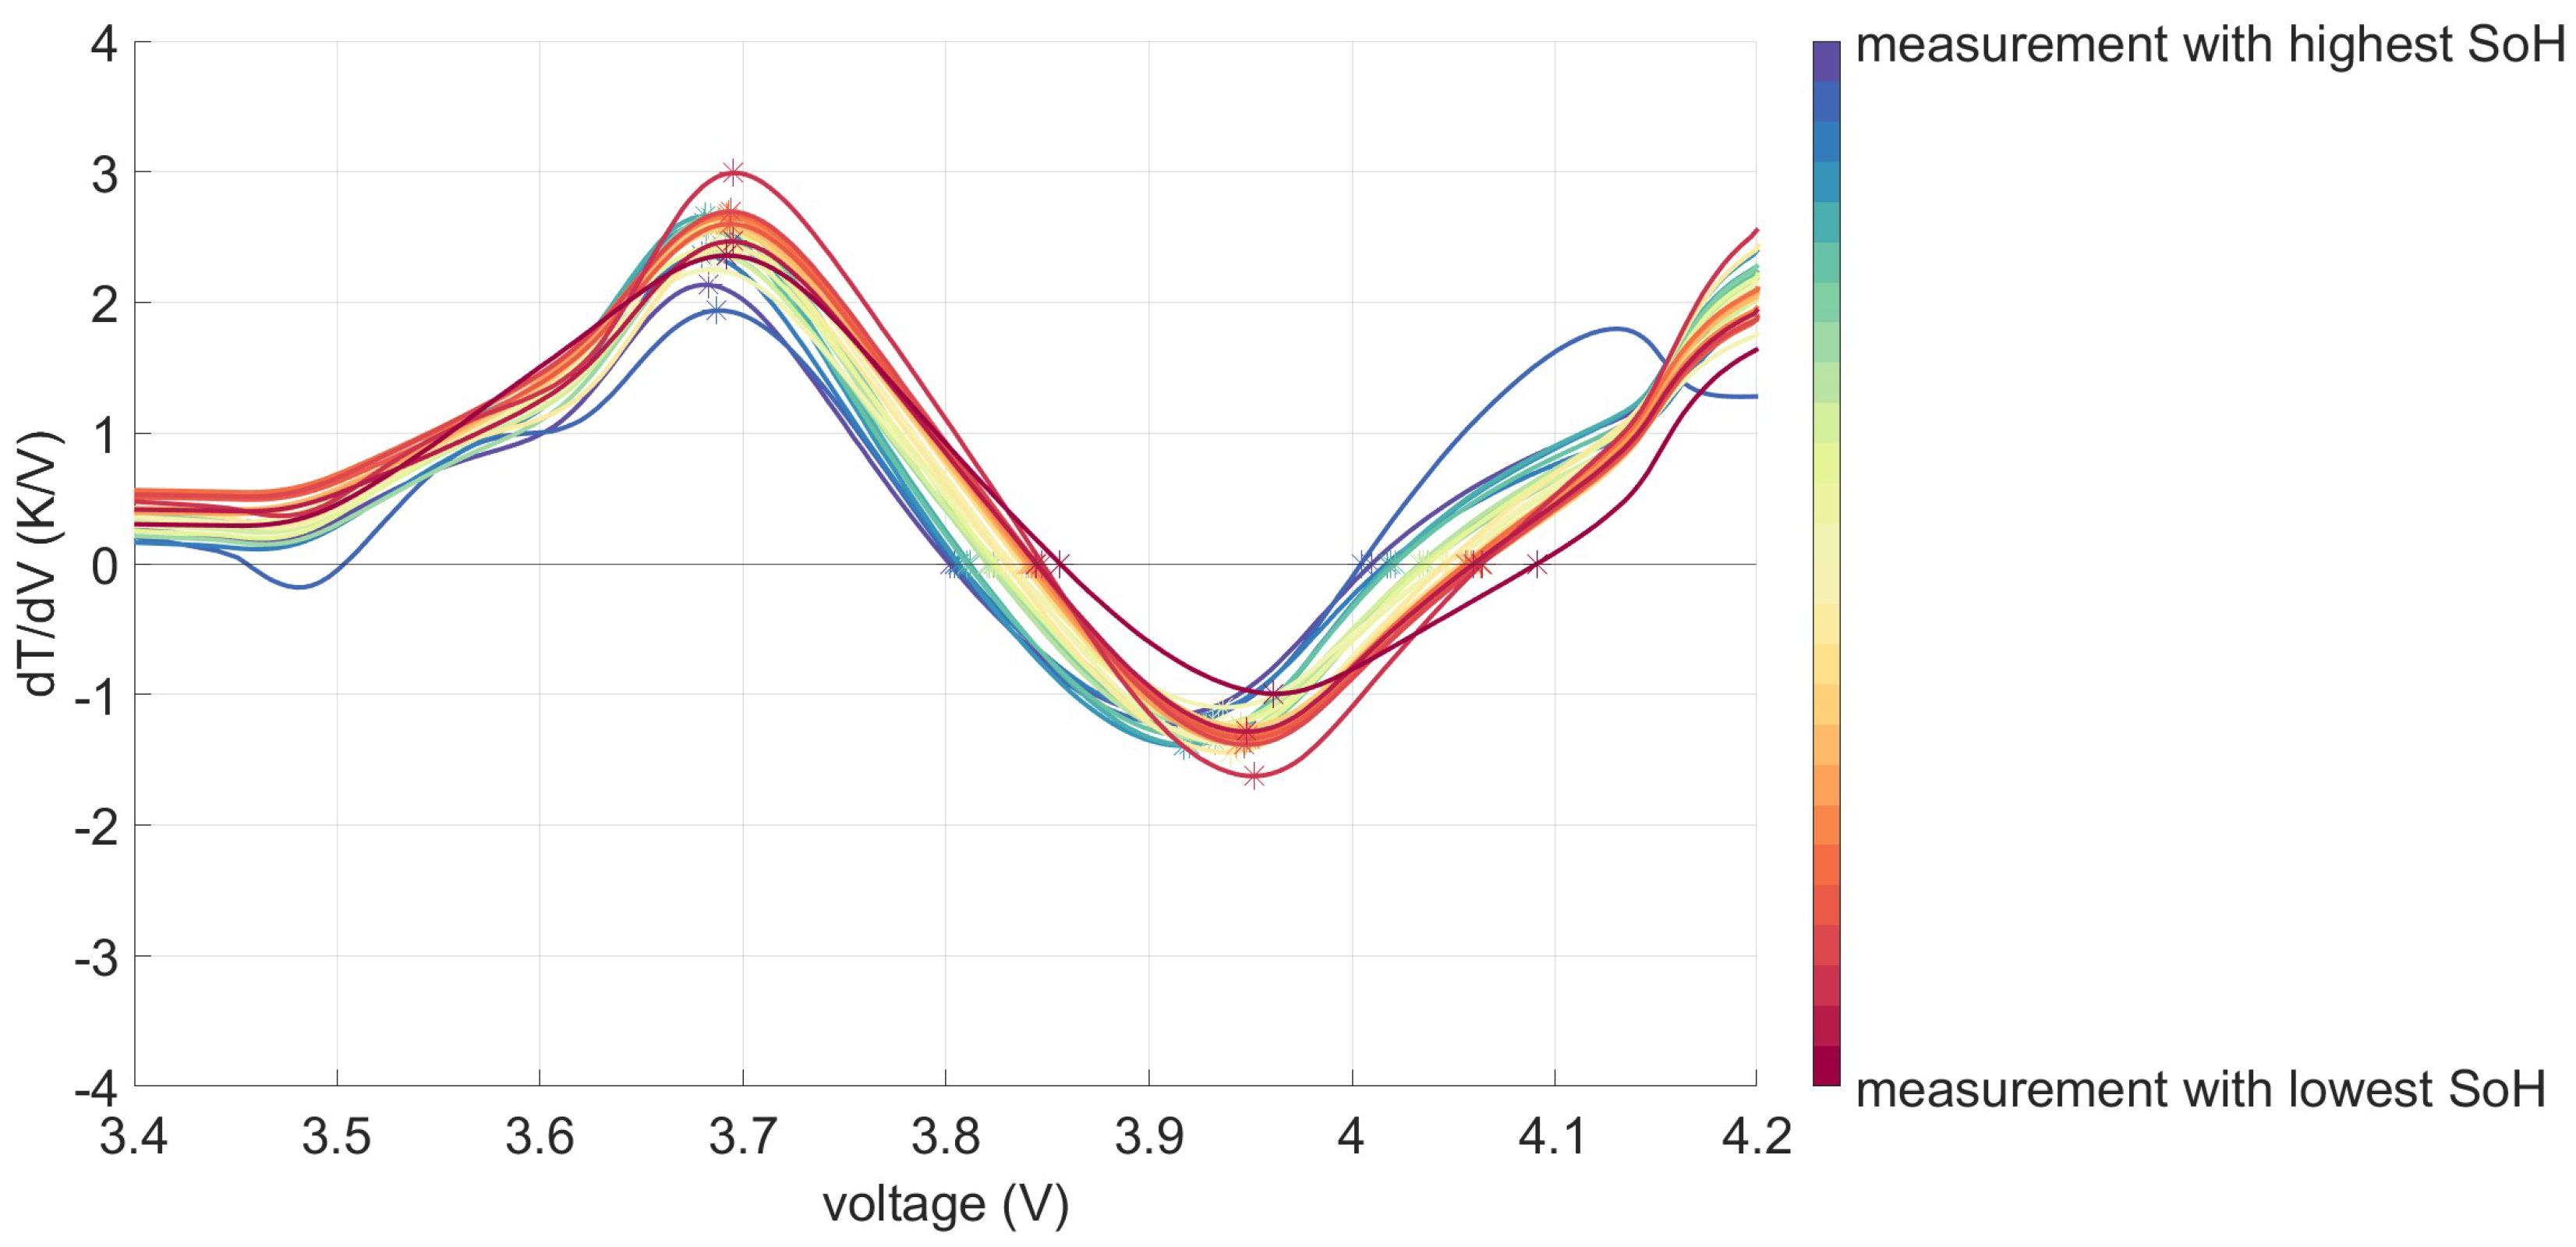
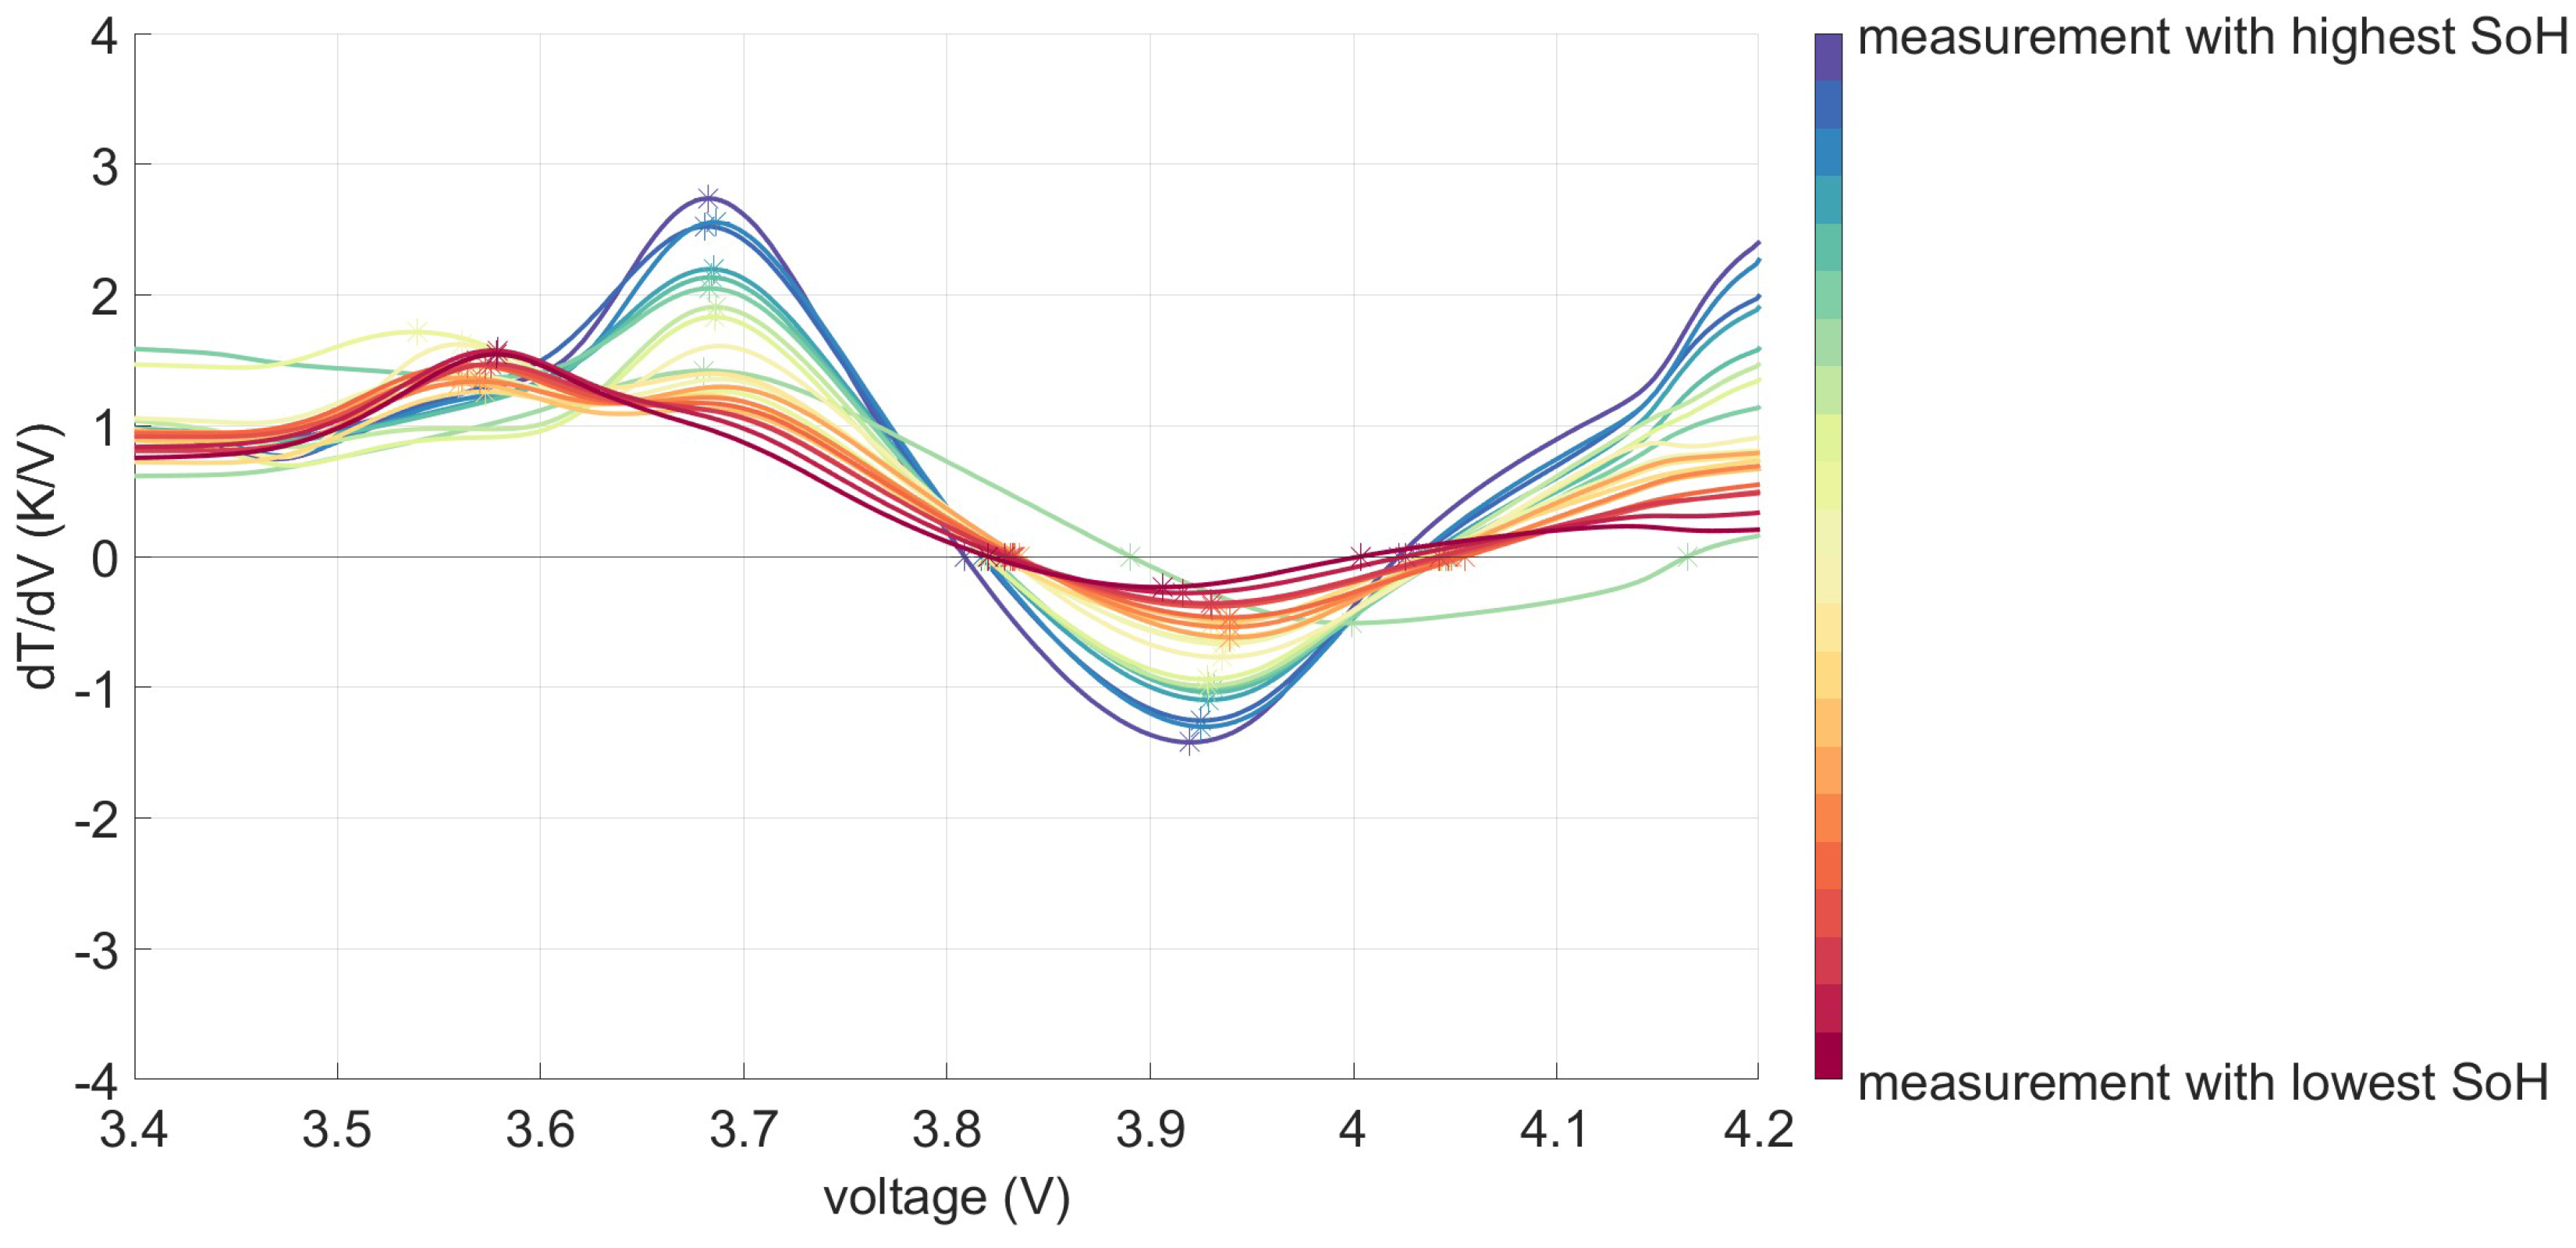
4.1. Analysis of the DTV Curves

In the first step, the different measurement data were refined. Here, a Gaussian filter was used to transform the noisy data into a clear form and enable the results to be processed further. Afterward, the corresponding DTV curves were calculated and plotted. In the following two graphs in Figure 4 and Figure 5, examples of the curves of a calendar-aged and a cyclic-aged cell can be seen. In the case of the calendar-aged lithium-ion cell, a shift in the zero points towards a higher voltage value and a simultaneous change in the extreme points can be seen. This is in line with the results Merla et al. [23] and Wu et al. [18] stated in their respective articles.
These changes can also be seen in the cyclic-aged cell. Here, the extreme points become constantly flatter as well. At the same time, however, the first maximum disappears completely. In return, a new maximum occurs at a voltage that is around 0.1 V lower than before. However, this occurs only in cells that have a high charging rate, so although it is not very common amongst the used test sample, it is still important to note, especially with regard to quick charging.
Although this paper is explicitly analyzing the behavior of used NMC cells, the principle behind the method can be used for investigating other cell compositions as well. For example, the DTV charging cycle of an LFP cell shows a valley followed by a peak. According to Shibagaki et al. [22], even though the explanation of why these peaks occur is different to that of an NMC cell, a similar correlation between the features of the DTV graphs and the SoH can be found.

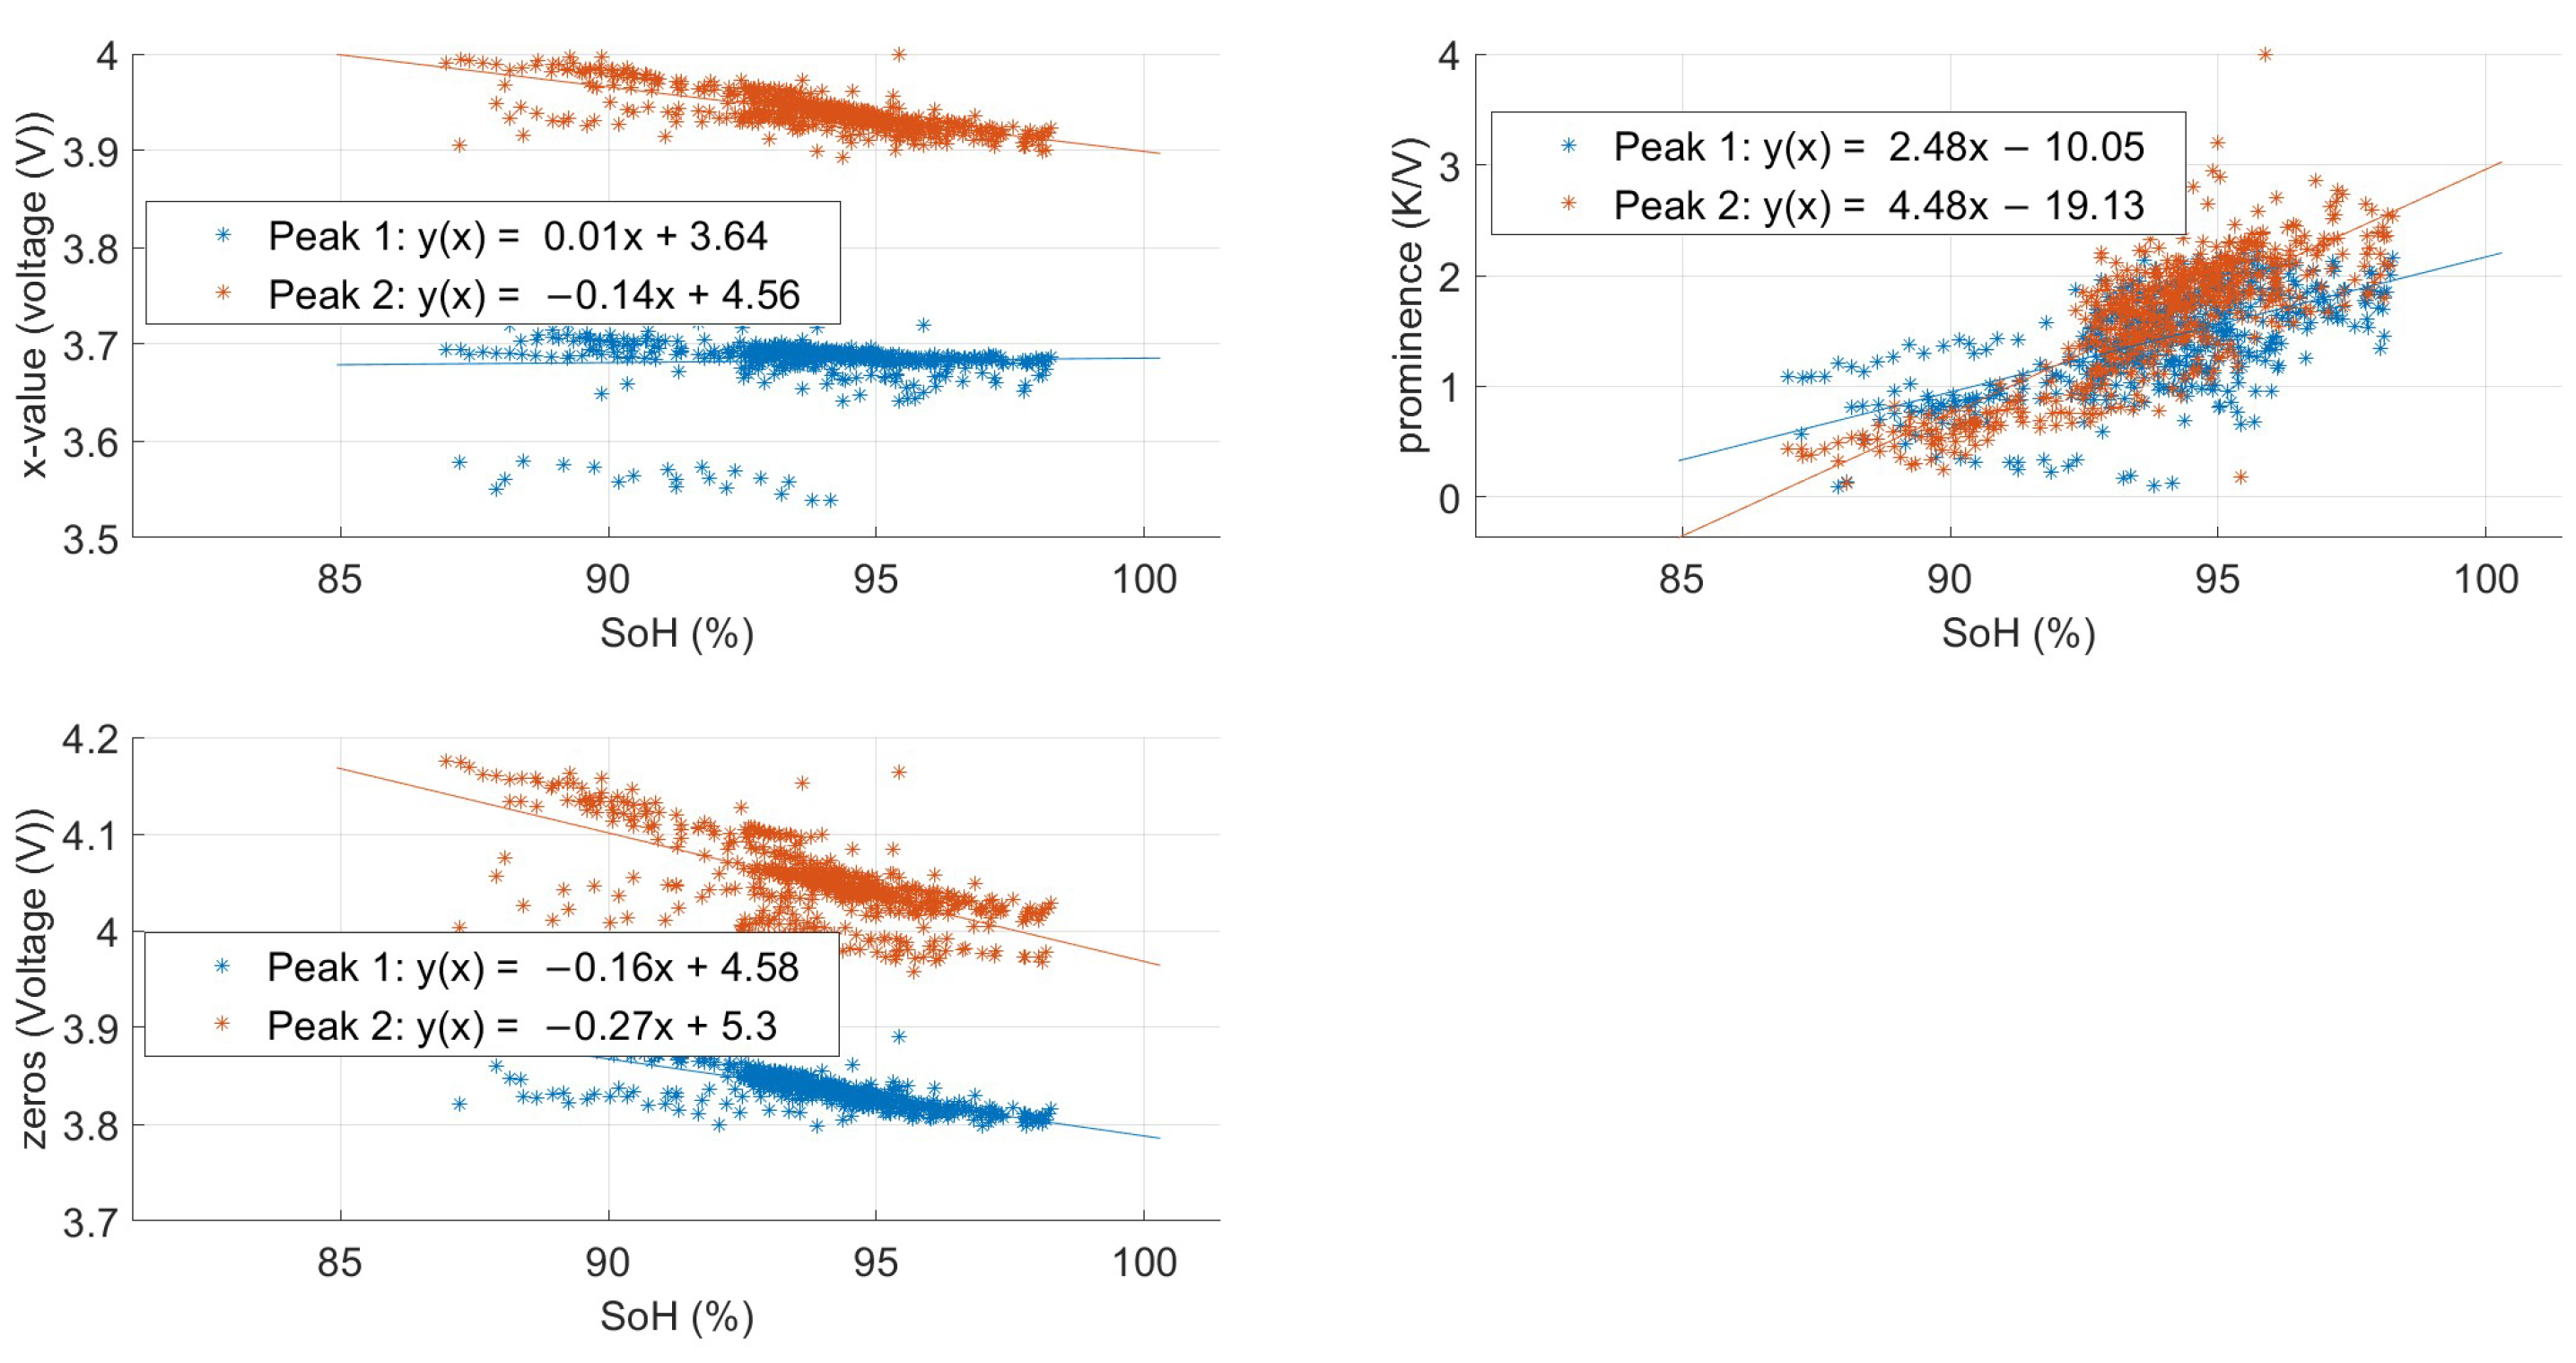
4.2. Definition of the SoH Regression Line
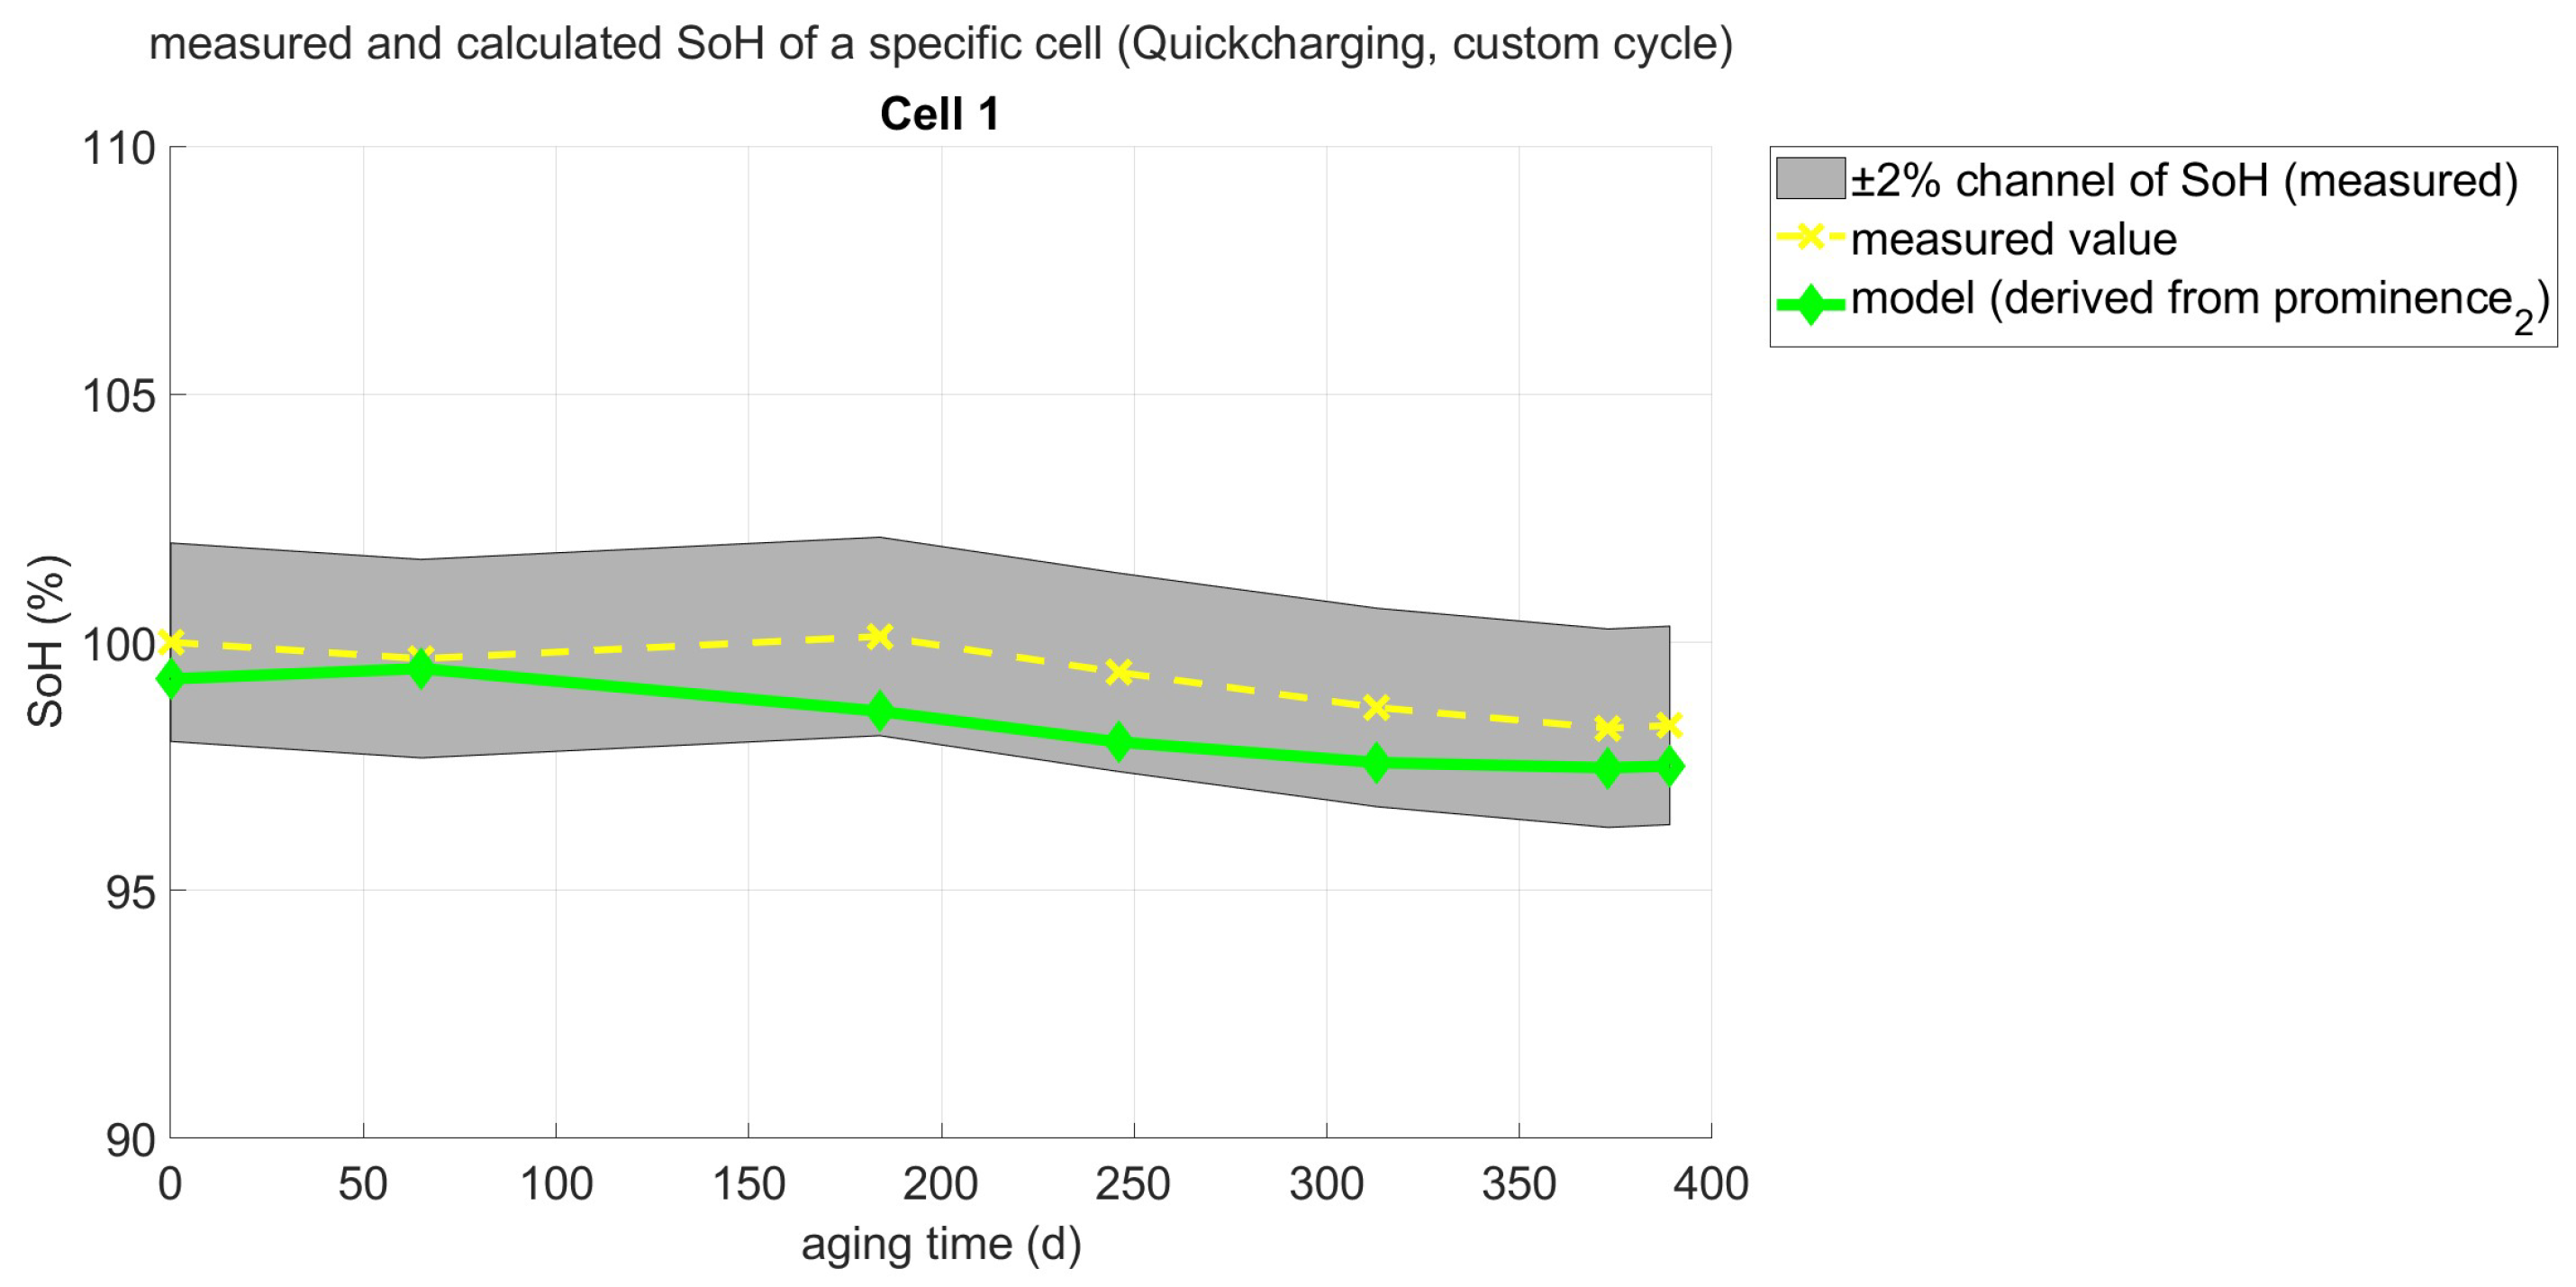
In the literature, most studies, for example Merla et al. [17] and Prosser et al. [24], use the DTV technique only to determine whether the analyzed cell is aged or completely fresh. In the paper of Shibagaki et al. [22], although only showcasing the concept with two LFP cells, it can be read that there is a definitive correlation between the peaks of the DTV and the corresponding capacity, even for LFP cells.
In the present paper, the whole approach is taken a step further by incorporating a broader variety of distinctive points into the analysis, instead of focusing on the observable shift of the peaks. The different DiPos obtained were then paired with the corresponding cell capacity data and later analyzed for linear dependency. For evaluation purposes, the respective correlation coefficient was used. The corresponding results of these calculations are shown as a bar chart in Figure 6. A line separating a gray area can be seen here. This limit is at the y-value of 0.7, above which the correlation shown is considered “very strong”. In addition, each bar that lies above this threshold is held in green, the others in red. On the far left, the corresponding correlation coefficient for the internal resistance measured with a 10 s pulse is displayed as a reference. Using this diagram, it can be quickly determined that the values consisting of p r o m i n e n c e 2 , x-value2, and z e r o 1 are particularly suitable for further investigation.
In the next step, all DiPos were now plotted comparatively in their respective diagrams, as shown in Figure 7. At the same time, the least squares method was used to determine the corresponding regression lines, which in turn were plotted as well. The proper equations were also added to this presentation. The color coding here is such that all data belonging to the first extreme point are blue, while data belonging to the second one are red. In principle, it can now be seen that the data points of the selected markers, namely p r o m i n e n c e 2 , x-value2, and z e r o 1 , also appear to lie on a straight line. In order to find the objectively best feature, the significance must be considered in the last step. All three DiPos considered here are below a value of 5%. However, p r o m i n e n c e 2 has the lowest p-value. This means that this specific characteristic has the highest probability of being a general statement about the correlation with the SoH.

4.3. Validation

As a first step to validate the findings, the selected DiPo p r o m i n e n c e 2 and the corresponding equation of the regression line were used against the validation dataset. This means that every aged cell that was not used during the design process of the regression equation will contribute towards the first validation step. Although using the validation dataset is a necessary condition, it is not sufficient to prove the concept of using this specific DiPo for SoH estimation. Because of this reason, in the next step, a new set of cells was used to validate the method even further. At first, a custom cycle was developed, which consists of a discharging cycle (which is based on real utilization graphs of a commercial bus, imitating different use cases across a whole year), a charging phase between 10% and 90% SoCs, and a stand-by phase. This custom high-power charge cycle was repeated once per day, in order to have an aging behavior that is as close to reality as possible.
The following Figure 8 shows the results for one of those custom cycle cells. It consists of a green data line representing the conventionally measured SoH data and a yellow line representing the estimated SoH derived from p r o m i n e n c e 2 at the given time steps. The gray area visualizes the error channel with a width of ±2%.
These results show that the estimated values are lower than the measured SoH across the whole aging period, but within the set boundaries of the SoH estimation. In order to obtain a statistically more reliable validation result, this method was used for all the cells that have been aged with the previously explained custom cycle. After analyzing all diagrams, a similar behavior of the corresponding model can be seen. The calculated root mean square error of all the data combined was at 1.1%, being within the threshold of 2%. This demonstrates that the model is capable of estimating and reflecting the current SoH of different cells within a common accuracy range.
While other signal analysis methods, like the DVA or the well-known ICA, are also broadly used to determine the condition of the cell, they often need low C rates during their measurements. Mitin [20] proposes C 50 , while Keil [16] takes it a step further by suggesting C 20 , which leads to measurement times that are about 15x slower when compared to the DTV.
Additionally, these low C rates in conventional methods often render them to be used in situ. By contrast, the DTV specifically needs between 0.5 C and 2 C. Otherwise, the change in the cell temperature would be too low to analyze, which enables this method to be used in operando. Preferably, during a charging cycle, the data are measured while either constant current or constant power is applied.
Furthermore, the individual peaks in conventional methods have a low informative value. Only when they are compared to other occurring peaks, a statement about the degradation mechanisms and the corresponding SoH can be proposed. The technique explained in this paper, on the other hand, focuses on a single peak. To be more precise, only the prominence is used here. This not only reduces the computational stress on the hardware, but enables the method to only require the data points between 3.6 V and 4.1 V, which represent the window in which both observable peaks of the NMC cells occur. This shows that the important information for this method lies in the measurement data above a 50% SoC. Particularly, this is important in real-life applications, as most drivers of cars and trucks often charge their batteries when there is an opportunity and not when the SoC reaches 0%.

5. Conclusions

In this paper, an online SoH estimation method for NMC lithium-ion cells, which uses the DTV analysis to obtain various distinctive points, is shown. After sorting and listing the data of differently aged cells and collecting the different distinctive points, a first examination of the possibilities was carried out by calculating the correlation coefficients with regard to the capacity and their corresponding significance. This showed that especially p r o m i n e n c e 2 is very promising in this matter. After establishing a regression equation based on p r o m i n e n c e 2 , a validation was performed. Here, cells that were previously aged according to real-life application cases were used. Although their stage of aging is comparably fresh, promising results were found. While the estimated SoH graph was in the channel of ±2% at all times, the root mean square error of all the data combined was calculated to be at 1.1 %. Furthermore, the approach described here developed into a very good method for reliably estimating the SoH of a specific cell. Due to the fact that the DTV technique does not require any special sensors and because battery packs in commercial vehicles already have temperature sensors installed, this method is able to take advantage of the already given conditions. In addition, the computational expense and the necessary accuracy of the measurements is comparably low, which makes it usable on-board on the integrated battery management unit of the pack. Additionally, analyzing only the voltage window of 3.6 V up until 4.1 V is sufficient to estimate the SoH with the presented method. This is especially helpful considering that most customers charge their battery in a rather opportunistic manner rather than when the SoC reaches 0%.
In the next step, the already installed sensors of our battery packs have to be examined. In particular, the frequency with which data points are recorded and the sensibility regarding the temperature fluctuation has to be analyzed. Furthermore, more aging cycles have to be performed on those validation cells in order to be able to estimate the long-term reliability of this technique. To round it off, the validation cells have to be aged until a much lower SoH is reached, in order to verify the results of this work for a longer lifetime of the tested NMC cells. In order to generalize the findings, different kinds of cell composition should also be analyzed. Although in the literature it can be found that the DTV graphs of LFP show a similar correlation to NMC, a wide analysis of the actual behavior must be performed first.

Author Contributions

Conceptualization, J.N.; methodology, J.N.; software, P.H.; validation, J.N., P.H. and H.W.; formal analysis, P.H.; investigation, J.N. and P.H.; resources, J.N., D.H., M.F. and T.M.; data curation, J.N. and P.H.; writing—original draft preparation, J.N. and P.H.; writing—review and editing, H.W., D.H. and T.M.; visualization, J.N. and P.H.; supervision, M.F. and D.H.; project administration, M.F. and T.M. All authors have read and agreed to the published version of the manuscript.

Funding

This research received no external funding.

Data Availability Statement

The datasets presented in this article are not readily available because of project restrictions. Requests to access the datasets should be directed to the corresponding authors.

Conflicts of Interest

Authors Jan Neunzling, Philipp Hainke, Hanno Winter and Matthias Fleckenstein were employed by the company BorgWarner Battery Systems Technical Center GmbH. The remaining authors declare that the research was conducted in the absence of any commercial or financial relationships that could be construed as a potential conflict of interest.

Abbreviations

The following abbreviations are used in this manuscript:
BMSBattery Management System
BMUBattery Management Unit
CUCheck-Up
DiPoDistinctive Points
DOAJDirectory of open access journals
DVADifferential Voltage Analysis
DTVDifferential Thermal Voltammetry
EISElectrochemical Impedance Spectroscopy
LAMLoss of Active Material
LFPLithium Iron Phosphate
LLILoss of Lithium Inventory
MDPIMultidisciplinary Digital Publishing Institute
NMCNickel Manganese Cobalt
NTCNegative Temperature Coefficient
OCVOpen Circuit Voltage
SoCState of Charge
SoHState of Health
SRCVSlow Rate Cyclic Voltammetry

References

  1. Kawamoto, R.; Mochizuki, H.; Moriguchi, Y.; Nakano, T.; Motohashi, M.; Sakai, Y.; Inaba, A. Estimation of CO2 Emissions of Internal Combustion Engine Vehicle and Battery Electric Vehicle Using LCA. Sustainability 2019, 11, 2690. [Google Scholar] [CrossRef]
  2. Bickert, S.; Kampker, A.; Greger, D. Developments of CO2-emissions and costs for small electric and combustion engine vehicles in Germany. Transp. Res. Part D Transp. Environ. 2015, 36, 138–151. [Google Scholar] [CrossRef]
  3. Mohtasham, J. Review Article-Renewable Energies. Energy Procedia 2015, 74, 1289–1297. [Google Scholar] [CrossRef]
  4. Nelson, V. Wind Energy; CRC Press: Boca Raton, FL, USA, 2009. [Google Scholar] [CrossRef]
  5. Lu, L.; Han, X.; Li, J.; Hua, J.; Ouyang, M. A review on the key issues for lithium-ion battery management in electric vehicles. J. Power Sources 2013, 226, 272–288. [Google Scholar] [CrossRef]
  6. Zhou, C.C.; Su, Z.; Gao, X.L.; Cao, R.; Yang, S.C.; Liu, X.H. Ultra-high-energy lithium-ion batteries enabled by aligned structured thick electrode design. Rare Met. 2022, 41, 14–20. [Google Scholar] [CrossRef]
  7. Lu, Q.; Jie, Y.; Meng, X.; Omar, A.; Mikhailova, D.; Cao, R.; Jiao, S.; Lu, Y.; Xu, Y. Carbon materials for stable Li metal anodes: Challenges, solutions, and outlook. Carbon Energy 2021, 3, 957–975. [Google Scholar] [CrossRef]
  8. Han, X.; Ouyang, M.; Lu, L.; Li, J.; Zheng, Y.; Li, Z. A comparative study of commercial lithium ion battery cycle life in electrical vehicle: Aging mechanism identification. J. Power Sources 2014, 251, 38–54. [Google Scholar] [CrossRef]
  9. Birkl, C.R.; Roberts, M.R.; McTurk, E.; Bruce, P.G.; Howey, D.A. Degradation diagnostics for lithium ion cells. J. Power Sources 2017, 341, 373–386. [Google Scholar] [CrossRef]
  10. Jossen, A.; Weydanz, W. Moderne Akkumulatoren Richtig Einsetzen, 2. überarbeitete Auflage von März 2019, revidierte Ausgabe ed.; MatrixMedia: Göttingen, Germany, 2021. [Google Scholar]
  11. Börger, A.; Wenzl, H. Batterien: Grundlagen, Systeme, Anwendungen; Wiley-VCH: Weinheim, Germany, 2022. [Google Scholar]
  12. Noura, N.; Boulon, L.; Jemeï, S. A Review of Battery State of Health Estimation Methods: Hybrid Electric Vehicle Challenges. World Electr. Veh. J. 2020, 11, 66. [Google Scholar] [CrossRef]
  13. Plett, G.L. Part 2. Sigma-point Kalman filtering for battery management systems of LiPB-based HEV battery packs: Simultaneous state and parameter estimation. J. Power Sources 2006, 161 Pt 2, 1369–1384. [Google Scholar] [CrossRef]
  14. Schmalstieg, J.; Käbitz, S.; Ecker, M.; Sauer, D.U. A holistic aging model for Li(NiMnCo)O2 based 18650 lithium-ion batteries. J. Power Sources 2014, 257, 325–334. [Google Scholar] [CrossRef]
  15. Li, Y.; Liu, K.; Foley, A.M.; Zülke, A.; Berecibar, M.; Nanini-Maury, E.; Van Mierlo, J.; Hoster, H.E. Data-driven health estimation and lifetime prediction of lithium-ion batteries: A review. Renew. Sustain. Energy Rev. 2019, 113, 109254. [Google Scholar] [CrossRef]
  16. Keil, P. Aging of Lithium-Ion Batteries in Electric Vehicles. Ph.D. Thesis, Technische Universität München, München, Germany, 2017. [Google Scholar]
  17. Merla, Y.; Wu, B.; Yufit, V.; Brandon, N.P.; Martinez-Botas, R.F.; Offer, G.J. Extending battery life: A low-cost practical diagnostic technique for lithium-ion batteries. J. Power Sources 2016, 331, 224–231. [Google Scholar] [CrossRef]
  18. Wu, B.; Yufit, V.; Merla, Y.; Martinez-Botas, R.F.; Brandon, N.P.; Offer, G.J. Differential thermal voltammetry for tracking of degradation in lithium-ion batteries. J. Power Sources 2015, 273, 495–501. [Google Scholar] [CrossRef]
  19. Asenbauer, J.; Eisenmann, T.; Kuenzel, M.; Kazzazi, A.; Chen, Z.; Bresser, D. The success story of graphite as a lithium-ion anode material—Fundamentals, remaining challenges, and recent developments including silicon (oxide) composites. Sustain. Energy Fuels 2020, 4, 5387–5416. [Google Scholar] [CrossRef]
  20. Anna Mitin. Identifizierung und Quantifizierung von Alterungsphänomenen in Lithium-Ionen-Batterien. Ph.D. Thesis, Technische Universität Carolo-Wilhelmina zu Braunschweig, Braunschweig, Germany, 2018.
  21. Lewerenz, M.; Marongiu, A.; Warnecke, A.; Sauer, D.U. Differential voltage analysis as a tool for analyzing inhomogeneous aging: A case study for LiFePO4|Graphite cylindrical cells. J. Power Sources 2017, 368, 57–67. [Google Scholar] [CrossRef]
  22. Shibagaki, T.; Merla, Y.; Offer, G.J. Tracking degradation in lithium iron phosphate batteries using differential thermal voltammetry. J. Power Sources 2018, 374, 188–195. [Google Scholar] [CrossRef]
  23. Merla, Y.; Wu, B.; Yufit, V.; Brandon, N.P.; Martinez-Botas, R.F.; Offer, G.J. Novel application of differential thermal voltammetry as an in-depth state-of-health diagnosis method for lithium-ion batteries. J. Power Sources 2016, 307, 308–319. [Google Scholar] [CrossRef]
  24. Prosser, R.; Offer, G.; Patel, Y. Lithium-Ion Diagnostics: The First Quantitative In-Operando Technique for Diagnosing Lithium Ion Battery Degradation Modes under Load with Realistic Thermal Boundary Conditions. J. Electrochem. Soc. 2021, 168, 030532. [Google Scholar] [CrossRef]
  25. Wang, Z.; Yuan, C.; Li, X. Lithium Battery State-of-Health Estimation via Differential Thermal Voltammetry With Gaussian Process Regression. IEEE Trans. Transp. Electrif. 2021, 7, 16–25. [Google Scholar] [CrossRef]
  26. Ma, B.; Yu, H.Q.; Wang, W.T.; Yang, X.B.; Zhang, L.S.; Xie, H.C.; Zhang, C.; Chen, S.Y.; Liu, X.H. State of health and remaining useful life prediction for lithium-ion batteries based on differential thermal voltammetry and a long and short memory neural network. Rare Met. 2023, 42, 885–901. [Google Scholar] [CrossRef]
  27. Zülke, A.; Li, Y.; Keil, P.; Burrell, R.; Belaisch, S.; Nagarathinam, M.; Mercer, M.P.; Hoster, H.E. High–Energy Nickel–Cobalt–Aluminium Oxide (NCA) Cells on Idle: Anode– versus Cathode–Driven Side Reactions. Batter. Supercaps 2021, 4, 934–947. [Google Scholar] [CrossRef]
  28. Lewerenz, M.; Dechent, P.; Endisch, C.; Sauer, D.U. Investigation of capacity and homogeneity recovery of commercial cells after cycle life tests. In Electrochemical Society Meeting Abstracts 235; The Electrochemical Society, Inc.: Pennington, NJ, USA, 2019. [Google Scholar]
Figure 1. Experimental setup with the KSR 150 system and the temperature probe.
Batteries 11 00025 g001
Figure 2. Check-up cycle shown as voltage over time signal.
Batteries 11 00025 g002
Figure 3. Analysis of two exemplary graphs regarding their respective distinctive points—(a) exemplary illustration of the distinctive points—(b) exemplary analysis of a DTV.
Batteries 11 00025 g003
Figure 4. DTV curves of a calendar-aged cell (T: 25 °C, SoC: 95%).
Batteries 11 00025 g004
Figure 5. DTV curves of a cyclic-aged cell (DoD: 20%, midSoC: 50%, T: 25 °C, Ch: 0.7 C, DCh: 0.5 C).
Batteries 11 00025 g005
Figure 6. Bar chart of the calculated correlation coefficients of the different DiPos.
Batteries 11 00025 g006
Figure 7. Regression lines and the corresponding equations of the three selected DiPos.
Batteries 11 00025 g007
Figure 8. Comparison between the conventionally measured and estimated SoH of a custom high-power charge cycle.
Batteries 11 00025 g008
Table 1. Technical specifications of cell under test.
TypeCylindrical
Format21700
Length70.1 mm
Diameter21.1 mm
Weight68 g
Nominal Energy18.2 Wh
Lower Voltage Limit2.5 V
Upper Voltage Limit4.2 V
Nominal Voltage3.7 V
Max Current3 C
Temperature Range−20 up to 60 °C
Table 2. Test matrix for calendar aging tests.
SoC/Temp.10 °C25 °C45 °C55 °C
100%XX
95%XXXX
80%XXX
70%X
60%XXXX
30%XXX
Table 3. Test matrix for cyclic aging tests.
DoD/mSoC20%50%60%70%
100%a
80%a
60%a, ga
20%aa, b, c, d, e, f, gaa
10%a
(a) 0.3 C | 0.5 C | 25 °C; (b) 0.3 C | 0.9 C | 25 °C; (c) 0.7 C | 0.3 C | 25 °C; (d) 0.7 C | 0.9 C | 25 °C; (e) 0.7 C | 0.5 C | 25 °C; (f) 0.9 C | 0.5 C | 25 °C; (g) 0.3 C | 0.5 C | 45 °C.
Disclaimer/Publisher’s Note: The statements, opinions and data contained in all publications are solely those of the individual author(s) and contributor(s) and not of MDPI and/or the editor(s). MDPI and/or the editor(s) disclaim responsibility for any injury to people or property resulting from any ideas, methods, instructions or products referred to in the content.

