Article

Optimizing Multi-Microgrid Operations with Battery Energy Storage and Electric Vehicle Integration: A Comparative Analysis of Strategies

by
Syed Muhammad Ahsan
1 and
Petr Musilek
1,2,*
1
Electrical and Computer Engineering, University of Alberta, Edmonton, AB T6G 1H9, Canada
2
Applied Cybernetics, University of Hradec Králové, 500 03 Hradec Králové, Czech Republic
*
Author to whom correspondence should be addressed.
Batteries 2025, 11(4), 129; https://doi.org/10.3390/batteries11040129
Submission received: 7 January 2025 / Revised: 18 March 2025 / Accepted: 24 March 2025 / Published: 27 March 2025

Abstract

:
This study presents a comprehensive comparative analysis of the operational strategies for multi-microgrid systems that integrate battery energy storage systems and electric vehicles. The analyzed strategies include individual operation, community-based operation, a cooperative game-theoretic method, and the alternating direction method of multipliers for multi-microgrid systems. The operation of multi-microgrid systems that incorporate electric vehicles presents challenges related to coordination, privacy, and fairness. Mathematical models for each strategy are developed and evaluated using annual simulations with real-world data. Individual operation offers simplicity but incurs higher costs due to the absence of power sharing among microgrids and limited optimization of battery usage. However, individual optimization reduces the multi-microgrid system cost by 47.5% when compared to the base case with no solar PV or BESS and without optimization. Community-based operation enables power sharing, reducing the net cost of the multi-microgrid system by approximately 7%, as compared to individual operation, but requires full data transparency, raising privacy concerns. Game theory ensures fair benefit allocation, allowing some microgrids to achieve cost reductions of up to 13% through enhanced cooperation and shared use of energy storage assets. The alternating direction method of multipliers achieves a reduction in the electricity costs of each microgrid by 6–7%. It balances privacy and performance without extensive data sharing while effectively utilizing energy storage. The findings highlight the trade-offs between cost efficiency, fairness, privacy, and computational efficiency, offering insights into optimizing multi-microgrid operations that incorporate advanced energy storage solutions.

1. Introduction

1.1. Background and Motivation

The integration of renewable energy sources and the ever-increasing demand for efficient and reliable power supply have paved the way for multi-microgrid (MMG) systems. MMGs consist of interconnected microgrids (MGs) capable of operating in both islanded and interconnected modes, thus enhancing the robustness of the distribution network [1]. The advent of electric vehicles (EVs) has introduced concepts such as vehicle-to-load (V2L), where EVs act as mobile storage units capable of supplying power to local loads [2]. Additionally, EVs with vehicle-to-grid (V2G) capability can sell power back to the grid [3]. These advancements, which add resources and flexibility to energy management, have made MMGs with EV integration a cornerstone of modern power systems [4]. Despite the potential advantages of MMGs integrated with EVs, this arrangement poses significant challenges. These include coordination complexity, intermittent renewable energy (RE) generation, and uncertainties in EV availability and charging behavior [5]. Furthermore, the diverse nature of MMGs in terms of resources and objectives requires advanced operational strategies to ensure efficient performance [6]. To address these challenges, researchers have explored various operational strategies, focusing on individual and community-based approaches, as well as advanced techniques such as cooperative game-theoretic (GT) methods and the alternating direction method of multipliers (ADMM). Each strategy has distinct strengths and limitations in managing the complexities of MMGs.

1.2. Literature Review

Individual operation (IO) preserves privacy and reduces communication requirements. It enables individual MGs to make decisions based solely on local information, without exchanging power or data with other MGs [7]. This approach allows MGs to independently optimize their operations to minimize costs or maximize efficiency, considering their own generation, storage, and load demands. For example, Masrur et al. [8] proposed a mixed-integer linear programming (MILP) model to co-optimize electrical, thermal, and EV energy demands in multi-energy MGs, aiming to enhance resilience during grid outages and reduce annual costs. Similarly, Billah et al. [9] employed a multi-agent system (MAS) with particle swarm optimization to optimize hybrid MG operations across islanded, grid-connected, and transitional modes, effectively addressing RE intermittency while ensuring cost-effectiveness. Shamshirband et al. [10] introduced an innovative eco-friendly framework for optimal EV charging and discharging scheduling, integrating V2G technology and stochastic programming to reduce costs and emissions while mitigating uncertainties of RE. However, individual approaches often result in suboptimal global solutions due to the lack of coordination and power sharing among MGs [11]. For instance, the inability to transfer surplus power to neighboring MGs leads to inefficient resource utilization, as excess power is sold back to the grid at lower rates. These limitations suggest the need for advanced techniques that combine the privacy and autonomy benefits of IO with mechanisms for power sharing and coordinated decision-making to enhance overall system performance.
To address these shortcomings, community-based operation (CBO) leverages a market operator (MO), a centralized entity with comprehensive information on all MGs, including their loads, local resource availability, and EV data [12]. The MO supervises and manages operations within the MMG system, facilitating power sharing and ensuring efficient coordination. This approach optimizes overall performance by balancing local power generation and load demands in interconnected MGs [6]. Several studies have explored the use of CBO to optimize resource utilization within MMGs. For instance, Nikkhah et al. [13] proposed a building-to-building energy management strategy to enhance cooperation among community-based residential MGs. Similarly, Malik et al. [14] introduced a multi-agent optimization framework to ensure the efficient operation of community-based MGs within MMG systems. Li et al. [15] developed a bilevel model for managing community-based multiparty MGs in both grid-connected and islanded modes. Olivares et al. [16] presented a centralized energy management system for isolated MGs, employing model predictive control to optimize resource dispatch while integrating renewable energy sources and addressing challenges such as system imbalances and voltage constraints. Javadi et al. [17] proposed a centralized hierarchical energy management system (EMS) for multiple home MGs. The system optimizes power trading and resource allocation in retail electricity markets, achieving significant economic and operational benefits. Furthermore, Ahsan et al. developed models for profit maximization in networked microgrids and smart buildings integrated with solar photovoltaic (PV) and battery systems, both without [18,19] and with [20,21] EV integration. However, CBO faces significant challenges. It requires substantial information exchange and a robust communication network, raising concerns about data privacy and cybersecurity [22]. Additionally, solving large-scale operational problems imposes high computational costs, leading to scalability issues as the number of MGs and EVs increases. CBO systems are also vulnerable to single points of failure, which can compromise the entire MMG system [23]. These limitations highlight the need for innovative operational techniques that enable power sharing while mitigating the disadvantages of IO and addressing the vulnerabilities inherent in CBO.
Advanced operational techniques such as cooperative GT and ADMM have been proposed to combine the strengths of CBO and IO, facilitating power sharing in MMG systems [1,24]. Cooperative GT enables multiple MGs to collaborate and share resources in a way that benefits all participants [25]. For example, Karimi and Jadid [26] developed a hybrid competitive–cooperative game model for interconnected MGs utilizing the Shapley value for fair gain allocation and a probabilistic approach to handle uncertainties in RE and market prices. Li et al. [27] proposed an energy optimization method for MMG systems based on cooperative GT, aiming to minimize economic costs and devise optimal power trading strategies under price constraints. Similarly, Chen et al. [28] introduced a cooperative game model that employs Nash bargaining for day-ahead energy transactions between MGs, optimizing power trading and tariffs to lower operating costs and improve market competitiveness. Chen et al. [29] presented a coalitional game approach that incorporates power losses and service charges to improve trading efficiency among MGs. Movahednia et al. [30] proposed a cooperative game model for day-ahead scheduling that ensures fair cost allocation and addresses uncertainties in MMG systems. Islam et al. [31] developed a cooperative alliance framework to optimize PV-based MG operations and equitably distribute benefits using the Shapley value. Likewise, Zhong et al. [32] introduced a coalition game-based strategy that uses the Shapley value to reduce energy procurement costs and encourage the sharing of electricity among interconnected MGs.
Distributed optimization techniques such as ADMM provide another means of MG coordination while preserving some degree of autonomy [33]. Liu et al. [34] presented a multi-objective optimization model for networked MGs, utilizing ADMM to achieve economic operation and maintain system reliability through coordinated energy management. Mansouri et al. [35] proposed a multilevel ADMM methodology that integrates IoT-enabled devices and virtual energy storage systems (VESS) to optimize flexibility and energy markets, reducing costs and losses while preserving MG privacy. Furthermore, Rajaei et al. [36] developed a robust decentralized transactive energy management framework that employs ADMM to coordinate MGs under the uncertainty of RE. Li et al. [37] introduced a supernode-enhanced ADMM to address the optimization of large-scale distributed power systems, achieving improved convergence speeds and computational efficiency. These advanced techniques address the privacy and scalability challenges associated with community-based systems while enabling effective power sharing in MMGs. However, implementing cooperative GT and ADMM relies on dependable communication networks and can encounter problems related to convergence and solution optimality [24]. Despite these challenges, cooperative GT and ADMM represent promising approaches for achieving efficient and coordinated MMG operations.

1.3. Research Gap and Contributions

Operational strategies (IO, CBO, cooperative GT, and ADMM) have been widely explored in the literature. Although each strategy has unique benefits, there are also inherent drawbacks. While autonomy and privacy are given priority in IO, the advantages of resource sharing are not utilized, which frequently results in sub-optimal performance of the MMG network. Improved coordination and resource utilization can be achieved using CBO in the MMG system, but they are susceptible to single points of failure, require a substantial communication infrastructure, and create privacy concerns. Cooperative GT encourages collaboration among MGs in the MMG system and ensures fair profit sharing through the use of well-established concepts such as Shapley value or Nash bargaining. ADMM offers a distributed optimization framework that enables MGs to maintain some autonomy while collaborating to achieve effective operation throughout the MMG network. Although much research has been conducted on the application of various operational strategies in the MMG system, no study has provided a comprehensive comparative analysis of these strategies in terms of the impact of power-sharing options on the overall performance of MMGs integrated with EVs. This study presents a unified comparison approach that evaluates various operational techniques for MMG, including game theory and ADMM. In comparison, previous studies focused on individual optimization strategies in isolation and did not consider the balance of cost efficiency, fairness, privacy, and computational complexity. As such, this article provides a novel point of view on MMG optimization, taking into account EVs with V2L and V2G functions, and addressing practical trade-offs that were often ignored in prior studies. To address this gap, this article presents a thorough comparative analysis to evaluate the trade-offs among IO, CBO with power sharing, cooperative GT, and ADMM. The analysis involves the following steps:
  • Development of mathematical models for each operational strategy:
    (a)
    IO model: Each MG optimizes its operations independently, without power sharing or data exchange with other MGs.
    (b)
    CBO model with power sharing: This model optimizes the collective operations of MMGs to enhance overall efficiency through coordinated power sharing.
    (c)
    Cooperative model using GT and the ADMM: This approach combines cooperative GT to ensure fair profit allocation among MMGs with ADMM to enhance computational efficiency. It facilitates power sharing while preserving a degree of autonomy for each MG within the MMG system.
  • Statistical modeling of EVs in the MMG system: The model incorporates both V2L and V2G functions, ensuring practical evaluations.
  • Annual simulations for the MMG system: Simulations are conducted to account for seasonal variations, including typical EV usage patterns, load data, time-of-use (TOU) tariffs, and RE generation profiles.
  • Annual cost analysis: The yearly electricity costs for each MG within the MMG system are calculated for all operational strategies to evaluate their economic performance.
The remainder of this paper is organized as follows: Section 2 outlines the system architecture and the mathematical models of each operational strategy. Section 3 details the simulation setup and parameters. Section 4 presents the results and provides a comparative analysis of the performance of the various strategies. Section 5 presents a short discussion to provide context and highlight the significance of the obtained results. Finally, conclusions and future research direction are presented in Section 6.

2. Comparative Analysis Framework

2.1. System Configuration

The system under analysis is an MMG system connected to the grid, as shown in Figure 1. It comprises three MGs (MG1, MG2, and MG3), each equipped with renewable generation (RG), a battery energy storage system (BESS), and local loads. Additionally, EVs are integrated into each MG, providing enhanced flexibility through V2L and V2G functionalities. The bidirectional power flow in each MG enables the purchase of power during shortages and the sale of surplus power, ensuring efficient energy management. This system configuration aligns with the objective of this study to investigate and compare different operational strategies.

2.2. Selection and Implementation of Operational Strategies

The choice of an operational strategy in an MMG system affects cost efficiency, power sharing, and data privacy. This subsection outlines the selection and implementation process for IO, CBO, the cooperative GT method, and ADMM. Figure 2 shows a flow chart that illustrates the decision-making process, from data collection to the execution of each strategy. The subsequent subsections detail the mathematical modeling of these strategies.

2.3. Individual Operation

2.3.1. Objective Function

The objective of the IO model is to minimize the electricity cost of each MG by efficiently utilizing local resources
min t = 1 T [ C t buy · L t , i buy + B t , i buy + m = 1 M E t , i , m buy C t sell · L t , i sell + B t , i sell + m = 1 M E t , i , m sell ] ,
where C t buy and C t sell are, respectively, the TOU electricity prices for buying and selling power at time t. The terms L t , i buy , B t , i buy , and E t , i , m buy represent the power bought from the utility grid to supply the local load, charge the BESS, and charge the EVs, respectively. Similarly, L t , i sell , B t , i sell , and E t , i , m sell denote the power sold to the grid from surplus RG, the BESS, and power discharged from an EV, respectively. The index i represents the MG under consideration, while m indicates the individual EV within the MG, indexed from 1 to total number of EVs (M).

2.3.2. Constraints

The IO model includes the following constraints:
Individual Power Balance: The power balance constraint ensures that the load demand ( D t , i ) of each MG is supplied by combining the amounts of power from RG ( S t , i RG ), BESS ( S t , i BESS ), the utility grid ( S t , i U ), and EVs ( S t , i , m EV )
D t , i = S t , i RG + S t , i BESS + S t , i U + m = 1 M S t , i , m EV t T , m M .
BESS State-of-Power (SOP): The BESS SOP is updated based on charging and discharging activities. The SOP ( P t , i BESS ) increases with power supply from RG ( P t , i RG ) and the grid ( B t , i buy ), adjusted for charging efficiency ( η ch BESS ), and decreases when the BESS supplies the load ( S t , i BESS ), grid ( B t , i sell ), and EVs ( E t , i , m BESS ), adjusted for discharging efficiency ( η dis BESS ):
P t , i BESS = P t 1 , i BESS + η ch BESS P t , i RG + B t , i buy S t , i BESS + B t , i sell + m = 1 M E t , i , m BESS η dis BESS t T , m M .
Avoiding Simultaneous BESS Charging/Discharging: To avoid the simultaneous charging and discharging of BESS, binary variables b t , i ch and b t , i dis are used, such that
b t , i ch + b t , i dis 1 t T , b t , i ch , b t , i ch { 0 , 1 } .
BESS Charging/Discharging Power Limits: BESS charging and discharging are limited by maximum power P i max
P t , i RG + B t , i buy P i max · b t , i ch t T ,
and minimum power P i min
S t , i BESS + B t , i sell + m = 1 M E t , i , m BESS P i min · b t , i dis t T , m M .
BESS Charging/Discharging Rate Limits: The charging of the BESS is also limited by the charging rate C BESS
0 P t , i RG + B t , i buy C BESS · b t ch t T ,
while BESS discharging is limited by the discharging rate D BESS
0 S t , i BESS + B t , i sell + m = 1 M E t , i , m BESS D BESS · b t dis t T , m M .
EV SOP: The SOP of each EV, denotes as P t , i , m EV , is updated based on the amounts of power supplied from utility ( E t , i , m buy ), BESS ( E t , i , m BESS ), RG ( E t , i , m RG ) and the power sold to grid ( E t , i , m sell ), power supplied to local load ( S t , i , m EV ), and the power consumed during driving ( E t , i , m drive )
P t , i , m EV = P t 1 , i , m EV + η ch EV E t , i , m buy + E t , i , m BESS + E t , i , m RG E t , i , m sell + S t , i , m EV + E t , i , m drive η dis EV t T , m M ,
where charging efficiency η ch EV and discharging efficiency η dis EV are used to reflect the power conversion losses.
Avoiding Simultaneous EV Charging/Discharging: To avoid the simultaneous charging and discharging of EVs, binary variables e t , i ch and e t , i dis are used, such that
e t , i , m ch + e t , i , m dis 1 , t T , m M , e t , i , m ch , e t , i , m dis { 0 , 1 } .
EV Charging/Discharging Power Limits: The charging and discharging of EVs are limited by maximum power E i max
E t , i , m buy + E t , i , m BESS + E t , i , m RG E i max · e t , i ch t T , m M
and minimum power E i min
E t , i , m sell + S t , i , m EV + E t , i , m drive E i min · e t , i dis t T , m M .
EV Charging/Discharging Rate Limits: EV charging is also constrained by the charging rate C EV
0 E t , i , m buy + E t , i , m BESS + E t , i , m RG C EV · e t ch t T , m M ,
while EV discharging is limited by the discharging rate D EV
0 E t , i , m sell + S t , i , m EV + E t , i , m drive D EV · e t dis t T , m M .

2.4. Community-Based Operation

2.4.1. Objective Function

The objective of the CBO model is to minimize the overall cost of electricity for the entire MMG system. This strategy facilitates the efficient and coordinated management of energy resources across the network, including provisions for power sharing among MGs. The objective function is updated to incorporate the costs and revenues associated with power sharing between MGs, as well as the costs and revenues from grid interactions for each MG
min t = 1 T [ i = 1 N ( C t buy · L t , i buy + B t , i buy + m = 1 M E t , i , m buy C t sell · L t , i sell + B t , i sell + m = 1 M E t , i , m sell ) + i = 1 N j = 1 , j i N C t int · T t , i , j sell T t , j , i buy ] ,
where N represents the total number of MGs, and C t int denotes the internal trading price, calculated as the average of the TOU buying and selling rates. T t , i , j sell and T t , j , i buy represent the power sold and purchased between MGs i and j, respectively. The added term shows the costs and revenues from power sharing among MGs.

2.4.2. Constraints

The CBO model is subject to the following constraints:
Community Power Balance: The power balance constraint for each MG is also updated to include the net power shared with other MGs. This ensures that the total power demand for each MG accounts for power transactions with neighboring MGs in the MMG system
D t , i = S t , i RG + S t , i BESS + S t , i U + m = 1 M S t , i , m EV + j = 1 , j i N T t , i , j buy T t , i , j sell , t T , i N , m M .
Power Balance in Internal Transactions: The power sharing balance constraint ensures that the total power exchanged among all MGs at any time t balances to zero. This guarantees that the total power supplied by some MGs matches exactly the power received by others, thus maintaining energy conservation within the MMG system.
i = 1 N j = 1 , j i N T t , i , j sell T t , j , i buy = 0 , t T , i N .
Internal Power Transaction Limits: Each MG i has a maximum power-sharing capacity, T i max . This constraint limits the amount of power an MG can supply or receive, ensuring that the MG’s operational limits are maintained, i.e.,
T i max j = 1 , j i N T t , i , j sell T t , j , i buy T i max , t T , i N .
The remaining operational constraints for BESS and EVs remain unchanged from those in the IO model. However, the CBO model introduces additional terms in the objective function and updates key constraints to account for power sharing among MGs.

2.5. Cooperative Game-Theoretic Method

2.5.1. Objective and Cost Allocation

The CBO model, compared to the IO model, enables power sharing within the MMG system. This reduces electricity costs and improves the overall energy efficiency of the entire network. However, a significant challenge lies in ensuring that the benefits of power sharing are fairly allocated among the MGs in the system. To address this, a cooperative GT framework offers a robust mechanism for benefit allocation, overcoming the limitations of the CBO model. The goal is to distribute the cost savings from power sharing among the MGs in a manner that is both fair and incentivizing. The total cost savings from power sharing can be expressed as
E ( N ) = i = 1 N E i IO E CBO ,
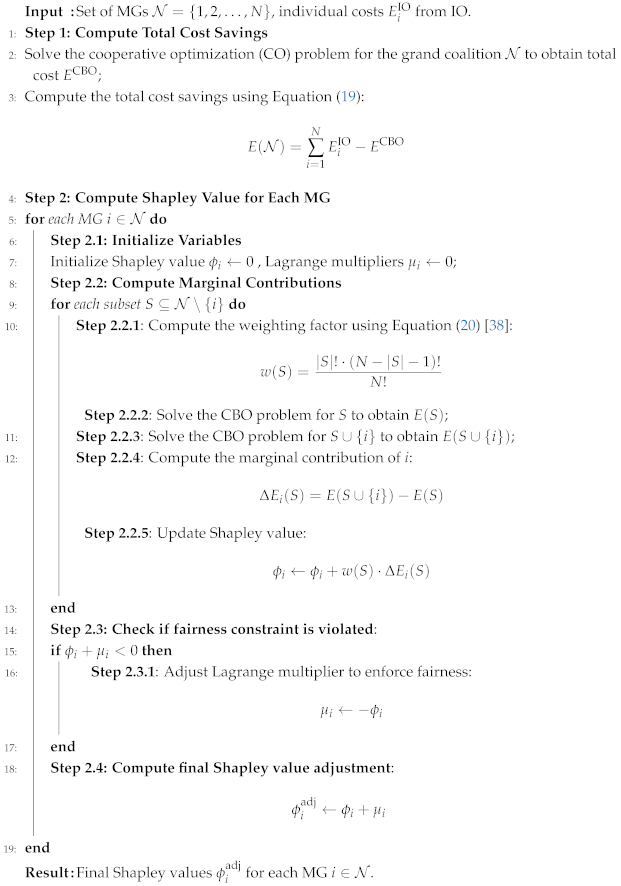
where N is the set of all N = | N | MGs, E i IO is the cost incurred by MG i in IO, and E CBO is the total electricity cost when all MGs share power in CBO. The objective is reached using the Shapley value, a well-known solution concept in cooperative GT, calculated for each MG i as [38]
ϕ i = S N { i } | S | ! ( N | S | 1 ) ! N ! E ( S { i } ) E ( S ) ,
where S is any subset of MGs that does not include MG i (i.e., S N { i } ), | S | denotes the number of MGs in subset S, E ( S ) is the total electricity cost when the MGs in subset S operate together (CBO), and E ( S { i } ) is the total electricity cost when MG i joins the coalition S.

2.5.2. Adjustment of Cost Shares

The Shapley value provides a fair allocation of the total cost savings, ensuring that the contribution of each MG to the cooperation is appropriately rewarded. However, to maintain consistency with additional fairness constraints, each MG i also satisfies a cost allocation condition enforced by its Lagrange multiplier μ i [39]. Essentially, μ i adjusts ϕ i so that no MG is left with an unfair portion of the total costs or gets disproportionate benefits.
ϕ i adj = ϕ i + μ i ,
where ϕ i adj shows the final cost share for MG i after the Lagrange-multiplier-based adjustment. Algorithm 1 shows the steps involved in computing the Shapley values along with the Lagrange multiplier-based adjustments.
Algorithm 1: Shapley Value Calculation for MGs
Batteries 11 00129 i001

2.6. Alternating Direction Method of Multipliers (ADMM)

The cooperative GT method enables the fair distribution of cost benefits among MGs while facilitating power sharing through a CBO framework. However, this approach raises concerns about data privacy, as MGs are required to share local information related to their loads, RE generation, and EV data with a central controlling entity or MO. To address these challenges, the ADMM method offers an efficient alternative for managing energy resources across MMGs without the extensive communication requirements of the CBO model.

2.6.1. Local Optimization Problem

ADMM decomposes the global operational problem into smaller subproblems that can be independently solved by each MG. At the same time, limited information exchange ensures convergence to a globally coordinated solution. This approach reformulates the operational problem using ADMM by introducing additional variables and terms to facilitate coordination among MGs. Consequently, the local operational problem for each MG i can be expressed as follows [40]:
min L i = f i ( D t , i ) + ρ 2 D t , i z t + λ t , i ρ 2 ,
where D t , i are the local decision variables for MG i, including state variables for power flows, SOP of BESS, SOP of EVs, and power trading, as identified in the CBO model. Trem f i ( D t , i ) represents the cost function of MG i which includes the costs of grid purchases, revenues from RE sales, and the costs or revenues from power trading with other MGs. Parameter ρ is a penalty that influences the convergence rate of the ADMM algorithm. The global consensus variables z t represent the power traded among MGs. The Lagrange multipliers (or the dual variables) λ t , i enforce consensus between local and global variables. The quadratic penalty term ensures that local solutions align with the global consensus variables.

2.6.2. Global Consensus and Dual Variable Updates

The global variables are updated after solving the local operational problem to achieve consensus among MGs
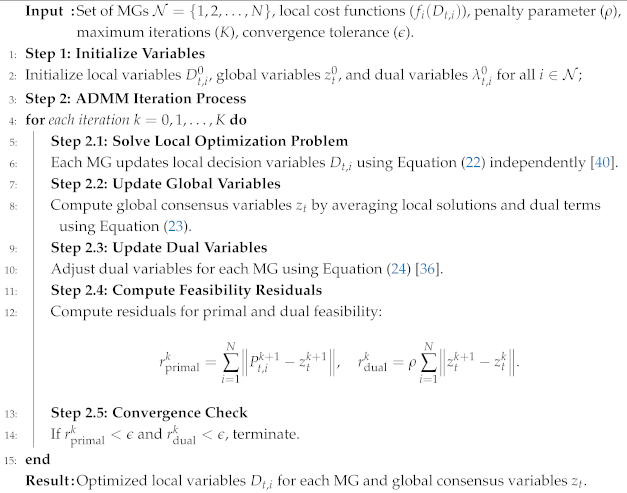
z t k + 1 = 1 N i = 1 N P t , i k + 1 + λ t , i k ρ ,
where k is the iteration number. The dual variables are used to penalize discrepancies between the local and global variables and drive the solution toward consensus. They are updated through [36]
λ t , i k + 1 = λ t , i k + ρ P t , i k + 1 z t k + 1 .
ADMM helps to achieve IO with coordination, ensuring efficient utilization of local resources without the need for local information exchange among MGs. Algorithm 2 outlines the steps included in obtaining the coordination among MGs using ADMM.
Algorithm 2: Alternating direction method of multipliers (ADMM) for power sharing within the MMG system
Batteries 11 00129 i002

3. Simulation Setup

3.1. Input Data

The input data comprise load profiles, TOU tariffs, RE generation, BESS, and EVs, capturing realistic MG operations. Three buildings, including residential and commercial structures, are assumed as three MGs located in Orlando, Florida, USA. The load profiles of the buildings are sourced from the Open Energy Data Initiative (OEDI) [41], reflecting diverse consumption patterns. The TOU buying rates are obtained from Duke Energy, a utility company in Orlando [42]. Solar PV capacities are set at 5 kW, 7 kW, and 9 kW for MGs 1, 2, and 3, respectively. The hourly solar PV generation profiles for Orlando are acquired using the PVWatts Calculator from the National Renewable Energy Laboratory (NREL) [43]. The BESS in each MG is configured with a 5 kW charging/discharging limit, storage capacities of 10 kWh, 12 kWh, and 15 kWh, and a charging/discharging efficiency of 95%. EV data are generated based on the methodologies outlined in [44]. They capture realistic driver behaviors such as daily arrival and departure times, parking durations, and daily mileage. This dataset models variations for weekdays, weekends, and holidays to reflect real-world conditions. Each MG is assumed to include two EVs.
  • MG1 has EVs with battery capacities of 37.9 kWh and 39.2 kWh with initial an state-of-charge (SOC) of 34% and 25%, respectively.
  • MG2 includes EVs with battery capacities of 38.3 kWh and 64 kWh with an initial SOC of 24% and 33.5%, respectively.
  • MG3 includes EVs with battery capacities of 51 kWh and 76 kWh with an initial SOC of 36% and 34.5%, respectively.
The minimum SOC for all EVs is set at 20%, and the charging power is capped at 7 kW using Level 2 chargers [45]. EVs can charge or discharge (V2G and V2L) primarily during parking periods, typically in the early morning or at night. However, parking times vary for each EV and are simulated over the course of an entire year to account for realistic conditions, including weekdays, holidays, and weekends.
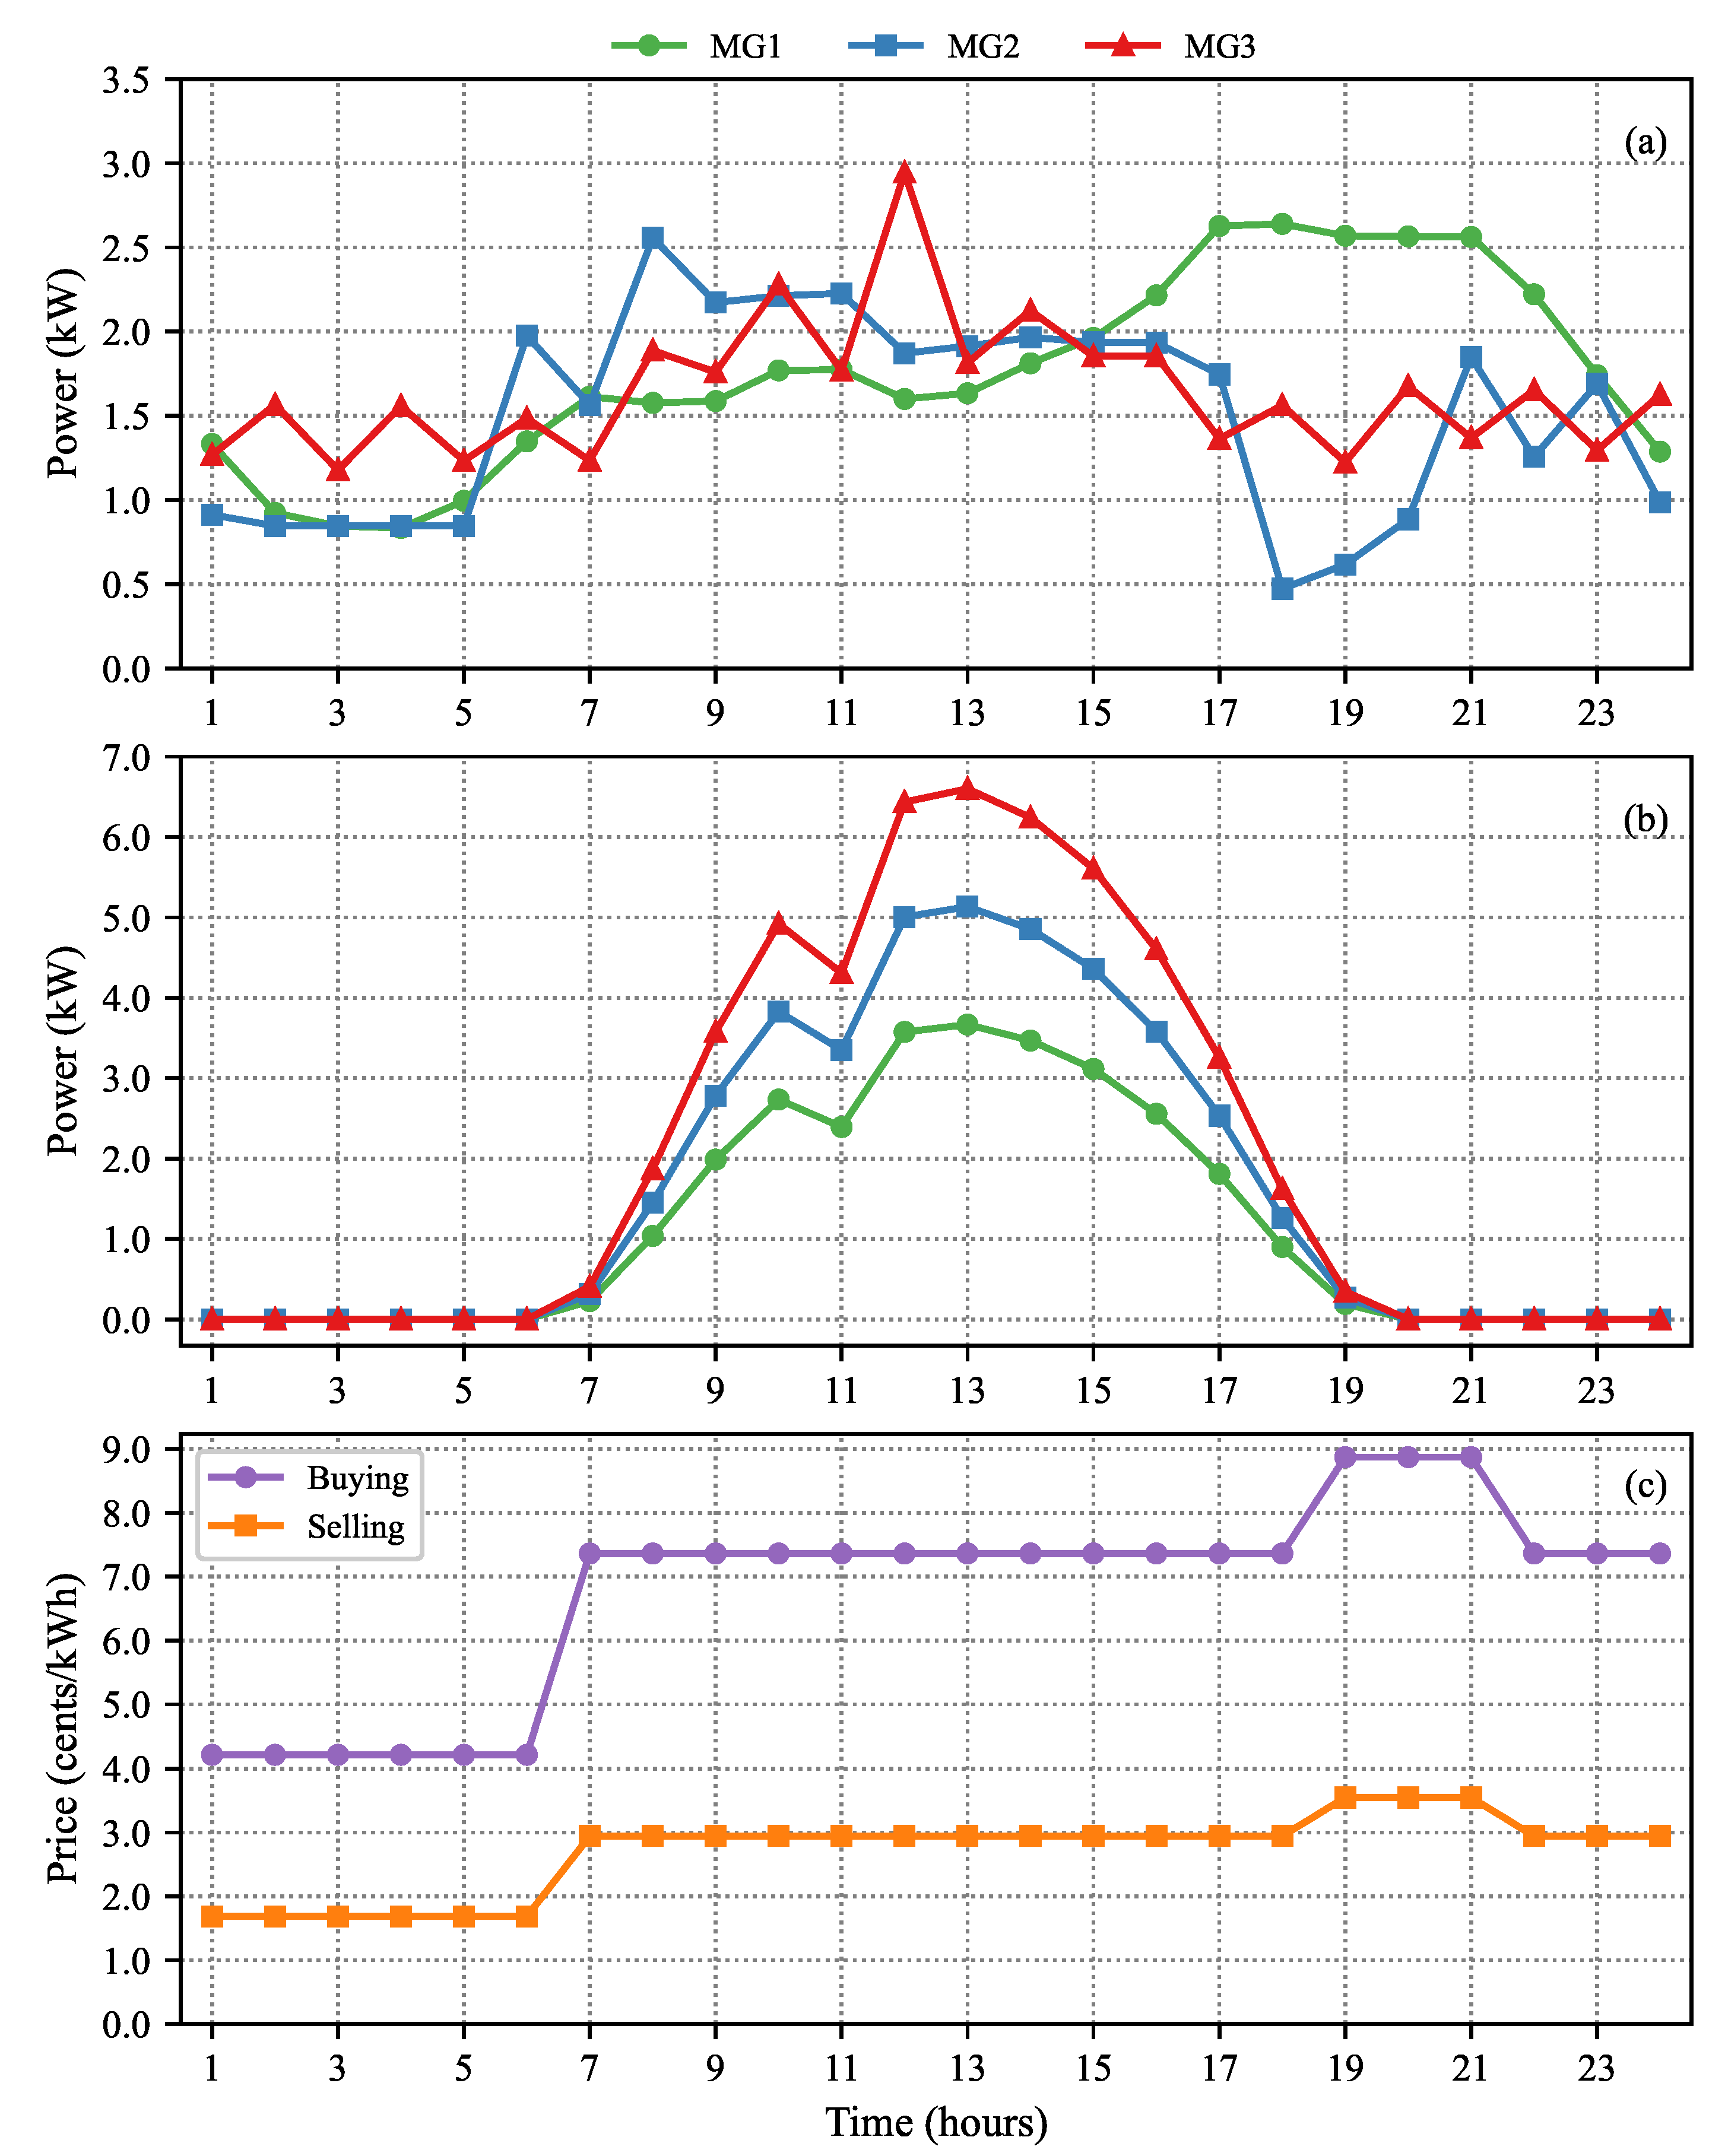
The hourly load profiles for MGs 1, 2, and 3 on a typical summer day are shown in Figure 3a. The profiles exhibit distinct patterns: MG1 demonstrates steady demand, MG2 shows intermediate levels, and MG3 fluctuates significantly with noticeable peaks around midday. The hourly solar generation for MGs 1, 2, and 3 is presented in Figure 3b. Solar PV generation peaks between 12:00 P.M. and 1:00 P.M., with MG3 producing the highest output due to its larger capacity (9 kW). The selected summer day presents optimal conditions for the utilization of solar PV systems and BESS. This scenario underscores the significant role of EVs, such as EV1 and EV2, in supporting grid operations by contributing a portion of the load in each MG. The TOU buying and selling rates for the chosen summer day are illustrated in Figure 3c. The TOU selling rates are set at one-third of the TOU buying rates. Three pricing periods are observed:
  • Peak hours: 6:00 P.M. to 9:00 P.M.,
  • Off-peak hours: 6:00 A.M. to 6:00 P.M. and 9:00 P.M. to 12:00 A.M.,
  • Super off-peak hours: 12:00 A.M. to 6:00 A.M.

3.2. Performance Evaluation

3.2.1. Individual Operation

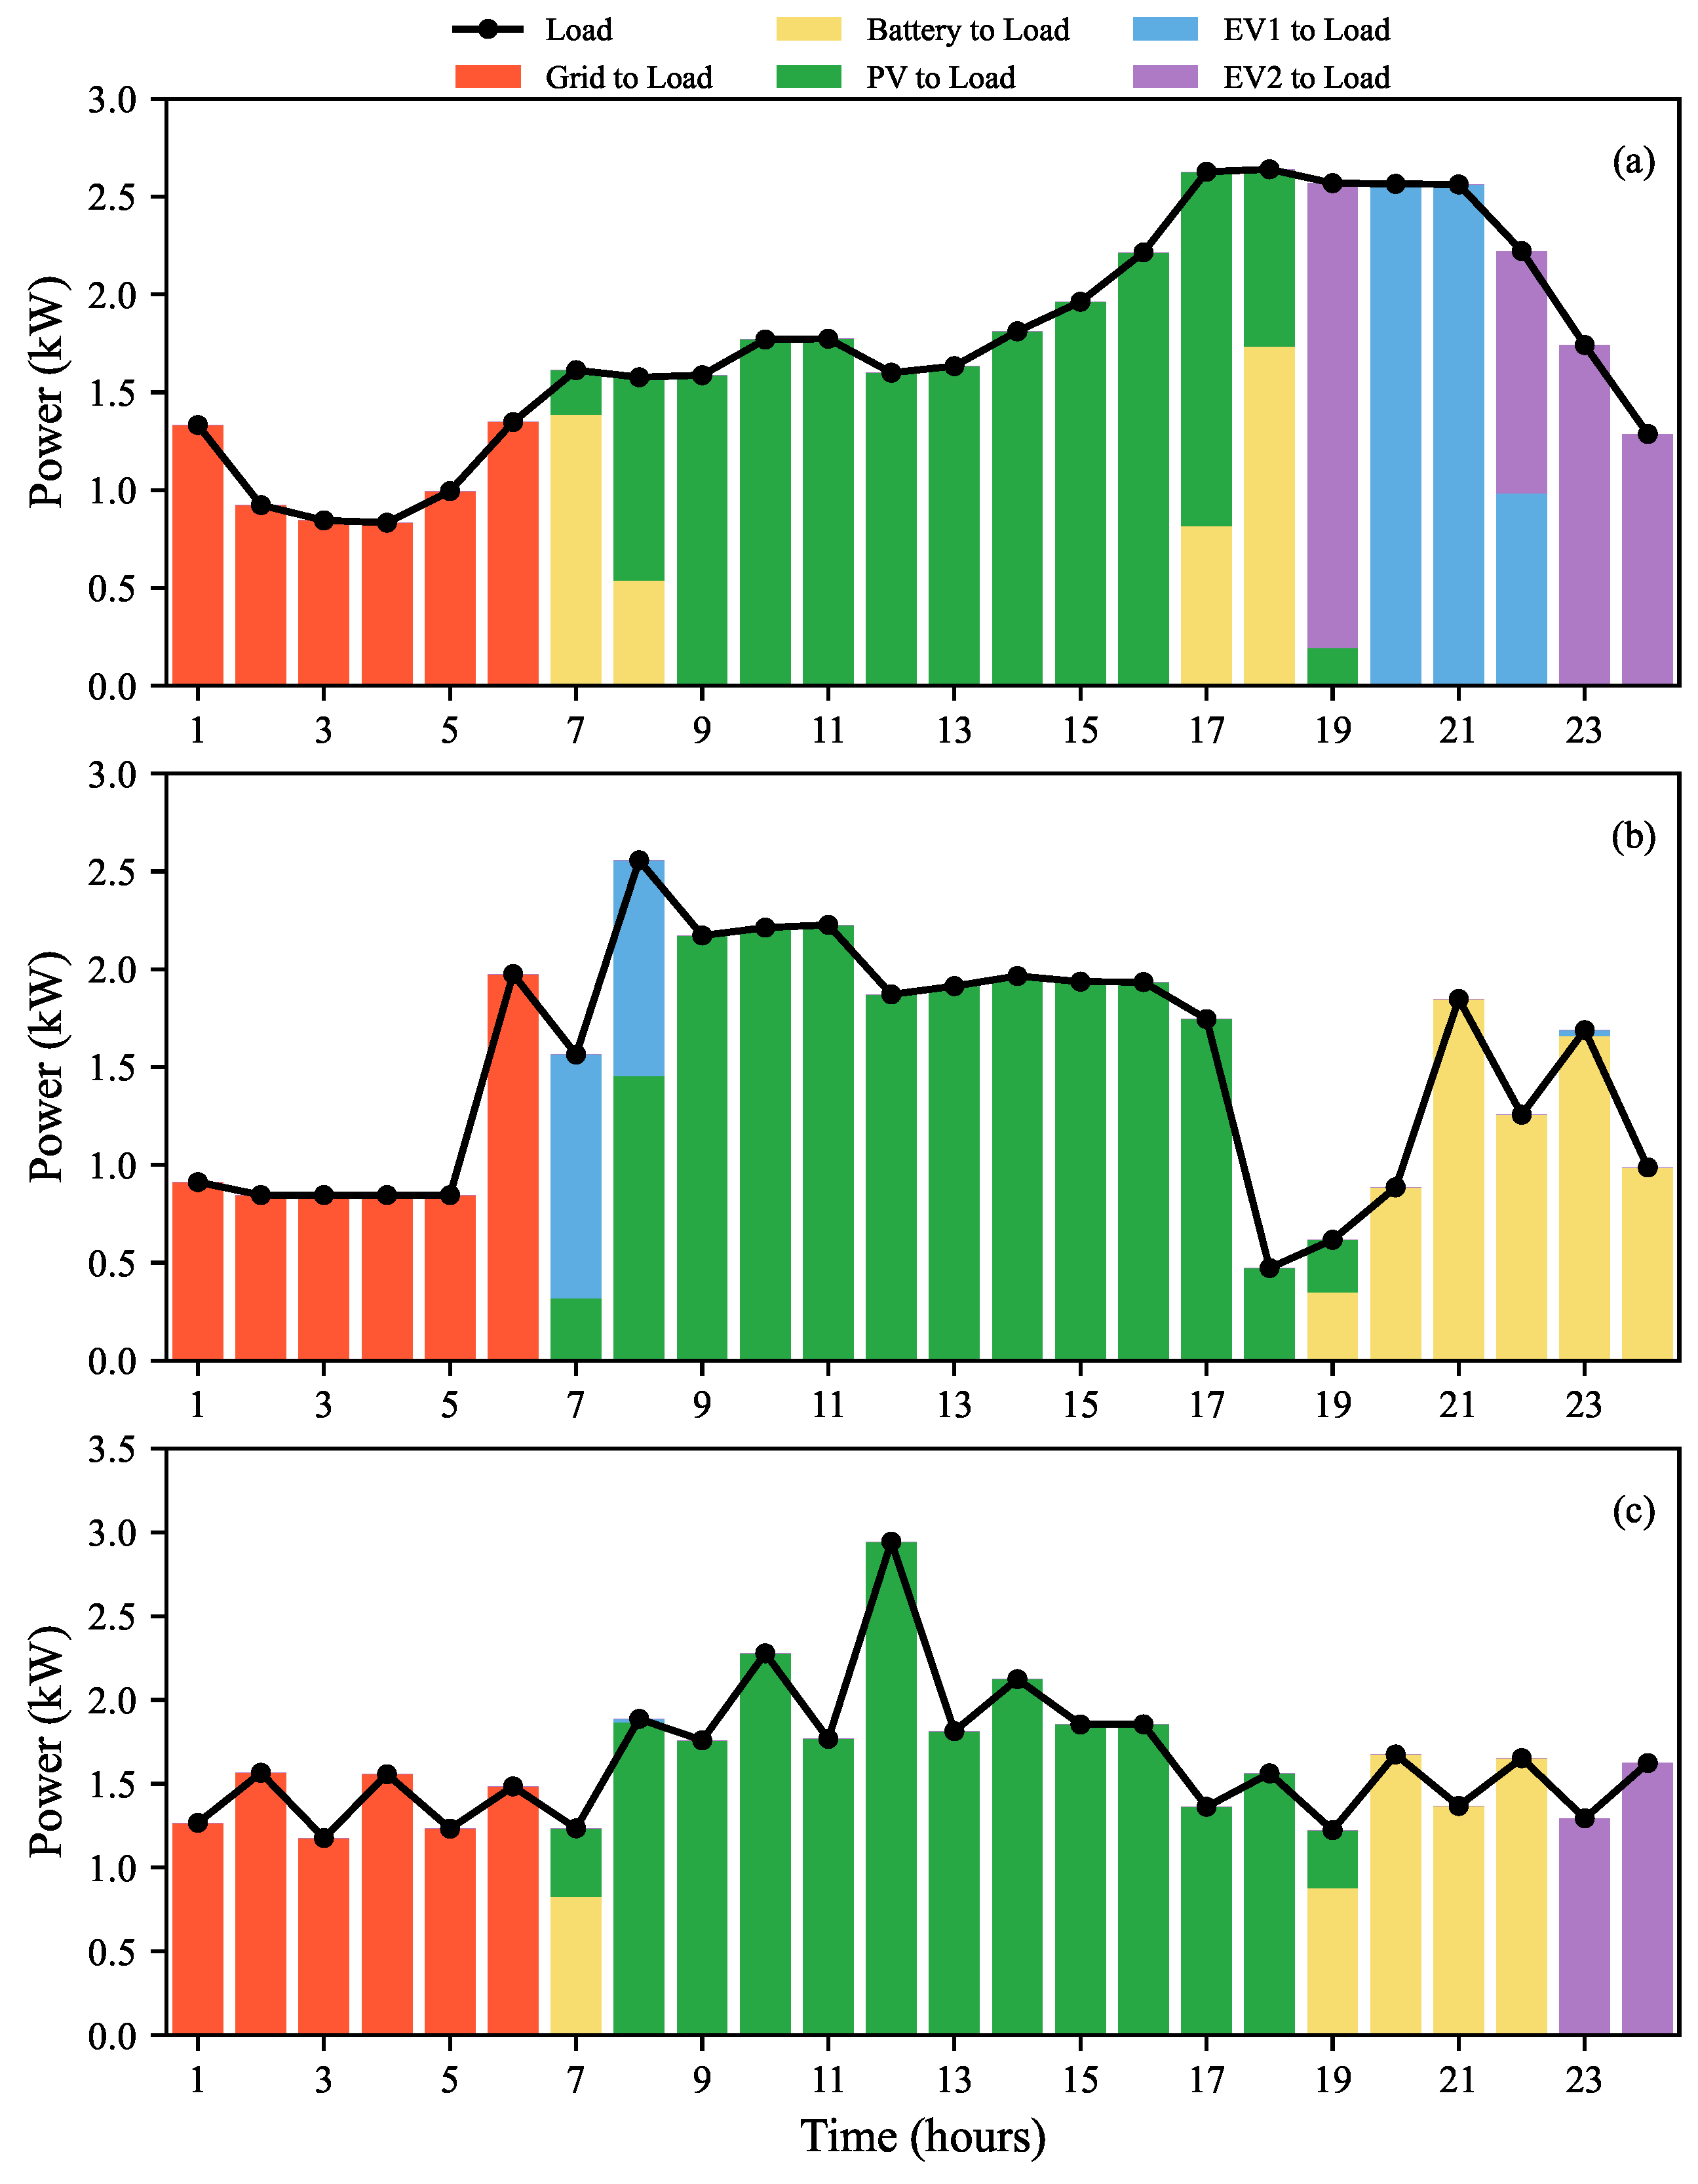
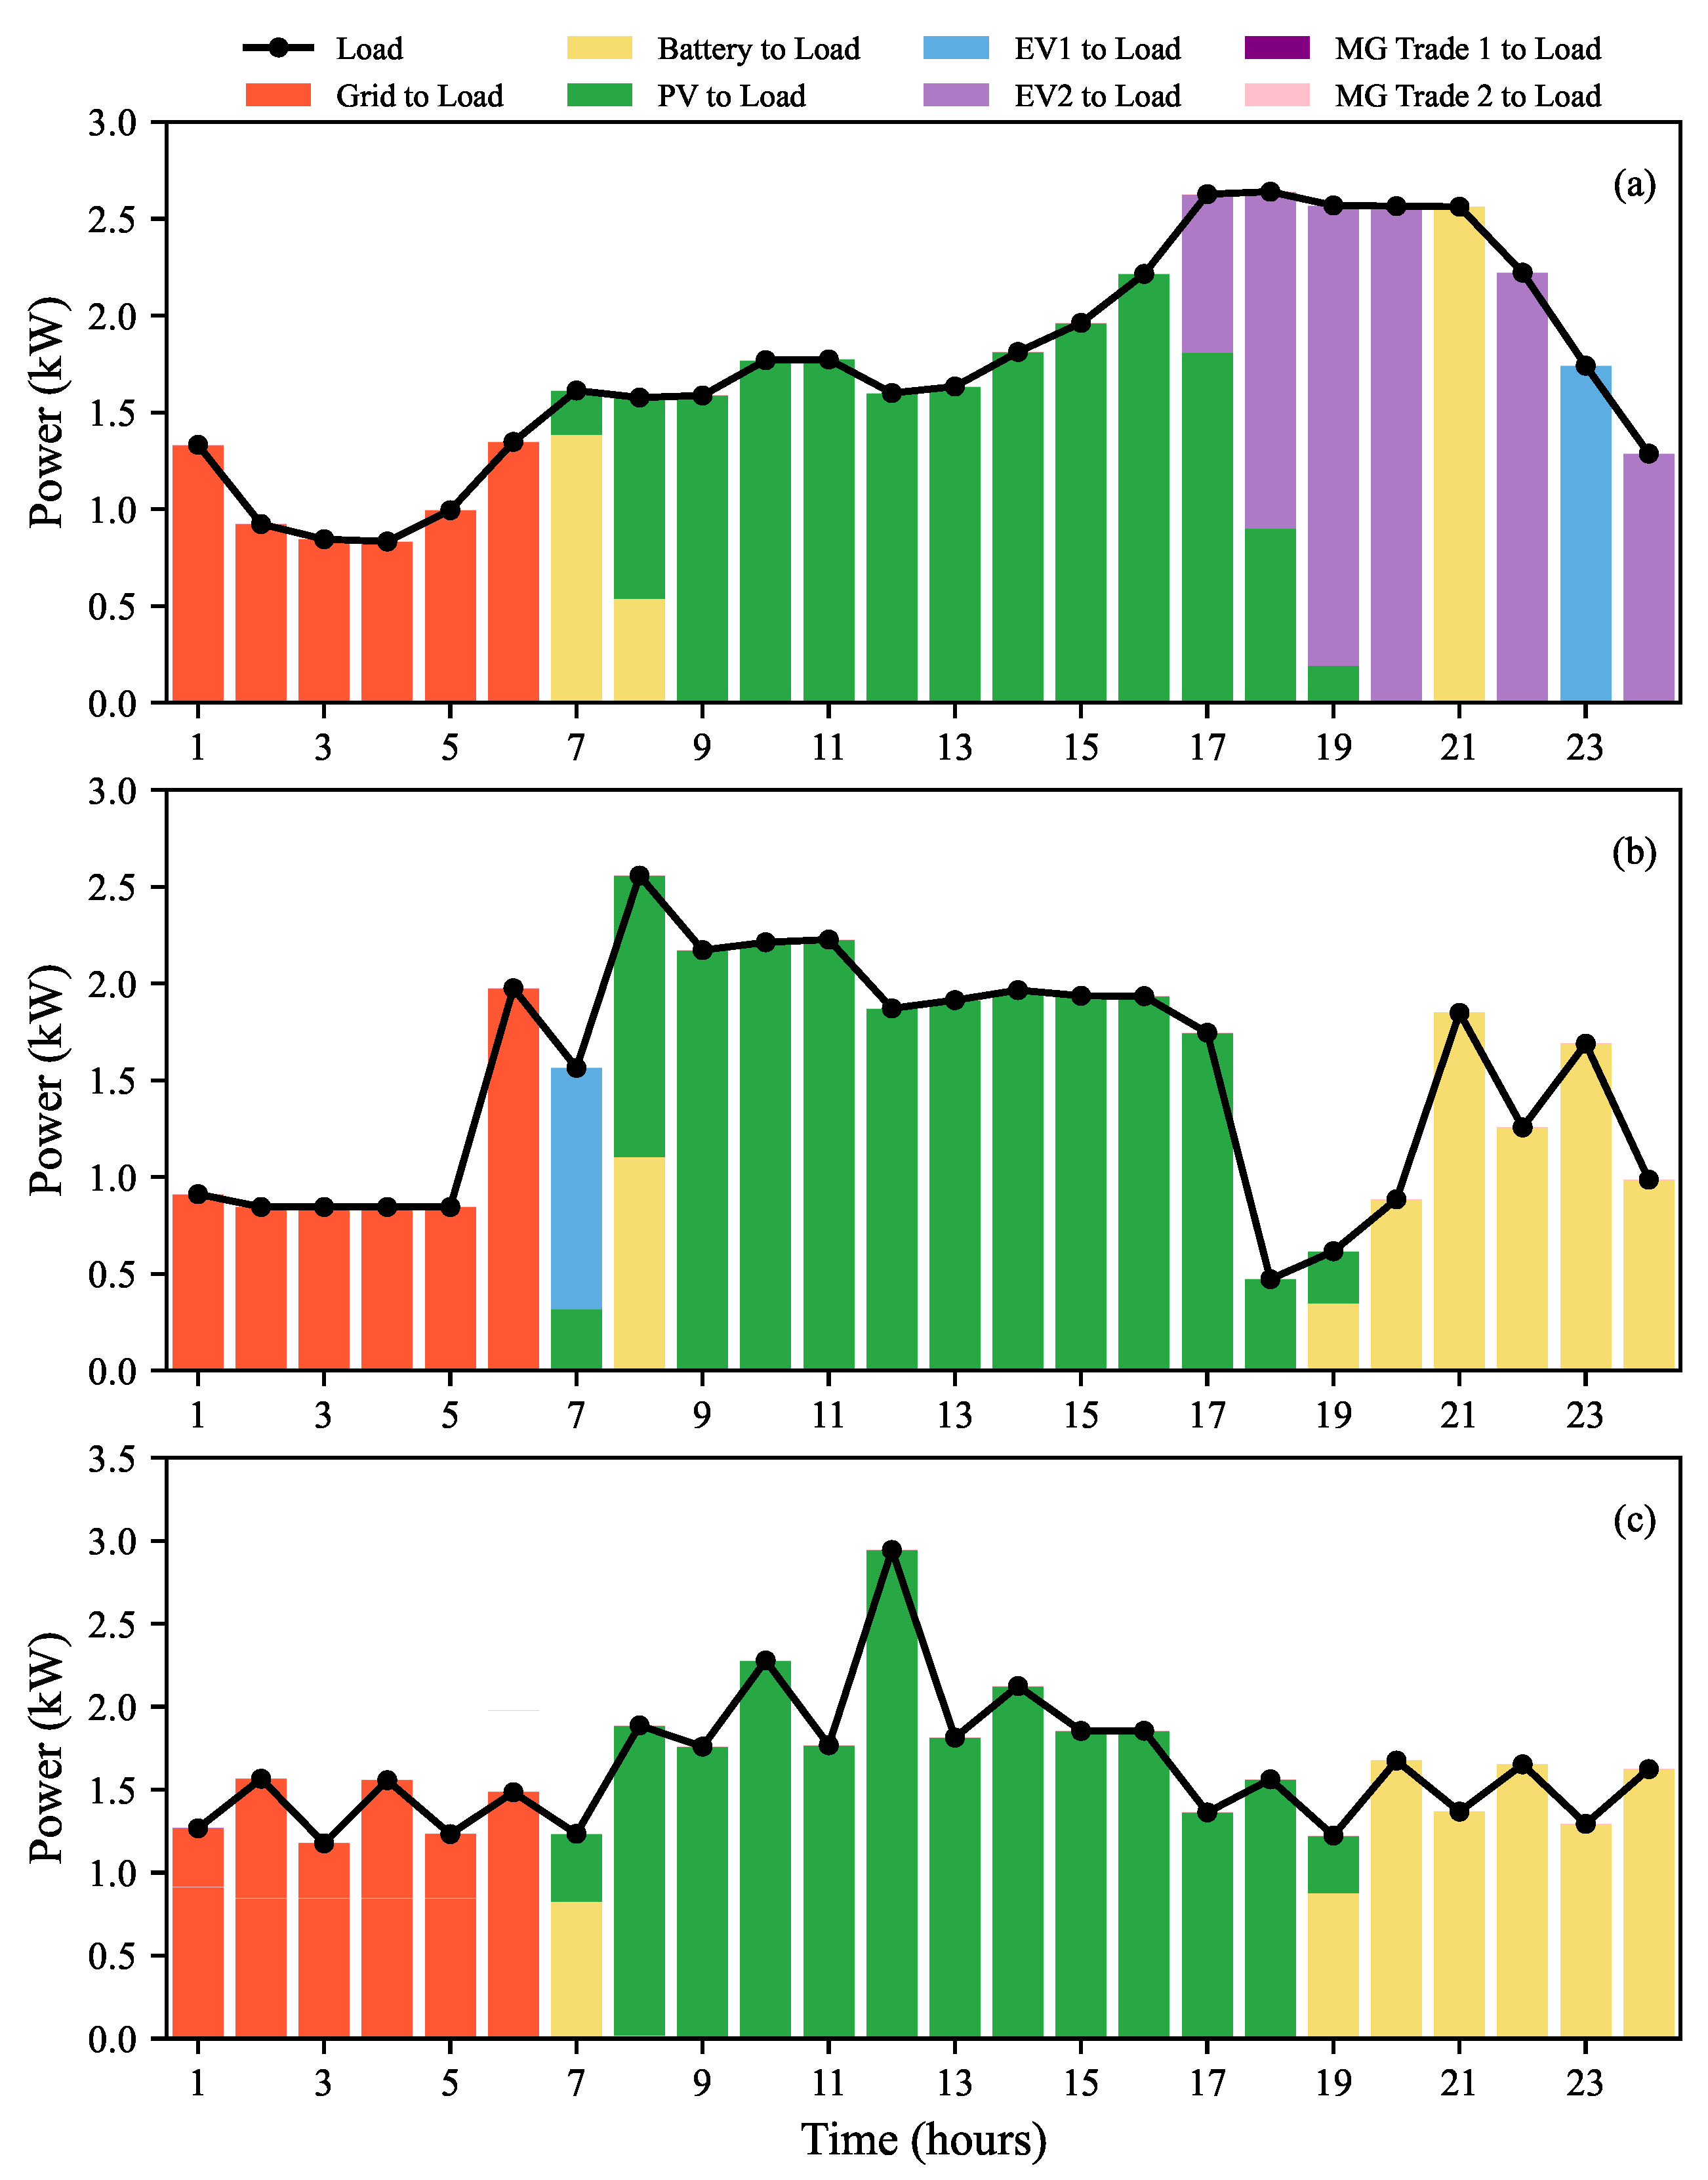
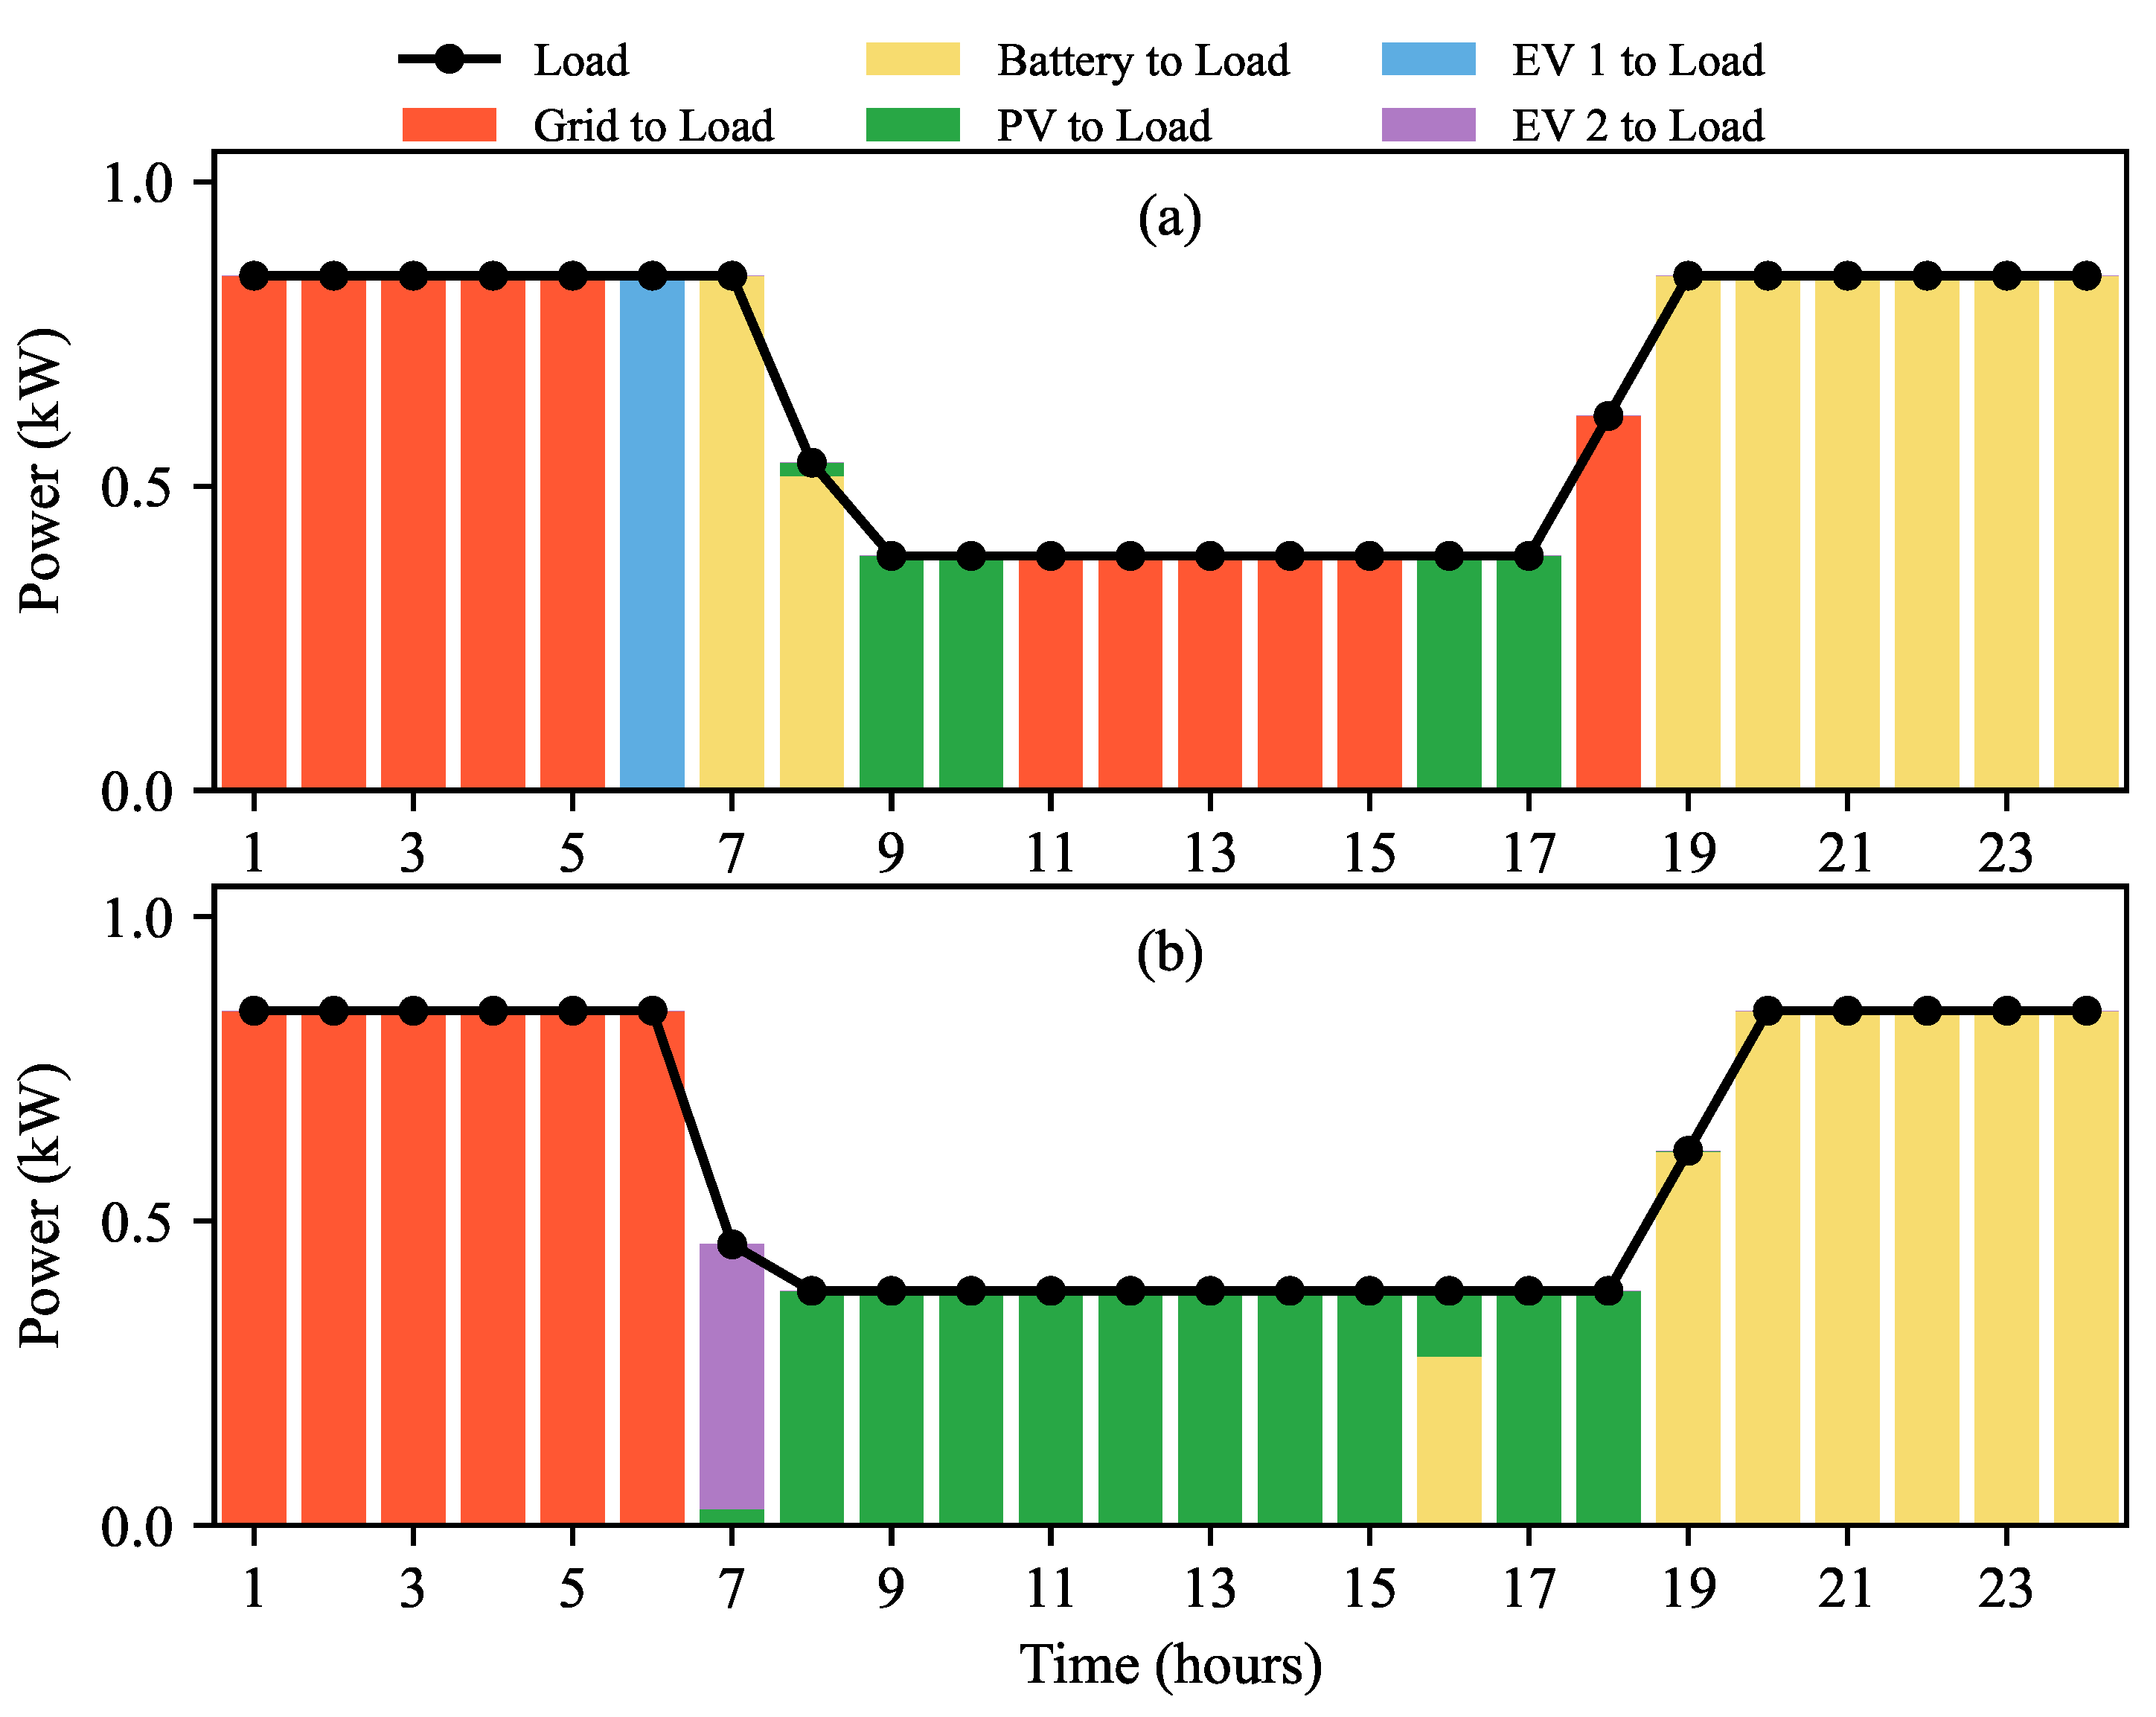
The load balances for MGs 1, 2, and 3 on the selected summer day are shown in Figure 4. It can be observed that for MG1 (Figure 4a), the load is primarily supplied by the grid during the early morning hours (1:00 A.M.–6:00 A.M.). Solar PV generation dominates during the midday (9:00 A.M.–4:00 P.M.), while BESS contributes during peak hours in the afternoon. For MG2 (Figure 4b), the BESS supplies power during the night (7:00 P.M.–12:00 A.M.), while solar PV generation meets most of the midday load (9:00 A.M.–5:00 P.M.). For MG3 (Figure 4c), the larger PV capacity covers most of the load between 9:00 A.M. and 6:00 P.M., while the grid and BESS provide support during the early morning and evening hours (1:00 A.M.–6:00 A.M. and 7:00 P.M.–10:00 P.M.).
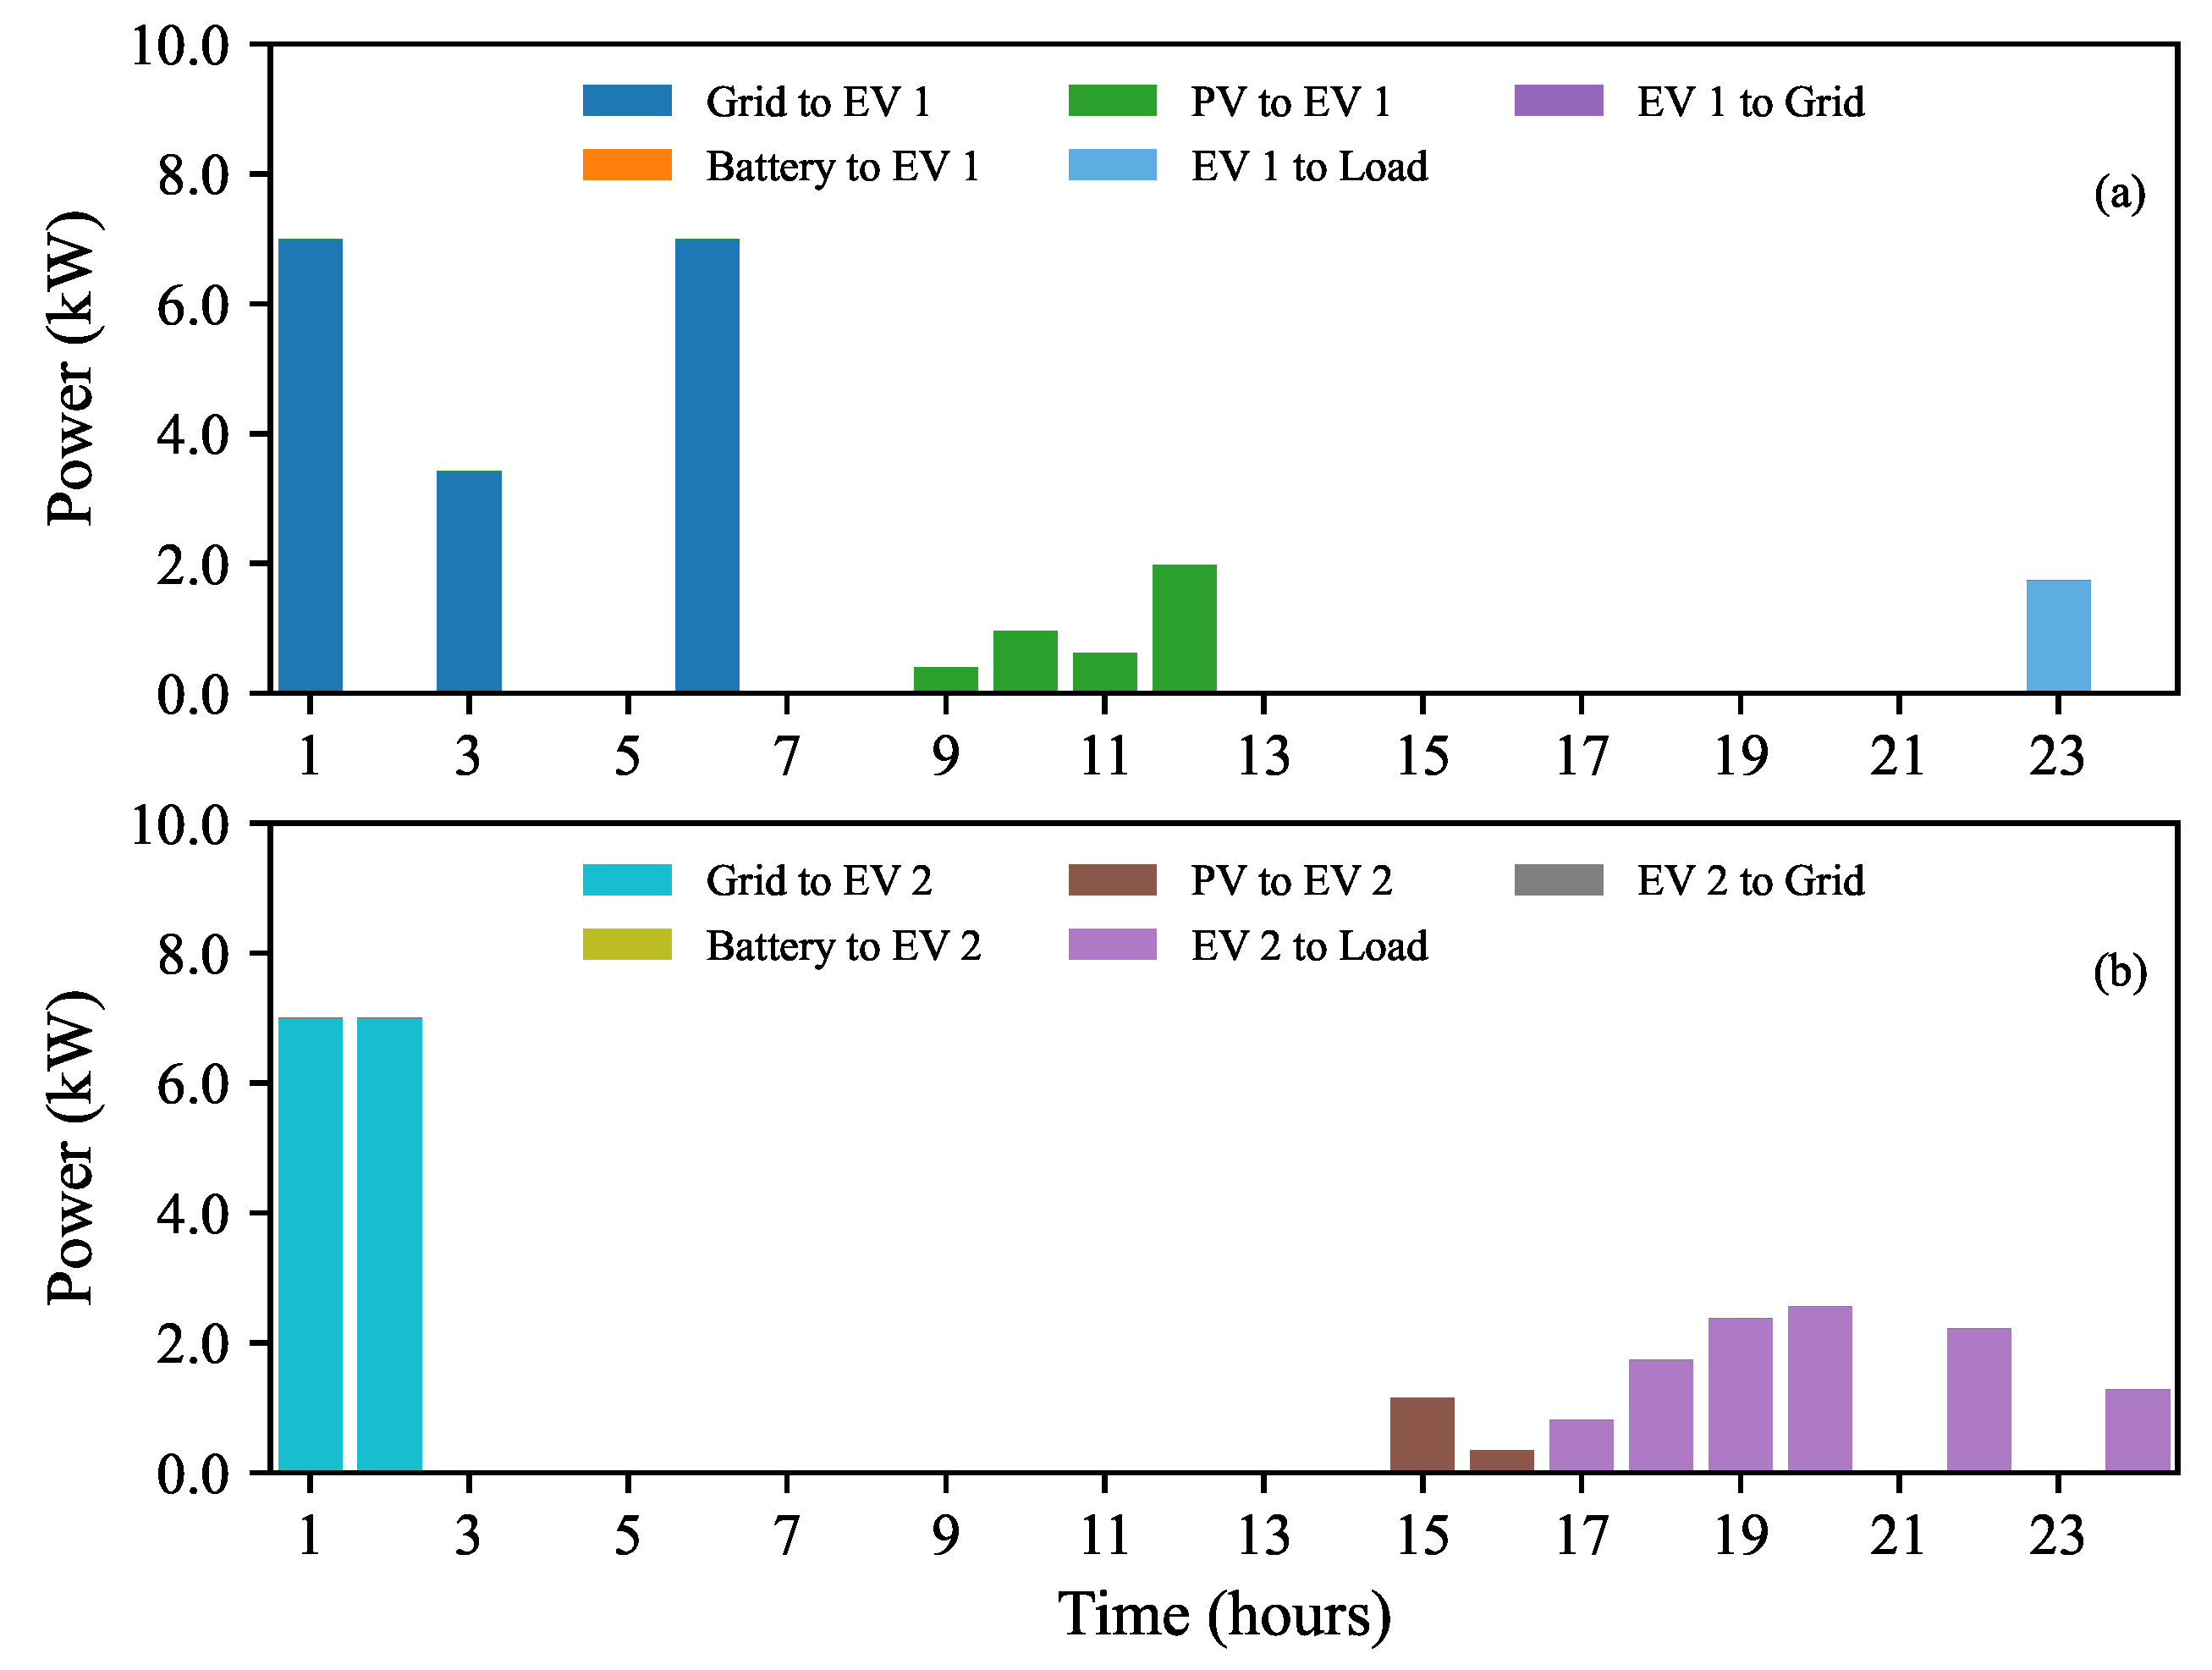
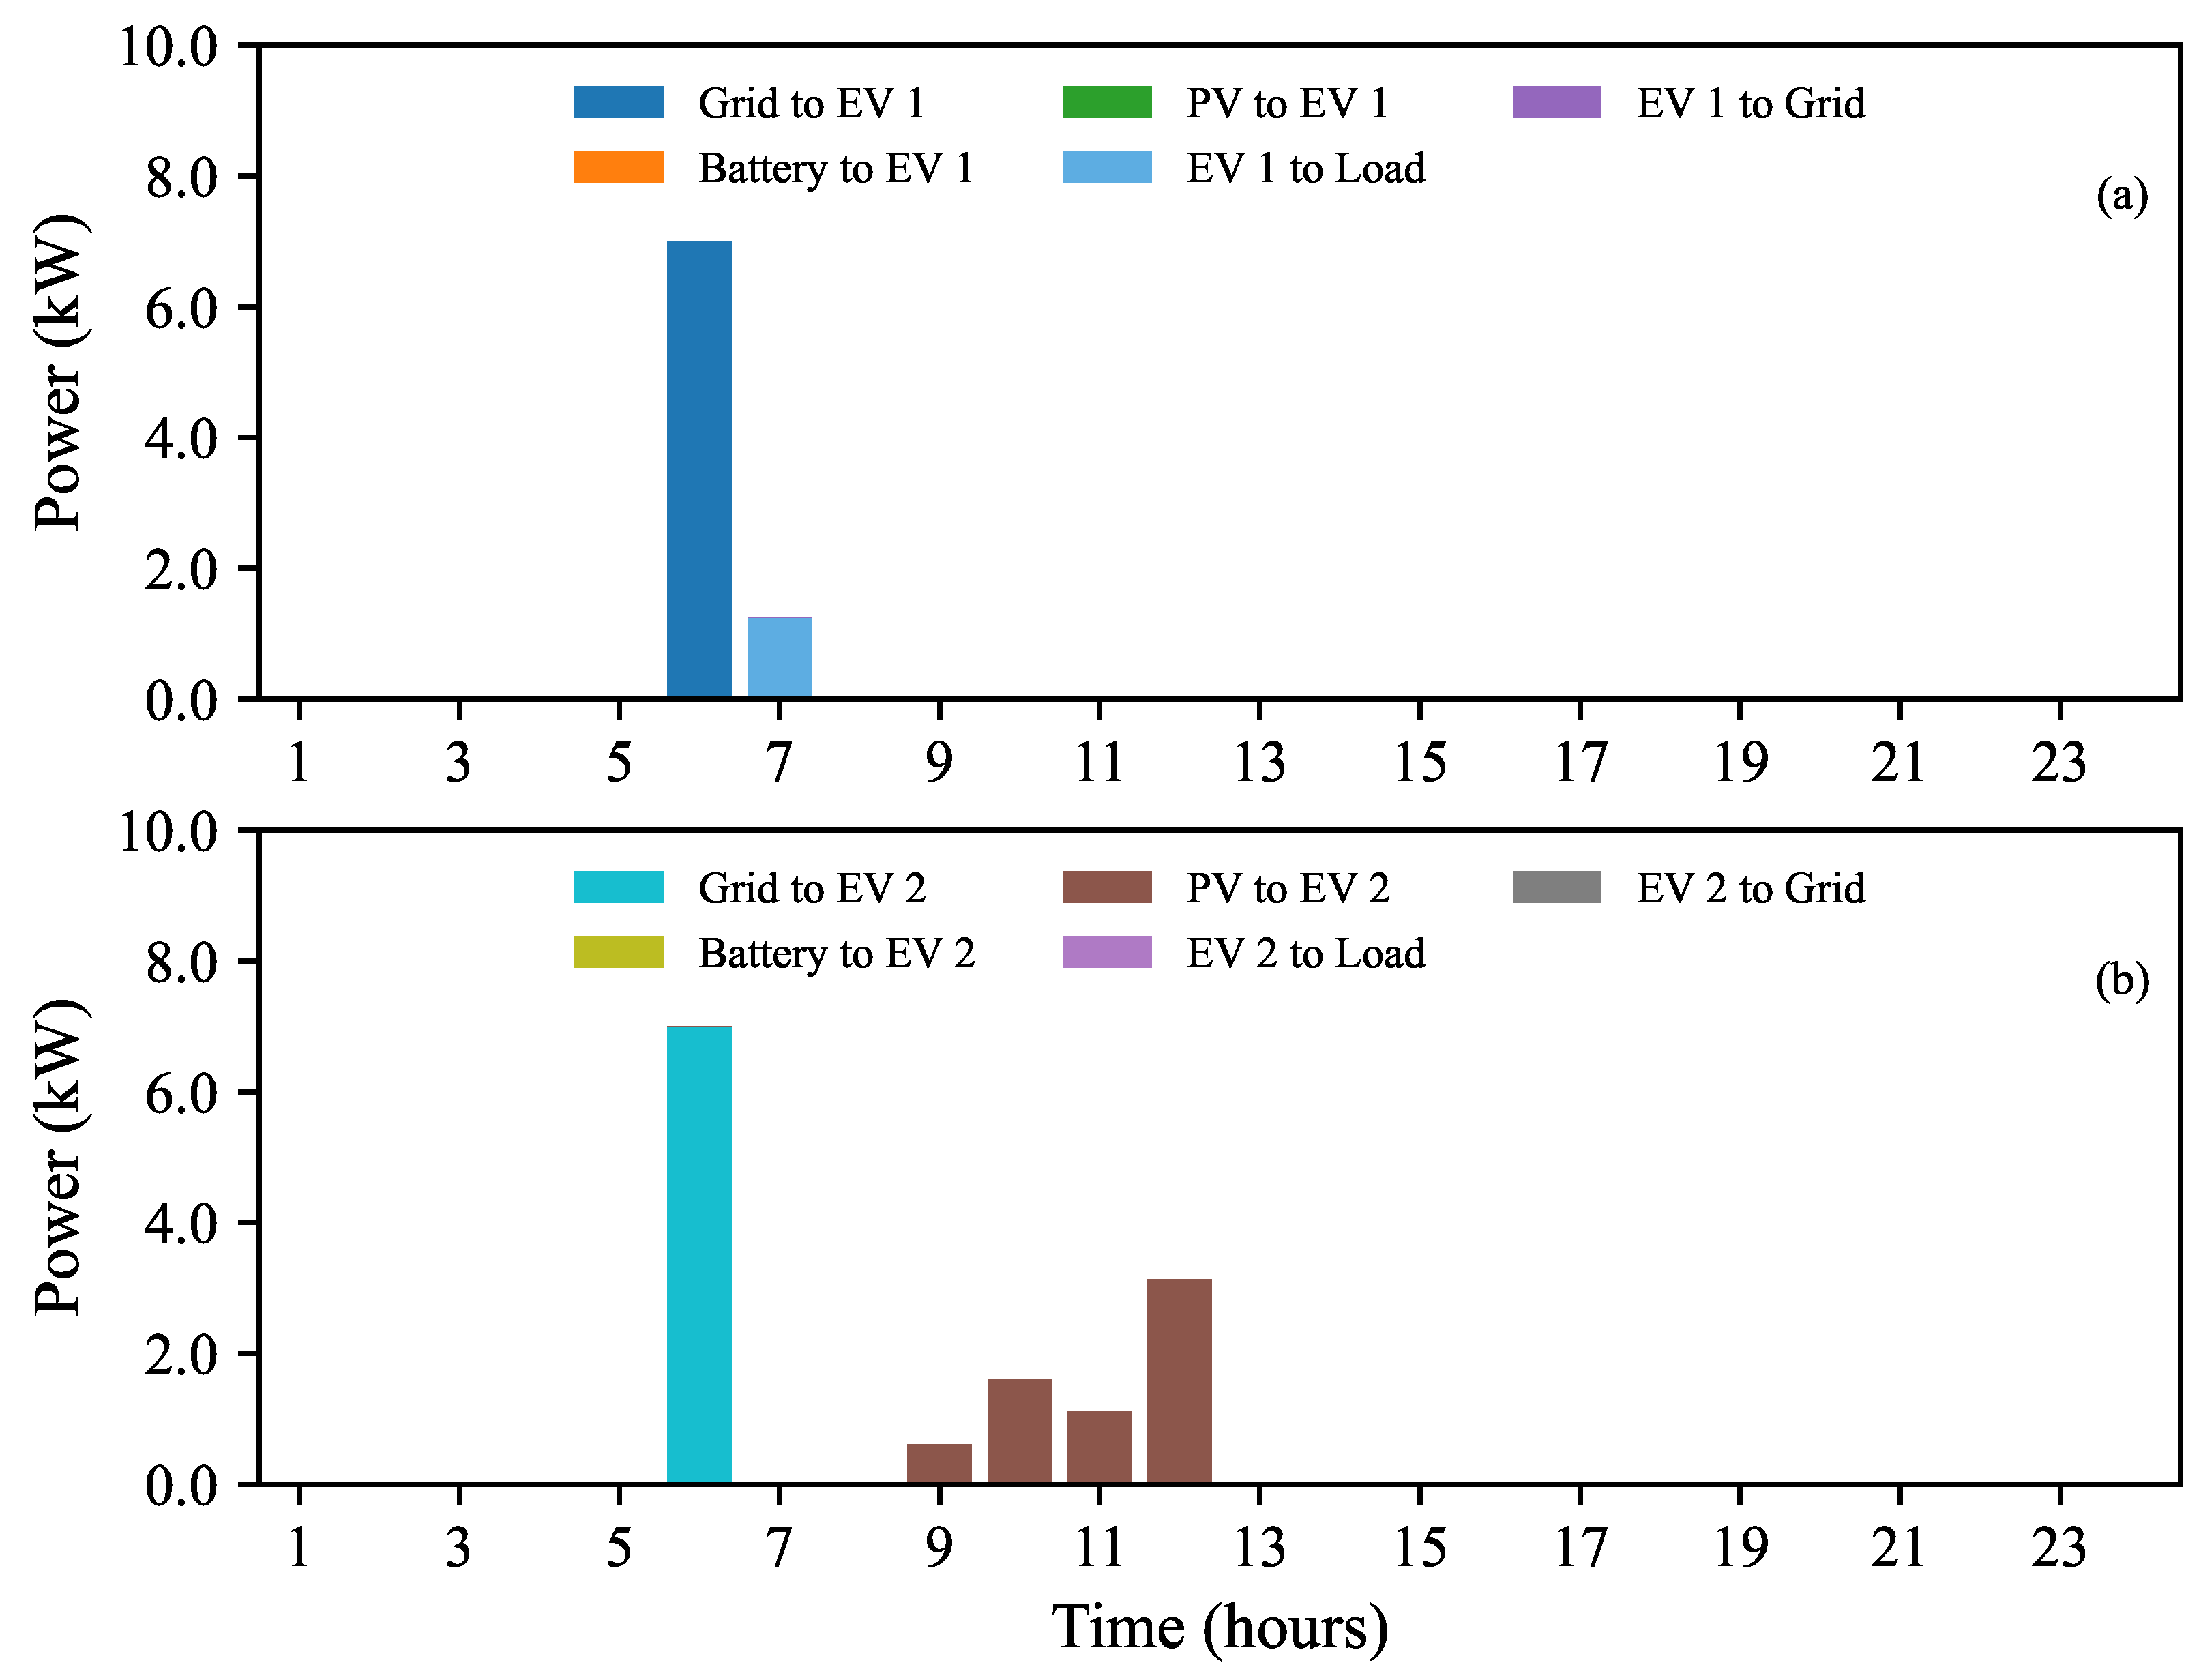
The EV power transactions for MGs 1, 2, and 3 on the selected summer day are shown in Figure 5, Figure 6, and Figure 7, respectively. Figure 5 shows that for MG1, EV1 charges from the grid in the early morning (around 4:00 A.M.) and from the PV generation during midday, discharging to the load between 8:00 P.M. and 10:00 P.M. EV2 exhibits a similar pattern, charging in the early morning (around 2:00 A.M.) and discharging to the load during the evening and late-night hours (7:00 P.M.–12:00 A.M.). Similarly, Figure 6 shows that for MG2, EV1 and EV2 charge from the grid during the early morning hours, with EV1 charging between 5:00 A.M. and 6:00 A.M. and EV2 charging at 2:00 A.M. Both EVs are charged using PV generation between 9:00 A.M. and 12:00 P.M. Further, as seen in Figure 7, the charging patterns of EVs 1 and 2 in MG3 are identical to those in MGs 1 and 2, with both EVs getting charged from the grid during either super off-peak or off-peak hours. EV2 also supplies power to the load between 11:00 P.M. and 12:00 A.M. These results highlight how IO effectively coordinates PV, BESS, and EVs to balance loads, reduce grid dependency, and maximize RE utilization.

3.2.2. Community-Based Operation and Cooperative Game-Theoretic Method

The load balances in the CBO framework across MG1, MG2, and MG3 for a typical summer day are shown in Figure 8. In all three MGs, PV generation continues to dominate midday energy supply (10:00 A.M.–3:00 P.M.), while the grid and batteries provide support during the early morning (1:00 A.M.–6:00 A.M.) and evening hours (6:00 P.M.–10:00 P.M.). MG1 and MG2 rely more heavily on grid power during non-solar hours, whereas MG3 leverages its larger PV capacity to reduce grid dependence. Figure 9, Figure 10, and Figure 11 illustrate the power transactions of EVs within MGs 1, 2, and 3, respectively. The figures show that EV charging and discharging patterns remain largely consistent with those observed in the IO framework. In each MG, EV1 and EV2 primarily charge during the early morning hours (3:00 A.M.–6:00 A.M.) and from PV generation during the daytime. The results from the CBO for the selected summer day show trends similar to the IO framework, with only minor differences in power distribution. Furthermore, the power distribution resulting from the cooperative GT approach is identical to that of the CBO, as cooperative GT focuses solely on redistributing savings among MGs within the MMG system without altering power flows.

3.2.3. Alternating Direction Method of Multipliers (ADMM)

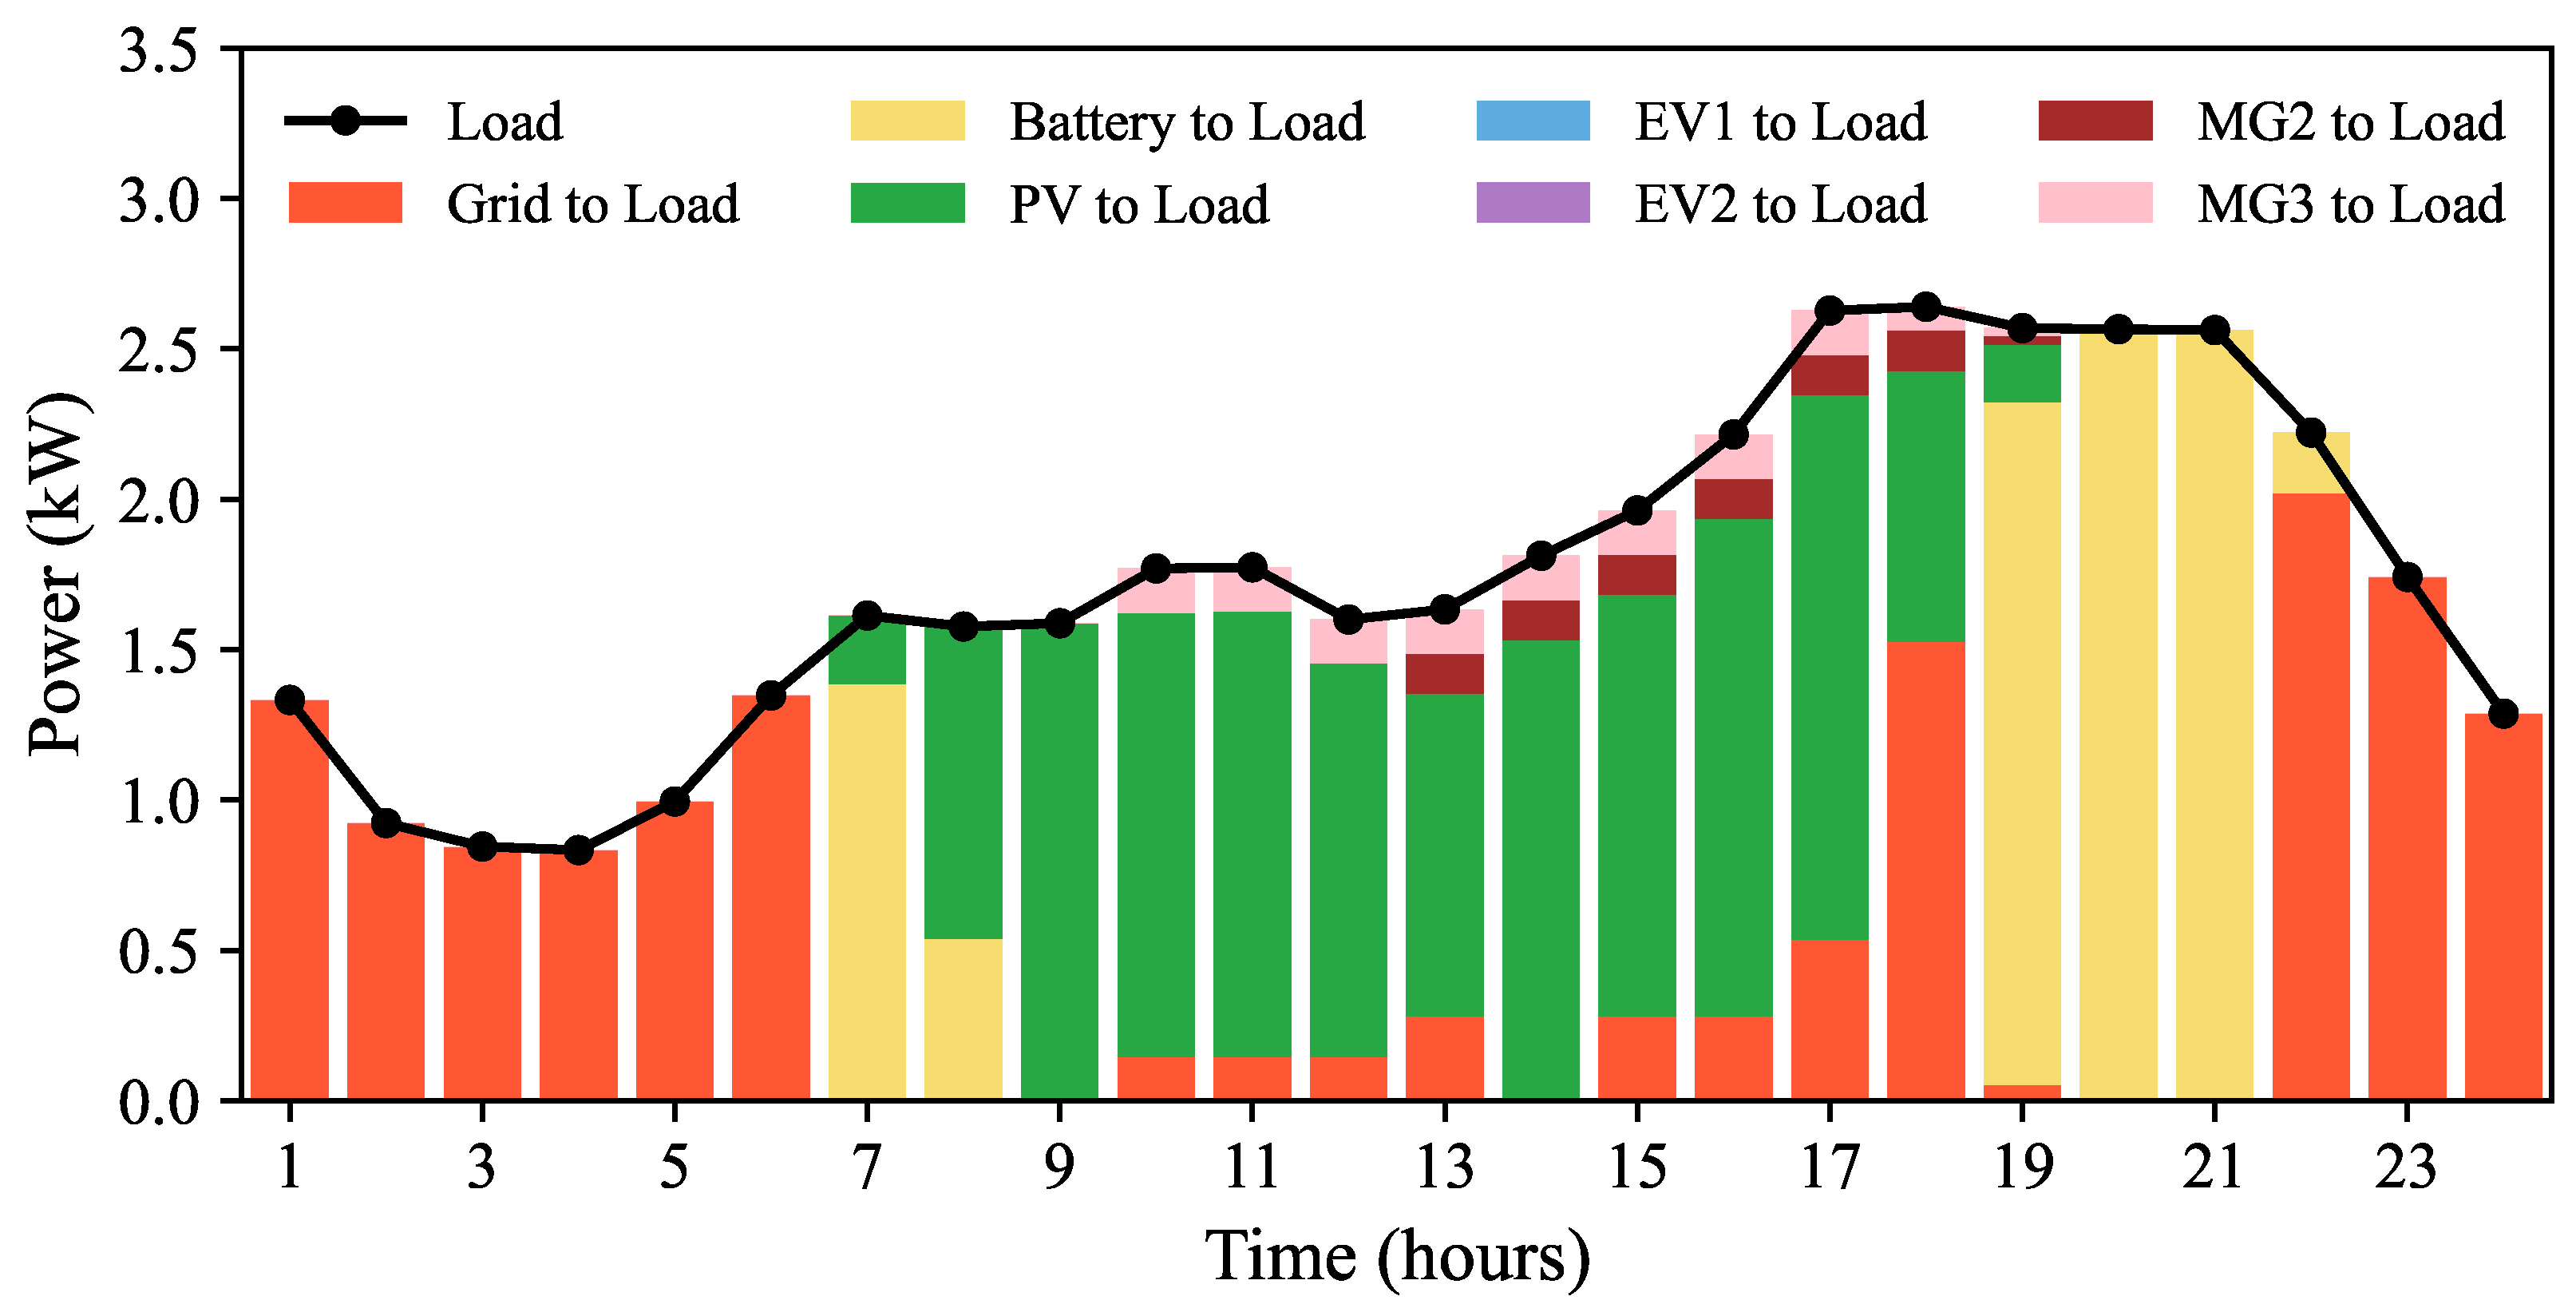
Figure 12 illustrates the load balancing for MG1 on the selected summer day using ADMM. It can be observed that while PV generation remains the dominant power source during 9:00 A.M.–5:00 P.M., additional support is provided by power imported from MGs 2 and 3 between 1:00 A.M. and 6:00 A.M., as well as from 10:00 A.M. to 6:00 P.M. Due to the larger PV capacity of MG3, it provides extended load support to MG1 for longer durations. Similar power distribution trends are observed in MG2 and MG3, consistent with the community-based and individual cases, as they primarily rely on PV and BESS for load support. Similarly, for EVs within MGs 1, 2, and 3, charging and discharging patterns closely resemble those in the CBO and IO cases, with only minor variations.

4. Results and Analysis

4.1. Seasonal Analysis

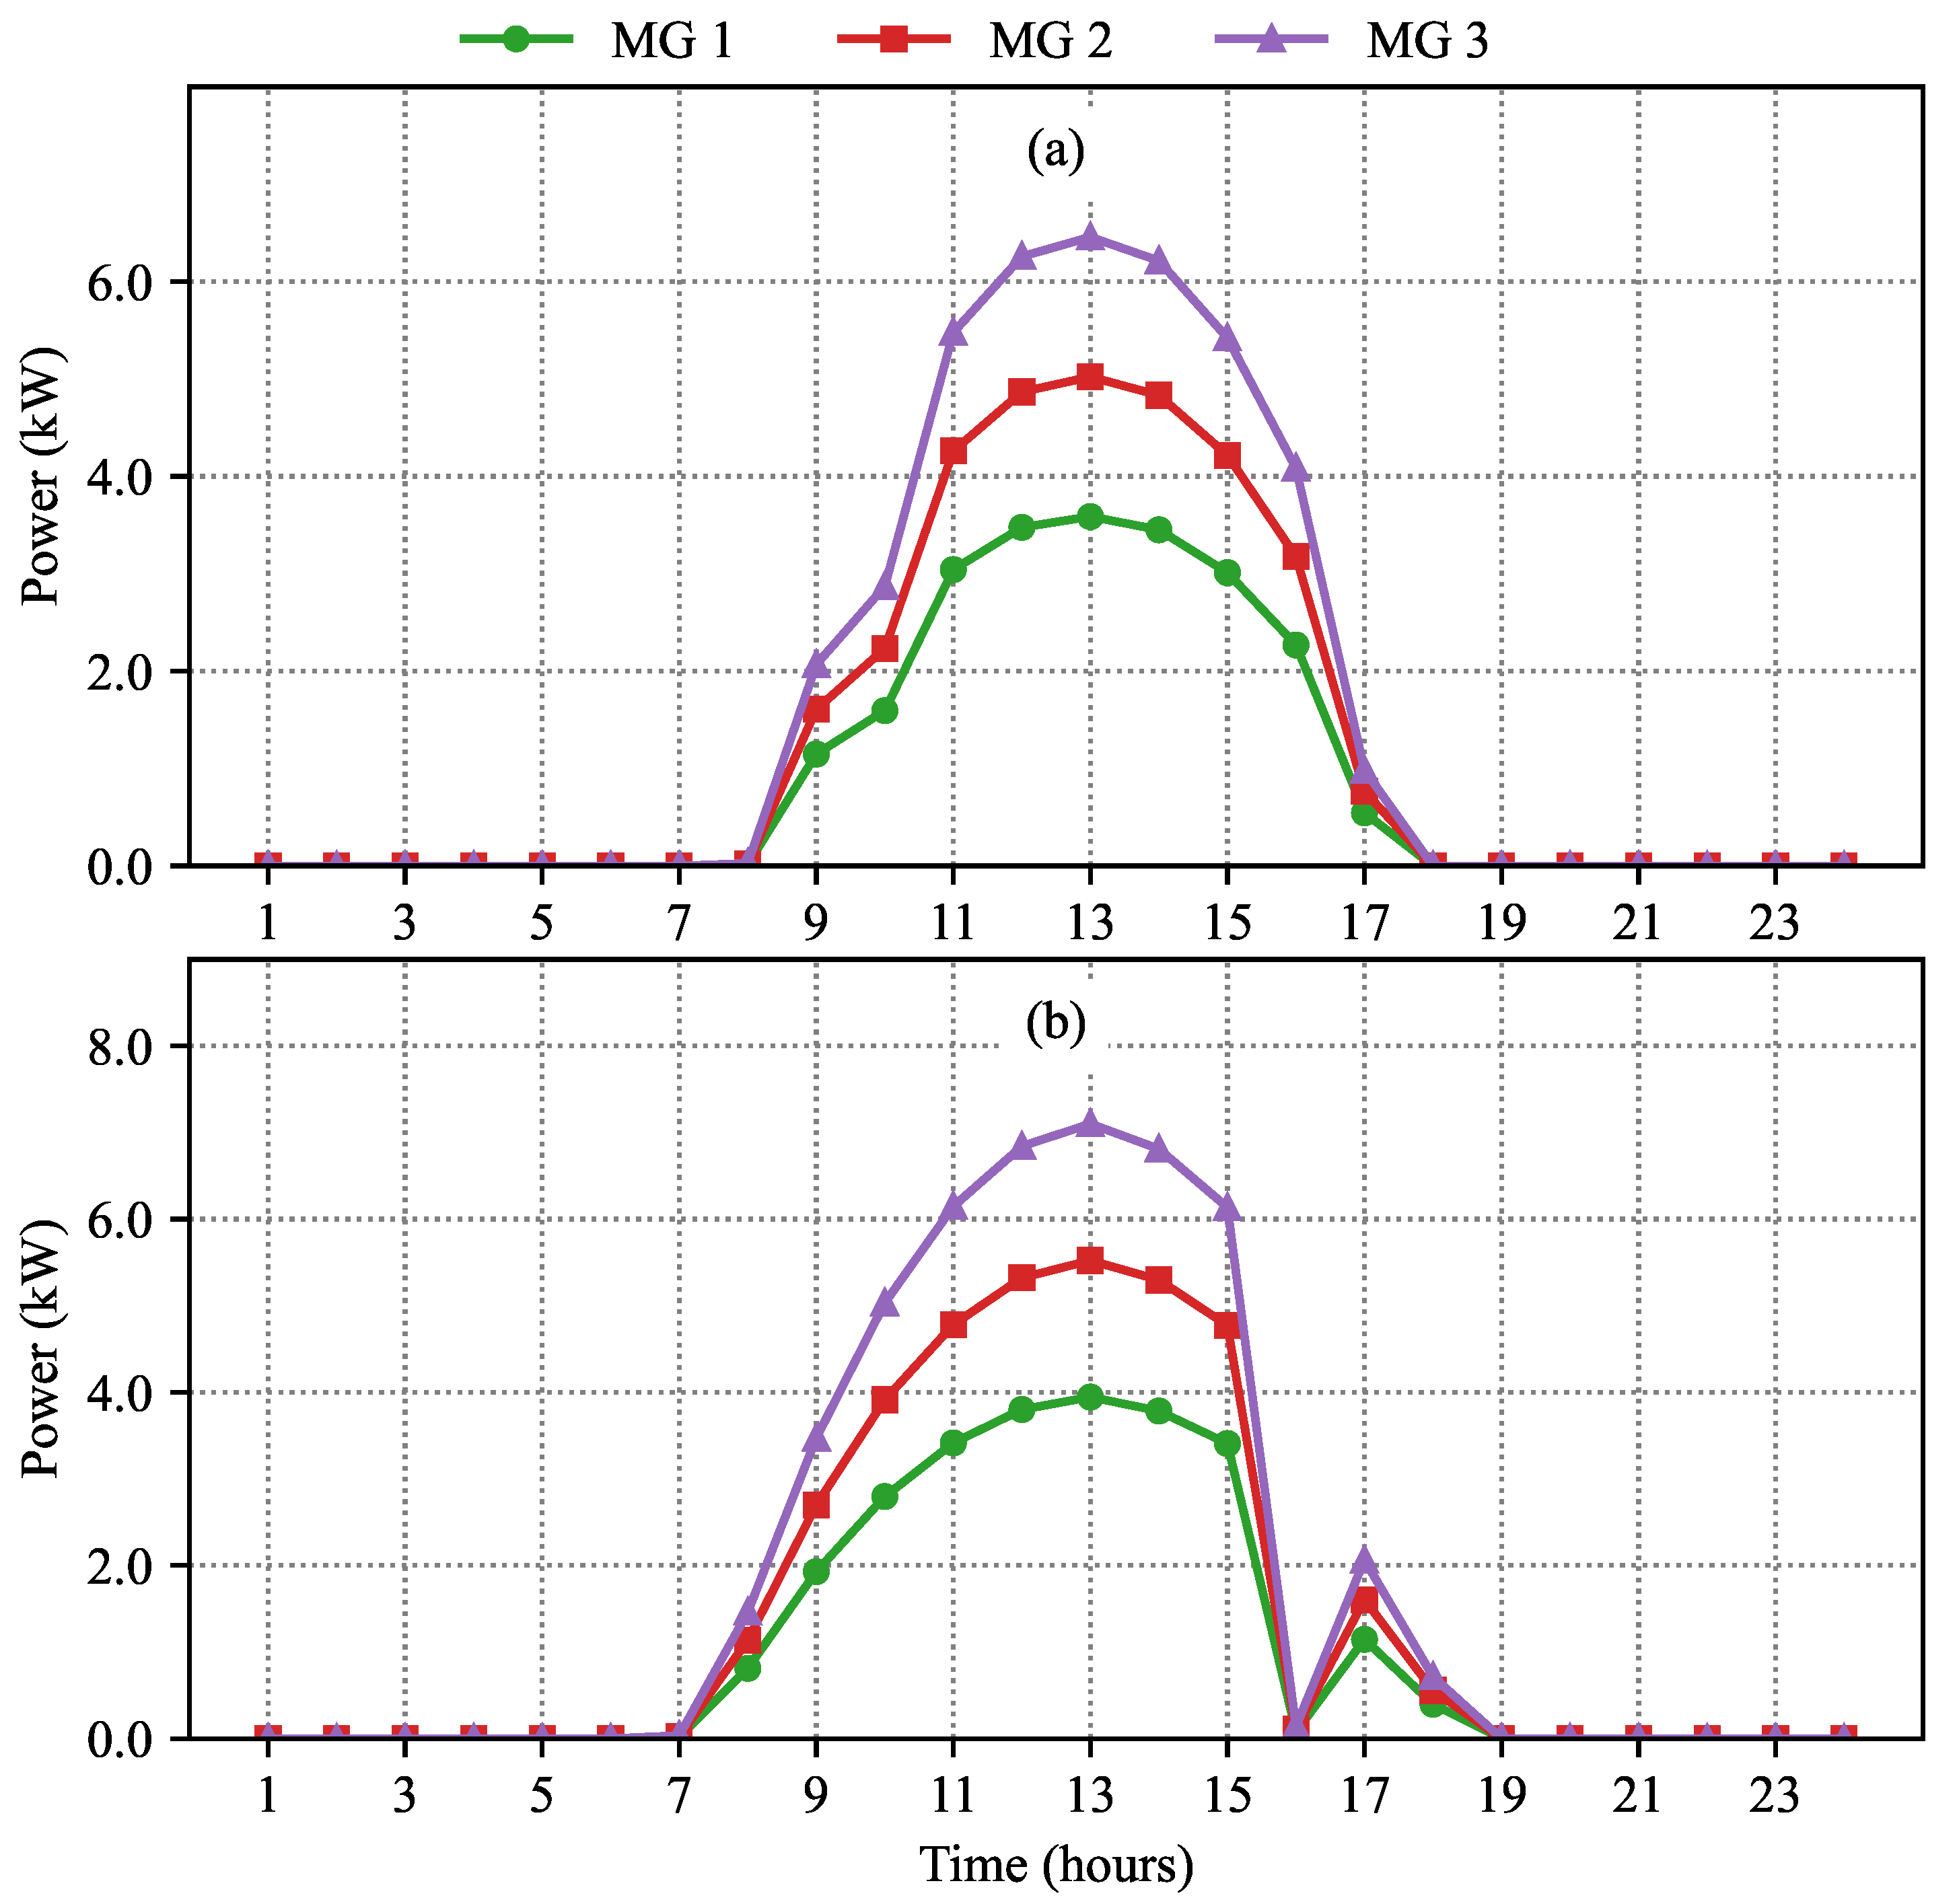
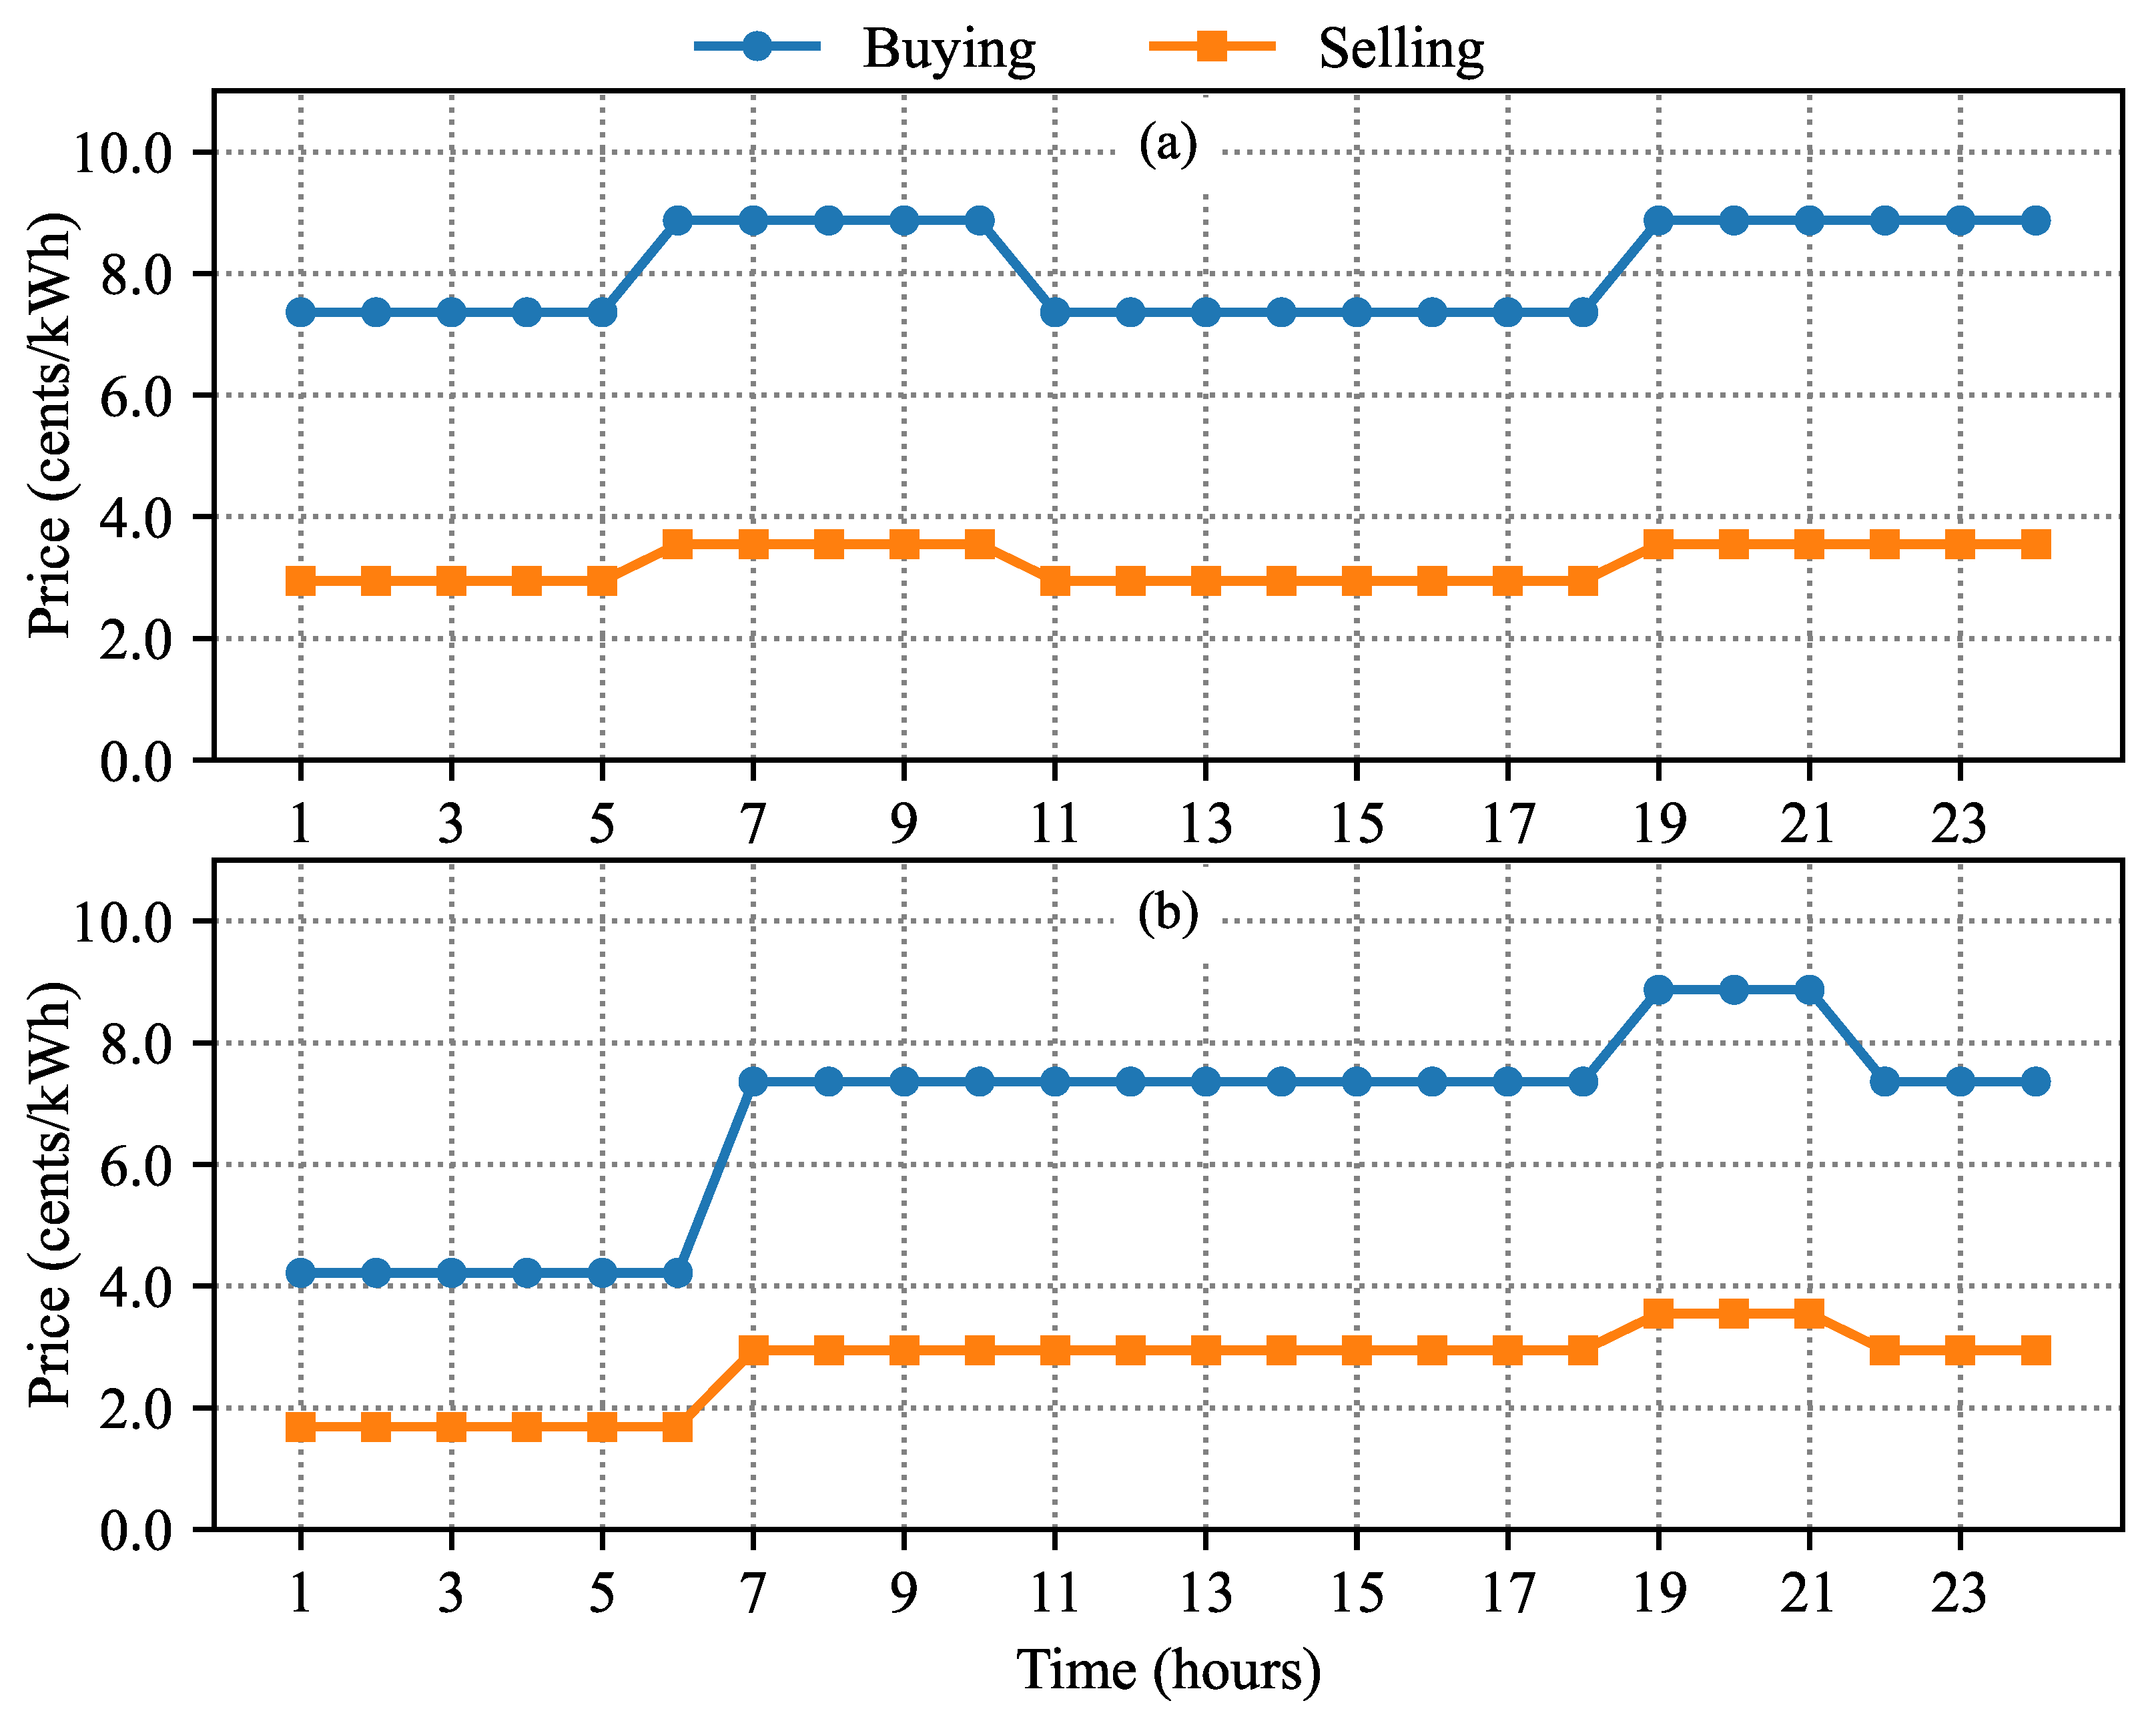
The hourly profiles of load and PV generation for MGs 1, 2, and 3 on selected winter and off-season days are shown in Figure 13 and Figure 14, respectively. Figure 13 illustrates that MG2 exhibits relatively steady demand throughout both days. In winter, MG1 experiences the highest peak demand at 7:00 P.M., whereas in the off-season, MG3 shows its peak demand at 3:00 P.M. These variations reflect the distinct load requirements of the MGs, influenced by seasonal differences. As shown in Figure 14, PV generation peaks between 12:00 P.M. and 1:00 P.M. on both days, with MG3 producing the highest output due to its larger capacity. Solar generation is notably lower in winter compared to the off-season due to reduced insolation levels (W/m2) [46]. Winter and off-season days were selected to demonstrate the optimal utilization of solar PV and BESS. These periods also underscore the crucial role of EVs in supporting grid operations. Similar to summer days, these selections aim to capture scenarios where solar PV and BESS significantly contribute to meeting the load demands of their respective MGs. The TOU buying and selling rates for winter and off-season days are presented in Figure 15. The winter day includes peak and off-peak pricing periods, while the off-season day features three pricing periods: peak, off-peak, and super off-peak.

4.1.1. Individual Operation

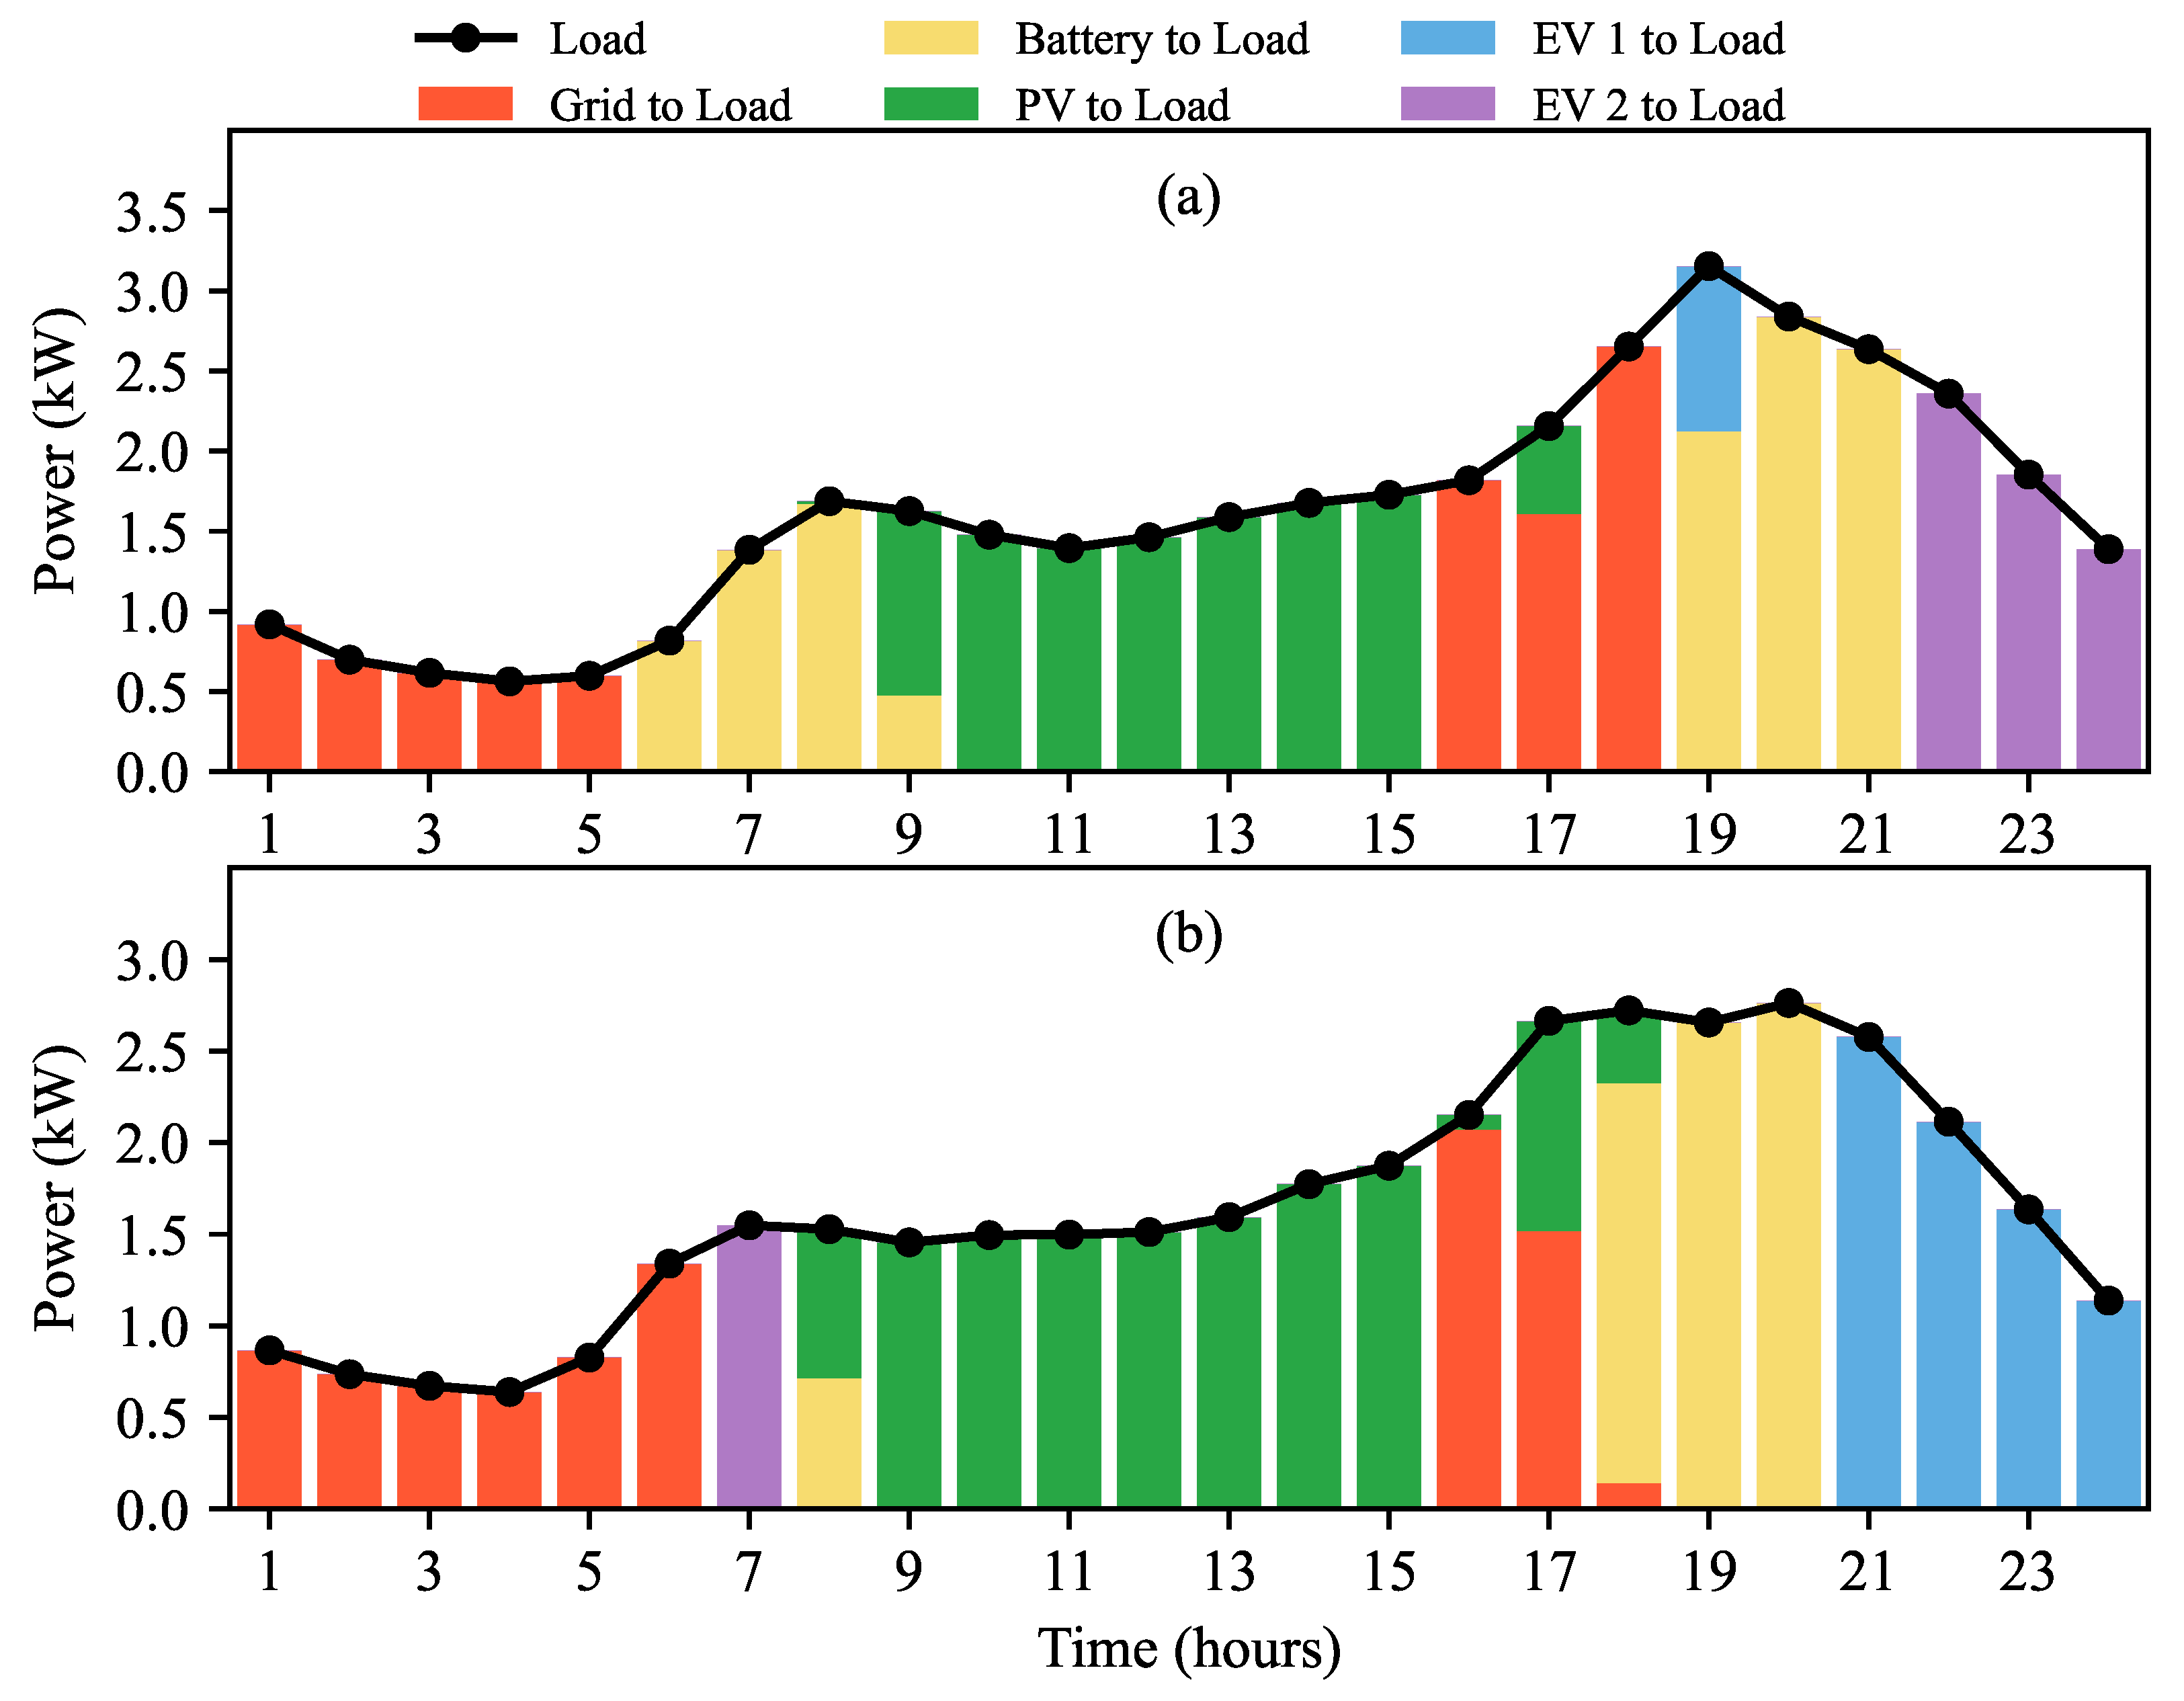
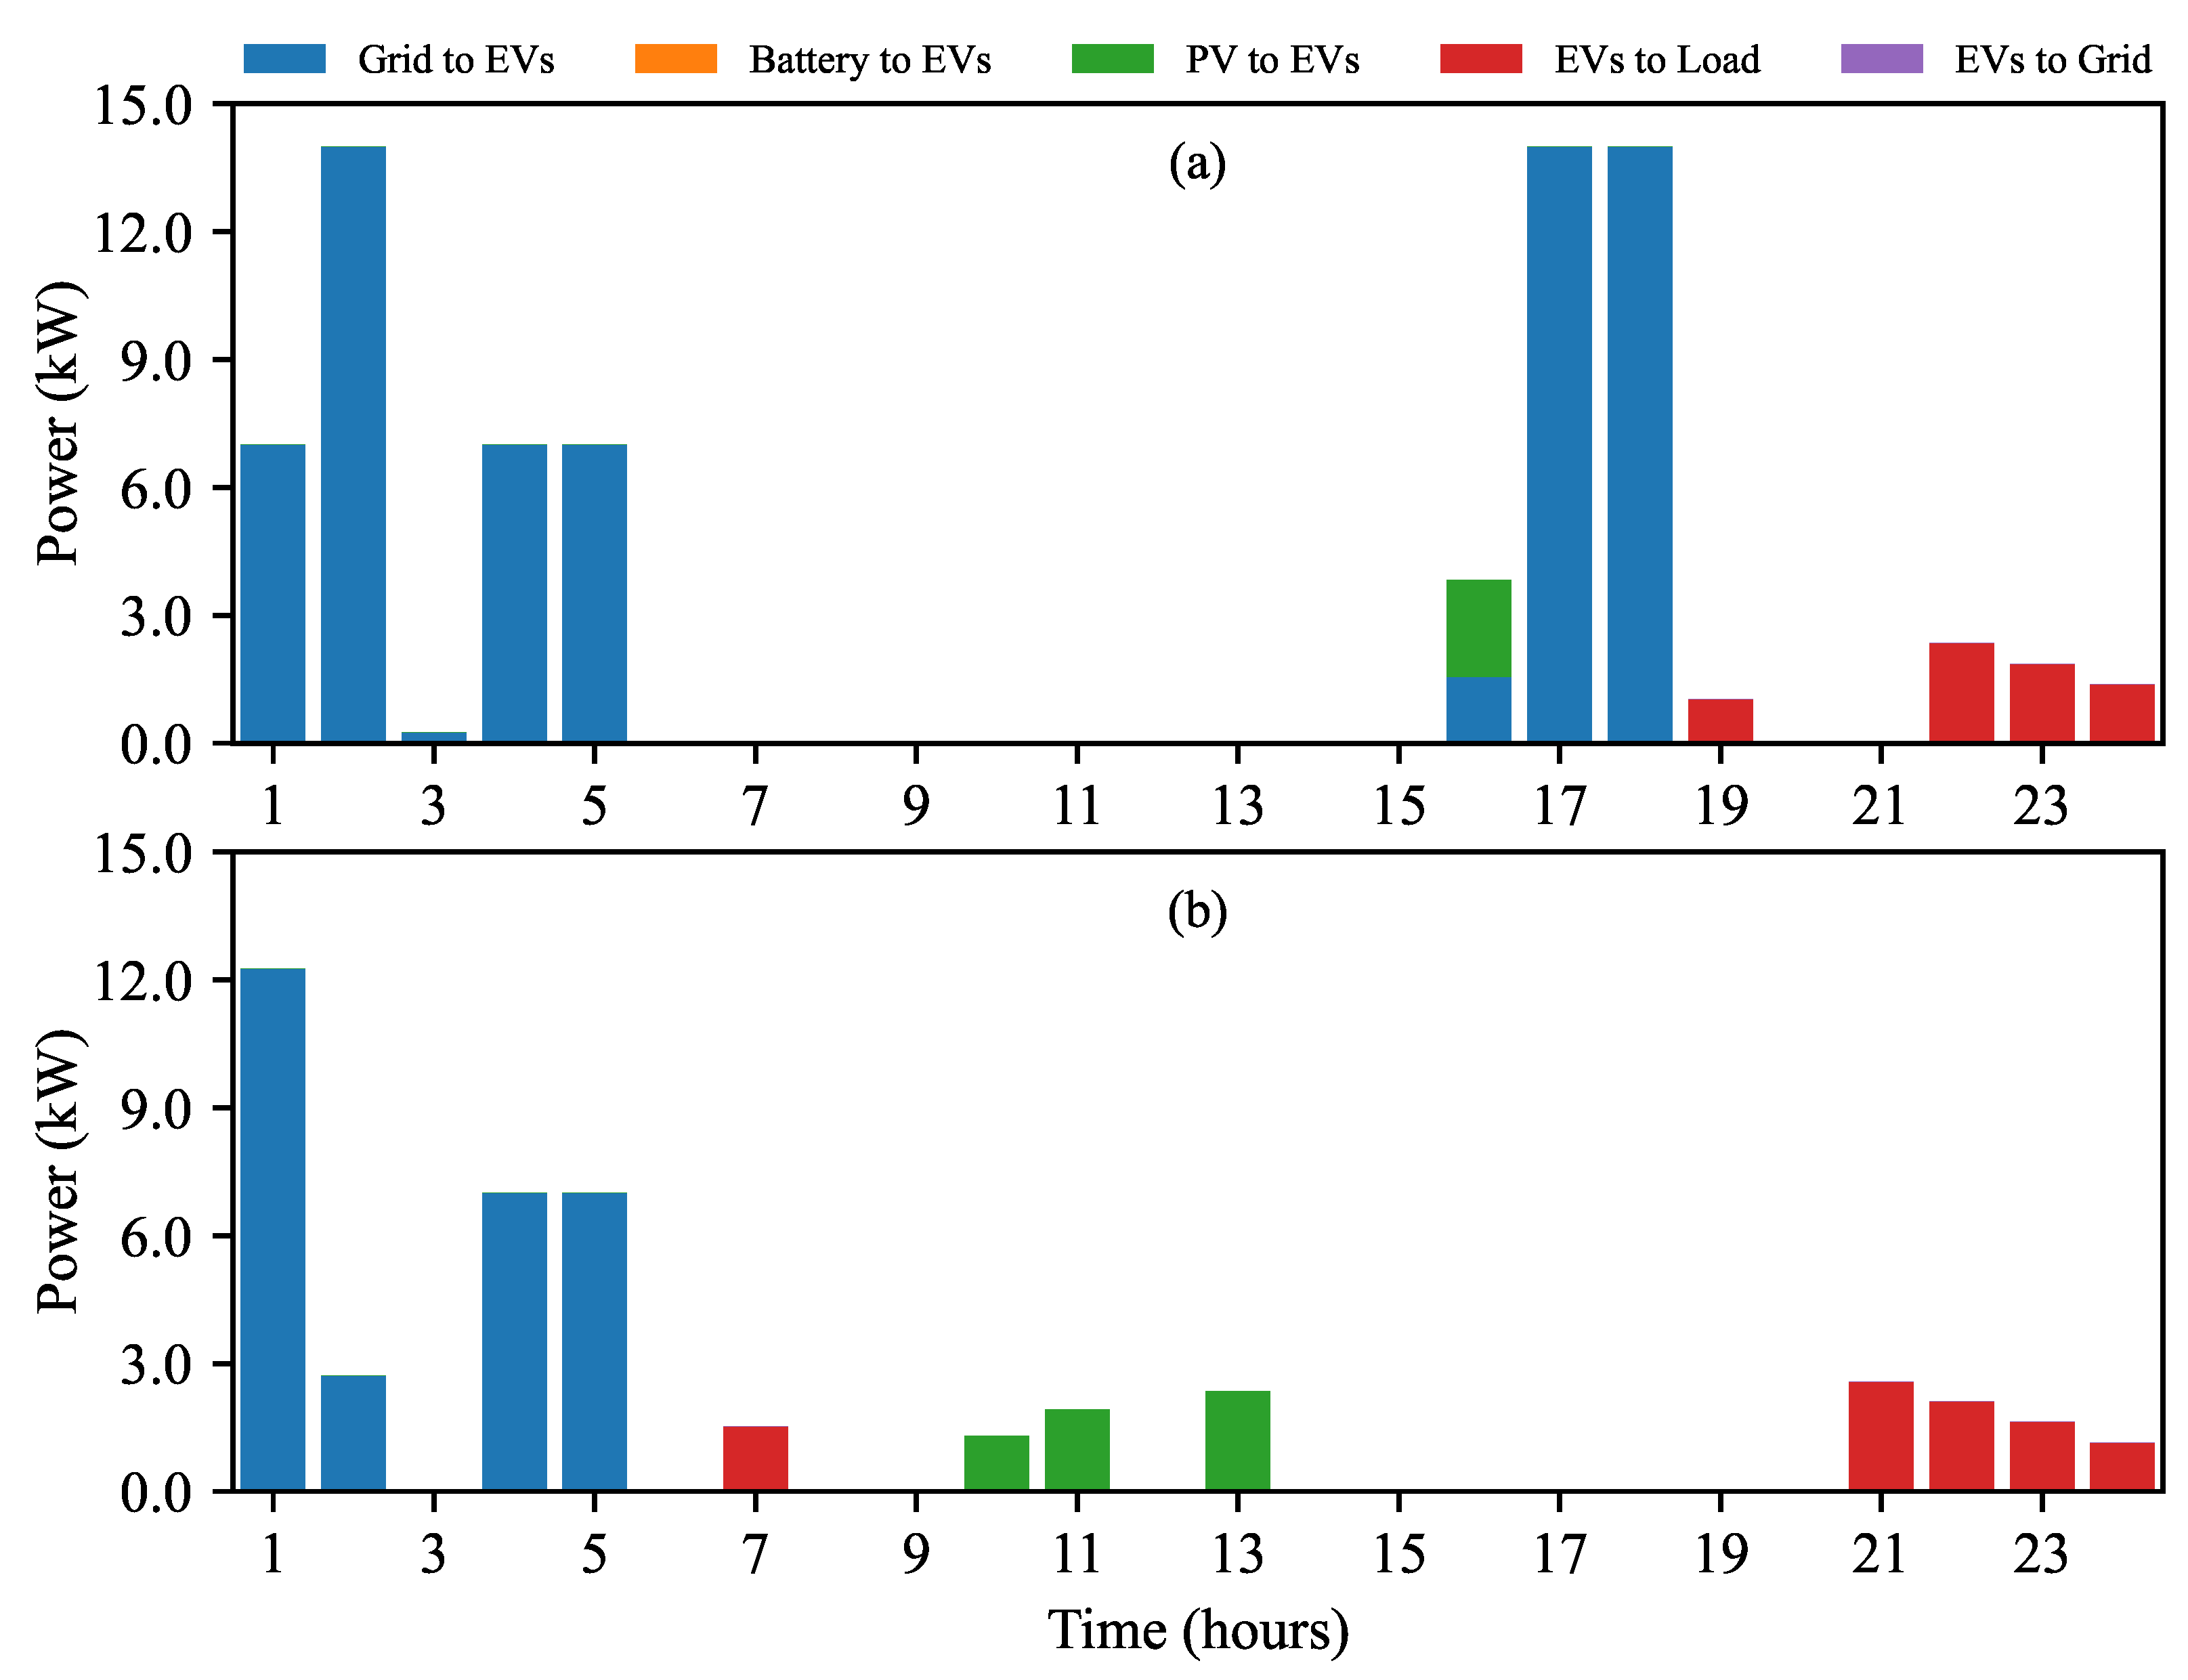
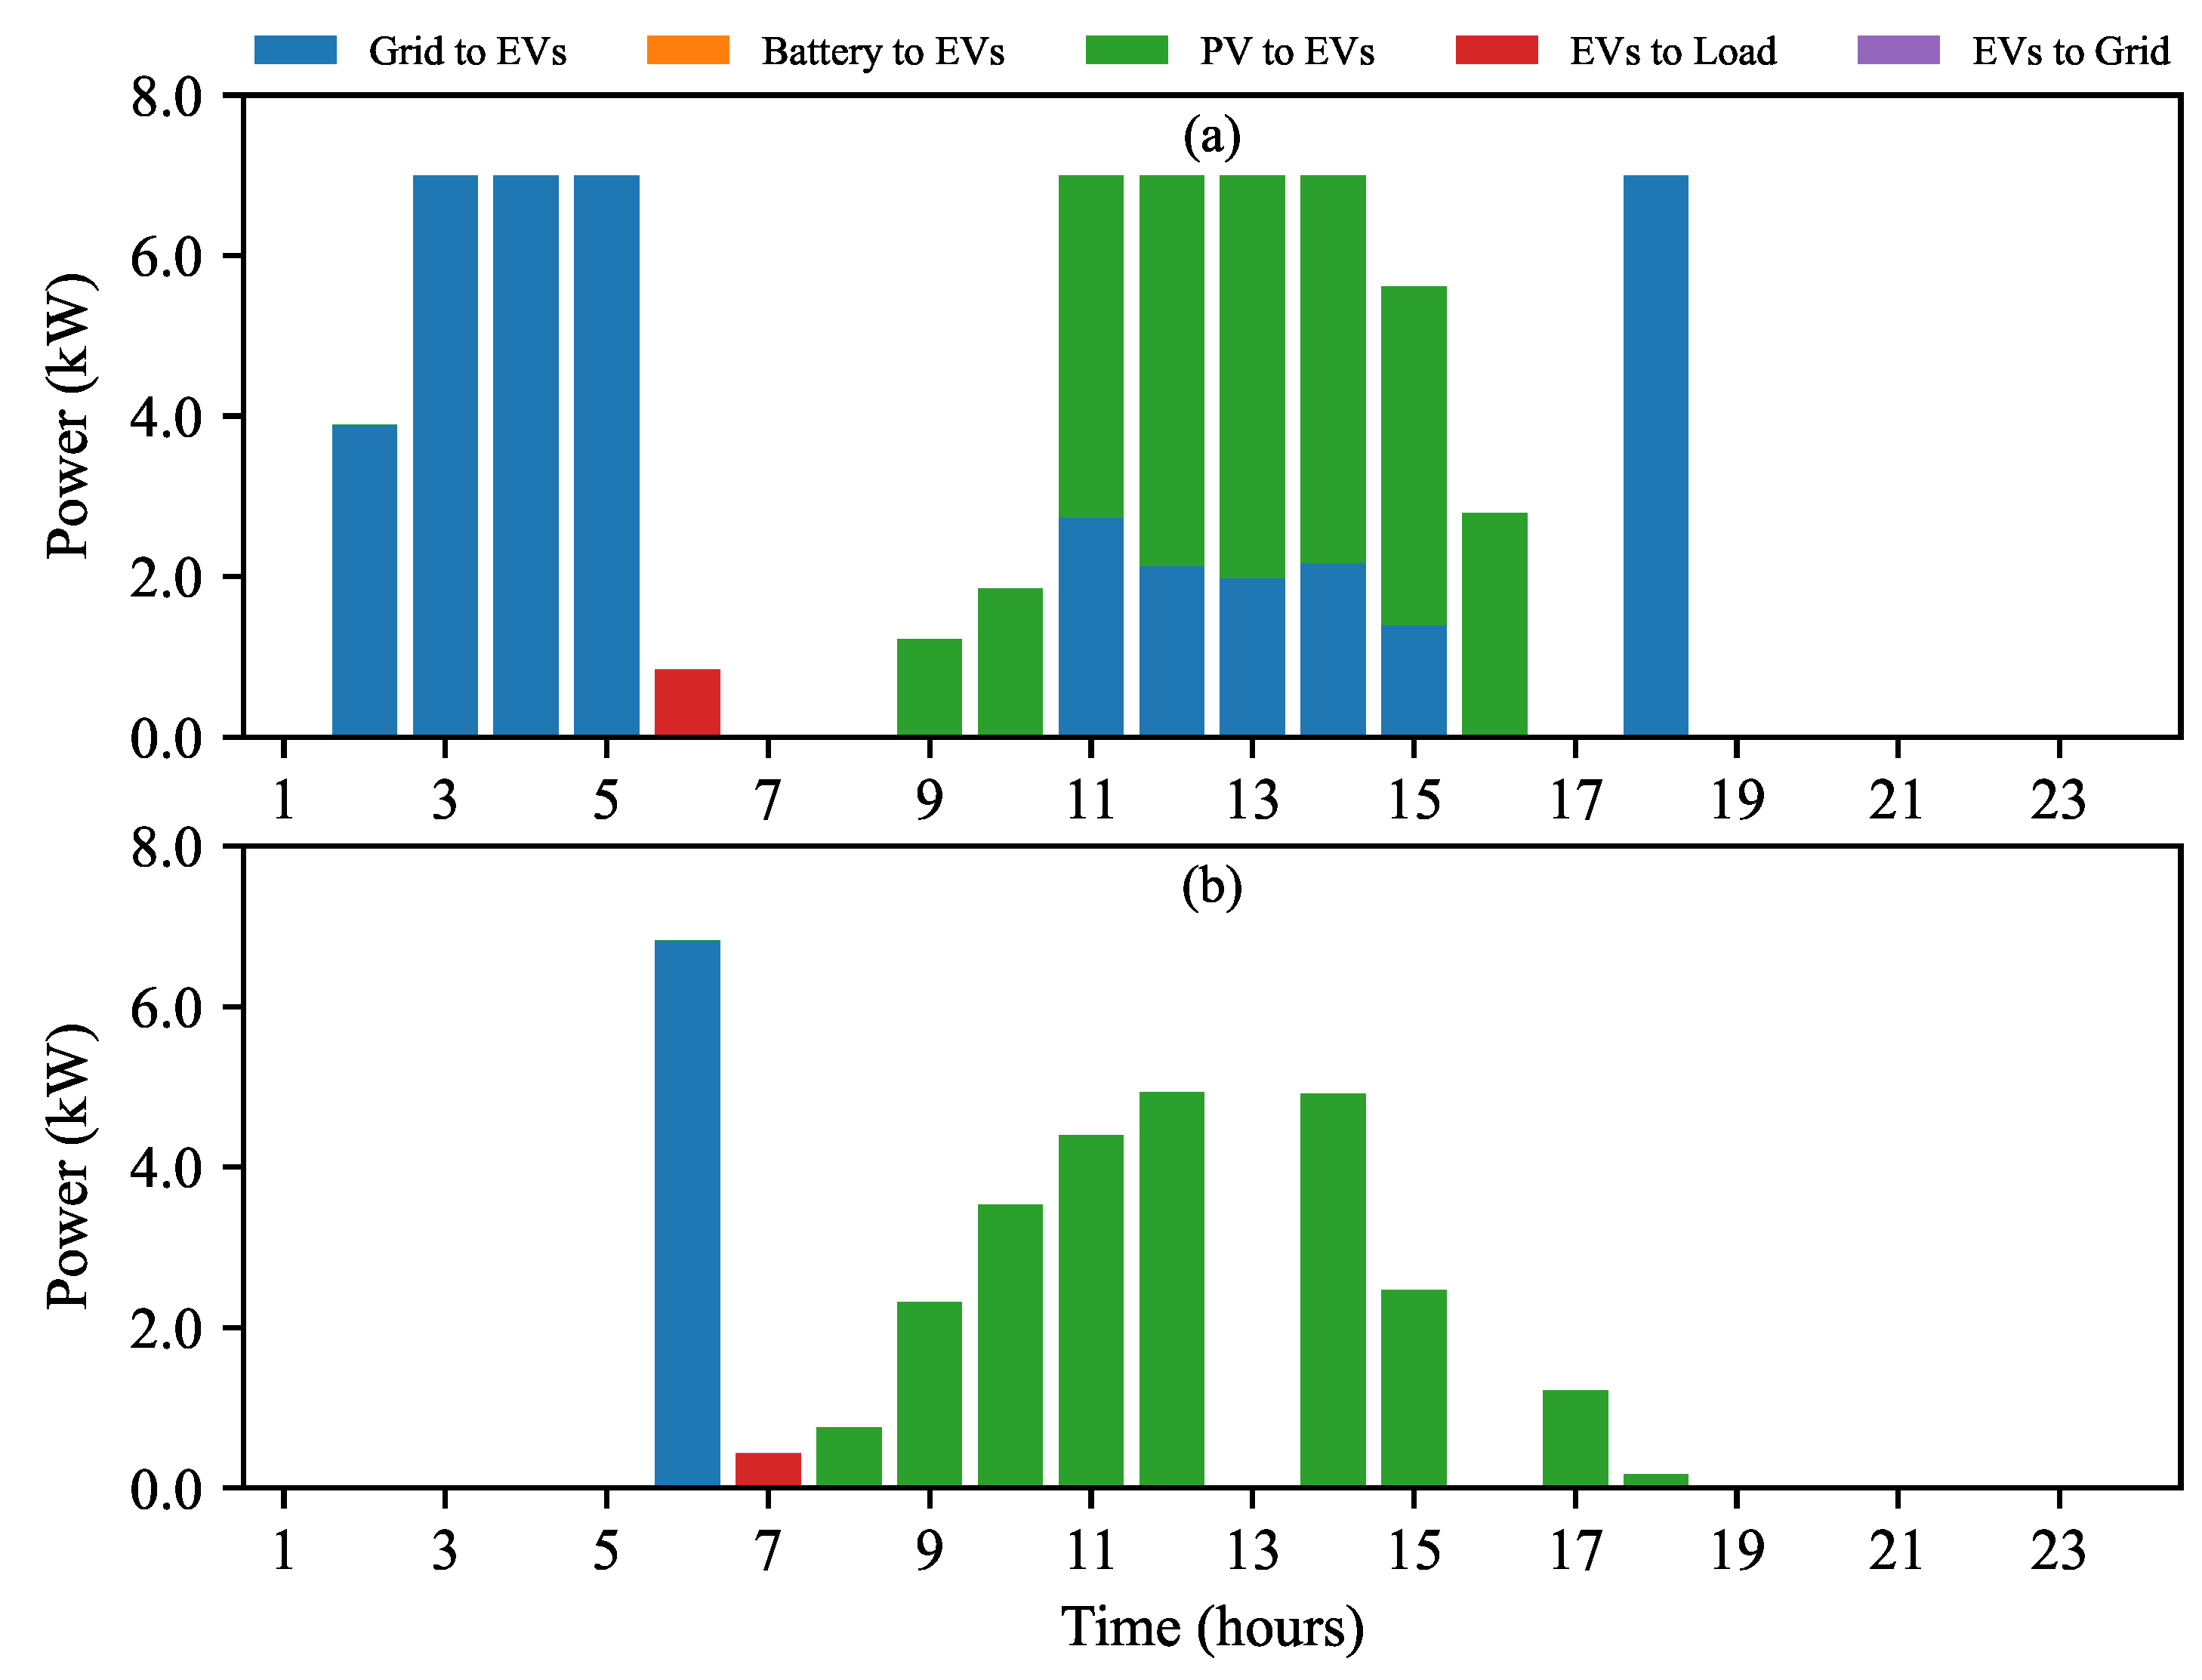
The load balances and EV power transactions for MG1 on the selected winter and off-season days are shown in Figure 16 and Figure 17, respectively. For both winter and off-season days, the load is primarily supported by PV generation from 10:00 A.M. to 3:00 P.M. The grid and BESS provide significant support during the early morning hours (1:00 A.M.–6:00 A.M.) and evening hours (6:00 P.M.–10:00 P.M.) when PV generation is minimal or unavailable. EVs also play a critical role in load support during the evening. On the winter day, EV2 discharges significantly between 7:00 P.M. and 9:00 P.M. (Figure 16a), while on the off-season day, EV1 provides substantial discharge between 8:00 P.M. and 11:00 P.M. (Figure 16b).
The load balances and EV power transactions for MG2 on the selected winter and off-season days are shown in Figure 18 and Figure 19, respectively. The load demand for MG2 is lower compared to MGs 1 and 3. In winter (Figure 18a), the BESS plays a dominant role in load balancing during the morning and night hours. PV generation contributes minimally due to reduced solar availability, particularly in winter. In the off-season (Figure 18b), PV generation increases and meets most of the load during the daytime, while the BESS provides consistent support during non-solar hours. EV power transactions show that the EVs charge from the grid during off-peak hours in winter (Figure 19a) and during super off-peak hours on the off-season day (Figure 19b).
Figure 20 and Figure 21 show the load balances and EV power transactions for MG3, respectively, on the selected winter and off-season days. MG3 demonstrates the greatest reliance on PV generation due to its higher capacity, while the grid and BESS provide support during the early morning and evening hours. EVs primarily charge from PV on the winter day (Figure 21a) and discharge to the load in the evening on the off-season day (Figure 21b).

4.1.2. Community-Based Operation and Game-Theoretic Method

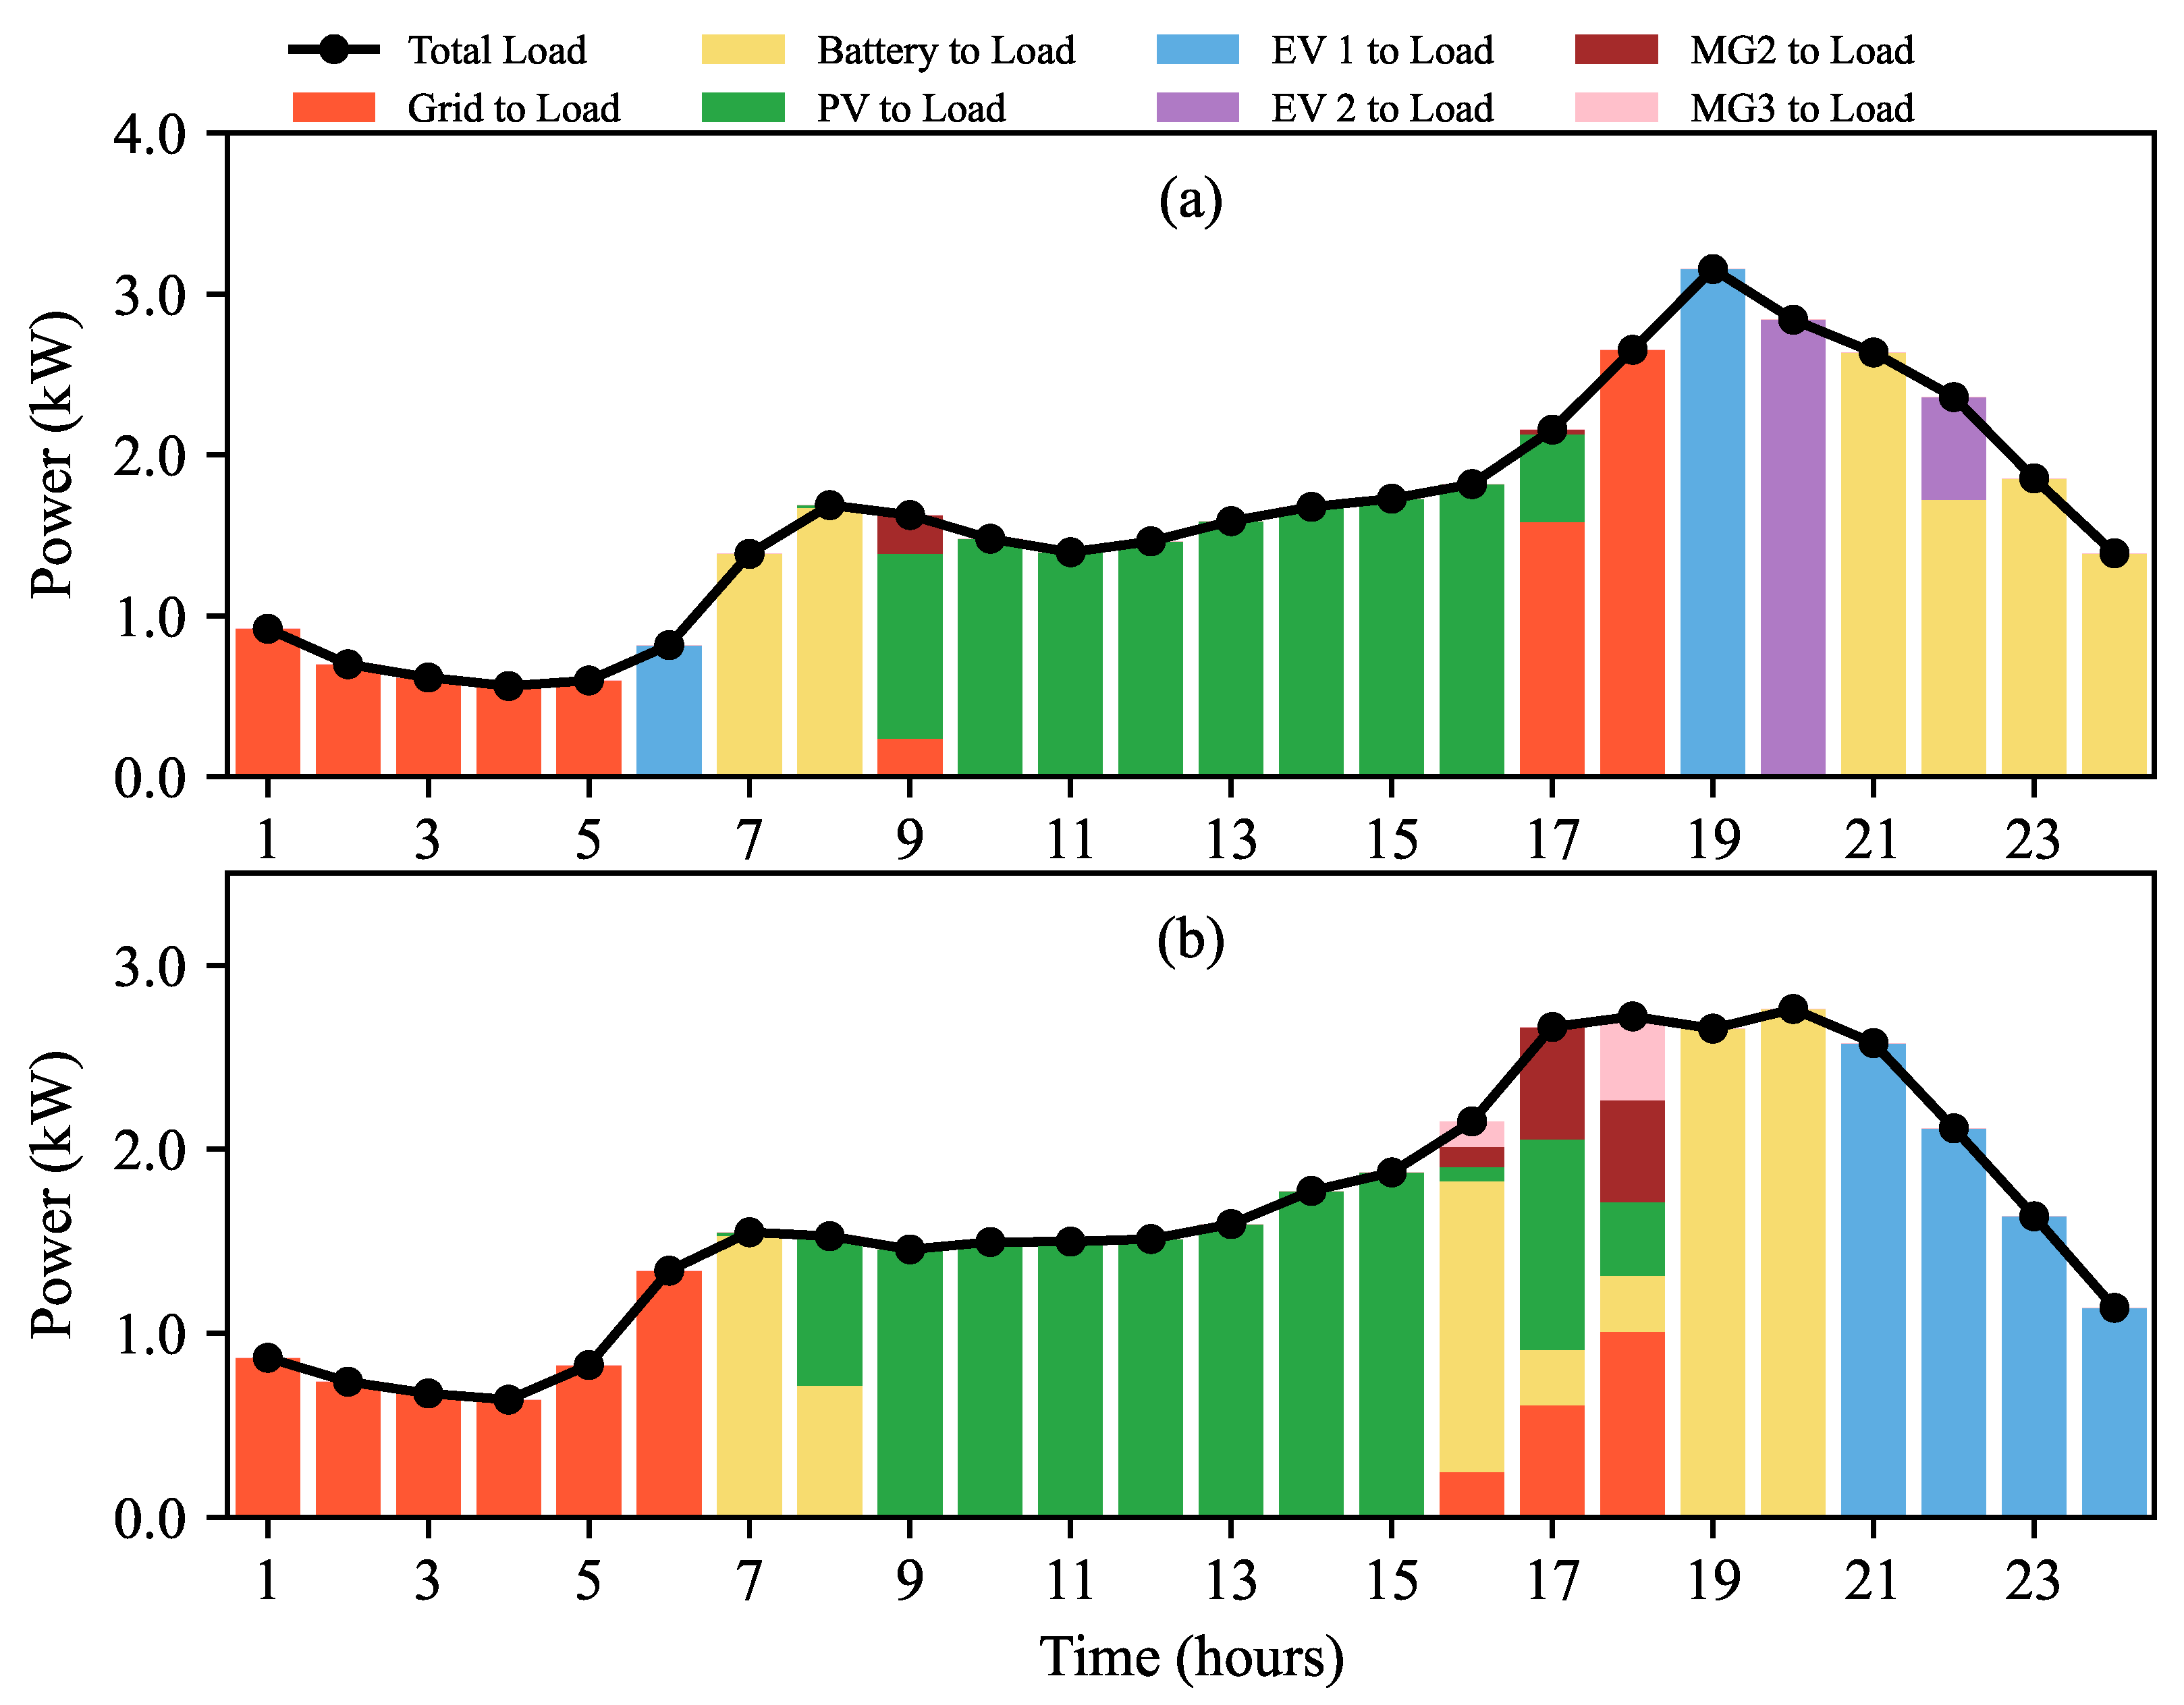
The load balances of MG1 and MG2 on the selected winter and off-season days are shown in Figure 22 and Figure 23, respectively. As observed in Figure 22a for the winter day, MG1 relies heavily on the grid and BESS during the periods from 1:00 A.M. to 6:00 A.M. and from 6:00 P.M. to 9:00 P.M., respectively. In contrast, for the off-season day (Figure 22b), PV generation covers a larger portion of the load from 10:00 A.M. to 4:00 P.M., while BESS and EV discharges manage evening peaks with supplementary power from MGs 2 and 3. Further, Figure 23a shows that MG2’s load is entirely supplied by PV, BESS, and EV discharges, unlike in the individual case, where grid support was necessary. The results for MG3 in the CBO model on the selected winter and off-season days are similar to those observed under IO. The optimized power flows obtained through cooperative GT align closely with those under CBO for the selected winter and off-season days.

4.1.3. Alternating Direction Method of Multipliers (ADMM)

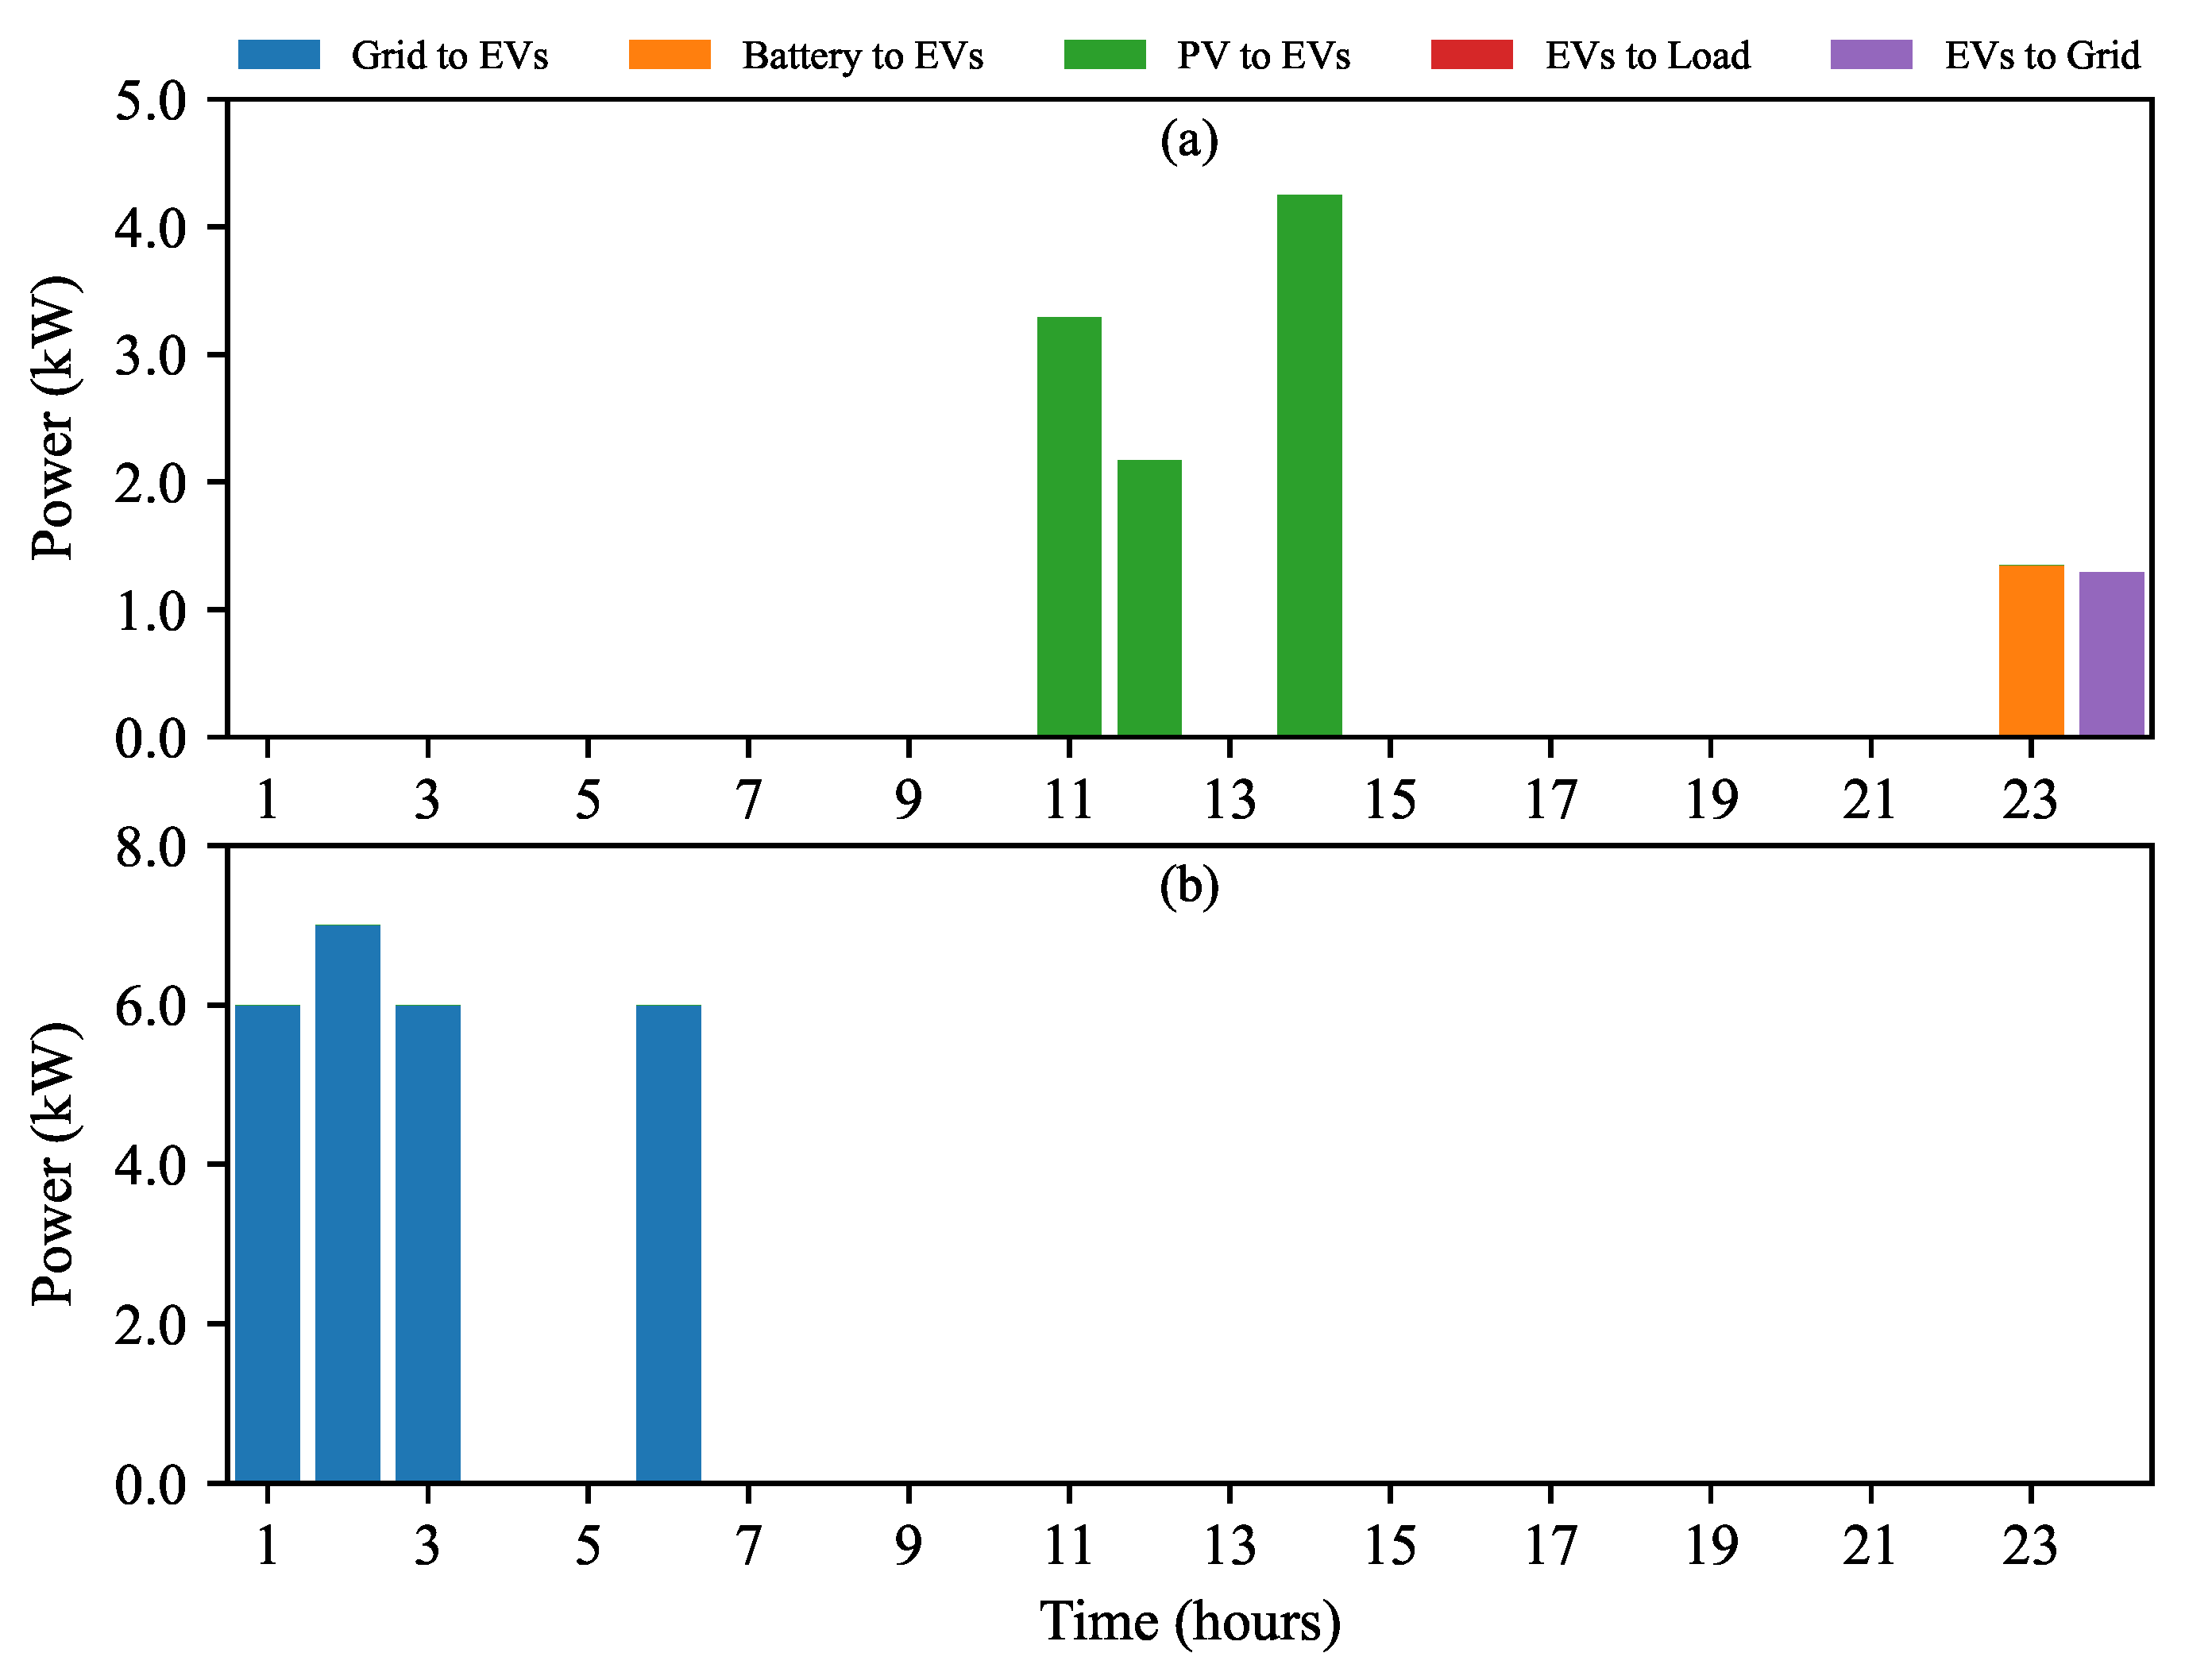
Figure 24 and Figure 25 show the load balancing and EV power transactions for MG3 on the selected winter and off-season days. Figure 24a shows that MG3 imports power from other MGs during the period from 5:00 P.M. to 9:00 P.M. on the winter day. In contrast, on the off-season day, higher PV production enables MG3 to meet its load independently without importing power, as shown in Figure 24b. Further, on the off-season day (Figure 25b), EVs charge only from the grid during parking hours, with no discharges observed.

4.2. Annual Cost Analysis

The detailed annual cost comparison for MGs 1, 2, and 3 in the IO approach is shown in Table 1. The table lists the costs of buying power from the grid, the revenue from selling power back to the grid, and the net costs (buying minus selling) for each MG. The net costs for MG1, MG2, and MG3 are USD 649.1, 567.4, and 829.3, respectively. These costs are relatively high since each MG relies on the grid for both buying and selling power, with no cooperation or power sharing between MGs within the MMG system. In comparison, the CBO approach significantly reduces the net costs for each MG, as shown in Table 2. MGs 1, 2, and 3 experience reductions in net costs to USD 603.7, 523.5, and 776.2, respectively. Specifically, MG1, MG2, and MG3 see reductions of 7%, 9.2%, and 6.4% in net costs compared to the individual approach. These reductions demonstrate the benefits of community-based coordination, where the collective operation of power flows between MGs reduces grid dependence and maximizes the use of local resources. However, CBO requires complete information sharing with the MO, which might not be feasible in certain practical scenarios.
The cooperative GT approach builds upon the community-based strategy by redistributing the savings among MGs using the Shapley value. While the total cost of the MMG system remains the same as in the community-based case (USD 562.2), the costs for individual MGs are redistributed based on their contributions to the system. MG1, with a higher contribution to the cooperative framework, benefits the most, reducing its cost to USD 562.2, a 13.4% reduction compared to the individual case. MG2 sees its cost reduced to USD 516.8, reflecting an 8.9% decrease, while MG3’s cost is slightly reduced to USD 824.4, a modest 0.6% improvement. This redistribution ensures fairness and incentivizes participation by rewarding MGs based on their relative contributions. The annual net costs for MGs 1, 2, and 3 are USD 603.8, 529.8, and 777.6, respectively, when using ADMM. These costs are nearly identical to those achieved through CBO, with differences of less than 1% for MGs 1 and 3, and 1.2% for MG2. The net costs achieved via ADMM are significantly lower than those in the IO approach, with reductions of 7%, 6.6%, and 6.2% for MGs 1, 2, and 3, respectively.
Unlike CBO, ADMM does not require the sharing of local information with the MO. In scenarios where data privacy is critical, ADMM is a suitable option that offers an optimal balance between data privacy and cost savings. On the other hand, based on the results, the combination of cooperative GT and CBO is the most effective strategy for systems that prioritize fairness and incentivize participation. Table 3 presents a summary of the annual net costs of each MG in different strategies. The annual costs for the base case with no optimization in which there is no solar PV or BESS and the MGs rely on the grid only to purchase electricity at TOU rates are also shown in Table 3. The trade-offs between cost, information sharing, and implementation complexity highlight the importance of selecting an approach that aligns with the system’s operational priorities and constraints.
When comparing the overall costs of the MMG system across the different strategies, CBO and ADMM demonstrate notable cost savings compared to the base case. The base case results in a total system cost of USD 3895.3. By putting CBO into practice, the entire cost of the MMG system is reduced to USD 1903.4 (a 51.1% reduction). Similarly, ADMM achieves a slightly higher total cost of USD 1911.2, a 50.9% reduction. IO reduces the system cost to USD 2045.8, achieving a reduction of 47.5% relative to the base case but falling short of the savings achieved through CBO and ADMM. The trade-offs among the operational strategies are highlighted in these results. Although CBO is more cost-effective than ADMM, it requires complete data sharing across MGs. This complete information sharing among MGs might not be feasible in situations where privacy regulations are strict. However, ADMM provides a balance between privacy protection and cost reduction. Therefore, ADMM is a viable choice for MMG systems where data security is a priority.

5. Discussion

The seasonal analysis reveals significant variations in the operational patterns and energy dynamics of the MGs, particularly as a result of the seasonal changes in solar insolation. In winter, lower PV generation results in greater dependence on the grid and BESS, especially during the morning and evening hours. In contrast, off-season days see more balanced operations, with PV generation meeting most of the demand during the day. The impact of these seasonal differences on energy management is critical to optimizing both load balance and integration of RE within the system.
One of the main findings of this study is the significant role that CBO and cooperative GT approaches play in reducing the overall grid dependence. These strategies allow for optimized power flows and contribute to substantial cost reductions, especially when compared to the IO approach. MGs that share power within a community framework achieve notable reductions in net costs, with MG1, MG2, and MG3 experiencing reductions of 7%, 9.2%, and 6.4%, respectively. Additionally, the cooperative GT approach ensures fair cost redistribution. This can incentivize the active participation of each MG and maximize the system-wide benefits.
The results of the presented study are consistent with the existing literature on energy management systems in MG, which emphasizes the benefits of coordination and optimization between multiple entities. Previous studies have shown that coordinated operation can reduce the dependence on centralized energy sources and lower operational costs [14,47]. Our findings reinforce this notion, showing that both CBO and cooperative GT strategies lead to cost reductions and improved energy utilization. Furthermore, the comparison of ADMM with CBO highlights the trade-off between privacy and cost efficiency, a topic also explored in recent studies on decentralized energy systems [48].
The employed strategies, particularly CBO, cooperative GT, and ADMM, significantly influence the outcomes of the analysis. CBO’s reliance on complete information sharing among MGs can result in more efficient cost reductions and better coordination. However, the practical feasibility of this type of information sharing is limited in many real-world scenarios, where data privacy and security are critical concerns. In contrast, the ADMM method provides a viable alternative for systems where privacy is a priority while still achieving results nearly identical to CBO. These findings underscore the importance of selecting the appropriate methodology based on the specific requirements of the system, such as privacy concerns and the need for fairness in cost distribution.
An unexpected outcome of this study is the relatively minor differences in cost reductions between the CBO and ADMM approaches. Despite the differences in their operational principles (CBO requires full information sharing, while ADMM is more decentralized), the net costs achieved by both methods are very close, particularly for MGs 1 and 3. This result suggests that the operational efficiencies gained through decentralized methods like ADMM can yield significant benefits without major trade-offs in cost performance.

6. Conclusions and Future Work

This study assesses several methods for optimizing a multi-microgrid (MMG) system integrated with electric vehicles (EVs). The adopted strategies include individual operation (IO), community-based operation (CBO), the cooperative game-theoretic (GT) method, and the alternating direction method of multipliers (ADMM). Each strategy is evaluated for its ability to achieve a balance between privacy, system coordination, and cost-effectiveness. Higher annual net costs are obtained in the IO due to the absence of power sharing between MGs. CBO allows for coordinated power sharing, reducing costs for MG1, MG2, and MG3 by 7.0%, 9.2%, and 6.4%, respectively. However, its reliance on data sharing with a central entity raises privacy concerns. Fairness in cost distribution is further improved using cooperative GT, which reduces the net annual costs of MG1 and MG2 by 13.4% and 8.9%, respectively, compared to IO. This fair allocation incentivizes participation while maintaining a 6.9% reduction in the total cost of the MMG system compared to the IO. ADMM achieves net cost savings of 6–7% for all MGs, comparable to those obtained using CBO, while preserving the autonomy of each MG within the MMG system. The results of this study highlight that cooperative GT is the optimal approach when fairness and cooperation are prioritized, while ADMM provides a viable alternative for MMG systems that focus on data privacy and individual decision-making processes.
Although the study provides valuable insights into the cost-saving potential of various operational strategies, it does have limitations. First, the analysis assumes that the PV generation, load profiles, and pricing structures remain constant over seasons, which may not fully reflect the variability observed in real-world systems. Furthermore, the simulation does not account for potential externalities, such as grid outages or fluctuating energy prices, which could affect the results. Moreover, the practicality of implementing CBO and GT strategies in real-world systems could be constrained by technical and economic factors such as the need for sophisticated control systems and the administrative overhead associated with information sharing. Future studies could explore the impact of these external factors and investigate the scalability of these approaches in larger and more complex MMG systems. Furthermore, as the MMG system scales, the iterative nature of ADMM can present challenges related to the increased computational time to converge. For CBO and GT, further research is required to develop effective coordination mechanisms to manage the system centrally and make these strategies practical for real-world applications.

Author Contributions

Conceptualization, S.M.A. and P.M.; methodology, S.M.A. and P.M.; software, S.M.A.; validation, S.M.A.; investigation, S.M.A.; resources, P.M.; writing—original draft preparation, S.M.A.; writing—review and editing, P.M.; supervision, P.M.; project administration, P.M.; funding acquisition, P.M. All authors have read and agreed to the published version of the manuscript.

Funding

This research was supported by the Natural Sciences and Engineering Research Council (NSERC) of Canada grant number ALLRP 549804-19, by the Government of Alberta Major Innovation Fund project Renewable and Clean Energy Systems (RCES), and by Alberta Electric System Operator (AESO), AltaLink, ATCO Electric, ENMAX, EPCOR Inc., and FortisAlberta.

Data Availability Statement

The data used in this study are publicly available from the Open Energy Data Initiative (OEDI), https://data.openei.org/submissions/4520, accessed on 1 September 2023.

Conflicts of Interest

The authors declare no conflicts of interest.

Abbreviations

ADMMAlternating Direction Method of Multipliers
BESSBattery Energy Storage System
CBOCommunity-Based Operation
EVElectric Vehicle
GTGame-Theoretic
IOIndividual Operation
MASMulti-Agent System
MGMicrogrid
MMGMulti-Microgrid
MOMarket Operator
NRELNational Renewable Energy Laboratory
NSERCNatural Sciences and Engineering Research Council
OEDIOpen Energy Data Initiative
PVPhotovoltaic
RERenewable Energy
SOCState-of-Charge
TOUTime-of-Use
V2GVehicle-to-Grid
V2LVehicle-to-Load
VESSVirtual Energy Storage Systems

References

  1. Zou, H.; Mao, S.; Wang, Y.; Zhang, F.; Chen, X.; Cheng, L. A survey of energy management in interconnected multi-microgrids. IEEE Access 2019, 7, 72158–72169. [Google Scholar] [CrossRef]
  2. Rehman, M.A.; Numan, M.; Tahir, H.; Rahman, U.; Khan, M.W.; Iftikhar, M.Z. A comprehensive overview of vehicle to everything (V2X) technology for sustainable EV adoption. J. Energy Storage 2023, 74, 109304. [Google Scholar] [CrossRef]
  3. Mojumder, M.R.H.; Ahmed Antara, F.; Hasanuzzaman, M.; Alamri, B.; Alsharef, M. Electric vehicle-to-grid (V2G) technologies: Impact on the power grid and battery. Sustainability 2022, 14, 13856. [Google Scholar] [CrossRef]
  4. Xing, X.; Jia, L. Energy management in microgrid and multi-microgrid. IET Renew. Power Gener. 2023, 18, 3480–3508. [Google Scholar] [CrossRef]
  5. Tan, B.; Chen, S.; Liang, Z.; Zheng, X.; Zhu, Y.; Chen, H. An iteration-free hierarchical method for the energy management of multiple-microgrid systems with renewable energy sources and electric vehicles. Appl. Energy 2024, 356, 122380. [Google Scholar]
  6. Nawaz, A.; Zhou, M.; Wu, J.; Long, C. A comprehensive review on energy management, demand response, and coordination schemes utilization in multi-microgrids network. Appl. Energy 2022, 323, 119596. [Google Scholar]
  7. Mansour-Saatloo, A.; Pezhmani, Y.; Mirzaei, M.A.; Mohammadi-Ivatloo, B.; Zare, K.; Marzband, M.; Anvari-Moghaddam, A. Robust decentralized optimization of Multi-Microgrids integrated with Power-to-X technologies. Appl. Energy 2021, 304, 117635. [Google Scholar]
  8. Masrur, H.; Shafie-Khah, M.; Hossain, M.J.; Senjyu, T. Multi-energy microgrids incorporating EV integration: Optimal design and resilient operation. IEEE Trans. Smart Grid 2022, 13, 3508–3518. [Google Scholar]
  9. Billah, M.; Yousif, M.; Numan, M.; Salam, I.U.; Kazmi, S.A.A.; Alghamdi, T.A. Decentralized smart energy management in hybrid microgrids: Evaluating operational modes, resources optimization, and environmental impacts. IEEE Access 2023, 11, 143530–143548. [Google Scholar]
  10. Shamshirband, M.; Salehi, J.; Gazijahani, F.S. Decentralized trading of plug-in electric vehicle aggregation agents for optimal energy management of smart renewable penetrated microgrids with the aim of CO2 emission reduction. J. Clean. Prod. 2018, 200, 622–640. [Google Scholar] [CrossRef]
  11. Shahgholian, G. A brief review on microgrids: Operation, applications, modeling, and control. Int. Trans. Electr. Energy Syst. 2021, 31, e12885. [Google Scholar]
  12. Liu, C.; Li, Z. Comparison of centralized and peer-to-peer decentralized market designs for community markets. IEEE Trans. Ind. Appl. 2021, 58, 67–77. [Google Scholar] [CrossRef]
  13. Nikkhah, S.; Allahham, A.; Royapoor, M.; Bialek, J.W.; Giaouris, D. A community-based building-to-building strategy for multi-objective energy management of residential microgrids. In Proceedings of the 2021 12th International Renewable Engineering Conference (IREC), Amman, Jordan, 14–15 April 2021; IEEE: Piscataway, NJ, USA, 2021; pp. 1–6. [Google Scholar]
  14. Malik, M.M.; Kazmi, S.A.A.; Asim, H.W.; Ahmed, A.B.; Shin, D.R. An intelligent multi-stage optimization approach for community based micro-grid within multi-microgrid paradigm. IEEE Access 2020, 8, 177228–177244. [Google Scholar]
  15. Li, J.; Liu, Y.; Wu, L. Optimal operation for community-based multi-party microgrid in grid-connected and islanded modes. IEEE Trans. Smart Grid 2016, 9, 756–765. [Google Scholar] [CrossRef]
  16. Olivares, D.E.; Cañizares, C.A.; Kazerani, M. A centralized energy management system for isolated microgrids. IEEE Trans. Smart Grid 2014, 5, 1864–1875. [Google Scholar] [CrossRef]
  17. Javadi, M.; Marzband, M.; Funsho Akorede, M.; Godina, R.; Saad Al-Sumaiti, A.; Pouresmaeil, E. A centralized smart decision-making hierarchical interactive architecture for multiple home microgrids in retail electricity market. Energies 2018, 11, 3144. [Google Scholar] [CrossRef]
  18. Ahsan, S.M.; Iqbal, M.A.; Hussain, A.; Musilek, P. Adaptive Pricing-Based Optimized Resource Utilization in Networked Microgrids. IEEE Access 2025, 13, 34483–34495. [Google Scholar] [CrossRef]
  19. Ahsan, S.M.; Khan, H.A.; Hassan, N.U.; Arif, S.M.; Lie, T.T. Optimized power dispatch for solar photovoltaic-storage system with multiple buildings in bilateral contracts. Appl. Energy 2020, 273, 115253. [Google Scholar]
  20. Ahsan, S.M.; Khan, H.A.; Naveed-ul-Hassan. Optimized power dispatch for smart building (s) and electric vehicles with V2X operation. Energy Rep. 2022, 8, 10849–10867. [Google Scholar]
  21. Ahsan, S.M.; Khan, H.A.; Sohaib, S.; Hashmi, A.M. Optimized Power Dispatch for Smart Building and Electric Vehicles with V2V, V2B and V2G Operations. Energies 2023, 16, 4884. [Google Scholar] [CrossRef]
  22. Kumar, A.; Jain, P.; Sharma, S. Transactive energy management for microgrids considering techno-economic perspectives of utility—A review. Int. J. Energy Res. 2022, 46, 16127–16149. [Google Scholar]
  23. Barani, M.; Vadlamudi, V.V.; Farzin, H. Impact of cyber failures on operation and adequacy of Multi-Microgrid distribution systems. Appl. Energy 2023, 348, 121437. [Google Scholar] [CrossRef]
  24. Saha, D.; Bazmohammadi, N.; Vasquez, J.C.; Guerrero, J.M. Multiple microgrids: A review of architectures and operation and control strategies. Energies 2023, 16, 600. [Google Scholar] [CrossRef]
  25. Prete, C.L.; Hobbs, B.F. A cooperative game theoretic analysis of incentives for microgrids in regulated electricity markets. Appl. Energy 2016, 169, 524–541. [Google Scholar]
  26. Karimi, H.; Jadid, S. Modeling of transactive energy in multi-microgrid systems by hybrid of competitive-cooperative games. Electr. Power Syst. Res. 2021, 201, 107546. [Google Scholar]
  27. Li, C.; Kang, Z.; Yu, H.; Wang, H.; Li, K. Research on Energy Optimization Method of Multi-microgrid System Based on the Cooperative Game Theory. J. Electr. Eng. Technol. 2024, 19, 2953–2962. [Google Scholar]
  28. Chen, W.; Wang, J.; Yu, G.; Chen, J.; Hu, Y. Research on day-ahead transactions between multi-microgrid based on cooperative game model. Appl. Energy 2022, 316, 119106. [Google Scholar]
  29. Modarresi, J. Coalitional game theory approach for multi-microgrid energy systems considering service charge and power losses. Sustain. Energy Grids Netw. 2022, 31, 100720. [Google Scholar]
  30. Movahednia, M.; Karimi, H.; Jadid, S. A cooperative game approach for energy management of interconnected microgrids. Electr. Power Syst. Res. 2022, 213, 108772. [Google Scholar]
  31. Islam, M.M.; Yu, T.; La Scala, M.; Wang, J.; Chengdong, L. Optimizing Cooperative Alliance Transactive Energy Framework for PV-based Multi-Microgrids Using Scheduling and Cooperative Game Theory. In Proceedings of the 2024 4th International Conference on Electrical Engineering and Informatics (ICon EEI), Pekanbaru, Indonesia, 16–17 October 2024; IEEE: Piscataway, NJ, USA, 2024; pp. 96–101. [Google Scholar]
  32. Zhong, X.; Zhong, W.; Liu, Y.; Yang, C.; Xie, S. Coalition game approach for electricity sharing in multi-energy multi-microgrid network. In Proceedings of the 2021 IEEE International Smart Cities Conference (ISC2), Virtual, 7–10 September 2021; IEEE: Piscataway, NJ, USA, 2021; pp. 1–6. [Google Scholar]
  33. Gao, H.; Liu, J.; Wang, L.; Wei, Z. Decentralized energy management for networked microgrids in future distribution systems. IEEE Trans. Power Syst. 2017, 33, 3599–3610. [Google Scholar]
  34. Liu, G.; Ollis, T.B.; Ferrari, M.F.; Sundararajan, A.; Chen, Y. Distributed Energy Management for Networked Microgrids Embedded Modern Distribution System Using ADMM Algorithm. IEEE Access 2023, 11, 102589–102604. [Google Scholar] [CrossRef]
  35. Mansouri, S.A.; Nematbakhsh, E.; Ramos, A.; Tostado-Véliz, M.; Aguado, J.A.; Aghaei, J. A Robust ADMM-Enabled Optimization Framework for Decentralized Coordination of Microgrids. IEEE Trans. Ind. Inform. 2024, 21, 1479–1488. [Google Scholar] [CrossRef]
  36. Rajaei, A.; Fattaheian-Dehkordi, S.; Fotuhi-Firuzabad, M.; Moeini-Aghtaie, M. Decentralized transactive energy management of multi-microgrid distribution systems based on ADMM. Int. J. Electr. Power Energy Syst. 2021, 132, 107126. [Google Scholar] [CrossRef]
  37. Li, Q.; Ge, Z.; Zhang, R.; Wang, C.; Zhang, Y. Research on the Economic Scheduling of Multi-Distributed Power Sources Based on the Super-Node Cooperative ADMM Algorithm. In Artificial Intelligence Technologies and Applications; IOS Press: Amsterdam, The Netherlands, 2024; pp. 629–636. [Google Scholar]
  38. Suh, J.; Yoon, S.G. Profit-sharing rule for networked microgrids based on Myerson value in cooperative game. IEEE Access 2020, 9, 5585–5597. [Google Scholar] [CrossRef]
  39. Sanjab, A.; Le Cadre, H.; Mou, Y. TSO-DSOs stable cost allocation for the joint procurement of flexibility: A cooperative game approach. IEEE Trans. Smart Grid 2022, 13, 4449–4464. [Google Scholar] [CrossRef]
  40. Zhao, D.; Zhang, C.; Cao, X.; Peng, C.; Sun, B.; Li, K.; Li, Y. Differential privacy energy management for islanded microgrids with distributed consensus-based ADMM algorithm. IEEE Trans. Control Syst. Technol. 2022, 31, 1018–1031. [Google Scholar] [CrossRef]
  41. National Renewable Energy Laboratory (NREL). Open Energy Data Initiative (OEDI). Available online: https://data.openei.org/ (accessed on 1 September 2023).
  42. Duke Energy. Time-of-Use Rate. Available online: https://www.duke-energy.com/home/billing/time-of-use (accessed on 1 November 2024).
  43. National Renewable Energy Laboratory (NREL). PVWatts® Calculator. Available online: https://pvwatts.nrel.gov/ (accessed on 1 November 2024).
  44. Hussain, A.; Musilek, P. Reliability-as-a-Service usage of electric vehicles: Suitability analysis for different types of buildings. Energies 2022, 15, 665. [Google Scholar] [CrossRef]
  45. Khan, S.; Alam, M.S.; Asghar, M.J.; Khan, M.A.; Abbas, A. Recent development in level 2 charging system for xEV: A review. In Proceedings of the 2018 International Conference on Computational and Characterization Techniques in Engineering & Sciences (CCTES), Lucknow, India, 14–15 September 2018; IEEE: Piscataway, NJ, USA, 2018; pp. 83–88. [Google Scholar]
  46. Ahsan, S.M.; Khan, H.A. Performance comparison of CdTe thin film modules with c-Si modules under low irradiance. IET Renew. Power Gener. 2019, 13, 1920–1926. [Google Scholar] [CrossRef]
  47. Javanmard, B.; Tabrizian, M.; Ansarian, M.; Ahmarinejad, A. Energy management of multi-microgrids based on game theory approach in the presence of demand response programs, energy storage systems and renewable energy resources. J. Energy Storage 2021, 42, 102971. [Google Scholar] [CrossRef]
  48. Aitzhan, N.Z.; Svetinovic, D. Security and Privacy in Decentralized Energy Trading Through Multi-Signatures, Blockchain and Anonymous Messaging Streams. IEEE Trans. Dependable Secur. Comput. 2018, 15, 840–852. [Google Scholar] [CrossRef]
Figure 1. Representation of MGs within an MMG system connected to the utility grid.
Batteries 11 00129 g001
Figure 2. Flowchart for the selection and implementation of operational strategies for the MMG system.
Batteries 11 00129 g002
Figure 3. Hourly (a) load demand, (b) PV generation, and (c) TOU rates of each MG for the selected summer day.
Batteries 11 00129 g003
Figure 4. Load balances on a typical summer day during the IO of MGs: (a) MG1, (b) MG2, and (c) MG3.
Batteries 11 00129 g004
Figure 5. Power transactions of MG1 for a typical summer day under IO: (a) EV1 and (b) EV2 (some possible flows are zero and do not show in the plot).
Batteries 11 00129 g005
Figure 6. Power transactions of MG2 for a typical summer day under IO: (a) EV1 and (b) EV2 (some possible flows are zero and do not show in the plot).
Batteries 11 00129 g006
Figure 7. Power transactions of MG3 for a typical summer day under IO: (a) EV1 and (b) EV2 (some possible flows are zero and do not show in the plot).
Batteries 11 00129 g007
Figure 8. Load balances on a typical summer day during the CBO of MGs: (a) MG1, (b) MG2, and (c) MG3.
Batteries 11 00129 g008
Figure 9. Power transactions of MG1 for a typical summer day under CBO: (a) EV1 and (b) EV2 (some possible flows are zero and do not show in the plot).
Batteries 11 00129 g009
Figure 10. Power transactions of MG2 for a typical summer day under CBO: (a) EV1 and (b) EV2 (some possible flows are zero and do not show in the plot).
Batteries 11 00129 g010
Figure 11. Power transactions of MG3 for a typical summer day under CBO: (a) EV1 and (b) EV2 (some possible flows are zero and do not show in the plot).
Batteries 11 00129 g011
Figure 12. Load balance of MG1 on a typical summer day using ADMM (some possible flows are zero and do not show in the plot).
Batteries 11 00129 g012
Figure 13. Hourly load demand of each MG for the selected day: (a) winter and (b) off-season.
Batteries 11 00129 g013
Figure 14. Hourly solar generation of each MG for the selected day: (a) winter and (b) off-season.
Batteries 11 00129 g014
Figure 15. TOU buying and selling rates for the selected day: (a) winter and (b) off-season.
Batteries 11 00129 g015
Figure 16. Load balance of MG1 in IO for the selected day: (a) winter and (b) off-season.
Batteries 11 00129 g016
Figure 17. EVs’ power transactions for MG1 under IO on a typical day: (a) winter and (b) off-season (some possible flows are zero and do not show in the plot).
Batteries 11 00129 g017
Figure 18. Load balance of MG2 under IO for the selected day: (a) winter and (b) off-season.
Batteries 11 00129 g018
Figure 19. EVs’ power transactions for MG2 under IO on a typical day: (a) winter and (b) off-season (some possible flows are zero and do not show in the plot).
Batteries 11 00129 g019
Figure 20. Load balance of MG3 under IO for the selected day: (a) winter and (b) off-season (some possible flows are zero and do not show in the plot).
Batteries 11 00129 g020
Figure 21. EVs’ power transactions for MG3 under IO on a typical day: (a) winter and (b) off-season (some possible flows are zero and do not show in the plot).
Batteries 11 00129 g021
Figure 22. Load balance of MG1 under CBO for the selected day: (a) winter and (b) off-season.
Batteries 11 00129 g022
Figure 23. Load balance of MG2 under CBO for the selected day: (a) winter and (b) off-season (some possible flows are zero and do not show in the plot).
Batteries 11 00129 g023
Figure 24. Load balance of MG3 using ADMM for the selected day: (a) winter and (b) off-season (some possible flows are zero and do not show in the plot).
Batteries 11 00129 g024
Figure 25. EVs’ power transactions for MG3 using ADMM on a typical day: (a) winter and (b) off-season (some possible flows are zero and do not show in the plot).
Batteries 11 00129 g025
Table 1. Detailed annual cost (USD) comparisons of MG1, MG2, and MG3 under IO.
BuyingSellingNet (Buying − Selling)
MG1654.55.3649.1
MG2574.97.5567.4
MG3838.89.5829.3
Table 2. Detailed annual cost (USD) comparisons of MG1, MG2, and MG3 under CBO.
Buying Selling Net (Buying − Selling)
Grid MG1 MG2 MG3 Grid MG1 MG2 MG3
MG1608.3-1.501.75.4-0.71.7603.7
MG2532.60.7-0.86.51.5-2.6523.5
MG3782.91.72.6-8.51.70.8-776.2
Table 3. Annual net (buying − selling) cost (USD) comparisons of MG1, MG2, and MG3 across different strategies.
MG1 MG2 MG3
Base Case (No Solar/BESS, No Optimization)1056.81160.71677.8
Individual Optimization649.1567.4829.3
Community-Based Optimization603.7523.5776.2
Cooperative GT562.2516.8824.4
ADMM603.8529.8777.6
Disclaimer/Publisher’s Note: The statements, opinions and data contained in all publications are solely those of the individual author(s) and contributor(s) and not of MDPI and/or the editor(s). MDPI and/or the editor(s) disclaim responsibility for any injury to people or property resulting from any ideas, methods, instructions or products referred to in the content.