Article

EIS Study on the Electrode-Separator Interface Lamination

Technology Center for Energy, University of Applied Sciences Landshut, Wiesenweg 1, D-94099 Ruhstorf, Germany
*
Author to whom correspondence should be addressed.
Batteries 2019, 5(4), 71; https://doi.org/10.3390/batteries5040071
Submission received: 30 September 2019 / Revised: 9 November 2019 / Accepted: 11 November 2019 / Published: 17 November 2019
(This article belongs to the Special Issue Batteries and Supercapacitors Aging)

Abstract

:
This paper presents a comprehensive study of the influences of lamination at both electrode-separator interfaces of lithium-ion batteries consisting of LiNi1/3Mn1/3Co1/3O2 cathodes and graphite anodes. Typically, electrode-separator lamination shows a reduced capacity fade at fast-charging cycles. To study this behavior in detail, the anode and cathode were laminated separately to the separator and compared to the fully laminated and non-laminated state in single-cell format. The impedance of the cells was measured at different states of charge and during the cycling test up to 1500 fast-charging cycles. Lamination on the cathode interface clearly shows an initial decrease in the surface resistance with no correlation to aging effects along cycling, while lamination on both electrode-separator interfaces reduces the growth of the surface resistance along cycling. Lamination only on the anode-separator interface shows up to be sufficient to maintain the enhanced fast-charging capability for 1500 cycles, what we prove to arise from a significant reduction in growth of the solid electrolyte interface.

1. Introduction

Lithium-ion battery (LIB) technology has grown to a market leader in the field of rechargeable batteries in the last decades. LIBs are used as the energy source for portable devices and electric vehicles (EVs), as well as for stationary energy storage systems to ensure grid stability upon fluctuations from renewable energy sources. To improve the fast-charging capability as well as the travelling distance of the EVs, ongoing research mainly addresses the basic cell components like active materials [1,2], electrolyte [3], separator [4,5,6,7], and manufacturing steps. Different manufacturing techniques, such as ultra-thick electrodes [8,9,10,11], calendering process [12], controlled stack pressure [13,14], laser structuring [15,16,17,18,19,20] and lamination [21], have been applied to increase the power density, energy density, lifetime and for cost reduction of LIBs. Typically, the calendering process improves the contact situation between the active material particles [14], which leads to an increase of the rate capability as well. On the other hand, extensive calendering can break the active material particles and block the lithium-ions at the electrode-electrolyte interface which makes the fast-charging capability problematic [12,22].
The electrode-separator lamination technique is known for the simplification of the stacking process upon reducing the probability of stack component slipping in the anode-separator-cathode compound [23], as well as accelerating the manufacturing speed. Besides, it can also improve the fast-charging capability and reduce the capacity fade at high C-rates [21]. This leads to the assumption that the detailed mechanisms that drive the fast-charging capability upon electrode-separator lamination are not completely understood so far, which inspired this study.
A recent study of lithium metal anodes showed that surface treatments for smooth lithium surfaces can significantly suppress lithium dendrite growth by modifying the surface topography and local surface chemistry, therefore lowering the solid electrolyte interface (SEI) growth losses during cycling [24]. Similarly, it was shown that electrochemical polishing on alkali metal anodes, which yield ultra-smooth surfaces, provide ultra-thin SEI layers which possibly suppress dendrite growth along cycling [25].
In our previous study, cross-section images gained by scanning-electron-microscopy (SEM) clearly showed pore size reduction at both electrode-separator interfaces upon lamination [21]. Hence, the lithium-ion diffusion paths can be expected to be shortened and homogenized at both electrode-separator interfaces. As a result, the ion current density distribution along the active area of the full cell gets equalized according to the ion path length homogenization on the electrode-separator interfaces. Equalizing the current density distribution reduces the possibility to locally reach exceptional high ohmic overpotentials, high enough to undergo the lithium deposition potential and cause local lithium dendrite formation, especially at high charging rates. Similar effects were found by Müller, S. et al., who recently reported a clear correlation for graphite anode inhomogeneities at different scale lengths to possibly cause local overpotentials high enough to undergo the lithium deposition potential [26].
To overcome some of the mentioned problems, the electrode-separator lamination technique provides proper contacts of separator and electrode at micro level. Suppression of ridges and wrinkles as well as reducing the probability to form cracks during cycling, analogously holds the potential to prevent dendrite formation and SEI growth. Validity of this assumption can be reasonably studied using electrochemical impedance spectroscopy (EIS).
To appropriately study the contribution of each electrode within a full cell using EIS, typically three electrode geometries are designed and used, which unfortunately requires special modifications to any kind of full cell design [27,28]. In case of two-electrode impedance spectroscopy, the distinction of each electrode contribution is challenging, but possible [27]. The EIS signal responses for LiNi1/3Mn1/3Co1/3O2 (NMC) cathodes [22] or related structures [29] and graphite anodes [30,31] have yet been studied in detail. Using this information, the EIS signal of a graphite/NMC full cell could be considered well understood so far. Nevertheless, in literature the interpretation of the surface resistance semicircle reflects several further aspects. While the signal is often assigned to mainly depend on the SEI [32,33], there are also studies that show separate influences arising from the electrode-current collector contact situation [34]. Therefore, reliable studies of SEI effects emerging from the surface resistance signal have to deal with a proper separation of the signal contributions.
To overcome this difficulty, EIS measurements are either driven at exceptional low temperatures [32], which is problematic when aiming for aging studies purely based on cycling effects, or by introducing reference electrodes into the cell geometry [27,28].
In this study, we will show the ability of the lamination technique to provide this signal separation even in a two-electrode geometry, and use the correlation to prove the enhanced fast-charging capability of laminated cells to arise from a reduction in SEI growth.

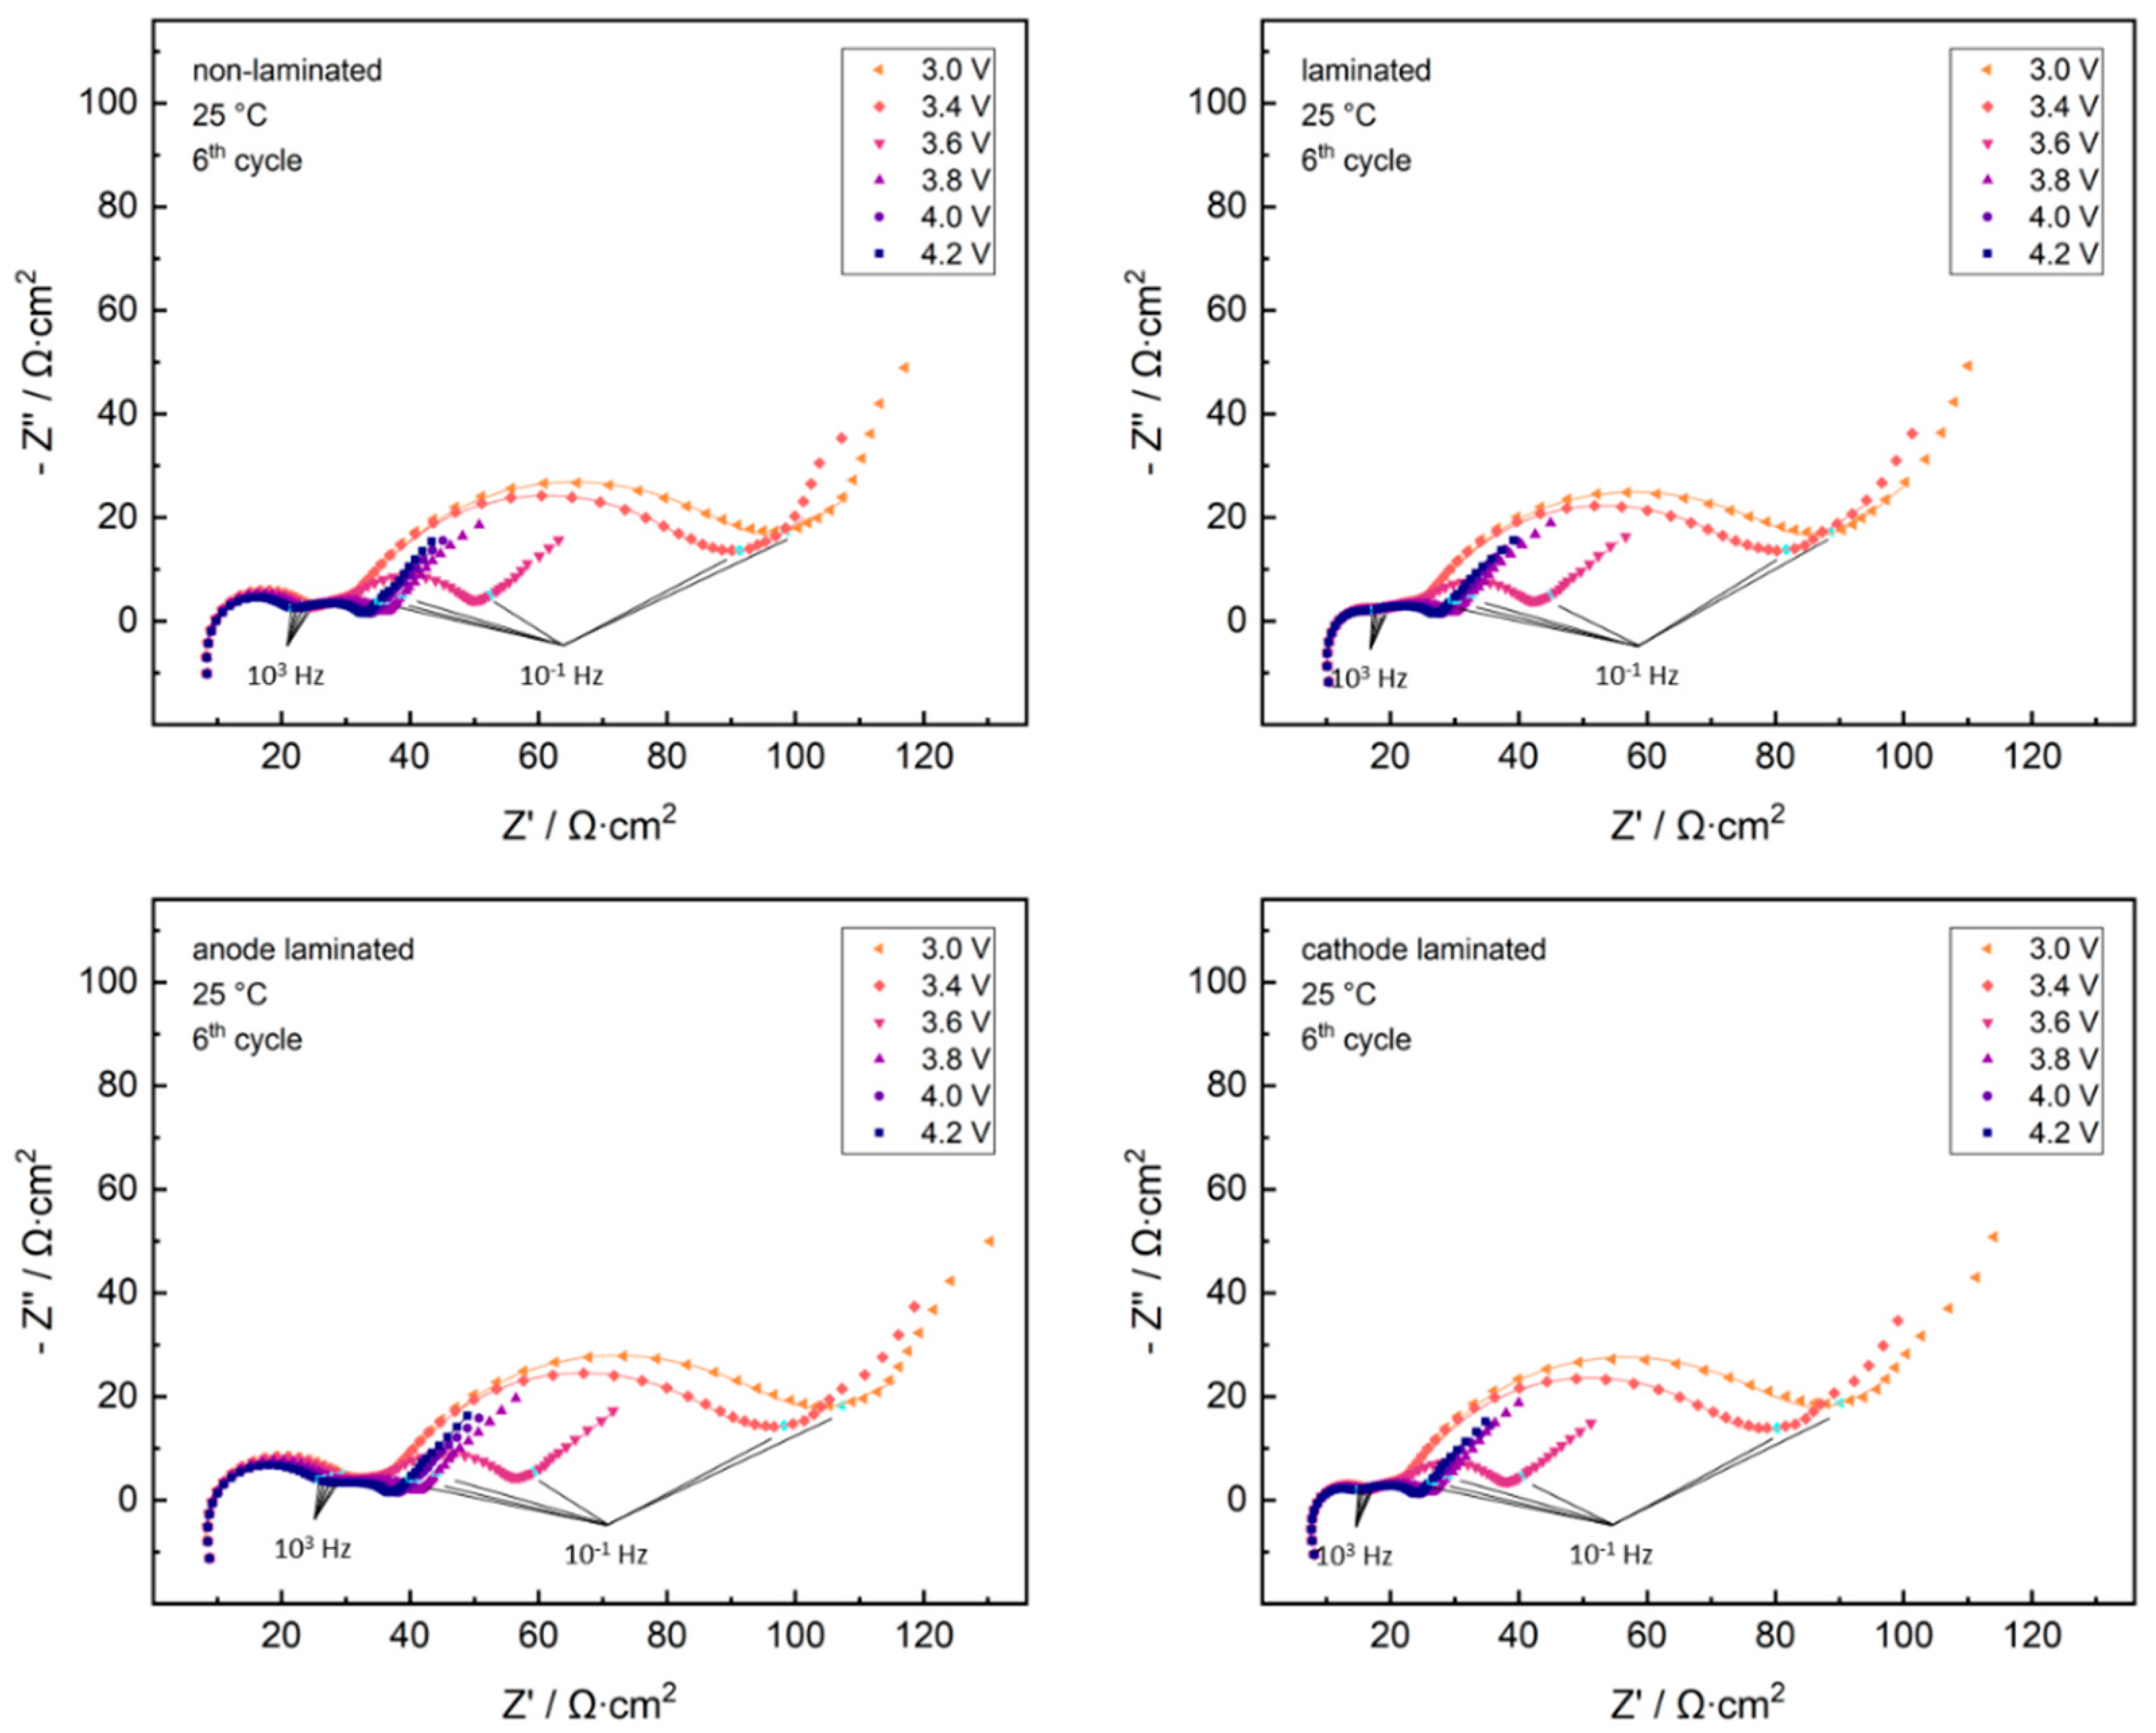
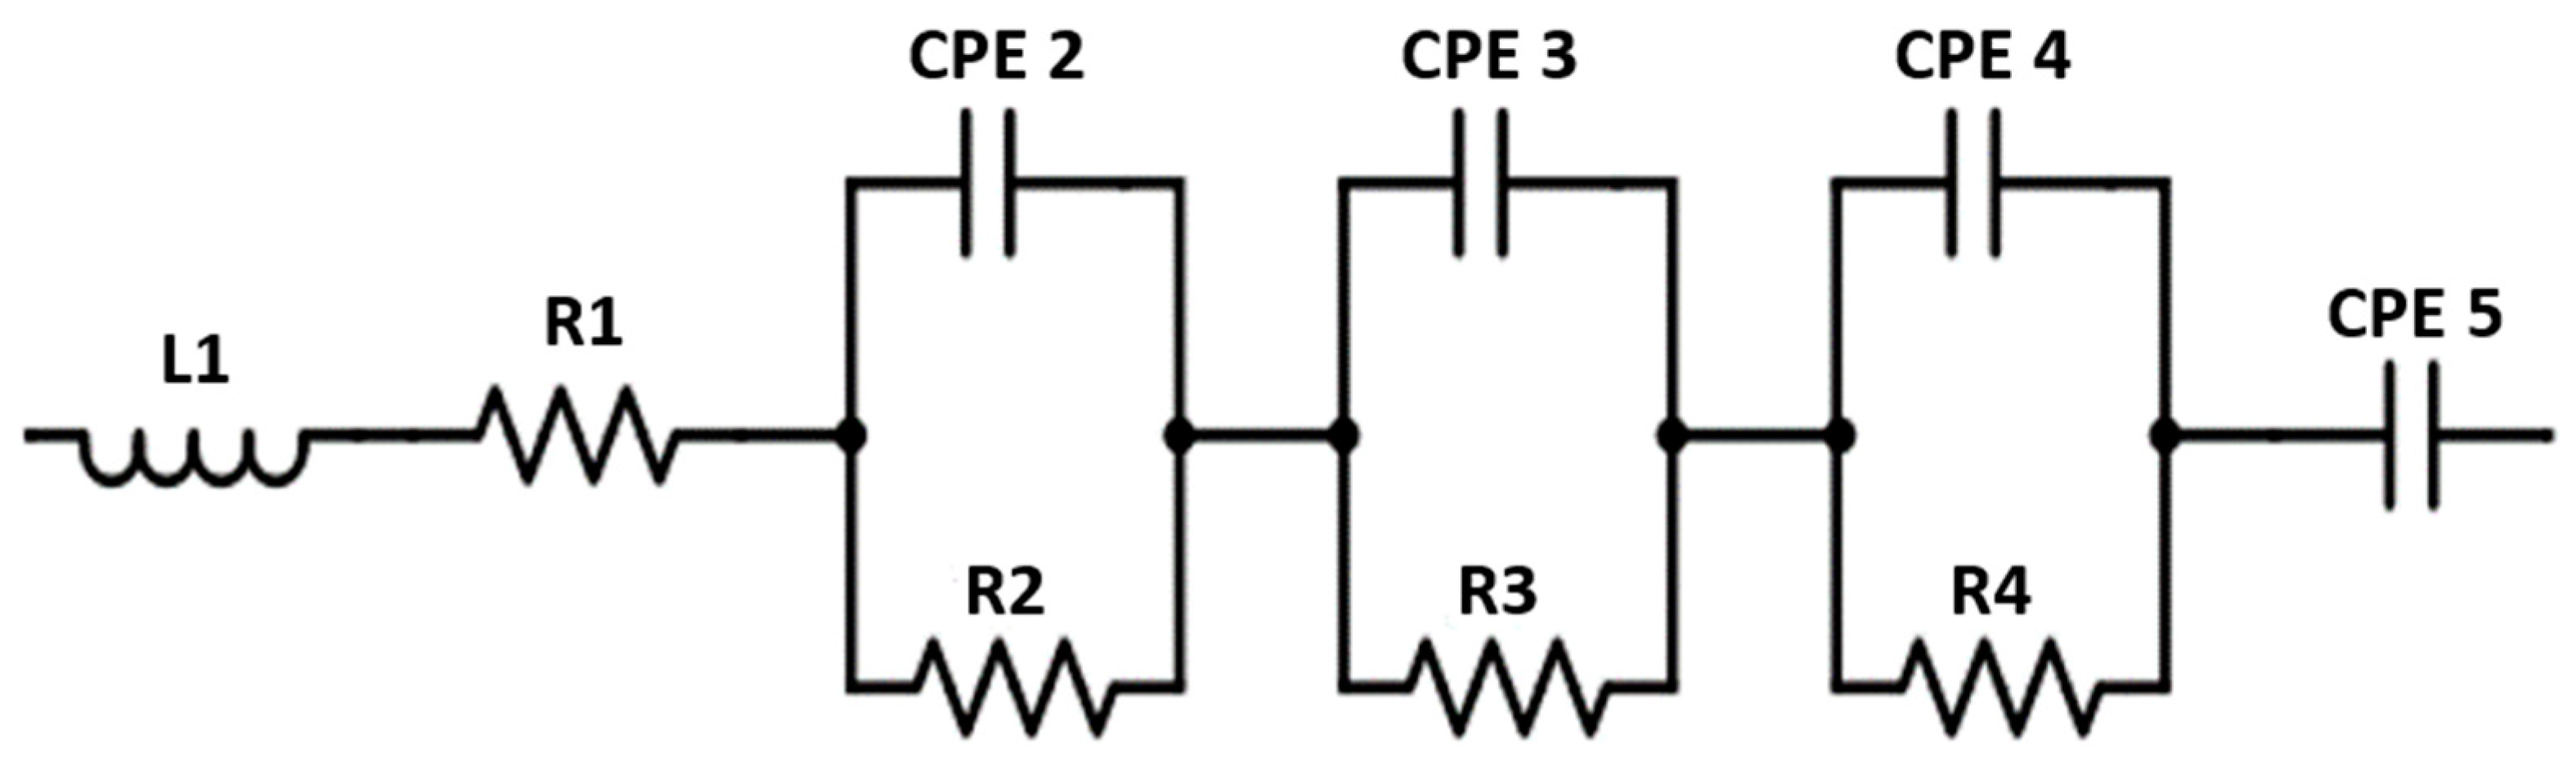
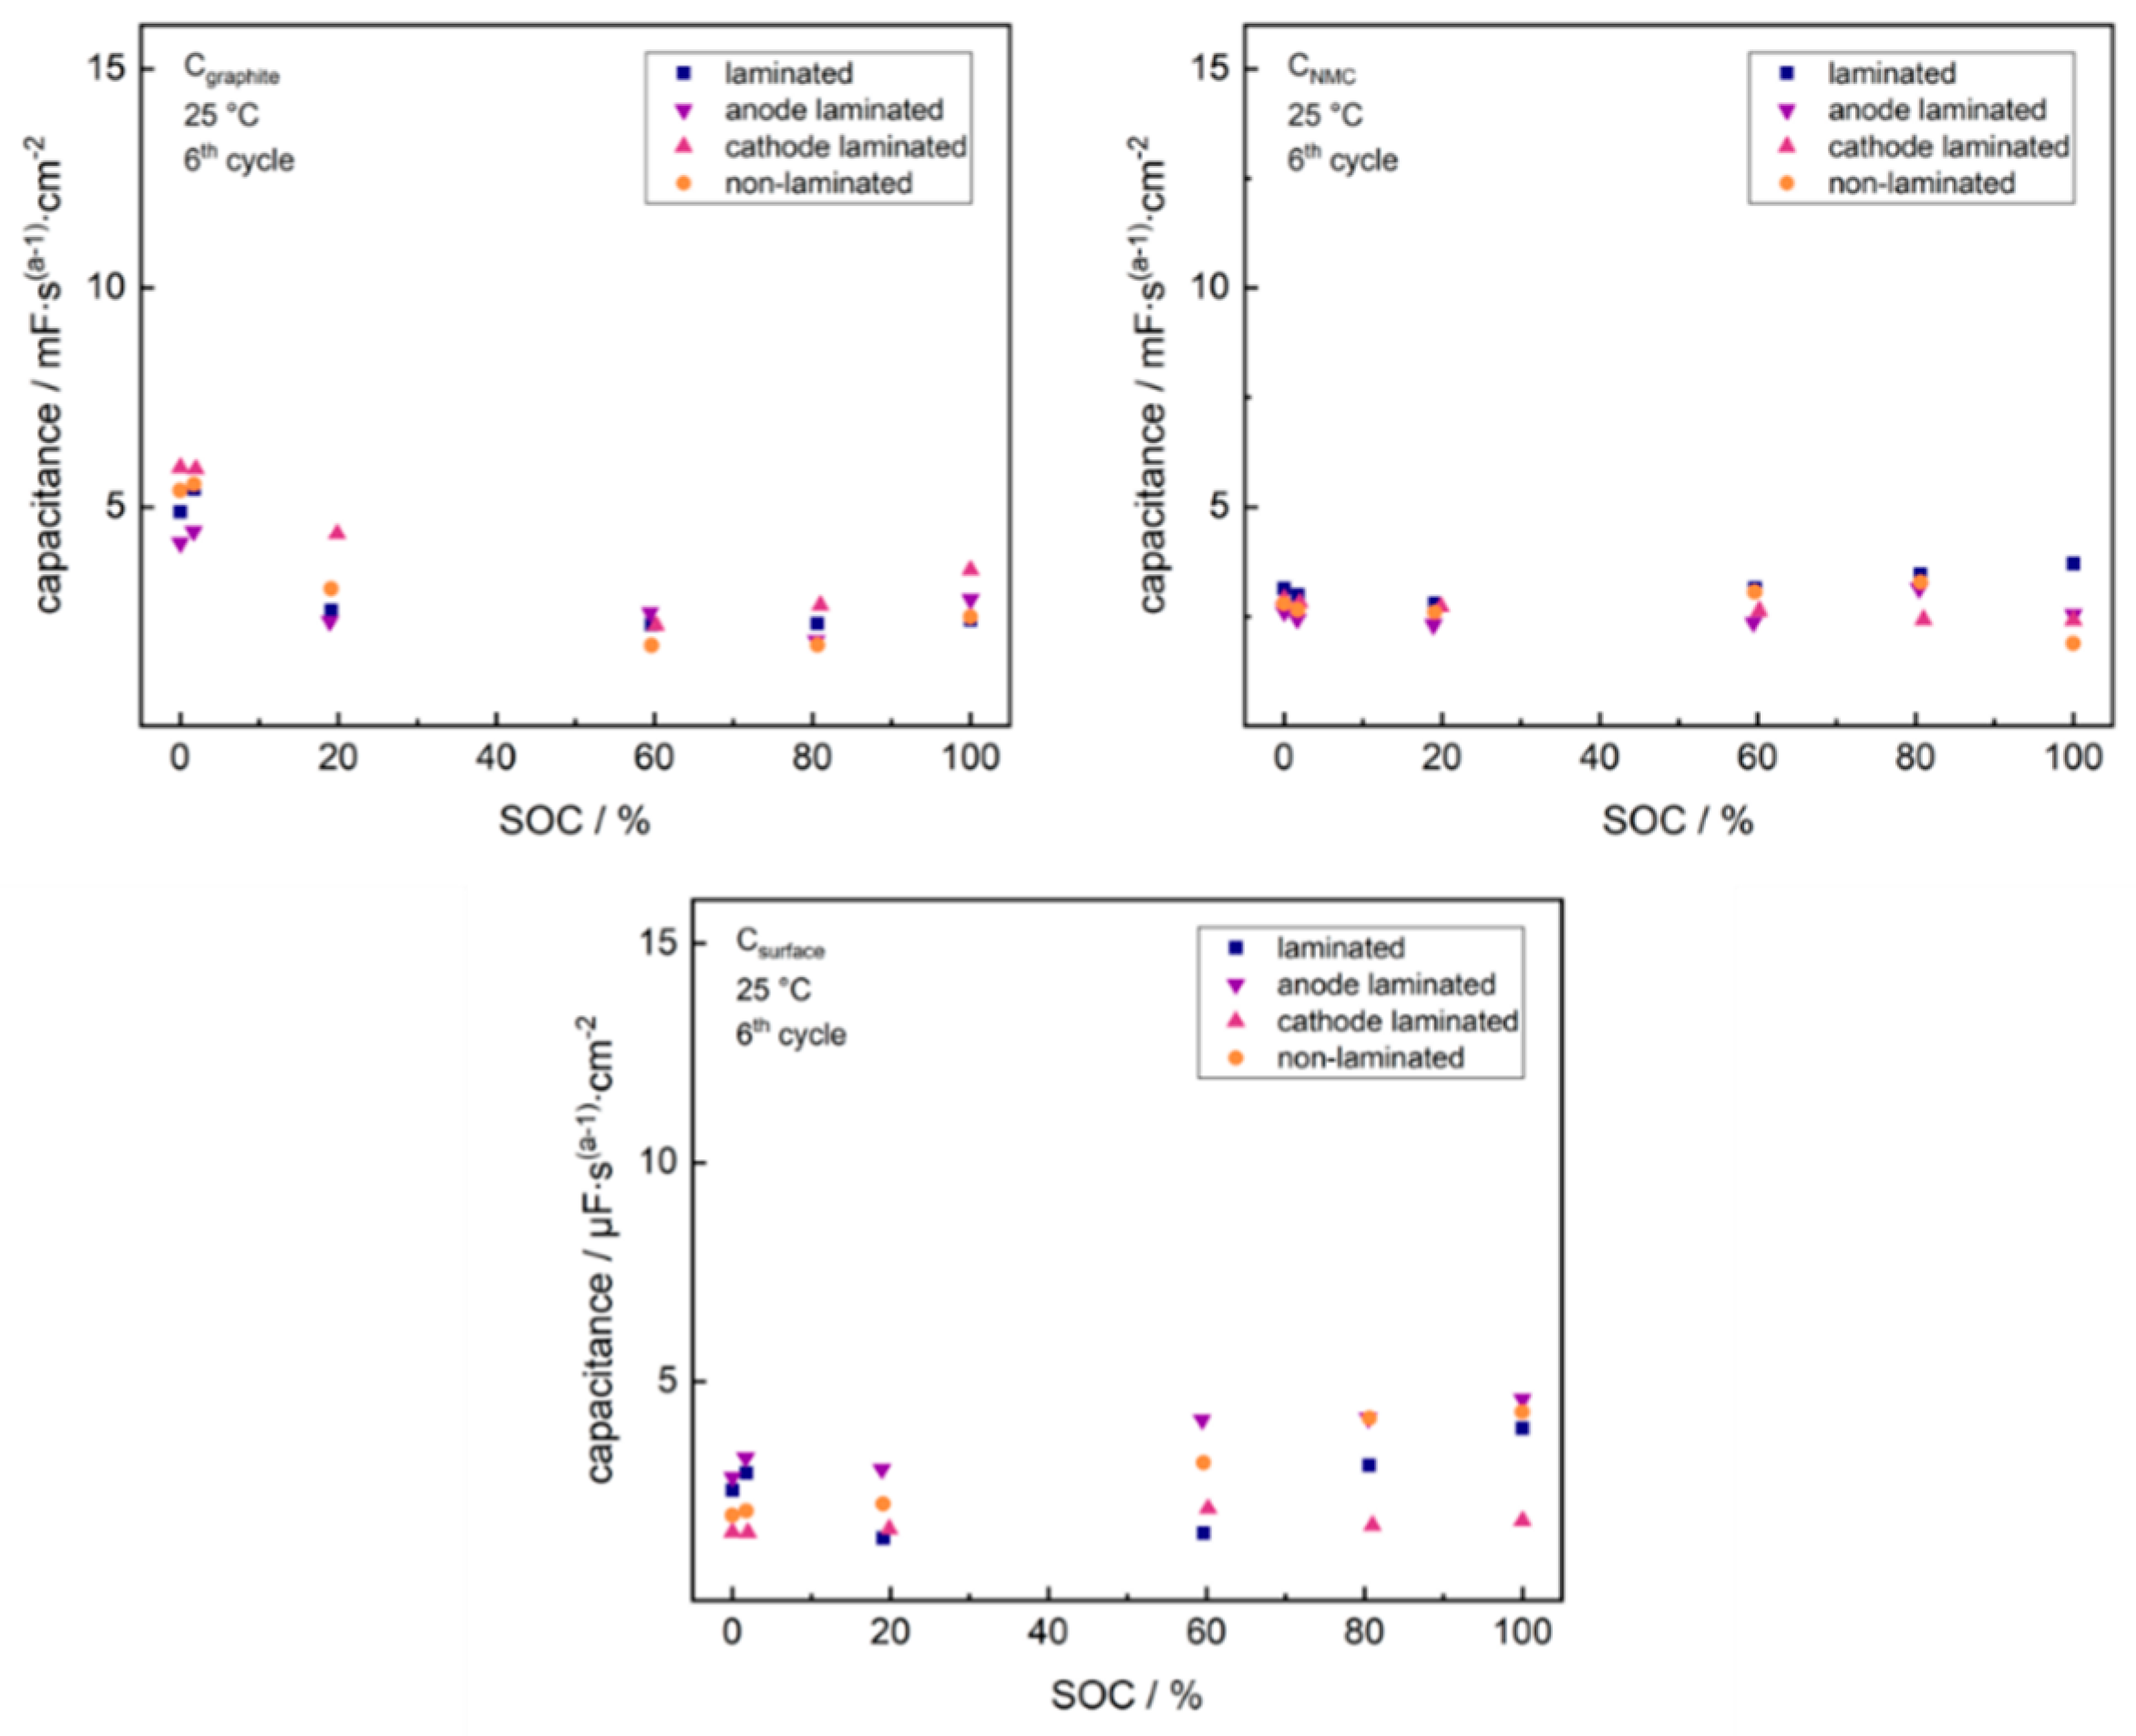
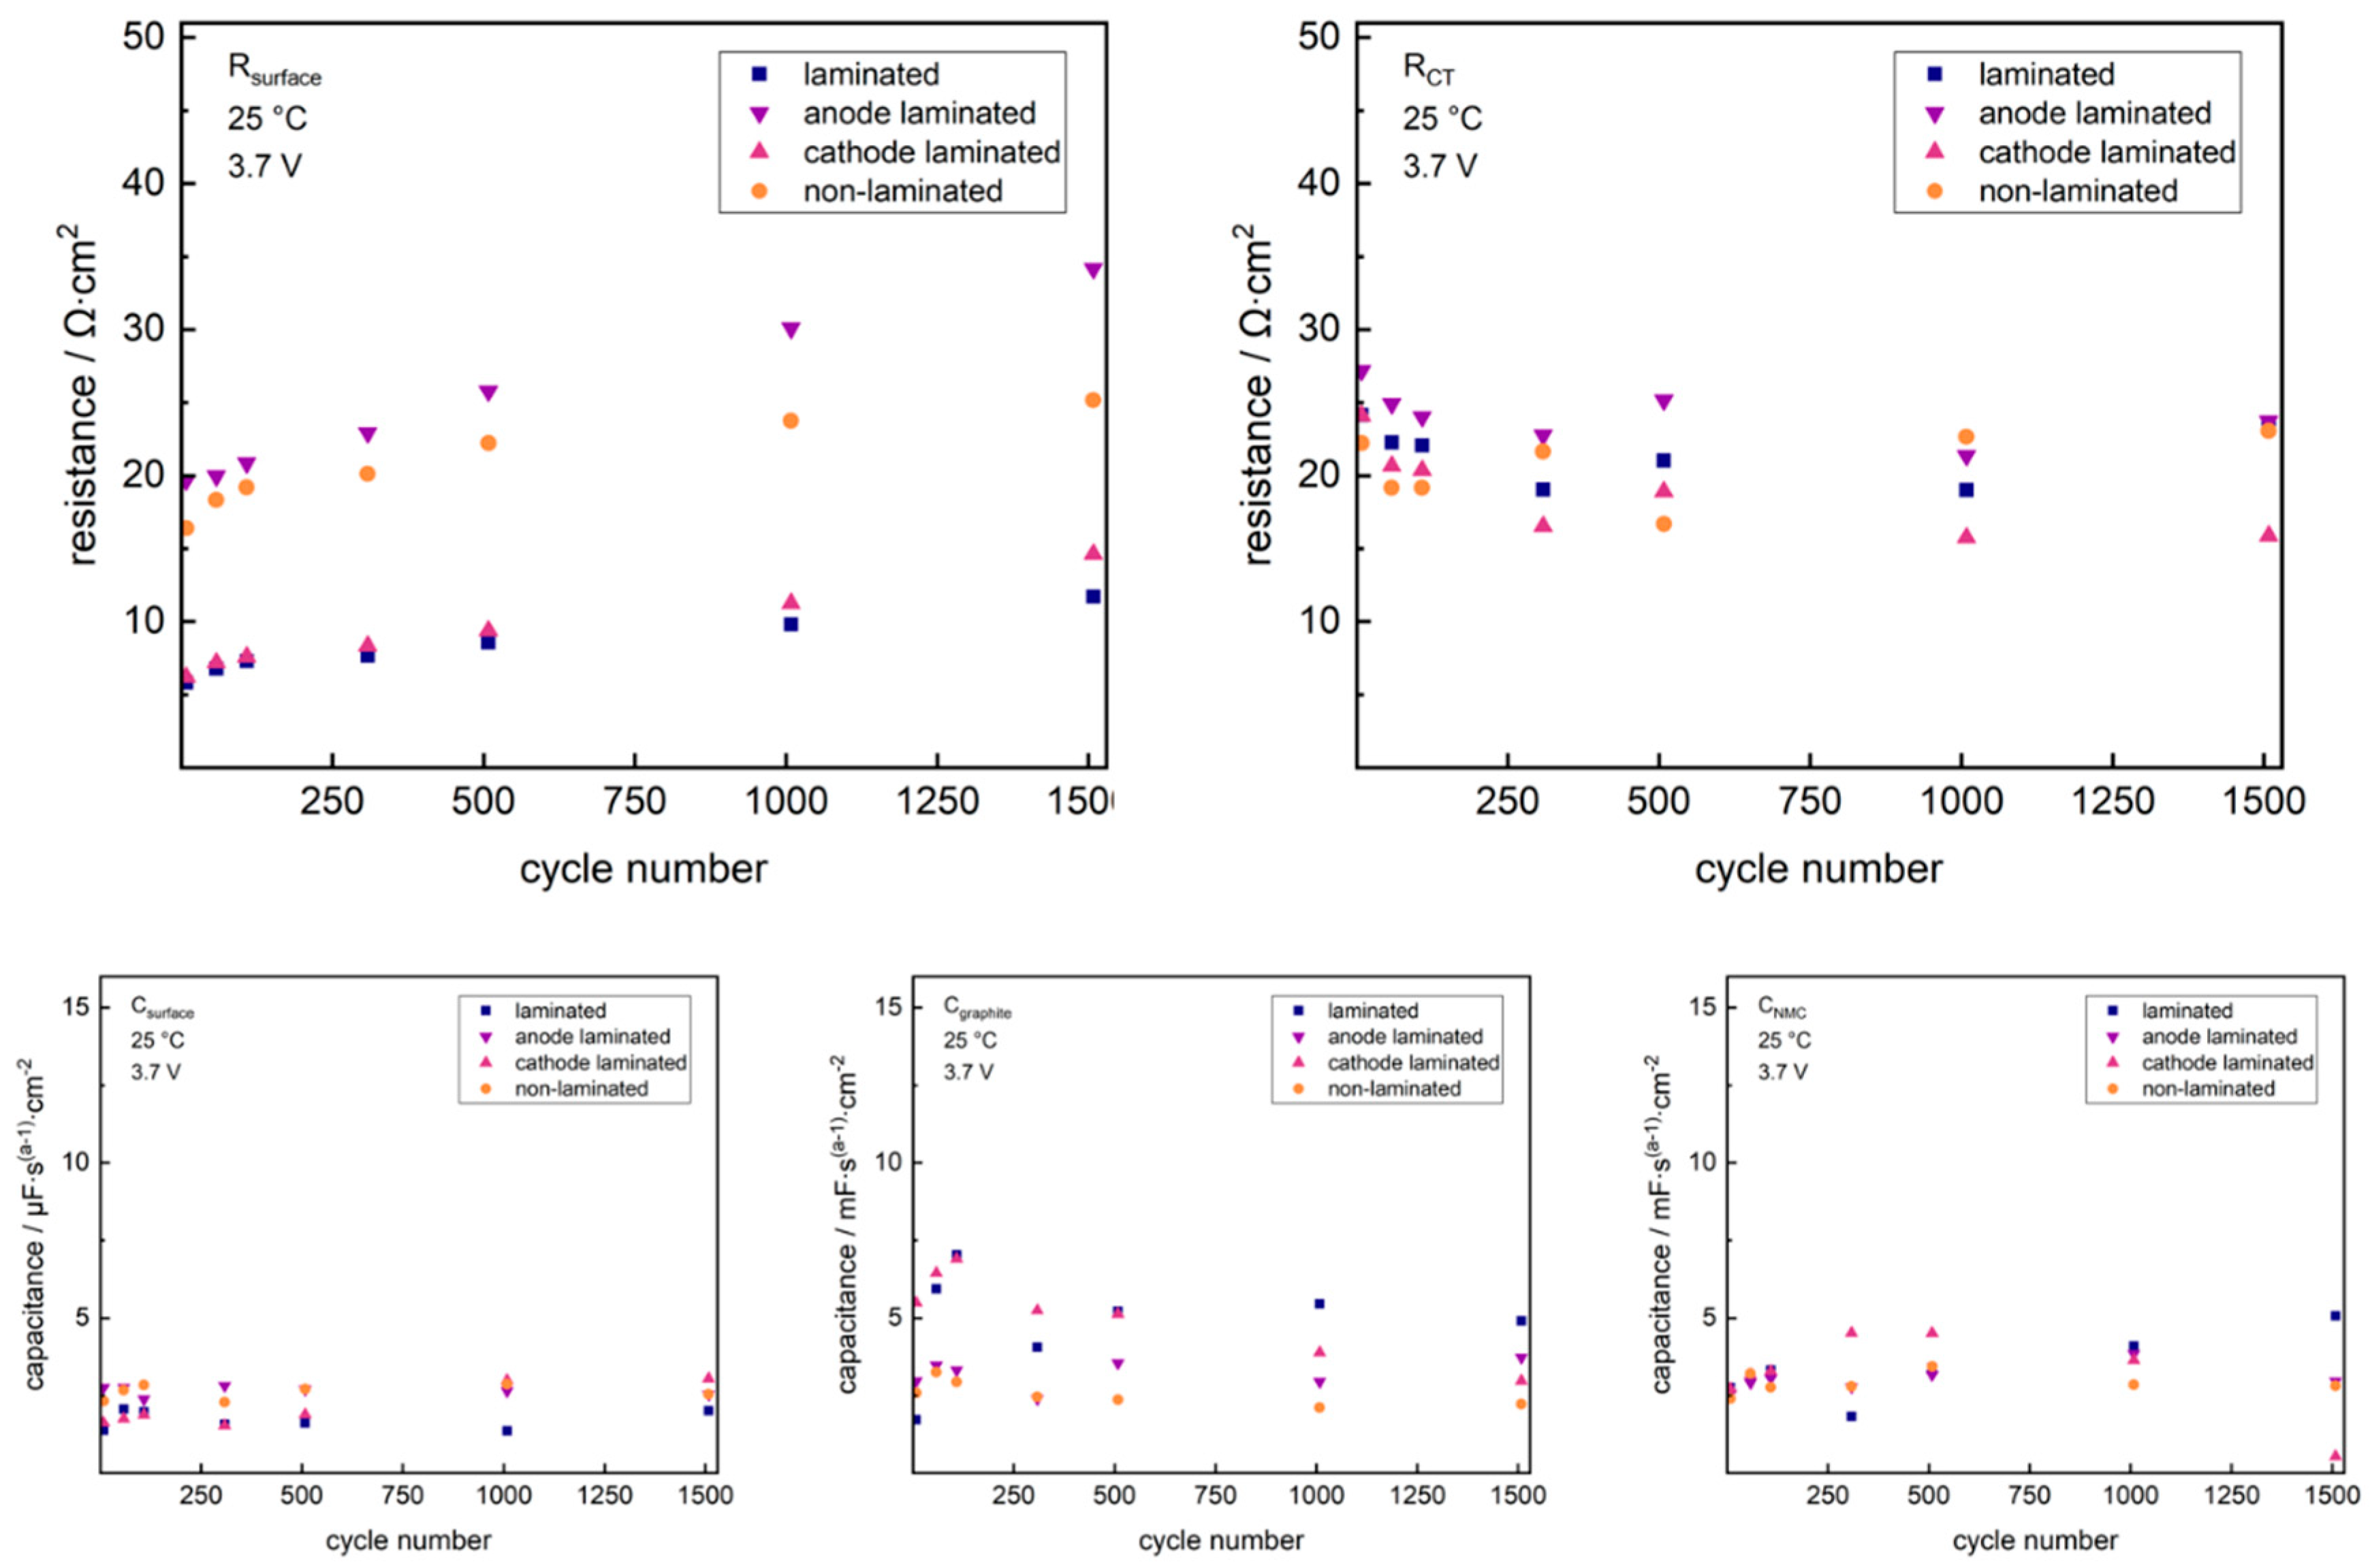
2. Results and Discussion

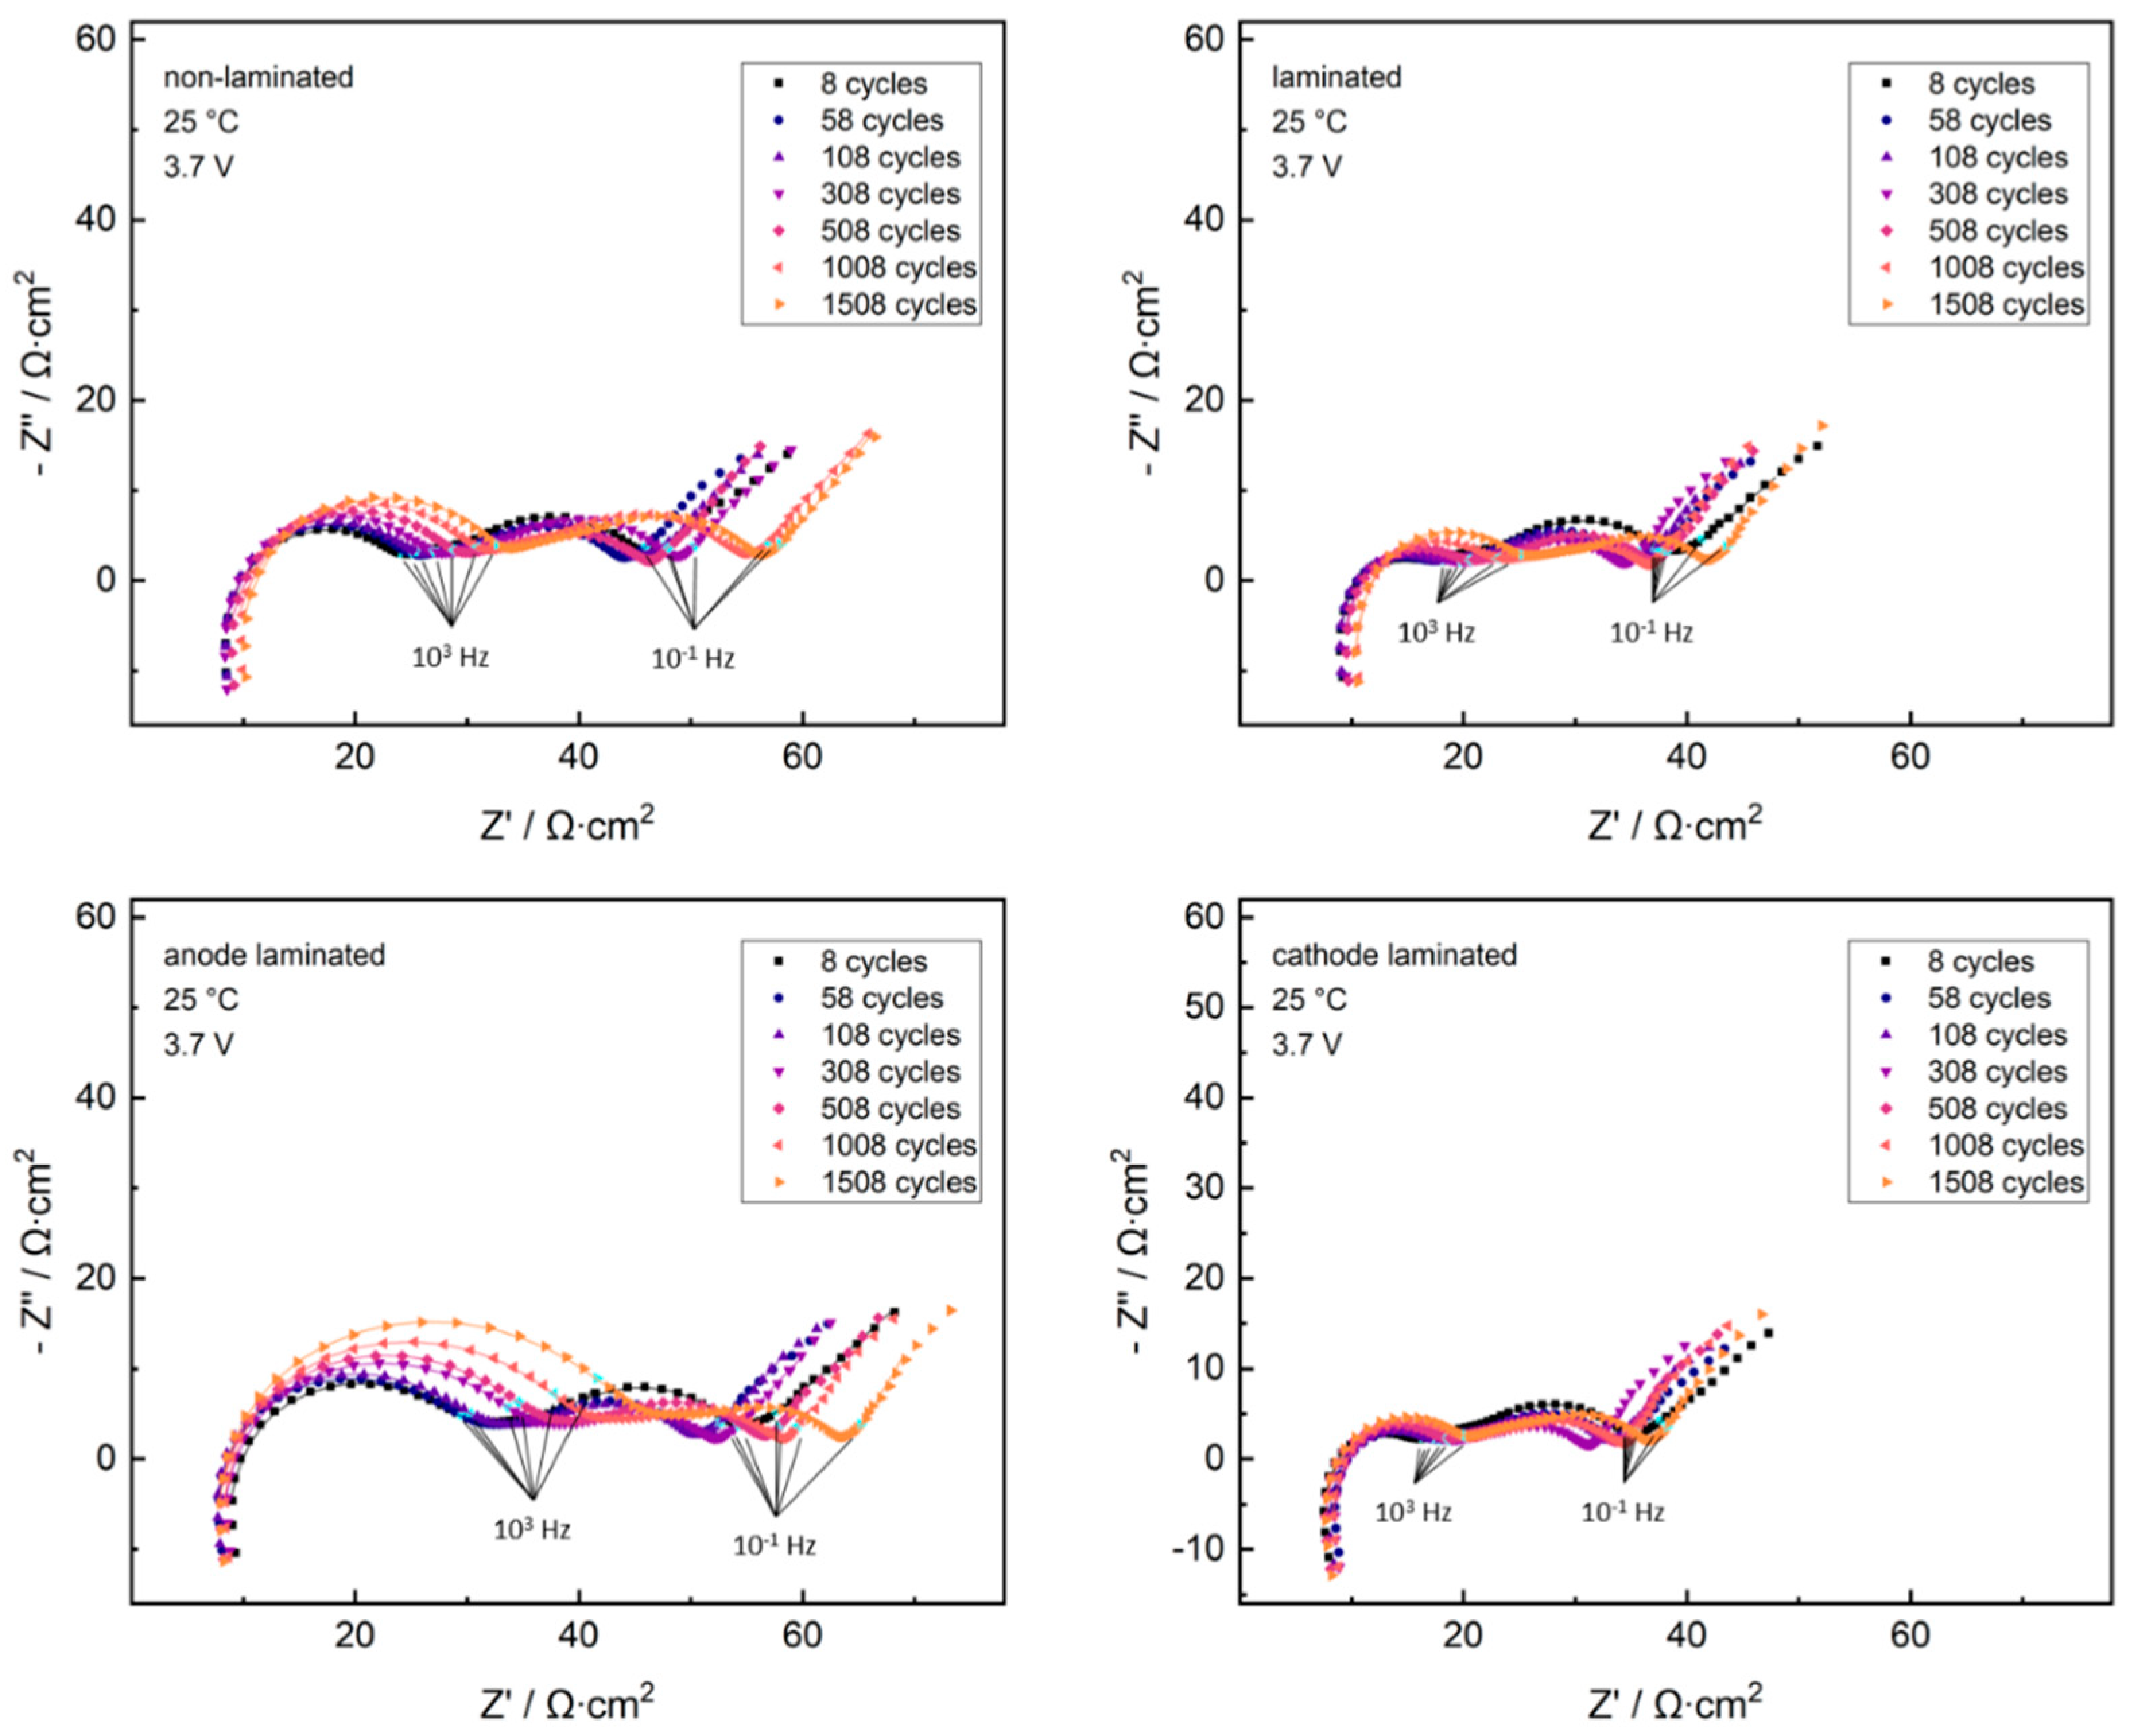
2.1. Cathode-Separator Lamination Effects

Single cells consisting of a NMC cathode, separator and graphite anode were studied via EIS in non-laminated/partially laminated/fully laminated state along varied state of charge (SOC) after three formation cycles (C/10 rate) and two initial cycles at 1C rate. Figure 1 shows the impedance spectra gathered upon different lamination modes.
The Nyquist plots uniquely show inductive behavior at the high-frequency regime, followed by three semicircles and the typical Warburg behavior at the lowest frequencies. For further studies, we characterize the three semicircles and the Warburg regime using the equivalent circuit model shown in Figure 2.
This common equivalent circuit model is frequently used in literature [32] to describe NMC/graphite full cells. In the highest frequency regime, the signal is dominated by inductive phenomena arising from the impedance measurement environment. Both inductance element L1 and the electronic resistance R1, considered to mainly arise from the electrolyte resistance, contain side influences from the setup, such as cell tabs, welding points, impedance channel contacts and cables. The first semicircle represents the surface resistance phenomena. The second and third semicircle are driven by the charge-transfer reactions of graphite anode and NMC cathode, respectively. Low frequency phenomena arise from solid state diffusion characteristics, that can be split into closed and open Warburg regime [35], and therefore sometimes occurring as a consecutive series of varying slopes in the Nyquist presentation of the lowest frequency responses. As described above, signals from both charge-transfer reactions tend to overlap in this reference system as arising from the sum of the graphite anode and NMC cathode charge-transfer contributions [29,30,31,36]. For proper signal separation of these charge-transfer contributions, typically three-electrode cell designs are used involving reference electrodes. But in the case of NMC/graphite full cells, given knowledge on the separate EIS signal trends along SOC for the NMC cathode [37] or related composite materials [29], and graphite anode [30,31] can be used to identify the individual full cell signal contributions to the charge-transfer resistance. It is well accepted that in case of LIB full cells the sum of the signal contributions of the separate electrodes define the EIS response in a two-electrode geometry [36,38]. Jimenez Gordon et al. described the signal contribution of graphite anodes in LIBs [30,31]. While the surface resistance contribution, arising from porosity aspects and SEI characteristics, stays independent from the SOC of the cell [30], the charge-transfer signal of graphite decreases with increasing SOC, following a characteristic trend [31]. Liu et al. clarified the EIS trends of composite cathodes with respect to the amount and ratio of the conductive additive and PVDF binder, identifying separate mechanisms to drive the raise in impedance depending both on the ratio and on the total content of binder and conductive additive [29]. In the case of a ratio of 0.8:1 for acetylene black: PVDF, both for the total contents of 3.6% and 9%, they found a characteristic increase of the charge-transfer resistance with increasing depth of discharge (DOD). A drastic increase of the slope was found approaching 100% DOD [29].
The highlighted data point set at 103 Hz in Figure 1 lies close to the minimum between the first and second semicircle for all shown Nyquist datasets. As its relative position does not change with SOC for any cell, the surface resistance, that characterizes the first semicircle, can be considered independent from SOC. The second highlighted data point series at 10−1 Hz lies within the Warburg regime at high SOC for all cells, shifting closer to the minimum between the third semicircle and Warburg regime with decreasing SOC. This behavior indicates a shift to lower time constants of the cathode charge-transfer process with decreasing SOC, which is a known effect on the charge-transfer resistance of NMC based full cells [37].
Using the described correlations of the EIS signal response, the equivalent circuit analysis of the signals shown in Figure 1 is unambiguous. As for the structure of the chosen equivalent circuit, the open Warburg behavior was excluded from the data fit. Results are presented in Figure 3 and Figure 4.
As shown in Figure 3, the capacitance fit parameters for the graphite anode and NMC cathode lie around 3–4 mF∙s (a−1)∙cm−2 with negligible dependence on SOC, which is in the range of typically reported values for EIS capacitance fit parameters, normalized to the geometric electrode area, of graphite anodes and composite cathodes in non-aqueous electrolytes [39,40,41]. The capacitance fit parameters of the surface resistance semicircle show no significant correlation to the SOC and lie around 3–5 µF∙s (a−1)∙cm−2 for all cells, which is in the range of double layer capacitances of non-aqueous electrolytes [39]. Further information can be extracted from the resistance fit parameters, shown in Figure 4.
For all cells, the charge-transfer resistance signal for the graphite anode decreases initially down to ~14 Ω∙cm2 at 20% SOC. For SOC higher than 60%, the charge-transfer signals lie at a constant lower plateau at around 7 Ω∙cm2. This trend of the graphite anode charge-transfer resistance was well-described by Jiménez Gordon, I. et al. [30,31]. As it can be seen, there is no significant difference between different lamination modes.
Analogously, a logarithmic drop of the NMC charge-transfer resistance along increasing SOC is found for all cells, with no correlation to any lamination mode. This logarithmic trend of the NMC charge-transfer signal is well-known [29,42].
The first significant difference between the lamination modes can be found in the trends of the surface resistance. Both non-laminated cell (~16 Ω∙cm2) and anode-laminated cell (~20 Ω∙cm2) show relatively high surface resistance signals, whereas cathode-laminated and fully laminated cells both drop to a surface resistance signal around 6 Ω∙cm2, especially at higher SOC. Zheng, H. et al. found a similar drop of the surface resistance purely upon calendering NMC-cathodes to different porosities, where also lowest resistances at around 5 Ω∙cm2 are reached [22]. This recognizable drop arises from porosity changes and contact optimization at the cathode side. As both lamination and calendering technique are applied previous to final cell assembly, this surface resistance drop can act as a normalization for the starting conditions of the full cell surface resistance. After minimizing all well-known NMC cathode influences on the surface resistance as in the cathode-laminated and fully laminated state previous to cycling studies, any further changes on the surface resistance upon cycling uniquely arise from changes in the SEI.

2.2. Anode-Separator Lamination Effects

Figure 5 presents the results of non-laminated/partially laminated/fully laminated cells in the cycling test, when charging at 5C (CCCV mode) and discharging at 1C (CC mode). Recent studies on electrode-separator lamination showed a recognizable reduction in capacity fading upon fast-charging cycles at fully laminated state [21].
Both the non-laminated cell and cathode-laminated cell reveal severe capacity fading, decreasing from 133.0 mAh∙g−1 (100%) and 133.4 mAh∙g−1 (100%) at the 9th cycle, down to 100.4 mAh∙g−1 (75.5%) and 99.3 mAh∙g−1 (74.6%) at the 1508th cycle, respectively. Additionally, both laminated and anode-laminated cells show a reduced capacity fading, decreasing from 133.2 mAh∙g−1 (100%) and 129.6 mAh∙g−1 (100%) at the 9th cycle, down to 112.5 mAh∙g−1 (84.6%) and 111.4 mAh∙g−1 (83.7%) at the 1508th cycle, respectively. Capacity fade trends are summarized in Table 1.
From the cycling test results, there arise two unique conclusions. First, minimization of the surface resistance via cathode lamination cannot ensure a permanent reduction in capacity fading upon fast-charging cycles, as is shown from the cathode-laminated cell. Second, yet the partial lamination on the anode interface is sufficient to generate the well-known reduction of capacity fade during fast-charging cycles, as shown from the discharge capacity trend of the anode-laminated cell in Figure 5. The data therefore show clearly that the fast-charging capability arises only from lamination at the anode interface, while the cathode interface does not affect the fast-charging aging mechanisms.
The cells studied at the fast-charging cycle test were also characterized with EIS along the cycling. Figure 6 shows the trends of the respective datasets in the Nyquist plots.
Similar to Figure 1, the highlighted data point set at 103 Hz in Figure 6 lies close to the minimum between the first and second semicircle for all datasets, while the second highlighted dataset series at 10−1 Hz lies close to the minimum between the third semicircle and Warburg regime. Both benchmark frequency datasets do not change in relative position within the Nyquist datasets along cycling, indicating a negligible change of the time constant with cell aging at the chosen conditions. This correlates well to findings by Waag, W. et al. on NMC based full cells at moderate SOC [37].
To exclude side influences from cathode interface phenomena to the surface resistance signal, EIS aging studies focused on SEI effects require a minimization of the surface resistance starting condition. As discussed above, lamination at the cathode-separator interface minimizes the surface resistance previous to cycling influences. Initially, both the cathode-laminated and fully laminated cell have smaller surface resistance semicircles, while anode-laminated and non-laminated cell reveal enlarged surface resistance semicircles. All cells reveal, that the surface resistance semicircle increases with rising cycle number, while no clear trend for the charge-transfer semicircles arises along cycling for any cell. Further insights can be extracted by studying the semicircles in the equivalent circuit fit. Again, due to the structure of the chosen equivalent circuit, the open Warburg regime was excluded from the data fit. Figure 7 shows the trends of the resistances and capacitances calculated upon the fitting.
As both charge-transfer signals have drastic overlap, only the sum of the fitted charge-transfer resistances can be studied. No clear trend on the charge-transfer resistance signal along cycling is found for any lamination mode. Although all surface resistance signals differ in starting values, as indicated in the Nyquist plots, they all increase upon cycling. Both the capacitance fit parameters for the graphite anode and NMC cathode (3–4 mF∙s (a−1)∙cm−2) and the capacitance signals of the surface resistance semicircles (~3 µF∙s (a−1)∙cm−2) reveal no significant trend along cycling.
As discussed above, focusing on the SEI trends arising from the lamination modes requires minimization of the cathode influences on the surface resistance. Therefore, only the surface resistance signals of the cathode-laminated and fully laminated cell deliver unpersuaded information on the SEI changes.
As shown in Figure 8, both cathode-laminated and fully laminated cells have a minimized surface resistance of 6.2 Ω∙cm2 and 5.8 Ω∙cm2 at the eigth cycle. The cathode-laminated cell increases in surface resistance up to 14.6 Ω∙cm2 after 1508 cycles, while the laminated cell dampens the surface resistance growth to 11.7 Ω∙cm2 after 1508 cycles. This trend in surface resistance clearly proves a reduction in SEI growth, which is specifically due to the lamination at the anode-separator interface.

3. Materials and Methods

3.1. Electrode Preparation

For preparation of anode slurries, MAGE3 graphite (HITACHI CHEMICAL, Sakuragawa, Japan), Solef® 5130 polyvinylidene difluoride (PVDF, SOLVAY, Milan, Italy), Super C65 carbon (IMERYS, Bodio, Switzerland) and SFG6L graphite (IMERYS) were mixed in a ratio of 90/7/2/1 with N-methyl-pyrrolidone (NMP, Overlack, Mönchengladbach, Germany) in a planetary mixer (TX 2, INOUE, Isehara, Japan), while for cathodes, LiNi1/3Mn1/3Co1/3O2 (NMC, NM-3102 h, BASF TODA America, Battle Creek, USA), PVDF (SOLVAY), Super C65 carbon (IMERYS) and KS6L graphite (IMERYS) were mixed in a ratio of 93/3/3/1 with NMP. Anode and cathode slurries were coated on copper foil (15 µm, GELON LIB, Hong Kong, China) and aluminum foil (20 µm, GELON LIB), respectively, by single-side coating on a doctor-blade coater in a roll-to-roll process coating machine, including in-line drying in a two-step drying tunnel at the temperature range of 135–150 °C. The averaged active mass loadings of cathode and anode electrodes were ~8.4 mg∙cm−2 (1.30 mAh∙cm−2) and ~4.2 mg∙cm−2 (1.51 mAh∙cm−2), respectively. Cathodes and anodes were matched to have a capacity balancing factor of ~1:1.16 in all full cells.

3.2. Pouch Cell Preparation

Within the pouch cell, punched cathode, anode and separator (inorganic filled separator, 67% Al2O3 and 33% PVDF/HFP copolymer) sheets with the dimensions 5 × 8 cm2, 5.4 × 8.4 cm2 and 5.8 × 8.8 cm2 were assembled. For the fully laminated state, stacks of cathode-separator-anode were laminated to form a single stack by using a lamination machine (BLE 282 D, MANZ Italy, former Arcotronics Italia, Bologna, Italy) at the roll speed of 1.4 m∙min−1, using a line force of 157 N∙cm−1 in the temperature range of 100–120 °C. For separate electrode-separator lamination, stacks of cathode-separator-PE (polyethylene) carrier and anode-separator-PE carrier were laminated at identical parameters. Pre-assembled pouch cell stacks were dried under vacuum at 110 °C for 12 h. 1 M LiPF6 in ethylene carbonate (EC): ethylmethylcarbonate (EMC) 3:7 w/w (Selectilyte LP57, BASF, Florham Park, USA) and vinylene carbonate (VC, Vinylene Carbonate E, BASF, Florham Park, USA), mixed in a ratio of 98/2, was used as electrolyte. The pre-assembled stacks were filled with 1000 µL electrolyte within an argon filled glovebox (MB20, H2O and O2 content <0.1 ppm, MBraun, Garching, Germany) and sealed under vacuum. Before starting the electrochemical characterization, wetting of all pores was ensured by keeping the cells at room temperature for 24 h previous to starting the formation cycles.

3.3. Electrochemical Characterization

Electrochemical characterization was done with a battery tester (CTS-LAB, BaSyTec, Asselfingen, Germany) and a potentiostat (PGSTAT204, METROHM, Filderstadt, Germany). Cells were cycled between 3.0 V and 4.2 V, using a CCCV protocol for charging (constant current protocol followed by constant voltage protocol) with a CV termination below 0.05C rate, and CC protocol for discharging. Formation was done by applying three cycles at 0.1C, using the nominal capacity of the NMC in each cell, calculated from the specific NMC capacity of 155 mAh∙g−1, given by the supplier. After formation, the discharge capacity of the third formation cycle was taken as the nominal capacity for C-rate calculation of all following steps.
For EIS analysis along SOC, cells were first discharged to 3.0 V at 0.2C rate after the fifth cycle, to then charge the cell up to each point of investigation at 0.2C rate. For EIS analysis along cycling, cells were charged to 3.7 V at 1C rate previous to EIS measurements at each specific cycle. Comparable temperature (25 °C) in EIS measurements was ensured by measuring in a cooled incubator (INCU-Line® IL 68 R, VWR, Ismaning, Germany). Cells rested for 2 h at OCV prior to each EIS measurement. EIS measurements were carried out in the frequency range of 100 kHz–10 mHz (potentiostatic mode) using an amplitude of 10 mVrms. For EIS data fitting the Z-fit protocol, included in the BT-Lab software, was used (BT-Lab V1.55, BioLogic SAS via GAMEC, Illingen, Germany).
To ensure reproducibility of the study, for each cell assembly mode at least three cells were prepared and studied thoroughly. At each path, the performance of the respective cell with lowest initial impedance contributions and lowest capacity fade along 1500 fast-charging cycles is shown and discussed.

4. Conclusions

NMC/graphite full cells were studied in several lamination modes upon significant interface lamination effects revealed by EIS. Along variation of the SOC, both NMC cathode and graphite anode charge-transfer signals were found to stay independent from any lamination mode. The initial surface resistance gets minimized upon lamination at the cathode-separator interface previous to cycling influences.
Fast-charging cycling studies revealed a clear correlation of the reduction in capacity fade, to arise from lamination at the anode-separator interface. The surface resistance minimization via cathode-separator lamination was furthermore used to exclude cathode influences on the surface resistance signal evolution in cycling tests. Using this correlation, the cycling studies prove the fast-charging capability to arise from a reduction in SEI growth specifically arising from lamination at the anode-separator interface.
So, lamination at the cathode-separator interface is found to decrease the internal cell resistances, while lamination at the anode-separator interface reduces long term aging phenomena during fast-charging cycles.

Author Contributions

Conceptualization, M.F., M.S. and K.-H.P.; methodology, M.F. and M.S.; software, M.F.; validation, M.F. and A.D.; formal analysis, M.F. and A.D.; investigation, M.F.; data curation, M.F. and A.D.; Writing—Original draft preparation, M.F.; Writing—Review and editing, M.F., M.S., A.D. and K.-H.P.; visualization, M.F.; supervision, M.S. and K.-H.P.; project administration, M.F.; funding acquisition, K.-H.P.

Funding

This research was funded by BMWi (Federal Ministry for Economic Affairs and Energy, Germany), grant number 03ET6103C.

Conflicts of Interest

The authors declare no conflict of interest. The funders had no role in the design of the study; in the collection, analyses, or interpretation of data; in the writing of the manuscript, or in the decision to publish the results.

References

  1. Geng, X.; Guo, H.; Wang, C.; Cheng, M.; Li, Y.; Zhang, H.; Huo, H. Surface modification of Li1.20Mn0.54Ni0.13Co0.13O2 cathode materials with SmF3 and the improved electrochemical properties. J. Mater. Sci. Mater. Electron. 2018, 29, 19207–19218. [Google Scholar] [CrossRef]
  2. Lee, M.-J.; Lho, E.; Oh, P.; Son, Y.; Cho, J. Simultaneous surface modification method for 0.4Li2MnO3-0.6LiNi1/3Co1/3Mn1/3O2 cathode material for lithium ion batteries: Acid treatment and LiCoPO4 coating. Nano Res. 2017, 10, 4210–4220. [Google Scholar] [CrossRef]
  3. Ming, J.; Li, M.; Kumar, P.; Lu, A.-Y.; Wahyudi, W.; Li, L.-J. Redox Species-Based Electrolytes for Advanced Rechargeable Lithium Ion Batteries. ACS Energy Lett. 2016, 1, 529–534. [Google Scholar] [CrossRef]
  4. Fukutsuka, T.; Koyamada, K.; Maruyama, S.; Miyazaki, K.; Abe, T. Ion Transport in Organic Electrolyte Solution through the Pore Channels of Anodic Nanoporous Alumina Membranes. Electrochim. Acta 2016, 199, 380–387. [Google Scholar] [CrossRef]
  5. Kannan, D.R.R.; Terala, P.K.; Moss, P.L.; Weatherspoon, M.H. Analysis of the Separator Thickness and Porosity on the Performance of Lithium-Ion Batteries. Int. J. Electrochem. 2018, 2018, 1–7. [Google Scholar] [CrossRef]
  6. Xu, Q.; Kong, Q.; Liu, Z.; Zhang, J.; Wang, X.; Liu, R.; Yue, L.; Cui, G. Polydopamine-coated cellulose microfibrillated membrane as high performance lithium-ion battery separator. RSC Adv. 2014, 4, 7845–7850. [Google Scholar] [CrossRef]
  7. Zhang, J.; Yue, L.; Kong, Q.; Liu, Z.; Zhou, X.; Zhang, C.; Xu, Q.; Zhang, B.; Ding, G.; Qin, B.; et al. Sustainable, heat-resistant and flame-retardant cellulose-based composite separator for high-performance lithium ion battery. Sci. Rep. 2014, 4, 3935. [Google Scholar] [CrossRef]
  8. Danner, T.; Singh, M.; Hein, S.; Kaiser, J.; Hahn, H.; Latz, A. Thick electrodes for Li-ion batteries: A model based analysis. J. Power Sources 2016, 334, 191–201. [Google Scholar] [CrossRef]
  9. Singh, M.; Kaiser, J.; Hahn, H. Thick Electrodes for High Energy Lithium Ion Batteries. J. Electrochem. Soc. 2015, 162, A1196–A1201. [Google Scholar] [CrossRef]
  10. Singh, M.; Kaiser, J.; Hahn, H. A systematic study of thick electrodes for high energy lithium ion batteries. J. Electroanal. Chem. 2016, 782, 245–249. [Google Scholar] [CrossRef]
  11. Singh, M.; Kaiser, J.; Hahn, H. Effect of Porosity on the Thick Electrodes for High Energy Density Lithium Ion Batteries for Stationary Applications. Batteries 2016, 2, 35. [Google Scholar] [CrossRef]
  12. Kang, H.; Lim, C.; Li, T.; Fu, Y.; Yan, B.; Houston, N.; De Andrade, V.; De Carlo, F.; Zhu, L. Geometric and Electrochemical Characteristics of LiNi1/3Mn1/3Co1/3O2 Electrode with Different Calendering Conditions. Electrochim. Acta 2017, 232, 431–438. [Google Scholar] [CrossRef]
  13. Barai, A.; Guo, Y.; McGordon, A.; Jennings, P. A study of the effects of external pressure on the electrical performance of a lithium-ion pouch cell. In Proceedings of the 2013 International Conference on Connected Vehicles and Expo (ICCVE), Las Vegas, NV, USA, 2–6 December 2013; IEEE: Piscataway, NJ, USA, 2013; pp. 295–299, ISBN 978-1-4799-2491-2. [Google Scholar]
  14. Cannarella, J.; Arnold, C.B. Stress evolution and capacity fade in constrained lithium-ion pouch cells. J. Power Sources 2014, 245, 745–751. [Google Scholar] [CrossRef]
  15. Habedank, J.B.; Kraft, L.; Rheinfeld, A.; Krezdorn, C.; Jossen, A.; Zaeh, M.F. Increasing the Discharge Rate Capability of Lithium-Ion Cells with Laser-Structured Graphite Anodes: Modeling and Simulation. J. Electrochem. Soc. 2018, 165, A1563–A1573. [Google Scholar] [CrossRef]
  16. Kim, J.S.; Pfleging, W.; Kohler, R.; Seifert, H.J.; Kim, T.Y.; Byun, D.; Choi, W.; Lee, J.K.; Jung, H.-G.; Jung, H.-G.; et al. Three-dimensional silicon/carbon core–shell electrode as an anode material for lithium-ion batteries. J. Power Sources 2015, 279, 13–20. [Google Scholar] [CrossRef]
  17. Lim, D.G.; Chung, D.-W.; Kohler, R.; Pröll, J.; Scherr, C.; Pfleging, W.; Garcia, R.E. Designing 3D Conical-Shaped Lithium-Ion Microelectrodes. J. Electrochem. Soc. 2014, 161, A302–A307. [Google Scholar] [CrossRef]
  18. Mangang, M.; Seifert, H.; Pfleging, W. Influence of laser pulse duration on the electrochemical performance of laser structured LiFePO4 composite electrodes. J. Power Sources 2016, 304, 24–32. [Google Scholar] [CrossRef]
  19. Proll, J.; Kim, H.; Piqué, A.; Seifert, H.; Pfleging, W. Laser-printing and femtosecond-laser structuring of LiMn2O4 composite cathodes for Li-ion microbatteries. J. Power Sources 2014, 255, 116–124. [Google Scholar] [CrossRef]
  20. Smyrek, P.; Pröll, J.; Seifert, H.J.; Pfleging, W. Laser-Induced Breakdown Spectroscopy of Laser-Structured Li (NiMnCo) O2 Electrodes for Lithium-Ion Batteries. J. Electrochem. Soc. 2016, 163, A19–A26. [Google Scholar] [CrossRef]
  21. Frankenberger, M.; Singh, M.; Dinter, A.; Jankowksy, S.; Schmidt, A.; Pettinger, K.-H. Laminated Lithium Ion Batteries with improved fast charging capability. J. Electroanal. Chem. 2019, 837, 151–158. [Google Scholar] [CrossRef]
  22. Zheng, H.; Tan, L.; Liu, G.; Song, X.; Battaglia, V.S. Calendering effects on the physical and electrochemical properties of Li[Ni1/3Mn1/3Co1/3]O2 cathode. J. Power Sources 2012, 208, 52–57. [Google Scholar] [CrossRef]
  23. Pettinger, K.-H. Fertigungsprozesse von Lithium-Ionen-Zellen. In Handbuch Lithium-Ionen-Batterien; Korthauer, R., Ed.; Springer: Heidelberg/Berlin, Germany, 2013; ISBN 978-3-642-30652-5. [Google Scholar]
  24. Meyerson, M.L.; Sheavly, J.K.; Dolocan, A.; Griffin, M.P.; Pandit, A.H.; Rodriguez, R.; Stephens, R.M.; Bout, D.A.V.; Heller, A.; Mullins, C.B.; et al. The effect of local lithium surface chemistry and topography on solid electrolyte interphase composition and dendrite nucleation. J. Mater. Chem. A 2019, 7, 14882–14894. [Google Scholar] [CrossRef]
  25. Gu, Y.; Wang, W.-W.; Li, Y.-J.; Wu, Q.-H.; Tang, S.; Yan, J.-W.; Zheng, M.-S.; Wu, D.-Y.; Fan, C.-H.; Hu, W.-Q.; et al. Designable ultra-smooth ultra-thin solid-electrolyte interphases of three alkali metal anodes. Nat. Commun. 2018, 9, 1339. [Google Scholar] [CrossRef] [PubMed]
  26. Muller, S.; Eller, J.; Ebner, M.; Burns, C.; Dahn, J.; Wood, V. Quantifying Inhomogeneity of Lithium Ion Battery Electrodes and Its Influence on Electrochemical Performance. J. Electrochem. Soc. 2018, 165, A339–A344. [Google Scholar] [CrossRef]
  27. Song, J.; Lee, H.; Wang, Y.; Wan, C. Two- and three-electrode impedance spectroscopy of lithium-ion batteries. J. Power Sources 2002, 111, 255–267. [Google Scholar] [CrossRef]
  28. Solchenbach, S.; Pritzl, D.; Kong, E.J.Y.; Landesfeind, J.; Gasteiger, H.A. A Gold Micro-Reference Electrode for Impedance and Potential Measurements in Lithium Ion Batteries. J. Electrochem. Soc. 2016, 163, A2265–A2272. [Google Scholar] [CrossRef]
  29. Liu, G.; Zheng, H.; Kim, S.; Deng, Y.; Minor, A.M.; Song, X.; Battaglia, V.S. Effects of Various Conductive Additive and Polymeric Binder Contents on the Performance of a Lithium-Ion Composite Cathode. J. Electrochem. Soc. 2008, 155, A887–A892. [Google Scholar] [CrossRef]
  30. Gordon, I.J.; Grugeon, S.; Takenouti, H.; Tribollet, B.; Armand, M.; Davoisne, C.; Débart, A.; Laruelle, S. Electrochemical Impedance Spectroscopy response study of a commercial graphite-based negative electrode for Li-ion batteries as function of the cell state of charge and ageing. Electrochim. Acta 2017, 223, 63–73. [Google Scholar] [CrossRef]
  31. Gordon, I.J.; Grugeon, S.; Debart, A.; Pascaly, G.; Laruelle, S. Electrode contributions to the impedance of a high-energy density Li-ion cell designed for EV applications. Solid State Ion. 2013, 237, 50–55. [Google Scholar] [CrossRef]
  32. Momma, T.; Matsunaga, M.; Mukoyama, D.; Osaka, T. Ac impedance analysis of lithium ion battery under temperature control. J. Power Sources 2012, 216, 304–307. [Google Scholar] [CrossRef]
  33. Stroe, D.I.; Swierczynski, M.; Stan, A.I.; Knap, V.; Teodorescu, R.; Andreasen, S.J. Diagnosis of lithium-ion batteries state-of-health based on electrochemical impedance spectroscopy technique. In Proceedings of the 2014 IEEE Energy Conversion Congress and Exposition (ECCE), Pittsburgh, PA, USA, 14–18 September 2014; Institute of Electrical and Electronics Engineers, Ed.; IEEE: Piscataway, NJ, USA, 2014; pp. 4576–4582, ISBN 978-1-4799-5776-7. [Google Scholar]
  34. Gaberšček, M.; Moskon, J.; Erjavec, B.; Dominko, R.; Jamnik, J. The Importance of Interphase Contacts in Li Ion Electrodes: The Meaning of the High-Frequency Impedance Arc. Electrochem. Solid-State Lett. 2008, 11, A170–A174. [Google Scholar] [CrossRef]
  35. Jossen, A.; Weydanz, W. Moderne Akkumulatoren, 2nd ed.; CUVILLIER VERLAG: Göttingen, Germany, 2019; ISBN 978-3-7369-9945-9. [Google Scholar]
  36. Dollé, M.; Orsini, F.; Gozdz, A.S.; Tarascon, J.-M. Development of Reliable Three-Electrode Impedance Measurements in Plastic Li-Ion Batteries. J. Electrochem. Soc. 2001, 148, A851–A857. [Google Scholar] [CrossRef]
  37. Waag, W.; Käbitz, S.; Sauer, D.U. Experimental investigation of the lithium-ion battery impedance characteristic at various conditions and aging states and its influence on the application. Appl. Energy 2013, 102, 885–897. [Google Scholar] [CrossRef]
  38. Levi, M.D.; Dargel, V.; Shilina, Y.; Aurbach, D.; Halalay, I.C. Impedance Spectra of Energy-Storage Electrodes Obtained with Commercial Three-Electrode Cells: Some Sources of Measurement Artefacts. Electrochim. Acta 2014, 149, 126–135. [Google Scholar] [CrossRef]
  39. Pritzl, D.; Landesfeind, J.; Solchenbach, S.; Gasteiger, H.A. An Analysis Protocol for Three-Electrode Li-Ion Battery Impedance Spectra: Part II. Analysis of a Graphite Anode Cycled vs. LNMO. J. Electrochem. Soc. 2018, 165, A2145–A2153. [Google Scholar] [CrossRef] [Green Version]
  40. Landesfeind, J.; Pritzl, D.; Gasteiger, H.A. An Analysis Protocol for Three-Electrode Li-Ion Battery Impedance Spectra: Part I. Analysis of a High-Voltage Positive Electrode. J. Electrochem. Soc. 2017, 164, A1773–A1783. [Google Scholar] [CrossRef]
  41. Ovejas, V.J.; Cuadras, A. Impedance Characterization of an LCO-NMC/Graphite Cell: Ohmic Conduction, SEI Transport and Charge-Transfer Phenomenon. Batteries 2018, 4, 43. [Google Scholar] [CrossRef] [Green Version]
  42. Huang, J.; Li, Z.; Zhang, J.; Song, S.; Lou, Z.; Wu, N. An Analytical Three-Scale Impedance Model for Porous Electrode with Agglomerates in Lithium-Ion Batteries. J. Electrochem. Soc. 2015, 162, A585–A595. [Google Scholar] [CrossRef] [Green Version]
Figure 1. Impedance measurements of laminated/partially laminated/non-laminated cells: EIS (100 kHz–10 mHz) along charging step, 6th cycle; fitting curves indicated as solid lines; data points at 103 Hz and 10−1 Hz highlighted in pale blue.
Batteries 05 00071 g001
Figure 2. Equivalent circuit model used for EIS fit analysis.
Batteries 05 00071 g002
Figure 3. EIS capacitance fit parameters of laminated/partially laminated/non-laminated cells along charging step, sixth cycle; data normalized to geometric electrode area.
Batteries 05 00071 g003
Figure 4. EIS resistance fit parameters of laminated/partially laminated/non-laminated cells along charging step, sixth cycle; data normalized to geometric electrode area.
Batteries 05 00071 g004
Figure 5. Discharge capacity data of laminated/partially laminated/non-laminated cells in fast-charging cycle test; charge at 5 C CCCV mode, discharge at 1 C CC mode.
Batteries 05 00071 g005
Figure 6. Impedance measurements of laminated/partially laminated/non-laminated cells: EIS (100 kHz–10 mHz) along fast-charging cycles; fitting curves indicated as solid lines; data points at 103 Hz and 10−1 Hz highlighted in pale blue.
Batteries 05 00071 g006
Figure 7. EIS resistance fit parameters of laminated and non-laminated single cells along fast-charging cycles; data normalized to geometric electrode area.
Batteries 05 00071 g007
Figure 8. Decrease of discharge capacity vs. increase of surface resistance of laminated and cathode-laminated single cells along fast-charging cycles.
Batteries 05 00071 g008
Table 1. Capacity fade of laminated/partially laminated/non-laminated cells in the fast-charging cycle test.
Cycle NumberLaminatedAnode-LaminatedCathode-LaminatedNon-Laminated
9133.2 mAh∙g−1129.6 mAh∙g−1133.4 mAh∙g−1133.0 mAh∙g−1
1508112.5 mAh∙g−1111.4 mAh∙g−199.3 mAh∙g−1100.4 mAh∙g−1

