1. Introduction
Among the currently used positive electrode (cathode) materials for lithium-ion batteries (LIBs), the layered oxides LiNi
xMn
yCo
zO
2 (x + y + z = 1, also designated as NMCXYZ, where X:Y:Z is the molar ratio of Ni, Mn, and Co) offer superior electrochemical capacities compared to conventional LiCoO
2 (~140 mAh/g), LiMn
2O
4 (~120 mAh/g) and LiFePO
4 (~160 mAh/g). NMCs with high nickel content (x > 0.6, Ni-rich NMCs) provide a high specific capacity of up to 220 mAh/g at a high working voltage (~3.6–3.8 V), being commonly regarded as the most promising for automotive LIBs [
1,
2]. Besides gravimetric energy density, the volumetric energy density of Ni-rich NMCs is another important parameter for practical applications, but here Ni-rich NMCs demonstrate certain deficiencies because of relatively low values of tap density. For instance, NMC811 cathode materials obtained via a co-precipitation method as the most preferred method for commercial production of NMC, consist of spherical secondary particles. Such polycrystalline materials are characterized by a limited tap density of 2.20–2.45 g/cm
3, corresponding to a volumetric energy density of 1700 mWh/cm
3, which is relatively low for providing suitable mileage of electric vehicles while keeping acceptable size and mass of the battery [
3,
4]. Several attempts have been incorporated to achieve enhanced tap density values by variation of co-precipitation synthesis conditions, including pH [
5], temperature [
6], and the molar ratio of TM and complexing agent [
6]. Apart from this, the shape [
7] and sizes of the secondary particles [
8] were tuned to obtain Ni-rich NMCs with proper tap density. Despite some progress, the ultimate values of tap density are already attained.
The most facile way to increase the tap density of Ni-rich NMCs is to fill the voids between closely-packed spherical secondary particles. Such a method was suggested in Ref. [
9] and is considered to be commercially prospective. However, obtaining two or three fractions of materials with different sizes by co-precipitation technique makes the cathode materials fabrication time-consuming and, therefore, more expensive. To enhance the energy- and resource efficiency of synthesis, a microwave-assisted hydrothermal route for preparing the Ni-rich hydroxide precursors is an attractive approach to produce a submicron-sized NMC fraction. Unlike the co-precipitation method, the microwave-assisted hydrothermal route does not require the continuous control of such synthesis parameters as pH, stirring rate, feeding rate of reagents, etc. This, in turn, relaxes the requirements of the equipment and reduces the materials production costs. Moreover, microwave radiation, transferring energy directly to the reacting species, can shorten the synthesis procedure from dozens of hours to several minutes, making this method one of the most energy- and cost-effective [
10,
11,
12,
13].
Herein, we report a strategy to prepare the mixed hydroxide Ni0.8Mn0.1Co0.1(OH)2 precursor via the microwave-assisted hydrothermal method based on inexpensive and readily available raw reagents. Furthermore, we demonstrate the utilization of the prepared NMC811 cathode material as a space filler for ~30% improvement of volumetric energy density by properly mixing it with the material obtained through the conventional co-precipitation route.
2. Results and Discussion
A series of mixed hydroxide Ni
0.8Mn
0.1Co
0.1(OH)
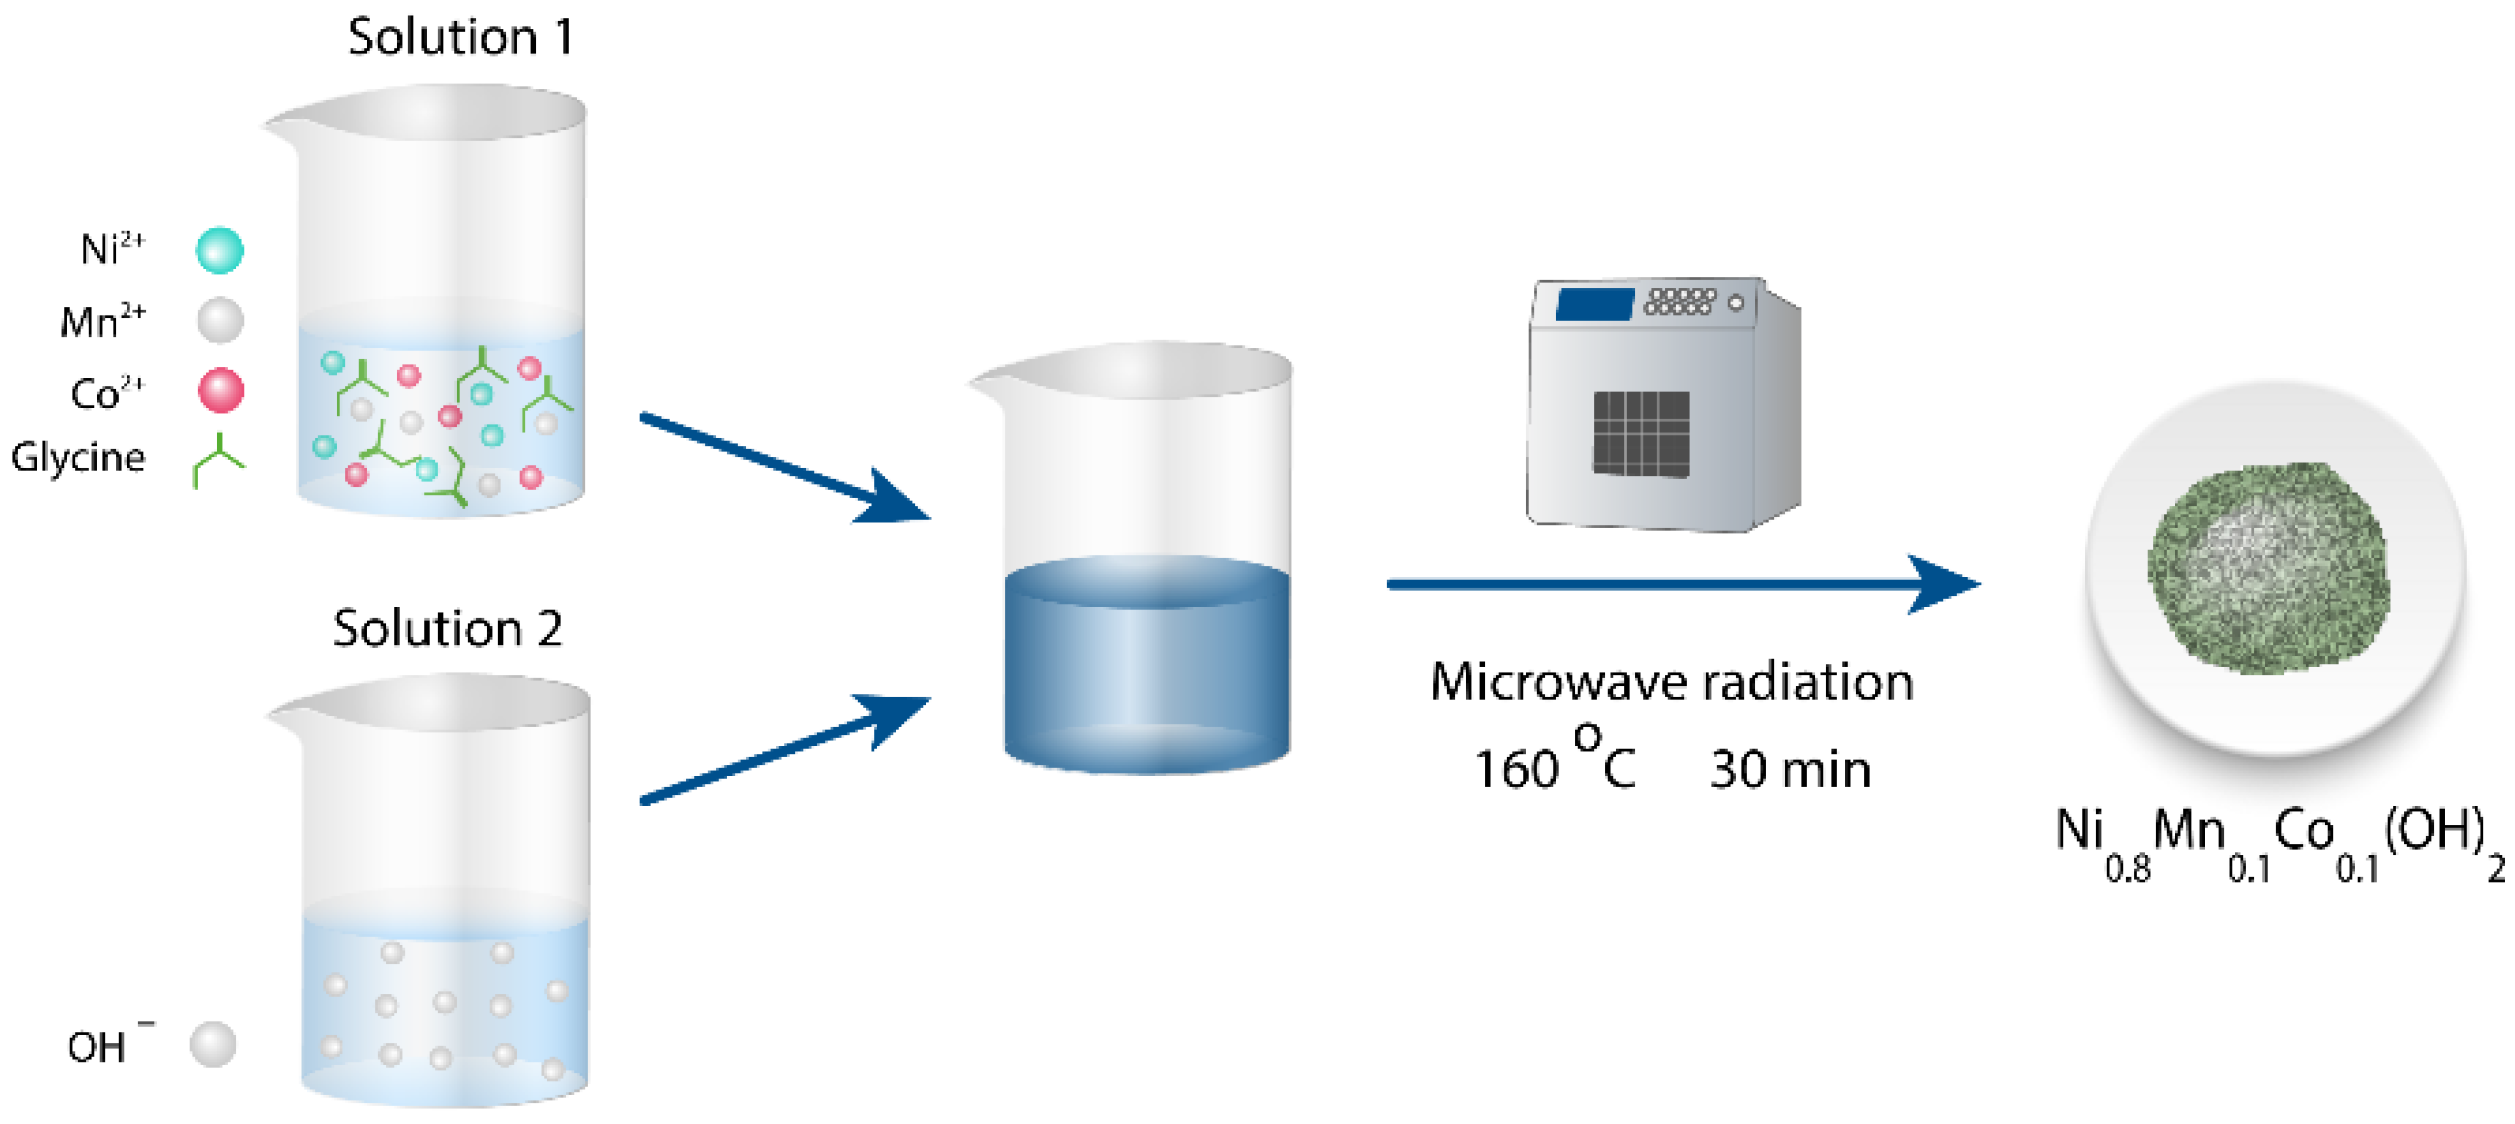
2 precursors was prepared via a microwave-assisted hydrothermal synthesis according to the scheme presented in
Figure 1.
An aqueous solution of transition metal (TM) sulfates taken in an appropriate molar ratio and glycine as a complexing agent was mixed with a solution of sodium hydroxide, transferred to a Teflon reactor for microwave-assisted hydrothermal synthesis, and treated at 160 °C for 15–60 min to obtain the mixed hydroxide precursor (see details in Materials and Methods). The role of glycine as a complexing agent has been demonstrated before in hydrothermal synthesis of β-Ni(OH)
2, where it prevents immediate precipitation of nickel(II) hydroxide when sodium hydroxide solution is added into the reaction mixture [
14,
15,
16]. However, in contrast to the precipitation of β-Ni(OH)
2, the synthesis of the mixed hydroxide Ni
0.8Mn
0.1Co
0.1(OH)
2 precursor with homogeneous TM distribution and desired composition requires the simultaneous formation of stable Ni(II), Mn(II) and Co(II) complexes with glycine in the initial solution. Therefore, the influence of TM:Gly and TM:NaOH molar ratios on the cation composition and homogeneity of TM spatial distribution in the hydroxide precursors obtained through the microwave-assisted hydrothermal technique was investigated. According to STEM-EDX, the TM:Gly ratio of 1:13.35 and TM:NaOH ratio of 1:25 were found to be optimal, providing a precipitated product with stoichiometry close to NMC811 with homogeneous TM distribution. Decreasing the TM:Gly molar ratio to 1:12.35 results in Mn and Co segregation (
Figure S1), whereas further increase of the glycine content (TM:Gly > 1:13.35) is limited by its solubility in water (25 g/100 mL at 25 °C) [
17]. The excessive amount of NaOH (TM:NaOH = 1:25) is required not only for co-precipitation of the hydroxide precursor but also for sustaining alkali conditions (pH > 11) [
14]. Lower TM:NaOH molar ratio (1:20) results in a formation of Ni
0.8Mn
0.1Co
0.1(OH)
2 consisting of small (150–200 nm) poorly agglomerated primary particles (
Figure S2), while the deep blue color of the supernatant manifests incomplete precipitation. Since the TM:Gly and TM:NaOH molar ratios were optimized, the influence of treatment time on the precursor morphology and electrochemical performance of the final cathode material was investigated. The obtained precursors are labeled as MW_15 m, MW_30m and MW_60m, where the numbers indicate the duration of the microwave hydrothermal treatment in minutes.
According to powder X-ray diffraction (XRD) analysis, all the precursors crystallize in the trigonal β-Ni(OH)
2 crystal structure (sp.gr.
Pm1) with similar unit cell parameters (
a = 3.130(1) Å,
c = 4.617(1) Å for the MW_30m sample). No admixture peaks were observed (
Figure 2 and
Figure S3). According to STEM-EDX analysis, all precursors possess homogeneous distribution of Ni, Mn, and Co (
Figure 3 and
Figure S4) and the desired TM cation ratio (
Table S1). To sum up, a combination of powder XRD (
Figure 2 and
Figure S3) and STEM-EDX (
Figure 3 and
Figure S4) data indicates that variation of the hydrothermal treatment time does not impact phase purity, composition and TM distribution of the obtained precursors. Contrarily, the morphology of the precursors clearly depends on the microwave hydrothermal treatment duration (
Figure 4). The mixed hydroxides consist of flower-shaped agglomerates of flake-like primary particles. Enhancement of the hydrothermal treatment time increases the average size of the primary particles from 400 nm to 600 nm and 800 nm for the MW_15m, MW_30m, and MW_60m samples, respectively.
The obtained precursors were sintered with LiOH∙H
2O in flowing oxygen to prepare the final NMC811 cathode materials MW_15m_A, MW_30m_A, and MW_60m_A. According to powder XRD data, all NMC811 samples are single-phase compounds crystallized in the layered α-NaFeO
2-type structure (sp. gr.
Rm). Moreover, a distinct splitting of the (006)/(012) and (108)/(110) peaks indicates a formation of the highly-ordered layered hexagonal structure (
Figure 5 and
Figure S5) [
18]. The unit cell parameters and the degree of Ni
2+/Li
+ disorder, originated from partial exchange of the Li
+ (r
IV = 0.76 Å) and Ni
2+(r
IV = 0.69 Å) cations between the 3
b (i.e., Li) and 3
a (i.e., Ni) sites were calculated for all samples using Rietveld refinement from powder XRD data (
Table 1) [
19]. The experimental, calculated and difference XRD patterns are shown in
Figure 5. All the samples exhibit low cation disorder comparable for both microwave hydrothermal (MW) and co-precipitation (CP) synthesis techniques (
Table 1). Similar values suggest that the synthetic route, as well as treatment time, negligibly impact the crystal structure of the final NMC811 materials.
According to STEM-EDX analysis, all NMC811 materials, regardless of the synthesis conditions, demonstrate uniform Ni, Mn, and Co distribution (
Figure 6 and
Figure S6). The Li content in all samples was measured by ICP-MS and the transition metal content was assessed by EDX analysis. The cationic composition in all samples is in good accordance with the desired stoichiometry (
Table 2).
Additionally, the local structure of the NMC811 samples was investigated by high-resolution HAADF-STEM imaging and selected area electron diffraction (SAED) (
Figure 7). All reflections in the SAED patterns can be indexed in the rhombohedral
Rm structure with the unit cell parameters
a ≈ 2.9 Å,
c ≈ 14.2 Å, in good agreement with the powder XRD data (
Table 1). The well-established layered structure can be recognized in the HAADF-STEM images as rows of bright dots corresponding to the TM atomic columns. The TM layers alternate along the
c-axis with dark gaps, which are the Li layers. The O3 stacking sequence manifests itself as a lateral shift of every next TM layer over ⅓ of the interdot distance. Slight HAADF intensity observed at the Li layers proves that Li/TM disordering is small, corroborating the Rietveld refinement results.
The annealed MW samples consist of irregularly-shaped agglomerates composed of primary particles (
Figure 8) with an average size of 250, 400, and 500 nm for the MW_15m_A, MW_30m_A, and MW_60m_A samples, respectively (
Figure S7). The increase of the primary particle size follows the particle size variation in the corresponding precursors.
NMC811 material obtained via the conventional co-precipitation route (CP_A) is single-phase and crystallizes in the layered α-NaFeO
2 structure type (sp. gr.
Rm) (
Figure 5) with a low degree of anti-site disordering (2.42(5)% of Ni
2+ in 3
a site). The homogeneous distribution of Ni, Mn, and Co and chemical composition were confirmed by STEM-EDX (
Figure S8). The co-precipitated NMC811 sample is formed by roundish agglomerates with a size of ~8–12 μm consisting of rectangular primary particles of 350 nm (
Figure S9).
The electrochemical performance of the NMC811 materials was investigated using galvanostatic cycling, and their specific discharge capacity plots are given in
Figure 9. The MW and CP samples demonstrate similar electrochemical performance (
Table 3), still, the maximum discharge capacity of 203 mAh/g and maximum capacity retention of 73% after 300 charge/discharge cycles at 1C current density is achieved in the MW_30m_A sample.
To evaluate the processes taking place during Li (de)intercalation in NMC811, differential capacity (dQ/dV) profiles were plotted for all the obtained materials (
Figure S10). The NMC811 samples undergo a series of phase transitions during charge/discharge, as corroborated by the several oxidation peaks denoted in
Figure S10: hexagonal-to-monoclinic (H1→M), monoclinic-to-hexagonal (M→H2) and hexagonal-to-hexagonal (H2→H3) [
21]. The H2→H3 transformation at a high delithiation degree is believed to have the most substantial negative effect on the cycling stability of NMC811, as it is accompanied by anisotropic volume change that destabilizes the mechanical integrity of the cathode particles and accelerates capacity fading [
22,
23,
24,
25,
26,
27]. The intensity of the H2→H3 cathodic peak for the MW_60m_A material markedly dropped after 100 cycles at 1C (
Figure S10c), indicating poor reversibility of the H2→H3 phase transformation considered as a source of severe structural collapse affected by mechanical strain [
28]. Oppositely, other materials maintain the H2→H3 peaks over 100 cycles (
Figure S10a,b), confirming the remarkable reversibility of the H2→H3 transition.
An additional comparative SEM study of the as-prepared and cycled 330 times electrodes (
Figure 10 and
Figure S11) was performed to reveal the influence of prolonged cycling on the microstructure of electrode materials. While the crystallites of the active material in MW_15m_A and MW_30m_A electrodes retain their integrity after cycling (
Figure S11c,d), microcracks across the cathode primary particles are observed in the cycled MW_60m_A-based cathode (
Figure 10b). The particle size distributions for MW_15m_A and MW_30m_A after cycling remain similar to those in the pristine materials, while for MW_60m_A the average particle size decreases dramatically from ~500 nm to around 250–300 nm (
Figure S12) due to cracking upon multiple cycles. These detrimental effects are associated with mechanical stresses induced by repetitive volume expansion and contraction of the particles during electrochemical cycling. As seen in
Figure S7, the broadest particle size distribution was observed for the MW_60m_A sample. It may result in uneven charging of particles of different sizes and finally promote the structural collapse of the biggest ones [
29]. Hence, we considered the prolonged microwave treatment as not favorable for obtaining the particles with a sufficiently narrow size distribution that compromises the capacity retention.
The SEM images demonstrate that the NMC811 samples prepared via microwave-assisted hydrothermal route consist of poorly agglomerated particles of a several times smaller size than the agglomerates in the CP-prepared material. These observations were also supported by BET-specific surface areas for the MW_30m_A sample with the best electrochemical performance and for the co-precipitated reference material. Predictably, the specific surface area for MW_30m_A is higher than that for the CP_A sample (0.99 vs. 0.60 m
2/g, respectively). As a result, the as-prepared MW_30m_A material demonstrates a lower tap density of 1.7 g/cm
3 compared to the CP_A sample with a tap density of 2.3 g/cm
3. On the one hand, it leads to lower volumetric energy density for MW_30m_A which calls for further development of annealing with sintering additives [
30]. On the other hand, it has been reported previously for NMC532 [
9] that tap density can be improved by mixing materials with different particle size distributions in an optimal mass ratio. Random packing of equal spheres achieved by the tapping method results in an average space filling of 64% [
31]. Adding a fraction with a smaller particle size allows for filling the voids between the spheres and, therefore, improves the tap density. Thus, to get the NMC811 material with the best tap density, we mixed the spherical agglomerates of the CP_A powder with the MW_30m_A sample consisting of small 200–700 nm crystallites. The optimal mass ratio between CP_A and MW_30m_A samples was found to be 7:3 (the sample is denoted as CP7_MW3), which raised the tap density of the resulting NMC811 by 30% to 2.9 g/cm
3 from 2.3 g/cm
3 for the pure CP_A powder (
Figure 11). When the mass fraction of MW_30m_A exceeds 30%, the tap density starts to decrease because all the voids between CP_A spheres are filled, and now the space between the MW_30m_A particles contributes to enhancing the total unoccupied volume.
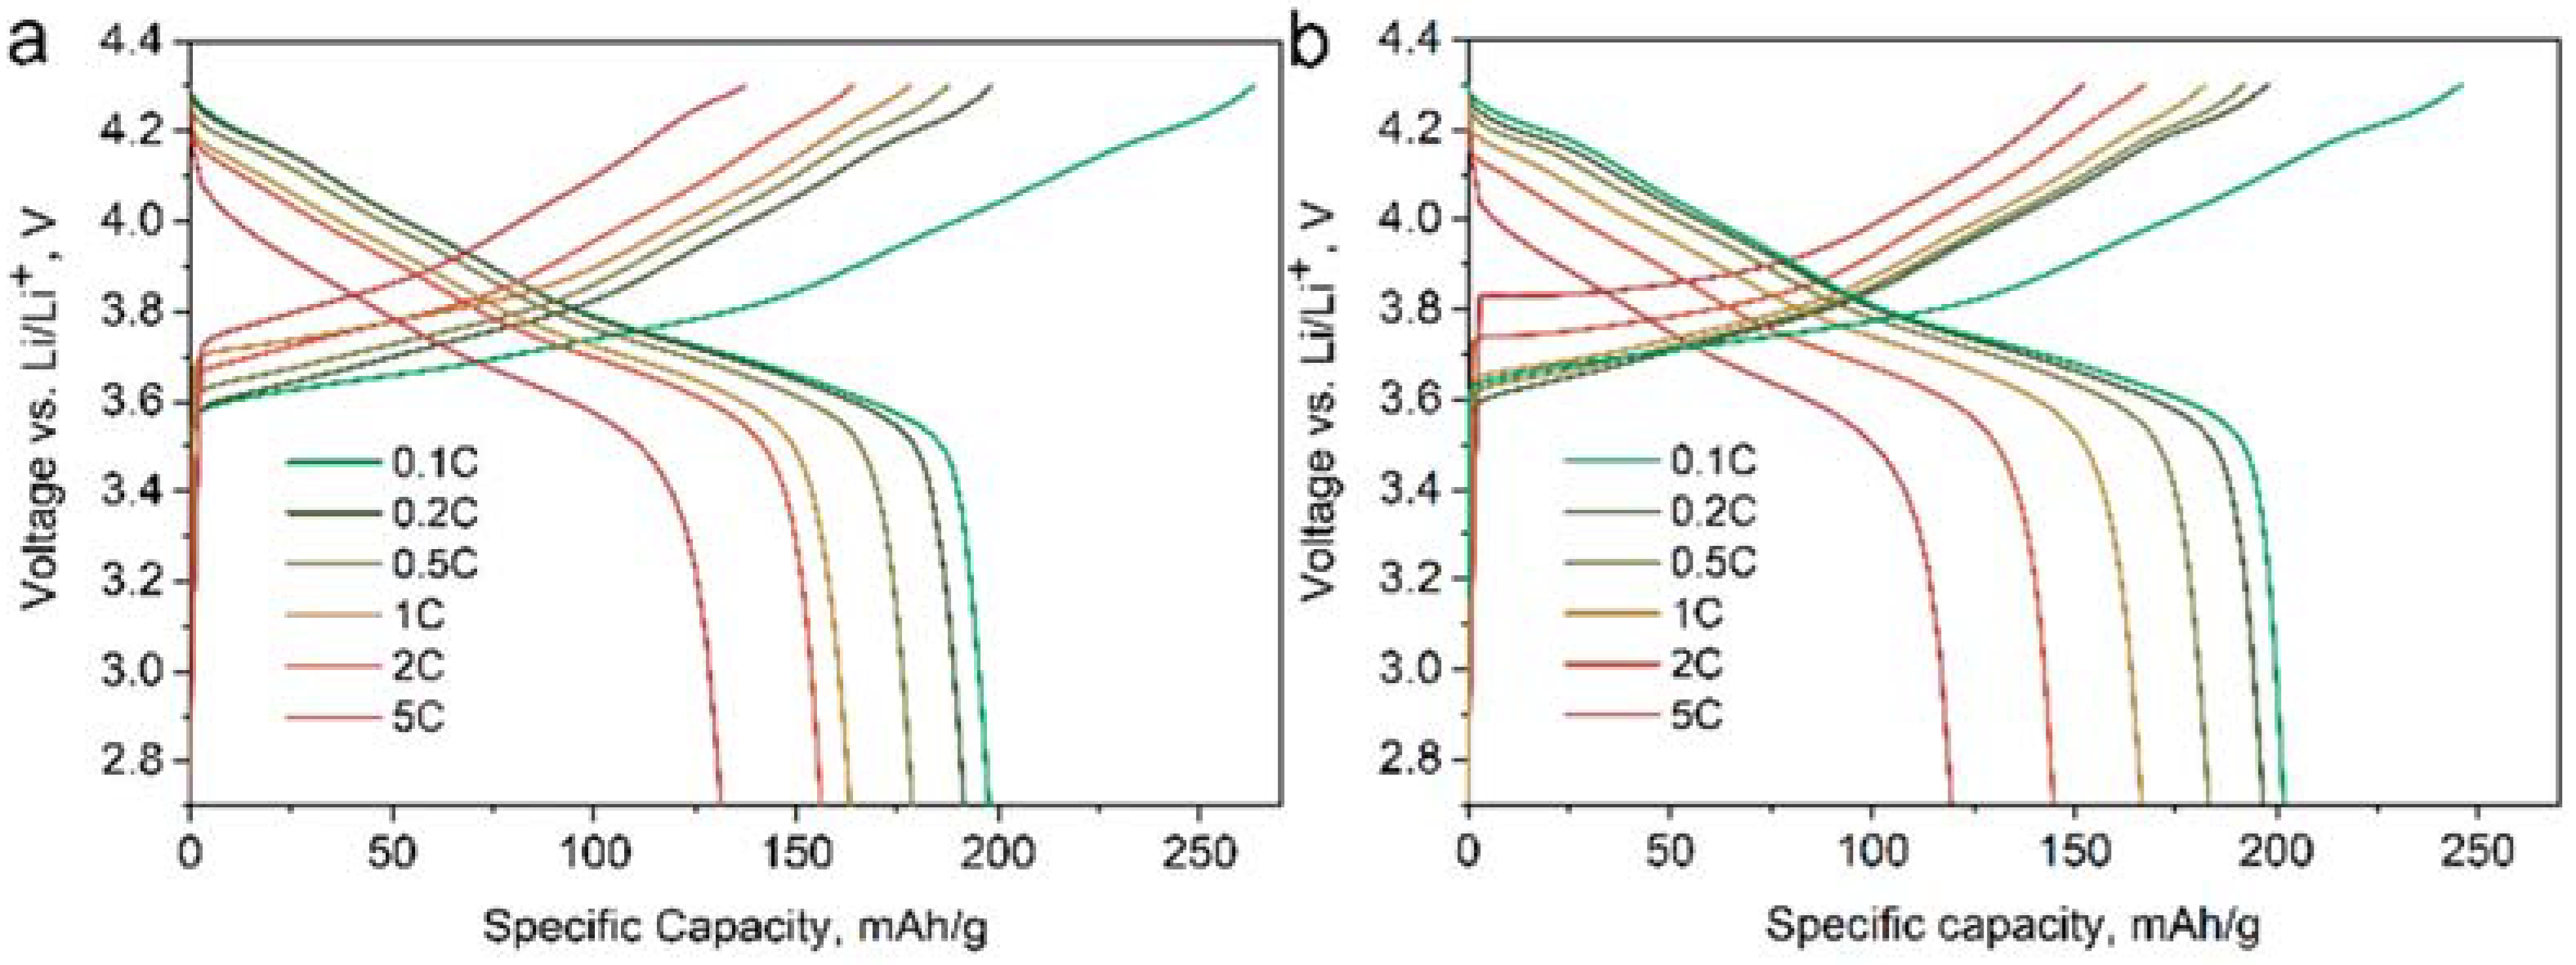
The electrochemical performance of the CP7_MW3 material was studied in both half- and full-cell configurations and compared to that of the CP_A sample. The mixed CP7_MW3 material demonstrates very similar to CP_A reversible discharge capacity at low current density but slightly lower capacity at high current density, i.e., 144 mAh/g and 120 mAh/g at 2C and 5C, respectively (
Figure 12). In turn, capacity retention for CP7_MW3 of 85% and 78% after 200 and 300 cycles at 1C (
Figure S13) noticeably exceeds the corresponding values of 77% and 69% for CP_A (
Table 3) because of the addition of more electrochemically stable MW_30m_A particles giving a decent trade-off between the electrochemical cycling stability and tap density of the resulting cathode material. However, in full cells, the difference in capacity retention of the CP7_MW3 and CP_A samples becomes less pronounced. Both materials demonstrate capacity retention of 88–90% after 300 cycles at 1C (
Figure 13). Nevertheless, due to increased tap density, the volumetric energy density was calculated to exceed 2100 mWh/cm
3, while for the CP_A sample, it reached only 1690 mWh/cm
3 (
Table 4).
To obtain a deeper insight into the electrochemical performance of prepared NMCs, electrochemical impedance spectroscopy (EIS) study has been carried out. The typical Nyquist plot for Li battery with Ni-rich NMC cathode material includes contributions from the electrolyte solution resistance (R
sol), interface resistance and capacitance (R
SEI and C
SEI), charge transfer resistance (R
ct), double layer capacitance (C
dl) and diffusion elements. The Nyquist plots of the CP7_MW3, MW_30m_A, and CP_A materials charged up to 3.7 V are presented in
Figure 14. All spectra include two semicircles in high- and low-frequency regions. High surface resistances are observed for the mixed CP7_MW3 (34.33 Ω) and microwave-prepared MW_30m_A (29.49 Ω) samples, while co-precipitation provides the material CP_A with the smallest R
SEI (14.22 Ω) indicating thinner passivation film accumulated on the electrode surface. This is in good agreement with the morphology of the CP7_MW3 and MW_30m_A samples: non-agglomerated particles, having higher surface area, are expected to increase interfacial resistance due to the increased number of contacts between the particles. At the same time, the CP_A sample demonstrates the highest charge transfer resistance R
ct (85.82 Ω), whereas CP7_MW3 and MW_30m_A are characterized by R
ct of 67.89 Ω and 48.18 Ω, respectively. In this sense, the trade-off between R
ct and R
SEI results (
Table S2) in similar rate performance of CP7_MW3, MW_30m_A, and CP_A samples.
3. Materials and Methods
Stoichiometric amounts (Ni:Mn:Co = 8:1:1) of NiSO
4∙6H
2O, MnSO
4∙H
2O, CoSO
4∙7H
2O (Alfa Aesar, ≥99%) were dissolved in 30 mL of deionized water with the resulting TM solution concentration of 0.20 mol/L. Glycine (Ruskhim) as a complexing agent was added to the TM solution with TM:Gly = 1:13.35 molar ratio, and the solution was stirred at room temperature for 10–20 min to obtain a transparent green solution (designated as Solution 1 in
Figure 1), corresponding to the water-soluble TM complexes with glycine. Afterwards, the preliminary prepared 10 mL of 15 mol/L solution of NaOH (Ruskhim, ≥99.9%) as a precipitating agent (Solution 2 in
Figure 1) was added dropwise into Solution 1 under magnetic stirring. Finally, a slurry-like blue precipitate of hydrates of disodium bis-glycylglycine complexes of TMs [
32] was formed. The synthesis of the Ni
0.8Mn
0.1Co
0.1(OH)
2 precursor via microwave-assisted hydrothermal technique was conducted using a WX-8000 Microwave Digestion System. For this, a suspension was transferred into an 80 mL Teflon vessel with 50% loading and treated under microwave hydrothermal conditions at 160 °C for 15, 30, and 60 min. The pressure inside the vessel was held at about 6 bar. Then the reactor was cooled to room temperature. The obtained precursors are labeled as MW_15m, MW_30m, and MW_60m. Upscaling of the microwave-assisted hydrothermal synthesis was conducted using the same microwave system and keeping the ratios of the starting reagents and their concentrations, but increasing the number of vessels to 10. The total slurry volume which was treated simultaneously under microwave conditions equals 400 mL. This resulted in a routine preparation of 10 g batches of the single-phase Ni
0.8Mn
0.1Co
0.1(OH)
2 precursor.
The Ni0.8Mn0.1Co0.1(OH)2 precursor was also synthesized via a conventional co-precipitation method. An aqueous solution of TM sulfates with the molar ratio of Ni:Mn:Co = 8:1:1 and a total concentration of 2 mol/L (V1 = 1 L) was slowly pumped into a 5 L continuously stirred batch reactor, which was pre-filled with a certain amount of deionized water and NH3·H2O solution under Ar atmosphere. Simultaneously, an aqueous solution of 4 mol/L (V2 = 300 mL) NaOH and 4 mol/L NH3·H2O were separately pumped into the reactor at a feeding rate of about 5 mL/min as the precipitating and complexing agents, respectively. The continuous stirring was kept at 800 rpm. The reactor temperature was maintained at 50 °C, and pH was fixed to 11.5. After co-precipitation, the resulting reaction mixture was kept at 50 °C under stirring for about 24 h for aging. The co-precipitated sample is designated as CP.
The greenish precursors, obtained with microwave-assisted hydrothermal synthesis and co-precipitation technique, were centrifuged, washed with distilled water several times, and dried at 90 °C for ~12 h under dynamic vacuum. The precursors were then mixed with LiOH∙H2O (Ruskhim) in a molar ratio of 1:1.05, and annealed at 750 °C for 12 h in flowing oxygen to prepare the final LiNi0.8Mn0.1Co0.1O2 (NMC811). The lithiated samples are designated as MW_15m_A, MW_30m_A, MW_60m_A, and CP_A. Mixed materials are designated as CP5_MW5, CP6_MW4, CP7_MW3, and CP8_MW2 where the numbers correspond to the mass ratio of CP_A and MW_30m_A samples.
Powder X-ray diffraction (XRD) data were collected using a Huber G670 Guinier diffractometer (CoK
α1 radiation (λ = 1.78892 Å), curved Ge (111) monochromator, image plate detector). The patterns were measured at ambient temperature with a step of 0.005° within the 4–100° 2θ range and then were fitted through Le Bail and Rietveld methods. The program package JANA2006 [
33] was used for data processing.
Particle morphology and size distribution in the pristine and cycled electrodes were investigated by scanning electron microscopy (SEM) using a ThermoFisher Quattro S microscope.
Selected area electron diffraction (SAED) patterns, high angle annular dark-field scanning transmission electron microscopy (HAADF-STEM) images, and energy-dispersive X-ray spectra in a STEM mode (STEM-EDX) were acquired using an aberration-corrected ThermoFisher Titan Themis Z transmission electron microscope operating at 200 kV and equipped with a Super-X system for EDX analysis. The samples were prepared in the air by crushing the powders with an agate mortar and pestle in ethanol and dropping the suspension onto a carbon film supported by a copper grid.
Nitrogen adsorption analysis of specific surface area was performed with a Quantachrome Instruments NOVA 2000 high-speed surface area analyzer at 77 K. Prior to the measurements, the samples were degassed in a dynamic vacuum for at least 12 h at 300 °C. The specific surface area was calculated using the Brunauer–Emmett–Teller (BET) method from the nitrogen adsorption data in the relative pressure range (P/P0) from 0.045 to 0.233.
The tap density of the materials was determined with a tap density analyzer Quantachrome Autotap. At least 20 g of powder was poured into a 50 mL glass cylinder, and the cylinder was tapped 3000 times before measuring the sample volume.
The total Li content in the NMC811 samples was determined by mass-spectrometry with inductively coupled plasma (ICP-MS) using a Perkin-Elmer ELAN DRC-II mass-spectrometer. Aqueous solutions for the analysis were prepared by dissolving ~17.5 mg of the NMC811 powders in 1–2 mL of concentrated HNO3 and HCl (1:3 vol. ratio) with subsequent dilution to 250 mL with deionized water. The standard calibration solutions were prepared by dissolving corresponding amounts of Li2SO4 (Sigma-Aldrich, 99.99%) in deionized water to obtain solutions with concentrations ranging from 2.0 mg/L to 10.0 mg/L.
In order to investigate the electrochemical properties, the NMC811 samples (80 wt.%) were mixed with carbon (Super-P) as a conductive phase (10 wt.%), polyvinylidene fluoride (PVdF) (10 wt.%) as a binder, and N-methyl-2-pyrrolidone (NMP) as a solvent. The active mass loading varies in a range of 2.55 ± 0.2 mg/cm2. The resulting homogeneous slurry was tape-casted onto a carbon-coated Al current collector using an automatic film applicator Zehntner ZAA 2300, dried at 70 °C, and then cut into disks with a diameter of 16 mm. Coin-type half-cells (2032 R) were assembled in an Ar-filled glove box using the electrolyte consisting of 1M LiPF6 (Sigma-Aldrich, 99.99%) solution in ethylene carbonate/propylene carbonate/dimethyl carbonate solution (EC:PC:DMC = 1:1:3 vol. ratio). Galvanostatic tests were performed using a Neware BTS4000-5V10mA Battery Testing System with a lithium foil disc as a counter electrode in the potential range of 2.7–4.3 V at room temperature at different current rates from 0.1C to 5C (1C = 200 mA/g).
Full cells were assembled with the synthesized cathode materials and commercially available Li4Ti5O12 (LTO) as the anode. Cathodes for full cells were prepared similarly to the cathodes for half-cells with the mass loading of 2.4–3.6 mg/cm2. The active LTO anode material (TOB), conductive additive (Super-P), and PVdF binder were suspended in NMP with a weight ratio of 92:3:5 and homogenized to form a slurry. This slurry was applied onto a carbon-coated aluminum current collector using an automatic film applicator Zehntner ZAA 2300, dried, and then cut into 15 mm diameter disks with cathode loading of 3.7–4.4 mg/cm2. 1 M LiPF6 solution in ethylene carbonate/ethyl methyl carbonate solution (EC:EMC = 2:5 by weight) + 2 wt.% of vinylene carbonate was used as an electrolyte. A 3-layer polyethylene/polypropylene/polyethylene (PP/PE/PP) Celgard 2325 polymer film with a thickness of 25 μm was used as a separator. The full cells were assembled in an Ar-filled glove box and rested for 12 h at room temperature to ensure sufficient wetting. As a formation procedure, charging and discharging in a galvanostatic mode at 0.1C, 0.3C, 0.5C, and 1C (3 times) were performed in the potential range of 1.60–2.65 V at room temperature. Capacity retention tests were performed after formation in the same potential range at 1C in the constant current (CC)—constant voltage (CV) charge regime (charge with 1C constant current till 2.65 V with the subsequent charge at the constant voltage at 2.65 V (corresponds to ~4.25 V vs. Li/Li+) till 0.05 C current density) and CC discharge (1C constant current till 1.60 V) at room temperature. Electrochemical impedance spectroscopy (EIS) measurements were performed in a three-electrode cell configuration with lithium metal as a counter and reference electrode. Tests were conducted using a Biologic VMP3 potentiostat in the frequency range from 100 kHz to 10 mHz with the amplitude of AC signal of 5 mV at 3.7 V.


 ,
, 


