Review

Recent Health Diagnosis Methods for Lithium-Ion Batteries

1
Department of Materials and Production, Aalborg University, 9220 Aalborg, Denmark
2
AAU Energy, Aalborg University, 9220 Aalborg, Denmark
*
Authors to whom correspondence should be addressed.
Batteries 2022, 8(7), 72; https://doi.org/10.3390/batteries8070072
Submission received: 14 June 2022 / Revised: 5 July 2022 / Accepted: 13 July 2022 / Published: 15 July 2022
(This article belongs to the Special Issue Lithium-Ion Batteries Aging Mechanisms, 2nd Edition)

Abstract

:
Lithium-ion batteries have good performance and environmentally friendly characteristics, so they have great potential. However, lithium-ion batteries will age to varying degrees during use, and the process is irreversible. There are many aging mechanisms of lithium batteries. In order to better verify the internal changes of lithium batteries when they are aging, post-mortem analysis has been greatly developed. In this article, we summarized the electrical properties analysis and post-mortem analysis of lithium batteries developed in recent years and compared the advantages of varieties of both destructive and non-destructive methods, for example, open-circuit-voltage curve-based analysis, scanning electron microscopy, transmission electron microscopy, atomic force microscopy, X-ray photoelectron spectroscopy and X-ray diffraction. On this basis, new ideas could be proposed for predicting and diagnosing the aging degree of lithium batteries, at the same time, further implementation of these technologies will support battery life control strategies and battery design.

1. Introduction

With the rapid development of green energy solutions, such as electric vehicles (EVs) and renewable power generation, lithium-ion batteries (LIBs) attract a lot of interest these days. Lithium chemistry offers high electrode potential (−3.04 vs. standard hydrogen electrode), low molecular weight and small ionic and atomic radii, ensuring fast diffusion and possibility of intercalation or integration into crystalline lattice of various materials. This helped Li-based batteries to outperform other secondary batteries both in terms of highest power and energy density as well as substantial lifetime [1]. However, uncertainties related to cost, degradation and weak performance in extreme weather conditions slow down large-scale adoption of Li-batteries. In particular, to meet the requirements in electrical vehicle (EV) applications, Li-ion batteries need to exhibit large capacity, stable thermal properties and a long lifetime [2,3,4,5,6,7]. Thus, detailed understanding of Li-ion batteries degradation behavior and mechanisms becomes a focal point of current battery research.
The aging process of a battery can be monitored by performing charging and discharging cycles while measuring the electrochemical characteristics, e.g., impedance and capacity [8,9,10,11,12,13].
For years, the internal physical and chemical reactions of Li-ion batteries were investigated [14]. As accurate and advanced electrochemical analysis devices were invented, people gained a better understanding of the aging processes of different materials and structures the batteries were composed of. To quantify the battery health, the most common indicator or concept, used in the literature, is State-of-Health (SOH). The SOH indicates the specific performance and health status of a battery, at a certain point, compared to the pristine state of the same battery [15]. Although there is no clear definition of the SOH, different parameters of a battery can be used to describe the SOH, such as capacity and impedance, corresponding to the battery’s energy and power, respectively [16]. Then, the diagnosis and estimation of Battery SOH can be promoted to determine battery characteristic parameters. The monitoring gives a measure of SOH which decreases as the battery ages. The decrease in SOH cannot commonly be attributed to a particular physical or chemical mechanism occurring inside the battery, but rather a complicated interplay of various mechanisms [7,17,18,19,20].
With the development of the interdisciplinary approach to battery ageing, in addition to the traditional electrical properties curve-based method, post-mortem analysis has attracted a wide interest for battery SOH estimation and/or diagnostics. With these methods, the battery lifetime and SOH can be deduced from the morphology and composition changes observed in a disassembled cell. This approach can provide understanding of the ageing processes based on the observed chemical and physical changes and link them to changes in electrical characteristics. While several recent reviews have addressed the electrical diagnostics methods, a detailed review of post-mortem analysis methods is missing [21,22].
The present paper summarizes the state-of-the-art methods for evaluating the SOH of lithium-ion batteries and compares common diagnostic methods, on both the electrical and material level, and their interplay as shown in Figure 1. In Table 1, it is shown the comparison of different diagnosis methods. The structure of this review is as follows: Section 2 describes the non-destructive methods, in particular, the curve-based methods, commonly used for electrical property analysis of lithium-ion batteries, and in situ/operando characterization. The working principles of the diagnostic techniques suitable for disassembled cells are described in Section 3. Finally, Section 4 presents an outline of the areas that need to be further investigated and the main conclusions of this study.

2. Electrical Properties Analysis

The state of health (SOH) of Li-ion batteries is usually assessed using two main aspects: the loss of capacity and the increase in impedance. In addition, different kinds of lithium-ion cells can be divided into full cells and half cells. Coin cells are a kind of represented half cells, which can be investigated by a coin cell tester, which are carried out in a climate chamber. Coin cells can also build from full cells to investigate the electrical performance of independent electrodes. The electrodes from full cells could be thoroughly rinsed three times with diethyl carbonate (DEC) to remove the deposition of the electrolyte and Li salt and then be pouched into a specific area to use as the positive electrode as the coin cell.

2.1. Open-Circuit-Voltage (OCV) Curve-Based Analysis

As the voltage of Li-ion batteries is mainly influenced by internal electrochemical reactions and also changes in a variety of aging conditions, many people are trying to employ health indicator (HI) to describe SOH. Thus, much research on SOH estimation is focused on appropriate HIs. In general, two models of the terminal voltage can be established by OCV and polarization voltage, reflecting thermodynamic and kinetic aspects. For OCV, this means measuring the terminal voltage while the battery is in the condition of an open circuit until it reaches the thermodynamic equilibrium state. In addition, the polarization refers to the deviation of the terminal voltage from the OCV. The OCV curve-based methods included two main parts, geometric features and electrical characteristics. It is essential to employ OCV to build a Li-ion batteries voltage model [21,23,24,25,26]. The geometric features-based method is a common way of the diagnostic methods, which can be used to detect aging mechanisms by focusing on OCV variation to realize the estimation of SOH. There are two main aging mechanism identification methods, incremental capacity analysis (ICA) and differential voltage analysis (DVA), and the comparison of these two methods is listed in Table 2 [21,27,28,29].
According to many studies, ICA has been employed to diagnose the battery aging mechanisms [10,30,31,32,33,34,35]. The incremental capacity (IC) curve is calculated by derivation of the voltage curve, which can reflect the electrochemical process in the charging procedure [36,37,38,39,40]. The analysis of the mechanism of battery aging is carried out by the position and shape of the peaks. For example, Yang et al. used IC curves to present the aging mechanisms, which is shown in Figure 2 [41]. Figure 2 shows the change of the IC curve during aging process, resulting from the 0.05 C-rates charging step. Three peaks decrease in the process of aging, which reflects the loss of the active materials (LAM) and loss of lithium inventory (LLI) on the electrode.
The DVA method is also commonly applied in the aging mechanism identification [6,42,43]. Ira et al. found that lithium-capacity-consuming side reactions were mainly occurring at anodes [23].
For coin cells, OCV test are similar to the full cell [37]. Alexander et al. extracted coin cells from commercial Li-ion cells [43]. As the influence of the reassembly of the coin cells was not investigated clearly, they developed a method to compare the different parameters such as washing the electrode or changing the ratio of the electrolyte, which influenced the performance [44,45,46,47,48]. They used a BaSyTec Cell System to realize the formation and the cycling of coin cells. The cycling method of the cells are constant-current-constant-voltage (CCCV) in discharge and constant-current (CC) in discharge process. The open circuit potentials of the coin cells are showed in Figure 3a at begin of life (BOL).
Another study by the same group attempted to relate the characteristic features of interest (FOI) to the evolution of the IC curve and the mechanism of aging [49]. The result of this research also proved that the principle of aging is the same between full cell and coin cell, which attributed to the original cells and the corresponding coin cells exhibited LLI at room temperature while an increasing trend of active materials loss at high temperatures. In Figure 3b,c, the three FOIs are studied for the IC analysis in coin cells. The general trend of the FOIs by the separated aging mechanisms was also discussed by Berecibar et al. [50]. They studied all the curves separately and considered independent parameters and combinations of different parameters. According to their results, LLI and LAM in negative and positive electrodes are exhibited, respectively. The values and the positions of these peaks related to the state-of-health of the Li-ion coin cells as shown in Table 3.

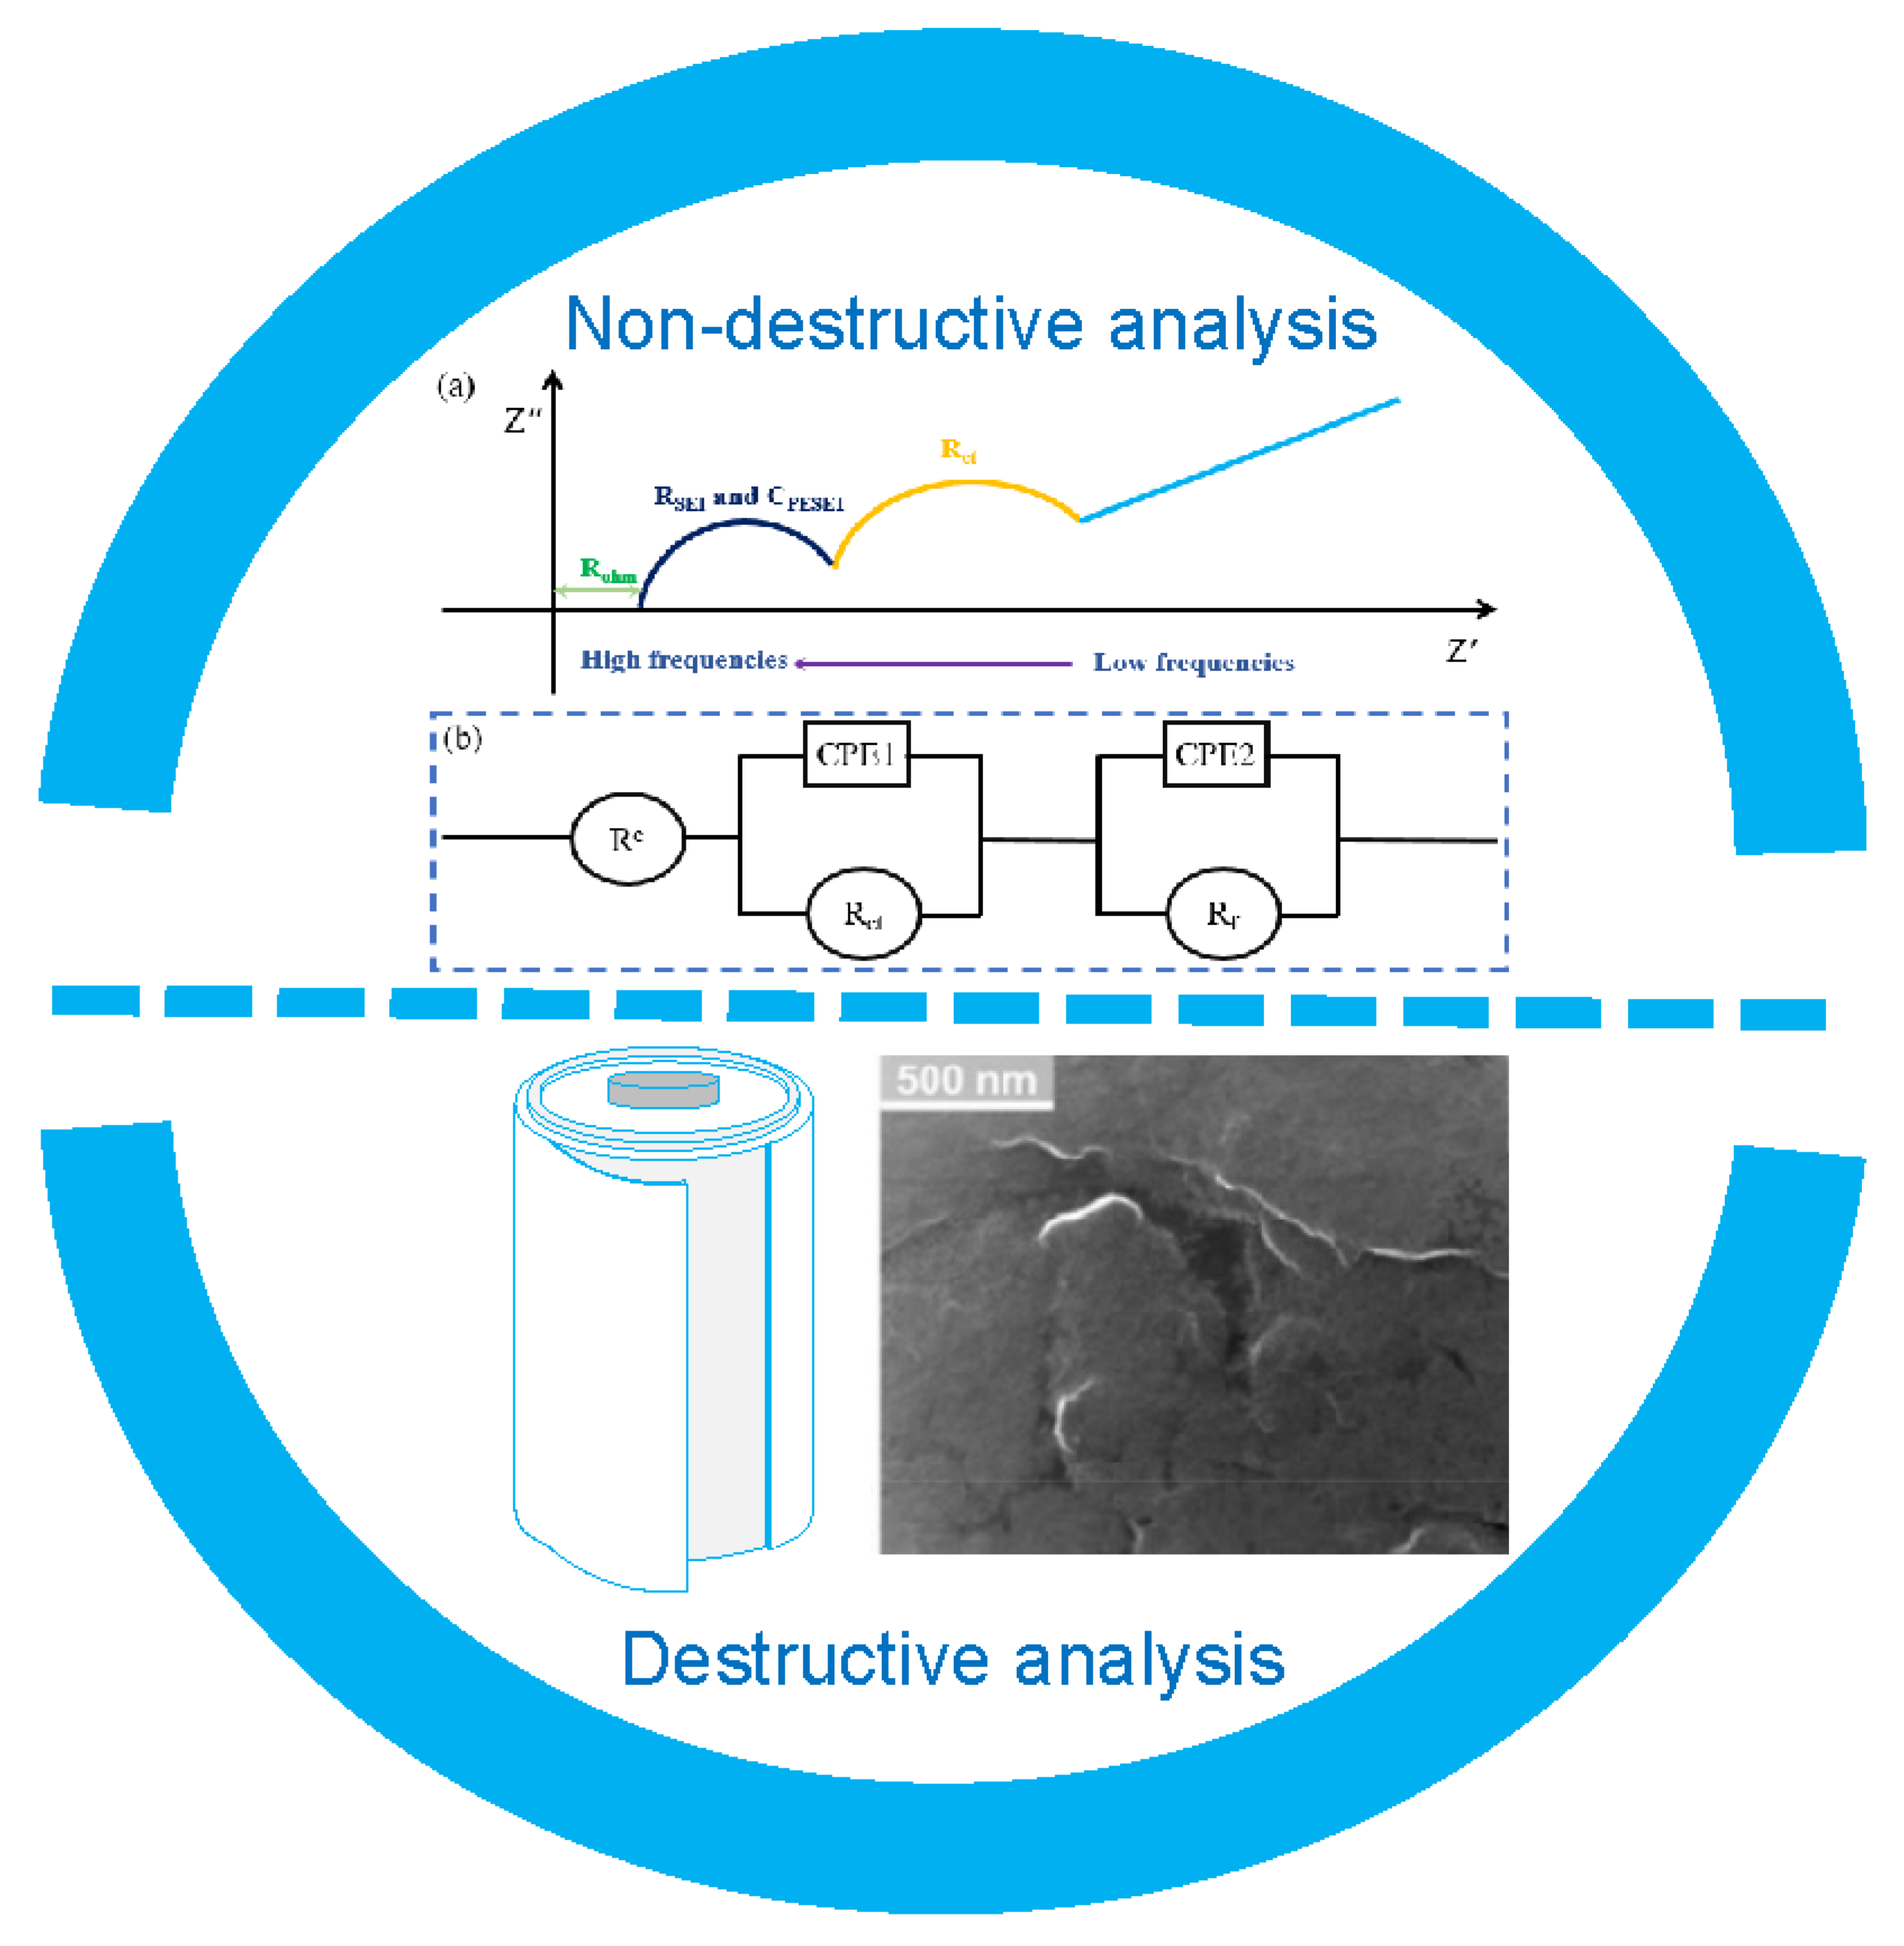
2.2. Electrochemical Impedance Spectrum (EIS) Analysis

Electrochemical Impendence Spectrum (EIS) is a useful method to measure the degradation level and the state-of-health without opening the batteries. The EIS is applied to the open circuit as well as the stable DC polarization electrochemical system.
The EIS result is usually described by Nyquist plot, which involves the imaginary part (y axis) and the real part (x axis) of the impedance of the cells. The internal impedance of a cell is usually defined as a turning point at the low frequency area of EIS in a battery management system [13,51,52]. Fitting the Nyquist plot to the LIB equivalent circuit model allows for the modelling of battery dynamics [53,54,55,56]. Rohm stands for the voltage drops because of the conductivity dropping during aging, such as current collector, binder, electrode and electrolyte electronic particles. Rf stands for Rflim, which refers to passivating film resistance. The process of charge transfer and conduction through the passivation layer should be considered as two sub-circuits consisting of pure resistors and pure capacitor elements in parallel. Considering the complexity of the electrode-solution interface, EIS was deconvoluted to the equivalent circuit shown in Figure 4, where the pure capacitance element was replaced by the constant phase element.
Daniel et al. investigated the amplitude alternating current impedance which was measured at the voltage of 3.72 V in Figure 5. They found that both cathode and anode exhibit capacitive tail frequencies which are higher than 10 kHz, middle frequencies (from 1 kHz to 1 Hz) show a semi-circular arc and a diffusion tail at low frequencies lower than 1 Hz [36]. According to their study, the tail at high frequencies area is the result from the interaction between the impedance analyzer and the electrochemical cell. The depression of the semicircle in the mid frequency range may be due to simultaneous electrochemical reactions on active particles inside the cells.
For coin cell, EIS has proven to be a strong technique for analyzing phenomena in Li-ion battery. EIS spectroscopy in principle allows the separation and quantification of several achievements to the whole cell impedance, such as charge transfer, diffusion, and electrolyte resistance at the solid/electrolyte interface. To separate the influence from anode and cathode, respectively, the reference electrode (RE) is introduced into the cell system, and the impedance is measured between the working electrode (WE) and RE, as well as between the counter electrode (CE) and RE. Locating the RE is not easy because the EIS spectrum is distorted for a particular three-electrode battery configuration and useful analysis of the data is difficult [57,58]. Two models were developed to simulate EIS spectra by Delacourt et al., the 2D mathematical model and the equivalent circuit model of button cell based on the finite-element method (FEM) [57,59]. Most of the simulations were performed using the FEM model, which is easier to be realized. The purpose of the equivalent circuit is to simply elucidate the origin of the impedance distortion effect, while preserving the basic characteristics of the 2D model.
It is worth mentioning that one special parameter of the EIS spectrum of the coin cells from full cells is the reference electrode position. For different locations of RE, the impedance spectra simulated using the FEM model are shown in Figure 6. In Figure 6b, the impedance of WE and CE is tested relative to REideal. In addition, they are also tested when relative to RE, which is shown in Figure 6c. The positioning of REideal follows Newman’s research [60], that is RE should be located between WE and CE and kept far away from the hole in the CE (diaphragm thickness). The impedance spectrum of Figure 6b is very consistent with the theoretical expectation that WE/ideal and CE/ideal spectra are composed of semicircles which exhibited similar resistance and frequency of ~10,000 Hz and ~100 Hz. The position of the two semicircles is at the same high frequency, corresponding to half of the impedance signal value between WE and CE, indicating that the ideal location for RE is located between WE and CE electrodes. The situation is quite different when the spectra and RE are measured (Figure 6c). The CE/RE spectrum consists of two twisted semicircles with characteristic frequencies of about 10,000 and 100 Hz. The semicircle which is located in the high frequency may correspond to the “distortion” of the WE signal. The WE/RE spectrum also includes capacitive contributions at high frequencies (about 10,000 Hz) and “inductive” contributions at low frequencies.
In summary, for full cells, EIS spectrum can provide the equivalent circuit model of the whole circuit. It is more specific when investigating half-cells, the measurements can be achieved for cathode and anode separately, as a result of this, it is easier to distinguish which part of the cells has more influence on the SOH of Li-ion cells.

2.3. Electrochemical Parameter-Based Methods

The electrochemical methods to investigate lithium-ion batteries are mainly divided into the following parameters: the intercalation rate of lithium electrode, the diffusion coefficient in the solid or liquid phase, and the change of resistance in the formation process of solid electrolyte interphase layers (SEI) and so on. [21,22,30,31,61].
Rujian et al. observed that the side reactions and deposits appeared not only on the SEI surface but also between the anode and separator [31]. On the basis of their investigations, they proposed a model to represent Li-ion cells degradation by using the aspects as the following: the volume fraction of the active anode accessible; the resistance of the SEI layers and the deposition layer; the diffusion coefficient of the electrolyte. These characteristic parameters are influenced by real experiments. They concluded that the degradation was mainly caused by the deposition of anode side reaction via different methods including SEM, XRD and XPS.

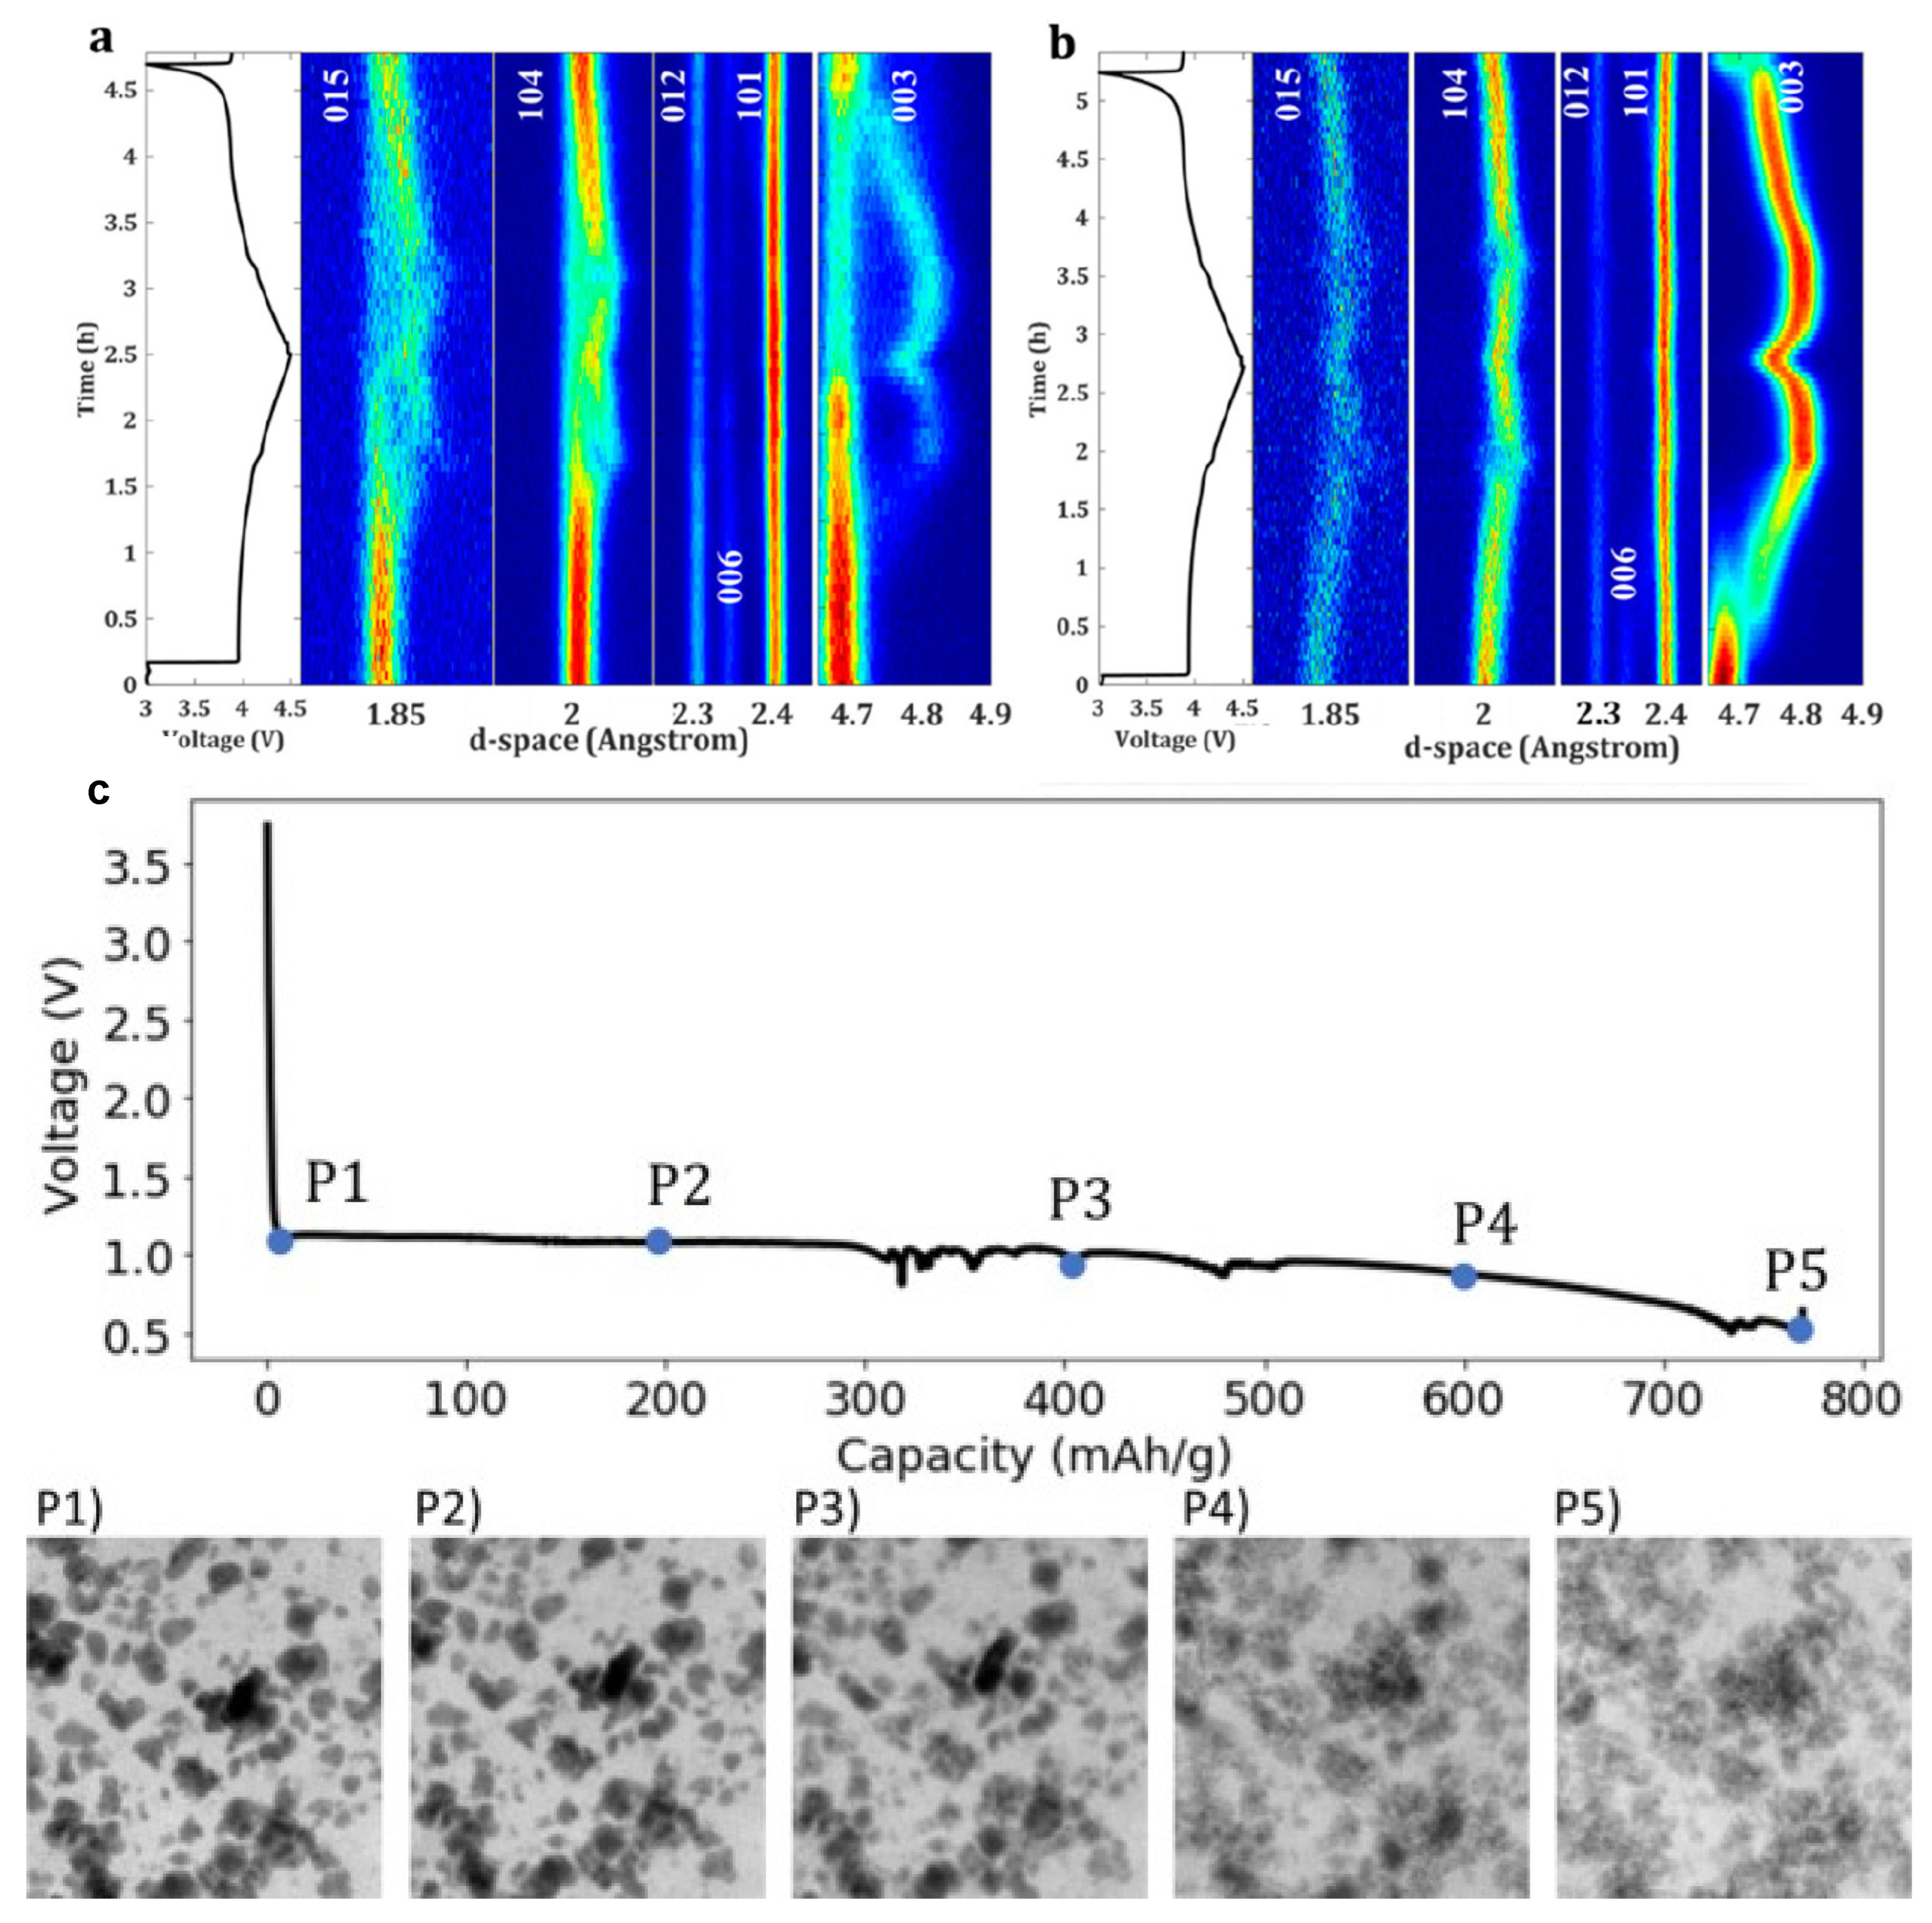
2.4. In Situ Operando Characterization

The degradation of battery performance is caused by both external factors (such as temperature, stress, and charging-discharging method) and internal factors (such as loss of lithium-ion, loss of active materials, and decomposition of electrolyte). Most of the current SOH estimation methods treat batteries as a black box for empirical fitting, overlooking the actual electrochemical meaning of the parameters. Therefore, an accurate aging evaluation algorithm, i.e., in situ operando characterization, must be based on comprehensive understanding of the internal aging mechanisms of Lithium-ion batteries.
Laisuo et al. have employed in operando energy dispersive X-ray diffraction (ED-XRD) measurements to monitor the evolution of LiCoO2 crystal structure during cycling [62]. The measurement process is illustrated in Figure 7a,b. The first charge-discharge cycle of the pristine and Poly (3,4-ethylenedioxythiophene) (PEDOT)-coated LiCoO2 electrode, and the lower intensity is represented by blue, and the higher intensity is red. It is shown that the structural evolutions are different between the two electrodes during cycling, which in turn confirms that ED-XRD is a powerful technique to investigate the mechanical behavior and the structure change of battery electrodes during cycling, and it can better explain the capacity fading caused by changes in the internal structure during cycling without destructive methods.
Operando transmission X-ray microscopy (TXM) has also been employed to visualize the morphological evolution of the electrodes. Laisuo et al. monitored LiCoO2 electrodes during the over-lithiation test [63]. The discharge curve of LiCoO2 electrodes at a C/2 rate is shown in Figure 7c. The images corresponding to five representative points on the curve are displayed as P1–P5. It is shown that during the over-lithiation, LiCoO2 particles and agglomerates are broken and eventually pulverized. Overall, larger particles showed stronger resistance to cracking, remained intact during most of the charging process and only started to crack at the end of the over-lithiation process. On the other hand, small particles fractured early. This example shows how in situ techniques help to improve understanding of the electro-chemo-mechanical behavior of electrodes during cycling and provides an easy way to estimate the SOH of lithium-ion batteries without destroying the batteries.

3. Disassembly-Based Analysis

Post-mortem analysis is a method to realize research of aging mechanisms by observation and analyzation of internal materials in the aged batteries which was disassembled in a particular environment (mostly in a glove box filled with inert gas). The first step of the battery disassemble method is to make sure the environment is safe and not contaminated. Several aspects should be paid attention to: (1) in order to avoid internal short circuits as well as other factors which influenced safety during the opening process, non-destructive testing techniques such as X-ray computed tomography should be used before opening the battery, and X-rays should also be used to determine the optimal cutting position; (2) disassembly should be carried out in a sealed well-operating environment which is filled full of inert gas and appropriate humidity to make sure safe and non-polluting disassembly. In general, it is common to use an argon-filled glove box; (3) avoid contact between the internal components of the battery to avoid cross-contamination during battery disassembly. Dimethyl carbonate, Diethyl carbonate or ethyl dimethyl carbonate are used to wash the samples from the disassembled cells before analysis. On the basis of physical and chemical analysis, the autopsy can be divided into morphological analysis, component analysis and structural analysis.

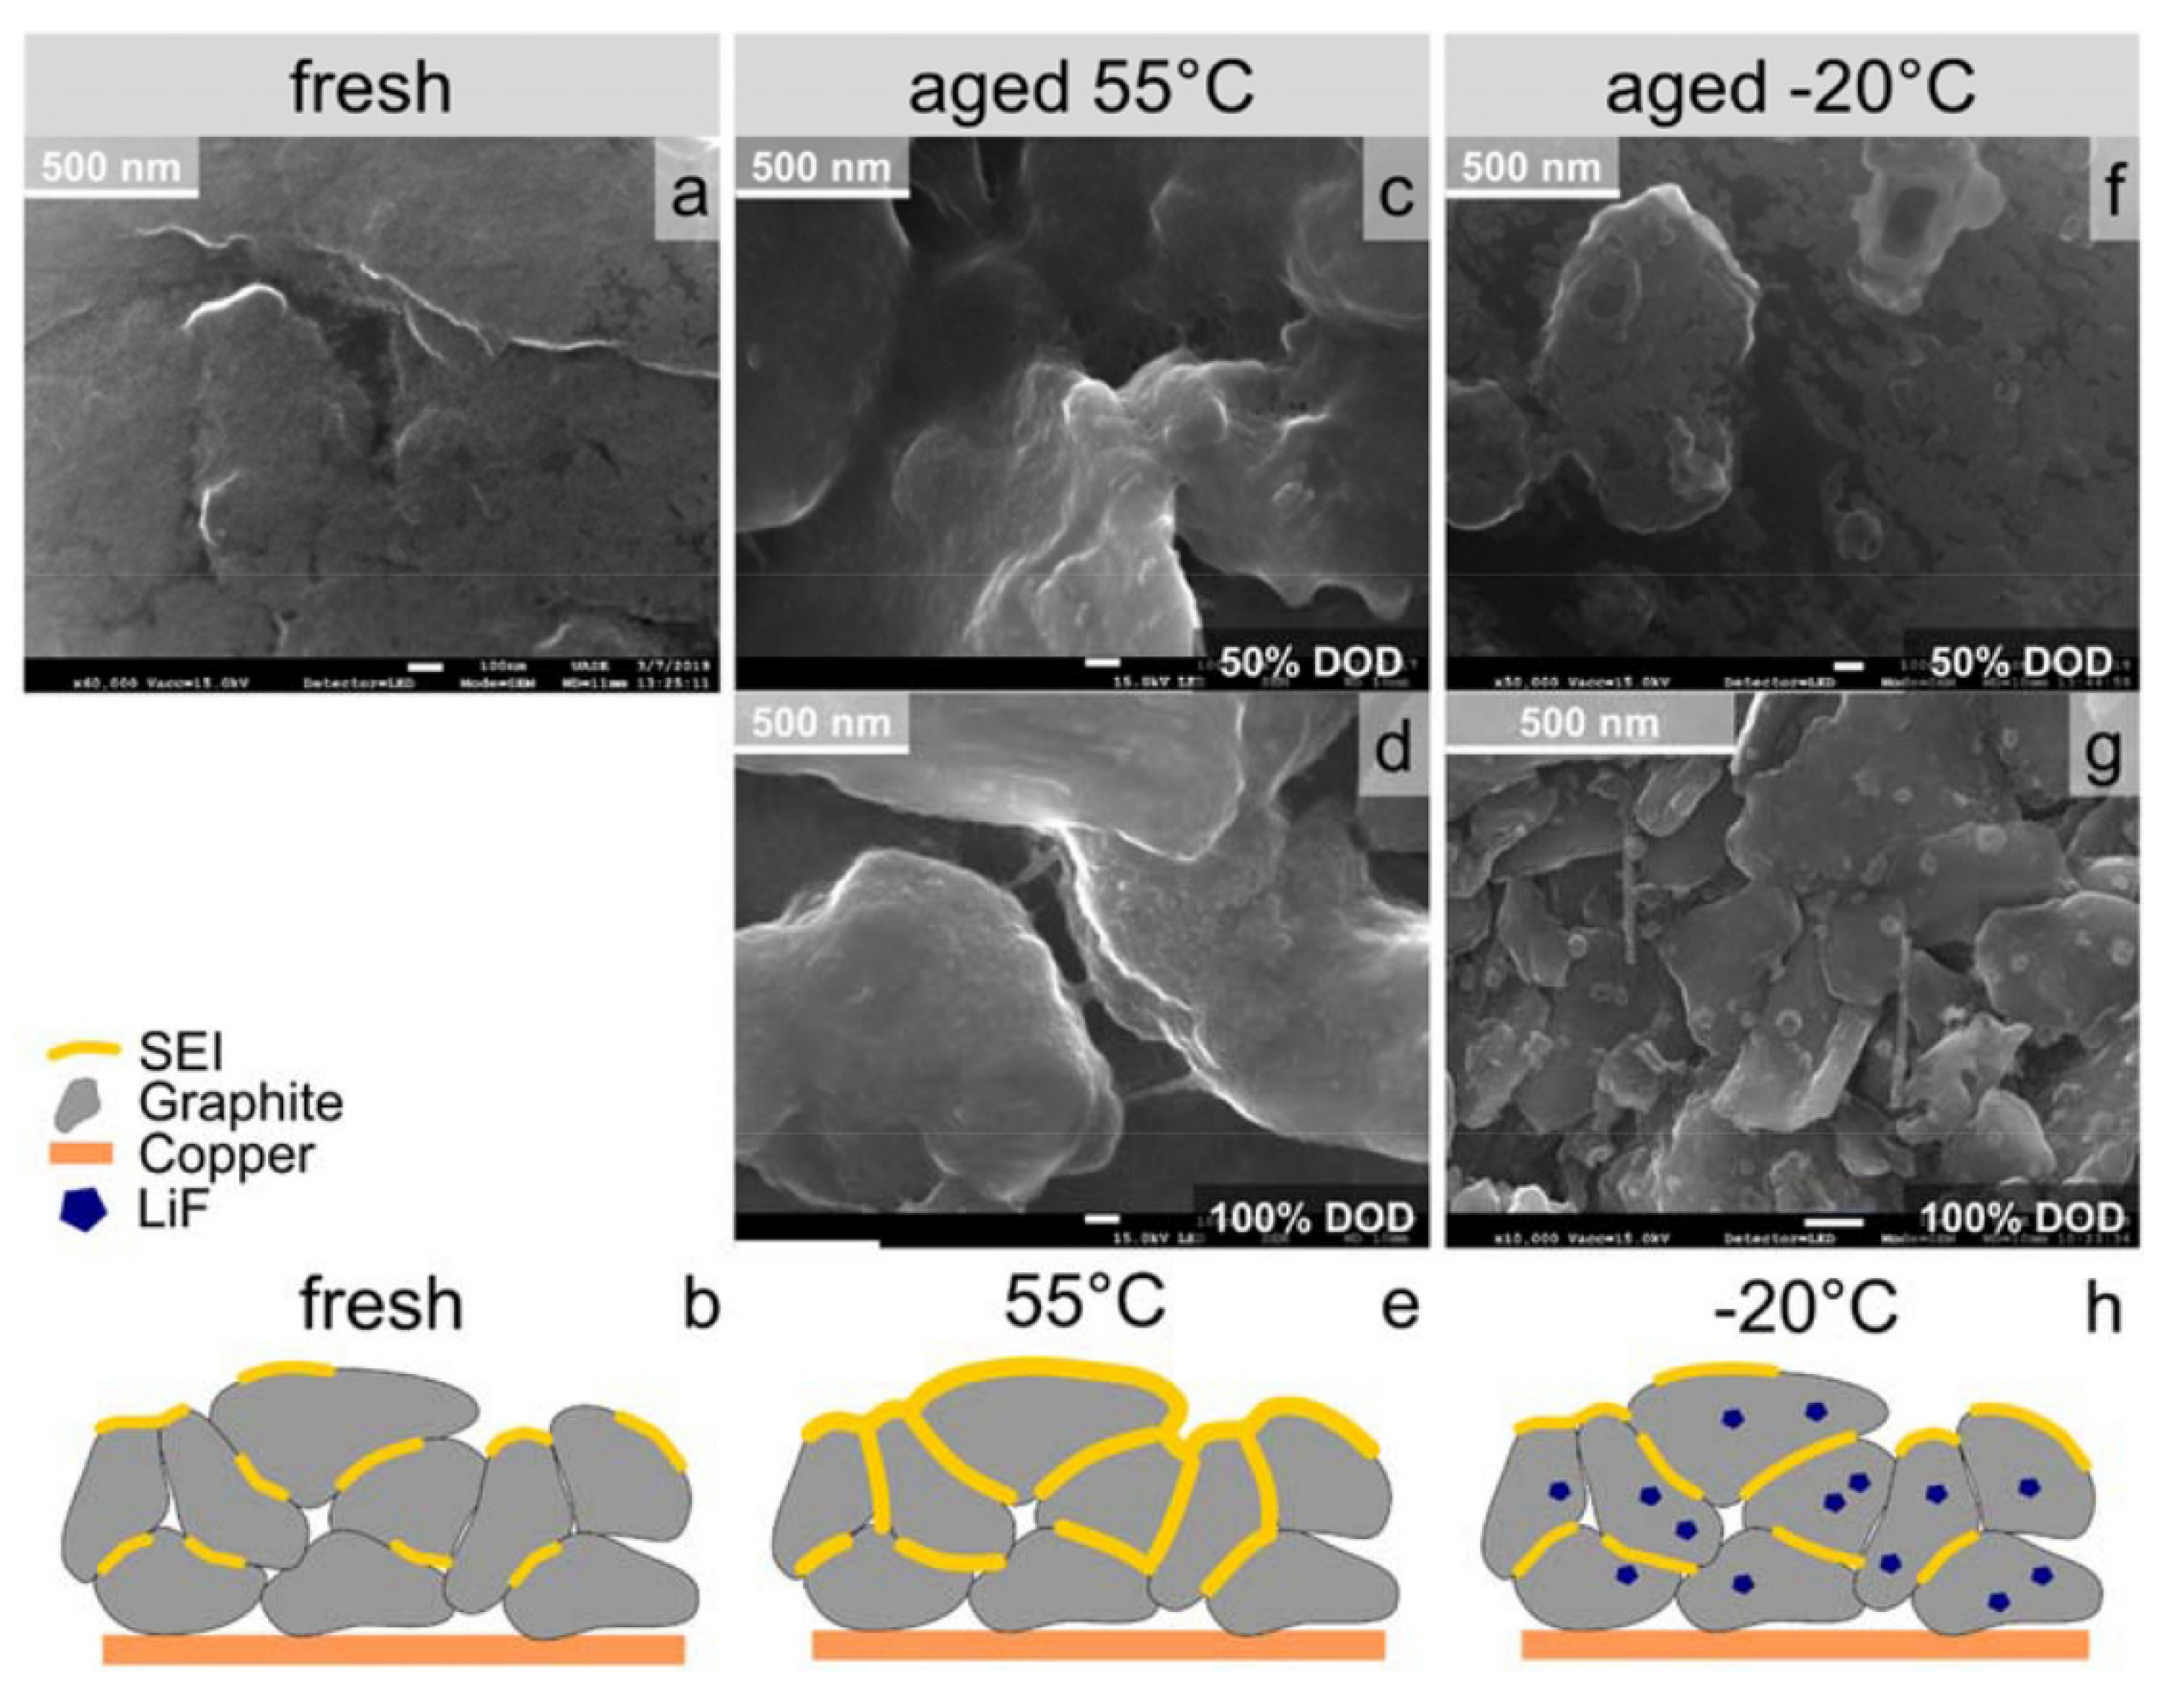
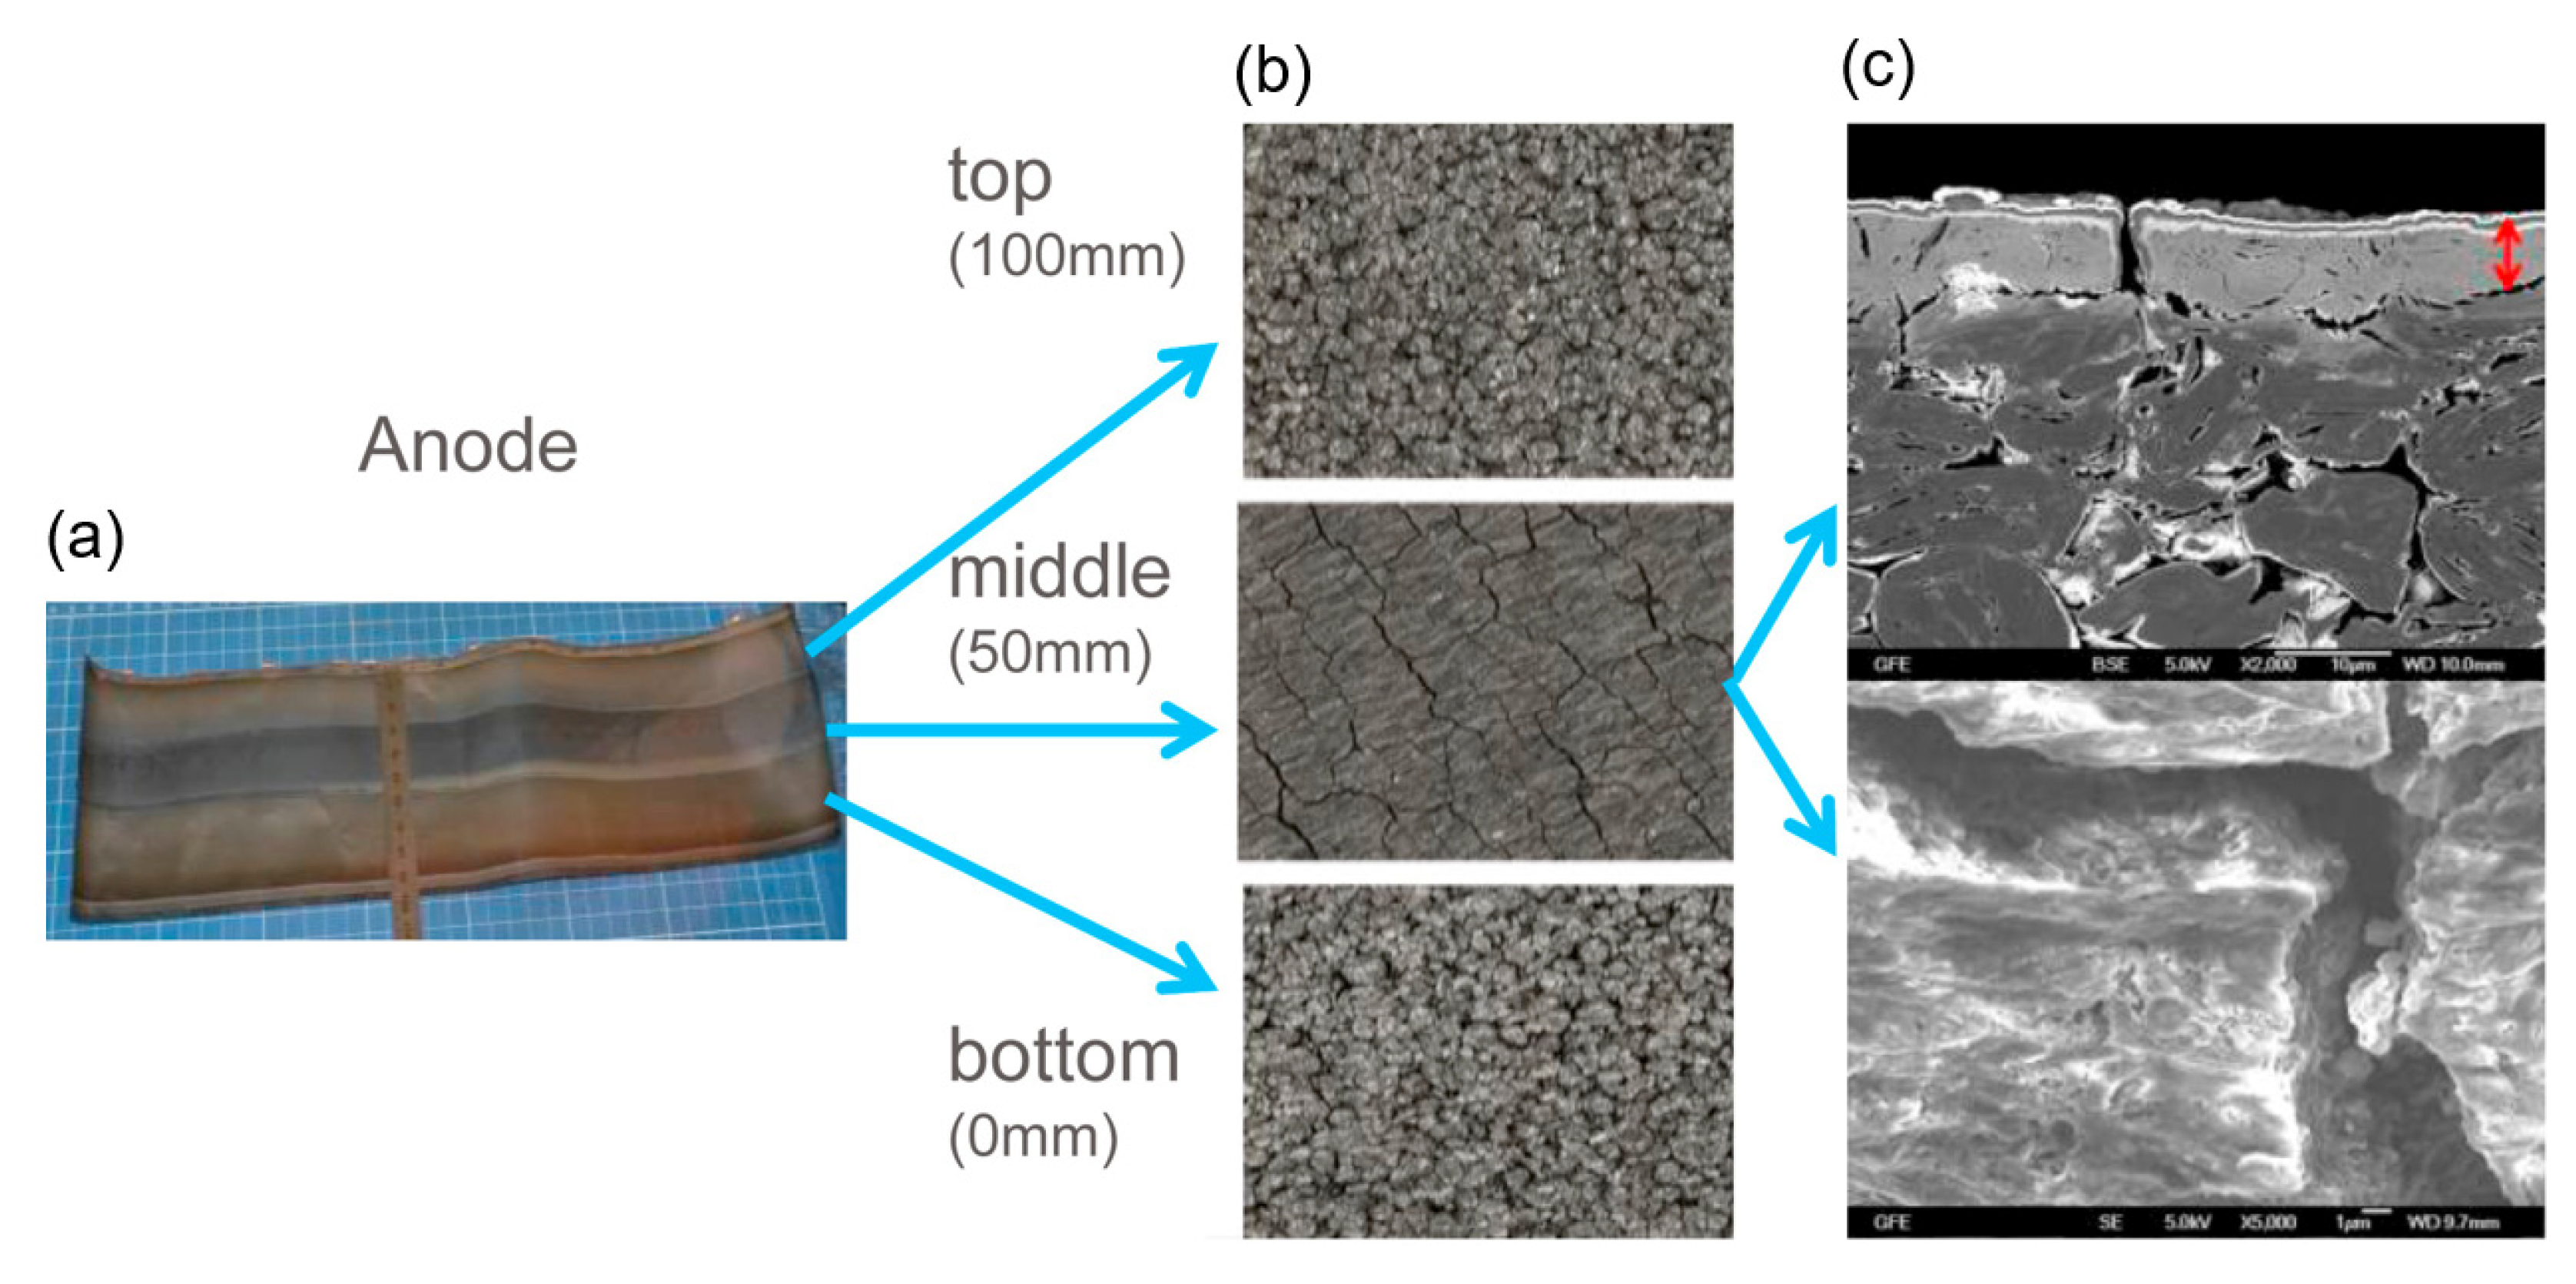
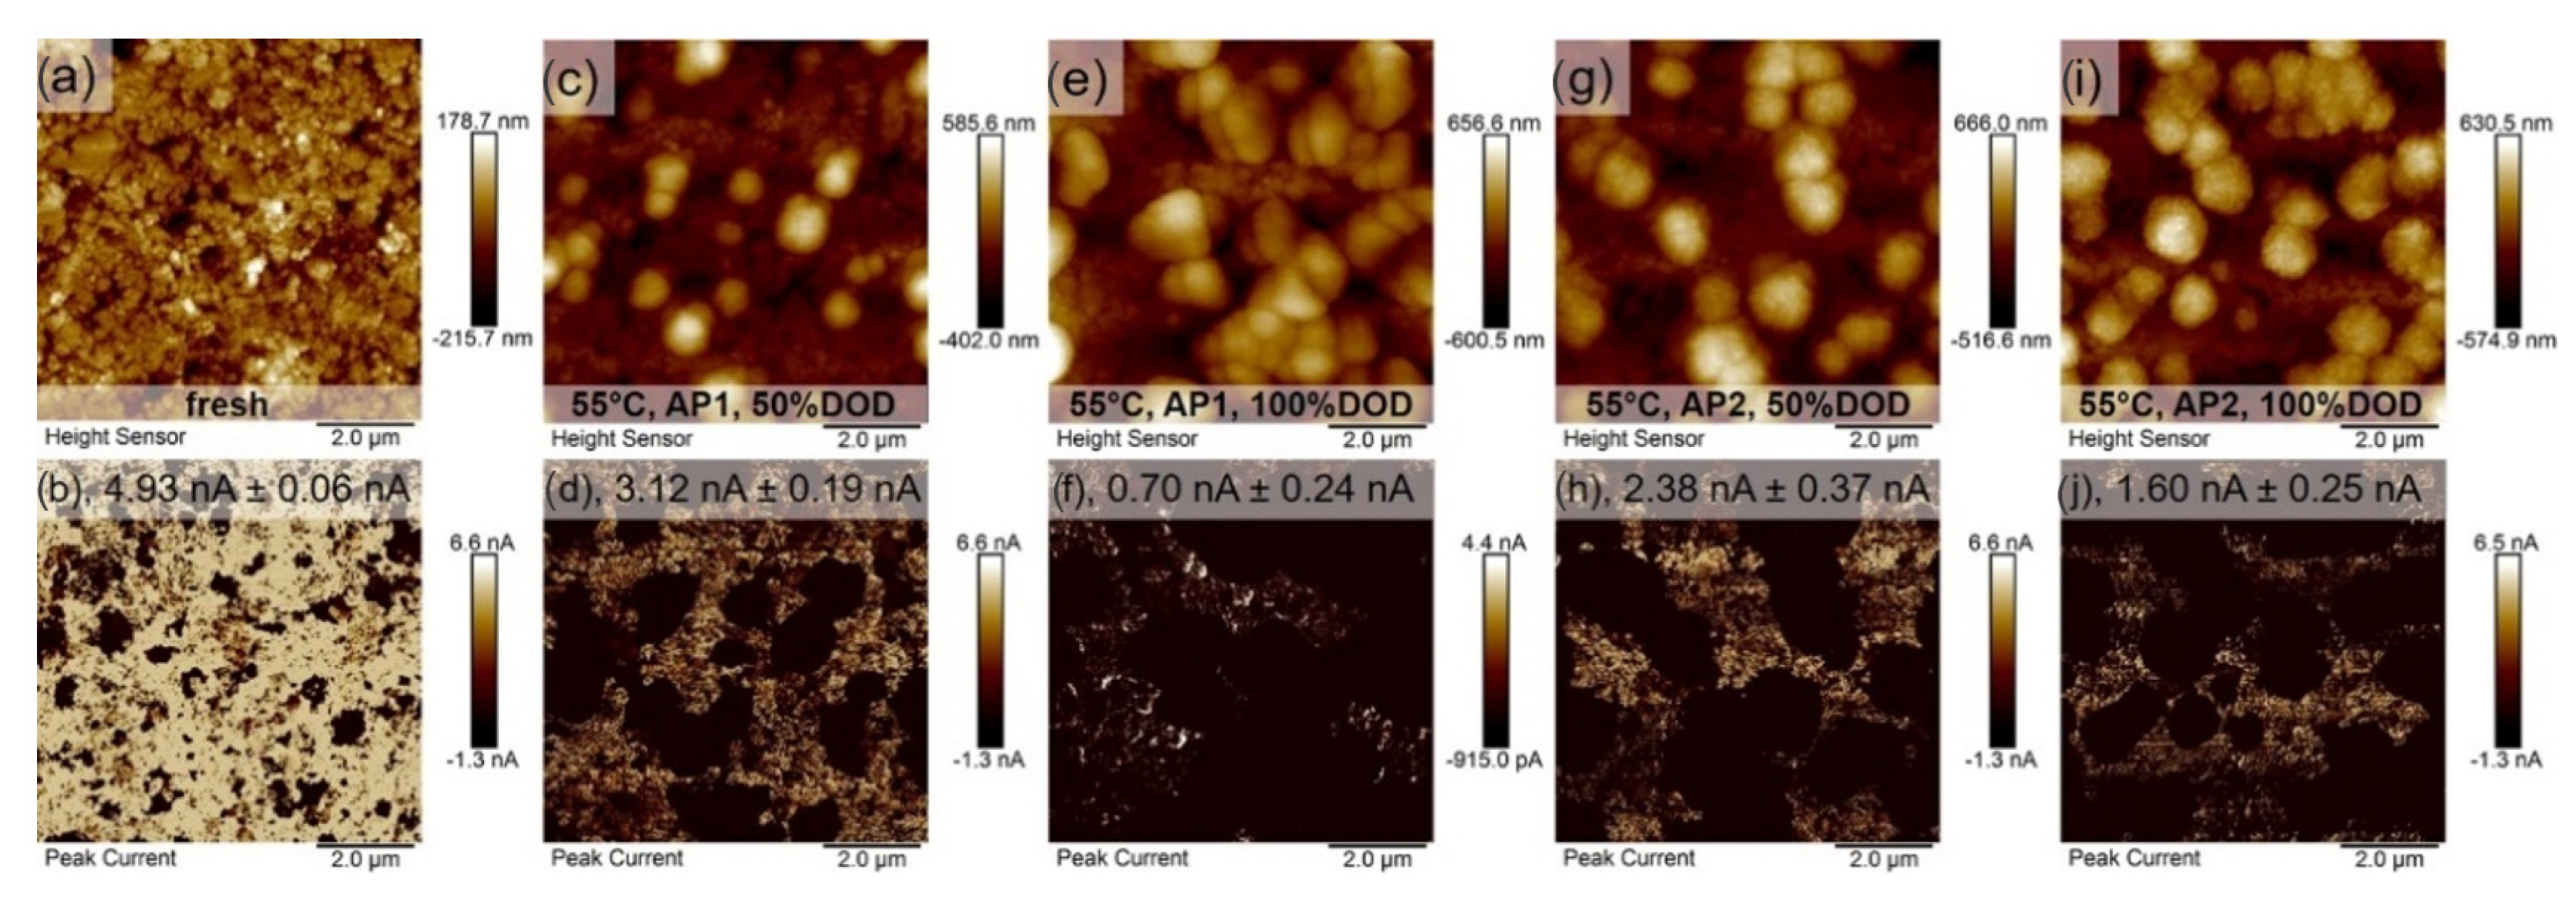
3.1. Morphology Characterization

To measure the morphology of the electrode surface, optical microscopy, scanning electron microscopy (SEM), transmission electron microscopy (TEM) as well as atomic force microscopy (AFM) are widely employed to collect data under a variety of resolutions. The comparison of the methods is shown in Table 4. At the micron-scale level, optical microscopy is commonly used to focus on the surface which does not that high resolution to detect things such as small breaks in the coating on electrode or electrode deformation. Both SEM and TEM have high resolution and can be used measure the aging conditions of active material particles on electrodes. Notably, SEM requires vacuum conditions during the whole use. The working principle of SEM is to generate high-resolution images on the surface of samples, the figures taken by SEM can be used to indicate the growth of SEI layer, the shape and cracks of the particles and the depositions of the lithium metal on the anodes. Comparing to SEM, TEM exhibits higher resolutions which is reflected in morphology, crystallinity, stress and other detailed features of samples. For example, the observation of CEI layer formation as aging percentage changing. Nevertheless, the applications of TEM are limited due to the strict demands such as a dust-free environment, the size of the samples, operation techniques and so on.
As shown in Figure 8, the morphology of the anode from the battery are obtained by SEM method. Simolka et al. studied the influence of temperature on the industrial produced LFP/C cell aging, which were cycled under the “worldwide harmonized light vehicles test procedure” (WLTP) ageing profile, named AP1. Moreover, the cycling current was doubled using another test profile (AP2) because they wanted to speed up the aging process [64]. Compared with the fresh anode surface, the surface of the anode had some distinct changes, but at the same temperature shows a similar appearance. The surface of the new anode at the BOL shows sheets of graphite with little covering (illustrations in Figure 8a,b). The boundaries of the graphite sheets can be seen clearly. It is worth noting that the anode surface undergoes a DMC cleaning. Therefore, any unstable surface layer will be removed. The anode surface of the battery aged at 55 °C has complete coverage of the surface layer (illustrated in Figure 8c–e). One of the main reasons for the decline in capacity is LLI. Furthermore, no surface morphological differences were observed between 50% and 100% DOD cycles in Figure 8c,d. Aging at −20 °C does not produce a thick surface layer because it appeared at the anode aged at 55 °C. Moreover, the graphite sheet coating exhibits characteristics similar to those of a fresh anode (Figure 8f). Similarly, Meinert et al. also employed laser microscopy to measure the surface morphology of the anode of the commercial LFP/Graphite battery between varieties of SOC state [65].
Although the average anodic potential is within the safe range relative to lithium plating, this may explain measurements of batteries aged between 45% and 55% SOC at 1C. Figure 9c highlights the area covered by a thick covering layer of one cell. In the related laser microscope image in Figure 10, the structural details of the graphite particles cannot be identified, but rather a thick coating can be seen. In summary, laser microscope are easily employed to investigating the morphology of cells surface, on the other hand, it cannot exhibit the detailed structure and high-resolution figures which require SEM and TEM to assist.
TEM is commonly used for measuring the morphological changes of the active materials on cathode, as well as the plane and lattice. In order to obtain the alteration on the surface and also inside the particle, high resolution transmission electron microscopy (HRTEM) is employed. For example, TEM was carried out on BOL and the cathode materials were cycled at high rates by Michael et al. [66]. The individual original particles of active substance were studied. The electron diffraction pattern of the LiMn2O4 (LMO) primary particles from the BOL materials in the direction of [110]c (c: cubic symmetry) is illustrated in Figure 11a. As can be seen from the high-resolution TEM (HRTEM) image (Figure 11g), the LMO does not show any defective areas. Figure 11b is also an electron diffraction pattern, which represented the original particle of BOL material. Since BOL cells have been through at least 100 cycles, the morphological changes that appear can also be attributed to these cycles. TEM technology is a powerful method to measure both structure and morphology at the same time, especially for distinguishing different cathode active materials, which can provide great contribution.
Since AFM has become a functional tool to examine the topography as well as the roughness and the elastic performance by Young’s modulus, the anode surfaces were investigated surfaces by using AFM attracted researchers’ interests. In Figure 12, images of the height as well as peak force error (PFE) of the anode surface is shown [64]. The fresh anode shows a smooth and flat graphite anode surface in both height and PFE images (Figure 12a,b). It is simply found that in the illustration of the PFE image, the side length is 5.1 μm. In the conductivity study, a bias voltage of 3.0 V was applied between tip and sample. While conductive regions were observed on a fresh anode, no conductivity was detected on aged samples. Therefore, smooth and flat surface together with measurable electrical conductivity of graphite sheets indicate that the SEI on fresh anode after cleaning is very thin or non-existent. In Figure 13, several agglomerates were observed on the cathode, and the formation could be attributed to continuous lithiation and delithiation. The lack of conductivity of the agglomerates implies disconnection to the electrode and loss of active materials. In addition, this suggested that at the beginning of the characterization cycle, the SEI film has not formed yet. In addition to the height and PEF images obtained from AFM, it can also be used to investigate in situ research, such as observation of SEI layer formation while cycling. Furthermore, the roughness of surface after aging is easily measured by AFM as well.

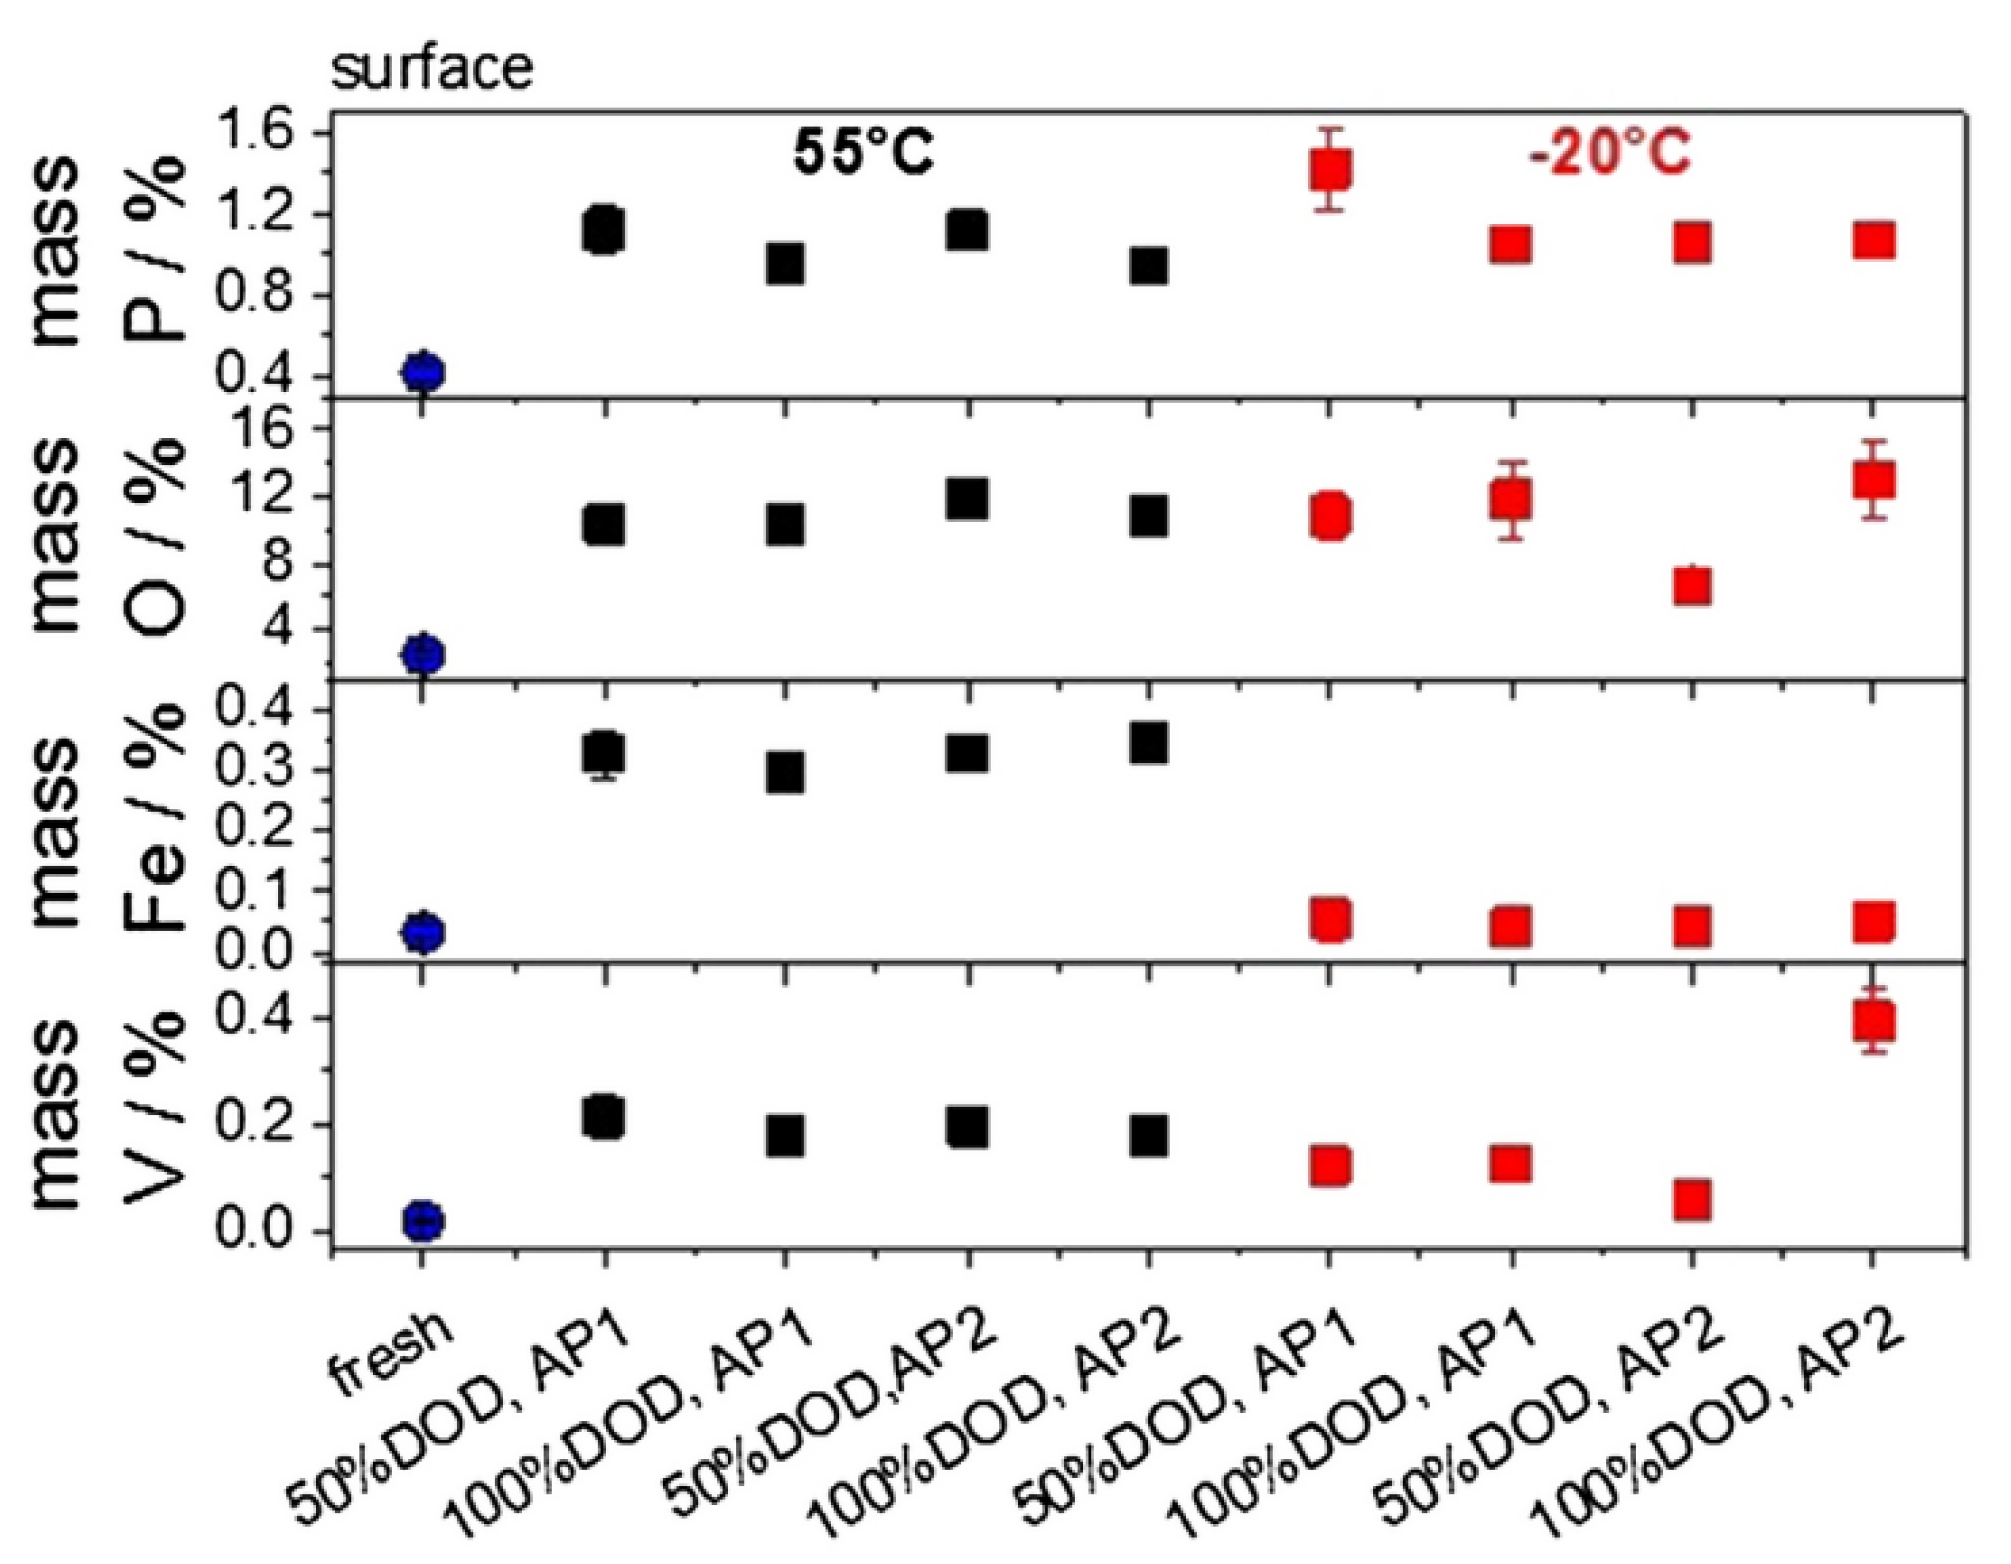
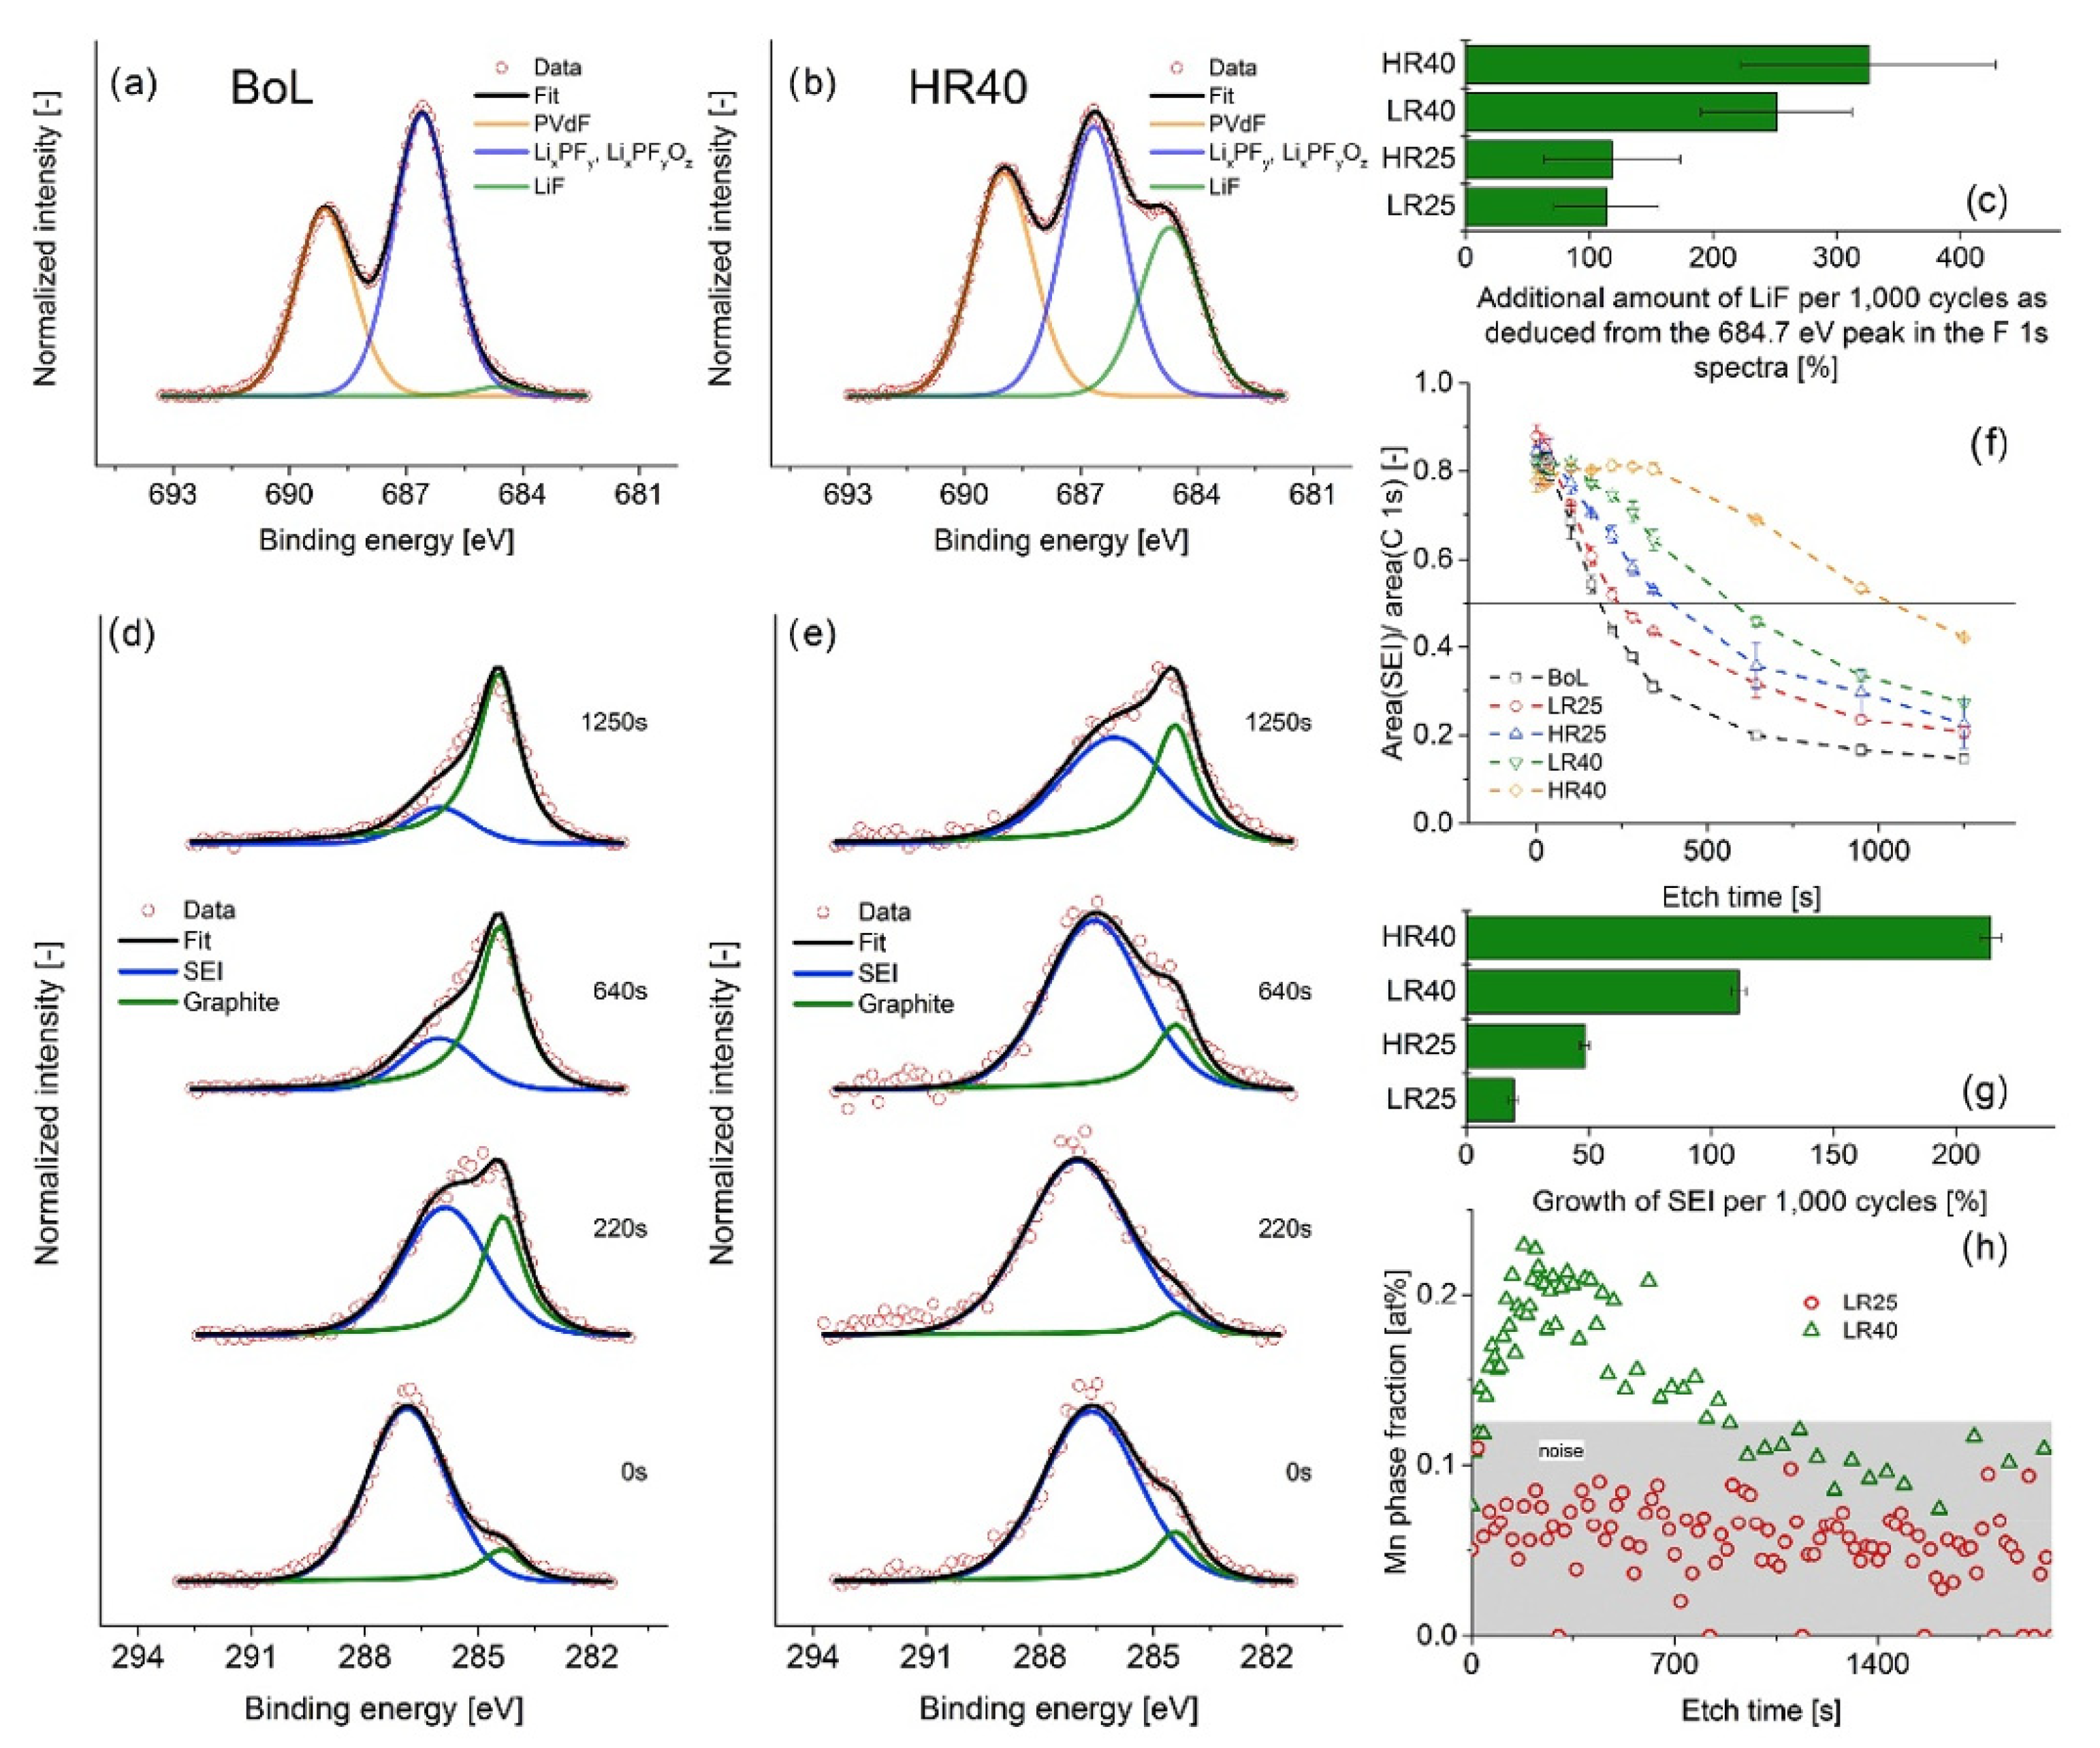
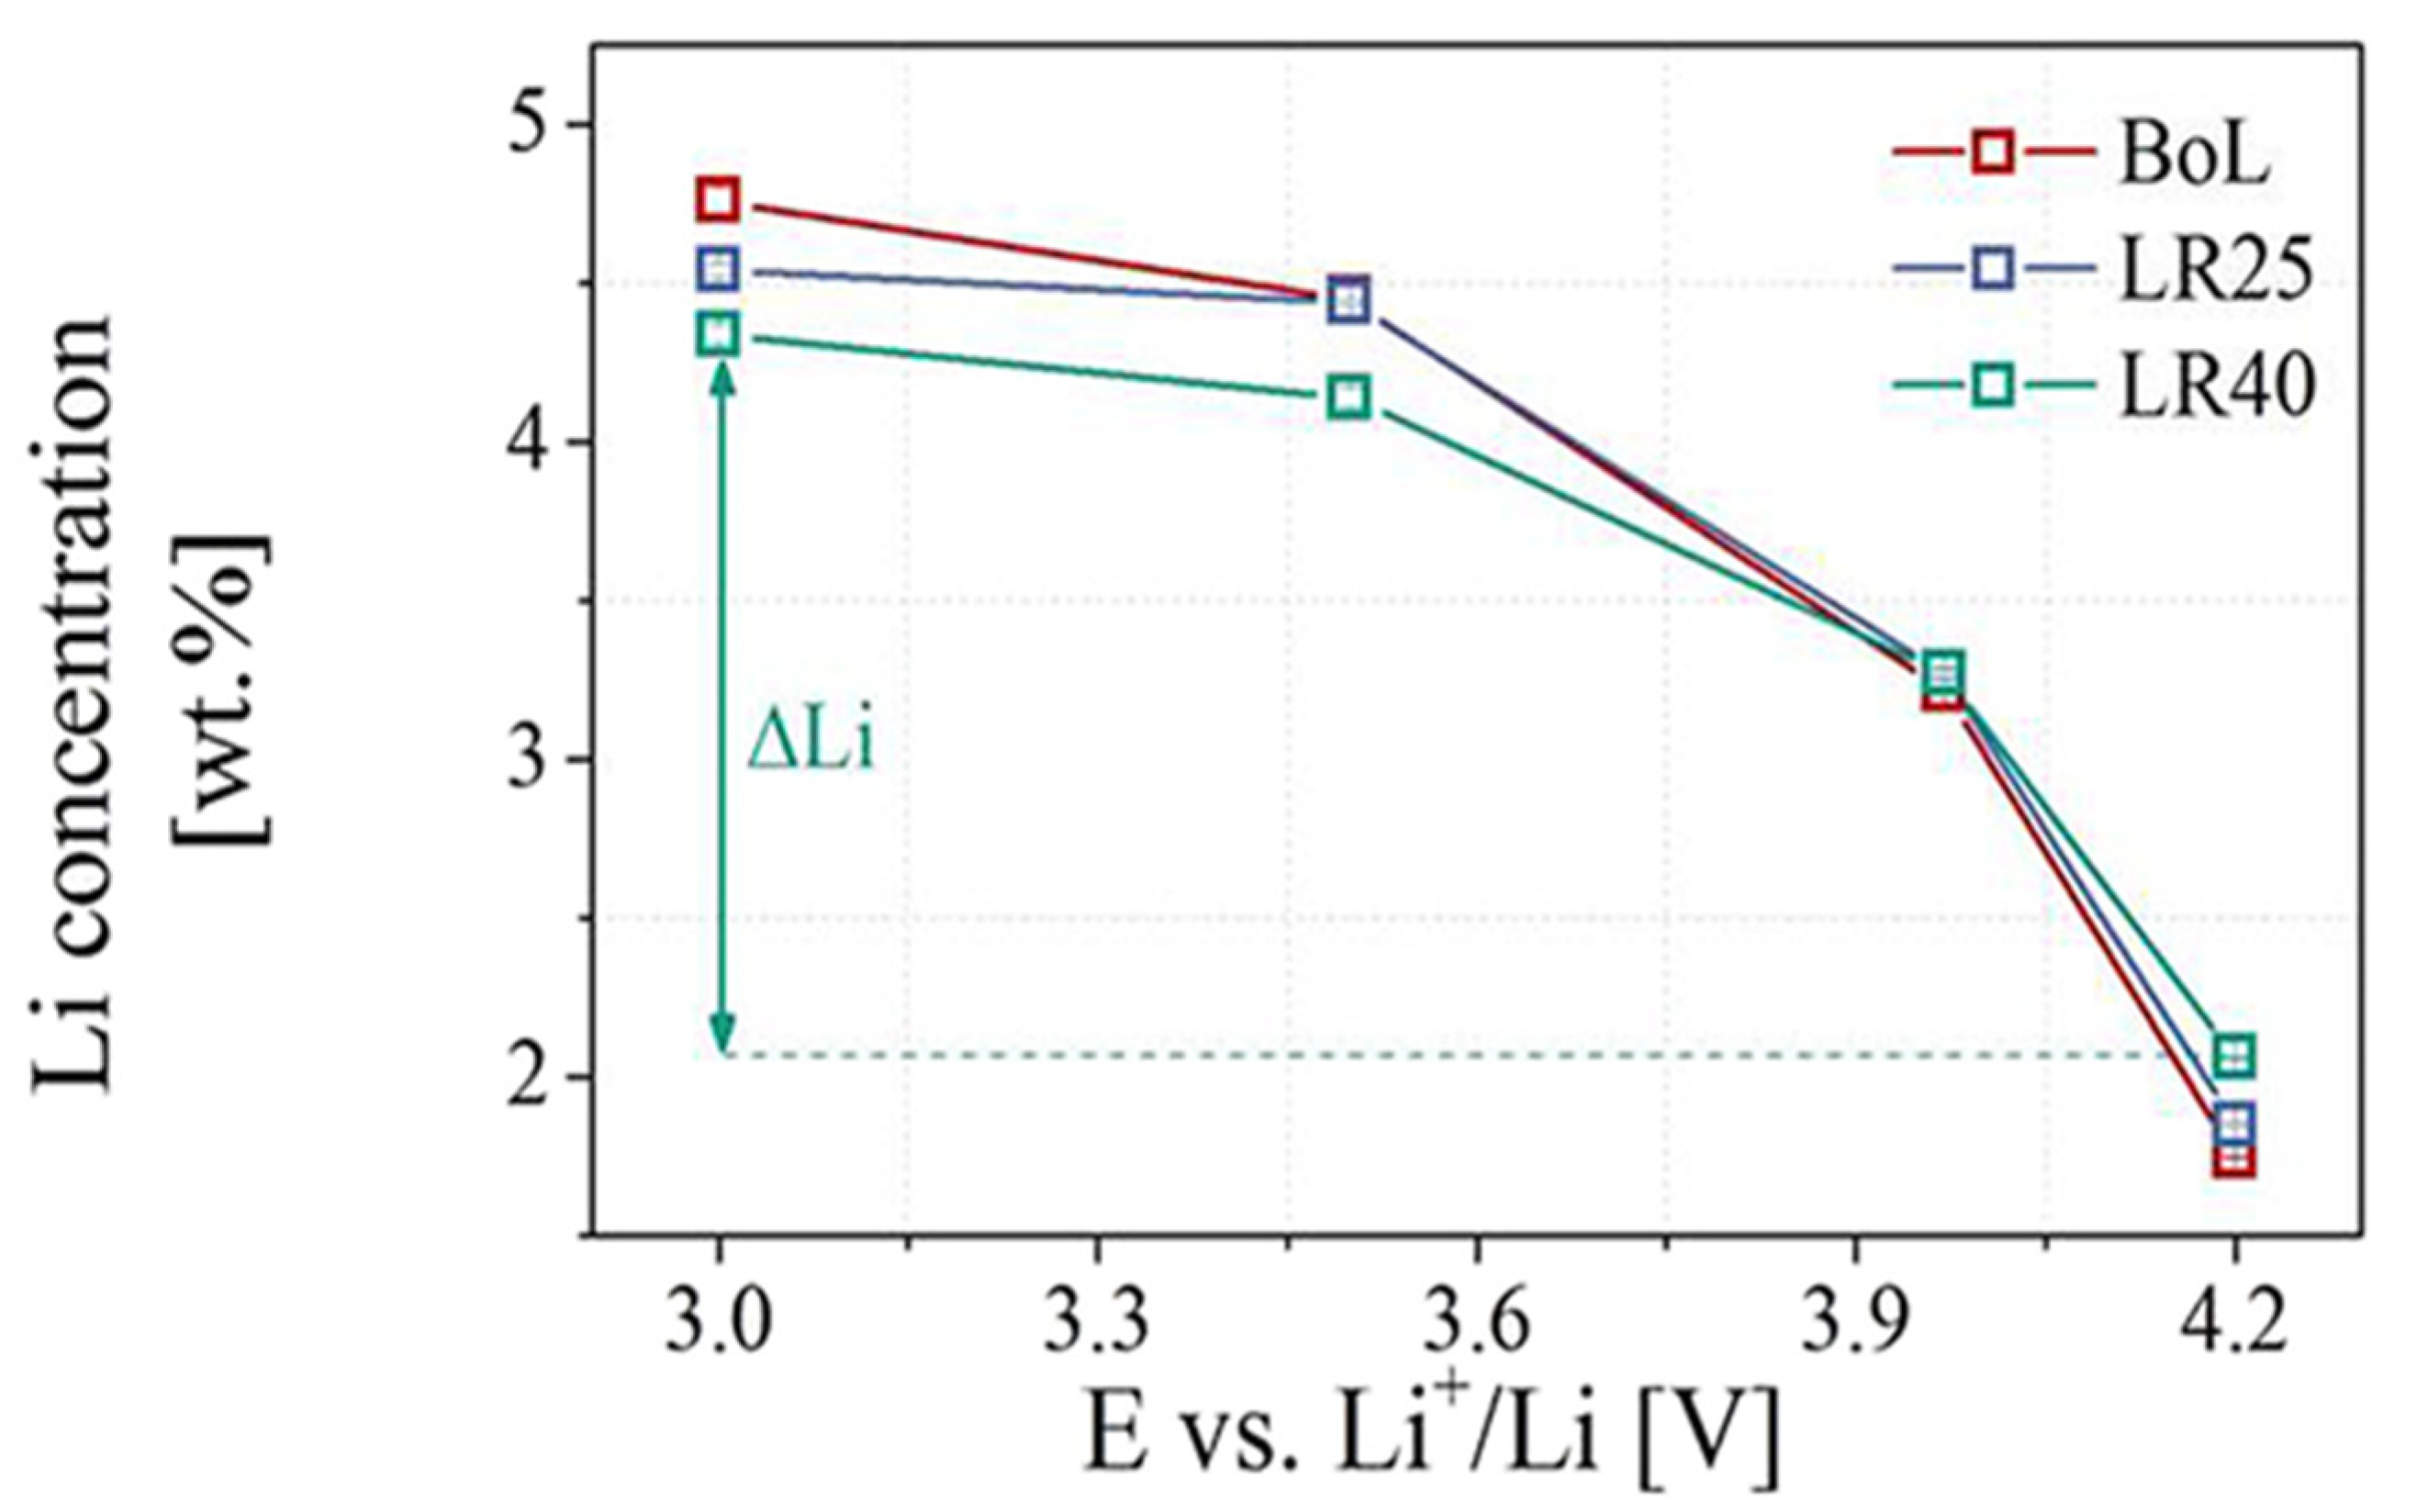
3.2. Composition Characterization

Compositional analysis involves defining the composition of elements, the dispersion of element concentrations and the chemical valence on the elements on surface and inside. The methods to investigate the composition of lithium-ion batteries are usually the utilization of energy dispersive X-ray spectroscopy (EDX), X-ray photoelectron spectroscopy (XPS) and inductively coupled plasma-optical emission spectrometer (ICP-OES), shortened to ICP.
Since elements from the cathode will dissolve in electrolyte and also transfer to anode surface, EDX measurements is usually used to measure anode. As mentioned in Section 3.1, Simolka et al. found that in the same aging profile, the anode surface under 50% DOD shows higher Phosphorous content than that under 100% DOD, which is shown in Figure 14 [56]. The well-known explanation is that higher SOC cycles lead to more significant SEI generation [67,68,69] than lower SOC cycles. At a 50% DOD cycle, the battery has a higher SOC range (compared to 100% DOD), a longer duration, and more electrolyte decompositions. In addition, the number of cycling cycles is quite different between changing DOD. The more latent cycles under 50% DOD, the thicker SEI and the more Li consumed during aging. The P and O on the surface of the aging anode at −20 °C increase to a similar extent even if the SEI is not obvious in observations of SEM and AFM. This is because the coated Li has reaction with the electrolyte to form a breakdown product on an anode aged at −20 °C, even if the graphite surface flake is not completely covered at 55 °C.
In order to study the interface changes between anode and electrolyte, SEI film, the surface of the anode is commonly measured by XPS. Michael Lang et al. investigated the F 1s, C 1s and Li 1s photoelectron spectra and subtracted the background, then normalized all spectra. The corresponding chemicals of the XPS peaks are shown in Table 5 [70].
Li2CO3 and LiF are the main chemicals generated from the decomposition of LiPF6, which is the electrolyte salt. Although Li2CO3 was formed as a component of SEI layer during the first few cycles of battery formation, LiF was formed as a result of the breakdown of conductive salts during battery circulation or storage [74]. Furthermore, metastable portions of the SEI layer (such as lithium alkyl carbonates (RO-CO2Li)) will decompose into Li2CO3 at high temperatures [75]. In addition, they found that the components were decomposition products of the electrolyte, the changes in SEI layers can be attributed to aging and the degradation level appeared to be much higher in the slow rate cycled cell.
XPS study are becoming more common in the field of post-mortem analysis of lithium-ion batteries. Michael et al. employed argon sputter depth profiling and XPS together to determine the relative SEI thickness [66]. They found there were more obvious changes when increasing the temperature rather than cycling rates which is shown in Figure 15. It is consistent with the effect of high cycle rates on SEI formation, as Wang and others have pointed out [76]. It is found that the cycle with a higher rate has a weaker influence on the growth of SEI, while the cycle at higher temperature has a stronger influence on the thickness of SEI.
In the work of Mariyam et al., they used ICP-OES to measure the composition of cells at BOL, aged using low rates at 25 °C (LR25), and high rates at 40 °C (HR40), respectively [77]. They used ICP-OES to quantify the capacity loss of the cathode to measure lithium element concentration by ICP-OES. In Figure 16, the relationship between the weight percentage of lithium in these cathodes and the voltage is represented. It is clear from the diagram that the amount of active lithium in the fatigue cathode decreases comparing to the lithium in the cathode of BOL condition. In the constant voltage step, large amounts of lithium insertion still occur on the fatigued cathode/extracted from the cathode.
Based on the composition analysis, a clear path to study inside the Li-ion batteries has been investigated excluding morphology characterization. It is now easier to understand the internal reactions when Li-ion batteries age, discover the reasons why capacity fades at the micro level related to degradation mechanisms and gain a comprehensive understanding of inside the battery aging mechanisms with both composition and structure analysis.

3.3. Structure Characterization

The purpose of structure characterization is mainly to determine the crystal structure, for instance, the distribution of atoms, the size and orientation of crystals which are composed to materials.
X-ray diffraction (XRD) is commonly used to determine the structure of the materials by positions and peaks via chemical characteristics [78]. In the spectra for Li-ion batteries, the strength and number of XRD peaks represent the degradation level of the electrode, while reflecting the formation of SEI films as well as lattice parameters of the active materials. Multiple methods are often together needed to fully study on the performance of aging, which can help to obtain a better understanding of aging mechanisms.
Kenza et al. have investigated the thermodynamic behavior of anode and lithium cobalt oxide (LCO) cathode-based lithium-ion battery and the evolution of the crystal structure of the electrode material after high voltage charging between the cutoff voltages (COV) of 4.2 V and 4.9 V [79]. They found that the entropy and enthalpy distributions are significantly different for the COV applied. Those phenomena are well correlated with the crystal structure degradation of the anode and cathode, as confirmed by XRD. As shown in Figure 17a, a complete XRD of the LCO cathode material under different COV was measured. In Figure 17b,c, the diffraction angle regions with peaks 003 and 104 are magnified, respectively. Moreover, the two corresponding narrow peaks which located at 18.9° and 45.25° of the “Fresh cell” in Figure 17b,c related to the 003 and 104 peaks of the fully lithium LCO, respectively. With the increase in COV, the peaks 003 and 104 moved toward a smaller angle and became wider at the 2θ angle. This shift in peak position is due to the residual lithium vacancy in Li1-xCoO2. In fact, when the lithium content in Li1-xCoO2 is extracted from LCO (0 < x < 0.5), the C parameters of hexagonal phase increase [80,81,82]. Another notable feature is that for COV ≥ 4.7 V, the 003 peak is split into two peaks. This may be related to the increasing disordered phases involving the mixing of Li and Co cations [82,83]. Figure 17d shows the evolution of the peak strength ratio I104/I003 with COV [84]. The latter ratio increases with COV, which indicates that the mixing rate of Li and Co cations increases with the increase in cathodic overcharge aging. Additionally, in Mariyam’s research, they employed in situ XRD to quantify the capacity loss in blended cathode [77]. In summary, XRD measurements can be used as a new research tool to estimate the degradation level of electrode materials to diagnose battery health.

4. Challenges and Future Perspectives

This article summarizes the recent diagnostic methods for lithium-ion battery aging. Two main methods are generally used for estimating the SOH of Li-ion batteries, namely, ex-post analysis based on disassembly and curve-based analysis. In order to develop advanced diagnostic methods, a balance should be made between accuracy and feasibility, especially in practical productions and applications. This work provides the combination of these two methods and produces the principle diagnostic method between full cells and coin cells (half cells). Comparing to full cells, coin cells are easier and safer to manipulate, the results can also be substantiated because of multiple investigations occurring at the same time. In addition, electrochemical analysis associated with post-mortem characterization make the comprehensive understanding of the aging mechanisms and estimation of degradation of Li-ion batteries in both macroscopic scale and microscopic scale.
Because of the growing cross-disciplinary contribution, multiple diagnosis methods are widely popular among research in Li-ion batteries field, and this trend is a promising direction for modifying the manufacture of Li-ion batteries and estimating the lifetime of batteries using in practical applications. However, some challenges remain, for instance, inconsistent testing parameters via different equipment, unrealistic data collection, as well as difficulties establishing well corresponded models of estimation for lifetime of Li-ion batteries between large amounts of data. In summary, further research and much more effort still required in future investigations of Li-ion batteries.

Author Contributions

Y.L. wrote the manuscript, Y.L. and D.-I.S. designed the structure of the paper; J.G., K.P. and L.G. reviewed the paper. All authors have read and agreed to the published version of the manuscript.

Funding

Y.L. was funded by a grant from the China Scholarship Council (no. 202006220024); J.G. was funded by a grant from the China Scholarship Council (no. 202006370035).

Acknowledgments

We would like to thank Peter Kjær Kristensen and Deyong Wang for their help in performing the FESEM test, and Kim Houtved Jensen for helping with the experiment platform.

Conflicts of Interest

The authors declare no conflict of interest.

References

  1. Tarascon, J.-M.; Armand, M. Issues and Challenges Facing Rechargeable Lithium Batteries. Nature 2001, 414, 359–367. [Google Scholar] [CrossRef] [PubMed]
  2. Yoon, W.-S.; Nam, K.-W.; Jang, D.; Chung, K.Y.; Cho, Y.-H.; Choi, S.; Hanson, J.C.; Yang, X.-Q. The Kinetic Effect on Structural Behavior of Mixed LiMn2O4–LiNi1/3Co1/3Mn1/3O2 Cathode Materials Studied by in Situ Time-Resolved X-ray Diffraction Technique. Electrochem. Commun. 2012, 15, 74–77. [Google Scholar] [CrossRef]
  3. Kitao, H.; Fujihara, T.; Takeda, K.; Nakanishi, N.; Nohma, T. High-Temperature Storage Performance of Li-Ion Batteries Using a Mixture of Li-Mn Spinel and Li-Ni-Co-Mn Oxide as a Positive Electrode Material. Electrochem. Solid-State Lett. 2005, 8, A87. [Google Scholar] [CrossRef]
  4. Kim, Y.; Lim, J.; Kang, S. Investigation on the Dissolution of Mn Ions from LiMn2O4 Cathode in the Application of Lithium Ion Batteries: First Principle Molecular Orbital Method. Int. J. Quantum Chem. 2013, 113, 148–154. [Google Scholar] [CrossRef]
  5. Dai, Y.; Cai, L.; White, R.E. Capacity Fade Model for Spinel LiMn2O4Electrode. J. Electrochem. Soc. 2012, 160, A182–A190. [Google Scholar] [CrossRef] [Green Version]
  6. Guo, J.; Li, Y.; Pedersen, K.; Stroe, D.-I. Lithium-Ion Battery Operation, Degradation, and Aging Mechanism in Electric Vehicles: An Overview. Energy 2021, 14, 5220. [Google Scholar] [CrossRef]
  7. Daubinger, P.; Schelter, M.; Petersohn, R.; Nagler, F.; Hartmann, S.; Herrmann, M.; Giffin, G.A. Impact of Bracing on Large Format Prismatic Lithium-Ion Battery Cells during Aging. Adv. Energy Mater. 2022, 12, 2102448. [Google Scholar] [CrossRef]
  8. Cordoba-Arenas, A.; Onori, S.; Guezennec, Y.; Rizzoni, G. Capacity and Power Fade Cycle-Life Model for Plug-in Hybrid Electric Vehicle Lithium-Ion Battery Cells Containing Blended Spinel and Layered-Oxide Positive Electrodes. J. Power Sources 2015, 278, 473–483. [Google Scholar] [CrossRef] [Green Version]
  9. Vetter, J.; Novák, P.; Wagner, M.R.; Veit, C.; Möller, K.-C.; Besenhard, J.O.; Winter, M.; Wohlfahrt-Mehrens, M.; Vogler, C.; Hammouche, A. Ageing Mechanisms in Lithium-Ion Batteries. J. Power Sources 2005, 147, 269–281. [Google Scholar] [CrossRef]
  10. Dubarry, M.; Liaw, B.Y.; Chen, M.-S.; Chyan, S.-S.; Han, K.-C.; Sie, W.-T.; Wu, S.-H. Identifying Battery Aging Mechanisms in Large Format Li Ion Cells. J. Power Sources 2011, 196, 3420–3425. [Google Scholar] [CrossRef]
  11. Barré, A.; Deguilhem, B.; Grolleau, S.; Gérard, M.; Suard, F.; Riu, D. A Review on Lithium-Ion Battery Ageing Mechanisms and Estimations for Automotive Applications. J. Power Sources 2013, 241, 680–689. [Google Scholar] [CrossRef] [Green Version]
  12. Schmalstieg, J.; Käbitz, S.; Ecker, M.; Sauer, D.U. A Holistic Aging Model for Li(NiMnCo)O2 Based 18650 Lithium-Ion Batteries. J. Power Sources 2014, 257, 325–334. [Google Scholar] [CrossRef]
  13. Meng, J.; Cai, L.; Stroe, D.-I.; Ma, J.; Luo, G.; Teodorescu, R. An Optimized Ensemble Learning Framework for Lithium-Ion Battery State of Health Estimation in Energy Storage System. Energy 2020, 206, 118140. [Google Scholar] [CrossRef]
  14. Rumberg, B.; Epding, B.; Stradtmann, I.; Kwade, A. Identification of Li Ion Battery Cell Aging Mechanisms by Half-Cell and Full-Cell Open-Circuit-Voltage Characteristic Analysis. J. Energy Storage 2019, 25, 100890. [Google Scholar] [CrossRef]
  15. Rezvanizaniani, S.M.; Liu, Z.; Chen, Y.; Lee, J. Review and Recent Advances in Battery Health Monitoring and Prognostics Technologies for Electric Vehicle (EV) Safety and Mobility. J. Power Sources 2014, 256, 110–124. [Google Scholar] [CrossRef]
  16. Waag, W.; Fleischer, C.; Sauer, D.U. Critical Review of the Methods for Monitoring of Lithium-Ion Batteries in Electric and Hybrid Vehicles. J. Power Sources 2014, 258, 321–339. [Google Scholar] [CrossRef]
  17. Zhang, G.; Wei, X.; Han, G.; Dai, H.; Zhu, J.; Wang, X.; Tang, X.; Ye, J. Lithium Plating on the Anode for Lithium-Ion Batteries during Long-Term Low Temperature Cycling. J. Power Sources 2021, 484, 229312. [Google Scholar] [CrossRef]
  18. Zhu, J.; Su, P.; Dewi Darma, M.S.; Hua, W.; Mereacre, L.; Liu-Théato, X.; Heere, M.; Sørensen, D.R.; Dai, H.; Wei, X.; et al. Multiscale Investigation of Discharge Rate Dependence of Capacity Fade for Lithium-Ion Battery. J. Power Sources 2022, 536, 231516. [Google Scholar] [CrossRef]
  19. Kisters, T.; Kuder, J.; Töpel, A.; Langkemper, R.; Nau, S.; Schopferer, S. Strain-Rate Dependence of the Failure Behavior of Lithium-Ion Pouch Cells under Impact Loading. J. Energy Storage 2021, 41, 102901. [Google Scholar] [CrossRef]
  20. Zhang, G.; Wei, X.; Chen, S.; Han, G.; Zhu, J.; Dai, H. Investigation the Degradation Mechanisms of Lithium-Ion Batteries under Low-Temperature High-Rate Cycling. ACS Appl. Energy Mater. 2022, 5, 6462–6471. [Google Scholar] [CrossRef]
  21. Han, X.; Ouyang, M.; Lu, L.; Li, J. A Comparative Study of Commercial Lithium Ion Battery Cycle Life in Electric Vehicle: Capacity Loss Estimation. J. Power Sources 2014, 268, 658–669. [Google Scholar] [CrossRef]
  22. Zhang, Q.; White, R.E. Capacity Fade Analysis of a Lithium Ion Cell. J. Power Sources 2008, 179, 793–798. [Google Scholar] [CrossRef]
  23. Knap, V.; Stroe, D.-I. Effects of Open-Circuit Voltage Tests and Models on State-of-Charge Estimation for Batteries in Highly Variable Temperature Environments: Study Case Nano-Satellites. J. Power Sources 2021, 498, 229913. [Google Scholar] [CrossRef]
  24. Han, X.; Ouyang, M.; Lu, L.; Li, J.; Zheng, Y.; Li, Z. A Comparative Study of Commercial Lithium Ion Battery Cycle Life in Electrical Vehicle: Aging Mechanism Identification. J. Power Sources 2014, 251, 38–54. [Google Scholar] [CrossRef]
  25. Marongiu, A.; Nlandi, N.; Rong, Y.; Sauer, D.U. On-Board Capacity Estimation of Lithium Iron Phosphate Batteries by Means of Half-Cell Curves. J. Power Sources 2016, 324, 158–169. [Google Scholar] [CrossRef]
  26. Birkl, C.R.; McTurk, E.; Roberts, M.R.; Bruce, P.G.; Howey, D.A. A Parametric Open Circuit Voltage Model for Lithium Ion Batteries. J. Electrochem. Soc. 2015, 162, A2271–A2280. [Google Scholar] [CrossRef] [Green Version]
  27. Tian, J.; Xiong, R.; Shen, W. A Review on State of Health Estimation for Lithium Ion Batteries in Photovoltaic Systems. eTransportation 2019, 2, 100028. [Google Scholar] [CrossRef]
  28. Bloom, I.; Jansen, A.N.; Abraham, D.P.; Knuth, J.; Jones, S.A.; Battaglia, V.S.; Henriksen, G.L. Differential Voltage Analyses of High-Power, Lithium-Ion Cells: 1. Technique and Application. J. Power Sources 2005, 139, 295–303. [Google Scholar] [CrossRef]
  29. Safari, M.; Delacourt, C. Aging of a Commercial Graphite/LiFePO4 Cell. J. Electrochem. Soc. 2011, 158, A1123. [Google Scholar] [CrossRef]
  30. Schmidt, A.P.; Bitzer, M.; Imre, Á.W.; Guzzella, L. Model-Based Distinction and Quantification of Capacity Loss and Rate Capability Fade in Li-Ion Batteries. J. Power Sources 2010, 195, 7634–7638. [Google Scholar] [CrossRef]
  31. Fu, R.; Choe, S.-Y.; Agubra, V.; Fergus, J. Modeling of Degradation Effects Considering Side Reactions for a Pouch Type Li-Ion Polymer Battery with Carbon Anode. J. Power Sources 2014, 261, 120–135. [Google Scholar] [CrossRef]
  32. Dubarry, M.; Liaw, B.Y. Identify Capacity Fading Mechanism in a Commercial LiFePO4 Cell. J. Power Sources 2009, 194, 541–549. [Google Scholar] [CrossRef]
  33. Chen, K.; Zheng, F.; Jiang, J.; Zhang, W.; Jiang, Y.; Chen, K. Practical Failure Recognition Model of Lithium-Ion Batteries Based on Partial Charging Process. Energy 2017, 138, 1199–1208. [Google Scholar] [CrossRef]
  34. Berecibar, M.; Gandiaga, I.; Villarreal, I.; Omar, N.; van Mierlo, J.; van den Bossche, P. Critical Review of State of Health Estimation Methods of Li-Ion Batteries for Real Applications. Renew. Sustain. Energy Rev. 2016, 56, 572–587. [Google Scholar] [CrossRef]
  35. Pastor-Fernández, C.; Uddin, K.; Chouchelamane, G.H.; Widanage, W.D.; Marco, J. A Comparison between Electrochemical Impedance Spectroscopy and Incremental Capacity-Differential Voltage as Li-Ion Diagnostic Techniques to Identify and Quantify the Effects of Degradation Modes within Battery Management Systems. J. Power Sources 2017, 360, 301–318. [Google Scholar] [CrossRef]
  36. Berecibar, M.; Garmendia, M.; Gandiaga, I.; Crego, J.; Villarreal, I. State of Health Estimation Algorithm of LiFePO4 Battery Packs Based on Differential Voltage Curves for Battery Management System Application. Energy 2016, 103, 784–796. [Google Scholar] [CrossRef]
  37. Weng, C.; Cui, Y.; Sun, J.; Peng, H. On-Board State of Health Monitoring of Lithium-Ion Batteries Using Incremental Capacity Analysis with Support Vector Regression. J. Power Sources 2013, 235, 36–44. [Google Scholar] [CrossRef]
  38. Weng, C.; Feng, X.; Sun, J.; Peng, H. State-of-Health Monitoring of Lithium-Ion Battery Modules and Packs via Incremental Capacity Peak Tracking. Appl. Energy 2016, 180, 360–368. [Google Scholar] [CrossRef] [Green Version]
  39. Li, X.; Jiang, J.; Wang, L.Y.; Chen, D.; Zhang, Y.; Zhang, C. A Capacity Model Based on Charging Process for State of Health Estimation of Lithium Ion Batteries. Appl. Energy 2016, 177, 537–543. [Google Scholar] [CrossRef]
  40. Riviere, E.; Venet, P.; Sari, A.; Meniere, F.; Bultel, Y. LiFePO4 Battery State of Health Online Estimation Using Electric Vehicle Embedded Incremental Capacity Analysis. In Proceedings of the 2015 IEEE Vehicle Power and Propulsion Conference (VPPC), Montreal, QC, Canada, 19–22 October 2015; pp. 1–6. [Google Scholar]
  41. Gao, Y.; Jiang, J.; Zhang, C.; Zhang, W.; Ma, Z.; Jiang, Y. Lithium-Ion Battery Aging Mechanisms and Life Model under Different Charging Stresses. J. Power Sources 2017, 356, 103–114. [Google Scholar] [CrossRef]
  42. Abraham, D.P.; Poppen, S.D.; Jansen, A.N.; Liu, J.; Dees, D.W. Application of a Lithium–Tin Reference Electrode to Determine Electrode Contributions to Impedance Rise in High-Power Lithium-Ion Cells. Electrochim. Acta 2004, 49, 4763–4775. [Google Scholar] [CrossRef]
  43. Schmid, A.U.; Kurka, M.; Birke, K.P. Reproducibility of Li-Ion Cell Reassembling Processes and Their Influence on Coin Cell Aging. J. Energy Storage 2019, 24, 100732. [Google Scholar] [CrossRef]
  44. Klett, M.; Eriksson, R.; Groot, J.; Svens, P.; Ciosek Högström, K.; Lindström, R.W.; Berg, H.; Gustafson, T.; Lindbergh, G.; Edström, K. Non-Uniform Aging of Cycled Commercial LiFePO4//Graphite Cylindrical Cells Revealed by Post-Mortem Analysis. J. Power Sources 2014, 257, 126–137. [Google Scholar] [CrossRef]
  45. Waldmann, T.; Iturrondobeitia, A.; Kasper, M.; Ghanbari, N.; Aguesse, F.; Bekaert, E.; Daniel, L.; Genies, S.; Gordon, I.J.; Löble, M.W.; et al. Review—Post-Mortem Analysis of Aged Lithium-Ion Batteries: Disassembly Methodology and Physico-Chemical Analysis Techniques. J. Electrochem. Soc. 2016, 163, A2149–A2164. [Google Scholar] [CrossRef]
  46. Waldmann, T.; Kasper, M.; Wohlfahrt-Mehrens, M. Optimization of Charging Strategy by Prevention of Lithium Deposition on Anodes in High-Energy Lithium-Ion Batteries—Electrochemical Experiments. Electrochim. Acta 2015, 178, 525–532. [Google Scholar] [CrossRef]
  47. Birkl, C.R.; Roberts, M.R.; McTurk, E.; Bruce, P.G.; Howey, D.A. Degradation Diagnostics for Lithium Ion Cells. J. Power Sources 2017, 341, 373–386. [Google Scholar] [CrossRef]
  48. Dubarry, M.; Truchot, C.; Liaw, B.Y. Synthesize Battery Degradation Modes via a Diagnostic and Prognostic Model. J. Power Sources 2012, 219, 204–216. [Google Scholar] [CrossRef]
  49. Schmid, A.U.; Ridder, A.; Hahn, M.; Schofer, K.; Birke, K.P. Aging of Extracted and Reassembled Li-Ion Electrode Material in Coin Cells—Capabilities and Limitations. Batteries 2020, 6, 33. [Google Scholar] [CrossRef]
  50. Berecibar, M.; Dubarry, M.; Omar, N.; Villarreal, I.; van Mierlo, J. Degradation Mechanism Detection for NMC Batteries Based on Incremental Capacity Curves. World Electr. Veh. J. 2016, 8, 350–361. [Google Scholar] [CrossRef] [Green Version]
  51. Mussa, A.S.; Liivat, A.; Marzano, F.; Klett, M.; Philippe, B.; Tengstedt, C.; Lindbergh, G.; Edström, K.; Lindström, R.W.; Svens, P. Fast-Charging Effects on Ageing for Energy-Optimized Automotive LiNi1/3Mn1/3Co1/3O2/Graphite Prismatic Lithium-Ion Cells. J. Power Sources 2019, 422, 175–184. [Google Scholar] [CrossRef]
  52. Pastor-Fernández, C.; Widanage, W.D.; Marco, J.; Gama-Valdez, M.; Chouchelamane, G.H. Identification and Quantification of Ageing Mechanisms in Lithium-Ion Batteries Using the EIS Technique. In Proceedings of the 2016 IEEE Transportation Electrification Conference and Expo (ITEC), Busan, Korea, 1–4 June 2016; pp. 1–6. [Google Scholar]
  53. Huang, J.; Ge, H.; Li, Z.; Zhang, J. Dynamic Electrochemical Impedance Spectroscopy of a Three-Electrode Lithium-Ion Battery during Pulse Charge and Discharge. Electrochim. Acta 2015, 176, 311–320. [Google Scholar] [CrossRef]
  54. Zhao, J.; Wang, L.; He, X.; Wan, C.; Jiang, C. Determination of Lithium-Ion Transference Numbers in LiPF[Sub 6]–PC Solutions Based on Electrochemical Polarization and NMR Measurements. J. Electrochem. Soc. 2008, 155, A292. [Google Scholar] [CrossRef]
  55. Dong, T.K.; Kirchev, A.; Mattera, F.; Kowal, J.; Bultel, Y. Dynamic Modeling of Li-Ion Batteries Using an Equivalent Electrical Circuit. J. Electrochem. Soc. 2011, 158, A326. [Google Scholar] [CrossRef]
  56. Itagaki, M.; Kobari, N.; Yotsuda, S.; Watanabe, K.; Kinoshita, S.; Ue, M. In Situ Electrochemical Impedance Spectroscopy to Investigate Negative Electrode of Lithium-Ion Rechargeable Batteries. J. Power Sources 2004, 135, 255–261. [Google Scholar] [CrossRef]
  57. Delacourt, C.; Ridgway, P.L.; Srinivasan, V.; Battaglia, V. Measurements and Simulations of Electrochemical Impedance Spectroscopy of a Three-Electrode Coin Cell Design for Li-Ion Cell Testing. J. Electrochem. Soc. 2014, 161, A1253–A1260. [Google Scholar] [CrossRef] [Green Version]
  58. Jiménez Gordon, I.; Grugeon, S.; Débart, A.; Pascaly, G.; Laruelle, S. Electrode Contributions to the Impedance of a High-Energy Density Li-Ion Cell Designed for EV Applications. Solid State Ion. 2013, 237, 50–55. [Google Scholar] [CrossRef]
  59. Thomas-Alyea, K.E.; Newman, J.; Chen, G.; Richardson, T.J. Modeling the Behavior of Electroactive Polymers for Overcharge Protection of Lithium Batteries. J. Electrochem. Soc. 2004, 151, A509. [Google Scholar] [CrossRef]
  60. Newman, J.; Tiedemann, W. Potential and Current Distribution in Electrochemical Cells: Interpretation of the Half-Cell Voltage Measurements as a Function of Reference-Electrode Location. J. Electrochem. Soc. 1993, 140, 1961–1968. [Google Scholar] [CrossRef]
  61. Ramadesigan, V.; Chen, K.; Burns, N.A.; Boovaragavan, V.; Braatz, R.D.; Subramanian, V.R. Parameter Estimation and Capacity Fade Analysis of Lithium-Ion Batteries Using Reformulated Models. J. Electrochem. Soc. 2011, 158, A1048. [Google Scholar] [CrossRef]
  62. Su, L.; Weaver, J.L.; Groenenboom, M.; Nakamura, N.; Rus, E.; Anand, P.; Jha, S.K.; Okasinski, J.S.; Dura, J.A.; Reeja-Jayan, B. Tailoring Electrode–Electrolyte Interfaces in Lithium-Ion Batteries Using Molecularly Engineered Functional Polymers. ACS Appl. Mater. Interfaces 2021, 13, 9919–9931. [Google Scholar] [CrossRef]
  63. Su, L.; Choi, P.; Nakamura, N.; Charalambous, H.; Litster, S.; Ilavsky, J.; Reeja-Jayan, B. Multiscale Operando X-ray Investigations Provide Insights into Electro-Chemo-Mechanical Behavior of Lithium Intercalation Cathodes. Appl. Energy 2021, 299, 117315. [Google Scholar] [CrossRef]
  64. Simolka, M.; Heger, J.-F.; Kaess, H.; Biswas, I.; Friedrich, K.A. Influence of Cycling Profile, Depth of Discharge and Temperature on Commercial LFP/C Cell Ageing: Post-Mortem Material Analysis of Structure, Morphology and Chemical Composition. J. Appl. Electrochem. 2020, 50, 1101–1117. [Google Scholar] [CrossRef]
  65. Lewerenz, M.; Warnecke, A.; Sauer, D.U. Post-Mortem Analysis on LiFePO4|Graphite Cells Describing the Evolution & Composition of Covering Layer on Anode and Their Impact on Cell Performance. J. Power Sources 2017, 369, 122–132. [Google Scholar] [CrossRef]
  66. Lang, M.; Darma, M.S.D.; Kleiner, K.; Riekehr, L.; Mereacre, L.; Ávila Pérez, M.; Liebau, V.; Ehrenberg, H. Post Mortem Analysis of Fatigue Mechanisms in LiNi0.8Co0.15Al0.05O2—LiNi0.5Co0.2Mn0.3O2—LiMn2O4/Graphite Lithium Ion Batteries. J. Power Sources 2016, 326, 397–409. [Google Scholar] [CrossRef]
  67. Lu, P.; Li, C.; Schneider, E.W.; Harris, S.J. Chemistry, Impedance, and Morphology Evolution in Solid Electrolyte Interphase Films during Formation in Lithium Ion Batteries. J. Phys. Chem. C 2014, 118, 896–903. [Google Scholar] [CrossRef]
  68. Anseán, D.; Dubarry, M.; Devie, A.; Liaw, B.Y.; García, V.M.; Viera, J.C.; González, M. Fast Charging Technique for High Power LiFePO4 Batteries: A Mechanistic Analysis of Aging. J. Power Sources 2016, 321, 201–209. [Google Scholar] [CrossRef]
  69. Leroy, S.; Blanchard, F.; Dedryvère, R.; Martinez, H.; Carré, B.; Lemordant, D.; Gonbeau, D. Surface Film Formation on a Graphite Electrode in Li-Ion Batteries: AFM and XPS Study. Surf. Interface Anal. 2005, 37, 773–781. [Google Scholar] [CrossRef]
  70. Lang, M.; Dewi Darma, M.S.; Mereacre, L.; Liebau, V.; Ehrenberg, H. Post Mortem Analysis of Ageing Mechanisms in LiNi0.8Co0.15Al0.05O2—LiNi0.5Co0.2Mn0.3O2—LiMn2O4/Graphite Lithium Ion Batteries. J. Power Sources 2020, 453, 227915. [Google Scholar] [CrossRef]
  71. Lu, Y.-C.; Mansour, A.N.; Yabuuchi, N.; Shao-Horn, Y. Probing the Origin of Enhanced Stability of “AlPO4” Nanoparticle Coated LiCoO2 during Cycling to High Voltages: Combined XRD and XPS Studies. Chem. Mater. 2009, 21, 4408–4424. [Google Scholar] [CrossRef]
  72. Shin, H.; Park, J.; Sastry, A.M.; Lu, W. Degradation of the Solid Electrolyte Interphase Induced by the Deposition of Manganese Ions. J. Power Sources 2015, 284, 416–427. [Google Scholar] [CrossRef]
  73. Liu, W.; Huang, X.; Guobao, L.; Wang, Z.; Huang, H.; Zhonghua, L.; Xue, R.; Chen, L. Electrochemical and X-Ray Photospectroscopy Studies of Polytetrafluoroethylene and Polyvinylidene Fluoride in Li/C Batteries. J. Power Sources 1997, 68, 344–347. [Google Scholar] [CrossRef]
  74. Broussely, M.; Biensan, P.; Bonhomme, F.; Blanchard, P.; Herreyre, S.; Nechev, K.; Staniewicz, R.J. Main Aging Mechanisms in Li Ion Batteries. J. Power Sources 2005, 146, 90–96. [Google Scholar] [CrossRef]
  75. Agubra, V.A.; Fergus, J.W.; Fu, R.; Choe, S.-Y. Analysis of Effects of the State of Charge on the Formation and Growth of the Deposit Layer on Graphite Electrode of Pouch Type Lithium Ion Polymer Batteries. J. Power Sources 2014, 270, 213–220. [Google Scholar] [CrossRef]
  76. Wang, J.; Liu, P.; Hicks-Garner, J.; Sherman, E.; Soukiazian, S.; Verbrugge, M.; Tataria, H.; Musser, J.; Finamore, P. Cycle-Life Model for Graphite-LiFePO4 Cells. J. Power Sources 2011, 196, 3942–3948. [Google Scholar] [CrossRef]
  77. Darma, M.S.D.; Lang, M.; Kleiner, K.; Mereacre, L.; Liebau, V.; Fauth, F.; Bergfeldt, T.; Ehrenberg, H. The Influence of Cycling Temperature and Cycling Rate on the Phase Specific Degradation of a Positive Electrode in Lithium Ion Batteries: A Post Mortem Analysis. J. Power Sources 2016, 327, 714–725. [Google Scholar] [CrossRef]
  78. Nam, K.-W.; Yoon, W.-S.; Yang, X.-Q. Structural Changes and Thermal Stability of Charged LiNi1/3Co1/3Mn1/3O2 Cathode Material for Li-Ion Batteries Studied by Time-Resolved XRD. J. Power Sources 2009, 189, 515–518. [Google Scholar] [CrossRef]
  79. Maher, K.; Yazami, R. Effect of Overcharge on Entropy and Enthalpy of Lithium-Ion Batteries. Electrochim. Acta 2013, 101, 71–78. [Google Scholar] [CrossRef]
  80. Ohzuku, T.; Ueda, A. Solid-State Redox Reactions of LiCoO2 (R3m) for 4 Volt Secondary Lithium Cells. J. Electrochem. Soc. 1994, 141, 2972–2977. [Google Scholar] [CrossRef]
  81. Amatucci, G.G.; Tarascon, J.M.; Klein, L.C. CoO2, The End Member of the Li x CoO2 Solid Solution. J. Electrochem. Soc. 1996, 143, 1114–1123. [Google Scholar] [CrossRef]
  82. Gabrisch, H.; Yazami, R.; Fultz, B. Hexagonal to Cubic Spinel Transformation in Lithiated Cobalt Oxide. J. Electrochem. Soc. 2004, 151, A891. [Google Scholar] [CrossRef]
  83. Ozawa, Y.; Yazami, R.; Fultz, B. Self-Discharge Study of LiCoO2 Cathode Materials. J. Power Sources 2003, 119–121, 918–923. [Google Scholar] [CrossRef]
  84. Yoshio, M.; Tanaka, H.; Tominaga, K.; Noguchi, H. Synthesis of LiCoO2 from Cobalt—Organic Acid Complexes and Its Electrode Behaviour in a Lithium Secondary Battery. J. Power Sources 1992, 40, 347–353. [Google Scholar] [CrossRef]
Figure 1. The structure of the review. Combination of destructive and non-destructive techniques is essential for understanding degradation mechanisms and lifetime predication. (a) Typical electrochemical impedance spectroscopy and (b) Equivalent circuit model of Lithium-ion battery.
Batteries 08 00072 g001
Figure 2. Incremental capacity curve of cycling at 0.05 C charging current [41]. Reprint with permission [41]; Copyright 2017, Elsevier.
Batteries 08 00072 g002
Figure 3. (a) Open circuit potentials before coin cells begin aging; (b) IC of the full cell voltage; (c) defined features of interest (FOIs) of the incremental capacity (IC) curves [43,49]. Reprint with permission [43]; Copyright 2019, Elsevier. Reprint with permission [49]; Copyright 2020, MDPI.
Batteries 08 00072 g003
Figure 4. (a) Typical electrochemical impedance spectroscopy principal diagram and (b) Equivalent circuit model of Lithium-ion battery.
Batteries 08 00072 g004
Figure 5. Impedance data measured at 3.72 V, which is the full voltage. The illustration inserted is an extended view of the respective electrode data [42]. Reprint with permission [42]; Copyright 2004, Elsevier.
Batteries 08 00072 g005
Figure 6. (a) Setup #1 with a hole in the CE of a three-electrode coin cell setup. Spectra are measured vs. (b) REideal and (c) RE. [57]. Reprint with permission [57]; Copyright 2014, IOP Science.
Batteries 08 00072 g006
Figure 7. The voltage profiles and the corresponding contour plots showing XRD peak evolution for (a) pristine and (b) PEDOT-coated LiCoO2 electrode during one cycle at C/2 with a cutoff voltage at 4.5 V. (c) Discharge curve during the over-lithiation test. Five points (P1–P5) were selected to show the respective TXM images [62,63]. Reprint with permission [62]; Copyright 2021, American Chemical Society. Reprint with permission [63]; Copyright 2021, Elsevier.
Batteries 08 00072 g007
Figure 8. SEM images of the anodes which opened from aged cells via different aging profiles: (a) fresh cell; (c) 50% depth of discharge (DOD); (d) 100% DOD using AP2 at 55 °C; (f) 50% DOD; (g) 100% DOD using AP2 at −20 °C; (b,e,h) show the fresh anode and the anode from cells aged at 55 °C and −20 °C, respectively [64].
Batteries 08 00072 g008
Figure 9. Optical microscope images of the aged cells: (a) photo of the anode; (b) laser microscope images; (c) SEM images [65]. Reprint with permission [65]; Copyright 2017, Elsevier.
Batteries 08 00072 g009
Figure 10. Laser microscope images of (a) a fresh cell at 0% SOC; (b) a fresh cell at 100% SOC; (c) an aged cell at 1C and 10% DOD, which can be observed covering a thick layer [65]. Reprint with permission [65]; Copyright 2017, Elsevier.
Batteries 08 00072 g010
Figure 11. Diffraction pattern from changing materials of BOL cathodes: (a) LMO; (b) LiNi0.5 Co0.2Mn0.3O2 (NCM); (c) LiNi0.8Co0.15Al0.05O2 (NCA). Diffraction patterns from cathode which were aging using high rates at 40 °C (HR40): (d) LMO; (e) NCM; (f) NCA. HRTEM images: (g) LMO; (h) NCM; (i) NCA and under HR40 condition: (j) LMO; (k) NCM; (l) NCA [66]. Reprint with permission [66]; Copyright 2016, Elsevier.
Batteries 08 00072 g011
Figure 12. The height images are on the top and PEF images on the bottom: (a,b) fresh anode; (c,d) cell aged at 55 °C using AP2, 50% DOD; (e,f) cell aged at  −20 °C using AP2, 50% DOD; (g,h) cell aged at −20 °C using AP2, 100% DOD. The blue circles emphasize the flat graphite, and the red arrows are using to present Li plating [64].
Batteries 08 00072 g012
Figure 13. Topography (ai) and the average current magnitude (bj) of the cathodes [64].
Batteries 08 00072 g013
Figure 14. EDX analysis on anode surfaces [64].
Batteries 08 00072 g014
Figure 15. The spectra of F 1s from: (a) BoL; (b) HR40; (c) comparison in all anodes. The spectra of C 1s with argon sputter under variety times: (d) BoL; (e) HR40 anodes; (f) figure of SEI mass content related to argon etch time; (g) SEI thicknesses compared to BoL; (h) Manganese elements distribution depth in the LR25 and LR40 samples [66]. Reprint with permission [66]; Copyright 2016, Elsevier.
Batteries 08 00072 g015
Figure 16. Lithium concentration measure by ICP-OES [77].
Batteries 08 00072 g016
Figure 17. XRD patterns of LiCoO2 before and after overcharge: (a) full pattern, (b) in the (003); (c) (104) peak area; (d) COV dependence of peak strength ration of I104/003 [79]. Reprint with permission [79]; Copyright 2013, Elsevier.
Batteries 08 00072 g017
Table 1. Comparison of aging diagnostic methods.
MethodsRepresentative TechniquesAdvantagesDisadvantages
Non-destructive analysisOpen-circuit-voltage curvesTesters are easy to be operated and the data are simple to obtainDifficult to understand the specific electrochemical reactions inside the cells
Electrochemical impedance spectroscopyThe equivalent circuit model can be provided and non-destructive diagnosisTime-consuming procedures and the estimation of SOH is influenced by the model
In situ operando characterizationCharacterizing the electro-chemo-mechanical behavior during cycling without destructing the batteryHigh instrument costs and high requirements for both experimental environment and users
Destructive analysisElectron microscopyVisualized morphology observation of the aging changes inside the cellsIrreversible destruction to cells and only used in vacuum
X-ray spectroscopyDetailed composition results and specific area can be investigated and quantifiedHigh requirements for the experimental environment and specialized skills for user
X-ray diffractionStructure features can be measured and can be used for SOH diagnostics both in situ and ex situHigh requirements for the samples and the specialized skills for user
Table 2. Comparison OCV curve-based analysis methods.
MethodsPrincipleAdvantagesDisadvantages
Incremental capacity analysis (ICA)IC curve changes with capacity decayIC (dQ/dV) measuring can be directly obtainedTime-consuming modeling and impractical for implementations with incomplete data
Differential voltage analysis (DVA)By counting the inverse of the IC value, the DV value can be easily obtainedConsidering the aging mechanism, the estimation error can be controlled by charging dataDV (dV/dQ) measuring requires the capacity of batteries, which is varied while battery aging and hard to be measured directly
Table 3. FOI general trends of different aging mechanisms [50].
FOIAttributeLLILAMNELAMPE
0Peak height dQ/dUsteady
0Position Usteady
1Peak height dQ/dUsteady
1Position Usteadysteadysteady
2Peak height dQ/dUsteady
2Position U
Table 4. Comparison of different morphology characterization methods.
MethodsAdvantagesDisadvantages
SEMThe apparatus is simple and convenient for operationOnly used in vacuum
TEMHigher resolutionStrict cleanliness requirements for the operation and expensive costs
AFMDetailed results and specific area can be investigatedResults can be easily influenced by environment and the situation of instrument
Table 5. The assignment of the XPS peaks [70].
Orbital of ElementsBinding Energy (eV)Chemicals
Li 1s55.1Li2CO3, LiF [69]
57.5LiPF6 [69]
C 1s284.1Graphite [71]
285.0C-H [71]
286.6C-O [71]
288.7O-C = O [71]
290.8CF2 [71]
292.8CF3 [71]
F 1s684.8LiF [72]
686.8LixPFyOz, LiPF6 [72]
689.1PVdF [73]
Publisher’s Note: MDPI stays neutral with regard to jurisdictional claims in published maps and institutional affiliations.

