Abstract
Silicon has become an integral negative electrode component for lithium-ion batteries in numerous applications including electric vehicles and renewable energy sources. However, its high capacity and low cycling stability represent a significant trade-off that limits its widespread implementation in high fractions in the negative electrode. Herein, we assembled high-capacity (1.8 Ah) cells using a nanoparticulate silicon–graphite (1:7.1) blend as the negative electrode material and a LiFePO4–LiNi0.5Mn0.3Co0.2O2 (1:1) blend as the positive electrode. Two types of cells were constructed: cylindrical 18650 and pouch cells. These cells were subjected both to calendar and cycling aging, the latter exploring different working voltage windows (2.5–3.6 V, 3.6–4.5 V, and 2.5–4.5 V). In addition, one cell was opened and characterised at its end of life by means of X-ray diffraction, scanning electron microscopy, and further electrochemical tests of the aged electrodes. Si degradation was identified as the primary cause of capacity fade of the cells. This work highlights the need to develop novel strategies to mitigate the issues associated with the excessive volumetric changes of Si.
1. Introduction
Lithium-ion batteries (LIBs) have influenced the technological developments of the last 30 years, from portable electronics to electric vehicles (EVs). Regarding the latter, almost all car manufacturers offer an electric model based on different LIB chemistries [1,2]. Nevertheless, it is well known that many car users foster concerns regarding ‘driving range anxiety’, which is caused by the limited mileage that EVs can achieve without recharging, the availability of recharging points, and the shorter driving range under certain climatic conditions (such as low temperature) [1]. As a result, it is necessary to develop novel materials capable of providing higher capacities at higher voltages, which translate into higher energy densities.
LiFePO4 (LFP) is the safest, state-of-the-art cathode material for automotive applications. In fact, it has been selected by Tesla for the Model 3 [3]. LFP can provide 170 mAh·g−1 at an average voltage of 3.45 V vs. Li, roughly providing 586 Wh·kgLFP−1 [4]. In order to increase the energy density of LIBs, many EV manufacturers have chosen layered metal oxides as cathode material instead of LFP. Among these layered oxides, LiNixMnyCozO2 (NMC) and LiNixCoyAlzO2 (NCA), both with x + y + z = 1, have been used in different EV models [1,5]. Many of these materials can provide higher capacities at higher voltages, leading to higher energy densities [6,7]. In particular, research associated with NMCs has pursued a decrease in cobalt content in the material replacing cobalt with nickel, which is cheaper and can lead to higher capacities [8,9]. In this context, NMC111 (Ni:Mn:Co = 0.33:0.33:0.33) has been subsequently replaced by NMC532, NMC622, and ultimately NMC811 [10,11]. Nevertheless, there is a trade-off between the high capacity resulting from high nickel content and the cycle life, as well as the thermal stability of these materials [10,11].
Regarding the negative electrode, graphite, which possesses a 372 mAh·g−1 capacity and a redox potential of 0.1 V vs. Li+/Li, has been the predominant material of the last 25 years [12]. Only Li4Ti5O12 (LTO) has questioned the supremacy of graphite, mostly for power applications [13]. However, its low discharge capacity (175 mAh·g−1) and high redox potential (1.55 V vs. Li+/Li) limit its implementation in high-energy applications [4]. Nevertheless, graphite is insufficient to achieve the highest volumetric energy density goals [14,15]. Thus, it has been blended with silicon oxide (SiOx) and silicon (Si) to enhance its capacity and energy density [12,16]. Silicon offers an excellent capacity and works at ~0.4 V vs. Li+/Li, which makes it an ideal candidate as an anode material [17,18]. Nonetheless, the drawback of this material is its low cycling stability; its immense capacity is associated with a significant volumetric expansion (+280%) that compromises the mechanical stability of Si anodes [19,20]. The continuous expansion/contraction cycles during the lithiation/delithiation cycles lead to the thickening of the solid electrolyte interphase (SEI) and fracture of the Si particles, causing the electric disconnection of these particles [18,21]. This loss of active material causes a gradual capacity decrease with the number of cycles; thus, Si displays a limited cycle life [16,22]. Si is usually combined with graphite in small fractions to obtain a compromise between an increased energy density and an acceptable cycle life. Nevertheless, the exploitation of silicon as an active material cannot be based on the decrease in its concentration until it is functional; it is necessary to determine the reactions occurring in the material upon lithiation/delithiation to optimise its use.
Theoretically and at high temperatures, Si is sequentially lithiated from its original phase to crystalline phases Li12Si7, Li7Si3, Li13Si4, and Li22Si5, providing a total capacity of 4200 mAh·g−1 [23]. At room temperature and in real LIBs, however, Si undergoes a two-phase lithiation in which the intermediate phases are amorphous [24]. By the end of the lithiation, no Li22Si5 is formed; the metastable and crystalline Li15Si4 is the silicon phase [23]. The capacity that can be obtained with the lithiation of Si to Li22Si5 is 3579 mAh·g−1 [25]. During subsequent delithiation, the crystalline Li15Si4 is removed, and an amorphous phase is obtained [23]. Thus, analysis by means of X-ray diffraction (XRD) can provide valuable information on the degree of lithiation of Si [26].
Another key aspect in the development of high-energy LIBs is the format of the cells. There are three main categories: prismatic, cylindrical, and pouch [4]. Cylindrical cells are the most widely implemented format [27]. Their dense container helps to prevent deformation due to swelling in the presence of side reactions [28]. They are defined with a numeric code (XXYYY) in which the first two numbers (XX) represent the diameter in mm, and the remaining numbers (YYY) represent the height of the cell in tenths of mm [2] Among them, the 18650 cells are the most popular; these cells were initially manufactured by Sony for their cameras, and the length of 65 mm is due to space limitations in such a device designed to be held in the palm of a single adult hand [29]. On the other hand, the diameter of 18 mm was selected due to safety reasons; it was determined as the maximum size to avoid thermal runaway for a cell of ~1 Ah capacity [29]. Recently, TESLA has announced the shift to 4860 cylindrical cells, despite the safety issues that can arise [30], which will probably have an impact on the cell size selected by other EV developers.
Even if cylindrical cells are the first option for industry, their low packing density and poor heat transport motivated battery developers to search for alternatives. Prismatic cells, with hard casings similar to those of cylindrical cells, provide safety towards swelling with increased packing density, but their energy density is ~20% lower than that of cylindrical cells [5]. In any case, most manufacturers select this format in their EVs [27]. In addition, it is believed that pouch cells (prismatic cells with a soft packaging) will be able to outperform their competitors, becoming the primary option in the near future [28].
In this work, high-energy cells with 1.8 Ah capacity were assembled in two different formats to assess the impact of the cell design and casing/packaging: 18650 cylindrical and pouch. The anode consisted of a graphite/Si mix material, while the cathode comprised of an LFP/NMC532 blend. A combination of materials was utilised to increase the energy density of the electrodes through the addition of NMC532 and Si to the stable-cycle-life LFP and graphite, respectively. NMC532 was selected due to its good compromise between high capacity and stability at high voltages [31]. Both types of cells were assembled using the same batch of electrodes and subjected to the same cycling protocols. The calendar ageing of some cells was investigated, while the cycling age of the other cells was studied using three different working voltages. Lastly, one cell was opened and characterised at the end of its cycle life.
2. Materials and Methods (Experimental)
2.1. Anode Manufacturing
The negative electrode of this work was prepared at CIDETEC’s electrode manufacturing line. The components of this electrode were nanoparticulate silicon (N-100, Tekna, Solli, Oslo) and graphite (MEG-2C, SGL Carbon, Meitingen, Germany) as anode active materials, Super C45 carbon (Imerys, Paris, France) as the conductive additive, carboxymethyl cellulose (CMC, Wallocel DOW, Midland, MI, USA) as the dispersant and binder, and styrene butadiene rubber (SBR, JSRmicro, Leuven, Belgium) as the co-binder. These components were mixed in a weight ratio of [Si/Gr/C45/CMC/SBR] = 10.4/74.6/5/5/5. The experiments performed to define the anode formulation are shown in Figure S1.
The components were water-processed in a planetary mixer. In addition, the procedure was adapted to eliminate agglomerates via pre-dispersion of Si in the CMC solution and addition of the solids (C45 and graphite) at different steps and the SBR latex at the end. Unexpected low slurry pH was measured (pH ~3), which could affect the polymer (CMC and especially the SBR) conformation. Thus, the slurry pH was adjusted to pH = 6–7 by addition of ammonia (NH4OH). Finally, a mirror-like wet coating with minimal fish-eye spots, straight edges, two-side alignment within <1 mm, and targeted loading (2.54 mAh/cm2) of 3.7 mg/cm2 within 0.3 mg/cm2 deviation between faces was achieved.
Overall, 75 m was produced in two different coating widths (130 and 205 mm, onto 250 mm-width and 10 μm thick Cu foil, Schlenk, Roth, Germany) for each of the cell formats (cylindrical and pouch cells, respectively).
The anodes with 205 mm width for soft packaged pouch cells did not need slitting. Electrodes were die-cut directly (four anodes on 14 cm wide sheet) after calendering, for the stacked design of 100 × 61 mm coated area, by CIDETEC. The anode rolls manufactured in 130 mm width coating were slit by CEA for cylindrical cells. To limit waste, CEA used a lab slitting equipment to slit the anode coating.
The calendering step for the anodes was aimed at an expected optimum porosity of 32% (1.41 g/cm3). Control of flexibility performed by bending test (no damage when the electrode was wound on mandrels with decreasing diameter) revealed no cracks on the 2 mm diameter mandrel. This coupled with the 90° peel test strength (67 ± 2 N/m) provided satisfactory mechanical results with very high adhesion to the Cu current collector.
2.2. Cathode Manufacturing
The positive electrode in the current work was developed in CEA and then upscaled, adapting viscosity with coating equipment capability for 50 L of slurry and a coating machine with an oven of 5 m length (Megtec, De Pere, WI, USA). The positive electrode consisted of LiFePO4 (LFP, beLife, Dnipropetrovsk, Ukraine) and LiNi0.5Mn0.3Co0.2O2 (NMC532) as active materials, Super C65 carbon black (Imerys, Paris, France) as the conductive additive, and polyvinylidene fluoride (PVDF, Solvay Solef® 5130, Brussels, Belgium) as the binder. The weight ratio of these components was [LFP/NMC/C45/PVDF] = 45.25/45.25/5/4.5. Finally, CEA coated 380 m of two-sided electrode from the slurry onto an aluminium current collector of 20 µm thickness and a width of 30 cm (Hydro, Oslo, Norway). The loading of this coating was 14.4 mg/cm2 (2.3 mAh/cm2). During the slitting step, the electrode width was adjusted by cutting the coils. Then, the cathode was calendered to 36% porosity (2.3 g/cm3). After calendering, a control of flexibility (satisfactory at 4 mm diameter bending) and adhesion strength (260 ± 21 N/m) was applied.
2.3. Cell Manufacturing
In order to compare the two cell designs, both the cylindrical and the pouch cells consisting of the same components (except the separator which was specific to the assembly) were conditioned with the same protocol. The separator was a tri-layer Celgard 2325 grade (Charlotte, NC, USA) for the cylindrical hard-case cells, while the stacked soft packaging cells were assembled with a modified Celgard ECT-2015 grade (same thickness) suitable for the specific lamination/winding process on the cell-assembly line. The electrolyte was composed of ethylene carbonate and dimethyl carbonate (EC:DMC) in a volume proportion of 1:1 with 1 M lithium hexafluorophosphate (LiPF6) and a blend of additives: 10% fluoroethylene carbonate (FEC), 2% lithium bis(trifluoromethanesulfonyl)imide (LiTFSI), and 2% vinylene carbonate (VC). The electrolyte was purchased from UBE Industries.
2.3.1. Assembly of 18650 Cylindrical Cells
Cell assembly was performed on semiautomatic winding equipment inside a dry room with a dew point of −40 °C. Each cell consisted of a double-side coated 55 mm wide cathode and a 57 mm wide anode with two 60 mm wide separators. Electrodes and separators were wound around a mandrel, and the resultant jellyroll was dried in a vacuum oven overnight. After welding of the tabs on the bottom and the cap for the anode and cathode, respectively, and grooving, the cells were placed in an Ar-filled glove box for electrolyte filling and crimping. A picture of the components used for the assembly of 18650 cells is shown in Figure S2.
2.3.2. Assembly of Pouch Cells
Electrodes were cut to size in a semiautomatic die-cutting unit (MTI Corp., Richmond, CA, USA) to 14 cm sheets from the electrode rolls. The cathodes and anodes were cut to different sizes (10 cm × 6.1 cm and 9.8 × 5.9 cm for the anodes and cathodes, respectively). Pictures of the die-cutting unit, a schematic representation of the cells, and a picture of the final cell are shown in Figure S3.
The stacked soft-packaging cell was designed comprising eight cathodes and nine anodes per cell. The assembly was carried out in a dry room (dew point −50 °C) by manual stacking of the electrodes after vacuum-drying at 120–140 °C for 12 h. The process, using a guiding tool to guarantee stack alignment, is depicted by the photographic sequence in Figure S4.
Electrode flanges (tabs) were ultrasonically welded to terminal tabs (100 μm thick Al (+) and Ni-plated Cu (−)) and then placed between two half-shells of aluminium laminated foil (ALF) pouch material (without depth-forming) and heat sealed on three sides before the filling step.
The cells were filled with 11.5 g (9 mL) of electrolyte, and the remaining side was thermally sealed under −850 mbar using a vacuum chamber sealer. The cells were then ready to be formed (see Section 2.4) under external pressure applied by sandwiching the cell between two stainless-steel plates.
After this formation, the cells were degassed and finally sealed under full vacuum for grading characterisation.
2.4. Electrochemical Tests
2.4.1. Conditioning (Formation)
The conditioning experiments were performed inside a temperature chamber set at 45 °C. After a resting period of 2 h, a 1 C pre-charge pulse of 10 s was applied, which was followed by a 3 h rest period for the impregnation of the electrolyte. After that, a C/10 constant current cycle between 4.5 and 2.5 V was conducted, including a constant voltage step by the end of the charge at 4.5 V until the current decreased to C/20. Afterwards, the cells were removed from the chamber, waiting until their temperature dropped below 30 °C. After this formation, the pouch cells were degassed and finally sealed under full vacuum for grading characterisation.
2.4.2. Calendar Ageing
After conditioning, four cells per format were charged to 3.6 V (two cells per format) and 4.5 V (two cells per format) and stored at 25 °C for 58 days (for the pouch cells) and 96 days (cylindrical cells). The cells were kept at an open-circuit voltage state. The capacity evolution during calendar ageing was determined after two consecutive cycles with a 0.3 C charge and discharge current rate.
2.4.3. Electrochemical Ageing
The cycling ageing tests were applied on cylindrical and pouch cells. Cycle ageing was performed with a current of 0.3 C for both charging and discharging within three different voltage windows: (i) between the minimum and maximum voltage limits (2.5–4.5 V), which includes the transition between LFP and NMC and between two intermediate voltages, (ii) 3.6–4.5 V, and (iii) 2.5–4.5 V to investigate the ageing degradation on the different LFP and NMC voltage working range. Each test was carried out on two cells from the same batch to ensure the test result repeatability. Electrochemical tests were performed with a Basytec Cell Test System potentiostat at 25 °C ± 1 °C (at CIDETEC facilities, Donostia-San Sebastian, Spain), a Maccor cycler S4000 (at Helmholtz Institute Ulm, Ulm, Germany), and a PEC SBT0550 battery cycler (at CEA, Grenoble, France).
2.5. Post-Mortem Characterisation
One cylindrical cell was opened to conduct post-mortem characterisation of its electrodes. This cell was previously cycled at 25 °C and within the voltage range 2.5 V–4.5 V until it reached 70% state of health (SOH) after 44 cycles. The cell was then fully discharged (0% state of charge, SOC) and introduced in an argon-filled glove box (MBraun, München, Germany) with O2 and H2O concentration below 1 ppm, respectively. The venting was pierced to evaluate the internal pressure, the free electrolyte was recovered by the venting, and the cell case was cut. Afterward, the electrode roll was extracted and unwound. The positive and negative electrodes were separated, and samples for post-mortem and extended electrochemical analyses were cut out from the middle part of the recovered sheets (avoiding the external parts of the electrodes). These samples were rinsed with DMC solvent; rinsing baths of solvent were used, in which each sample was soaked for approximately 30 s. Pristine samples were studied in parallel.
Scanning electron microscopy (SEM) imaging and energy-dispersive X-ray spectroscopy (EDX) was performed on a carbon-sputtered sample using a JSM 7600F (JEOL, Tokyo, Japan). The crystallographic analysis of the different samples was performed by means of powder XRD, using a Bruker D8 Discover diffractometer (Cu Kα radiation, λ = 0.154 nm, Billerica, MA, USA) equipped with a LynxEye PSD detector (Stockholm, Sweden). The diffractograms were recorded between 2θ = 10° and 80° at 0.003°·s−1. XRD and SEM analyses were performed using an inert transfer chamber to protect the sample from the external atmosphere.
Lastly, some samples were also used to assemble half coin cells (HCCs, CR2032 configuration) using lithium metal (Rockwood Lithium, 500 μm thick, Frankfurt, Germany) as the counter electrode. Electrodes of 1.13 cm2 were punched and assembled in an argon-filled glove box (H2O < 0.1 ppm, O2 < 0.1 ppm) versus lithium, using Whatman, GF/D separator (Maidstone, UK), and 120 μL of 1 M of LiPF6 in EC:DMC (1:1) + 10% FEC, 2% LiTFSI, and 2% VC electrolyte. These cells were subjected to two cycles at C/20 followed by a rate capability test and 150 cycles at C/3 (for the half coin cells with recovered negative electrode) or 1 C (for the half coin cells with recovered positive electrode). The tests were conducted at 20 °C. The potential windows for positive and negative electrode HCCs were 4.3 V–2.6 V and 1.0 V–10 mV, respectively.
2.6. Three-Electrode Cells
Three-electrode cells were assembled to monitor the potential of each of the electrodes upon galvanostatic cycling. Three-electrode Swagelok cells were assembled in an MBraun argon-filled glove box with oxygen and water contents below 1 ppm. Lithium metal foil (Rockwood Lithium, Frankfurt, Germany) was used as reference electrode along with glass fibre separators (Whatman, Cytiva, Maidstone, UK), soaked with 1 M LiPF6 in EC:DMC (1:1) + 10% FEC, 2% LiTFSI, and 2% VC electrolyte.
3. Results
3.1. Conditioning Results
Figure 1 shows a representative conditioning cycle of one of the cells.
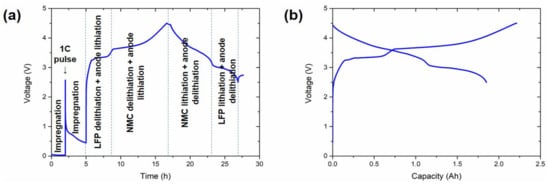
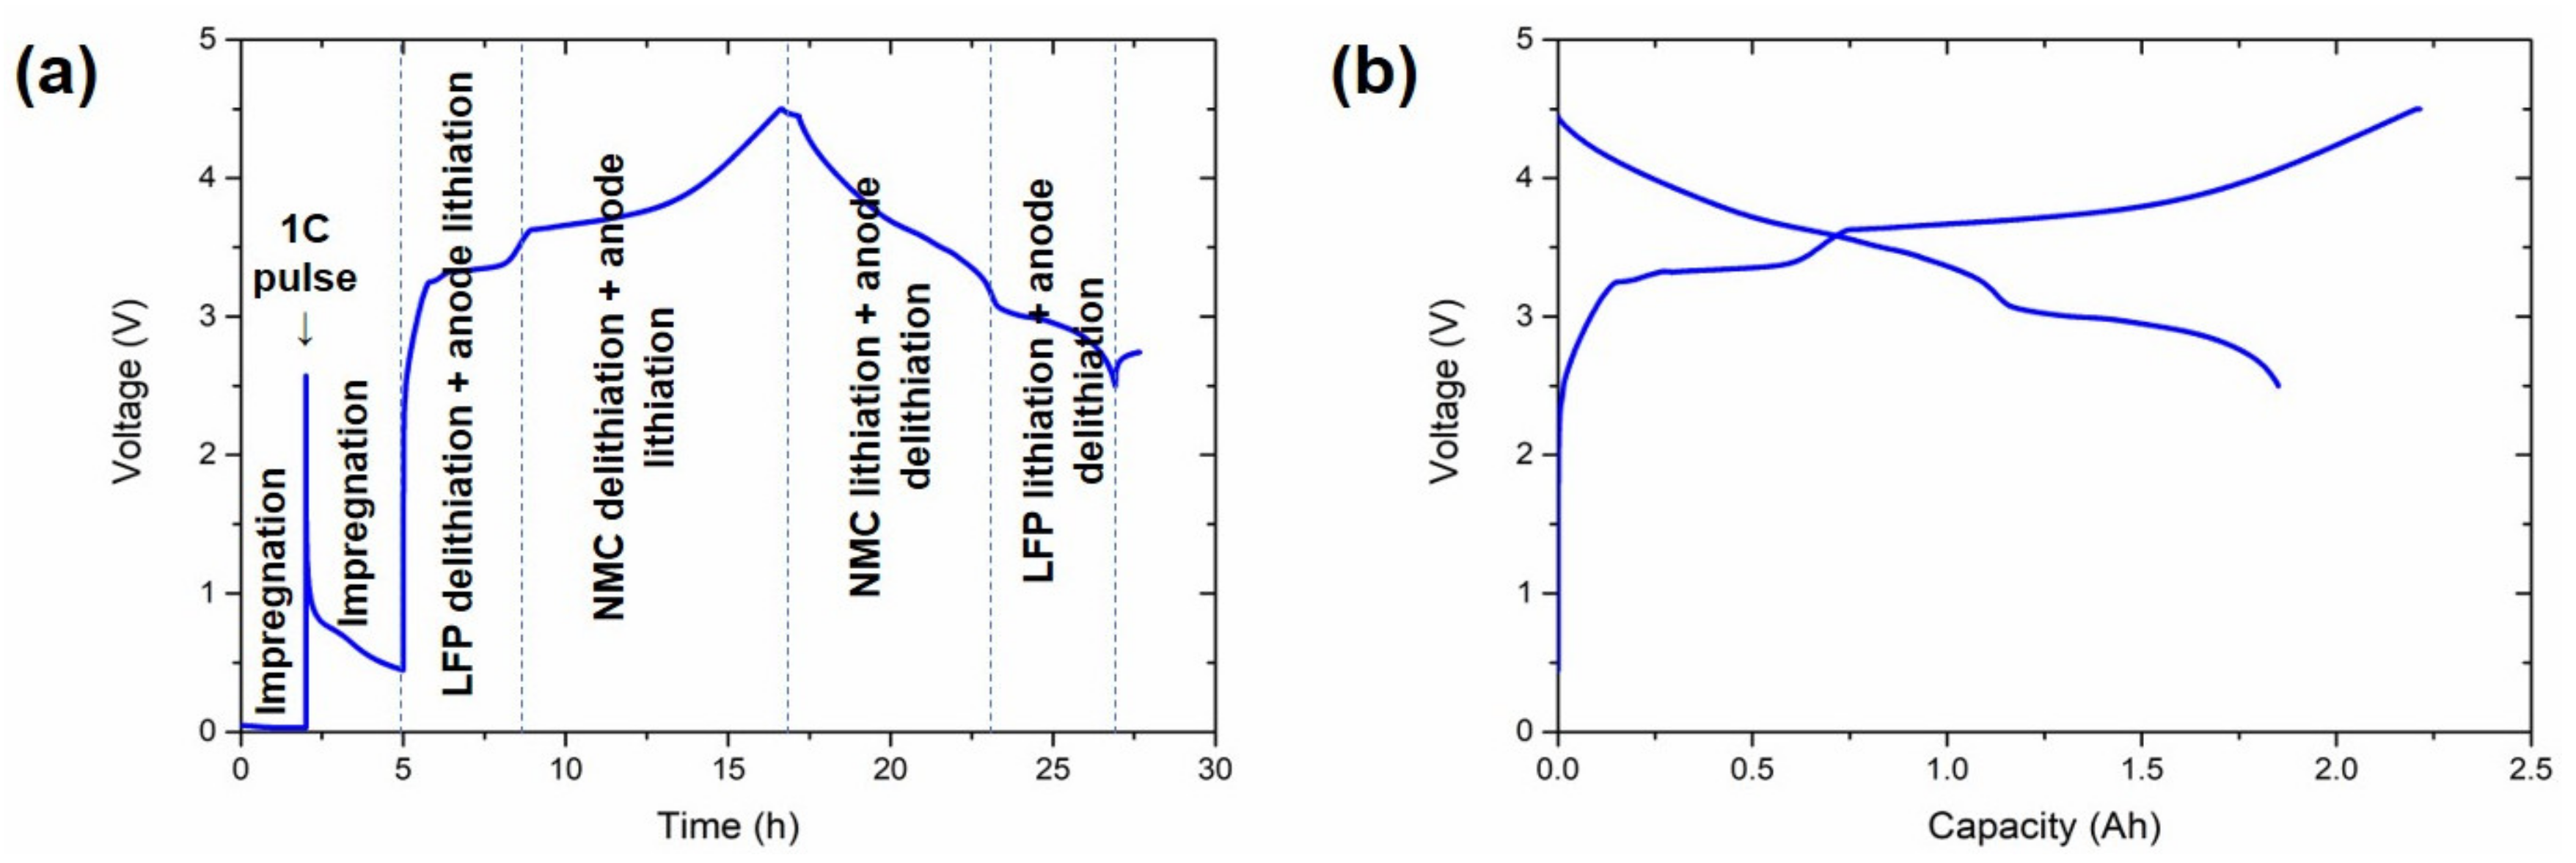
Figure 1.
Characteristic conditioning cycle of the cells. (a) Voltage vs. time representation and (b) voltage vs. capacity representation. Electrochemical processes at each step of the profile are indicated in (a).
The conditioning cycle at 45 °C is divided into different steps in Figure 1a. Initially, a 1 C pulse of 10 s was introduced in between two resting periods of 2 and 3 h. The aim of these resting periods was to achieve an efficient impregnation of the electrodes and the separator with the electrolyte, while the pulse was applied to avoid copper oxidation at ~0 V. Afterwards, a C/10 C-rate was applied throughout the charge step. The potential initially increased rapidly until ~2.5 V, at which point the SEI was formed [32]. The delithiation of the LFP, together with the lithiation of the anode, was the reaction corresponding to the plateau between 3.35 and 3.5 V. Even if it is easy to ascribe this plateau to LFP in the cathode, it is not trivial to identify the anode active material (Si or graphite) undergoing the reduction reaction. This analysis was performed using a three-electrode cell and is discussed in Section 3.3. The delithiation of NMC532 and the lithiation of the anode were the main reactions occurring above 3.5 V. Most of the charge capacity was obtained in this last region (~1.3 Ah), with the capacity in the LFP delithiation region being only ~0.45 Ah (Figure 1b).
The subsequent discharge was initiated with the delithiation of the anode and the lithiation of the NMC532 (~1.1 Ah), followed by a stable plateau between 3.1 and 2.5 V for LFP lithiation and the delithiation of the anode.
The discharge capacity and coulombic efficiency obtained for the pouch cells were 1.81 ± 0.05 Ah and 82.3% ± 0.5%, respectively, whereas 1.93 ± 0.02 Ah and 86.6% ± 0.3% were obtained for the 18650 cells (Table 1). The higher discharge capacity obtained in the 18650 cells probably originates from the different behaviour towards the residual water content during cell assembly. For the first point, all the cells were assembled in a dry room, paying attention to dry all the components before assembly. It is reasonable to consider that the cylindrical configuration is more resilient at maintaining pressure on the electrode and to avoid the particles from disconnecting even if the pouch cells are formed between two plates.

Table 1.
Average first cycle discharge capacity (at C/10) and coulombic efficiency, second cycle discharge capacity (at 1 C), and AC resistance of the pouch and the 18650 cylindrical cells assembled.
3.2. Calendar Ageing
Figure 2 shows the evolution of SOH at the end of the calendar ageing test of both the cylindrical and the pouch cells at 3.6 and 4.5 V. The SOH was calculated using Equation (1).
where is the discharge capacity measured at the end of the ageing test, and is the discharge capacity measured before the ageing test (initial capacity), both obtained at a 0.3 C-rate.
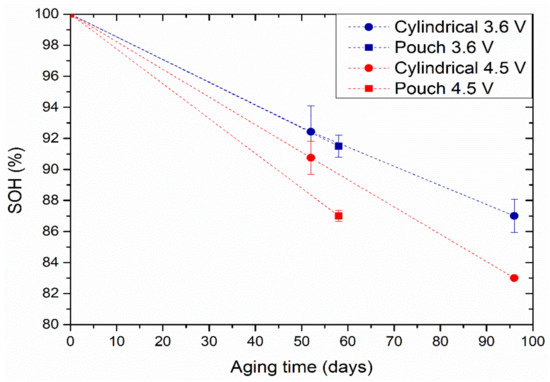
Figure 2.
SOH evolution upon calendar aging at 25 °C for cylindrical (circles) and pouch (squares) cells at 3.6 V (blue markers) and 4.5 V (red markers). Error bars indicate the standard deviation between the two cells per experiment.
The capacity of the cells stored at 3.6 V seems to decrease more slowly than that of the cells stored at the higher voltage of 4.5 V. This is because the electrolyte degrades faster at higher voltage, i.e., when the cell is fully charged. On the other hand, the degradation is higher in pouch format when aged at 4.5 V. No notable differences were observed between the two cell formats at 3.6 V calendar aging.
3.3. Cycling Aging: Effect of the Voltage Cycling Window on the Capacity Fade Rate
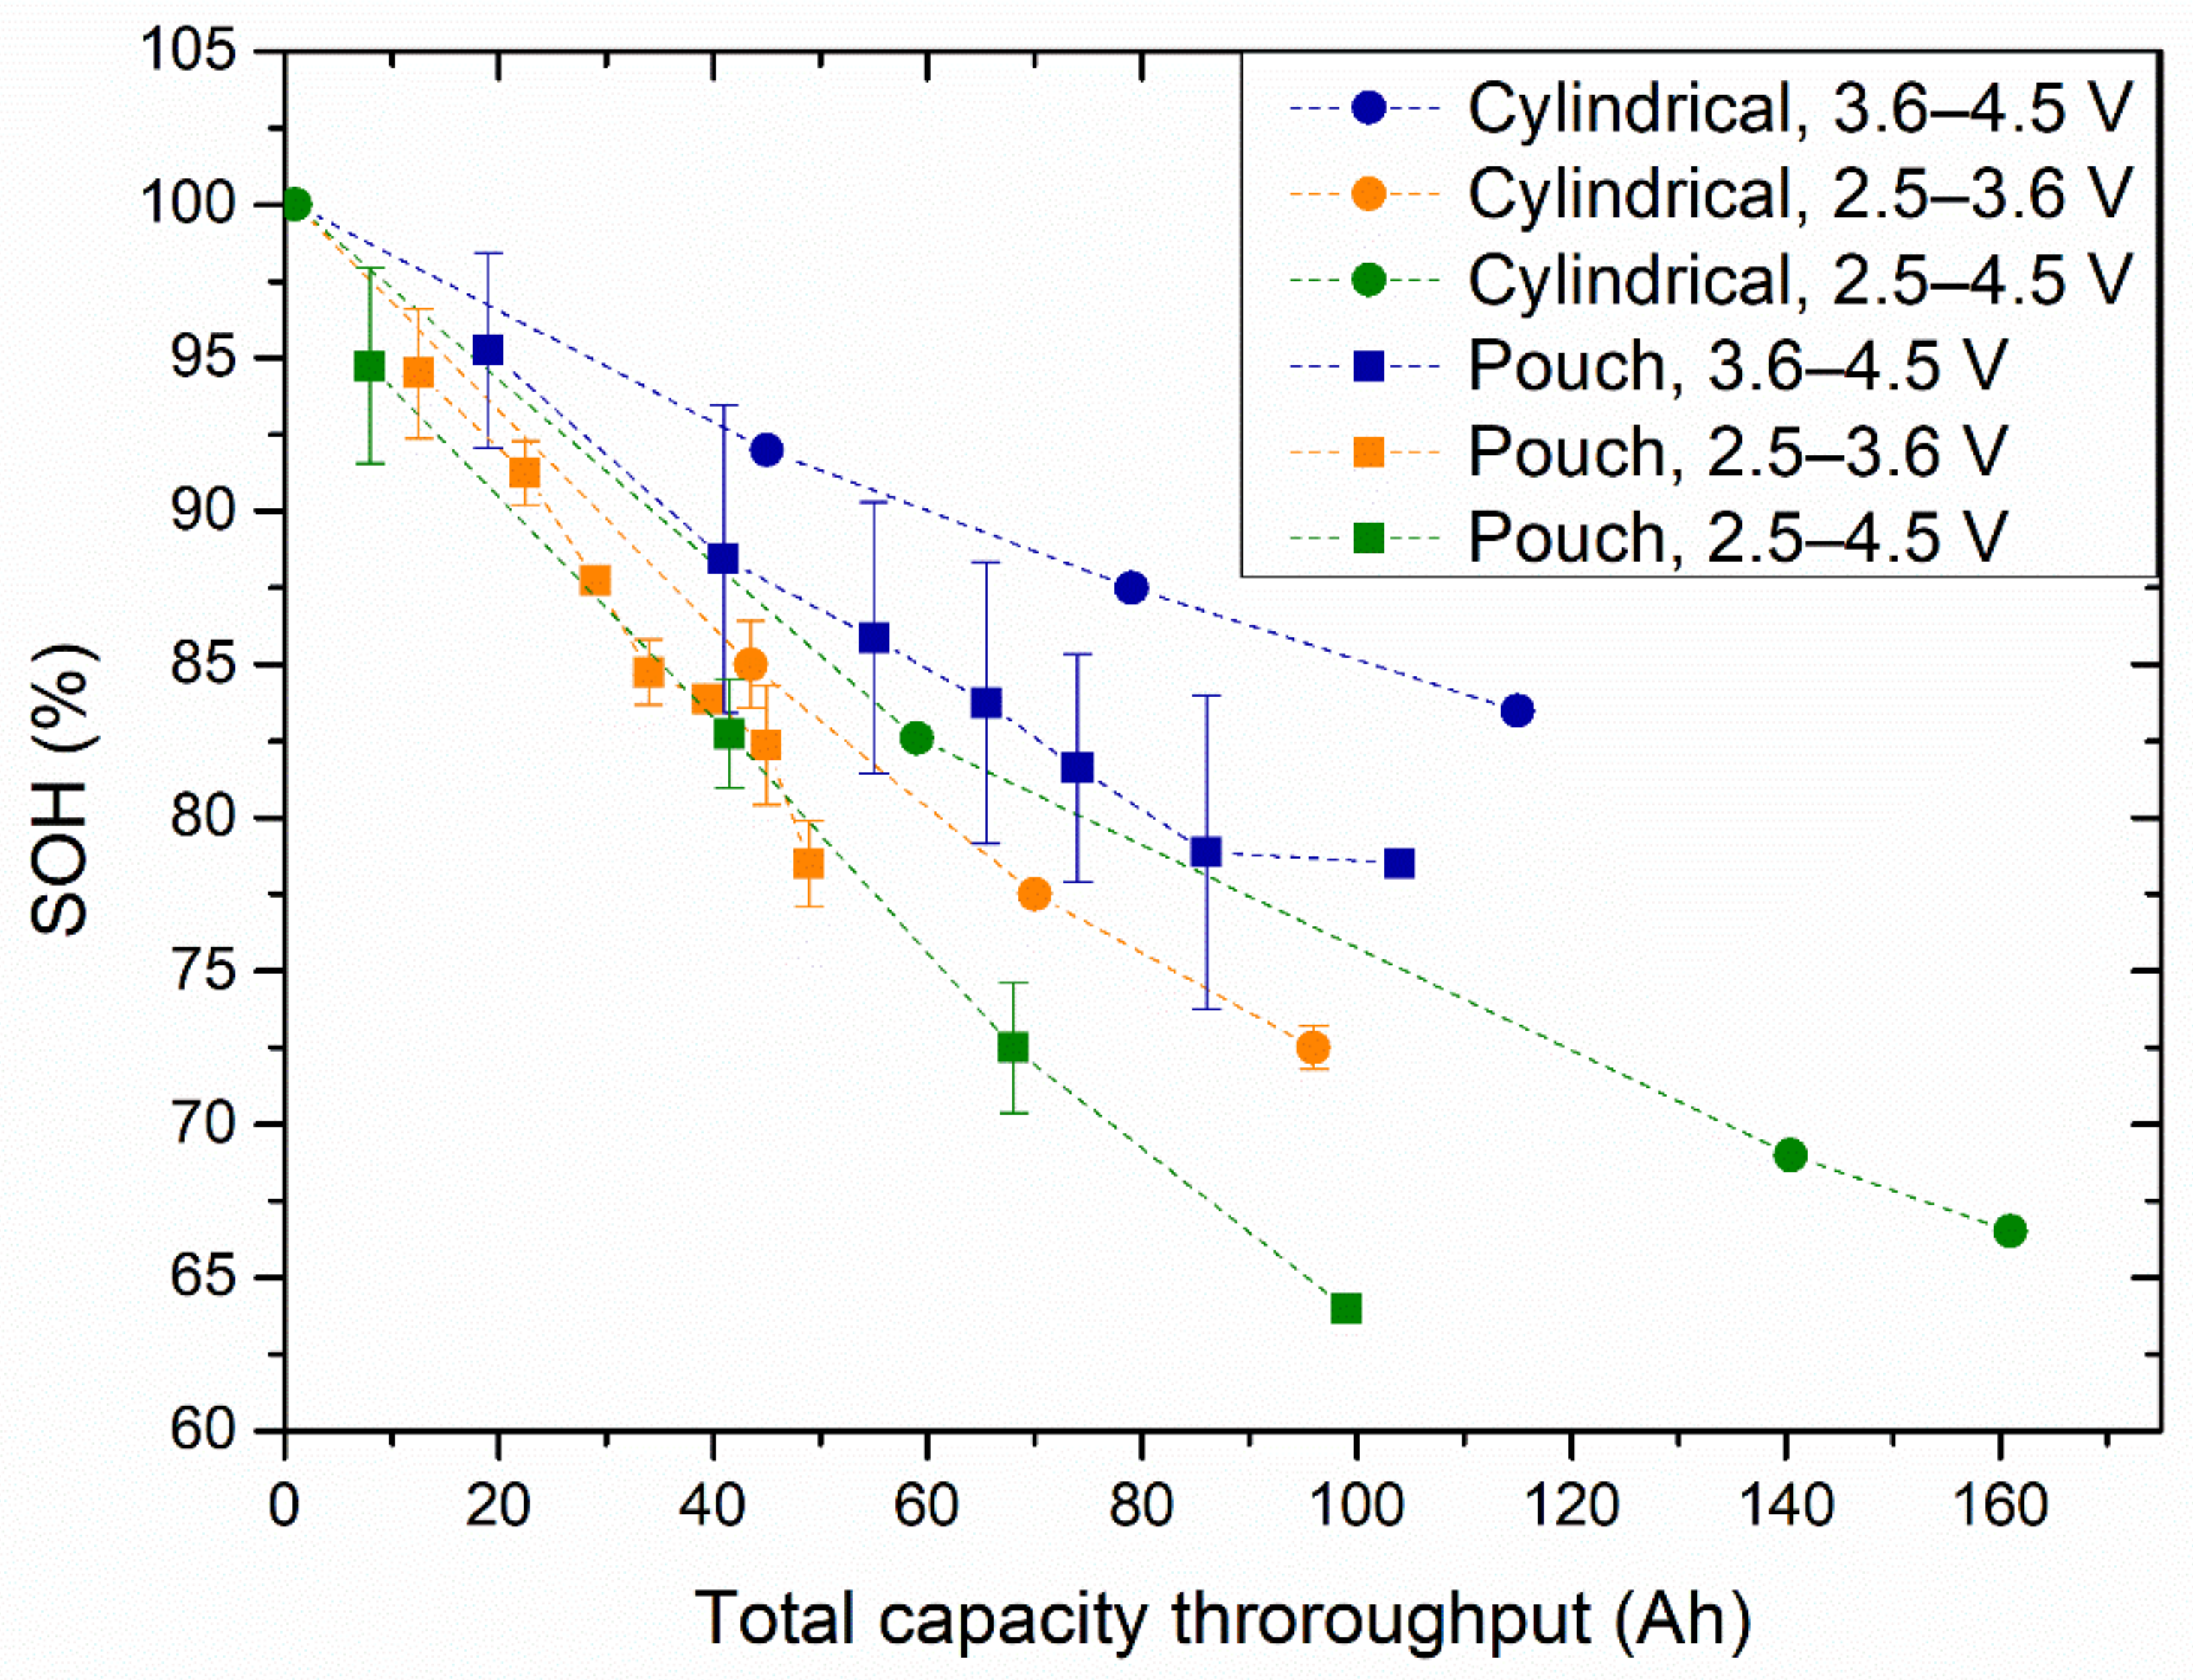
Figure 3 shows the evolution of the SOH versus the total capacity throughput (cumulative capacity during the cycle life) of the cylindrical and pouch cells at 25 °C. The circles, triangles, and squares indicate the cells cycled in the 2.5–3.6 V, 3.6–4.5 V, and 2.5–4.5 V voltage windows, respectively.
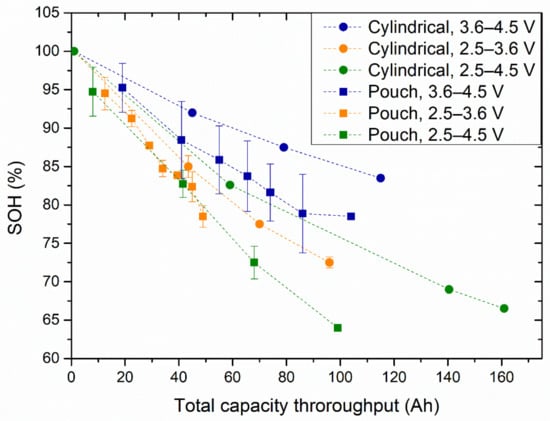
Figure 3.
SOH evolution with the total capacity throughput for cylindrical (circle markers) and pouch (square markers) cells cycled in the 3.6–4.5 V (blue markers), 2.5–3.6 V (orange markers), and 2.5–4.5 V (green markers) voltage windows.
Similar to what was observed for the calendar ageing tests, the pouch cells seemed to degrade faster than the cylindrical cells.
For both cell formats, the cells cycled within the 3.6 to 4.5 V voltage window showed the slowest ageing rate, compared to the cells cycled within the voltage windows of 2.5 to 3.6 V and 2.5 to 4.5 V. For the latter two cases, there was a minimal difference between the capacity of the cylindrical cells, which showed slightly higher capacity retention. On the other hand, the pouch cells showed similar capacity degradation at those two voltage windows.
To provide further insight into the cause of the differences in the capacity retention of the cells depending on the voltage window, a three-electrode Swagelok cell with Li as the reference was assembled and cycled between 2.5 and 4.5 V. The electrochemical results obtained with this cell are shown in Figure 4.

Figure 4.
Experiments with a three-electrode cell consisting of an NMC-LFP cathode, a Gr/Si anode, and a Li reference electrode cycled at 25 °C between 2.5 and 4.5 V at a C/3 C-rate. (a) Discharge capacity with the cycle count. (b) Voltage profiles at C/20. Differential capacity plot at (c) C/20 and (d) C/3 of the anode voltage profiles. Delithiation features associated with graphite and silicon utilisation in (c) are highlighted in yellow and green, respectively. Evidence of a lack of silicon activity after 50 cycles in (d) is highlighted in purple.
The curve of the capacity evolution with the cycle count (Figure 4a) showed an almost linear and steep capacity decay after the two initial C/20 cycles. These two initial cycles are analysed in detail in Figure 4b, where the contribution of the anode and the cathode were obtained through the use of the reference electrode included in the cell. Both cycles displayed that the discharge capacity of the full cell was limited by the delithiation of the anode in the voltage window selected (2.5–4.5 V). The differential analysis of the lithiation and delithiation curves of the anode in these two cycles are shown in Figure 4c, where the peaks associated with the (de)lithiation of graphite and silicon are differentiated. It can be observed that the delithiation of silicon occurred at ~0.4 V, which is close to the lower cut-off voltage of the full cell (below 3 V in Figure 4b). This contribution disappeared in the DVA curve with the repetitive lithiation/delithiation steps at C/3, as highlighted in Figure 4d. Thus, the cells cycled within the voltage window of 3.6–4.5 V were cycled in a range that avoided deep Si lithiation/delithiation. These results explain the higher cycle life observed in cells cycled at the 3.6–4.5 V voltage window.
3.4. Post-Mortem Characterisation
One of the cylindrical cells cycled in the voltage window 2.5–4.5 V was dismantled (Figure S5) and subjected to material and electrochemical characterisation, particularly of the electrodes. On initial visual analysis, the negative electrode presented large de-bonding areas, as shown in Figure S6. The zones strongly adhered to the separator were white/grey, while no drastic colour change was observed for the separator which mainly remained white (Figure S7). The jelly roll was still well soaked by the electrolyte during dismantling. The positive electrode unexpectedly showed a very high degree of debonding, as shown in Figure S8. Usually, no (or very-low level) debonding occurs for the positive electrodes. Nevertheless, undamaged samples of this electrode showed a very high adhesion of around 100 N/m.
3.4.1. SEM-EDX
The SEM images of the positive electrode are given in Figure S9. The positive post-mortem electrode was composed of a mixture of particles with small (Ø < 1 µm) and larger (1 µm < Ø < 5 µm) particle sizes. Some carbon fibres were also observed. The morphology of the positive electrode was homogeneous in large zones, as shown in the lowest-magnification SEM picture.
EDX analysis, corresponding to a rectangular zone (~40 × 55 µm), is presented in Figure S10. The positive electrode was mainly composed of C, O, Fe, and P elements. Mn and Ni were also detected, but in smaller amounts. The Co signal was not detected, but it could have been masked by the Fe main peak, as it appeared in the same energy domain. The EDX analysis was also performed in three different zones, as described in Figure S11. The EDX spectra are compared in Figure S12; Point 1 corresponds to an area with a large particle size (1 µm < Ø < 5 µm). EDX analysis revealed the main composition of Mn, Ni, and Co elements, thus corresponding to NMC532 particles. A small amount of P was also detected; however, because of the small amount of P along with peak overlap, it was difficult to deduce the chemical nature of the P-containing material. It could correspond to LiPF6 or LiFePO4 materials, as F or Fe peaks would have been masked by the Mn, Co, and Ni peaks. On the contrary, EDX analysis of Point 2 and Point 3 showed similar compositions. Here, Fe and P were the main elements, together with C and O, as shown in Figure S12. No other elements such as Ni, Mn, or Co were detected; thus, it corresponded to LiFePO4 material.
The negative electrode (Figure S13) was composed of nanometric (Ø ~200 nm) and micrometric (Ø ~5–10 µm) particles. The micrometric particles were smooth. The electrode seemed to be homogeneous, as shown in the lowest-magnification (×200) SEM picture, corresponding to a rectangular area of 400 × 600 µm2. Furthermore, no deposited particle was observed on the surface of the electrode. EDX analysis of a rectangular area with dimensions of 150 × 200 µm2 is shown in Figure S14. The main elements from the negative electrodes, namely, C, O, and Si, were detected, while F and P were also observed, likely derived from the SEI layer and/or LiPF6 salt. Lastly, small amounts of Mn were observed, indicating dissolution of Mn from the positive electrode, followed by its reduction in the negative electrode. Similar EDX analysis and conclusions were also obtained with another area having smaller dimensions (40 µm × 55 µm). EDX analyses were also performed in three different zones of the electrode, as shown in Figure S15. Point 1 corresponds to the micrometric particles, whereas Point 2 and Point 3 correspond to the nanometric particle agglomerates. However, in the Point 2 area, the nanometric particles seemed to be ‘naked’, whereas they seemed to be covered by a ‘layer’ in Point 3. The respective EDX spectra are given in Figure S16. In all three areas, C, O, and Si were detected. Furthermore, Na, F, and P elements were also observed. The Na was attributed to the CMC binder, whereas F and P stemmed from LiPF6 residues and/or the SEI layer. Mn from the dissolution of the positive electrode was only observed in Point 2. Lastly, a very small amount of S from LiTFSI additive in the electrolyte, close to the detection limit, was detected in Point 2 and Point 3. The intensity of the Si peak in Point 1 was the lowest. This is consistent with the morphology of the particle, which preferably corresponded to graphite (micrometric) rather than Si (nanometric) particles. However, Si particles could have been deposited on the surface or very close to the graphite particles, as Si was detected. In Point 3, the intensity of C and F peaks was higher than in Point 2. This likely corresponds to an SEI-like layer, which is in good agreement with the SEM observations, where a thin layer was observed. Its composition could have been LiF rather than LixPOyFz, because the intensity of the P peak did not change between Point 2 and Point 3.
3.4.2. XRD
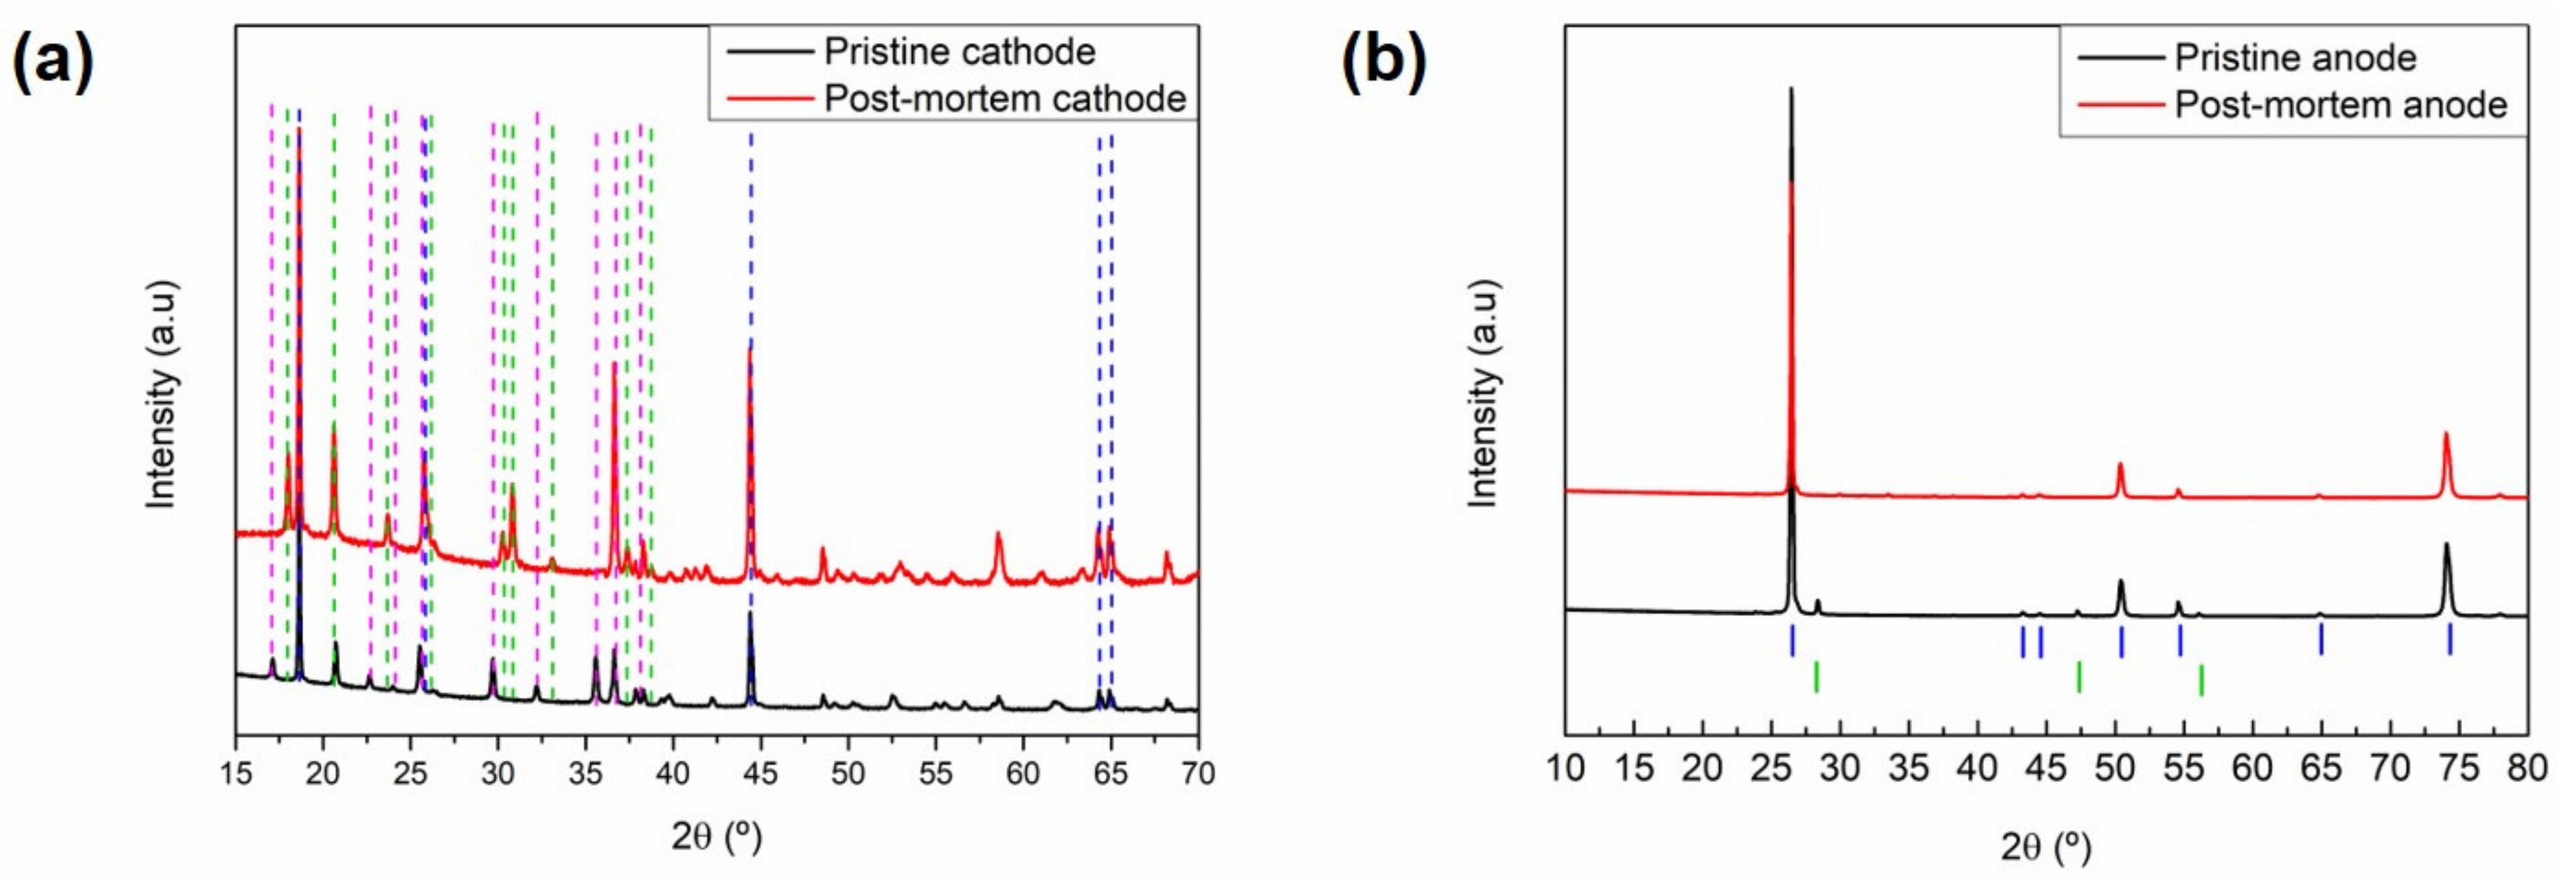
The samples of the positive and negative electrodes taken from the aged cells are compared with their corresponding pristine electrodes in Figure 5. The two active materials of the cathode blend, i.e., LiFePO4 (JCPDS No. 83-2092) and NMC532 (JCPDS No. 00-85-1968), could be clearly indexed for the pristine sample (Figure 5a). On the other hand, the aged electrode showed no presence of the lithiated phosphate, and only the FePO4 phase could be observed. This suggests significant lithium inventory loss in the cell; hence, the remaining cyclable lithium only allowed the lithiation of the NMC phase and was not available for the phosphate phase (reaction at lower voltage). This is also supported by the electrochemical characterisation of the harvested cathodes (Figure 6a). Additionally, there was no significant change in the NMC532 phase that would indicate structural ageing.
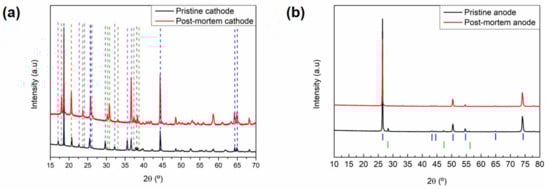
Figure 5.
X-ray diffraction patterns of the pristine and aged electrodes. (a) Cathodes and (b) anodes. Blue, green, and pink dashed lines in (a) are ascribed to diffraction features of NMC532, LFP, and FePO4, respectively. Blue and green markers in (b) are ascribed to graphite and silicon, respectively.
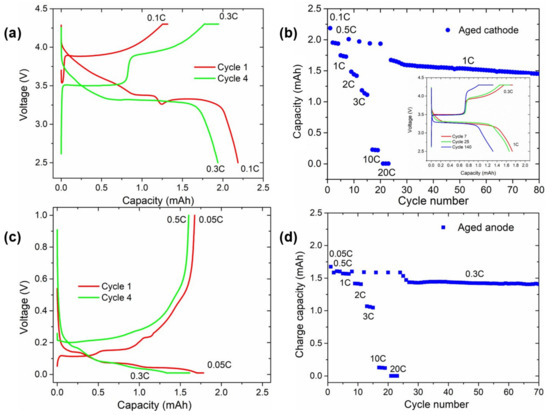
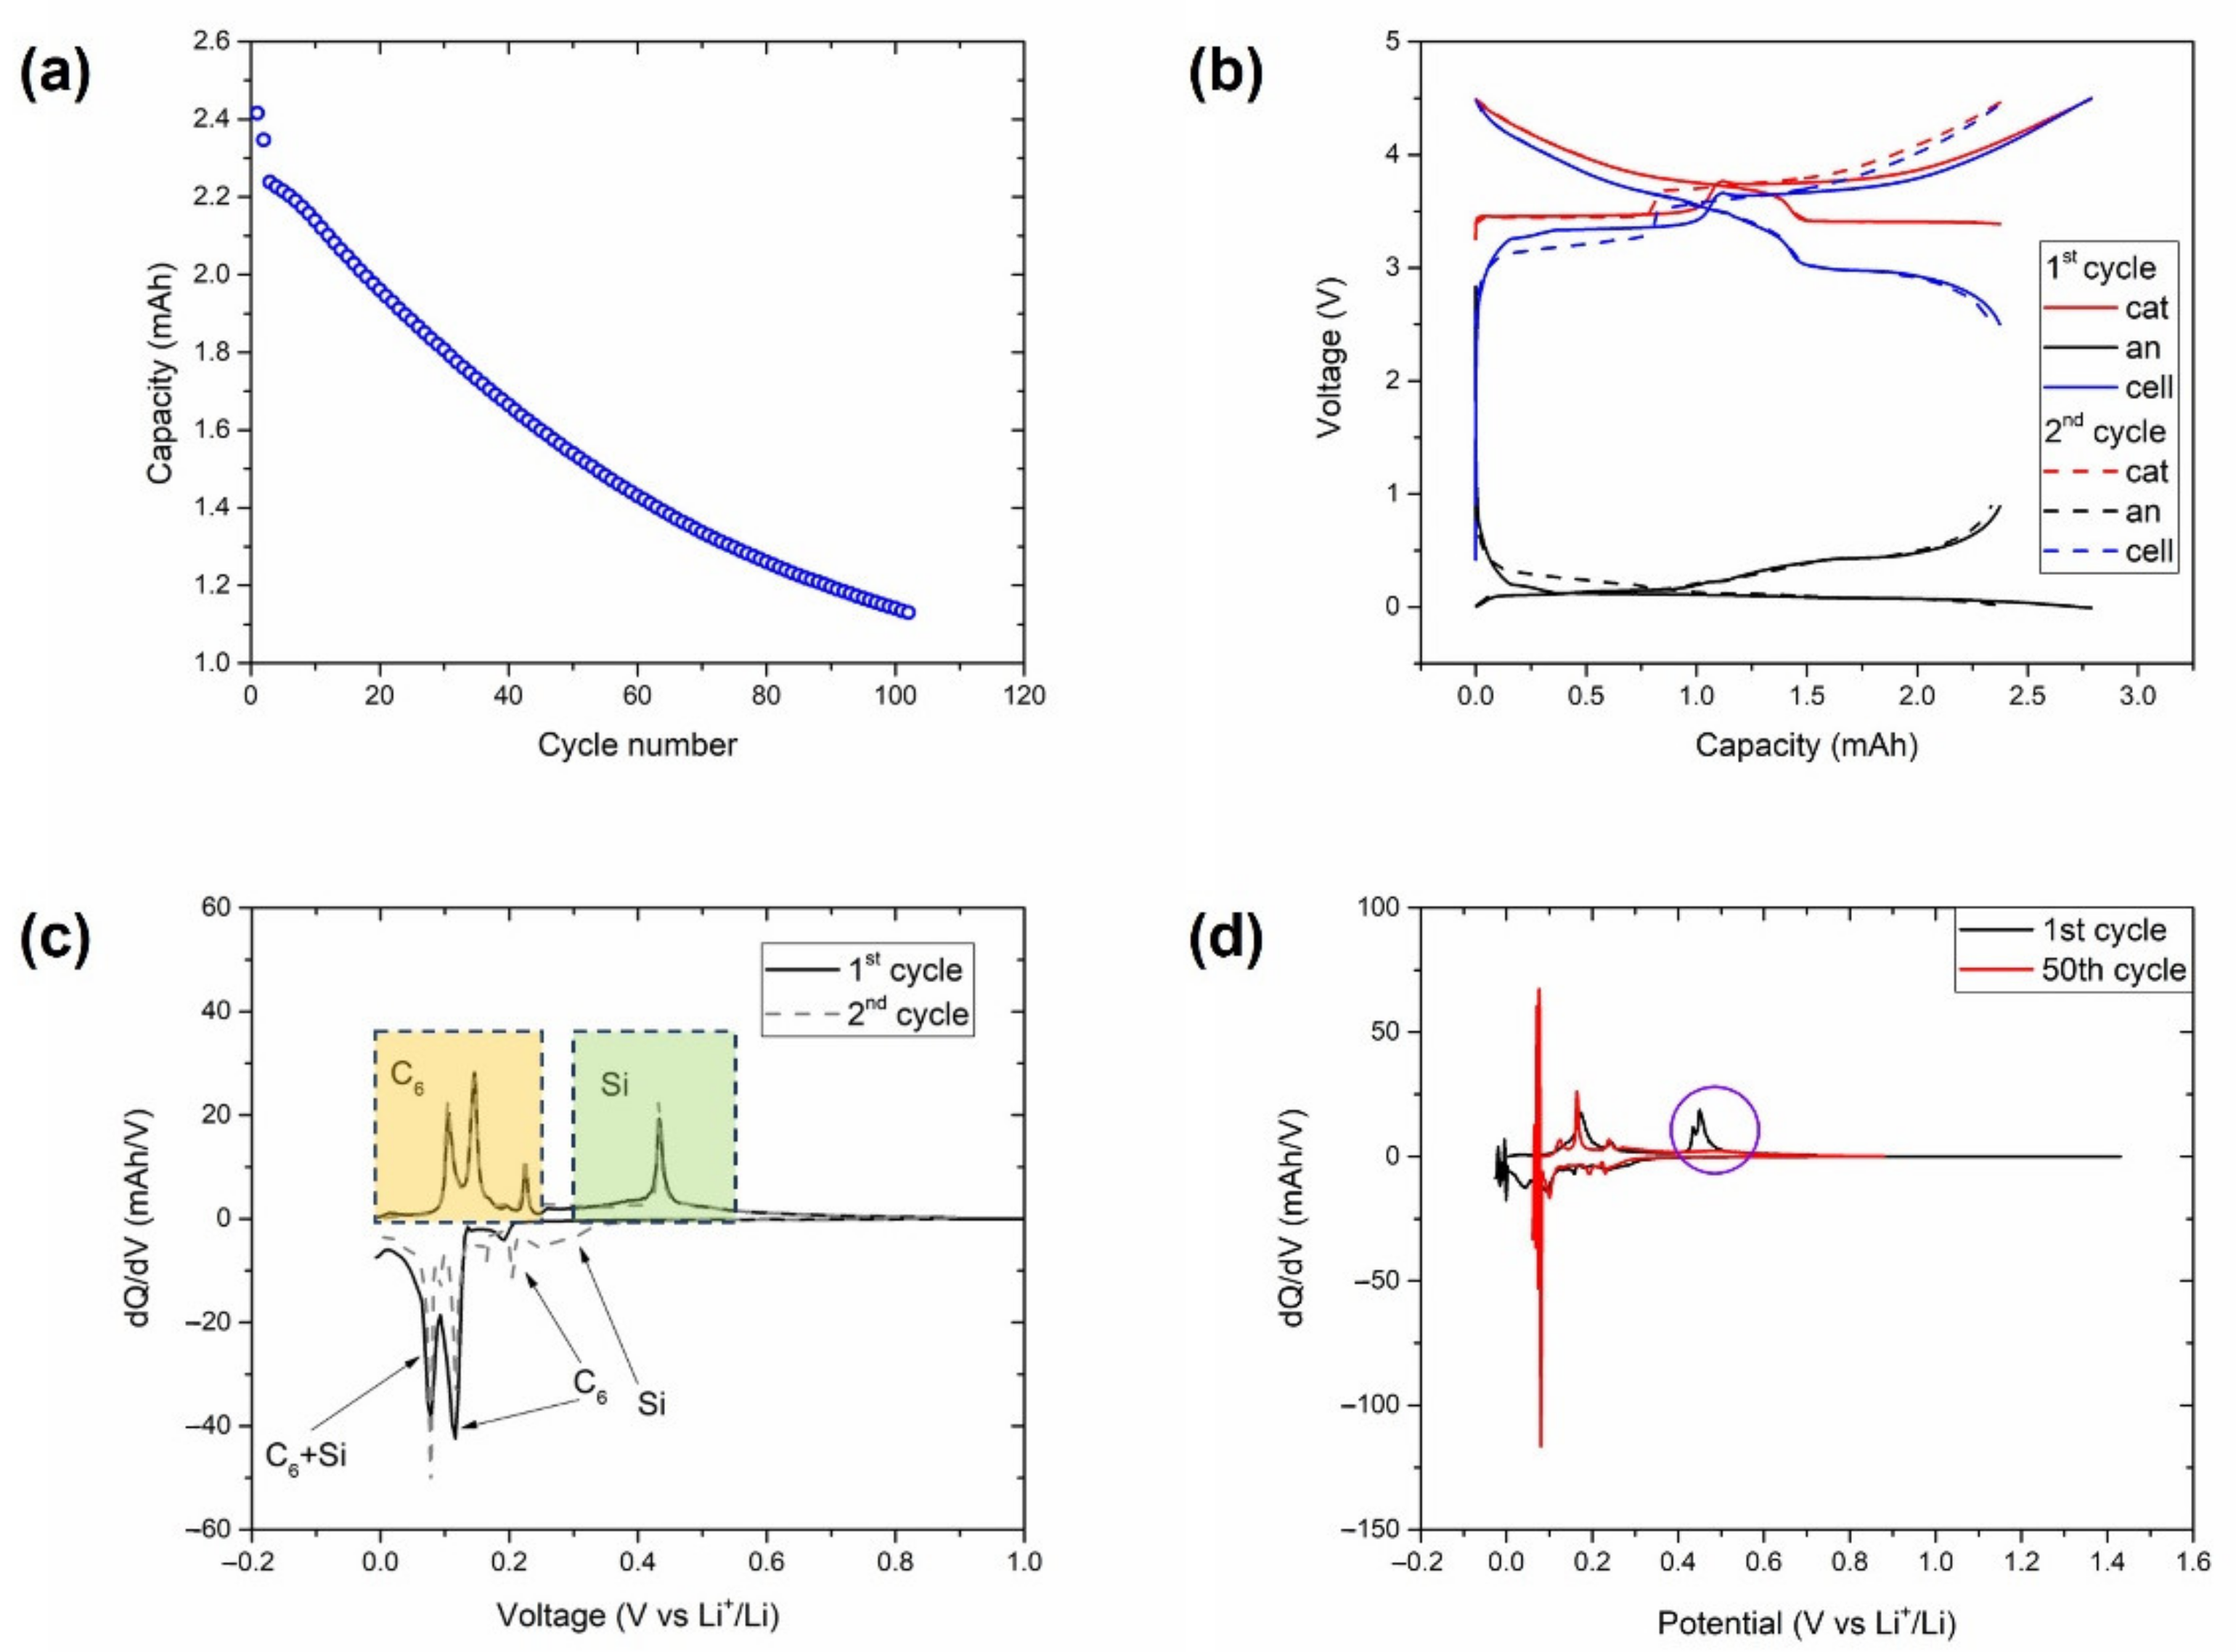
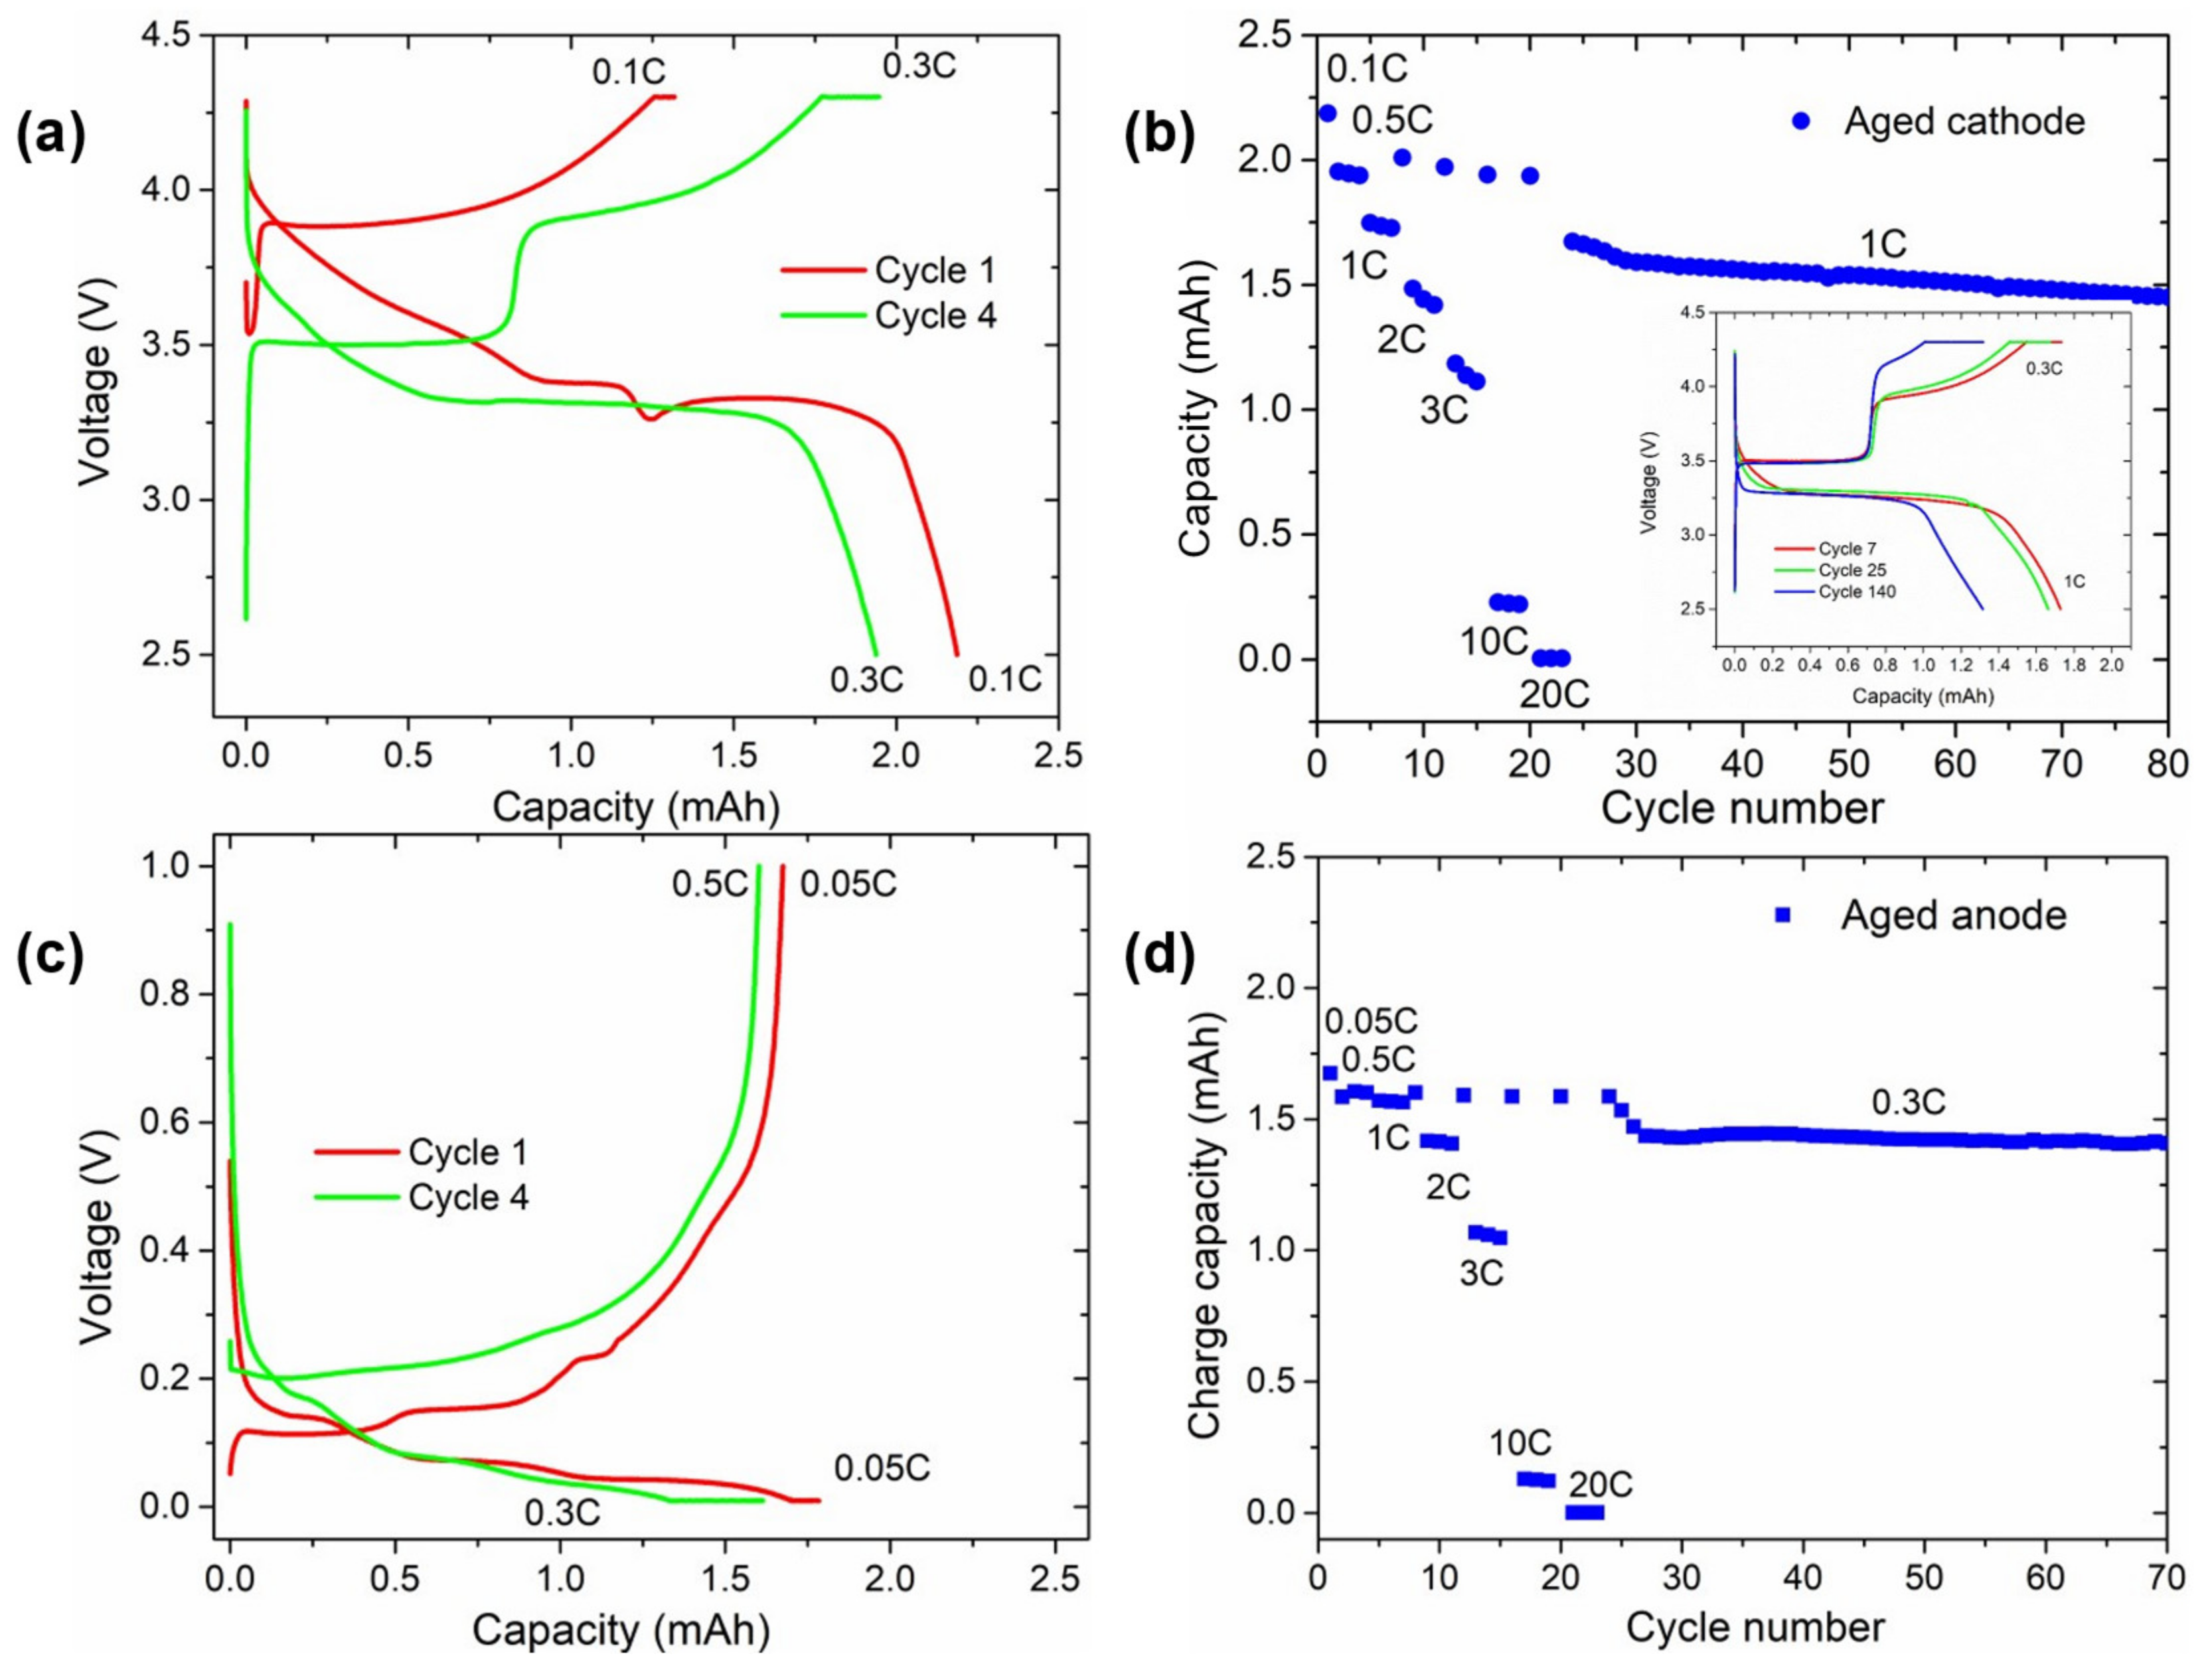
Figure 6.
Comparison of the voltage profile and subsequent rate capability test from aged (a,b) cathodes and (c,d) anodes. Red and green galvanostatic curves correspond to cycles number 1 and 4, respectively. The inset in (b) shows the voltage vs. capacity curve of these cells for cycles 7 (red line), 25 (green line), and 140 (blue line) at 1 C discharge and 0.3 C charge C-rates.
Regarding the anode (Figure 5b), graphite (88 wt.%) and silicon (12 wt.%) could be clearly observed and indexed for the pristine sample. In the aged sample, however, while no major changes could be observed for the graphite (JCPDS No. 01-73-5918) phase (no shift of 00l reflection), the contribution of silicon (JCPDS No. 00-005-0565) nearly disappeared, as evidenced by the absence of the peaks detected in the pristine sample at 28.4° and 47.3°. Instead, several additional peaks with low intensity could be distinguished in the aged sample, particularly in the 30° to 40° range. The compounds leading to these reflections remain unidentified.
3.4.3. Electrochemical Characterisation of Aged Electrodes
Some electrodes disassembled from the aged cylindrical cell were punched and assembled in half coin cells. Figure 6 displays the results of the half-cells assembled using the aged electrodes. The voltage profile of the first and fourth cycles of the cathode half-cell subjected to galvanostatic cycling are shown in Figure 6a, while the rate capability test can be found in Figure 6b. The first delithiation of the aged cathode showed a high polarisation of up to ~3.8 V with a similar profile of NMC and absence of active LFP. Upon discharge, the first part of the voltage slope was attributed to the lithiation of NMC until a plateau at ~3.4 V, corresponding to the reactivation of LFP. The voltage profile of the fourth cycle clearly showed the voltage profiles of both NMC and LFP, confirming that the structure of both cathode materials was not damaged. Nevertheless, in Figure 6b, the long-term cycling of the cathode in the half-cell is also displayed, highlighting that, even when using excess fresh electrolyte and lithium metal as the anode, the cell suffered from a constant capacity fading. Overall, the NMC capacity was reduced upon cycling, while the plateau of LFP was less altered (inset of Figure 6b).
The residual capacity of the anode (Figure 6c) was below 2 mAh, and no charge plateau at 0.4 V characteristic of Si delithiation was visible. Its absence even during further cycling (and the low capacity but high stability of the anode for more than 100 cycles in Figure 6d) suggests the complete loss of Si activity.
4. Discussion
Overall, the performance of pouch cells was lower than that of cylindrical cells in cycling and calendar ageing tests. This can be attributed to two different factors. On the one hand, the hard casing of cylindrical cells can prevent excessive volumetric expansion. Berckmans et al. evidenced that the application of external pressure can provide higher capacity and lower cell resistance with extended cycle life [33]. They attributed this improvement to the limitation of the swelling of the Si particles. The coulombic efficiency was higher for cylindrical cells, evidencing the lower occurrence of irreversible reactions. In addition, calendar ageing experiments revealed that hard cylindrical casing was more efficient in avoiding capacity loss than soft pouch packaging. This could be associated with the easier deformability of the latter format, which could allow side reactions such as gassing. Although the pouch format could improve the packaging density of the cells, the energy and number of cycles that we could obtain from these cells remain unsatisfactory; hence, additional development is required, such as control of the optimum external pressure.
Furthermore, the electrochemical and post-mortem characterisation of the cells further support that the origin of the capacity fade of the cells could be attributed to the loss of cyclable Si. As discussed in Section 1 and evidenced by the three-electrode cell, the lithiation of bulk crystalline silicon proceeded via a two-phase reaction (ca. 0.17 V) and involved the formation of amorphous LiySi. The complete lithiation resulted in crystalline Li15Si4. Reversing the process, amorphous LizSi was formed via a two-phase reaction (ca. 0.45 V), followed by the complete delithation (via a solid solution mechanism) of amorphous silicon. This phase could be relithiated to amorphous LixSi; while charging below 0.07 V vs Li+/Li, the crystalline Li15Si4 was formed again. Rhodes et al. [34] experimentally showed that the potential regions where extensive fracturing of Si takes place correspond to the two-phase reactions of Li15Si4. Therefore, the faster decay of the cells cycled down to 2.5 V, corresponding to extensive formation and dealloying of Li15Si4, could be partially attributed to the silicon containing anode. The three-electrode experiment showed a progressive loss of Si activity upon cycling at C/3 between 2.5 and 4.5 V, most probably due to the typical fracturing upon large volume expansion/contraction. On the contrary, when the discharge cut-off was limited to 3.6 V, the capacity retention was higher than when using 2.5 V as the cut-off limit. This was associated with silicon utilisation, with a lower working voltage of the cell resulting in higher silicon utilisation. Furthermore, it was observed that cycling in voltage windows of 2.5–3.6 V and 2.5–4.5 V had similar ageing effects. As a result, it appears that the low cut-off voltage was associated with a full silicon reaction that accelerated the capacity fade in both cylindrical and pouch cell formats.
The hypothesis of silicon governing the capacity fade of the cells was further confirmed by the post-mortem characterisation. On the one hand, disappearance of the Si signal from the XRD pattern of the post-mortem negative electrode indicated the degradation of this material, likely pulverised and disconnected from the anode. In addition, assembly of HCCs with aged electrodes suggested that the remaining active materials continued being electrochemically active, while Si was the sole unrecoverable material.
Consequently, it is necessary to study the stabilisation of silicon in the repetitive volumetric expansion/contraction during lithiation/delithiation cycles. Many efforts have been directed toward developing silicon/carbon composites that can buffer these volumetric changes, enhancing the cycle performance of the cells [18,35]. The use of silicon oxide (SiOx) instead of Si can also be a good alternative; even if its capacity is lower (1200–1500 mAh·g−1) [36,37], it undergoes a lower volumetric expansion and can be added in higher fractions in the anode formulation [38].
5. Conclusions
In this work, we assembled 1.8 Ah cells in 18650 cylindrical and pouch formats using NMC532/LFP and graphite/Si blends as the positive and negative electrodes, respectively. Cells of both formats were subjected to electrochemical testing, while a cylindrical cell was also opened at its end of life, and the electrodes were post-mortem characterised. The electrochemical performance of the cylindrical cells was superior to that of pouch cells in terms of both capacity and cycle life; a lower irreversible capacity loss was also reported. This was attributed to a better cell pressure management in the hard-cased cylindrical cells. In addition, it was observed that the main capacity decay mechanism of the cells was due to the degradation of Si. Furthermore, the voltage window selected for the galvanostatic cycling significantly affected the capacity retention. The cycle life was extended when the cells were cycled in the 3.6–4.5 V range due to the limited lithiation of silicon, as shown by the three-electrode cell tests. This was also confirmed by the post-mortem analysis of the cylindrical cell, which further evidenced the Si degradation. This supports the need to develop strategies that minimise the negative impact of silicon due to its volumetric expansion/contraction upon cycling.
Supplementary Materials
The following supporting information can be downloaded at https://www.mdpi.com/article/10.3390/batteries8080097/s1: Figure S1. (a) Electrochemical performance of anodes containing 12 and 15 wt.% Si in half coin cells (CR2032, separator Whatman GF/D, electrolyte 1 M LiPF6 in EC:DMC (1:1 wt.%) + 2% FEC) and (b) results with reduced carbon content; Figure S2. Jelly roll and all components for assembling an 18650 cell; Figure S3. Die-cutting unit for the small pouch cell format (left), stacked electrode soft packaging cell design with dimensions (centre), and one of the final cells (right); Figure S4. Stacking process steps: lamination of cathode with separator, sequential stacking of electrodes, cell core wrapping, and tab ultrasonic welding; Figure S5. Picture of the aged cell opened in the glove box; Figure S6. Picture of the aged negative electrode. (a) Debonding and (b) white/grey areas, more strongly adhered to the separator; Figure S7. Picture of the aged separator facing the positive electrode; Figure S8. Picture of the aged positive electrode with large debonding area; Figure S9. SEM images of the positive electrode at different magnifications; Figure S10. EDX analysis of the positive electrode; Figure S11. Location of the three electrode areas at which the EDX analysis of the positive electrode was conducted; Figure S12. Results of the EDX analysis conducted at the three electrode areas of the positive electrode; Figure S13. SEM images of the negative electrode at different magnifications; Figure S14. EDX analysis of the negative electrode; Figure S15. Location of the three electrode areas at which the EDX analyses of the negative electrode were conducted; Figure S16. Results of the EDX analysis conducted at the three electrode areas of the negative electrode.
Author Contributions
Conceptualisation, A.M., S.P. and I.d.M.; data curation, I.L.-M., A.E.-B., W.P., K.T., A.M., D.V.C. and I.d.M.; funding acquisition, S.P. and I.d.M.; investigation, A.E.-B., W.P., K.T., D.V.C. and I.d.M.; project administration, A.M. and I.d.M.; supervision, W.P., A.M., S.P. and I.d.M.; writing—original draft, I.L.-M.; writing—review and editing, A.E.-B., S.S.-I., K.T., S.P. and I.d.M. All authors have read and agreed to the published version of the manuscript.
Funding
This research was funded by the European Union’s Horizon 2020 research and innovation programme, grant number 653373 (SPICY project) and grant number 814389 (SPIDER project). The Si nanoparticles were available from the SPICY project. The APC was funded by the SPIDER project.
Institutional Review Board Statement
Not applicable.
Informed Consent Statement
Not applicable.
Data Availability Statement
The data presented in this study are available on request from the corresponding author. The raw data are not publicly available due to confidentiality provisions in project consortium agreements.
Acknowledgments
The authors acknowledge SGL Carbon for the graphite supply. We would like to thank Carmen Palacios, Ibai Mujika, Andoni Contreras, and Iker Boyano for the anode electrode manufacturing at the CIDETEC pilot plant and Silvia Lijó for the pouch cell assembly.
Conflicts of Interest
The authors declare no conflict of interest. The funders had no role in the design of the study; in the collection, analyses, or interpretation of data; in the writing of the manuscript, or in the decision to publish the results.
References
- Li, W.; Erickson, E.M.; Manthiram, A. High-nickel layered oxide cathodes for lithium-based automotive batteries. Nat. Energy 2020, 5, 26–34. [Google Scholar] [CrossRef]
- Blomgren, G.E. The Development and Future of Lithium Ion Batteries. J. Electrochem. Soc. 2017, 164, 5019–5025. [Google Scholar] [CrossRef]
- Alvarez, S. Available online: https://www.teslarati.com/elon-musk-tesla-lfp-battery-movement/ (accessed on 7 March 2022).
- Armand, M.; Axmann, P.; Bresser, D.; Copley, M.; Edström, K.; Ekberg, C.; Guyomard, D.; Lestriez, B.; Novák, P.; Petranikova, M.; et al. Lithium-ion batteries—Current state of the art and anticipated developments. J. Power Sources 2020, 479, 228708. [Google Scholar] [CrossRef]
- Li, M.; Lu, J.; Chen, Z.; Amine, K. 30 Years of Lithium-Ion Batteries. Adv. Mater. 2018, 30, 1800561. [Google Scholar] [CrossRef]
- Busà, C.; Belekoukia, M.; Loveridge, M.J. The effects of ambient storage conditions on the structural and electrochemical properties of NMC-811 cathodes for Li-ion batteries. Electrochim. Acta 2021, 366, 137358. [Google Scholar] [CrossRef]
- Wood, M.; Li, J.; Ruther, R.E.; Du, Z.; Self, E.C.; Meyer, H.M.; Daniel, C.; Belharouak, I.; Wood, D.L. Chemical stability and long-term cell performance of low-cobalt, Ni-Rich cathodes prepared by aqueous processing for high-energy Li-Ion batteries. Energy Storage Mater. 2020, 24, 188–197. [Google Scholar] [CrossRef]
- Ryu, H.H.; Park, K.J.; Yoon, C.S.; Sun, Y.K. Capacity Fading of Ni-rich Li[NixCoyMn1-x-y]O2 (0.6 ≤ x ≤ 0.95) Cathodes for High-Energy-Density Lithium-Ion Batteries: Bulk or Surface Degradation? Chem. Mater. 2018, 30, 1155–1163. [Google Scholar] [CrossRef]
- Sun, H.H.; Manthiram, A. Impact of microcrack generation and surface degradation on a nickel-rich layered Li[Ni0.9Co0.05Mn0.05]O2 Cathode for Lithium-Ion Batteries. Chem. Mater. 2017, 29, 8486–8493. [Google Scholar] [CrossRef]
- Ma, L.; Nie, M.; Xia, J.; Dahn, J.R. A systematic study on the reactivity of different grades of charged Li[NixMnyCoz]O2 with electrolyte at elevated temperatures using accelerating rate calorimetry. J. Power Sources 2016, 327, 145–150. [Google Scholar] [CrossRef]
- Manthiram, A. A reflection on lithium-ion battery cathode chemistry. Nat. Commun. 2020, 11, 1550. [Google Scholar] [CrossRef]
- Asenbauer, J.; Eisenmann, T.; Kuenzel, M.; Kazzazi, A.; Chen, Z.; Bresser, D. The success story of graphite as a lithium-ion anode material-fundamentals, remaining challenges, and recent developments including silicon (oxide) composites. Sustain. Energy Fuels 2020, 4, 5387–5416. [Google Scholar] [CrossRef]
- Ma, R.; Shao, L.; Wu, K.; Shui, M.; Wang, D.; Pan, J.; Long, N.; Ren, Y.; Shu, J. Comparison of LiVPO4F to Li4Ti5O12 as anode materials for lithium-ion batteries. ACS Appl. Mater. Interfaces 2013, 5, 8615–8627. [Google Scholar] [CrossRef]
- Li, X.; Colclasure, A.M.; Finegan, D.P.; Ren, D.; Shi, Y.; Feng, X.; Cao, L.; Yang, Y.; Smith, K. Degradation mechanisms of high capacity 18650 cells containing Si-graphite anode and nickel-rich NMC cathode. Electrochim. Acta 2019, 297, 1109–1120. [Google Scholar] [CrossRef]
- Salah, M.; Murphy, P.; Hall, C.; Francis, C.; Kerr, R.; Fabretto, M. Pure silicon thin-film anodes for lithium-ion batteries: A review. J. Power Sources 2019, 414, 48–67. [Google Scholar] [CrossRef]
- Chae, S.; Ko, M.; Kim, K.; Ahn, K.; Cho, J. Confronting Issues of the Practical Implementation of Si Anode in High-Energy Lithium-Ion Batteries. Joule 2017, 1, 47–60. [Google Scholar] [CrossRef]
- Difeng, W.; Jie, M.; Zhenan, Z.; Junjie, F.; Yingwu, L.; Xiang, G. SI Achieving a high loading Si anode via employing a triblock copolymer elastomer binder, metal nanowires and a laminated conductive structure. J. Mater. Chem. A 2018, 6, 20982–20991. [Google Scholar] [CrossRef]
- Chae, S.; Choi, S.-H.; Namhyung, K.; Sung, J.; Cho, J. Integration of Graphite and Silicon Anodes for the Commercialization of High-Energy Lithium-Ion Batteries. Angew. Chem. 2019, 59, 110–135. [Google Scholar] [CrossRef]
- Wang, L.; Liu, T.; Peng, X.; Zeng, W.; Jin, Z.; Tian, W.; Gao, B.; Zhou, Y.; Chu, P.K.; Huo, K. Highly Stretchable Conductive Glue for High-Performance Silicon Anodes in Advanced Lithium-Ion Batteries. Adv. Funct. Mater. 2018, 28, 1704858. [Google Scholar] [CrossRef]
- Casimir, A.; Zhang, H.; Ogoke, O.; Amine, J.C.; Lu, J.; Wu, G. Silicon-based anodes for lithium-ion batteries: Effectiveness of materials synthesis and electrode preparation. Nano Energy 2016, 27, 359–376. [Google Scholar] [CrossRef]
- Zuo, X.; Zhu, J.; Müller-Buschbaum, P.; Cheng, Y.J. Silicon based lithium-ion battery anodes: A chronicle perspective review. Nano Energy 2017, 31, 113–143. [Google Scholar] [CrossRef]
- Wetjen, M.; Trunk, M.; Werner, L.; Gernhäuser, R.; Märkisch, B.; Révay, Z.; Gilles, R.; Gasteiger, H.A. Quantifying the distribution of electrolyte decomposition products in silicon-graphite electrodes by neutron depth profiling. J. Electrochem. Soc. 2018, 165, A2340–A2348. [Google Scholar] [CrossRef]
- McDowell, M.T.; Lee, S.W.; Nix, W.D.; Cui, Y. 25th anniversary article: Understanding the lithiation of silicon and other alloying anodes for lithium-ion batteries. Adv. Mater. 2013, 25, 4966–4985. [Google Scholar] [CrossRef] [PubMed]
- Ryu, J.; Bok, T.; Kim, S.; Park, S. Fundamental Understanding of Nanostructured Si Electrodes: Preparation and Characterization. ChemNanoMat 2018, 4, 319–337. [Google Scholar] [CrossRef]
- Marinaro, M.; Weinberger, M.; Wohlfahrt-Mehrens, M. Toward pre-lithiatied high areal capacity silicon anodes for Lithium-ion batteries. Electrochim. Acta 2016, 206, 99–107. [Google Scholar] [CrossRef]
- Limthongkul, P.; Il Jang, Y.; Dudney, N.J.; Chiang, Y.M. Electrochemically-driven solid-state amorphization in lithium-silicon alloys and implications for lithium storage. Acta Mater. 2003, 51, 1103–1113. [Google Scholar] [CrossRef]
- Quinn, J.B.; Waldmann, T.; Richter, K.; Kasper, M.; Wohlfahrt-Mehrens, M. Energy Density of Cylindrical Li-Ion Cells: A Comparison of Commercial 18650 to the 21700 Cells. J. Electrochem. Soc. 2018, 165, A3284–A3291. [Google Scholar] [CrossRef]
- Budde-Meiwes, H.; Drillkens, J.; Lunz, B.; Muennix, J.; Rothgang, S.; Kowal, J.; Sauer, D.U. A review of current automotive battery technology and future prospects. Proc. Inst. Mech. Eng. Part D J. Automob. Eng. 2013, 227, 761–776. [Google Scholar] [CrossRef]
- Winter, M.; Barnett, B.; Xu, K. Before Li Ion Batteries. Chem. Rev. 2018, 118, 11433–11456. [Google Scholar] [CrossRef]
- Tranter, T.G.; Timms, R.; Shearing, P.R.; Brett, D.J.L. Communication—Prediction of Thermal Issues for Larger Format 4680 Cylindrical Cells and Their Mitigation with Enhanced Current Collection. J. Electrochem. Soc. 2020, 167, 160544. [Google Scholar] [CrossRef]
- Jung, R.; Metzger, M.; Maglia, F.; Stinner, C.; Gasteiger, H.A. Oxygen release and its effect on the cycling stability of LiNixMnyCozO2(NMC) cathode materials for Li-ion batteries. J. Electrochem. Soc. 2017, 164, A1361–A1377. [Google Scholar] [CrossRef]
- Moretti, A.; Sharova, V.; Carvalho, D.V.; Boulineau, A.; Porcher, W.; de Meatza, I.; Passerini, S. A Comparison of Formation Methods for Graphite//LiFePO4 Cells. Batter. Supercaps 2019, 2, 240–247. [Google Scholar] [CrossRef]
- Berckmans, G.; De Sutter, L.; Marinaro, M.; Smekens, J.; Jaguemont, J.; Wohlfahrt-Mehrens, M.; van Mierlo, J.; Omar, N. Analysis of the effect of applying external mechanical pressure on next generation silicon alloy lithium-ion cells. Electrochim. Acta 2019, 306, 387–395. [Google Scholar] [CrossRef]
- Rhodes, K.; Dudney, N.; Lara-Curzio, E.; Daniel, C. Understanding the Degradation of Silicon Electrodes for Lithium-Ion Batteries Using Acoustic Emission. J. Electrochem. Soc. 2010, 157, A1354. [Google Scholar] [CrossRef]
- Luo, W.; Chen, X.; Xia, Y.; Chen, M.; Wang, L.; Wang, Q.; Li, W.; Yang, J. Surface and Interface Engineering of Silicon-Based Anode Materials for Lithium-Ion Batteries. Adv. Energy Mater. 2017, 7, 1701083. [Google Scholar] [CrossRef]
- Shen, C.; Fu, R.; Guo, H.; Wu, Y.; Fan, C.; Xia, Y.; Liu, Z. Scalable synthesis of Si nanowires interconnected SiOx anode for high performance lithium-ion batteries. J. Alloys Compd. 2018, 783, 128–135. [Google Scholar] [CrossRef]
- Suh, S.-S.; Yoon, W.Y.; Kim, D.-H.; Kwon, S.-U.; Kim, J.H.; Kim, Y.U.; Jeong, C.U.; Chan, Y.Y.; Lee, J.K. Electrochemical behavior of SiOx anodes with variation of oxygen ratio for Li-ion batteries. Electrochim. Acta 2014, 148, 111–117. [Google Scholar] [CrossRef]
- Pan, K.; Zou, F.; Canova, M.; Zhu, Y.; Kim, J.H. Systematic electrochemical characterizations of Si and SiO anodes for high-capacity Li-Ion batteries. J. Power Sources 2019, 413, 20–28. [Google Scholar] [CrossRef]

Publisher’s Note: MDPI stays neutral with regard to jurisdictional claims in published maps and institutional affiliations. |
© 2022 by the authors. Licensee MDPI, Basel, Switzerland. This article is an open access article distributed under the terms and conditions of the Creative Commons Attribution (CC BY) license (https://creativecommons.org/licenses/by/4.0/).