1. Introduction
As part of the global carbon neutrality effort, the utilization of renewable energy has grown, leading to an increased interest in energy storage systems (ESSs) to compensate for the intermittency of renewable energy generation. In addition, the EV (electric vehicle) market is expanding due to the transition from existing internal combustion engine transportation to electricity-powered transportation. EV power devices and ESSs store electrical energy through battery packs comprising a combination of battery cells, and it is important to select the appropriate cell according to the purpose of use. Lithium-ion batteries (LIBs) are more suitable for energy storage than other batteries due to their high energy density, low self-discharge rate, and long cycle life [
1]. Despite these advantages, LIBs have stability issues that can cause the battery to overheat and explode or catch fire if over-charged or over-discharged [
2,
3,
4]. Therefore, proper management of the battery is essential and can be realized through a BMS (battery management system). BMS contributes to the improvement of battery life and reliability through continuous monitoring of the battery, and the factors monitored by BMS are the state of charge (SOC), state of health (SOH), and state of power (SOP).
The SOC is one of the key metrics in a BMS that indicates the remaining capacity of a battery. It plays a similar role to the fuel gauge in an internal combustion engine car, providing the user with information about the available capacity so that the user can make a reasonable judgment. In addition, monitoring the SOC can improve battery reliability by preventing over-charging or over-discharging. Since the SOC is difficult to estimate directly, it is often estimated indirectly via measuring the current, voltage, and impedance [
5,
6]. Representative methods include Coulomb counting (CC), open-circuit voltage (OCV), and electrochemical impedance spectroscopy (EIS). Coulomb counting is a method that calculates the remaining charge capacity of a battery by continuously monitoring the current flowing through the battery during charging and discharging. The SOC can be estimated by setting the charging current direction to + and the discharging current direction to—and calculating the current flowing in and out of the battery. It is a simple and intuitive method that can calculate the SOC directly through the current sensor, and it has the advantage of measuring the current in real time to estimate the SOC during device operation.
However, since the SOC estimate is determined by the initial SOC, the charge/discharge current, and the total capacity of the battery, it is subject to error due to the error of the current sensor and the decrease in capacity due to battery aging. With the increasing usage time of the battery, the errors accumulate, and if they are not corrected, the SOC estimation error will increase. Therefore, the Coulomb counting method is being researched for its potential to be combined with other SOC estimation techniques or algorithms to calibrate the initial SOC value, aiming to enhance the accuracy [
7,
8,
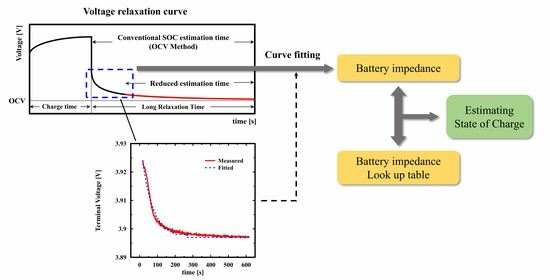
9]. The OCV refers to the voltage of the battery when it is not connected to any load or charging terminal, and it is closely associated with the EMF (electromotive force). A battery is a device that converts electrical energy into chemical energy and stores it, and its voltage varies due to internal chemical reactions when it is charged or discharged. However, when the circuit is opened, the internal chemical reaction stops, and the battery voltage gradually stabilizes. The graph showing the terminal voltage as a function of time after stopping the charge and discharge current is called the voltage relaxation curve, as shown in
Figure 1, and the battery voltage is usually called the OCV when it has achieved internal equilibrium through a sufficient stabilization period. At internal equilibrium, the OCV has the same meaning as the EMF and has a one-to-one correspondence with the SOC [
10]. Therefore, the OCV method works by measuring the battery OCV and estimating the current SOC through a pre-established SOC-OCV curve and is frequently used due to the ease of the estimation that the SOC can be directly obtained from the SOC-OCV relationship.
EIS is used to analyze the health of electrochemical systems, such as batteries, by applying a constant alternating voltage to the battery and varying the frequency in steps to measure the voltage response. The Nyquist plot is a graph that expresses the voltage response on a complex plane according to the frequency, through which the electrical characteristics and status of the battery can be identified. By analyzing the internal battery characteristics such as the internal resistance, ion transfer resistance, and electrolyte resistance through a Nyquist plot, the battery status can be precisely identified, and SOC estimation research is being conducted using this [
11,
12]. EIS provides information on the internal chemical reactions of the battery, enabling high-accuracy SOC estimation compared to other methods. However, EIS requires specialized equipment for measuring voltage responses across various frequencies and has a high computational complexity due to the use of electrochemical models [
13]. Consequently, EIS is recognized as a relatively time-consuming and costly method, so it is rarely used directly to estimate the SOC in practical applications and is mainly used in research or battery performance evaluation where accuracy is required. In practical applications, the OCV method is more frequently used than EIS for SOC estimation due to its simplicity. However, as shown in
Figure 1, a long battery relaxation process is required to obtain the OCV, typically taking from several hours to tens of hours. For this reason, the OCV method cannot provide real-time SOC estimation for an operating device. Therefore, prior research has been conducted to reduce the estimation time through OCV prediction [
1] and to enable real-time estimation through ECM-based OCV computation methods [
14,
15].
In this paper, we propose an SOC estimation method using a voltage relaxation curve to address the limitations of the EIS and OCV methods. Internal battery reactions like polarization and charge transfer occur over extended periods, and the voltage relaxation curve can be obtained through recording the terminal voltage over time.
Figure 1 shows the voltage relaxation curve when charging is stopped. As the battery is charged, the internal electromotive force and OCV increase as energy is accumulated, which leads to a rise in the terminal voltage. When the charging current is stopped at the Toff point in
Figure 1, the terminal voltage gradually decreases and converges to the OCV as internal chemical reactions reach equilibrium, and the OCV has a constant value. The time after T
off is referred to as the relaxation period, split into the
Rs-
Rp region and
Rp-
Cp region. The
Rs-
Rp region is caused by ohmic resistance and shows a sharp change immediately after stopping the charging current. After that, the
Rp-
Cp region is caused by polarization resistance and capacitance and converges to the OCV exponentially, so most of the time of OCV measurement is spent in this region. The voltage relaxation curve is influenced by temperature and battery impedance (ohmic resistance, polarization capacitor, resistance), and understanding the relationship between the voltage relaxation curve and these factors provides information for battery state estimation, leading to ongoing research in this field. In Ref. [
16], a study was conducted to reduce the SOC estimation time by using an interpolation to estimate the OCV utilizing the rapid change characteristics of the voltage relaxation curve in the early stage. Refs. [
17,
18,
19] improves the practicality of the OCV method by focusing on a voltage relaxation model for the prediction of the OCV. Furthermore, Ref. [
20] identifies key parameters related to the ohmic depolarization, activation depolarization, and concentration depolarization processes and evaluates the SOH through simulations on the voltage relaxation curve. In this paper, we investigated the relationship between the battery impedance and voltage relaxation curves based on simulations and differential equations. Using the established relationship, we identified the battery impedance from the voltage relaxation curve through curve fitting. We estimated the SOC using a lookup table method. Furthermore, to reduce the estimation time, we performed the partial fitting of the initial range of the voltage relaxation curve for SOC estimation and analyzed SOC estimation errors associated with the partial fitting range.
The paper is organized as follows.
Section 2 presents the simulation results of the relationship between the voltage relaxation curve and battery impedance using an ECM (equivalent circuit model).
Section 3 describes the experimental data measurements of the voltage relaxation curve and discusses the curve-fitting method for battery impedance estimation.
Section 4 details the proposed SOC estimation method, and
Section 5 addresses the SOC estimation error and discusses the validity and effectiveness of the proposed method.
Section 6 concludes the paper.
2. Battery Model
Battery modeling methods include empirical models, ECM, electrochemical models, and data-driven models, depending on the purpose of use. Among them, the ECM has Rint, Thevenin, and DP (dual-polarization) models depending on the degree of representation of the internal characteristics of the battery. In this paper, the Thevenin model, which has a low computational complexity and can represent the relaxation process, is used for rapid SOC estimation and is shown in
Figure 2.
Voc is the OCV as a function of the SOC.
Rs corresponds to the internal resistance of the battery, and
Rp and
Cp are connected in parallel to represent the polarization characteristics of the battery.
Vt is the battery terminal voltage, and the voltage relaxation curve is obtained through measuring the terminal voltage
Vt during the relaxation period.
The relationship between the battery impedance (
Rs,
Rp,
Cp) of the ECM and the voltage relaxation curve was investigated through simulation. Since the battery is modeled through the ECM, the transients of the ECM can explain the voltage relaxation curve of the battery. To model the battery charging and discharging process, a switch and an external DC voltage source were connected to the Thevenin model, as shown in
Figure 2. While charging through the external DC voltage source, the voltage relaxation curve was measured when charging was stopped via opening the switch. The shape of the voltage relaxation curve was changed via adjusting the individual impedance values. The effect of individual impedance on the voltage relaxation curve was verified.
Figure 3 shows the simulation results for the change in the shape of the voltage relaxation curve with individual impedance. The simulation results can be analyzed from the transients for
Vt in
Figure 2.
Voc and
Vs. are assumed to be constant, and the charging currents flowing through
I1,
Rp, and
Cp are called
I2 and
I3, respectively, and the back end of the
Rp and
Cp parallel circuits is called
Vt. At
t > 0, the charging current
I1 was cut off to calculate the transient response of
Vt. To calculate the initial condition of
I1, we assume that
Cp is fully charged before the switch is opened. The current flows through
Rs and
Rp, and the initial condition of
I1 is as follows:
The process to find the transient response of the terminal voltage
Vt is as follows. The equation obtained through the application of Kirchhoff’s current law is presented as:
Since the voltages across
Rp and
Cp are equal, the following equation holds true:
As
I1 becomes 0 upon current interruption, and
I2 gradually converges to 0 due to the discharge of the capacitor, the transient response of
I2, calculated from (1), (2), and (3), can be expressed as follows:
Since
I1 (
t) is zero at
t > 0, the voltage across
Rs becomes zero as the current is cut off, so the transient response of the terminal voltage can be calculated as follows:
The influence of impedance on the voltage relaxation curve is divided into two regions. The first is the Rs-Rp region, which corresponds to the initial voltage variation, and the second is the Rs-Rp region, which gradually converges. The impact of each impedance can be understood from (5), which is the transient of the terminal voltage. The transient is shown to converge to Voc by decreasing polarization as time increases, according to (5). The second term of (5) is for the Rp-Cp region, which represents the polarization of the battery. Since Vs and Voc are constants, the sum of the Rs-Rp region and the Rp-Cp region is constant. Therefore, the influence of impedance on the initial voltage variation can be determined from the Rp-Cp region. As the internal resistance Rs increases, the Rp-Cp region decreases, which means that the initial voltage variation increases. Conversely, an increase in the polarization resistance Rp increases the Rp-Cp region, which decreases the initial voltage variation. Next, the influence on the Rp-Cp region can be determined through the time constant in the second term of (5). With increasing values of Rp and Cp, the time constant τ increases, requiring more time for the polarization to disappear, consequently resulting in a gentler slope of the voltage relaxation curve. The simulations performed show a direct relationship between the relaxation curve and the impedance, indicating the possibility of estimating the battery impedance from the voltage relaxation curve of a particular SOC. Based on the results of this study, the SOC was estimated via identified impedance, which is described in the next section. This approach enables the estimation of battery impedance without the need for specialized equipment in EIS.
3. Research Setup
The equipment used to measure the experimental data of the voltage relaxation curve is shown in
Figure 4. The battery was an ICR 14,500 Li-ion battery with a rated voltage of 3.7 V and a rated capacity of 800 mAh. The cells were pre-discharged to 2.75 V, the voltage at 0% SOC, and charged using a constant voltage (CV) method. Charging was interrupted at 10% intervals over an SOC range from 20% to 80% to measure voltage relaxation at seven SOCs. The charging current was monitored via a current sensor to calculate the reference SOC and, from the calculated SOC, the charging interruption time was determined. After the charging interruption, the relaxation period was set to 600 s, and we verified that the voltage varied less than 0.02% after 600 s of relaxation across the seven SOCs. The voltage at the end of the relaxation period was set to the OCV of the corresponding SOC, and the sampling time for building the voltage relaxation curve was 1 s.
Figure 5 shows the voltage profile when the battery is charged and relaxed to obtain the voltage relaxation curve.
The process of deducing the impedance from the voltage relaxation curve was performed via curve fitting. If the simulated voltage relaxation curve is matched to the measured voltage relaxation curve via adjusting the impedance, then the impedance at that SOC can be obtained. Although impedance variation with an SOC is common, according to [
21], the internal resistance
Rs varies only slightly with the SOC. Therefore, when adjusting the impedance for curve fitting,
Rs was fixed at 2.609 Ω, and
Rp and
Cp were adjusted to match the voltage relaxation curve. The curve fitting of the experimentally measured voltage relaxation curve was performed on seven SOCs for different fitting ranges.
Figure 6 shows an example of the curve-fitting process for the entire relaxation curve, and the accuracy of the curve fitting is assessed as 0.000925 standard deviation.
The voltage relaxation curve exhibits an initial rapid change, where the voltage across the internal resistor diminishes quickly as the battery charging current (
I1 in
Figure 2) ceases. Subsequently, the current in the RC parallel circuit, induced by
Cp, gradually diminishes, causing the terminal voltage to converge towards the OCV. Since these characteristics are due to the battery impedance, the impedance can be deduced from the voltage relaxation curve. Therefore, if the impedance is estimated via curve fitting to the initial voltage relaxation curve instead of the long relaxation period of the existing OCV method, the SOC estimation time can be shortened. To demonstrate the validity of this method, the SOC estimation error via curve fitting was compared in various fitting ranges. The fitting range was set to the time to reach a certain percentage of the
Rp-
Cp region. For each of the seven SOCs, we calculated the size of the
Rp-
Cp region, measured the time it took to reach 20–70% of its size, and calculated the average for each SOC. As shown in
Table 1, the six calculated average times were set as the fitting ranges for the experiment.
4. Proposal Method
SOC estimation is conducted via comparing the impedance estimated through curve fitting with a pre-established lookup table. Therefore, the creation of the lookup table must precede this process. The fitting range is then set according to the device operating environment and allowed SOC estimation error. The fitting range means the actual downtime of the device for the voltage relaxation measurement, which varies depending on the device’s usage environment. In addition, the SOC estimation error and the length of the fitting range have a trade-off relationship, so the fitting range is set via considering the device’s operating environment and tolerance range. According to the fitting range, the estimated impedance is calculated through curve fitting for the given voltage relaxation curve, and finally, the SOC is estimated through the SOC estimation algorithm. In this paper, we set the fitting range for the six ranges shown in
Table 1 to estimate the SOC. The lookup table for the seven SOC segments was created via curve fitting to the relaxation curve of 600 s and is shown in
Table 2.
Figure 7 represents the estimated impedance according to fitting ranges, enabling the verification of impedance estimation errors. Since
Rs is fixed,
Rp determines the width of the initial voltage variation, i.e., the starting point of the gradual convergence region. Since the starting point of the
Rp-
Cp region is independent of the length of the fitting range, the estimated
Rp is less correlated with the length of the fitting range. However, the slope of the fitting graph changes as the fitting region increases. Since
Rp is fixed for fitting the starting point, the slope is determined by
Cp, which means that the SOC estimation error along the fitting range is highly dependent on
Cp. The algorithm for estimating the SOC from impedance estimated through partial fitting is divided into two stages: the first estimation and the second estimation. The first estimation step estimates a rough SOC range, whereas the second estimation step estimates a more detailed figure. The first estimation compares the estimated impedance to a lookup table to find the most similar impedance and sets that SOC as the estimated range. To do this, the deviation is calculated using the following formula:
As can be seen in
Figure 7, the impedance has a non-linear relationship with the SOC, so there were cases where the region where deviation was minimized did not cover the actual SOC. To address this, we introduced the voltage just before charge interruption to establish three candidate SOCs in order of decreasing deviation, and then set the estimation range around the SOC that is closest to the voltage just before charge interruption. In this paper, we set the estimation range to ±10% of the center SOC.
The second estimation computes the SOC estimate between the center SOC and the neighboring SOCs in the estimation range as the ratio of
Rp,
Cp. Since there are two neighboring SOCs in this process, the estimation range must be determined from two ranges between the center SOC and the neighboring SOCs. In the case of linearity, such as 20–40% in
Figure 7a, it is easy to determine which range the actual SOC is in. However, if it is non-linear, such as 40–60%, a new criterion is needed to select the range. In such situations, like the primary estimation, we introduce the voltage just before the charge interruption as a deciding factor. We choose the range of the SOC of the adjacent SOC with a closer voltage to the voltage just before charge interruption. Then, we calculate the percentage of the estimated
Rp and
Cp from the center SOC’s
Rp and
Cp to the neighboring SOC’s
Rp and
Cp, and estimate the final SOC by averaging the SOC estimate calculated from
Rp and the SOC estimate calculated from
Cp.
5. Results and Discussion
In this study, the SOC was estimated via the identification of the battery impedance through the voltage relaxation curve. To evaluate the SOC estimation performance of the proposed method, SOC estimates were calculated for the different curve-fitting intervals in
Table 1. Curve fitting was performed on the voltage relaxation curves measured at 20–80% SOC, and 42 impedance estimates were calculated for each. Based on the estimated impedance, the SOC was estimated, and
Table 3 shows the comparison between the estimated SOC and the actual SOC during curve fitting for the 70% section. The SOC showed an estimation error of up to 5.00% and an average of 1.67%.
The SOC estimation errors for the six fitting ranges were averaged over the seven SOCs. We found that the accuracy of SOC estimation increased as the curve-fitting range increased, i.e., as the voltage measurement time increased. The maximum value of the estimation error decreased to 15%, 15%, 15%, 15%, 7%, 6%, and 5%, depending on the fitting range. As a comparison group to evaluate the performance of the proposed method, the estimation time of the conventional OCV method was set. The time for the terminal voltage to reach 99.9% of the
Rp-
Cp region of the voltage relaxation curve was measured for seven SOCs, and the average value was calculated to be 530.14 s. This value was set as the estimation time of the OCV method, and the measurement time reduction rate compared to the existing OCV method was calculated for the six fitting ranges in
Table 1, and it is shown in
Figure 8 along with the average SOC estimation error. From
Figure 8, we can see that the shorter the fitting range, the greater the reduction in the SOC estimation time, and the higher the estimation error. From the SOC estimation results in
Figure 8, we can see the relationship between the estimation time and the estimation error, which means that the proposed SOC estimation method is valid. From this relationship, we can predict the minimum estimation time required depending on the tolerance of SOC estimation, which can be used as an indicator to judge the applicability of the proposed SOC estimation algorithm in devices that can be stopped briefly, such as electric vehicles.


