Article

Silicon Negative Electrodes—What Can Be Achieved for Commercial Cell Energy Densities

Hazleton Campus, Penn State University, Hazleton, PA 18202, USA
Batteries 2023, 9(12), 576; https://doi.org/10.3390/batteries9120576
Submission received: 25 October 2023 / Revised: 14 November 2023 / Accepted: 23 November 2023 / Published: 28 November 2023

Abstract

:
Historically, lithium cobalt oxide and graphite have been the positive and negative electrode active materials of choice for commercial lithium-ion cells. It has only been over the past ~15 years in which alternate positive electrode materials have been used. As new positive and negative active materials, such as NMC811 and silicon-based electrodes, are being developed, it is crucial to evaluate the potential of these materials at a stack or cell level to fully understand the possible increases in energy density which can be achieved. Comparisons were made between electrode stack volumetric energy densities for designs containing either LCO or NMC811 positive electrode and silicon-graphite negative electrodes, where the weight percentages of silicon were evaluated between zero and ninety percent. Positive electrode areal loadings were evaluated between 2.00 and 5.00 mAh cm−2. NMC811 at 200 mAh g−1 has the ability to increase stack energy density between 11% and 20% over LCO depending on percentage silicon and areal loading. At a stack level, the percentage of silicon added results in large increases in energy density but delivers a diminishing return, with the greatest increase observed as the percentage of silicon is increased from zero percent to approximately 25–30%.

1. Introduction

Lithium-ion cells are of extreme importance to the advancement and implementation of electric vehicles (EVs), with goals of increasing energy density, cycle life, and drive distance while maintaining/improving safety, reducing costs, and decreasing charge times [1,2]. To date, the EV battery market has been dominated by cathode materials such as lithium cobalt oxide (LCO), lithium nickel cobalt oxide (NCA), and lithium nickel manganese cobalt oxide (NMC) [3]. Graphite has been the overwhelming negative electrode active material of choice for lithium-ion EV batteries since their commercialization [4]. Related to energy density, most improvements in commercial lithium-ion technology have been achieved through fabrication improvements, where the theoretical limits of the traditional materials are close to being achieved [5]. These improvements consisted of cells being fabricated with higher active material content using thinner foils, separators, and packaging as well as using lighter aluminum case materials as opposed to stainless steel. To further increase energy density, the development and implementation of new materials is needed. Two of the most promising materials for increasing lithium-ion cell energy density are NMC811 and silicon for positive and negative electrodes, respectively.
NMC, LiNixMnyCozO2, is an alternative material to LCO in which the cobalt is replaced with other transition metals such as nickel and manganese, where X, Y, and Z indicate the atomic or molar ratios of Ni, Mn, and Co, respectively. Commercial cells containing variations of NMC such as NMC111, NMC 532, and NMC622 are currently in production, with a goal of moving to cathode variations with higher nickel contents [6,7,8,9]. NMC811 is one variation of this composition that is proving to be a leader in cathode choice for future lithium-ion cells. Increased nickel content leads to greater capacities for the same cutoff potential, as well as resulting in less cobalt use [10]. Not only does cobalt have large variability in cost [11], but also ethical concerns related to mining practices in the Democratic Republic of the Congo [12,13,14]. Electrochemically, NMC811 has the potential to deliver reversible capacities exceeding 200 mAh g−1 compared to 150 mAh g−1 for LCO [15,16,17,18]. Currently, NMC811 experiences capacity fade during cycling, with large efforts being made to decrease or eliminate this issue.
On the negative electrode side of lithium-ion technology, various alternatives to graphite are being developed and evaluated, with the most promising being silicon-based negative electrode active materials. Graphite has a theoretical capacity of 372 mAh g−1, reaching full lithiation at one lithium per every six carbon atoms (LiC6) and demonstrating a highly reversible capacity of ~330 mAh g−1 in commercial lithium-ion cells [19]. Silicon, on the other hand, has a theoretical capacity of 4200 mAh g−1 for a Li22Si5 alloy and 3580 mAh g−1 for a Li15Si4 alloy [20]. Based on capacity alone, silicon has the potential to increase lithium-ion cell energy density a large amount. The issue with silicon active materials is the extremely large volume change that takes place as lithium alloys with silicon, 280% [21]. As this alloying and volume expansion re-occurs during cycling, there are numerous issues that arise, with the most important being the breakdown and reformation of the negative electrode solid electrolyte interphase layer (SEI). This continual SEI formation leads to recurring lithium consumption, resulting in high continued irreversible capacity loss (ICL), as opposed to graphite, in which almost all ICL and SEI formation occurs during the first charge. Despite this large issue, silicon is still viewed as a promising candidate to replace graphite, due to its low cost and high theoretical specific capacity.
The literature shows large variations in silicon reversible capacity, with values as high as 2800–3200 mAh g−1 being reported for the first few cycles [19,21,22], with capacity fading during cycling. To mitigate this persistent capacity fade and decrease in the first-cycle ICL of silicon, there is the need to develop and implement pre-lithiation techniques [23]. These techniques use chemical lithiation, electrochemical lithiation, or the introduction of stabilized lithium metal particles (SLMPs) as an additional lithium source to be consumed for SEI formation [24,25]. These techniques, although not yet commercially implemented, would allow for the higher reversible capacity of silicon to be realized and maintained in commercial cells.
There have typically been two approaches for incorporating silicon into lithium-ion negative electrodes: First, the use of silicon–graphite composites, in which lower percentages of silicon are added, replacing a portion of the graphite material. Second, the active component in the negative electrode is 100% silicon [26]. This publication looks at volumetric energy densities for cell designs containing ninety percent active material in the negative electrode, with silicon percentages ranging from zero to ninety percent, and the remaining active material being graphite.
As new electrode materials are investigated, it is crucial that they be evaluated not only on a material basis, but also as what is expected if implemented into full lithium-ion cells. Authors have identified the disconnect when lab-scale half-cell energy density predictions are incorporated into commercial-scale cells [27]. The following publication applies the best of these materials into a commercial cell design. What do we expect in energy density for the future of lithium-ion cells using state-of-the-art cathode and anode materials once these issues are overcome? The volume expansion of silicon is something that must be considered during the evaluation of these cell designs, and results are presented accounting for this expansion. For a comparison, LCO or NMC 811 vs. graphite cells is chosen as the starting point, with improvements noted from there. What increase in energy density do we expect as NMC811 replaces LCO and as silicon is added in varying amounts to a graphite negative electrode? SiOx anodes are another developing negative electrode material that has the potential to increase cell energy density from today’s state-of-the-art cells. As this additional information would add considerable length and complication to the presented results, these data will be presented in a future publication.

2. Materials and Methods

2.1. Electrode Design

When comparing lithium-ion cell volumetric energy densities, it is important to note that cells should contain the same amount of volume or space for cell packaging, seals, exit tabs, internal space for ultrasonic weld connections, etc. As these values will most likely differ slightly among various cell manufacturers, the results are presented as values per electrode pair or per electrode stack. For a fixed electrode composition, current collector thickness, electrode porosity, areal capacity, and separator thickness, volumetric energy density is somewhat intrinsic to the cell design, differing very slightly between the electrode stack volumetric energy density and an electrode pair volumetric energy density. The only difference is that an electrode pair is defined as one double-side-coated positive electrode, one double-side-coated negative electrode, and two separators. An electrode stack typically contains a number (y) of double-side-coated positive electrodes, a number (y − 1) of double-side-coated negative electrodes, two single-side-coated negative electrodes, and a number (2y) of separators, where y equals the number of electrode pairs. A stack will contain one extra negative current collector, resulting in a slightly lower stack volumetric energy density when compared to a single electrode pair. If a cell design requires a small number of electrode pairs, the stack and pair volumetric energy density deviate from each other to a greater extent. Table 1 shows the electrode composition used in the following energy density and cell capacity results. The positive and negative electrode calender porosities are 30% and 40%, respectively.
Utilizing the composition outlined in Table 1, lithium-ion cells are designed with positive electrode areal capacities ranging from 2 to 5 mAh cm−2. LCO reversible capacities of 150 mAh g−1 and NMC811 reversible capacities of 200 mAh g−1 were used for the following results. The range of positive electrode areal capacities were paired with negative electrodes, giving a negative to positive reversible equal area capacity ratio of 1.1:1. The reversible capacities used for the presented results of graphite and silicon were 330 mAh g−1 and 3000 mAh g−1, respectively. The average discharge voltage of an LCO cell used for energy density calculation was 3.7 V, and 3.8 V was used for NMC811.

2.2. Electrode Expansion at 100% State of Charge

Electrode expansion, which occurs during cell cycling, especially at 100% state of charge (SOC), greatly affects the overall cell thickness and volumetric energy density. Consistent with the literature, 6% expansion is used for the graphite component of the negative electrode at 100% SOC and 280% expansion for the silicon component of the negative electrode. When determining the electrode volume following expansion, it is assumed that no change in electrode porosity occurs. This assumption matches well with the published literature outlined in the results section of this manuscript. If a decrease in negative electrode porosity did occur during cell charging, the presented results would be an understatement of the volumetric energy densities that can be achieved. Like the negative electrode, a positive electrode thickness change occurs during cell cycling. This thickness change incorporates a reversible and irreversible change [29], which for the following results has been fixed at 6% growth at 100% SOC. There are most likely differences in the expansion between NMC811 and LCO, but, given that the majority of expansion occurs within the silicon component of the negative electrode, especially for electrodes containing a high percentage of silicon, any slight changes in this value will have limited effects on the presented results.

2.3. Full Cell Design

Electrode size and inert cell component dimensions are presented in Table 2. Electrode stacks were designed for the greatest number of electrode pairs without exceeding 6.50 mm in thickness. This was performed for cells utilizing either LCO or NMC811 active material positive electrodes. This maximum thickness is a constraint on the uncharged or as-fabricated electrode stack before charging. This stack thickness is comparable to current lithium-ion pouch cells in production for EV use [30]. Separator length and width dimensions were used for calculating the stack volume.

2.4. Assumptions Related to Cell Characteristics

The presented results are purely computational. To complete the calculations for the results section of this manuscript, a few assumptions were made, as outlined below. Many of these assumptions are mentioned throughout the text, but the author felt there is benefit to listing them. Except for the first two assumptions, all are related to determining the electrode and stack thickness at 100% SOC. Current research continually shows progress and improvements in silicon-based electrode performance. The first assumption outlines a goal of current research for low-ICL silicon electrodes, currently through the use of pre-lithiation strategies or stabilized lithium metal powders.
  • Silicon is known to have high irreversible capacity loss, not only on the first cycle, but on subsequent cycles. The results assume silicon delivers a reversible capacity of 3000 mAh g−1. This can either be interpreted as the first discharge energy density or as a future prediction of energy density on cells containing silicon, where the continued ICL has been mitigated through research and development.
  • The consumption of available reversible lithium as silicon SEI is mitigated. LCO and NMC811 deliver 150 mAh g−1 and 200 mAh g−1, respectively.
  • The expansion of silicon and graphite occurs as cells are charged. The porosity of the electrode does not change during expansion.
  • No increase in electrode thickness occurs after electrode calendering. Depending on the target calender porosity, electrodes may “spring back” or relax following calendering. As this relaxation is typically minimal, it has been omitted.
  • No separator compression occurs during electrode expansion at 100% SOC.

3. Results

3.1. Influence of Percentage Silicon on Electrode Thickness

Figure 1 demonstrates the diminishing return resulting from electrode thickness as electrodes incorporate a higher percentage of silicon. Figure 1a compares electrode coating calender thickness and Figure 1b electrode thickness at 100% SOC for various areal loadings to match a positive electrode loading range of 2–5 mAh cm−2 and a 1.1:1 negative to positive capacity ratio. The coating thickness at 100% SOC incorporates a 280% thickness increase in silicon volume due to lithium alloying and a 6% increase in graphite volume resulting from lithium insertion. Again, to restate an earlier assumption, the following thickness results assume the electrodes maintain a constant porosity during expansion. The comparison in thickness at calender and 100% SOC match well with the published literature [32], where a nearly linear relationship is observed between the weight percentage of silicon and percentage electrode expansion at 100% SOC. Electrodes with 90 wt. % silicon show a 157% increase in thickness during charging. Electrodes containing 0 wt. % silicon, 90 wt. % graphite show an approximate 6% increase in thickness.
Aside from the important information which can be interpreted by comparing Figure 1a,b, the trends observed in each figure are of equal importance. For Figure 1a, as the weight percentage silicon is increased from 0 to 45%, a quick drop in electrode thickness occurs; then, as wt. % silicon is increased to 90%, a much slower drop occurs. An electrode containing 90 wt. % graphite is 856% thicker than an electrode containing 90 wt. % silicon, or the silicon electrode is ~10% as thick. An electrode containing equal wt. % of silicon and graphite (45%:45%) is only 19% as thick as an electrode with 90 wt. % graphite. This demonstrates that for a calendered electrode, as the wt. % of silicon is increased from 0 to 45%, an electrode is decreased to 19% of the original thickness for the same areal capacity. As the wt. percentage of silicon increases from 45 to 90%, the electrode thickness is decreased from 19% to 10% of the original thickness. This large difference in electrode thickness change, during the first 45 wt. % and second 45% wt. % of silicon added, shows a strong correlation to electrode stack or electrode pair energy density. A very similar trend is observed in Figure 1b, to a lesser extent, as this incorporates silicon growth at 100% SOC. Electrodes which contain a high percentage of silicon are thinner but show greater growth due to the silicon expansion.
The thickness information in Figure 1b compares electrode thickness at 100% SOC. The key difference between the two figures is that as the weight percentage of silicon in the electrode is increased, a much larger expansion occurs at 100% SOC compared to an electrode containing a majority of graphite. Electrodes at 100% SOC containing 90 wt. % silicon are 25% as thick as an electrode with no silicon. An electrode containing equal parts silicon and graphite (45:45) is 33% as thick as an electrode containing no silicon. Both Figure 1a,b highlight the fact that during the initial introduction of silicon to a lithium-ion cell negative electrode, there is a large percentage decrease in electrode coating thickness and the resulting cell thickness for the same areal loading. This decrease in thickness is not linear, and at higher percentages of silicon, electrode coating thickness decreases much less, which results in a much smaller increase in cell volumetric energy density.

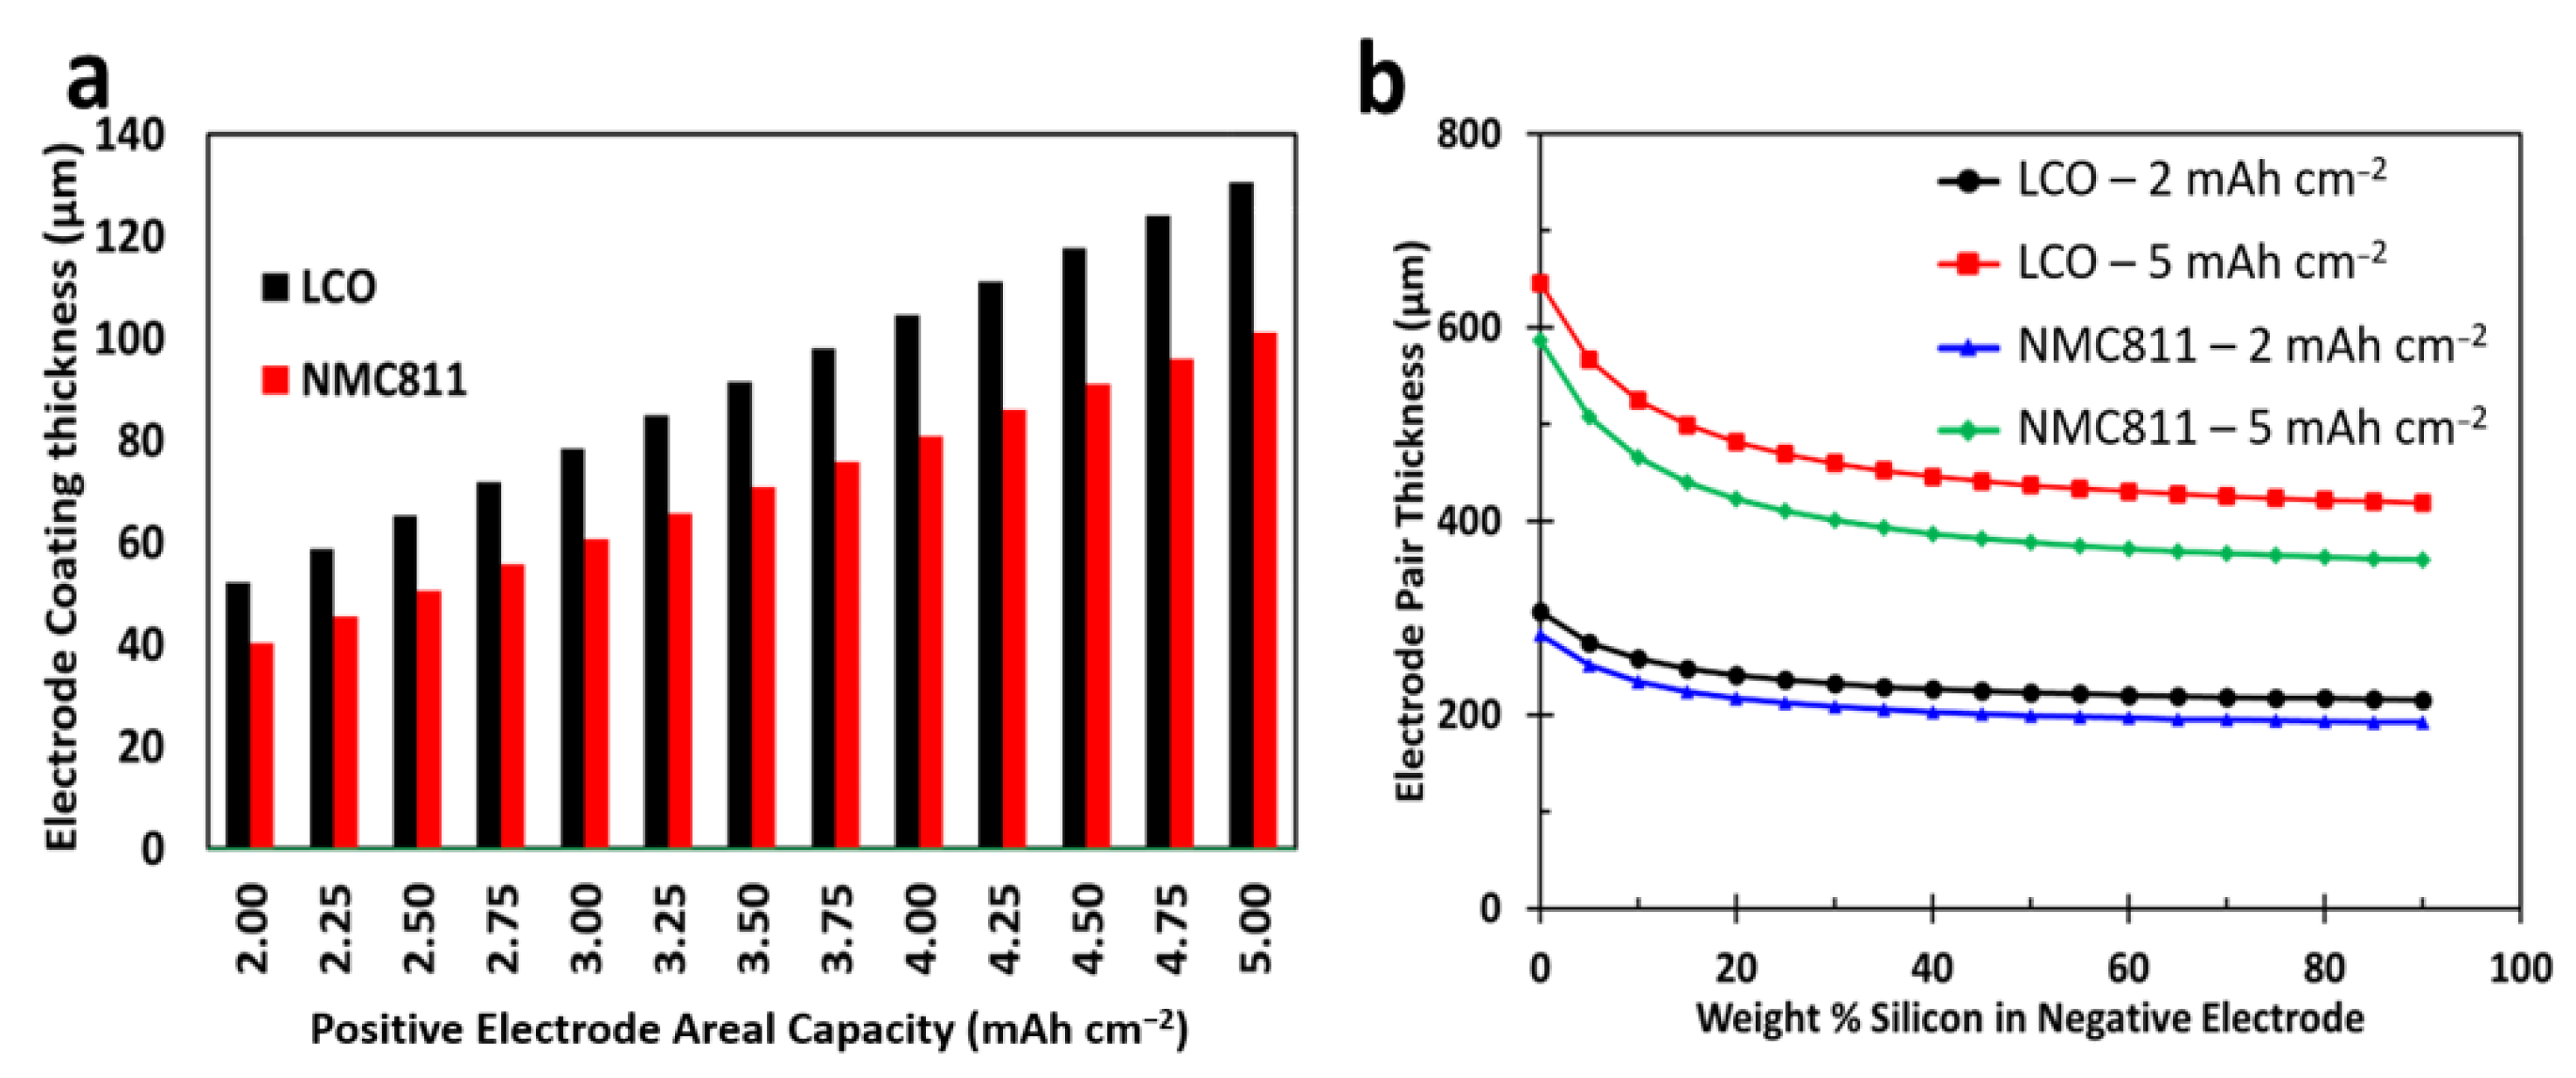
3.2. Positive Electrode Thickness LCO versus NMC 811

Another key component of determining stack or pair volumetric energy density is the thickness of the positive electrode. Figure 2a shows the thickness of a positive electrode containing either LCO or NMC811 as the active component at 100% SOC. NMC811 has a 33% higher specific capacity when compared to LCO but also has a slightly lower density, both of which affect electrode thickness. For all areal capacity loadings, an NMC811 electrode is 77% as thick as an electrode containing LCO as the active material. Comparisons of stack and pair volumetric energy density and cell capacity for cells containing both LCO and NMC 811 positive active materials are included in the next section. Figure 2b compares electrode pair thickness at 100% SOC for both LCO and NMC811 electrode pairs for various weight percentages of silicon in the negative electrode; 0 to 90%. For clarity in Figure 2b, only lines corresponding to the low and high end of areal loadings were included, 2.00 and 5.00 mAh cm−2. All additional data can be found in the Supplemental Materials. A very similar conclusion can be drawn from Figure 2b as was drawn Figure 1. For the same areal loading, a large decrease in electrode pair thickness is observed during the first initial silicon addition. Recall that each line at the same areal loading (black and blue or red and green) represents the same capacity electrode pair. An electrode pair with NMC811 in place of LCO results in a thinner electrode pair. For an areal capacity of 2 mAh cm−2, LCO electrodes containing electrode pairs are 8 to 12% thicker, and for 5 mAh cm−2, LCO electrodes containing electrode pairs are 10 to 16% thicker.

3.3. Stack Characteristics

Combining the electrode thickness of the positive and negative electrode for various areal loadings while meeting cell design thickness requirements results in a range of cell capacities, electrode pairs, stack thickness values, and volumetric energy densities. Figure 3 includes the results from variations in areal loading and percentage of silicon in the negative electrode for cells containing both LCO- and NMC811-based positive electrodes. Figure 3a displays the cell capacities, while Figure 3b highlights the electrode pairs used to meet the stack thickness requirements. Again, for plot clarification and simplicity, only the extreme areal loadings of 2.00 and 5.00 mAh cm−2 are included in these figures, with all additional data provided in the Supplemental Materials. In Figure 3a, the cell design that should deliver the maximum capacity is 5.00 mAh cm−2 with an NMC811 positive electrode. The lowest design capacity is a 2.00 mAh cm−2 LCO positive electrode. For the lowest areal loading, 2.00 mAh cm−2, NMC811 cells deliver an increased capacity over LCO cells ranging from 10 to 15%, while for 5.00 mAh cm−2, NMC811 cells have a greater capacity ranging from 8 to 25%.
Comparing Figure 3a and Figure 3b, numerous ranges in percentage silicon have the same design capacity. Figure 3b explains this result. As the percentage of silicon in the negative electrode is increased, the electrode stack becomes thinner due to a thinner negative electrode. If an additional electrode pair was added to the cell stack, the maximum stack thickness would be exceeded. As an example 5.00 mAh cm−2 LCO design, the red line in Figure 3a,b shows the same capacity and number of electrode pairs between 55% and 90% silicon. Although these designs would deliver the same capacity, the overall electrode stack would be thinner, resulting in an increased stack volumetric energy density. Thinner areal loadings result in an increased number of electrode pairs. Cells with 2.00 mAh cm−2 would contain between 21 and 33 and 23 and 38 electrode pairs for LCO and NMC811 designs, respectively. The heaviest areal loading designs would contain between 10 and 17 and 11 and 21 electrode pairs for LCO and NMC811 cell designs, respectively.
Figure 3c,d compare the electrode stack thickness for uncharged electrode stacks and electrode stacks at 100% SOC. The largest contributor to the difference in these figures is the 280% thickness growth of the silicon component of the negative electrode.
Figure 3e,f compare stack volumetric energy density for the uncharged and 100% SOC stack. Vertical axes for these figures have been kept equal to allow for easier comparison. In either plot, NMC811-containing cells have increased stack volumetric energy density, compared to LCO-containing cells, for all areal loadings. For the lowest areal loading of 2.00 mAh cm−2, uncharged NMC811 cells have a volumetric energy density ranging from 547 to 881 Wh L−1. At 100% SOC, the volumetric energy density is 525–773 Wh L−1, increasing as the percentage of silicon in the negative electrode is increased. LCO-containing cells show a very similar trend, with ranges of 492–758 Wh L−1 and 472–670 Wh L−1 for the uncharged and 100% SOC electrode stacks, respectively.
For the maximum areal loading of 5.00 mAh cm−2, 100% SOC volumetric energy densities for NMC811 and LCO cells range from 633 to 1032 and 559 to 863 Wh L−1, respectively. Volumetric energy density values decrease from 4 to 15% between an uncharged and 100% SOC electrode stack, with this percentage increasing as additional silicon is added to the negative electrode.
Very similar conclusions can be drawn from Figure 3e,f relating to stack properties and percentage silicon in the negative electrode. As silicon is introduced into the negative electrode, there is a large increase in volumetric energy density, until around 25–30% silicon. At this point, the volumetric energy density increases much less per percentage of silicon added.

4. Conclusions

As lithium-ion cell research and development continues, new positive and negative active materials will be incorporated into commercial cells. Historically, LCO and graphite have been the materials of choice, with NMC811 and silicon proving to be the materials of the future, due to the possibility of showing large increases in cell energy density. Both materials currently have issues with long-term cycling and capacity fade, but large efforts are being made to mitigate these issues. When evaluating these materials for the next generation of lithium-ion technology, it is extremely important that they not only be evaluated on a material level, but also at a stack or cell level. The presented results highlight not only the increase in cell volumetric energy density that can be achieved by implementing NMC811, but also the increase which can be achieved as various amounts of silicon are incorporated into a graphite negative electrode.
At a cell or stack level, there is diminishing return that occurs as silicon is added to the negative electrode, replacing graphite. The results show what is possible for future commercial lithium-ion cell energy densities, where any addition of silicon results in increases in volumetric energy density, but the greatest return in energy density for percentage silicon added occurs at approximately 25–30%. This does not mean that research should not strive to include as much silicon as possible, as this will increase cell volumetric energy density, but the greatest benefit is reaching approximately 25–30 weight percentage silicon with high reversibility.

Supplementary Materials

The following supporting information can be downloaded at: https://www.mdpi.com/article/10.3390/batteries9120576/s1, Figure S1: Electrode pair thickness for LCO; Figure S2: Electrode pair thickness for NMC811; Figure S3: Cell capacity for cells containing LCO; Figure S4: Cell capacity for cells containing NMC811; Figure S5: Electrode pairs for cells containing LCO; Figure S6: Electrode pairs for cells containing NMC811; Figure S7: Uncharged energy density for cells containing LCO; Figure S8: Uncharged energy density for cells containing NMC811; Figure S9: 100% state of charge energy density for cells containing LCO; Figure S10: 100% state of charge energy density for cells containing NMC811.

Funding

Work has been partially supported by the Penn State Hazleton Research Development Grant.

Data Availability Statement

Data available on request due to restrictions.

Conflicts of Interest

The author declares no conflict of interest.

References

  1. Lipu, M.S.H.; Al Mamun, A.; Ansari, S.; Miah, M.S.; Hasan, K.; Meraj, S.T.; Abdolrasol, M.G.M.; Rahman, T.; Maruf, M.H.; Sarker, M.R.; et al. Battery Management, Key Technologies, Methods, Issues, and Future Trends of Electric Vehicles: A Pathway toward Achieving Sustainable Development Goals. Batteries 2022, 8, 119. [Google Scholar] [CrossRef]
  2. Kennedy, B.; Patterson, D.; Camilleri, S. Use of Lithium-Ion Batteries in Electric Vehicles. J. Power Sources 2000, 90, 156–162. [Google Scholar] [CrossRef]
  3. Salgado, R.M.; Danzi, F.; Oliveira, J.E.; El-Azab, A.; Camanho, P.P.; Braga, M.H. The Latest Trends in Electric Vehicles Batteries. Molecules 2021, 26, 3188. [Google Scholar] [CrossRef] [PubMed]
  4. Liu, W.; Placke, T.; Chau, K.T. Overview of Batteries and Battery Management for Electric Vehicles. Energy Rep. 2022, 8, 4058–4084. [Google Scholar] [CrossRef]
  5. Scrosati, B.; Garche, J. Lithium Batteries: Status, Prospects and Future. J. Power Sources 2010, 195, 2419–2430. [Google Scholar] [CrossRef]
  6. Märker, K.; Reeves, P.J.; Xu, C.; Griffith, K.J.; Grey, C.P. Evolution of Structure and Lithium Dynamics in LiNi0.8Mn0.1Co0.1O2 (NMC811) Cathodes during Electrochemical Cycling. Chem. Mater. 2019, 31, 2545–2554. [Google Scholar] [CrossRef]
  7. Beltrop, K.; Klein, S.; Nölle, R.; Wilken, A.; Lee, J.J.; Köster, T.K.J.; Reiter, J.; Tao, L.; Liang, C.; Winter, M.; et al. Triphenylphosphine Oxide as Highly Effective Electrolyte Additive for Graphite/NMC811 Lithium Ion Cells. Chem. Mater. 2018, 30, 2726–2741. [Google Scholar] [CrossRef]
  8. Xia, Y.; Zheng, J.; Wang, C.; Gu, M. Designing Principle for Ni-Rich Cathode Materials with High Energy Density for Practical Applications. Nano Energy 2018, 49, 434–452. [Google Scholar] [CrossRef]
  9. Noh, H.J.; Youn, S.; Yoon, C.S.; Sun, Y.K. Comparison of the Structural and Electrochemical Properties of Layered Li[NixCoyMnz]O2 (x = 1/3, 0.5, 0.6, 0.7, 0.8 and 0.85) Cathode Material for Lithium-Ion Batteries. J. Power Sources 2013, 233, 121–130. [Google Scholar] [CrossRef]
  10. Ryu, H.H.; Park, K.J.; Yoon, C.S.; Sun, Y.K. Capacity Fading of Ni-Rich Li[NixCoyMn1−x−y]O2 (0.6 ≤ x ≤ 0.95) Cathodes for High-Energy-Density Lithium-Ion Batteries: Bulk or Surface Degradation? Chem. Mater. 2018, 30, 1155–1163. [Google Scholar] [CrossRef]
  11. Lee, S.; Manthiram, A. Can Cobalt Be Eliminated from Lithium-Ion Batteries? ACS Energy Lett. 2022, 7, 3058–3063. [Google Scholar] [CrossRef]
  12. Banza Lubaba Nkulu, C.; Casas, L.; Haufroid, V.; De Putter, T.; Saenen, N.D.; Kayembe-Kitenge, T.; Musa Obadia, P.; Kyanika Wa Mukoma, D.; Lunda Ilunga, J.M.; Nawrot, T.S.; et al. Sustainability of Artisanal Mining of Cobalt in DR Congo. Nat. Sustain. 2018, 1, 495–504. [Google Scholar] [CrossRef] [PubMed]
  13. Gulley, A.L. One Hundred Years of Cobalt Production in the Democratic Republic of the Congo. Resour. Policy 2022, 79, 103007. [Google Scholar] [CrossRef]
  14. Secrist, E.S.; Fehring, T.K. Cobalt Mining in the Democratic Republic of the Congo for Orthopaedic Implants: A Complex Ethical Issue with No Simple Solutions. J. Bone Jt. Surg. 2023, 105, 167–171. [Google Scholar] [CrossRef]
  15. Dong, Q.; Guo, F.; Cheng, Z.; Mao, Y.; Huang, R.; Li, F.; Dong, H.; Zhang, Q.; Li, W.; Chen, H.; et al. Insights into the Dual Role of Lithium Difluoro(Oxalato)Borate Additive in Improving the Electrochemical Performance of NMC811||Graphite Cells. ACS Appl. Energy Mater. 2020, 3, 695–704. [Google Scholar] [CrossRef]
  16. Myung, S.T.; Maglia, F.; Park, K.J.; Yoon, C.S.; Lamp, P.; Kim, S.J.; Sun, Y.K. Nickel-Rich Layered Cathode Materials for Automotive Lithium-Ion Batteries: Achievements and Perspectives. ACS Energy Lett. 2017, 2, 196–223. [Google Scholar] [CrossRef]
  17. Schmuch, R.; Wagner, R.; Hörpel, G.; Placke, T.; Winter, M. Performance and Cost of Materials for Lithium-Based Rechargeable Automotive Batteries. Nat. Energy 2018, 3, 267–278. [Google Scholar] [CrossRef]
  18. Schipper, F.; Erickson, E.M.; Erk, C.; Shin, J.-Y.; Chesneau, F.F.; Aurbach, D. Review—Recent Advances and Remaining Challenges for Lithium Ion Battery Cathodes. J. Electrochem. Soc. 2017, 164, A6220–A6228. [Google Scholar] [CrossRef]
  19. Zuo, X.; Zhu, J.; Müller-Buschbaum, P.; Cheng, Y.J. Silicon Based Lithium-Ion Battery Anodes: A Chronicle Perspective Review. Nano Energy 2017, 31, 113–143. [Google Scholar] [CrossRef]
  20. Müller, J.; Michalowski, P.; Kwade, A. Impact of Silicon Content and Particle Size in Lithium-Ion Battery Anodes on Particulate Properties and Electrochemical Performance. Batteries 2023, 9, 377. [Google Scholar] [CrossRef]
  21. Sakabe, J.; Ohta, N.; Ohnishi, T.; Mitsuishi, K.; Takada, K. Porous Amorphous Silicon Film Anodes for High-Capacity and Stable All-Solid-State Lithium Batteries. Commun. Chem. 2018, 1, 24. [Google Scholar] [CrossRef]
  22. Karkar, Z.; Jaouhari, T.; Tranchot, A.; Mazouzi, D.; Guyomard, D.; Lestriez, B.; Roué, L. How Silicon Electrodes Can Be Calendered without Altering Their Mechanical Strength and Cycle Life. J. Power Sources 2017, 371, 136–147. [Google Scholar] [CrossRef]
  23. Wang, B.; Wang, D.; Wang, F.; Li, J.; Wang, B.; Zhou, Y.; Liu, H.; Dou, S. Prelithiation: A Crucial Strategy for Boosting the Practical Application of next-Generation Lithium Ion Battery. ACS Nano 2021, 15, 2197–2218. [Google Scholar] [CrossRef] [PubMed]
  24. Holtstiege, F.; Bärmann, P.; Nölle, R.; Winter, M.; Placke, T. Pre-Lithiation Strategies for Rechargeable Energy Storage Technologies: Concepts, Promises and Challenges. Batteries 2018, 4, 4. [Google Scholar] [CrossRef]
  25. Jin, L.; Shen, C.; Shellikeri, A.; Wu, Q.; Zheng, J.; Andrei, P.; Zhang, J.G.; Zheng, J.P. Progress and Perspectives on Pre-Lithiation Technologies for Lithium Ion Capacitors. Energy Environ. Sci. 2020, 13, 2341–2362. [Google Scholar] [CrossRef]
  26. Cui, Y. Silicon Anodes. Nat. Energy 2021, 6, 995–996. [Google Scholar] [CrossRef]
  27. Günter, F.J.; Wassiliadis, N. State of the Art of Lithium-Ion Pouch Cells in Automotive Applications: Cell Teardown and Characterization. J. Electrochem. Soc. 2022, 169, 030515. [Google Scholar] [CrossRef]
  28. Yourey, W. Theoretical Impact of Manufacturing Tolerance on Lithium-Ion Electrode and Cell Physical Properties. Batteries 2020, 6, 23. [Google Scholar] [CrossRef]
  29. Moyassari, E.; Kücher, S.; Jobst, N.M.; Chang, C.-C.; Hou, S.-C.; Spingler, F.B.; Wohlfahrt-Mehrens, M.; Jossen, A. Influence of Initial Porosity on the Expansion Behavior of Electrodes in Lithium-Ion Batteries. J. Electrochem. Soc. 2023, 170, 050528. [Google Scholar] [CrossRef]
  30. Sun, P.; Bisschop, R.; Niu, H.; Huang, X. A Review of Battery Fires in Electric Vehicles. Fire Technol. 2020, 56, 1361–1410. [Google Scholar] [CrossRef]
  31. Yourey, W. Cell Design Considerations and Impact on Energy Density—A Practical Approach to EV Cell Design. World Electr. Veh. J. 2023, 14, 279. [Google Scholar] [CrossRef]
  32. Moyassari, E.; Roth, T.; Kücher, S.; Chang, C.-C.; Hou, S.-C.; Spingler, F.B.; Jossen, A. The Role of Silicon in Silicon-Graphite Composite Electrodes Regarding Specific Capacity, Cycle Stability, and Expansion. J. Electrochem. Soc. 2022, 169, 010504. [Google Scholar] [CrossRef]
Figure 1. Negative electrode coating thickness at (a) calender and (b) 100% SOC for electrodes containing between zero and ninety weight percentage silicon. Electrodes contain a combination of ninety weight percentage active material made up of both graphite and silicon.
Batteries 09 00576 g001
Figure 2. (a) Positive electrode thickness at 100% SOC for LCO and NMC811 positive electrodes. Areal loadings range from 2.00 to 5.00 mAh cm−2. (b) Electrode pair thickness for LCO and NMC811 electrodes at 2.00 and 5.00 mAh cm−2 containing different percentages of silicon.
Batteries 09 00576 g002
Figure 3. (a) Cell capacity for cells containing either LCO or NMC811 for various weight percentages of silicon with positive areal loadings of 2.00 and 5.00 mAh cm−2. (b) Number of electrode pairs. (c) Uncharged and (d) 100% SOC stack thickness. (e) Uncharged stack and (f) 100% SOC volumetric energy density.
Batteries 09 00576 g003
Table 1. Positive and negative electrode formulations [28].
Positive Electrode (LCO)
MaterialWeight PercentDensity (g/cm3)
LiCoO2905.00
Conductive Additive52.00
PVDF Electrode Binder51.78
Positive Mixture-4.29
Positive Electrode (NMC 811)
MaterialWeight PercentDensity (g/cm3)
NMC 811904.80
Conductive Additive52.00
PVDF Electrode Binder51.78
Positive Mixture-4.16
Negative Electrode
MaterialWeight PercentDensity (g/cm3)
Active Carbon90 → 02.20
Silicon0 → 902.33
Conductive Additive22.00
PVDF Electrode Binder81.78
Negative Mixture-2.15 → 2.27
Table 2. Fixed components for cell design [31].
ComponentDimensionsMaterial
Positive Current Collector20 µmAl foil
Negative Current Collector10 µmCu foil
Negative Electrode200 mm × 120 mm-
Positive Electrode199 mm × 119 mm-
Separator 1201.75 mm × 120 mm × 25 µmPolypropylene/Polyethylene
1 Overall separator dimensions are used for stack length and width for energy density calculations.
Disclaimer/Publisher’s Note: The statements, opinions and data contained in all publications are solely those of the individual author(s) and contributor(s) and not of MDPI and/or the editor(s). MDPI and/or the editor(s) disclaim responsibility for any injury to people or property resulting from any ideas, methods, instructions or products referred to in the content.

