Abstract
Lithium-ion (Li-ion) batteries are considered to be one of the ideal energy sources for automotive and electronic products due to their size, high levels of charge, higher energy density, and low maintenance. When Li-ion batteries are used in harsh environments or subjected to poor charging habits, etc., their degradation will be accelerated. Thus, online state of health (SOH) estimation becomes a hot research topic. In this study, normalized capacity is considered as SOH for the estimation and calculation of remaining useful lifetime (RUL). A multi-step look-ahead forecast-based deep learning model is proposed to obtain SOH estimates. A total of six batteries, including three as source datasets and three as target datasets, are used to validate the deep learning model with a transfer learning approach. Transferability measures are used to identify source and target domains by accounting for cell-to-cell differences in datasets. With regard to the SOH estimation, the root mean square errors (RMSEs) of the three target batteries are 0.0070, 0.0085, and 0.0082, respectively. Concerning RUL prediction performance, the relative errors of the three target batteries are obtained as 2.82%, 1.70%, and 0.98%, respectively. In addition, all 95% prediction intervals of RUL on the three target batteries include the end-of-life (EOL) value (=0.8). These results indicate that our method can be applied to battery SOH estimation and RUL prediction.
1. Introduction
Recently, there have been major breakthroughs in battery energy technology. Investment in technologies that support mass vehicle electrification is expected to increase in adoption as the government sets a deadline to end sales of fossil fuel-powered vehicles. A total of 10.5 million new battery and plug-in hybrid vehicle deliveries took place in 2022, a 55% increase compared to 2021 [1]. Lithium-ion (Li-ion) batteries have high energy density, low self-discharge rate, and low maintenance that are superior to other energy storage systems such as NiMH batteries, lead-acid batteries, and supercapacitors [2]. Li-ion batteries are used as energy storage devices in electric vehicles (EVs). Therefore, Li-ion batteries need to be managed properly.
Estimating the state of health (SOH), state of charge (SOC), and remaining useful life (RUL) of a battery is useful information in a smart battery management system (BMS) [3]. In an RUL prediction study, the decision to replace a degraded battery can be made before the battery reaches its end-of-life (EOL) or 80% of the initial capacity [4]. Both SOH estimation and RUL prediction are getting increasing attention because accurate prediction provides useful information for proper battery health management. Three main categories, model-based methods, data-driven methods, and hybrid methods, are widely used to predict the RUL of Li-ion batteries [5,6]. A model-based method, such as one based on a physical degradation model, is applied to describe the internal electrochemical reactions of Li-ion batteries. However, modeling this type of method under different workloads and operating conditions is a challenging task. Whereas data-driven methods or hybrid methods have been shown in many studies in the literature to provide better RUL predictions.
While data-driven methods are more popular than model-based methods, the need for large amounts of data and specialized skills to guarantee accurate predictive performance is a drawback. Transfer learning is able to train a predictive model using a source dataset and transfer the learned parameters to a predictive model on a target dataset [7,8].
Previous studies on SOH estimation and RUL prediction mostly use offline methods. Regarding those offline methods, model training, and estimation verification are performed on known samples, and then the model is used for multi-step prediction. These predicted values cannot reflect the whole capacity degradation. Therefore, accurate prediction is a challenging task for the wide application of intelligent BMS. Transfer learning (TL) can reuse a pre-trained model for another dataset, reducing the time and data required to train a different predictive model. Although transfer learning has been applied to Li-ion battery RUL prediction, most of the previously published papers did not discuss the training starting point or choose a random starting point for model training [9]. A deep learning model such as the bidirectional long short-term memory and attention mechanism (Bi-LSTM-AM) model is successfully achieved online Li-ion RUL prediction [10]. Therefore, we propose a method based on Bi-LSTM-AM and a transfer learning technique called Bi-LSTM-AM-TR, expecting accurate SOH prediction.
The specific objectives of this article are: (1) to show how transfer learning can be applied to alleviate data shortage by transferring pre-trained model weights from source data to target data, and (2) to apply a sliding window approach to obtain multi-step-ahead predictions of SOH. Section 2 reviews related research on SOH and RUL prediction and transfer learning. Section 3 introduces our proposed method, including the sliding window method, transferability measure, BiLSTM-AM model, and evaluation metrics. The results of Bi-LSTM-AM-TR with other LSTM-based models for Li-ion batteries are presented in Section 4. Finally, in conclusion, we state that the prediction results of our proposed Bi-LSTM-AM-TR method are suitable for online RUL prediction.
2. Related Works
In this study, the SOH is given by:
where SOHi is a normalized discharge capacity at the ith cycle, is the measured capacity based on discharging process at cycle number i, and is the initial capacity.
In addition, RUL is defined as the cycle life between the current cycle number and EOL, which is defined as:
where is the remaining life after the start cycle number of the predicted RUL, TS is the start cycle number of the RUL prediction, and is the end of life.
2.1. Remaining Useful Life Prediction
Online RUL and SOH estimation studies can be used to improve battery management systems. Research methods can be divided into three categories: methods based on adaptive filters, methods based on artificial intelligence (AI), and mathematical models such as stochastic processes [11]. Adaptive filters contain the Kalman filter [12], particle filter (PF) [4], and improved particle filter [13]. For example, Chen et al. [4] used PF and grey model to build an RUL prediction framework. Dong et al. [14] proposed a method consisting of PF and support vector regression (SVR) for SOH recording and RUL prediction. Peng et al. [15] developed a multivariate degradation model using batch particle filters.
AI-based methods include artificial neural networks (ANNs), support vector machine (SVM), random forest (RF) and extreme gradient boosting (XGB), recurrent neural networks (RNNs) such as LSTM and gated recurrent unit (GRU), and convolutional neural networks (CNNs). Liu et al. [16] studied an ensemble prediction method based on LSTM and Bayesian model averaging (BMA) for RUL prediction. Ungurean et al. [17] applied a GRU model to online SOH prediction.
Mathematical models include the equivalent circuit model, the Gaussian process regression (GPR) model [18,19,20], and the Wiener process model [21,22]. Xu et al. [21] used the Wiener process with useful time for regeneration for RUL prediction. Shen et al. [22] presented a two-stage Wiener process model to quantify the capacity difference between different degradation stages and an unscented particle filter (UPF) algorithm was used for RUL prediction. Jia et al. [23] used the voltage, current, and temperature during the charging process as health indicators, and a GPR model with a probability approach was used to predict short-term SOH.
A hybrid approach integrates multiple predictive models and can achieve better predictive results than a single model. Wu et al. [24] studied a hybrid approach combining neural networks and bat-based particle filters for Li-ion battery RUL prediction. Li et al. [25] proposed an Elman-LSTM model for battery RUL prediction. Gou et al. [26] used an ensemble approach based on random vector function linking (RVFL) and extreme learning machines (ELM) to predict SOH and RUL. Table 1 summarizes the pros and cons of numerous prediction methods.

Table 1.
The summary of different RUL prediction methods.
2.2. Transfer Learning on SOH and RUL Prediction
Che et al. [27] applied the GPR model to optimize the health indicators and used a gated recurrent neural network with transfer learning for predicting RUL. Chehade and Hussein [28,29] used the GPR model to analyze the capacity degradation trend and investigated a multi-output convolutional Gaussian process to decompose the capacity trend of multiple Li-ion cells into a latent function to forecast the capacity trend.
Many researchers have proposed transfer learning to improve SOH estimation. El-Dalahmeh et al. [30] introduced multi-domain feature time-frequency image (TFI) analysis and TL to effectively improve SOH estimation accuracy. Li and Tao [31] proposed a CNN-based architecture with TL for automatic feature extraction and online SOH estimation. Shen et al. [32] proposed a deep CNN with a transfer learning approach for online capacity estimation. Shen et al. [33] presented Deep CNN with ensemble and transfer learning called DCNN-ETL for online capacity estimation. Jia et al. [34] used the transfer component analysis (TCA) with the ELM model for the SOH estimation. Kim et al. [7] proposed the LSTM-TL model to predict SOH by using three types of batteries; one as a source dataset and the other two as target datasets. Ye and Yu [35] proposed a deep domain adversarial network (DDAN) to address the distribution difference between training and testing datasets in SOH estimation.
Health feature extraction plays a major role in SOH estimation. Kong et al. [36] developed an extraction approach for voltage-temperature health features and these features are input to a battery degradation model for RUL prediction. Table 2 provides a summary of some studies on Li-ion battery SOH and RUL prediction.
Table 2.
Summary of previously published studies on Li-ion battery SOH and RUL prediction.
3. Proposed Method
Our proposed method framework, Bi-LSTM-AM with the transfer learning technique, for capacity prediction and RUL prediction is shown in Figure 1. The knee point is used as the start cycle number of the RUL prediction. We use the Bi-LSTM-AM model from the source data to obtain a pre-trained model. We then tune the pre-trained model by freezing the BI-LSTM-AM layers and fully connected (FC) layers. This fine-tuning step will help the pre-trained model transfer weights. Finally, the fine-tuned model will be used to predict the capacity of the target data.
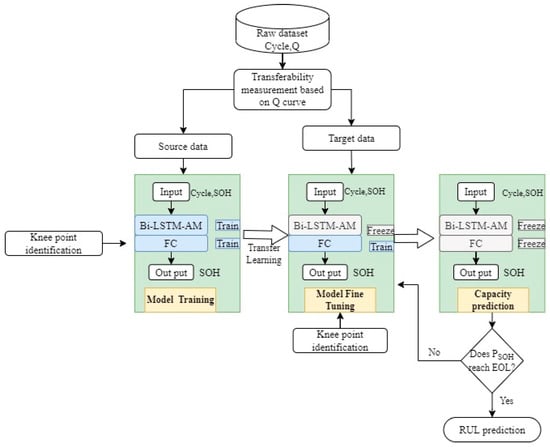
Figure 1.
The proposed method framework.
An LSTM unit has 3 gates (Input, Output, and Forget Gate) to protect and control the cell state and add necessary information to the current state. There are 3 inputs to an LSTM unit, i.e., previous cell state, previous unit output, and input event at the time t. Whereas it has two outputs, i.e., current cell state, and current output.
Bi-LSTM is a variation of LSTM that flows input in both the direction to preserve future and past information. The forward LSTM reads the input visit sequence from x1 to xt and calculates a sequence of forward hidden states. The backward LSTM reads the visit sequence in reverse order. By concatenating the forward hidden state and the backward one, we can obtain the final latent vector representation as shown in Figure 2. Forward LSTM hidden-state () and backward LSTM hidden-state () are calculated simultaneously at each time step t [39].
where , , and b are the forward LSTMs’ weight, the backward LSTM weight, and the output layer bias, respectively.
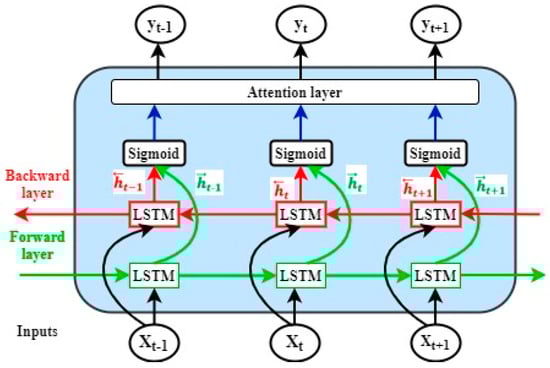
Figure 2.
The Bi-LSTM-AM model.
Regarding the attention layer, the vector Mi is calculated by a weighted sum of the states (St), which is given by
where and is the output score of a feedforward neural network described by the function a that attempts to capture the alignment between input at j and output at i.
In the RUL prediction process, the sliding window approach can remove random fluctuations and noise disturbance of the dataset. In the sliding window process, the window with size L, slides over the time series data, and for each sliding step, the model will approximate the data inside the window. The output of the first step will be input for the next step of the model.
To determine the predicted RUL, a multi-step-ahead prediction approach is performed through iterative one-step ahead prediction in which every iteration generates one prediction value and then passes to Bi-LSTM-AM as the subsequent window input data. One-step-ahead predictions are iteratively made until the predicted SOH reaches its end of life ().
A long-term prediction sequence is obtained by iteratively implementing the one-step-ahead prediction approach. Let us suppose the current cycle number is . In the proposed sliding window prediction, the next cycle number will be the starting point for the one-step-ahead prediction. In this prediction process, there will be a measured sequence of SOH with observations (), and a predicted sequence of os SOH (). The first predicted sequence value will be:
In this equation, is the sliding window length at cycle number , while is Bi-LSTM-AT based prediction function. After finding the first predicted SOH value, we can obtain the second prediction value, where is the first predicted SOH value at cycle number .
The alternative prediction process will continue until the predicted SOH value reaches EOL, as indicated in Equation (9) below.
The illustration of the entire prediction process is provided in Figure 3.
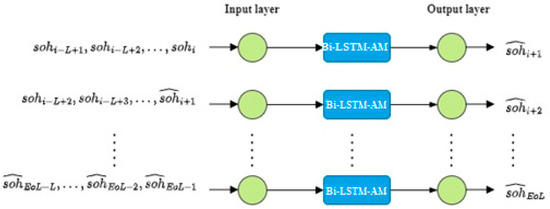
Figure 3.
Illustration of iterative prediction of Bi-LSTM-AM with sliding window approach.
4. Transferability Measures for Source and Target Batteries Selection
In transfer learning, the data distribution similarity between the source and target data plays a vital role in the model’s training and prediction performance. Therefore, instead of randomly choosing the source data and the target data, a transferable sample selection approach [40] is used in this study. The four-step transferability measures are based on the curve shapes, the rate of long-term degradation, based on the life span concentration at the end of the test, and the distance between the degradation curves. The Toyota battery dataset [41] has a total of 124 cells that tested under fast charging policies with a cycle life ranging from 150 to 2300 cycles. As a transferability measurement, we apply the following two steps to select the source and target data.
Step 1: As the first step, we select batteries with a cycle life greater than 400. Batteries with unknown EOL values and those with cycle life less than 400 will be removed. Therefore, batteries with long and medium cycle life span will be selected for the next selection step.
Step 2: After identifying the batteries with long and medium cycle life, the degradation curves are grouped into three regions as shown in Figure 4, where the capacity values are the actual capacity values from the dataset.
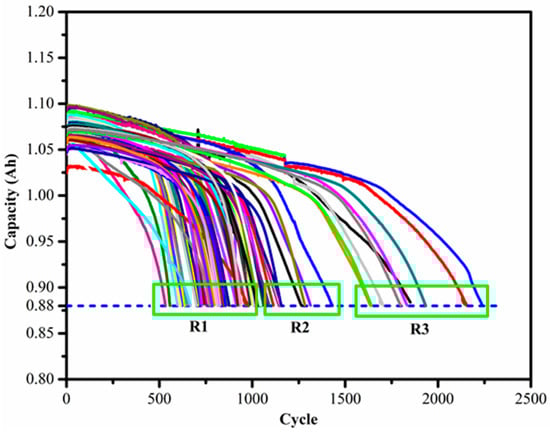
Figure 4.
Grouping of the batteries based on cycle life.
The selection of the source and target data from these regions has its advantages and disadvantages.
Option 1: Use batteries at region 3 as the source battery and at region 1 as the target battery. This will help to have more training data but may result in negative transfer because of the difference in the shape of the degradation curves.
Option 2: Use batteries at region 2 as the source battery and batteries at region 1 as the target battery. The degradation curve similarity is better than the first option, but this will result in less training data.
Option 3: Use batteries from region 1 with a similar curve shape and minimum Chebyshev distance as the source battery and the target battery. It provides better similarity between source data and target data.
Therefore, considering the merits and demerits of the above three options, one source and one target dataset are selected from each region based on the Chebyshev distance between curves. The equation for Chebyshev distance is given as:
where and are two vectors, and are standard coordinates on the curve, and is the Chebyshev distance between points and .
Finally, three source batteries and three target batteries are selected for our proposed method validation as shown in Table 3 and Figure 5.
Table 3.
Description of cells in the source and target domain.
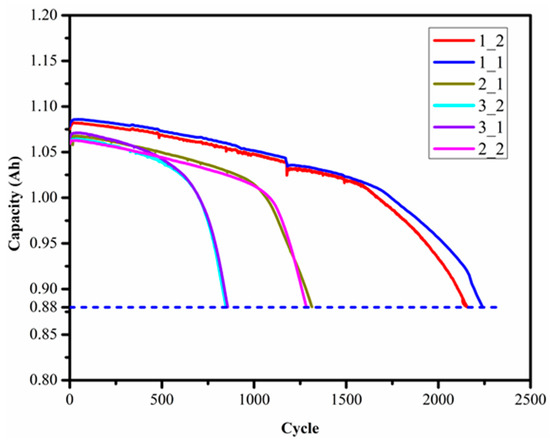
Figure 5.
The six batteries used as the source and target dataset.
The root mean square error (RMSE) is used as a performance evaluation metric in this study to compare different model performances for SOH prediction and is given by:
where and denote the observed SOH and the predicted SOH for cycle number i.
For testing the RUL prediction performance of the proposed model, absolute error (AE) and relative error (RE) measures are used as indicated in Equations (12) and (13).
where denotes the predicted RUL and denotes the actual RUL.
Here, the 95% prediction interval of SOH is derived by:
where predSOH is the predicted SOH, is obtained by using the MC dropout approach, and is based on the inherent noise. The details of this approach can be found in [10].
5. Analysis Results
We discuss the performance of two prediction methods (without and with transfer learning), where four LSTM-based models including LSTM, LSTM-AM, Bi-LSTM, and Bi-LSTM-AM are considered. All analyses were carried out on a desktop computer equipped with Intel Core (TM) i9-9900K (3.60 GHz) CPU, NVIDIA GeForce GX 1060, and Microsoft Operating System (Windows NTx64). The Python code runs under Spyder 3.7.3 environment with PyTorch library.
In the proposed method, different cells are selected as the source domain and target domain using transferability measures analysis. The Bi-LSTM-AM model is used to train batteries 1_1, 2_1, and 3_1, respectively, as the pre-trained model. Then batteries 1_2, 2_2, and 3_2 used the fine-tuning approach for the pre-trained model by freezing the Bi-LSTM-AM layer and the fully connected (FC) layer. Finally, we use the fine-tuned model to predict the future SOH.
The Bi-LSTM-AM-TR model hyperparameters need to be assigned first. Finding the optimal parameters of a deep learning model is a challenging task. Therefore, iterative optimization is followed by assigning preset values for the model hyperparameters to improve performance. From the model hyperparameters, the number of epochs, the number of lookbacks, the number of neurons, batch size, and dropout rate affect the model prediction performance. Table 4 provides the hyperparameters used for all batteries to obtain the SOH prediction results.
Table 4.
Hyperparameters used in SOH predictions.
The SOH prediction results using different LSTM-based models using without/with transfer learning are shown in Table 5 and Table 6. The RMSE values displayed in both tables are for the test data on the target batteries. The comparison results of the four LSTM-based models (LSTM, LSTM-AM, Bi-LSTM, and Bi-LSTM-AM) without transfer learning for the three source batteries are shown in Table 5. Using transfer learning, the comparison results of Bi-LSTM-AM-TR with the other four models are shown in Table 6. The weights from the source batteries are transferred to train the corresponding target battery. Accordingly, the trained weights are transferred from source battery 1_1 to target battery 1_2, from source battery 2_1 to target battery 2_2, and from source battery 3_1 to target battery 3_2.
Table 5.
SOH prediction results of the three target batteries without transfer learning.
Table 6.
SOH prediction results of the three target batteries with transfer learning.
The hyperparameters used for both target and source batteries are the same in the transfer learning process. We use a constant length of 500 cycles as the training length; for the test data, use the point from the start of RUL prediction (knee point) to EOL. As we can see from the table results, our proposed transfer learning model provides the lowest RMSE compared to the other models. The computational time is also significantly reduced for the target batteries since we transfer the trained weights to the Bi-LSTM-AM-TR model, which will save time for training the model again. The prediction results for the target batteries are shown in Figure 6. We can see from the figures that our proposed Bi-LSTM-AM-TR model has the best performance in all three target datasets, while the LSTM_AM model has the worst performance.
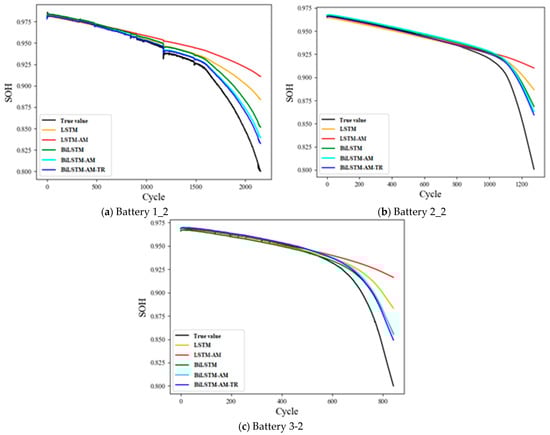
Figure 6.
Comparison results of SOH prediction for the three target batteries.
The computational time for the comparative models is also shown in Table 7. We can observe from the comparison results that the computational time is also significantly reduced for the target batteries since we transfer the trained weights to the Bi-LSTM-AM-TR model, which will save time for training the model again.
Table 7.
Computational time of different models for the six batteries (unit = second).
The comparison results of different models on SOH for the three target batteries are shown in Figure 6. These prediction results indicate that our proposed method has the best performance in terms of RMSE and computational time. The Bi-LSTM-AM model is the second-best in tracking the capacity degradation curve of the three target batteries. On the other hand, the LSTM-AM model has the worst performance in tracking the capacity degradation curve of the three target batteries. It can be seen from the model comparison graph that with the increase in the three target battery cycle times, the predicted value of the LSTM-AM model deviates from the actual value. Before the degradation curve reaches the TS point, all five models’ prediction values are closer to the actual value. However, as the cycle number increases (especially between the TS point to EOL), the prediction performance of the other models deviates from the actual value. In this regard, our proposed model performs better than the other models. That is, our proposed model can capture the real capacity degradation curves from TS to EOL for the three target batteries as the number of cycles increases.
The RUL prediction of the three source batteries and three target batteries is discussed here. All batteries used in the RUL prediction are considered to reach their EOL when the capacity value drops below 80 % of their rated capacity. The training length for all six batteries keeps constant with 500 data points prior to the prediction starting point. The sliding window with the transfer learning approach is used to predict the unknown test dataset. In this approach, the data points from the training starting point to the EOL are considered unknown.
The hyperparameter values used in computing the RUL of both the source and target batteries are indicated in Table 8. The hyperparameters for the source and target dataset have to be the same for possible weight transfer from the source to the target dataset.
Table 8.
Hyperparameters used in computing the predicted RUL.
The RUL prediction results for the target batteries using the proposed method are shown in Table 9. The training starting point (TS) and prediction starting point (TSP) are indicated in the table, all batteries have the same training length of 500. The predicted RUL with 95 % PI is also shown in the table. As we can see from the table, the maximum absolute error (AE) value is 10 and the relative error (RE) value is less than 9%. The RE values for the target batteries 1_2, 2_2, and 3_2 are 2.82%, 1.70%, and 0.98%, respectively. Figure 7 shows the RUL prediction plot for the target batteries with upper and lower 95% prediction intervals using the Monte Carlo approach.
Table 9.
RUL prediction results for the target batteries.
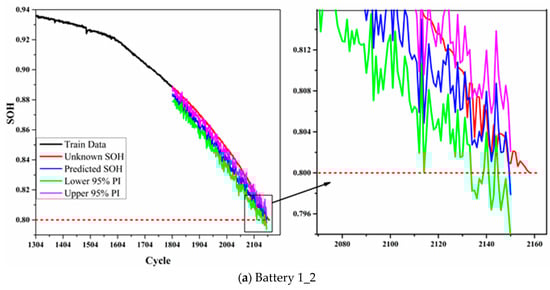
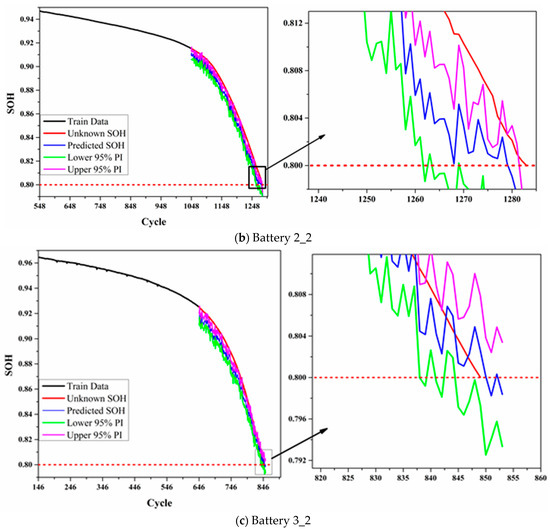
Figure 7.
RUL prediction with prediction intervals for the three target batteries.
Figure 7 shows the RUL prediction plot for the target battery. The upper and lower 95% prediction intervals are obtained by using the Monte Carlo dropout method. The black curve is the train data, the red curve is the actual (unknown) SOH value, and the blue curve is the predicted SOH. The green and pink curves are the lower and upper bounds of the 95% prediction interval values. The dashed red line represents the EOL point of the three batteries which is indicated as 80 % of the SOH value. The SOH of 88% is used as the prediction starting point, while the training starting point is the knee point of the respective batteries. For battery 1_2, our proposed model predicted the RUL before its actual RUL, while for batteries 2_2 and 3_2, the model predicted the RUL was beyond the actual RUL point. The AE values of the three target batteries are 10, 4, and 2, respectively. The RE percentage values of the three target batterie are 2.82%, 1.70%, and 0.98%, respectively. In addition, all 95% prediction intervals of RUL on the three target batteries include the EOL value (=0.8). These results show that the proposed RUL prediction method can be applied to battery health management with uncertainty.
6. Conclusions
Accurate prediction is a challenging task for the wide application of intelligent BMS. Transfer learning can reuse a pre-trained model in another related task, reducing the time and data required to train a different predictive model. Although transfer learning has been applied to Li-ion battery RUL prediction, most of the previously published papers did not discuss the training starting point or choose a random starting point for model training.
We propose a method based on Bi-LSTM-AM and a transfer learning technique called Bi-LSTM-AM-TR, where normalized capacity is considered as SOH. The EOL of the battery is given as SOH = 0.8. Three source and three target batteries using a transferable sample selection approach were selected for model validation. Our proposed method achieves better prediction results than the other LSTM-based models.
For this study, the relative error values of the target battery using the proposed method on the three target batteries are 2.82%, 1.70%, and 0.98%, respectively. These prediction results show that our proposed method is very suitable for online RUL prediction.
For the proposed transfer learning approach, the weights from the three trained source batteries are transferred to the corresponding three target batteries, and SOH is predicted using the transferred weights. The transfer learning approach gives a better result compared to LSTM-based models without transfer learning and saves a significant amount of training time, making it suitable for online prediction.
Further research will extend our proposed model to predict multiple target cells from multiple source cells. In addition, the impact of different prediction starting points and training lengths on model prediction performance can be considered.
Author Contributions
Conceptualization, F.-K.W. and Z.E.A.; methodology, F.-K.W., Z.E.A., and J.-H.C.; software, J.-H.C. and Z.E.A.; validation, F.-K.W. and J.-H.C.; formal analysis, Z.E.A.; investigation, F.-K.W.; resources, F.-K.W.; data curation, Z.E.A.; writing—original draft preparation, Z.E.A.; writing—review and editing, F.-K.W. and Z.E.A.; visualization, Z.E.A.; supervision, F.-K.W.; project administration, F.-K.W.; funding acquisition, F.-K.W. All authors have read and agreed to the published version of the manuscript.
Funding
This research was funded by the Ministry of Science and Technology in Taiwan under Grant MOST-109-2221-E011-098-MY3.
Data Availability Statement
The dataset presented in this study is openly available at https://data.matr.io/1 (accessed on 3 December 2022).
Acknowledgments
The authors acknowledge the Ministry of Science and Technology in Taiwan for funding this work.
Conflicts of Interest
The authors declare no conflict of interest.
References
- Global EV Sales for 2022 H1. Available online: https://www.ev-volumes.com/ (accessed on 6 March 2023).
- U.S Department of Energy. Batteries for Hybrid and Plug-in Electric Vehicles. Available online: https://afdc.energy.gov/vehicles/electric_batteries.html/ (accessed on 19 August 2022).
- Ali, M.; Zafar, A.; Nengroo, S.H.; Hussain, S.; Park, G.S.; Kim, H.J. Online remaining useful life prediction for lithium-ion batteries using partial discharge data features. Energies 2019, 12, 4366. [Google Scholar] [CrossRef]
- Chen, L.; Wang, H.; Chen, J.; An, J.; Ji, B.; Lyu, Z.; Cao, W.; Pan, H. A novel remaining useful life prediction framework for lithium-ion battery using grey model and particle filtering. Int. J. Energy Res. 2020, 44, 7435–7449. [Google Scholar] [CrossRef]
- Ge, M.F.; Liu, Y.; Jiang, X.; Liu, J. A review on state of health estimations and remaining useful life prognostics of lithium-ion batteries. Measurement 2021, 174, 109057. [Google Scholar] [CrossRef]
- Hasib, S.A.; Islam, S.; Chakrabortty, R.K.; Ryan, M.J.; Saha, D.K.; Ahamed, M.H.; Moyeen, S.I.; Das, S.K.; Ali, M.F.; Islam, M.R.; et al. A comprehensive review of available battery datasets, RUL prediction approaches, and advanced battery management. IEEE Access 2021, 9, 86166–86193. [Google Scholar] [CrossRef]
- Kim, S.; Choi, Y.Y.; Kim, K.J.; Choi, J.I. Forecasting state-of-health of lithium-ion batteries using variational long short-term memory with transfer learning. J. Energy Storage 2021, 41, 102893. [Google Scholar] [CrossRef]
- Zhuang, F.; Qi, Z.; Duan, K.; Xi, D.; Zhu, Y.; Zhu, H.; Xiong, H.; He, Q. A comprehensive survey on transfer learning. Proc. IEEE 2021, 109, 43–76. [Google Scholar] [CrossRef]
- Li, Y.; Li, K.; Liu, X.; Wang, Y.; Zhang, L. Lithium-ion battery capacity estimation—A pruned convolutional neural network approach assisted with transfer learning. Appl. Energy 2021, 285, 116410. [Google Scholar] [CrossRef]
- Wang, F.K.; Amogne, Z.E.; Chou, J.H.; Tseng, C. Online remaining useful life prediction of lithium-ion batteries using bidirectional long short-term memory with attention mechanism. Energy 2022, 254, 124344. [Google Scholar] [CrossRef]
- Wang, S.; Jin, S.; Deng, D.; Fernandez, C. A critical review of online battery remaining useful lifetime prediction methods. Front. Mech. Eng. 2021, 7, 719718. [Google Scholar] [CrossRef]
- Lin, X.; Tang, Y.; Ren, J.; Wei, Y. State of charge estimation with the adaptive unscented Kalman filter based on an accurate equivalent circuit model. J. Energy Storage 2021, 41, 102840. [Google Scholar] [CrossRef]
- Wu, M.; Qin, L.; Wu, G.; Huang, Y.; Shi, C. State of charge estimation of power lithium-ion battery based on a variable forgetting factor adaptive Kalman filter. J. Energy Storage 2021, 41, 102841. [Google Scholar] [CrossRef]
- Dong, H.; Jin, X.; Lou, Y.; Wang, C. Lithium-ion battery state of health monitoring and remaining useful life prediction based on support vector regression-particle filter. J. Power Sources 2014, 271, 114–123. [Google Scholar] [CrossRef]
- Peng, W.; Ye, Z.S.; Chen, N. Joint online RUL prediction for multivariate deteriorating systems. IEEE Trans. Ind. Inform. 2019, 15, 2870–2878. [Google Scholar] [CrossRef]
- Liu, Y.; Zhao, G.; Peng, X. Deep learning prognostics for lithium-ion battery based on ensembled long short-term memory networks. IEEE Access 2019, 7, 155130–155142. [Google Scholar] [CrossRef]
- Ungurean, L.; Micea, M.V.; Cârstoiu, G. Online state of health prediction method for lithium-ion batteries, based on gated recurrent unit neural networks. Int. J. Energy Res. 2020, 44, 6767–6777. [Google Scholar] [CrossRef]
- Fan, L.; Wang, P.; Cheng, Z. A remaining capacity estimation approach of lithium-ion batteries based on partial charging curve and health feature fusion. J. Energy Storage 2021, 43, 103115. [Google Scholar] [CrossRef]
- Hosen, M.S.; Youssef, R.; Kalogiannis, T.; Van Mierlo, J.; Berecibar, M. Battery cycle life study through relaxation and forecasting the lifetime via machine learning. J. Energy Storage 2021, 40, 102726. [Google Scholar] [CrossRef]
- Pan, W.; Luo, X.; Zhu, M.; Ye, J.; Gong, L.; Qu, H. A health indicator extraction and optimization for capacity estimation of li-ion battery using incremental capacity curves. J. Energy Storage 2021, 42, 103072. [Google Scholar] [CrossRef]
- Xu, X.; Yu, C.; Tang, S.; Sun, X.; Si, X.; Wu, L. Remaining useful life prediction of lithium- ion batteries based on Wiener processes with considering the relaxation effect. Energies 2019, 12, 1685. [Google Scholar] [CrossRef]
- Shen, D.; Wu, L.; Kang, G.; Guan, Y.; Peng, Z. A novel online method for predicting the remaining useful life of lithium-ion batteries considering random variable discharge current. Energy 2021, 218, 119490. [Google Scholar] [CrossRef]
- Jia, J.; Liang, J.; Shi, Y.; Wen, J.; Pang, X.; Zeng, J. SOH and RUL Prediction of lithium-ion batteries based on Gaussian process regression with indirect health indicators. Energies 2020, 13, 375. [Google Scholar] [CrossRef]
- Wu, Y.; Li, W.; Wang, Y.; Zhang, K. Remaining useful life prediction of lithium-ion batteries using neural network and bat-based particle filter. IEEE Access 2019, 7, 54843–54854. [Google Scholar] [CrossRef]
- Li, X.; Zhang, L.; Wang, Z.; Dong, P. Remaining useful life prediction for lithium-ion batteries based on a hybrid model combining the long short-term memory and Elman neural networks. J. Energy Storage 2019, 21, 510–518. [Google Scholar] [CrossRef]
- Gou, B.; Xu, Y.; Feng, X. State-of-health estimation and remaining-useful-life prediction for lithium- ion battery using a hybrid data-driven method. IEEE Trans. Veh. Technol. 2020, 69, 10854–10867. [Google Scholar] [CrossRef]
- Che, Y.; Deng, Z.; Lin, X.; Hu, L.; Hu, X. Predictive battery health management with transfer learning and online model correction. IEEE Trans. Veh. Technol. 2021, 70, 1269–1277. [Google Scholar] [CrossRef]
- Chehade, A.A.; Hussein, A.A. A collaborative Gaussian process regression model for transfer learning of capacity trends between li-ion battery cells. IEEE Trans. Veh. Technol. 2020, 69, 9542–9552. [Google Scholar] [CrossRef]
- Chehade, A.A.; Hussein, A.A. A Multioutput convolved Gaussian process for capacity forecasting of li-ion battery cells. IEEE Trans. Power Electron. 2022, 37, 896–909. [Google Scholar] [CrossRef]
- El-Dalahmeh, M.; Al-Greer, M.; El-Dalahmeh, M.; Short, M. Time-frequency image analysis and transfer learning for capacity prediction of lithium-ion batteries. Energies 2020, 13, 5447. [Google Scholar] [CrossRef]
- Li, Y.; Tao, J. CNN and transfer learning based online SOH estimation for lithium-ion battery. In Proceedings of the 2020 Chinese Control And Decision Conference (CCDC), Hefei, China, 22–24 August 2020; pp. 5489–5494. [Google Scholar] [CrossRef]
- Shen, S.; Sadoughi, M.; Hu, C. Online estimation of lithium-ion battery capacity using transfer learning. In Proceedings of the IEEE Transportation Electrification Conference and Expo (ITEC), Detroit, MI, USA, 19–21 June 2019; pp. 1–4. [Google Scholar] [CrossRef]
- Shen, S.; Sadoughi, M.; Li, M.; Wang, Z.; Hu, C. Deep convolutional neural networks with ensemble learning and transfer learning for capacity estimation of lithium-ion batteries. Appl. Energy 2020, 260, 114296. [Google Scholar] [CrossRef]
- Jia, B.; Guan, Y.; Wu, L. A state of health estimation framework for lithium-ion batteries using transfer components analysis. Energies 2019, 12, 2524. [Google Scholar] [CrossRef]
- Ye, Z.; Yu, J. State-of-health estimation for lithium-ion batteries using domain adversarial transfer learning. IEEE Trans. Power Electron. 2021, 37, 3528–3543. [Google Scholar] [CrossRef]
- Kong, J.; Yang, F.; Zhang, X.; Pan, E.; Peng, Z.; Wang, D. Voltage-temperature health feature extraction to improve prognostics and health management of lithium-ion batteries. Energy 2021, 223, 120114. [Google Scholar] [CrossRef]
- Tan, Y.; Zhao, G. Transfer learning with long short-term memory network for state-of-health prediction of lithium-ion batteries. IEEE Trans. Ind. Electron. 2020, 67, 8723–8731. [Google Scholar] [CrossRef]
- Chen, Z.; Chen, L.; Shen, W.; Xu, K. Remaining useful life prediction of lithium-ion battery via a sequence decomposition and deep learning integrated approach. IEEE Trans. Veh. Technol. 2022, 71, 1466–1479. [Google Scholar] [CrossRef]
- Bahdanau, D.; Cho, K.; Bengio, Y. Neural machine translation by jointly learning to align and translate. arXiv 2015, arXiv:1409.0473. Available online: https://arxiv.org/abs/1409.0473 (accessed on 28 December 2021).
- Ma, J.; Shang, P.; Zou, X.; Ma, N.; Ding, Y.; Sun, J.; Cheng, Y.; Tao, L.; Lu, C.; Su, Y.; et al. A hybrid transfer learning scheme for remaining useful life prediction and cycle life test optimization of different formulation li-ion power batteries. Appl. Energy 2020, 282, 116167. [Google Scholar] [CrossRef]
- Severson, K.A.; Attia, P.M.; Jin, N.; Jin, N.; Perkins, N.; Jiang, B.; Yang, Z.; Chen, M.H.; Aykol, M.; Herring, P.K.; et al. Data-driven prediction of battery cycle life before capacity degradation. Nat. Energy 2019, 4, 383–391. [Google Scholar] [CrossRef]


Disclaimer/Publisher’s Note: The statements, opinions and data contained in all publications are solely those of the individual author(s) and contributor(s) and not of MDPI and/or the editor(s). MDPI and/or the editor(s) disclaim responsibility for any injury to people or property resulting from any ideas, methods, instructions or products referred to in the content. |
© 2023 by the authors. Licensee MDPI, Basel, Switzerland. This article is an open access article distributed under the terms and conditions of the Creative Commons Attribution (CC BY) license (https://creativecommons.org/licenses/by/4.0/).