Abstract
The present expeditious charging approach for electric automobiles relies on provisional trial data and the technical proficiency of lithium battery producers, and it is deficient in systematic methodologies for assessing the safety threshold of charging. The present study is grounded on the utilization of an electrochemical fast-charging model for the purpose of determining the temperature limits for lithium deposition. A proposed approach for enhancing the charging strategy involves the consideration of discharging pulses and pulse widths, and the utilization of a genetic algorithm based on the lithium deposition boundary. The present approach endeavors to enhance the duration of charging and minimize the occurrence of irreversible thermal effects by employing the existing threshold as a safeguard threshold. The outcomes of the experiment indicate that the electrochemical rapid charging approach proposed in this study exhibits a significant level of simulation precision when subjected to high magnification and a wide range of temperatures. Furthermore, the implementation of an enhanced genetic algorithm-based optimized charging strategy has demonstrated the capability to efficiently balance the charging duration and irreversible heat, leading to a significant improvement in the charging performance in comparison to the conventional 1 C constant current charging approach.
1. Introduction
Lithium-ion batteries (LIBs) have quickly acquired popularity in electrified transportation due to their attractive features of high gravimetric and volumetric densities. In conjunction with the rapid and anticipated rise of electric vehicles (EVs) and LIB utilization, the past few years have witnessed extensive research on battery management systems (BMSs), including state estimation [1,2], health prognosis [3,4], and fault diagnostics [5,6]. LIB charging is acknowledged as a crucial technology for the future success of EVs. However, the quest for a maximum charging speed carries the risk of violating critical physical limits, along with unanticipated thermal/stress buildup and side reactions. In the worst-case scenario, this can lead to diminished effectiveness, rapid depletion, and even safety risks.
Charging control has been the subject of extensive research, spawning a variety of solutions that may be divided into two basic categories. The first group consists of heuristic rule-based methods that are model-free and commonly utilized in real-world applications. The constant current–constant voltage (CCCV) charging protocol [7,8] and its several versions, such as the multistage constant current (MCC) [9,10], multistage CCCV [11,12], and boost charging [13,14,15,16], are well-known options. Despite their low complexity, these approaches are empirical and lack adequate knowledge of battery dynamics and physical restrictions. Consequently, these methods are far from the optimum in terms of charging speed and the enforcement of battery safety or durability. This has prompted the investigation of the second category of methodologies, namely, model-based tactics.
On the other hand, several studies have addressed charge safety using a high-precision battery model. Lin et al. [17] used the porous electrode electrochemical model and the two-state thermal model. A significant quantity of training and test data was gathered, and the LSTM (long short-term memory) model was constructed. Parameters for current, voltage, state of charge, and surface temperature may be utilized to forecast the anode potential under various scenarios. However, the influence of SoH on the battery model parameters is not taken into account, and the electrochemical model utilized is sophisticated and difficult to obtain parameter values with. Han et al. [18] employed P2D models to produce training data and then trained several neural networks to predict the anode potential during rapid charging by utilizing these training data. Based on an analogous circuit model, Drees et al. [19] partitioned cathode and anode circuit parts in modeling and correlated parameters with SoC and temperature. Chu et al. [20] retrieved the anode potential by simplifying the P2D model, utilized the anode overpotential observer to monitor the lithium deposition state in real time while charging, and changed the current in real time to guarantee that the lithium battery was not in a lithium-depleting condition. Yin et al. [21] developed an electrochemical model capable of calculating the ion concentration and anode potential in real time and then linearized and mathematically processed the model to simplify it. When employing a high-precision model to solve the charging safety boundary, it is important to evaluate how the model’s complexity and parameter identification affect the boundary acquisition process.
Based on the above, it can be seen that existing control strategies have good effects in shortening charging time or ensuring battery health, but there are still some issues that need to be improved. Firstly, the research on charging safety boundaries mainly focuses on a single factor under short-time-scale conditions, without considering the coupling effects of multiple factors (temperature, magnification, SoC, SoH, etc.), and without considering the identification and acquisition of charging safety boundaries under long-time-scale conditions. Therefore, it is not possible to directly use charging safety boundaries to guide the development of fast charging strategies and vehicle applications. Second, the majority of research focuses on multistage constant current charging techniques [22,23,24] or single-amplitude intermittent pulse charging strategies [25,26,27]. The influence of variable amplitude, charge current pulse or discharge current pulse on the battery charging process has received little consideration.
Considering the above issues, a charging safety boundary formulation method based on the SP + fast charging battery model is proposed in this study. The model is used to obtain the charging safety boundary of batteries at different environmental temperatures, and a comparative experimental group is set up under different cycling conditions inside and outside the safety boundary to verify the accuracy of the safety boundary. Additionally, a reverse pulse current is added in the charging process to decrease battery polarization and potential lithium degradation, as well as to increase battery charging capacity and charging speed. Because a high-polarization voltage will cause the real permissible current of the battery to decrease, lowering the battery’s charging rate, and the rise in the current rate will create a significant quantity of latent heat inside the battery [28,29]. Finally, a multiobjective optimization technique based on an enhanced genetic algorithm (GA) [9] is proposed to generate the charging strategy, with the goal of minimizing charging time and irreversible heat, the safety barrier as the current limit, and the impact of the discharge current pulse and pulse width on the optimization.
The main contributions of this research are summarized as follows:
- In this study, the whole life cycle of a fast-charging and life test platform of power batteries is established. Considering the influence of a variable ambient temperature and high current ratio on model parameters, multifactor fast charging and cycle tests were set up, and a battery fast charging data set is established. On this basis, a high-precision battery simulation model is established.
- Based on the simulation model, the charging safety boundary at different temperatures is obtained, and the accuracy of the safety boundary is verified via comparative tests. A multiobjective-optimization fast charging problem considering the safety boundary is established. Taking the charging time and irreversible heat as the optimization objectives, taking the safety boundary as the current limit, and considering the impact of pulse width, an improved genetic algorithm is used to solve the optimal charging strategy.
- In view of the impact of battery deterioration on model parameters and security boundaries, for the normal temperature charging scenario, the simulation model parameters and the update research of the charging strategy in a long time scale are proposed, and the effectiveness of the update of the strategy is verified through a capacity decay experiment, which provides a reference for improving the charging speed and ensuring battery safety.
This article comprises six distinct sections in its structure. The initial section expounds upon the significance of secure and expeditious battery charging and outlines the research trajectory of the manuscript. The subsequent phase involves the development of an electrochemical framework for the battery, incorporating a parameter identification approach that is contingent on the chosen electrochemical model. The third step involves determining the secure limits of battery charging by utilizing the established electrochemical model to obtain the safe boundaries of battery charging at varying temperatures. The fifth section of the study focuses on the selection of two optimization objectives for fast charging strategies, which are based on charging boundaries. The study then proceeds to solve the global optimal control strategy through the utilization of an improved genetic algorithm. The efficacy of the capacity decay experiment approach is assessed in the sixth section through validation.
2. Working Principle and Modeling of LIBs
The charging and discharging of LIBs mainly depends on the deinking and embedding of lithium ions between the positive and negative electrodes [30], as shown in Figure 1. The majority of current electrochemical models fail to incorporate the impact of elevated current rates and fluctuating environmental temperatures on model parameters. The precision of battery terminal voltage simulation under conditions of high-current-rate charging and discharging is insufficient, thereby impeding the determination of safety thresholds for subsequent charging and the development of expeditious charging protocols.
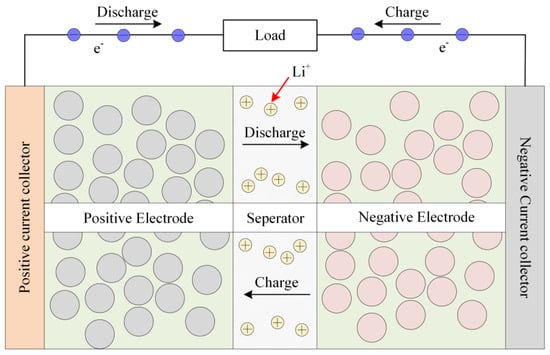
Figure 1.
Working process of LIBs.
The chapter has opted for the SP+ model as a means to mitigate challenges associated with parameter identification and computational complexity, while also ensuring the accuracy of the battery model. The SP+ model was formulated based on the P2D model. The SP model incorporates various processes, including solid–liquid diffusion and ohmic polarization, while simultaneously reducing the parameters involved.
2.1. Basic Reaction Process
Under a constant battery degradation state and ambient temperature, the battery’s charging and discharging processes correspond to a specific set of anode and cathode lithium intercalation concentrations, as well as the current open-circuit voltage, for each state of charge (SoC). Under the assumption that the battery undergoes low-rate charging and discharging, it can be inferred that no diffusion process takes place. Consequently, the open-circuit voltage can be expressed as follows.
where and are the intrinsic open circuit potential curves of the positive and negative electrodes of the utilized LIBs, which are exclusively connected to the anode and cathode electrode materials and may be acquired by charging and discharging at a low rate. and represent the initial lithium concentrations of the anode and cathode, respectively. and correspond to the maximal level of anode and cathode lithium-ion re-embedding. is the capacity of the battery. and are the embedded lithium concentration ranges.
2.2. Solid-Phase Diffusion Process
The solid-phase diffusion process involves a specified relationship between the surface lithium concentration of positive and negative active particles and the internal lithium concentration.
where and represent the concentration of lithium embedded on the surface of the anode and cathode electrodes, respectively. and are the intermediate variables of the anode and cathode concentration difference with an initial value of 0. and is the solid-phase diffusion time constant of the anode and cathode, and ) is the solid-phase diffusion time constant of the cathode.
2.3. Liquid-Phase Diffusion Process
During the course of the process, active particles of positive and negative electrodes undergo the embedment and detachment of lithium ions, which subsequently results in the development of a concentration disparity between the positive and negative liquid phases. This, in turn, leads to the occurrence of lithium ion diffusion in the electrolyte and concentration polarization. According to reference [18], it is commonly assumed that the concentration of lithium ions in the liquid phase at both the positive and negative electrodes undergoes a similar change denoted by . The formula used to calculate the overpotential caused by concentration polarization is as follows:
where represents the liquid-phase diffusion’s proportional coefficient. is the concentration difference of liquid lithium ions at the electrode boundary generated by liquid diffusion, and the initial value is 0. represents the liquid-phase diffusion’s time constant.
2.4. Electrochemical Polarization Process
Upon the sudden addition of a current, the electrochemical reaction rate within the cell exhibits a delay in comparison to the rate of electron movement. Currently, the electrode potential experiences a deviation, resulting in the formation of electrochemical polarization. The formula for calculating electrochemical polarization overpotential is presented in reference [18].
where is the positive electrochemical polarization overpotential. is the negative electrochemical polarization overpotential. is the electrochemical polarization overpotential. is the electrochemical polarization coefficient.
2.5. Ohmic Polarization Process
The phenomenon of ohmic polarization pertains to the polarization effect that arises from the internal resistance of various components of lithium-ion batteries (LIBs). This resistance is primarily attributed to the solid electrolyte interface (SEI), as well as the positive and negative electrode materials and electrolyte, etc. [31]. The formula for calculation is as follows.
where is the equivalent ohmic resistance inside the battery.
The formula for calculating the terminal voltage of a battery during its operation can be derived from the internal reaction described above.
In order to examine the maximum safe charging current curve in battery operation, it is imperative to acquire the negative electrode potential during said operation. Following experimentation conducted in my laboratory, the formula for calculating negative potential is as follows.
The summary of the parameters to be identified by the model is shown in Table 1.

Table 1.
Parameter identification variable.
3. Model Parameter Identification Results and Verification
3.1. Pulse Excitation Response Test Condition Design
This research employs a lithium-battery test platform that was constructed in the laboratory to devise diverse test scenarios for evaluating the battery’s performance. Figure 2 depicts the testing platform. The testing apparatus comprises two distinct components, namely a rapid charging testing platform and an alternating current impedance testing platform. The experimental setup for rapid charging evaluation comprises a switch, a battery charging and discharging analyzer, a programmable constant temperature and humidity chamber, and a computerized system for data acquisition. The AC impedance testing platform comprises an electrochemical workstation. The present study focuses on the Prospower ICR18650P cells as the subject of investigation. Table 2 displays the specifications and parameters. The battery’s AC impedance is sufficiently low to satisfy the demands of rapid charging and discharging.
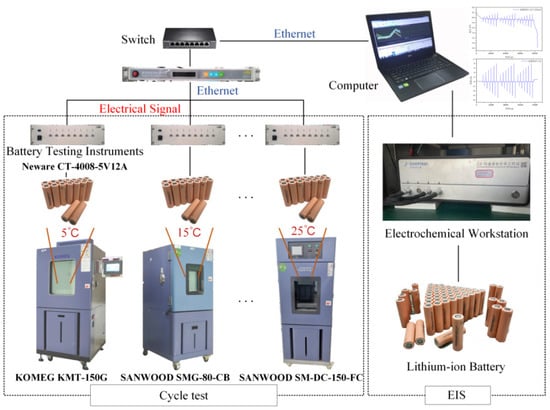
Figure 2.
Battery test platform.
Table 2.
Battery specifications.
Per the specifications outlined in Section 2, a total of 12 model parameters are required to be identified. The current excitation response can be utilized to obtain the terminal voltage change curve under various excitations, without the need to disassemble the battery. Upon current excitation, it is evident that ohmic polarization and electrochemical polarization will manifest, followed by stabilization of solid and liquid phase diffusion after a certain duration. Hence, utilizing the variation in reaction to present stimulation in the lithium-ion battery, it is plausible to distinguish the open circuit voltage and the overpotential that arises from electrochemical polarization, ohmic polarization, and solid–liquid phase diffusion for the purpose of parameter identification.
The parameter identification conditions and terminal voltage results of B01 battery at an ambient temperature of 25 °C are shown in Figure 3a,b. The red dot in Figure 3b indicates that the battery is put aside for 30 min after the current excitation becomes zero. At this time, the internal concentration polarization of the battery recovers, and the battery reaches a stable state. The measured terminal voltage can be regarded as the open-circuit voltage, , as shown in Figure 3c.
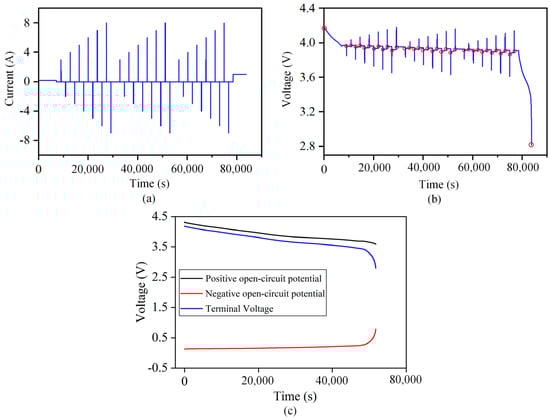
Figure 3.
Schematic diagram of the parameter identification working condition and measured terminal voltage curve. (a) Parameter identification working condition. (b) Terminal voltage curve at 25 °C. (c) The terminal voltage of the battery and the open circuit potential curve of the positive and negative electrodes.
3.2. Identification of Basic Characteristic Parameters of Batteries
The SoC of the battery can be calculated in real time using the charge accumulation method when the battery capacity does not decay.
By comprehensively analyzing Formulas (21) and (1)–(3), the open-circuit potential can be expressed as follows.
Ordinary least squares regression [32] is adopted, and relevant empirical functions are used to fit the positive and negative potential curves mentioned above; the fitting data for each parameter at different temperatures are detailed in the Appendix A. The final empirical expressions for the positive and negative open circuits of the battery are obtained as follows. The relationship curve between the fitted positive and negative open circuit potential and the corresponding lithium intercalation concentration is shown in Figure 4a,b.
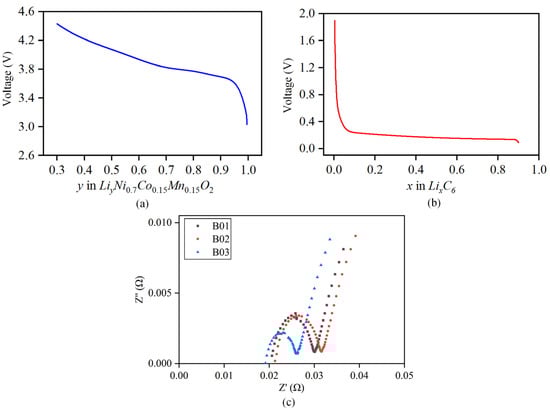
Figure 4.
Fitting curve of positive and negative open-circuit potential. (a) Curve of positive open-circuit potential. (b) Curve of negative open-circuit potential. (c) Schematic diagram of battery’s internal resistance.
3.3. Identification of Ohmic Polarization Parameters
Per the findings in Section 2.5, it is evident that the ohmic internal resistance’s composition is solely dependent on the battery’s current state of charge (SoC), state of health (SoH), and environmental temperature. Furthermore, it is observed that this composition remains unaffected by the calculation process of other parameters. Consequently, the ohmic internal resistance of novel batteries can be determined autonomously at varying ambient temperatures.
The sinusoidal excitation current is applied to both sides of the battery to obtain the impedance spectrum of the battery. The of different batteries is obtained from the intersection with the X-axis, and the average is calculated to obtain the final ohmic internal resistance value, as shown in Figure 4c. The test found that the ohmic internal resistance is more accurate when SOC = 50%. Therefore, this article selects the ohmic internal resistance at SOC = 50% for subsequent research. The identification results of under different temperatures are shown in Table 3. The results show that the ohmic internal resistance increases exponential growth with a decrease in temperature, and decreases gradually with an increase in temperature.
Table 3.
at different temperatures.
3.4. Parameter Identification Verification
To verify the accuracy of the identified parameters and the model, four indexes, including RMSE (root mean square error), MAE (mean absolute error), correlation coefficient () and maximum error (), were used to evaluate the model. The indicators are described as follows:
where m is the total length of the sequence, is the measured terminal voltage, is the simulated terminal voltage, and is the average value of the measured terminal voltage.
In order to guarantee the precision and universality of the parameter identification outcomes, the 16 batteries exhibiting comparable performance, as outlined in Section 2.2, were evenly partitioned into two groups. Two groups conducted parameter identification at varying ambient temperatures. The first group performed the identification at temperatures of 5 °C, 15 °C, 25 °C, and 35 °C, while the second group conducted the identification at temperatures of 10 °C, 20 °C, 30 °C, and 40 °C.
The outcomes of the identification process are utilized as input for the simulation model, which generates the simulation curve for the battery terminal voltage and the corresponding error curve at varying temperatures. These curves are depicted in Figure 5. The figure depicts a magnified section wherein the dissimilarity between the computed voltage and the recorded voltage is the most significant. The majority of the inaccuracies in the simulation occur at the point of sudden alteration in current excitation. Table 4 presents the simulation outcomes.
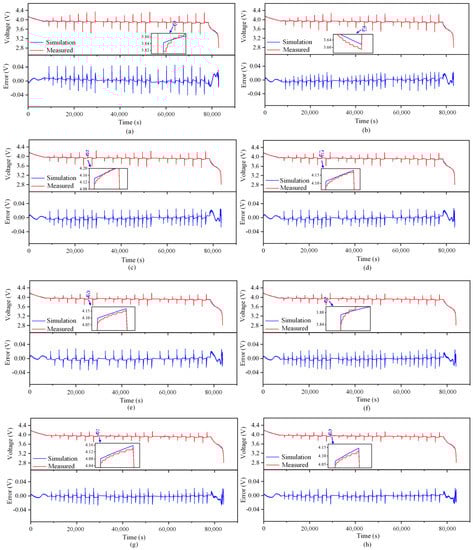
Figure 5.
Simulation terminal voltage and error curve at different temperatures (B01). (a) 5 °C. (b) 10 °C. (c) 15 °C. (d) 20 °C. (e) 25 °C. (f) 30 °C. (g) 35 °C. (h) 40 °C.
Table 4.
Indicators at different temperatures.
When the temperature is low, the maximum error of the simulation voltage is within 50 mV, while when the temperature is high, the maximum error of the simulation voltage is lower than 35 mV. At the same time, when the temperature is above 10 °C, the coefficient of determination, , is greater than 0.99, indicating that the simulation curve is very close to the measured curve, proving that the model accuracy meets the requirements. The reason for the error is that the measured value of ohmic internal resistance when SoC = 50% is selected as the fixed value in the parameter identification process, but in fact, the ohmic internal resistance will change with the change in SoC, so the ohmic polarization and electrochemical polarization calculated by the model when the current excitation is sudden are different from the actual values.
3.5. Charging Secure Boundary Acquisition
The present study exclusively takes into account the SoC range of 20–80% for the purpose of establishing the safety boundary and rapid charging strategy. This decision is based on the fact that the ohmic internal resistance of LIBs experiences a significant surge as the SoC drops below 20% [32]. Performing high-rate charging at present can result in a significant increase in the ohmic polarization overpotential, thereby impeding the chemical process within the lithium-ion batteries (LIBs) and causing a decline in their overall capacity. However, it should be noted that if the state of charge (SoC) of the battery exceeds 80%, the utilization of rapid charging may lead to an elevated voltage, causing the battery to reach its maximum capacity and rendering the negative electrode more vulnerable to lithium precipitation, as has been previously observed [33].
In this research, the lithium precipitation of the battery is defined when the negative electrode potential is lower than 0 V relative to the reference electrode, [34]. The model was used to simulate the change curve of the negative potential with SoC at different constant current rates from SoC 20% to 80% at a certain temperature. The schematic diagram is shown in Figure 6a,b.
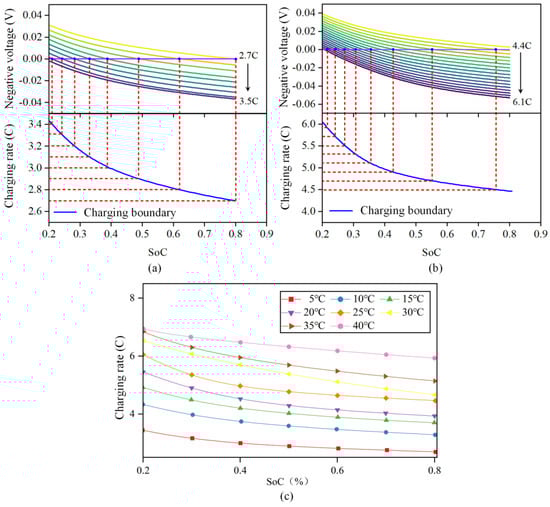
Figure 6.
Schematic diagram for obtaining the safety boundary of LIB charging under different ambient temperatures. (a) 5 °C safety boundary. (b) 25 °C safety boundary. (c) Safety boundary of lithium battery charging at different ambient temperatures.
Taking the ambient temperature of 5 °C to 40 °C, the curve of the change in negative potential with SoC when charging from 20% SoC to 80% SoC at different constant current rates was simulated, as shown in Figure 6c. The intersection point of the negative potential with 0 V at different constant current rates and the corresponding SoC were obtained to obtain the corresponding charging safety boundary.
According to the figures, the battery can tolerate a reasonably high maximum safe charging rate, which satisfies the need for a high charging rate. When the temperature decreases, the battery’s charging safety boundary declines, suggesting that the battery’s acceptable charging rate decreases at a low temperature and lithium is more likely to evolve at a high pace. This happens because when the temperature drops, the battery’s internal resistance improves dramatically. The charging safety limit increases as the temperature rises, and when the temperature is over 30 °C, the safety boundaries of different temperatures are close together because the ohmic internal resistance of the battery does not vary significantly when the temperature is above 25 °C.
4. Multiobjective Optimization of a Fast Charging Strategy Based on a Genetic Algorithm
The fast charging technique for lithium-ion batteries (LIBs) has several crucial goals, which encompass safeguarding battery integrity, enhancing charging velocity, mitigating irreversible heat (such as polarization heat and Joule heat), and curbing polarization voltage. Hence, it is imperative to circumvent the adverse effects of rapid charging, namely lithium deposition and reduced capacity, while concurrently reducing the charging duration.
The battery produces a lot of heat at a high temperature and at a rapid rate. In order to avoid the battery from losing control due to an elevated temperature, a thermal management and control system is required [35]. The quick charging method for LIBs at 5 °C and 25 °C is improved in this part to reduce the unpredictability of battery damage brought on by an excessively low temperature or rapid rate. The improved genetic algorithm’s implementation framework is shown in Figure 7. The clear process is described below.
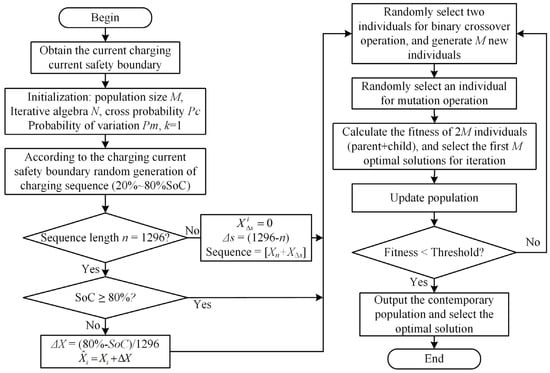
Figure 7.
Genetic algorithm framework.
(1) Population individual initialization. The parameter settings of the genetic algorithm are shown in Table 5. When initializing the population, each individual is the current sequence of charging the battery from SoC 20% to 80%. Each value in the sequence is the current amplitude of each second, and the length of the sequence is the time required for charging. The battery charging time from a 20% SoC constant current to a 80% SoC at a 1 C rate is 2160 s. To ensure that the fast charging time was more than 40% shorter than that of 1 C constant-current charging, the maximum length of the sequence was set to 1296.
Table 5.
Basic parameter settings of the GA.
(2) To evaluate individual fitness. It can be seen from Section 2 that the polarization voltage affects the charging process of LIBs [36,37]. An increase in the polarization voltage will reduce the battery life, charging efficiency and performance of LIBs, so it is necessary to reduce the polarization voltage during the charging process.
The purposes of the rapid charging strategy optimization may be stated as follows because the battery charge within the current environment’s temperature security border is known: (1) reducing the permanent heat, and (2) cutting down on battery charging time.
where is the current per second, is the maximum acceptable current corresponding to the current SoC, and is the charging time. It can be seen from the above that the total length of the sequence of different individuals is the same, and the charging time depends on the number of zeros at the end of the sequence. The sum of , and is the total polarization voltage. Since the two objectives represent the charging time and irreversible heat, respectively, the three dimensions are different, and their value ranges are different, which requires a balance adjustment treatment before coupling. Therefore, this section adopts the score system for normalization, and a higher score indicates a better optimization result.
where is the heat production of the irreversible heat of charging at 1 C. is the heat production of charging following the safety boundary. is the total heat generated by charging.
The weight coefficients and , , and are used to transform the combination of multiple targets into a single target, where plays the role of the penalty function by coupling to the fitness function with a given weight. In addition, in the subsequent crossover, mutation and other operations, the current corresponding to some positions in the individual will exceed the current charging safety boundary. Therefore, each current value in the individual will be judged by the boundary. The total number of current values beyond the boundary is recorded as , which will be coupled to the fitness function through the given weight, playing the role of a penalty function. The fitness function established is as follows.
(3) According to , two individuals are randomly selected for the crossover operation. The current parent is traversed, and random numbers, , are generated for judgment. At that time, when , two unequal individuals were randomly selected as “father” and “mother”, and SBX was used to randomly select gene loci for crossover. The progeny current sequence obtained by the crossover still meets the demand of charging from SoC 20% to 80%. The crossover function established is as follows:
where represents the cross-step size, and the larger the value is, the greater the likelihood that the created child is distant from the parent. This formula represents the current iteration algebra as well as the individual’s coding position.
(4) Mutation operation is performed on the offspring. The normal mutation process will result in modifications to the sum of the sequence, such that the present sequence cannot be charged from SoC 20% to 80%, it is difficult for the nonzero value at the conclusion of the sequence to reach zero, and the length of the final all-zero sequence cannot be increased. To ensure that the corresponding current sequences of different individuals can charge LIBs from SoC 20% to 80%, that the sum of sequences remains unchanged, and that the mutation process time is shortened, two mutation methods are adopted in this section, as depicted in Figure 8, and the detailed procedure is as follows. Both mutation processes have an equal chance of occurring.
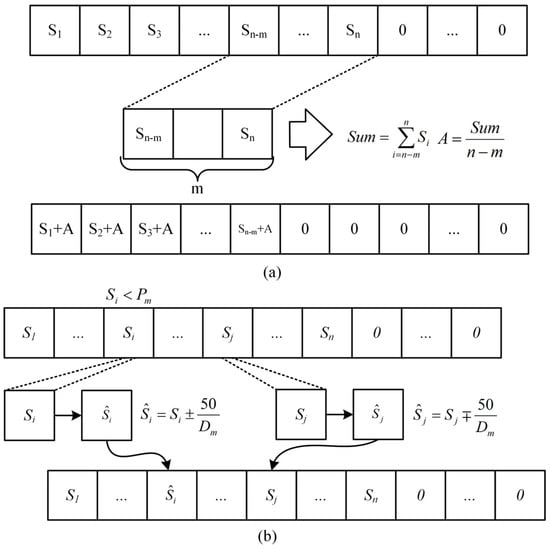
Figure 8.
Improved implementation framework of the genetic algorithm. (a) Mutation method 1. (b) Mutation method 2.
A. Mutation method 1: t M values were taken forward from the first nonzero value at the end of the sequence, , the sum of the M values was evenly divided into the previous sequence, and then the values of the M positions were set to zero.
B. Mutation method 2: a gene locus of the offspring was randomly selected according to for mutation. When the random number was less than or equal to , the current gene locus of the individual was changed by of the value, and another gene locus not in the last all-zero sequence was randomly selected for the change of .
(5) The offspring population obtained after genetic manipulation (crossover, mutation) and the parent population were individually recombined. Based on the tournament algorithm (TA), the previous optimal solution was selected as the parent population of the next generation for iteration according to the fitness function.
(6) Repeat steps 3 to 5 for update iteration. The optimal solution was considered to be found, and the search was stopped when the maximum iteration number was reached or the change in the optimal value of the fitness function within 10 consecutive generations was less than 0.0001.
5. Analysis of the Optimization Results of the Fast Charging Strategy
This section employs an enhanced genetic algorithm to produce charging strategies for distinct operating conditions, relying on the SP+ model introduced in Section 2. The present study compares the charging strategy put forth with the 1C-CCCV and 6C-CCCV charging strategies. The objective is to showcase that the proposed charging strategy is capable of mitigating heat generation during the charging process, while simultaneously reducing the charging duration.
5.1. Multiobjective Optimization Results
In this study, the multiobjective optimization experiment was divided into three groups. The optimization results for batteries are displayed in Figure 9a–c.
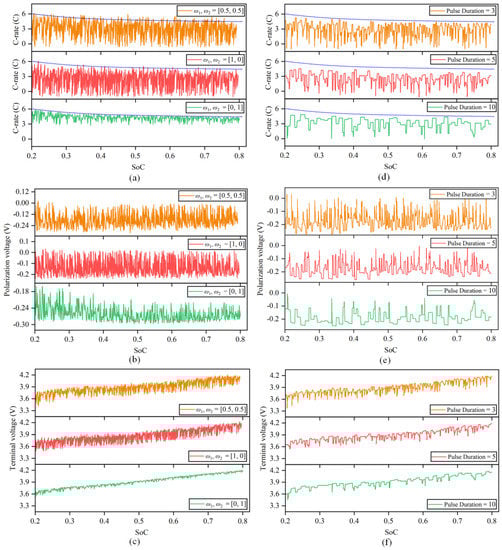
Figure 9.
Multiobjective optimization results of the fast charging strategy. (a) Optimization charging current of different weight coefficients. (b) Optimization polarization voltage of different weight coefficients. (c) Optimization terminal voltage of different weight coefficients. (d) Optimization charging current with different pulse widths. (e) Optimization polarization voltage with different pulse widths. (f) Optimization terminal voltage with different pulse widths.
- (1)
- . The optimization result of this problem is the optimal control strategy considering only irreversible heat.
- (2)
- . The optimization result of this problem is the optimal control strategy considering only charging time.
- (3)
- . This indicates that irreversible heat and charging time are considered equally important in the optimization process.
The results show that at that time, , the charging time is 1195 s, and the irreversible heat is 763.46 J. At that time, , the charging time was 514 s, and the irreversible heat was 1133.88 J. It can be seen from the analysis in Section 2 that optimizing the irreversible heat is carried out essentially to optimize the polarization voltage and charging current. Therefore, the purpose of the optimization strategy is to increase the amplitude and number of discharge current pulse as much as possible to control the change in the overall polarization voltage, and the corresponding cost is a longer charging time. However, when optimizing the charging time, the opposite strategy tends to be chosen; let the amplitude of the charge current pulse follow the charging safety boundary as much as possible and try to reduce or even remove the discharge current pulse, which will lead to an increase in the polarization voltage and the total irreversible heat every second.
Since the weight coefficients and represent the importance of different objectives in the optimization process, the values of different objective functions are also different under different weight values, which reflects the performance of irreversible heat and charging time under different optimization preferences. When the weight coefficients are equal, the optimized irreversible heat and charging time are equally important. In this case, the charging time obtained by the calculation is shortened by 53.15% compared with that under 1 C constant-current charging, and the irreversible heat is reduced by 34.11% compared with the heat production following the safety boundary.
5.2. Influence of Pulse Width on Strategy Optimization
The previous section’s billing policy proposal is modified in 1 s. However, in reality, the pulse current width is typically not only one second, and varying pulse widths will have an impact on how quickly lithium dendrites grow in the battery’s negative electrode during charging [25].
This section is based on the collocation of the weight coefficient , taking pulse widths of 3 s, 5 s and 10 s to solve the genetic algorithm to explore the influence of different pulse widths on strategy optimization. The optimization results are shown in Figure 9d–f.
It can be seen from the optimization results that when the pulse width is 3 s, the optimization strategy tends to let the charge current pulse follow the safety boundary while increasing the number of discharge current pulses. The optimization strategy tends to reduce or even remove the discharge current pulse when the pulse width increases while keeping the charge current pulse amplitude near 3 C as much as possible. The reason is that when the pulse width increases, the number of times the high-magnification current exceeds the safety boundary increases, so the penalty term increases, and finally, the fraction decreases. The charging time still shows a downward trend as the number of discharge current pulses decreases, although the amplitude of charge current pulse also decreases.
In addition, the two widely used multiobjective optimization algorithms ABC [38] and TSA [39] were also compared to the suggested model, and the results of the multiobjective optimization results for the rapid charging strategy are presented in Figure 10a–d. The figure shows that the method suggested in this study has a significant advantage over ABC and TSA in terms of reducing irreversible heat and cutting down on charging time. Table 6 and Table 7 display the optimization indicators for various techniques, and it is demonstrated by the indicators that the strategy suggested in this article has a good optimization impact. The charging time of different pulse widths was reduced by 54.17%, 55.74%, 57.17%, 58.84% and 60.65%, respectively, compared with that under 1 C constant-current charging. The heat production of irreversible heat was reduced by 35.84%, 37.94%, 40.28%, 36.07% and 33.15%, respectively, compared with that when following safety boundary charging. When the pulse width is 5 s, both the charging time and irreversible heat can be well balanced. In addition, the optimal strategy calculated by increasing the pulse width is better than the solution calculated by increasing the pulse width to 1 in terms of charging time and irreversible heat, indicating that it is easier to find the optimal strategy by increasing the pulse width appropriately.
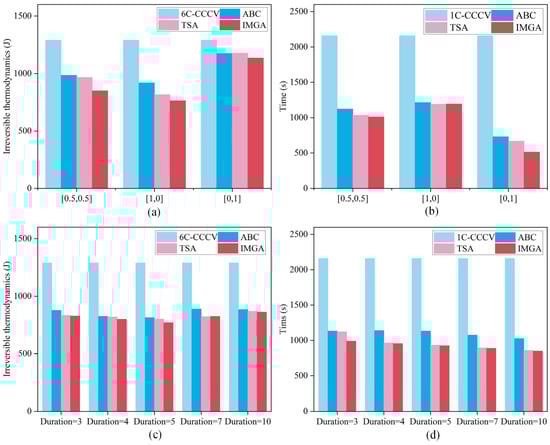
Figure 10.
Optimization results with different pulse widths. (a) The charging time of different objective optimizations. (b) Charging times for different pulse widths. (c) The irreversible heat of different objective optimizations. (d) The irreversible heat of different pulse widths.
Table 6.
Comparison of irreversible heat using different methods.
Table 7.
Comparison of charging time using different methods.
6. Experimental Results and Discussion
6.1. Security Boundary Verification and Analysis
A ex situ detection method can be used to judge whether or not there is lithium deposition in the battery by disassembling the battery and observing the existence of lithium dendrites in the negative electrode of the battery [40]. To verify and analyze the charging safety boundary proposed in the research, this section sets up comparative test groups with different cycle conditions inside and outside the safety boundary to disassemble the battery and observe the lithium precipitation of the negative electrode.
Six new batteries with similar performance in the same batch were selected, numbered and divided into two groups. One group (including B01, B03 and B05 batteries) was tested in a constant temperature box of 25 °C, and the other group (including B02, B04 and B06 batteries) was tested in a constant temperature box of 5 °C. Since the battery fast charging strategy studied in this chapter mainly focuses on the interval from SoC 20% to 80%, only the charging safety boundary corresponding to this section of SoC is verified to improve the accuracy.
B01 and B03 were charged according to charging conditions 1 and 2, as shown in Figure 11a, and B02 and B04 were charged according to charging conditions 1 and 2, as shown in Figure 11b. Meanwhile, B05 and B06 were charged for 6 min at a constant current of a 6 C rate. Then, the battery was kept in the shelved state for 30 min to allow the concentration polarization to recover. All six batteries were charged from SoC 20% to 80%. Charging condition 1 in Figure 10 was set to decrease to 95% of the current maximum current when the current reached 98% of the current charging safety boundary, while charging condition 2 was set to decrease to 97% of the current maximum current when the current reached 102% of the current charging safety boundary.
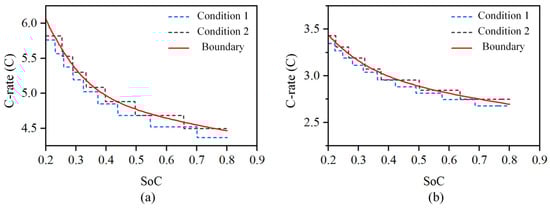
Figure 11.
Charging safety boundary verification conditions of LIBs at different temperatures. (a) Charging condition of 25 °C temperature. (b) Charging condition of 5 °C temperature.
Figure 12a–f shows the disassembly result. The results show that dendrites were not observed on the B01 and B02 cathode surfaces (including battery electrolyte on the surface of still volatile). The B03 and B04 battery cathode surface edges showed slightly gray lithium dendrite formation due to the high current density in these areas. The B05 and B06 cathode surface edges and the gray color in the middle of the dendrite were more obvious. These results indicate that more lithium dendrites will be precipitated by charging at high rates. The disassembly results confirm that the charging safety boundary at different temperatures obtained in Section 3.3 is accurate, which can be used for research on fast charging strategies.
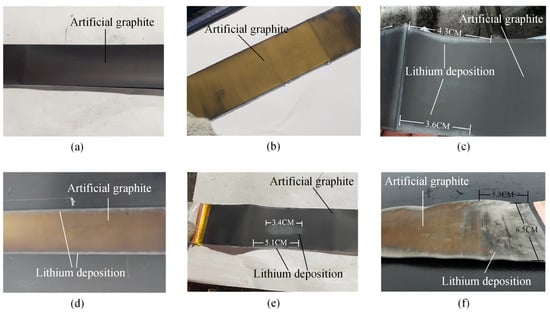
Figure 12.
Physical images of the negative electrode surface of LIBs. (a) B01. (b) B02. (c) B03. (d) B04. (e) B05. (f) B06.
6.2. Analysis of the Optimization Results of the Fast Charging Strategy
To verify that the proposed fast charging strategy based on capacity decay for charging safety boundary correction can slow down battery capacity decay, a capacity decay verification experiment is designed in this section. In this section, another 15 batteries from the same batch are selected and divided into five groups, with 3 batteries in each group. Comparative degradation experiments were conducted under different charging strategies in a 25 °C incubator. The charging strategy validation scheme used in this section is shown in Figure 13.
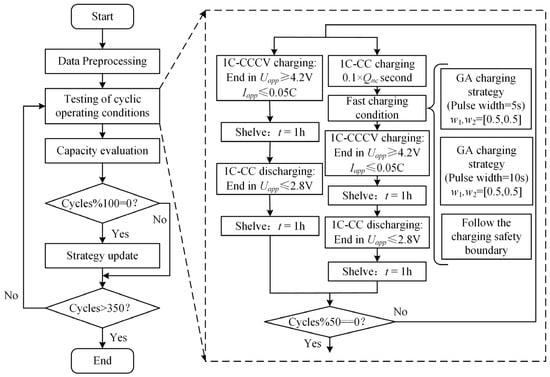
Figure 13.
Charging strategy verification scheme.
The following conclusions can be drawn from the experiment of the charging safety boundary. High-rate charging at a low temperature will aggravate lithium precipitation. There was only a small amount of analytical lithium on the negative electrode surface of the B05 battery, while a large area of lithium was decomposed on the negative electrode surface of the B06 battery, indicating that when the ambient temperature is low, the rapid charging of LIBs will lead to more lithium precipitation. To ensure the safety of the battery, this paper only studied the fast charging strategy of LIBs at room temperature. Five comparative experiments were designed as follows:
- Test 1: the pulse condition calculated by the GA is , and the pulse width is set to 5 s.
- Test 2: the pulse condition calculated by the GA is , and the pulse width is set to 10 s.
- Test 3: charge without a discharge current pulse and follow the current curve of the charging safety boundary (as shown in Figure 10a condition 1).
- Test 4: charge without a discharge current pulse and follow the current curve of the charging safety boundary (as shown in Figure 10a condition 2).
- Test 5: charge at a constant current and constant voltage at a 1 C rate to the cutoff voltage of 4.2 V and cutoff current of 0.05 C, stop charging, leave for one hour, and then discharge at a 1 C rate to 2.8.
Table 8 shows the time of 20–80% SoC for different charging strategies in different cycles. Due to the high current ratio in the fast charging process, the battery temperature easily increases, which affects the capacity decay. Therefore, a thermal management system should be used to control the battery temperature. After 350 cycles, the working condition test was stopped. The capacity attenuations of 15 batteries based on different charging strategies are shown in Figure 14, and the specific changes are shown in Table 9.
Table 8.
Comparison of the time spent in the fast charging stage under different working conditions.
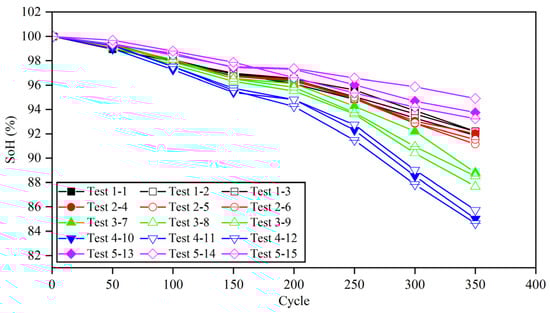
Figure 14.
Capacity depreciation curve of lithium batteries under various cycle conditions.
Table 9.
Comparison of LIB capacity attenuation under different cycle conditions.
When the pulse width is set to give, the battery capacity decay after 350 cycles is only 1~3% less than that at 1 C, and the average time of each fast charging phase can be shortened by 54.17%. After 350 cycles, the capacity of the battery that follows the safety boundary but does not update decreased to 84.64%, which proves that the lithium precipitation phenomenon of the battery deepened in the second half of the cycle, leading to the accelerated decline in the capacity. Compared with the battery without updating the boundary, the capacity of the battery following the safety boundary and updating the boundary was still less than 90%, although the capacity decay rate was slower. In addition, compared with the battery with a pulse width set to 5, the capacity of the battery with a pulse width set to 10 was decreased, which proves that the polarization voltage also has a certain effect on the capacity decay.
7. Conclusions
The safe and efficient rapid charging method can not only reduce the charging time and ensure the battery’s safety, but it can also delay the capacity loss of the battery. The objective of this study is to improve battery life and safety during high-rate fast charging by formulating and revising high-rate safe and fast charging strategies.
The research develops an electrochemical simulation model to determine the negative electrode’s potential and charging safety limit of batteries at different temperatures. On the basis of the boundary, an enhanced genetic algorithm is utilized to optimize the solution, with the shortest charging time and the reduction in irreversible heat serving as the optimization objectives for generating the charging strategy via an interpolation mutation operation. The verification results demonstrate that the model is highly accurate, with the maximum simulation error at 5 °C being 46 mV, the voltage prediction error at 10 °C above ambient temperature and different charge–discharge ratios being less than 35 mV, and the determination coefficient R2 exceeding 0.99. In comparison to the 1 C current charging effect, the rapid charging strategy can reduce charging time by 57.17%, and irreversible heat by 40.28% when the pulse width is set to 5 s.
However, due to the battery’s prolonged testing cycle, this research is limited to using experimental data, and the battery’s ohmic internal resistance at SoC = 50% is used as the parameter identification value. In subsequent research, the variation trend of the ohmic internal resistance at distinct temperatures (SoC and SoH) during the charging and discharging processes will be investigated in greater depth. The ohmic internal resistance under various operating conditions will be determined based on the charging and discharging stages, environmental temperature, and SoC, and then incorporated into the model to enhance model accuracy. Secondly, fast charging strategy optimization and capacity attenuation verification are presently only conducted for room-temperature scenarios, but future verification can be conducted for other temperatures.
Author Contributions
H.W.: Methodology, Validation, Writing—original draft. J.L.: Investigation, Visualization. S.L.: Investigation, Visualization. Y.F.: Conceptualization, Validation, Funding acquisition. X.T.: Investigation, Visualization, Writing—review and editing, Funding acquisition. All authors have read and agreed to the published version of the manuscript.
Funding
This work was supported by the Key-Area Research and Development Program of Guangdong Province, China (2020B0909040004, 2020B090920002).
Data Availability Statement
The relevant experiments of this study are still in progress. If you need our data for relevant research, you can contact the corresponding author of this article.
Conflicts of Interest
The authors declare that they have no known competing financial interest or personal relationships that may appear to influence the work reported in this paper.
Appendix A
Table A1.
The value of , , , and at different temperatures.
Table A1.
The value of , , , and at different temperatures.
| 5 °C | 10 °C | 15 °C | 20 °C | 25 °C | 30 °C | 35 °C | 40 °C | |
|---|---|---|---|---|---|---|---|---|
| 0.35287 | 0.34912 | 0.34266 | 0.34177 | 0.34025 | 0.33967 | 0.33854 | 0.33848 | |
| 0.66531 | 0.66528 | 0.66533 | 0.66532 | 0.66526 | 0.66529 | 0.66530 | 0.66531 | |
| 0.62642 | 0.62554 | 0.62042 | 0.61766 | 0.61522 | 0.61391 | 0.61308 | 0.61316 | |
| 0.34563 | 0.34558 | 0.34558 | 0.34559 | 0.34557 | 0.34562 | 0.34560 | 0.34562 |
Table A2.
The value of at different temperatures.
Table A2.
The value of at different temperatures.
| 5 °C | 10 °C | 15 °C | 20 °C | 25 °C | 30 °C | 35 °C | 40 °C | |
|---|---|---|---|---|---|---|---|---|
| 1.0 C | 69,811.83 | 65,044.09 | 57,961.85 | 56,204.24 | 46,003.02 | 21,149.47 | 19,430.57 | 16,480.75 |
| 1.5 C | 63,880.09 | 57,735.86 | 53,864.53 | 52,561.18 | 45,972.17 | 20,483.91 | 20,039.38 | 15,959.71 |
| 2.0 C | 59,287.06 | 52,215.78 | 46,677.22 | 47,323.27 | 42,086.34 | 19,758.37 | 19,500.98 | 15,840.76 |
| 2.5 C | 53,674.78 | 46,518.76 | 36,141.48 | 36,366.69 | 36,979.29 | 19,511.72 | 19,317.79 | 15,552.09 |
| 3.0 C | 47,645.15 | 40,982.44 | 33,701.11 | 35,856.59 | 32,625.16 | 18,875.99 | 18,761.77 | 15,131.95 |
| 3.5 C | 42,959.35 | 35,021.68 | 28,344.13 | 27,727.01 | 26,052.27 | 18,375.31 | 17,813.85 | 14,623.37 |
| 4.0 C | 36,673.05 | 28,711.71 | 21,531.05 | 20,250.15 | 20,374.16 | 18,264.81 | 17,759.82 | 14,333.51 |
Table A3.
The value of at different temperatures.
Table A3.
The value of at different temperatures.
| 5 °C | 10 °C | 15 °C | 20 °C | 25 °C | 30 °C | 35 °C | 40 °C | |
|---|---|---|---|---|---|---|---|---|
| 1.0 C | 251.26 | 221.26 | 215.83 | 205.67 | 188.54 | 138.87 | 101.61 | 89.97 |
| 1.5 C | 239.07 | 209.07 | 202.37 | 182.94 | 175.46 | 127.18 | 96.18 | 87.12 |
| 2.0 C | 222.97 | 192.97 | 187.73 | 170.14 | 163.13 | 121.09 | 93.31 | 86.91 |
| 2.5 C | 216.31 | 176.31 | 170.16 | 159.25 | 150.24 | 115.08 | 92.61 | 83.41 |
| 3.0 C | 207.68 | 163.68 | 154.06 | 147.71 | 138.63 | 104.28 | 90.29 | 82.89 |
| 3.5 C | 190.12 | 153.12 | 141.61 | 134.39 | 125.75 | 97.95 | 88.19 | 80.83 |
| 4.0 C | 175.03 | 145.04 | 128.02 | 123.83 | 112.56 | 93.78 | 87.59 | 79.72 |
Table A4.
The value of at different temperatures.
Table A4.
The value of at different temperatures.
| 5 °C | 10 °C | 15 °C | 20 °C | 25 °C | 30 °C | 35 °C | 40 °C | |
|---|---|---|---|---|---|---|---|---|
| 1.0 C | 107.66 | 69.83 | 63.21 | 51.81 | 44.42 | 31.59 | 22.61 | 20.17 |
| 1.5 C | 96.95 | 68.33 | 60.95 | 50.35 | 42.66 | 32.20 | 26.53 | 24.18 |
| 2.0 C | 93.81 | 67.35 | 57.59 | 48.38 | 40.56 | 30.10 | 25.92 | 22.52 |
| 2.5 C | 88.09 | 65.22 | 54.16 | 47.97 | 37.43 | 29.51 | 22.53 | 21.14 |
| 3.0 C | 84.44 | 63.41 | 52.87 | 45.59 | 34.37 | 28.52 | 21.99 | 19.36 |
| 3.5 C | 76.49 | 61.02 | 50.71 | 44.77 | 32.28 | 27.67 | 21.11 | 18.51 |
| 4.0 C | 70.91 | 60.83 | 47.97 | 42.54 | 30.64 | 24.41 | 19.95 | 16.05 |
Table A5.
The value of at different temperatures.
Table A5.
The value of at different temperatures.
| 5 °C | 10 °C | 15 °C | 20 °C | 25 °C | 30 °C | 35 °C | 40 °C | |
|---|---|---|---|---|---|---|---|---|
| 1.0 C | 187.14 | 173.34 | 166.18 | 148.05 | 142.28 | 126.52 | 107.18 | 80.51 |
| 1.5 C | 172.08 | 163.01 | 157.42 | 144.99 | 140.31 | 121.01 | 103.66 | 77.45 |
| 2.0 C | 168.90 | 159.83 | 152.63 | 141.52 | 134.88 | 114.29 | 98.82 | 75.77 |
| 2.5 C | 154.19 | 149.82 | 143.92 | 137.18 | 131.66 | 107.57 | 96.96 | 74.83 |
| 3.0 C | 144.26 | 140.50 | 135.72 | 128.93 | 126.84 | 100.36 | 93.90 | 72.91 |
| 3.5 C | 121.83 | 120.35 | 117.92 | 114.27 | 107.83 | 93.67 | 85.79 | 71.89 |
| 4.0 C | 112.91 | 110.63 | 107.77 | 104.44 | 100.47 | 82.46 | 80.48 | 70.45 |
Table A6.
The value of at different temperatures.
Table A6.
The value of at different temperatures.
| 5 °C | 10 °C | 15 °C | 20 °C | 25 °C | 30 °C | 35 °C | 40 °C | |
|---|---|---|---|---|---|---|---|---|
| 1.0 C | 184.99 | 170.41 | 158.87 | 136.09 | 102.33 | 98.99 | 84.99 | 70.41 |
| 1.5 C | 172.74 | 166.84 | 149.66 | 135.90 | 98.31 | 93.13 | 81.13 | 66.84 |
| 2.0 C | 160.20 | 154.52 | 140.70 | 124.39 | 95.22 | 88.79 | 78.79 | 62.52 |
| 2.5 C | 157.93 | 150.65 | 132.46 | 115.31 | 93.71 | 86.86 | 76.86 | 59.65 |
| 3.0 C | 141.55 | 137.75 | 124.54 | 112.67 | 92.24 | 84.21 | 75.21 | 57.75 |
| 3.5 C | 130.58 | 121.22 | 116.09 | 107.13 | 89.24 | 80.03 | 73.03 | 54.22 |
| 4.0 C | 121.47 | 110.88 | 106.72 | 103.30 | 85.31 | 76.97 | 68.97 | 50.88 |
References
- Cheng, K.W.E.; Divakar, B.P.; Wu, H.; Ding, K.; Ho, H.F. Battery-Management System (BMS) and SOC Development for Electrical Vehicles. IEEE Trans. Veh. Technol. 2011, 60, 76–88. [Google Scholar] [CrossRef]
- Rahimi-Eichi, H.; Ojha, U.; Baronti, F.; Chow, M.Y. Battery Management System: An Overview of Its Application in the Smart Grid and Electric Vehicles. IEEE Ind. Electron. Mag. 2013, 7, 4–16. [Google Scholar] [CrossRef]
- Lawder, M.T.; Suthar, B.; Northrop, P.W.; De, S.; Hoff, C.M.; Leitermann, O.; Subramanian, V.R. Battery Energy Storage System (BESS) and Battery Management System (BMS) for Grid-Scale Applications. Proc. IEEE 2014, 102, 1014–1030. [Google Scholar] [CrossRef]
- Tan, X.; Zhan, D.; Lyu, P.; Rao, J.; Fan, Y. Online state-of-health estimation of lithium-ion battery based on dynamic parameter identification at multi timescale and support vector regression. J. Power Sources 2021, 484, 229233. [Google Scholar] [CrossRef]
- Zhang, J.; Xia, C. State-of-charge estimation of valve regulated lead acid battery based on multi-state Unscented Kalman Filter. Int. J. Electr. Power Energy Syst. 2011, 33, 472–476. [Google Scholar] [CrossRef]
- Xiong, R.; Sun, W.; Yu, Q.; Sun, F. Research progress, challenges and prospects of fault diagnosis on battery system of electric vehicles. Appl. Energy 2020, 279, 115855. [Google Scholar] [CrossRef]
- Li, Y.; Li, K.; Xie, Y.; Liu, J.; Fu, C.; Liu, B. Optimized charging of lithium-ion battery for electric vehicles: Adaptive multistage constant current–constant voltage charging strategy. Renew. Energy 2020, 146, 2688–2699. [Google Scholar] [CrossRef]
- Lee, C.H.; Chen, M.Y.; Hsu, S.H.; Jiang, J.A. Implementation of an SOC-based four-stage constant current charger for Li-ion batteries. J. Energy Storage 2018, 18, 528–537. [Google Scholar] [CrossRef]
- Khan, A.B.; Choi, W. Optimal Charge Pattern for the High-Performance Multistage Constant Current Charge Method for the Li-Ion Batteries. IEEE Trans. Energy Convers. 2018, 33, 1132–1140. [Google Scholar] [CrossRef]
- Khan, A.B.; Pham, V.L.; Nguyen, T.T.; Choi, W. Multistage constant-current charging method for Li-Ion batteries. In Proceedings of the 2016 IEEE Transportation Electrification Conference and Expo, Asia-Pacific (ITEC Asia-Pacific), Busan, Republic of Korea, 1–4 June 2016; pp. 381–385. [Google Scholar] [CrossRef]
- Shen, W.; Vo, T.T.; Kapoor, A. Charging algorithms of lithium-ion batteries: An overview. In Proceeding of the 2012 7th IEEE Conference on Industrial Electronics and Applications (ICIEA), Singapore, 18–20 July 2012; pp. 1567–1572. [Google Scholar] [CrossRef]
- Wongsathan, R.; Nuangnit, A.; Seedadan, I. Optimal Intelligent Controllers for Multi-Stage CCCV Charging of Solar PV Battery Charger System. In Proceedings of the 2018 International Conference on Computing, Power and Communication Technologies (GUCON), Greater Noida, India, 28–29 September 2018; pp. 105–110. [Google Scholar] [CrossRef]
- Lee, Y.; Jeghan, S.M.N.; Lee, G. Boost charging lithium-ion battery using expanded graphite anode with enhanced performance. Mater. Lett. 2021, 299, 130077. [Google Scholar] [CrossRef]
- Lee, J.H.; Moon, J.S.; Lee, Y.S.; Kim, Y.R.; Won, C.Y. Fast charging technique for EV battery charger using three-phase AC-DC boost converter. In Proceedings of the IECON 2011—37th Annual Conference of the IEEE Industrial Electronics Society, Melbourne, VIC, Australia, 7–10 November 2011; pp. 4577–4582. [Google Scholar] [CrossRef]
- Tran, V.-L.; Tran, N.-T.; Yu, S.-H.; Park, Y.; Choi, W. Design of a Nonisolated Fuel Cell Boost Charger for Lithium Polymer Batteries with a Low Output Ripple. IEEE Trans. Energy Convers. 2015, 30, 605–614. [Google Scholar] [CrossRef]
- Gao, Z.; Lin, Z.; LaClair, T.J.; Liu, C.; Li, J.-M.; Birky, A.K.; Ward, J. Battery capacity and recharging needs for electric buses in city transit service. Energy 2017, 122, 588–600. [Google Scholar] [CrossRef]
- Li, C.; Cui, N.; Wang, C.; Zhang, C. Reduced-order electrochemical model for lithium-ion battery with domain decomposition and polynomial approximation methods. Energy 2021, 221, 119662. [Google Scholar] [CrossRef]
- Han, X.; Ouyang, M.; Lu, L.; Li, J. Simplification of physics-based electrochemical model for lithium ion battery on electric vehicle. Part I: Diffusion simplification and single particle model. J. Power Sources 2015, 278, 802–813. [Google Scholar] [CrossRef]
- Drees, R.; Lienesch, F.; Kurrat, M. Fast charging lithium-ion battery formation based on simulations with an electrode equivalent circuit model. J. Energy Storage 2021, 36, 102345. [Google Scholar] [CrossRef]
- Chu, Z.; Feng, X.; Lu, L.; Li, J.; Han, X.; Ouyang, M. Non-destructive fast charging algorithm of lithium-ion batteries based on the control-oriented electrochemical model. Appl. Energy 2017, 204, 1240–1250. [Google Scholar] [CrossRef]
- Yin, Y.; Hu, Y.; Choe, S.Y.; Cho, H.; Joe, W.T. New fast charging method of lithium-ion batteries based on a reduced order electrochemical model considering side reaction. J. Power Sources 2019, 423, 367–379. [Google Scholar] [CrossRef]
- Zhang, C.; Jiang, J.; Gao, Y.; Zhang, W.; Liu, Q.; Hu, X. Charging optimization in lithium-ion batteries based on temperature rise and charge time. Appl. Energy 2017, 194, 569–577. [Google Scholar] [CrossRef]
- Xu, M.; Wang, R.; Zhao, P.; Wang, X. Fast charging optimization for lithium-ion batteries based on dynamic programming algorithm and electrochemical-thermal-capacity fade coupled model. J. Power Sources 2019, 438, 227015. [Google Scholar] [CrossRef]
- Xiong, R.; Wang, J.; Shen, W.; Tian, J.; Mu, H. Co-Estimation of State of Charge and Capacity for Lithium-Ion Batteries with Multi-Stage Model Fusion Method. Engineering 2021, 7, 1469–1482. [Google Scholar] [CrossRef]
- Li, Q.; Tan, S.; Li, L.; Lu, Y.; He, Y. Understanding the molecular mechanism of pulse current charging for stable lithium-metal batteries. Sci. Adv. 2017, 3, e1701246. [Google Scholar] [CrossRef]
- Goetz, S.M.; Peterchev, A.V.; Weyh, T. Modular Multilevel Converter with Series and Parallel Module Connectivity: Topology and Control. IEEE Trans. Power Electron. 2015, 30, 203–215. [Google Scholar] [CrossRef]
- Paz-Solís, J.; Thomson, S.; Jain, R.; Chen, L.; Huertas, I.; Doan, Q. Exploration of High- and Low-Frequency Options for Subperception Spinal Cord Stimulation Using Neural Dosing Parameter Relationships: The HALO Study. Neuromodulation Technol. Neural Interface 2022, 25, 94–102. [Google Scholar] [CrossRef] [PubMed]
- Zhang, L.; Gao, T.; Cai, G.; Hai, K.L. Research on electric vehicle charging safety warning model based on back propagation neural network optimized by improved gray wolf algorithm. J. Energy Storage 2022, 49, 104092. [Google Scholar] [CrossRef]
- Wassiliadis, N.; Schneider, J.; Frank, A.; Wildfeuer, L.; Lin, X.; Jossen, A.; Lienkamp, M. Review of fast charging strategies for lithium-ion battery systems and their applicability for battery electric vehicles. J. Energy Storage 2021, 44, 103306. [Google Scholar] [CrossRef]
- Li, J.; Wang, L.; Lyu, C.; Wang, H.; Liu, X. New method for parameter estimation of an electrochemical-thermal coupling model for LiCoO2 battery. J. Power Sources 2016, 307, 220–230. [Google Scholar] [CrossRef]
- Liu, S.; Chen, J.; Zhang, C.; Jin, L.; Yang, Q. Experimental study on lithium-ion cell characteristics at different discharge rates. J. Energy Storage 2022, 45, 103418. [Google Scholar] [CrossRef]
- Huang, Q.-A.; Shen, Y.; Huang, Y.; Zhang, L.; Zhang, J. Impedance Characteristics and Diagnoses of Automotive Lithium-Ion Batteries at 7.5% to 93.0% State of Charge. Electrochim. Acta 2016, 219, 751–765. [Google Scholar] [CrossRef]
- Zhang, S.S. The effect of the charging protocol on the cycle life of a Li-ion battery. J. Power Sources 2006, 161, 1385–1391. [Google Scholar] [CrossRef]
- Novák, P.; Joho, F.; Lanz, M.; Rykart, B.; Panitz, J.-C.; Alliata, D.; Kötz, R.; Haas, O. The complex electrochemistry of graphite electrodes in lithium-ion batteries. J. Power Sources 2001, 97, 39–46. [Google Scholar] [CrossRef]
- Tan, X.; Lyu, P.; Fan, Y.; Rao, J.; Ouyang, K. Numerical investigation of the direct liquid cooling of a fast-charging lithium-ion battery pack in hydrofluoroether. Appl. Therm. Eng. 2021, 196, 117279. [Google Scholar] [CrossRef]
- Vazquez-Arenas, J.; Gimenez, L.E.; Fowler, M.; Han, T.; Chen, S. A rapid estimation and sensitivity analysis of parameters describing the behavior of commercial Li-ion batteries including thermal analysis. Energy Convers. Manag. 2014, 87, 472–482. [Google Scholar] [CrossRef]
- Khaleghi Rahimian, S.; Rayman, S.; White, R.E. Extension of physics-based single particle model for higher charge–discharge rates. J. Power Sources 2013, 224, 180–194. [Google Scholar] [CrossRef]
- Akay, B.; Karaboga, D. A modified artificial bee colony algorithm for real-parameter optimization. Inf. Sci. 2012, 192, 120–142. [Google Scholar] [CrossRef]
- Chen, W.; Tan, X.; Cai, M. Parameter identification of equivalent circuit models for Li-ion batteries based on tree seeds algorithm. In IOP Conference Series: Earth and Environmental Science; IOP Publishing: Bristol, UK, 2017; p. 012024. [Google Scholar]
- Ge, H.; Aoki, T.; Ikeda, N.; Suga, S.; Isobe, T.; Li, Z.; Tabuchi, Y.; Zhang, J. Investigating Lithium Plating in Lithium-Ion Batteries at Low Temperatures Using Electrochemical Model with NMR Assisted Parameterization. J. Electrochem. Soc. 2017, 164, A1050–A1060. [Google Scholar] [CrossRef]


Disclaimer/Publisher’s Note: The statements, opinions and data contained in all publications are solely those of the individual author(s) and contributor(s) and not of MDPI and/or the editor(s). MDPI and/or the editor(s) disclaim responsibility for any injury to people or property resulting from any ideas, methods, instructions or products referred to in the content. |
© 2023 by the authors. Licensee MDPI, Basel, Switzerland. This article is an open access article distributed under the terms and conditions of the Creative Commons Attribution (CC BY) license (https://creativecommons.org/licenses/by/4.0/).