Article

Economic and Environmental Viability of Lithium-Ion Battery Recycling—Case Study in Two Canadian Regions with Different Energy Mixes

by
Giovanna Gonzales-Calienes
*,
Miyuru Kannangara
and
Farid Bensebaa
*
Energy, Mining and Environment Research Centre, National Research Council Canada, 1200 Montreal Road, Ottawa, ON K1A 0R6, Canada
*
Authors to whom correspondence should be addressed.
Batteries 2023, 9(7), 375; https://doi.org/10.3390/batteries9070375
Submission received: 9 May 2023 / Revised: 25 June 2023 / Accepted: 5 July 2023 / Published: 11 July 2023

Abstract

:
Lithium-ion battery (LIB) pack is the core component of electric vehicles (EVs). As the demand is continuously increasing, it puts a lot of strain on the battery raw material supply chains. Likewise, the large quantity of spent LIBs from different sources will add to the complexity of end-of-life (EoL) management. Battery recycling processing is a potential source of critical cathode precursor materials as an alternative to virgin raw material sourcing. Indeed, metal sulfates (nickel, cobalt, and manganese) and lithium carbonate could be recovered through EoL processing. This study aims to provide an economic and environmental life cycle sustainability assessment of recycled battery materials. This assessment is based on a bottom-up approach considering geographical boundaries and process data inputs. The two sources of critical cathode battery materials, virgin and recycled battery materials, are compared based on economic and environmental indicators. This study identified the province of Quebec in Canada as the geographical boundary where several battery processing plants have been recently announced. The best available recycling process (hydrometallurgy) was selected. For the virgin materials, this study considers the option of importing from other jurisdictions by using global average supply chain values. Furthermore, a comparison of alternative supply chain configurations was performed using a spatially differentiated approach. The main findings of this study are as follows: (i) the environmental credit of recycled cathode active materials (CAMs) is estimated as −6.46 kg CO2e/kg CAM, and (ii) the overall cost and environmental impacts of producing LIB cathode active material from recycled battery materials can be 48% and 54% lower than production from virgin materials, respectively, considering the upstream, midstream, and downstream stages of the CAM supply chain. The main drivers for the reduction in these financial costs and emissions are the local transportation and the hydrometallurgical process. The assessment results provide insights to support the development of appropriate policies and R&D solutions adapted to local considerations as well as offer additional possibilities to improve the design of sustainable supply chains for LIB recycling.

Graphical Abstract

1. Introduction

Lithium-ion batteries were commercialized more than 35 years ago [1] and were mostly used for consumer electronics. The production scale has significantly increased in the last decade due to the deployment of EVs. In the last couple of years, several LIB mega-factories have been announced throughout the world which could lead to two big and interrelated challenges in the future. Large amounts of LIB packs arriving at their EoL will be available for recycling with limited commercially viable solutions [2]. In the long term, this LIB demand could lead to significant negative environmental impacts. Furthermore, increased demand for LIBs is already putting a strain on the battery raw material supply chains and pressure on the market prices of these materials [2]. Even if there are numerous technologies and start-ups launched to address these challenges, current policies, R&D, and commercial solutions are moving at a slower pace [3,4]. These challenges are compounded by the multiplicity of battery technologies and battery material formulation [5,6,7,8]. Recent studies show that many efforts have been made to develop battery technologies to address LIB challenges. For instance, research on all-solid-state Li-metal battery technology shows that solid-state electrolytes enable high performance and high cycling stability of the LIB by replacing current organic-liquid-based electrolytes with polymer-based [9,10]. Organic batteries represent a promising technology that uses sustainable active materials such as redox-active polypeptides to reduce dependence on strategic metals [11,12]. However, these alternative battery technologies still face key challenges related to improvement, optimization, and design for EoL management that need further R&D [11]. International and national policies and regulations to address EoL LIB management are crucial to reduce the demand for further extraction of critical metals and foster a closed-loop system for EV LIBs [4]. We have recently published the potential of LIB recycling in Canada focusing on the upstream supply chain [13]. To support the development of appropriate policies and R&D solutions adapted to local settings, integrated economic and environmental sustainability assessments of alternative battery material supply chains should be developed. In particular, comparing virgin and recycled battery cathode materials is needed.
This study focuses on the economic and environmental impact assessments of recycling spent LIBs to address the current supply chain challenges. The objective of this paper is to perform an integrated techno-economic analysis (TEA) and life cycle assessment (LCA) of the upstream and downstream supply chains of the battery cathode active materials to produce LIB cells using virgin and recycled metal sulfates and lithium. To test this framework, we will consider the recycling of spent EV LIBs in the province of Quebec, Canada, where several battery production project announcements have been recently made [14].

1.1. LIB Recycling Market

The global lithium-ion battery recycling market is forecasted to increase from USD 4546 million in 2021 to USD 22,805 million by 2030, at a CAGR of 19.6% [15]. Market growth is driven by the increase in demand for electric vehicles resulting in high outputs of spent EV LIBs, the depletion of critical minerals, and strict government policies and regulations in North America, Europe, and Asia Pacific. However, safety issues and high capital and operating costs are important challenges to overcome [15]. Lithium, cobalt, and nickel are strategic critical minerals since both metals are the key constraining commodities for the EV transition [16]. Lithium prices peaked in 2022 with lithium battery grade spot prices, including lithium carbonate, falling down starting in early 2023. The decrease in lithium carbonate price is attributed to a 2000 mt oversupply, from a deficit of 15,000 mt in 2022 [17]. However, there is still a risk of a sustained deficit in the long term, due to supply constraints and the massive demand for lithium salts [17]. Benchmark Mineral Intelligence has forecasted a demand for lithium and nickel in the order of six and two times current supply levels, respectively, by 2035 [16]. With the potential long-term deficit of battery minerals, the development of the global LIB recycling industry is thus critical.
The EV sector in North America will account for 41% of the global market of LIB recycling by 2030 with a CAGR of 19.4% between 2021 and 2030. The EV LIB recycling market share by battery chemistry in North America by 2030 is forecasted to be 57%, 27%, 13%, 2%, and 1% for lithium-nickel manganese cobalt (Li-NMC), lithium-iron phosphate (LFP), lithium-manganese oxide (LMO), lithium-titanate oxide (LTO), and lithium-nickel cobalt aluminum oxide (NCA), respectively [15]. Li-NMC will remain the dominant EV LIB due to its high energy density, stability, and power density [15]. We will focus on this technology below.

1.2. Sustainability Indicators

Socio-economic and environmental viability is important for the long-term sustainability of the EV. Comparing the full sustainability of virgin and recycling battery material is beyond the scope of the current study. A complete sustainability assessment should include a dozen economic, environmental, and social indicators such as global warming potential, energy consumption, particulate matter formation, costs, employment, and human health, among others [18]. Instead, this study will be limited to the sustainability assessment based on two indicators: global warming potential expressed as greenhouse gas (GHG) emissions and financial cost. Table 1 presents a summary of recent peer-reviewed publications on the life cycle assessment of LIB recycling [19,20,21,22,23,24,25]. Fewer recent and detailed studies combining the environmental impact and cost analysis of battery recycling have been reported [20,24]. The Argonne National Laboratory (ANL) team has reported a detailed manufacturing cost analysis using the BatPac model and bottom-up approach [26]. Nguyen-Tien, Dai [27] provided an economic assessment of the UK EoL battery industry based on a customized EverBatt model. Baxter [28] developed a conceptual recycling flowsheet for the processing of black mass obtained from a mixed LIB feed stream into a mixed hydroxide precipitate (MHP) and battery-grade Li2CO3 (lithium carbonate). This study conducted a techno-economic assessment of NMC battery recycling based on process simulation. Most other studies [29,30] lacked the bottom-up approach similar to LCA-based GHG accounting. Furthermore, limited field input data, considered as commercial secrets, hinders quality assessment.

1.3. Gap in Current Sustainability Assessment of EV Battery Car—Critical Battery Material Supply Chain

Several studies on the life cycle assessment (LCA) of lithium-ion battery recycling have focused on discussing the state of the art of recycling process technologies such as pyrometallurgical, hydrometallurgical, and direct recycling and comparing the overall carbon emission reductions of these recycling methods at the battery pack and cell levels [19,20,21,22,23,25,31,32,33]. Some peer-reviewed articles have also discussed both the economic and environmental impacts of battery pack recycling [20,24,34,35]. However, all these cited references lacked a detailed and consistent bottom-up approach implemented along the supply chain of the recycled battery. Furthermore, Heath, Ravikumar [36] recommended moving research beyond recycling technology development to comprehensive and holistic research on the economic, environmental, and policy aspects of the circular economy strategies of LIB recycling.
Beyond the benchmarking of the current LIB recycling routes, the identification of critical hot spots to improve cost and carbon footprint impacts is critical. Our study aims at addressing two relevant gaps in the current sustainability assessment of LIBs. First, currently, there is no study comparing the two sources (recycling and mining of virgin materials) of EV LIB materials using bottom-up sustainability assessment considering local conditions and process data inputs. Second, a holistic sustainability approach considering the economic and environmental impacts of the full supply chain of recovered LIB cathode materials, i.e., from the transportation of spent batteries to the recovery of critical cathode materials, should investigate the effect of local geographical settings and the optimization of reverse logistics. For that purpose, this study provides a detailed, consistent, and integrated economic and environmental assessment that considers a bottom-up approach applied along the full supply value chain of battery materials for a single battery production plant within the same jurisdiction. To do this, first, it is necessary to identify the geographical boundary, the sources of critical battery materials, and the best available recycling process technology. While several battery recycling processes exist, the GHG emission impacts and economic scenarios of these processes vary and could change for each specific battery chemistry. Several studies investigate NMC LIB recycling using the hydrometallurgical process [8,20,37,38] as a viable recycling approach. Pyrometallurgical approaches have been also considered [39]. In this study, we will conduct process modeling and simulation of a hydrometallurgical solvent extraction process to provide transparent material and energy flow data.
Below, the system boundaries are described for both the virgin and recycled battery material. As mentioned above, this study will consider a practical case study within the province of Quebec in Canada. Several battery-manufacturing plants, battery recycling, and other related initiatives have been announced [14]. For the virgin materials, we will consider the option of importing from other Canadian provinces and countries.

1.4. System Boundary, Process Flow Diagram, and Geographical Setting

When defining the system boundary, three aspects are carefully considered and described. The first aspect is related to the process steps included in benchmarking recycled battery materials against virgin materials. To provide a complete sustainability assessment, upstream (battery collection and delivery to processing sites), midstream (battery recycling), and downstream (raw material processing) stages should be considered (Figure 1). The second aspect, related to the first one, is the geographical setting. The transportation of the battery may have a significant impact. Carbon intensity and the cost of electricity (and other energy sources) available for the upstream, midstream, and downstream stages is often a key decision factor for the choices for the geographical place of the recycling plants. The third and last aspect to be considered is to provide a fair comparison for both battery material sources, i.e., recycled battery materials and virgin materials. Therefore, it is necessary to choose the jurisdiction in which to conduct the proposed study. With multiple announcements for the battery production and recycling plants [14], the Canadian province of Quebec is used as the geographical boundary in this study. In our recent publication, we focused mostly on the upstream stages [13]. We will build on this work to complete the sustainability assessment, in particular, the aspect of critical battery material production.

2. Methodology

2.1. Bottom-Up Approach

Proposed bottom-up approach is adapted from the standardized methodology developed by our team in the context of CO2 conversion technologies [40]. This bottom-up methodology for battery recycling is summarized in Figure 2. First, the different material pathways are defined which include product system, system boundary, and technology description. Second, the upstream, midstream, and downstream stages including material supply chain are also described. In the last step, the cost and LCA are the three main steps developed to evaluate the cost and environmental impact of battery recycling. This approach integrates granular details of components, materials, and production process with scaled-up criteria from laboratory scale to industrial scale using process simulation. In the case of battery recycling, the methodology assesses the impact on the cathode active material component which represents around half of battery production cost [41] and more than 50% of battery-manufacturing GHG emissions [42].
To assess the cost and life cycle carbon footprint impacts of recycled battery materials, the system boundary should be carefully defined. First, the NMC technology group will be used. More specifically, the NMC 811 will be considered. Tables S3 and S4 in the Supplementary Information show the NMC 811 battery characterization and bill of materials, respectively. The cost and GHG impact of four LIB materials (Li, Ni, Mn, and Co) will be quantified and used as indicators. The system boundary of the recycling pathway is provided below. A cradle-to-gate LCA methodology will be used for GHG emission estimation. In this case, a lithium battery cell production facility is the gate. This approach will also be used for the cost analysis.

2.1.1. Recycled Battery Material System Boundary

Recovered materials from EV LIBs can be obtained from chemical extraction methods and direct recycling procedures. The chemical processes usually consider two major methods: pyrometallurgical and hydrometallurgical treatments. The battery pack recycling process includes two sub-processes: (a) mechanical separation through dismantling, sorting, and shredding and further recycling treatment of BOS battery components [32,43]; and (b) a generic pyrometallurgical recycling process followed by metal recovery through a hydrometallurgical process [32,34] based on these studies and the Product Environmental Footprint Category Rules (PEFCRs) on rechargeable batteries document [44]. Furthermore, hydrometallurgical treatments regularly require acid leaching of metals from black mass, which are then separated and recovered as metal salts by solvent extraction, precipitation, or electroextraction. An advantage of hydrometallurgy is its high rate of material recovery, but downsides include requirements for substantial amounts of hot water and reagents such as acids and solvents [45]. This could give rise to significant amounts of chemical wastes.
The system boundary approach is “grave-to-gate”. The EV LIB recycling system boundary comprises the three stages of the supply chain of cathode active materials (Figure 3). First, the upstream stage considers the collection of spent EV LIB packs and transportation to dismantling hubs to be sorted, dismantled, and separated for further use, and then black mass is transported to a recycling facility [5,13]. In the midstream, a recycling method is used to retrieve battery cathode active materials from the black mass. The downstream stage comprises the synthesis of the precursor cathode active materials (PCAM) (metal sulfates, lithium carbonate, lithium hydroxide) via co-precipitation and the production of the cathode active material, i.e., the NMC powder, Li0.8·Ni0.1·Co0.1·MnO2, via calcination [46]. The CAM is then sent to the battery cell manufacturing unit.

2.1.2. Virgin Material System Boundary

The system boundary of the cathode active material manufacturing from virgin battery materials from raw material extraction to CAM manufacturing was discussed broadly in the literature [1,25,33,34,47,48] and summarized and depicted in Figure 4. A major difference, not often reported in the literature, is the simplicity of the recycling pathways when compared to the multiple process flow diagrams in the case of virgin battery materials. Furthermore, recycled batteries have a higher concentration of critical minerals than mined materials.

3. Results

3.1. Cost Accounting Methodology of the Midstream

To assess the impact of the recycled battery material cost, a scoping-level techno-economic analysis (TEA) is conducted to evaluate the capital costs and operating costs incurred in an EV LIB recycling facility to recover critical cathode materials using conventional solvent extraction to produce high-purity (battery-grade) metal salts of nickel, cobalt, and manganese. Also, lithium carbonate is recovered.
The different steps required to complete a TEA of the recycled battery materials of LIBs in the midstream are described below.

3.1.1. Process Design Criteria

The process design criteria (PDC) used in this study are based on preliminary bench-scale test work performed at National Research Council Canada, literature data, and process conditions typically employed in similar process areas in conventional hydrometallurgical plants. Solvent extraction performance is estimated based on the expected properties of known extractants (i.e., Cyanex 272 and DEHPA). It should be noted that solvent extraction parameters frequently vary on a case-by-case basis, and thus test work is required to validate these inputs.
The PDC used in this study is used as the basis for a mass and energy balance model of the process plant, which was constructed using SysCAD simulation software [28]. Additionally, the PDC serves as a basis for the development of process block flow diagrams, overall process flowsheet description, plant/process area throughputs, key process chemistries, and process parameters (retention time, pH, temperature).
Black mass, consisting of mainly anode (graphite) and cathode (metal oxides) materials, was selected as the feed material for this study. LIB cathode materials comprise a significant fraction of the mass composition and the material value of an LIB cell [28,34]. The process plant is designed for a nominal capacity of two dry tons of black mass cake per hour. With 20 wt.% cake moisture, an annual capacity throughput of approximately 16,560 dry tons is achievable using a 95% operating factor. The feed elemental composition is based on the projected LIB battery mix for 2030 containing 38.6 wt.% C, 5.14 wt.% Co, 23.2 wt.% Ni, and 3.97 wt.% Li, with an allowance for minor impurities [28]. Based on the PDC employed, the overall metal recoveries for Ni, Co, Mn, and Li were calculated to be 92.4%, 92.3%, 30.1%, and 89.3%, respectively.
The estimated production, at 98 wt.% solids, of metal salts of manganese, cobalt, and nickel are 344 tpa (112 tpa Mn equivalent), 3749 tpa (786 tpa Co equivalent), and 15,766 tpa (3523 tpa Ni equivalent), respectively. The production of industrial-grade lithium carbonate is at 3120 dry tpa.

3.1.2. Process Flow Diagram

The LIB recycling plant uses a hydrometallurgical route to produce high-purity salts of manganese sulfate (MnSO4·H2O), cobalt sulfate (CoSO4·7H2O), and nickel sulfate (NiSO4·6H2O) products suitable for sale to battery cathode manufacturing. Conventional solvent extraction and evaporative crystallization steps were selected as a baseline. The process considers the following stages: a reductive acid leach, primary and secondary slurry neutralization steps, intermediate MHP, scavenger precipitation, manganese and magnesium removal, calcium carbonate precipitation, lithium carbonate precipitation, and sodium sulfate decahydrate (i.e., Glauber salt) crystallization. Further refinement is accomplished by MHP leaching, and sequential manganese, cobalt, and nickel solvent extraction and crystallization. Using this process, the intermediate MHP product could be upgraded into higher-value products and so re-introduced more directly into the battery supply chain. A reverse-osmosis step is required following Glauber salt removal to close the water balance. The overall process flow diagram (PFD) is presented in Figure 5.

3.1.3. Mass Balance

The mass balance is generated as a result of the implementation of the PFD in the SysCAD process simulation software. Table 2 provides the mass balance as an indicator of the process performance. The input and output streams indicate the flow amount of the input and output material flows through the system. Sulphuric acid, sodium carbonate, and lime represent all together 44% of total input materials; meanwhile, fresh water makeup and other consumables represent 42% and 14%, respectively. Metal sulfates and lithium carbonate, residues and material disposal, and Glauber salt account for 17%, 34%, and 49% of total output materials, respectively.

3.1.4. Capital Cost and Operating Cost

Based on the concept-level PDC specifications (Section 3.1.1) and equipment sizing for the main process units, mass and energy balance data are obtained from the process modeling. Mass and energy balance for the hydrometallurgical solvent extraction process plant is used to estimate the overall recovery of critical battery materials, production rates, product compositions, and the selection and sizing of the major mechanical equipment items. This mass and energy balance is also used to calculate the operating costs of major reagents and consumables, energy, and fresh water. Based on the mass and energy balance, major equipment items were sized, and an AACE Class 5 estimate was produced [50]. The capital and operating cost estimates will carry an anticipated accuracy of no better than +/−50%. The direct capital cost estimate is based on the sizing of major mechanical equipment and parametric factoring. In-house data [36] will be used to cost major mechanical equipment items and estimate operating costs. A list of the direct capital costs for the process plant by process area is presented in Table S1 in the Supplementary Information.
The total LIB recycling capital cost is presented in Table 3 and estimated at kCAD (thousand Canadian dollars), including direct, indirect, and contingency costs. The capital and operating costs of this TEA study were originally estimated in US dollars, which were converted to CAD using the exchange rate USD to CAD provided by the Bank of Canada daily exchange rates [51].
Total operating costs are shown in Table 4. Based on the mass balance in Table 2, the quantity of reagent materials can be estimated. These materials consist of sulphuric acid, sodium carbonate, lime, magnesia, sulphur dioxide, pellets of sodium hydroxide, and organic extractants and diluents. The prices of reagents are estimated using in-house and InfoMine data [49,52,53,54,55]. The fresh water cost was estimated using an average of industrial water use rates from Canadian municipalities [49]. Likewise, electricity cost was estimated using the average electricity rates from Canadian provinces. Labour costs were established considering 119 employees, considering a budget for management, administration, support services, and maintenance. Process waste streams are reductive acid leach residue, primary neutralization residue, manganese and magnesium precipitation residue, mixed hydroxide precipitation leaching residue, and Glauber salt. These washed solid residues containing mainly inert materials and small quantities of undissolved metals/metal oxides/metal hydroxides are trucked to a residue disposal facility (landfill).
Labour represents 20% of total operating costs due to the high labour rates in Canada and the relatively low production yield. As a group, the main reagents sulphuric acid, lime, sulphur dioxide, magnesia, and sodium carbonate account for 52% of the total operating cost; thus, an optimized consumption of reagents is needed to improve process economics. Sulphuric acid and sodium carbonate used during solvent extraction represent 20% and 19% of total operating costs, respectively.
A breakdown of the estimated operating costs is provided in Table S2 in the Supplementary Information.
All other potential operating costs associated with, but not limited to, marketing, royalties, corporate charges, taxes, depreciation and amortization, financing, legal, and cost incurred as a result of unforeseen circumstances (force majeure) are excluded.

3.1.5. Recycling Processing Cost

The overall recycling processing cost to operate a hydrometallurgical recycling facility is estimated by dividing the total recycled battery material production cost by the annual throughput of black mass. The total production cost is estimated as 96 MCAD/year, including an annual profit of 5% total capital cost and the annual black mass throughput of 16,560 tons per year. Therefore, the recycling processing cost is estimated as 5.8 CAD/kg of black mass (10.6 CAD/kg of CAM equivalent).

3.2. GHG Accounting Methodology of the Midstream

As the upstream stage methodology and calculation have been described in a recent publication [
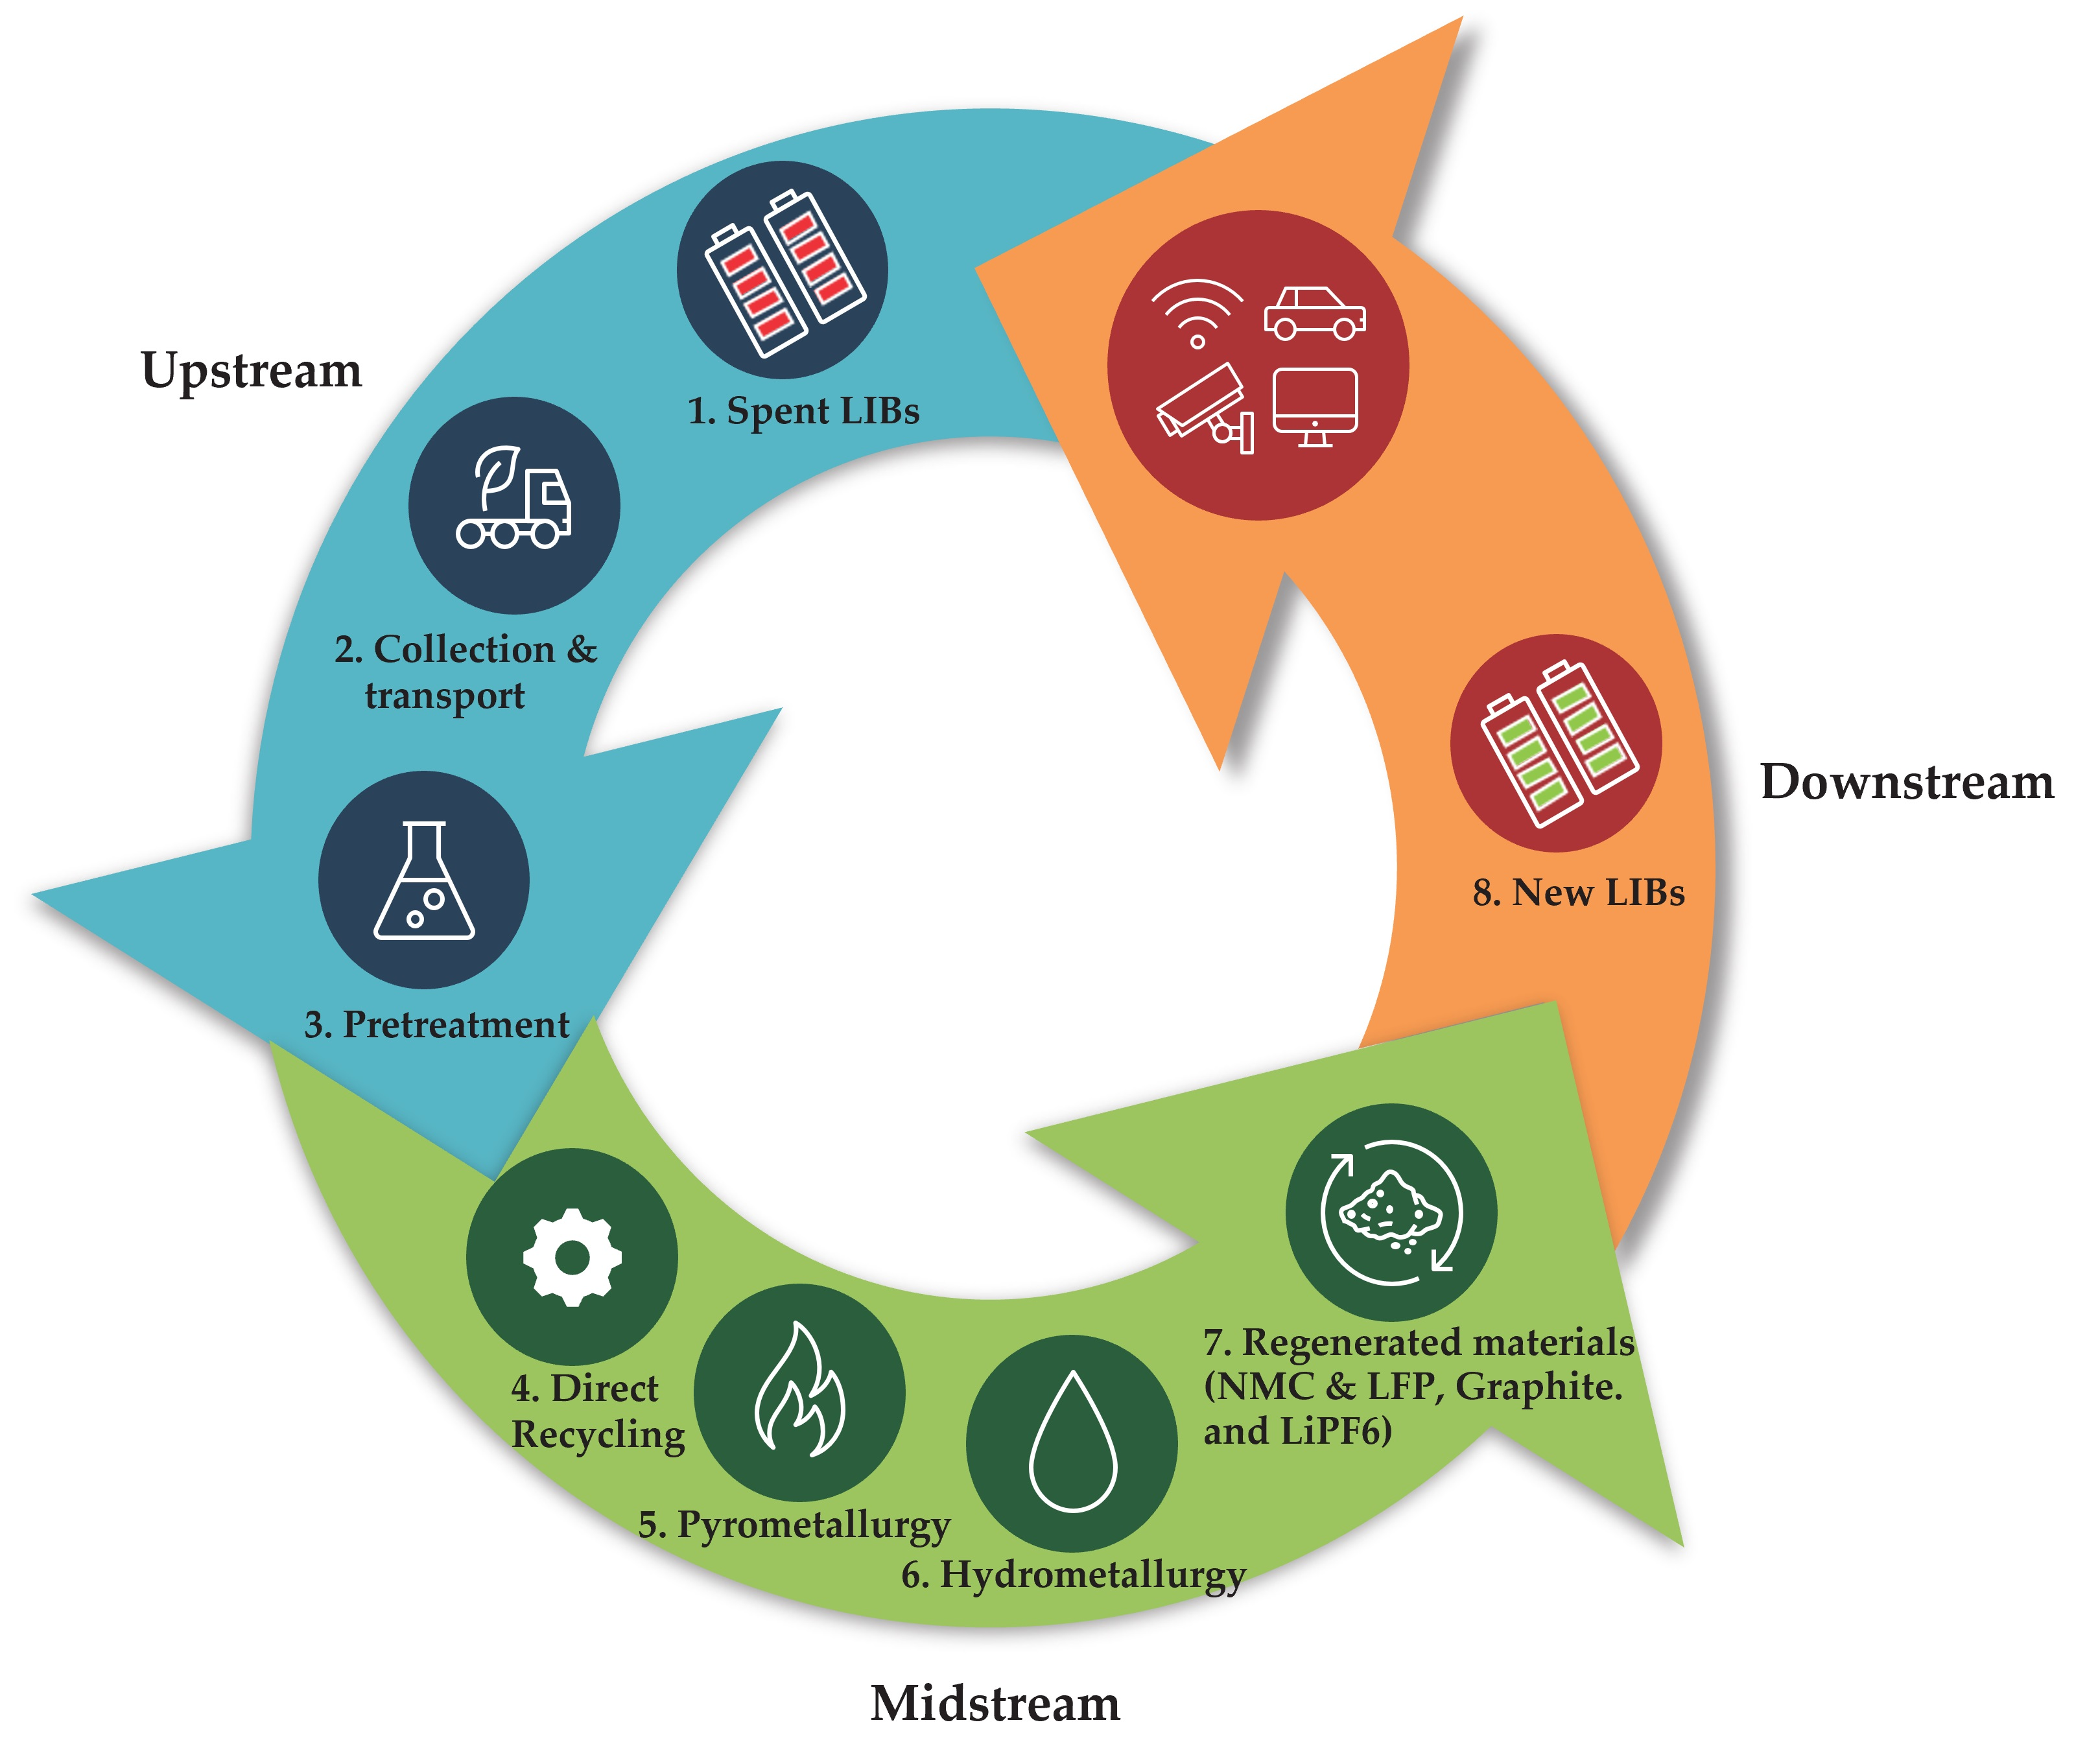
13], we will focus on the midstream (battery recycling) and downstream (material refining). As shown in Figure 2, GHG emission accounting is based on the life cycle assessment approach. According to ISO standards [56,57], the following methodological LCA components are evaluated in this study.

3.2.1. Definition of Functional Unit

The goal of this LCA study is to estimate the life cycle environmental impact, global warming potential, of the supply chain of recycled and recovered EV LIB CAMs from grave-to-gate and evaluate the potential environmental credits associated with the recovery of primary material from recycling processes. These recovered primary materials in the form of sulfates (NiSO4, CoSO4, MnSO4) are precursor inputs for LIB cathode production that could be part of a closed-loop recycling scheme where LIB raw materials can be recycled and reused. The recycled sulfates could be considered as avoided products in the life cycle inventory of the battery cell cathode production process.
According to ISO 14044 [56], the scope of a study is defined by the functional unit (FU) of the product system studied and the definition of the system boundary. In this LCA study, the product system considers the recycled cathode active material whose recovered materials come from a hydrometallurgical process of the black mass generated. This study considers two functional units: for the midstream stage, 1 kg of black mass and for the downstream processing and refining, 1 kg of EV LIB cathode active material.

3.2.2. Definition of System Boundary

The system boundary is described as a set of criteria to determine which unit processes are included or not in a product system [56]. The system boundary of this LCA study of the supply chain of the EV LIB cathode active material from recycled and recovered materials to CAM manufacturing is illustrated in Figure 3 in Section 2.1.1.

3.2.3. Building the Life Cycle Inventory (LCI)

In accordance with Recharge [44], the spent LIB pack is assumed to be dismantled and the main components separated to recover primary battery materials.
The life cycle inventory foreground system of the recovered LIB CAMs is developed with input and output materials and energy based on the mass balance resulted from the hydrometallurgical solvent extraction process simulation explained in Section 3.1.3. The background system LCI data are obtained from the Ecoinvent environmental database v. 3.9.1.
Detailed LCI datasets are developed for the midstream stage of the CAM supply chain, i.e., the hydrometallurgical process with solvent extraction to recover sulfates and lithium from 1 kg of black mass. For the downstream stage of recycled battery materials, LCI datasets of the production of the precursor CAM (mixed hydroxide precipitation) and the cathode active material manufacturing via calcination are also developed. Two geographical scenarios for Canada with different electricity production mixes are considered: first, the province of Quebec consisting mostly of hydroelectricity and, second, the province of Ontario with a mix of hydroelectricity, nuclear, and natural gas energy sources.
The LCI datasets and metadata are presented in Table S5 in the Supplementary Information. Datasets can be accessed online by using a free open-source tool called openLCA collaboration server, which supports import and export functions to download/upload the indicated datasets in JSON formats. The openLCA collaboration server is administered by the National Research Council Canada [58].
Related to the LCI for the battery CAM production from virgin materials, the input materials were modelled as 100% virgin materials, which means that no environmental credits were considered to arise from recycled material content. Potential benefits from recycled battery materials are credited in terms of “recycled content material” in primary input material to manufacture battery cathode active material.

3.2.4. Allocation Method

According to ISO 14044 [56], the input and output flows should be allocated to the different by-products based on established procedures. Global Battery Alliance and Nickel Institute have established the rules to apply for the allocation of metallic by-products. In the case of a base metal, which is a non-ferrous metal that is neither a precious nor noble metal, the following rule applies. If only base metals are produced as co-products, the best approach is mass allocation to define the environmental profile [59,60]. Then, NiSO4, CoSO4, MnSO4, and lithium compounds could be classified as base metals. In this LCA study, the mass allocation factor for nickel sulfate, cobalt sulfate, manganese sulfate, and lithium carbonate is 68.7%, 16.3%, 1.4%, and 13.5%, respectively.

3.2.5. End-of-Life Approach

There are two main approaches in LCA to model the end-of-life (EoL) stage for EV LIBs. The cut-off approach, also known as the “recycled content approach”, does not give credits for material recovery, although it allows the possibility for secondary material input (recycled content). The EoL recycling approach, also known as “avoided burden”, gives credits for material recovery for primary material input [45,59]. In this LCA study, the EoL approach is a hybrid closed-loop cut-off recycling model by including recycling content, as well as modelling the material recovery processes in the EoL stage, but without giving any credits for avoided burdens. An attributional system model is used as an accounting type of LCA. The cut-off point is set just after the use phase has been completed as indicated in Figure 6 showing the scope of the EoL modelling for spent lithium-ion batteries in a closed-loop approach. In this case, the spent batteries are burden-free.

3.2.6. Life Cycle Impact Assessment (LCIA)

This study conducted the LCIA by sorting the inventory materials in inputs and outputs according to the environmental selected impact category. The impact category selected in this study is the global warming potential (GWP) expressed in kg CO2e, and the selected impact assessment method is the ReCiPe 2016 v1.1 midpoint method using the hierarchic version [61]. The LCIA of the recycled battery CAMs was conducted using the open-source software openLCA version 1.11. The global warming potential impact of the hydrometallurgical recycling process located in Quebec (Canada) is estimated as 3.57 kgCO2e/kg black mass (6.54 kg CO2e/kg cathode active material). The GWP of the recycling process located in Ontario is 3.68 kg CO2e/kg black mass (6.74 kg CO2e/kg cathode active material).
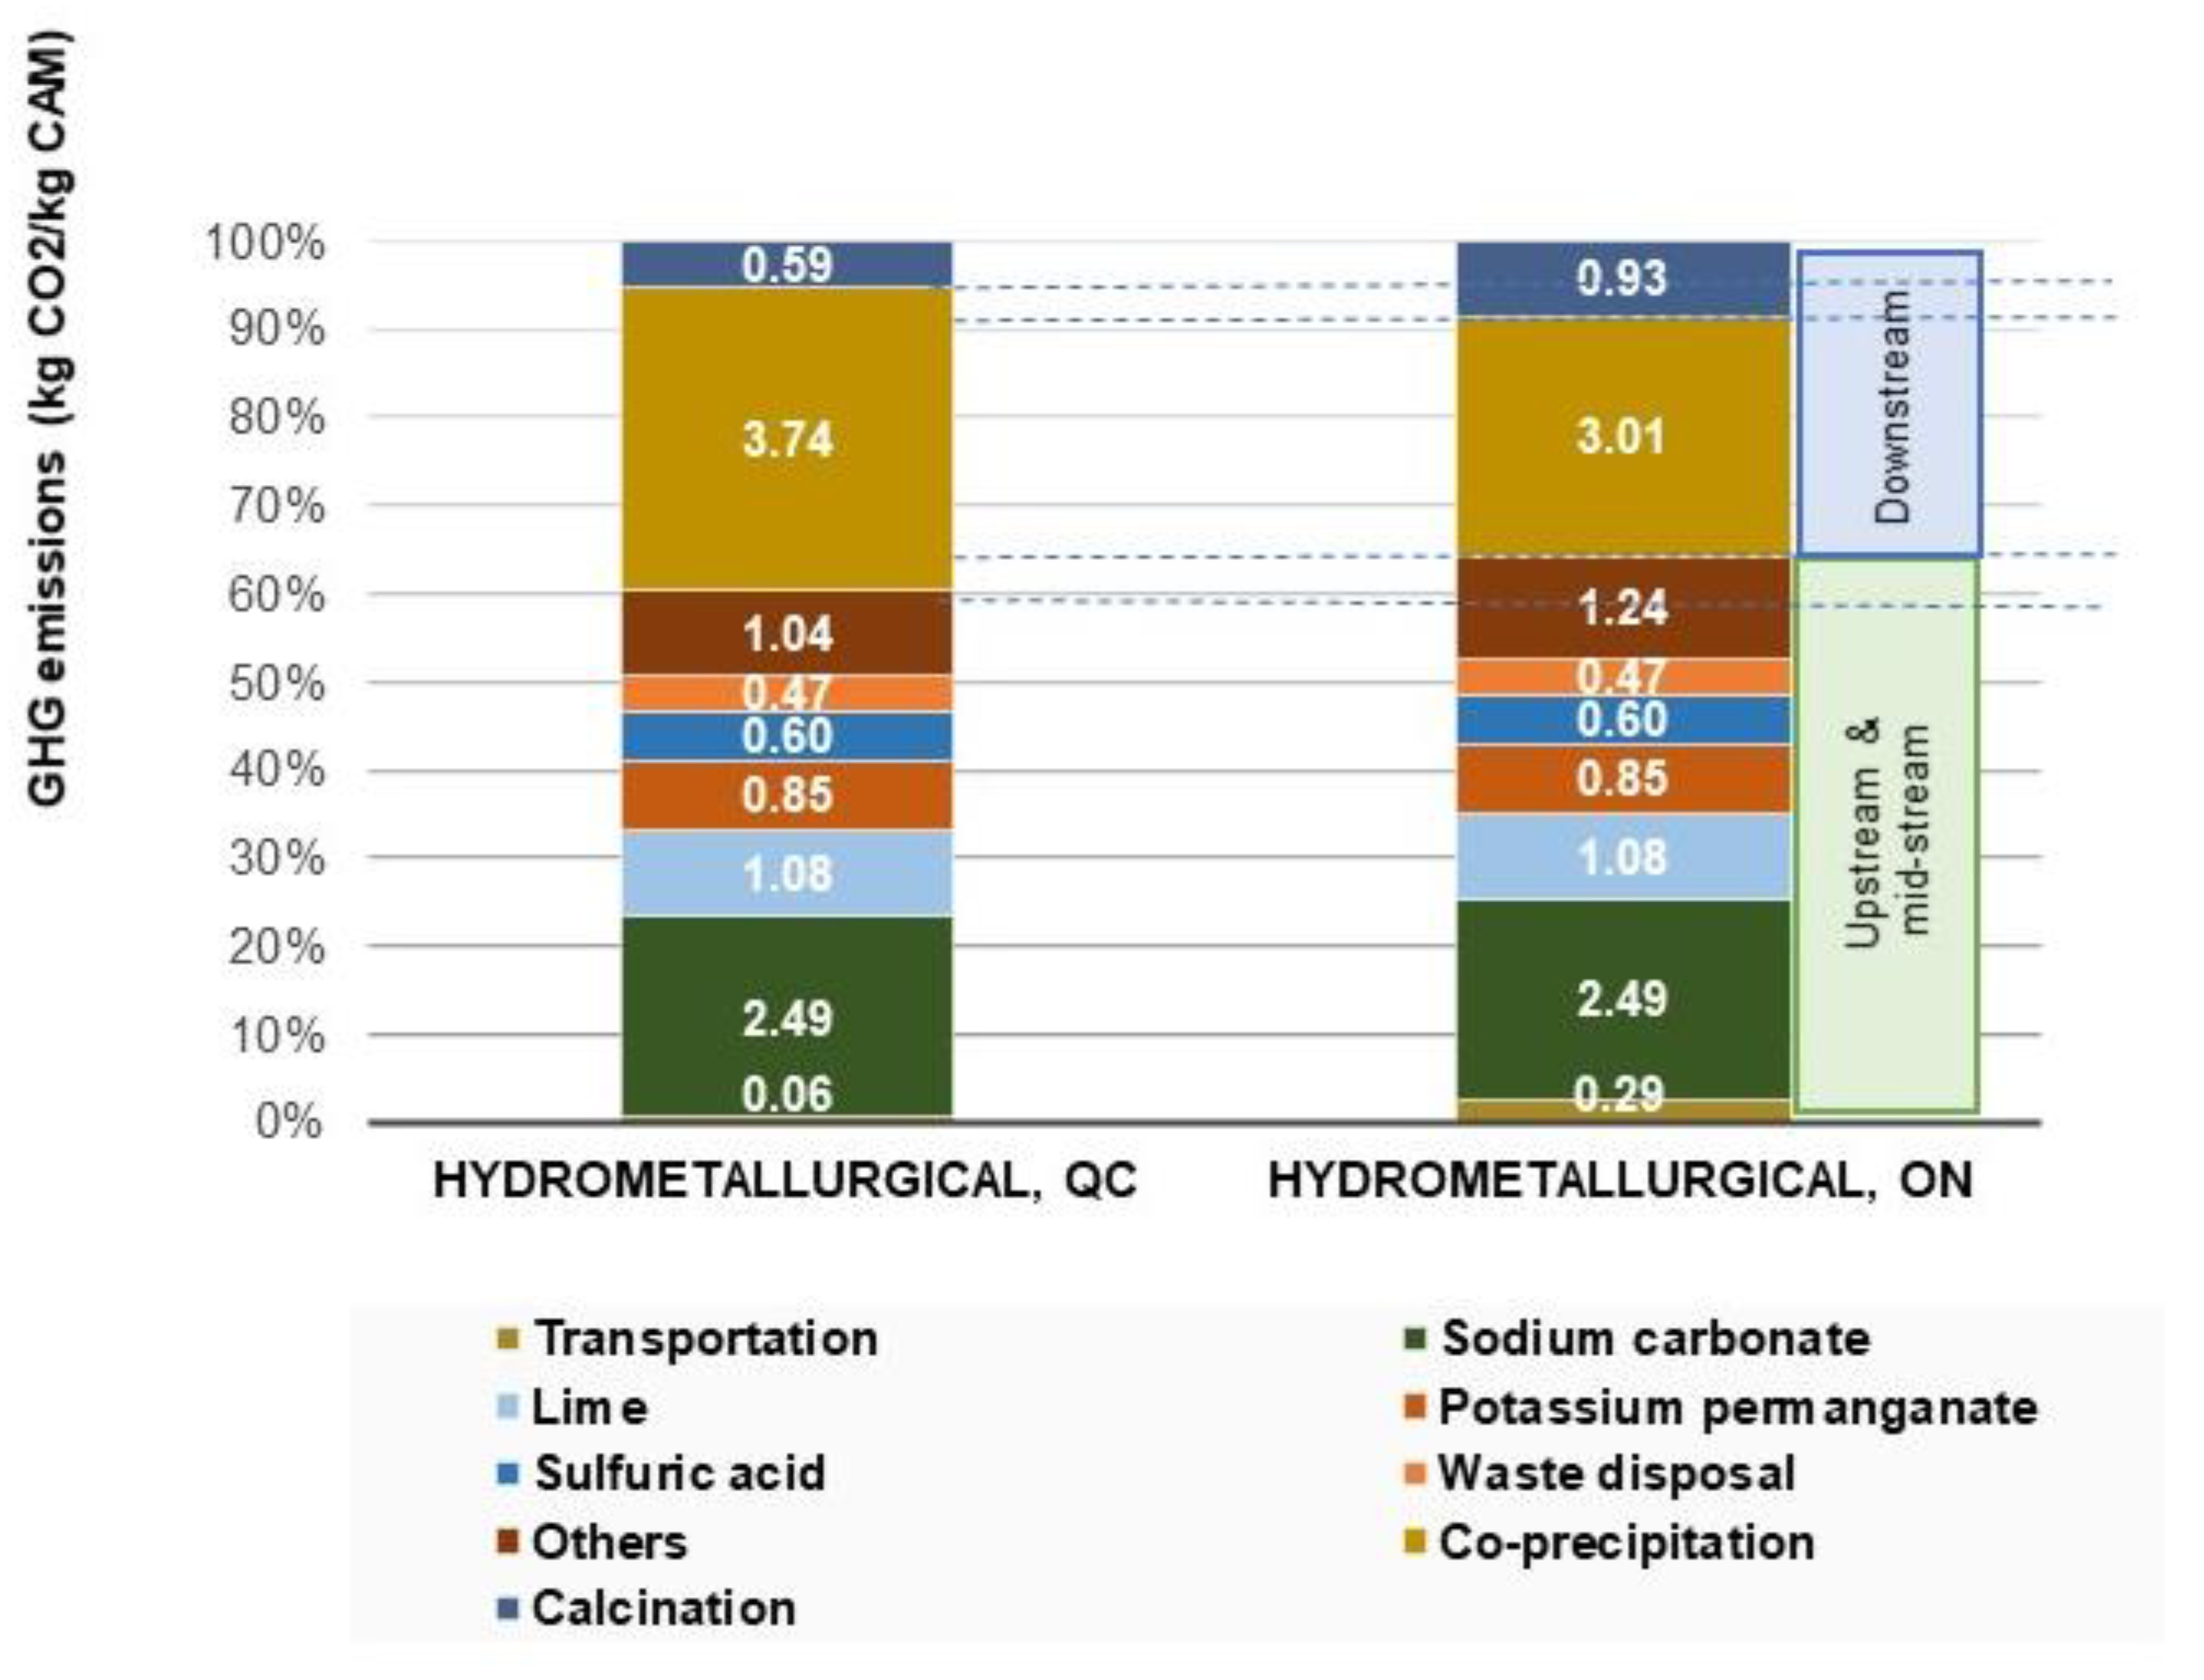
Figure 7 provides the breakdown of the different contributions to the overall GHG emissions for Quebec and Ontario. Overall, in both geographical locations, reagents (sodium carbonate, lime, sulphuric acid, and other chemicals) contribute the most to the total GHG emissions of the supply chain of cathode active material from recycled battery materials accounting for 51% of total emissions. Sodium carbonate contributes the most to the recycling processing GHG emissions accounting for 38.5% and 37% of total recycling emissions in Quebec and Ontario, respectively.

3.2.7. Environmental Credits

An environmental credit is assigned to each recovered material, based on the process it displaces. Since the bottom line of closed-loop recycling is to reuse any recovered material for its original purpose, it is assumed in this LCA study that all recovered materials replace the production of their virgin counterparts.
The life cycle environmental credits are obtained as the difference between the total recycling credits from CAM recovered in the overall recycling process and the life cycle environmental impact of recycling and recovering LIB CAM components, according to Equation (1) below.
E C i , k = E I r e c y c l i n g   i , k R C i , k
where ECi,k is the life cycle environmental credit impact category k result for the battery component i, EIrecycling i,k is the life cycle environmental impact category k result for recycling battery component i, and RCi,k is the life cycle recycling credit category k result for battery component i.
Potential life cycle recycling credits as a result of avoiding the production of primary materials (CoSO4, NiSO4, and MnSO4) and Li2CO3/Li2OH to manufacture NMC 811 LIB cathode active materials are estimated based on Equation (2).
R C i , k   = m j × e i j . k
where mj denotes the mass in kilograms of recovered material j, and eij,k is the result of environmental impact/emission category k for 1 kg of virgin material j. It was assumed that the metal sulfates and lithium carbonate can be recycled back to produce NMC battery cathode active materials based on the closed-loop recycling approach.
Recycling credits from these avoided products represent the environmental impacts avoided/saved from recycling processes against the primary material production.
In our Quebec case study, the life cycle environmental credit as a result of recovering metals at battery EoL to produce CAM with 100% recycled content is −6.46 kgCO2e/kg CAM.
Figure 8 shows the environmental credits and GHG emission reduction rate of nickel sulfate, cobalt sulfate, and lithium carbonate at different recycled content rates. Nickel sulfate and lithium carbonate provide the highest potential for emission reduction at 48% and 28%, respectively, when the recycled content of these materials is 100%.

3.2.8. Comparison with Previous Studies

A comparison of our study’s environmental credit result, i.e., net environmental benefits, with the results reported in the literature is indicated in Figure 9. The outcomes from recent life cycle assessment publications of lithium-ion batteries are reviewed, including net environmental benefits and recycling costs for recovering CAMs from spent NMC batteries [19,20,21,22,23,24,27,30]. The large variability of the reported results in the literature is attributed to the differentiations in the hydrometallurgical process route, system boundaries, functional units, data source of the supply chain process, and assumption scopes (geographical and supply chain processes included); therefore, transparency among LCAs on LIB recycling is needed [19,21]. Since our study scope is focused on the hydrometallurgical recycling process and does not include the recycling processing of aluminum, cooper, and steel by mechanical pretreatment, for comparative purposes, we harmonized the net environmental benefits reported in most studies by excluding the effect of recycling aluminum, cooper, and steel from the battery pack.
Our result of environmental credits of −6.46 kg CO2e/kg of cathode material is in the midrange of literature estimates for hydrometallurgical processing (−2.31 to −12.5 kg CO2e/kg of cathode material). Meanwhile, our estimate of the recycling cost for NMC 811 recycling (of 14.9 CAD/kg cathode material) is at the lower end of the existing results (15.18–19.5 CAD/kg cathode material). For example, Ciez and Whitacre [20] present the lowest estimate of net environmental benefits due to the upstream LCI data sources they used; for instance, the energy inputs are from the GREET model while we used background data from Ecoinvent database 3.9.1. In addition, they assumed that the electrode materials (aluminum and cooper foil) not recovered through the recycling process, or collected as scrap, are incinerated. Mohr, Peters [23] evaluated a parametrized model of mechanical-hydrometallurgical recycling processing at the cell level and estimated an overall recycling benefit considering aluminum, copper, and CAM metals. In regards to the net environmental credits for recovering metal sulfates, these are in line with the results of our model. Kallitsis, Korre [19], Sun, Luo [22], and Blömeke, Scheller [24] present the highest net environmental benefits due to the differentiation in the cobalt sulfate inventory used in their studies. Blömeke, Scheller [24] modelled a European recycling supply chain while Kallitsis, Korre [19] and Sun, Luo [22] modelled a Chinese one, thus partially explaining the variability together with the different chemistries modelled in each study. Regarding the recycling cost estimates, Lander, Cleaver [30] provide an estimation of the total cost of recycling a full battery pack and assumes a supply chain configuration that includes the UK as the origin of the end of life and recycling locations in Belgium, China, South Korea, and the US, which increments essentially the transportation costs.

3.3. Overall Impact Assessment

In our performed LCA, recovered CAM is considered as avoided primary CAM and thus provides positive environmental credits to the overall impact. Since a closed-loop recycling process is assumed, the recovered product quality must comply with the battery grade. That means the supply chain of the recovered CAM modeled in our study considers the downstream stage for further refining of the output metal compounds from the recycling process to obtain a CAM at battery grade.
Assessment of the costs and GHG emissions of the supply chain of NMC 811 LIB CAMs using recycled battery materials (benchmark scenario) considers three stages, upstream, midstream, and downstream. For the upstream stage, the cost and GHG emissions of transporting spent EV LIBs from collection centers through dismantling hubs to recycling facilities in the province of Quebec, Canada, are estimated and scaled from Gonzales-Calienes, Yu’s [13] LIB reverse logistics study. The costs and GHG emissions of the midstream related to the recycling processing of black mass to recover precursor material (metal sulfates and lithium) are estimated in Section 3.1 and Section 3.2 of this study. The downstream stage considers two processes, the co-precipitation as the conversion of the recycled battery materials into an NMC 811 precursor CAM, i.e., the mixed hydroxide precipitation, and the calcination process of the precursor to produce the LIB cathode active material at battery grade.
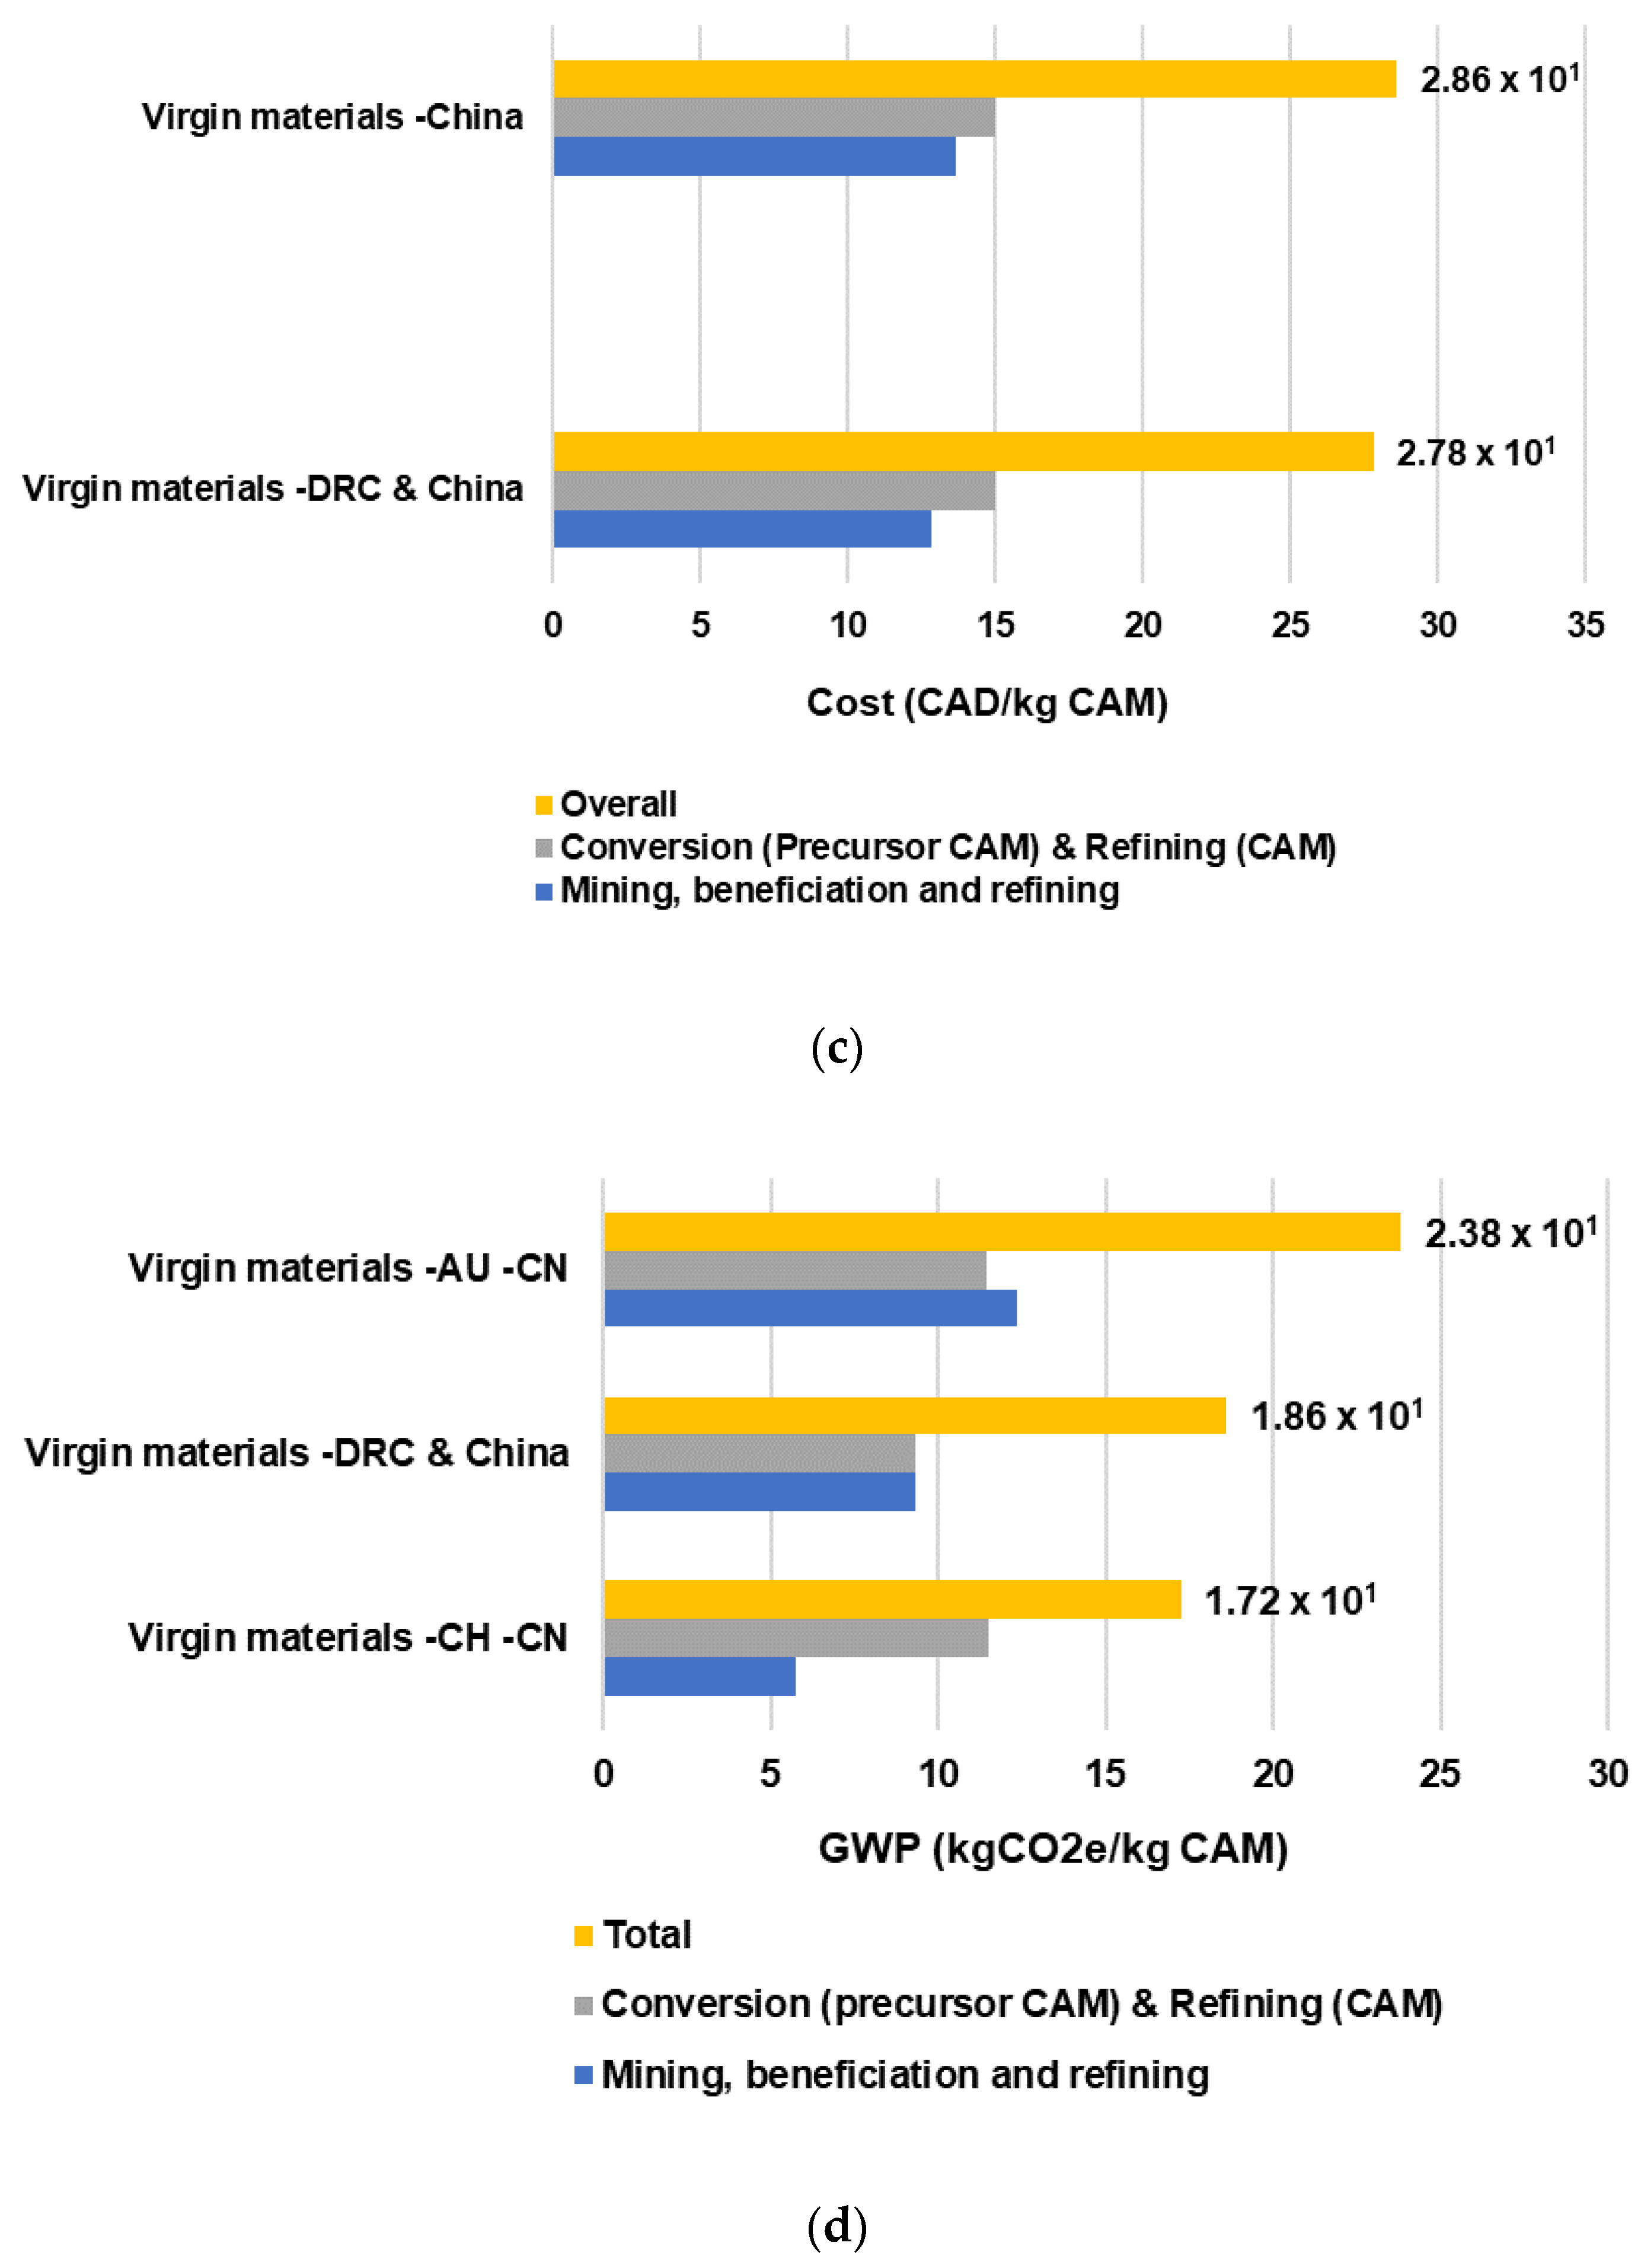
The benchmark scenario is compared to a scenario that considers evaluating the costs and GHG emissions of the supply chain of the NMC 811 LIB CAMs using virgin materials. For this route, costs and GHG emissions are estimated using open-source EverBatt developed by the Argonne National Laboratory [62]. The geographical location of the upstream and midstream stages is assumed to be located in China, where lithium compounds (LiOH·H20 or Li2CO3) are produced from concentrated ores after mining extraction and beneficiation. Metal sulfates are also produced and refined in China. The downstream stage processes also take place in China based on a study.
Table 5 and Table 6 provide a comparison of cost and GHG emissions between the recycled battery material supply chain and the virgin material supply chain. The overall cost of the recycled battery material supply chain is 48% less expensive than the virgin material route. The downstream stage of the virgin battery material supply chain accounts for 52% and 15% of total costs and GHE emissions, respectively. In the case of the recycling processing cost, including spent battery collection and transportation, this is 21% less expensive than the mining, extraction, beneficiation, and refining of virgin raw materials.
Regarding the GHG emission comparison, the recycled battery material route polluted 54% less than the virgin material one. The upstream and downstream recycled material supply chain represents a 47% emission reduction with respect to the mining, beneficiation, and refining stages of the virgin materials. The main drivers of this difference are the local transportation and precursor CAM obtained from the hydrometallurgical process, which is less energy-intensive. The production of the PCAM and CAM (downstream stage) from recycled battery materials also represents an emission reduction of 62% due to the main source of energy in China being coal, which increments the carbon intensities of heat and electricity required to produce the LIB CAM. An important quantity of coal is consumed for process heat, as fuel, and for steam production [42]. In the Quebec case study, the energy source is natural gas to provide heat, whereas electricity is obtained from hydroelectricity representing ninety-four percent of Quebec’s electricity generation mix. Quebec’s electricity rates are among the lowest in North America [63].
In Table 7, environmental impact in terms of the GHG emissions of individual recycled battery precursor materials, including nickel sulfate, cobalt sulfate, manganese sulfate, and lithium carbonate, are compared with the GHG emissions of the production of these precursor materials from virgin materials. Important emission reductions can be achieved when nickel sulfate and lithium carbonate from ore are recovered and recycled from spent EV LIBs.
The GHG emissions of recycled sulfates and lithium compounds are estimated using the mass allocation method for the calculated GWP of the hydrometallurgical process of 1 kg of black mass. The recovered sulfates, NiSO4·6H2O, CoSO4·7H2O, MnSO4·7H2O, and lithium carbonate (Li2CO3) are co-products with the following GHG emission allocation factors: 0.6875, 0.1630, 0.0149, and 0.1346, respectively.
Nickel is a major component of the active cathode material. Nickel sulfate hexahydrate battery-grade obtained from virgin materials is mostly produced from either oxidic (lateritic) or sulphide ore [64]. Regionally, ore mining and processing are located in Russia, Canada, and Australia [65]. China represents around 31% of global nickel refining production. Nickel Institute’s LCA study indicates a GWP of 5.4 kg CO2e/kg nickel sulfate, where primary extraction and refining processes contribute 42% and 35%, respectively, to the GWP for the production of nickel sulfate [66].
Cobalt sulfate is essentially mined in the Democratic Republic of Congo (DRC) and then concentrated and converted into raw Co(OH)2. The further refining process, into CoSO4, is essentially energy-intensive and generally occurs in China [67]. In the case of NMC811 cathodes, these are aligned with the trend in the EV LIB industry with higher energy density and lower cobalt content [42]. GREET© software provides a GWP of 9.7 kg CO2e/kg cobalt sulfate using economic allocation [68].
Manganese sulfate is used in NMC cathode active material in the form of high-purity electrolytic manganese metal which is produced mainly in China. This direct ore processing route involves beneficiation, leaching, precipitation, crystallization, and drying [69]. GREET© provides a GWP of 0.869 kg CO2e/kg manganese sulfate [68].
Table 7. Environmental impact comparison of recycled battery cathode active material and battery primary material production from virgin materials. Recycling processing values include transportation.
Battery Precursor CAMRecycling Processing (kg CO2e/kg CAM) 1Mining, Beneficiation, Extraction, and RefiningEmission Reductions
(kg CO2e/kg CAM)
NiSO4·6H2O4.50006.8700 2−35%
CoSO4·7H2O1.07001.5500 3−31%
MnSO4·7H2O0.09730.0134 4−28%
Li2CO3—brine0.88101.3500 5−35%
Li2CO3—ore8.7300 5−90%
1 Recycling processing emissions are estimated by mass allocation of the co-products using openLCA software. 2 [66]. 3 [68]. 4 [68]. 5 [42].
Lithium carbonate is a chemical component used in the refining and conversion of the precursor CAM into cathode active material. For this study, NMC 811 CAM, two pathways for lithium carbonate extraction are considered: ore and brine. Ore-based lithium compounds are available from Western Australia and represent a major market share of global lithium production. This form of lithium is spodumene from mined ore, which can be refined to obtain Li2CO3 or LiOH [70]. Chile represents a substantial market share of lithium carbonate or lithium hydroxide extracted from brine. Kelly et al.’s study [42] concludes that the brine-based route largely consumes renewable energy to concentrate lithium up to 6%; meanwhile, the ore-based route depends greatly on diesel for ore mining and processing and coal for refining to get an equivalent 6% lithium oxide, which has less than 3% of lithium. This, mixed with the low-carbon electricity generated in Chile versus China, contributes to less carbon emissions from lithium compounds extracted from brine [42]. Further refining to produce CAM is located in China. The GWP of lithium carbonate from brine is 2.7 kg CO2e/kg lithium carbonate, and from ore, it is 20.4 kg CO2e/kg lithium carbonate [42].

3.4. Sensitivity Analysis

Sensitivity analysis is conducted to evaluate the influence of different parameters and assumptions on two scenarios: (i) the GHG emission reduction rate of the production of LIB CAM by using recycled CAMs and (ii) the cost and GHG emissions of the supply chain of LIB cathode active materials.

3.4.1. GHG Emission Reduction

The sensitivity analysis was carried out for three parameters: the recycled content of cathode active materials, i.e., sulfates and lithium carbonate recovered from black mass, the recovery rate from recycling processing, and the GHG emissions of the recycling processing of precursor CAM by the hydrometallurgical process (Figure 10). GHG emission reduction percentages are evaluated for a variation of ±10% of the recycled content in CAM, recovery rate, and GHG emission production from virgin materials of nickel sulfate, cobalt sulfate, and lithium carbonate.
The recycling processing emissions of nickel sulfate present high variability in comparison with cobalt sulfate and lithium carbonate since NiSO4 has the higher mass allocation of carbon emissions. Recycled content presents high variability for all three precursors. This confirms the significance of ensuring high recovery levels for the primary metals in the CAM. For instance, a proper battery design for the end of life and efficient dismantling and sorting of the waste battery elements for recycling could improve material recovery. The total recycling credits still surpass the environmental impact of recycling treatments for the EV LIB. Hence, the environmental credits still justify the viability of EV LIB pack recycling.

3.4.2. Spatial Differentiation

The geographical specificity of the battery cathode active material supply chain is a critical parameter when estimating operating costs and GHG emissions. In Figure 11a, the supply chain of recycled CAMs in Quebec is compared to two alternative recycling scenarios in the US and China. Overall, recycling costs in Canada are 12% and 33% lower than in the US and China, respectively. The recycling processing cost is affected by the type of technology route chosen. The hydrometallurgical process with solvent extraction used in our baseline scenario has still a higher cost than the conventional hydrometallurgical pathway followed by the US and China. Higher energy consumption, greater capital cost related to solvent extraction areas, especially for nickel solvent extraction (22% of CAPEX), higher reagent costs (sulphuric acid and sodium carbonate), and reduced nominal capacity are the key contributors. Further investigation of other approaches to reduce solvent extraction steps is recommended. Since downstream refining processes are energy-intensive, costs related to energy consumption are 66% higher in China than in North America. Overall, the GHG emissions of the recycled battery material supply chain in Canada are 27% and 38% lower than in the US and China, respectively. The main primary energy source in China is coal, and its electricity production mix relies mostly on fossil fuels.
Since cathodes, anodes, and electrolytes are imported mainly from China, Japan, and Korea [2], different scenarios are considered where the supply chains of precursor CAMs using virgin materials are affected by the geographical location of the ore mining. Although there are sufficient lithium resources around the world, almost 70% of these are concentrated in Argentina, Chile, and Bolivia, and the same is true for cobalt, of which 60% of the resources are in Congo [15]. Critical mineral concentration in mined ores is a key decision-making factor.
In Figure 11b, the GWP of three scenarios of cathode active material supply chain from virgin materials is estimated considering that lithium carbonate originates from brine-based production with mining ore in Atacama, Chile, and precursor CAM and CAM manufacturing takes place in China. The other sulfate material production occurs in China [42]. The second scenario considers the upstream stage, and precursor CAM manufacturing (mixed oxide precipitation) happens in the DRC and CAM refining in China [71]. The third scenario considers that lithium carbonate has ore-based production with mining spodumene ore in Australia and precursor CAM manufacturing and CAM manufacturing in China [42]. On the basis of battery CAM, the differentiation in lithium carbonate sources leads to a 28% variance in GHG emissions. For NMC 811 battery CAM, the cathode production from recycled CAMs in Canada leads to a reduction in costs and GHGs of 48% and 54%, respectively. This is not the case when the cathode production from virgin materials is based in China.

3.5. Further Research

Although the costs and GHG emissions are critical indicators to evaluate the viability of battery cathode material recycling, the potential drawbacks of recycled battery materials should be also discussed in more detail through further research. Some studies have discussed the impact of recycling on battery performance, active material quality, and associated costs. Zheng, Chen [72] compared battery performance using NMC 111 recycled battery materials versus virgin materials. The experimental results obtained showed that recovered NMC 111s obtained via the hydrometallurgical process have similar rate capability at low C rates (0.2, 0.5, 1, and 2 C) as cells manufactured with virgin materials and considerably better rate performance at high rates (5 and 10 C). Ma, Chen [73] also found that recycled NMC 111 enables 4200 cycles and 11,600 cycles at 80% and 70% capacity retention, which is 33% and 53% better than the state-of-the-art, commercial NMC 111 cathode. Meanwhile, its rate performance is 88.6% better than commercial powders at 5C. Wagner-Wenz, van Zuilichem [74] evaluated the recycled active material quality in terms of the purity and cyclability of recovered cathode material. After hydrometallurgical processing, the recovered transition metals and lithium salts correspond to the precursors from the production of LIBs. High-purity degrees of up to 99.9% could be achieved and used directly for the production of new cathode materials [74]. Regarding the purity of recycled active materials from pyrometallurgical recycling routes, these are low-purity cathode precursors that need further refinement processes to obtain a battery-grade material [75]. However, there is still a complex effect of impurities such as Cu, Fe, and Mg on recovered NMC cathode material electrochemistry performance, material stability, and lifetime after the hydrometallurgical process. In some cases, these can contribute to an improvement in the electrochemical performance, while in others, they damage the cell. It depends on the form (metal, ion) and concentration limits [76,77]. In the case that the recovered active material does not reach battery grade or high energy density or cycling performance, it is recommended to apply additional treatment to the recovered materials, for example, combining them with virgin materials before being reintroduced to battery production [76,78].

4. Conclusions and Future Work

In this paper a new bottom-up framework has been described and used to support the sustainability assessment of battery material supply chains. It addresses the challenge of integrating the economic and environmental sustainability dimensions of upstream and downstream supply chains based in a common bottom-up framework. For this, we integrated process simulation results to scale up capital and operating costs in building detailed life cycle inventories. Life cycle cost and GHG assessments integrate the effect of geographic specificity on the supply chain of specific recycled battery materials of electric vehicle lithium-ion batteries.
We showed that the supply chain configuration along the upstream, midstream, and downstream stages has a substantial influence on the GWP impact variability. GWP impacts of the hydrometallurgical recycling process located in Quebec and Ontario (Canada) are estimated as 3.57 and 3.68 kg CO2e/kg black mass (6.54 and 6.74 kg CO2e/kg cathode active material), respectively. The environmental credits of recovering battery cathode active material have a substantial impact on the overall carbon footprint.
There are two main findings of this study. First, the environmental credit of recycled cathode active materials (CAMs) is estimated as −6.46 kg CO2e/kg CAM. Second, the overall cost and environmental impacts of producing LIB cathode active materials from recycled battery materials can be 48% and 54% lower than production from virgin materials, respectively, considering the upstream, midstream, and downstream stages of the recycled CAM supply chain. The main drivers for the reduction in these costs and emissions are the local transportation and precursor cathode active materials recovered from the hydrometallurgical process.
The environmental impact of the battery pack dismantling process in the upstream stage was not included in the overall GHG emissions of the supply chain of cathode active materials. However, further research is suggested to investigate the contribution of the operating costs and environmental impact of different dismantling activities, such as screening, sorting, testing, and discharging, and separation methods.

Supplementary Materials

The following supporting information can be downloaded at https://www.mdpi.com/article/10.3390/batteries9070375/s1. Supplementary data: capital cost breakdown, operating cost list, battery characterization, and life cycle inventory tables. References [34,46,62] are cited in the Supplementary Materials.

Author Contributions

Conceptualization, G.G.-C. and F.B.; Data curation, G.G.-C. and M.K.; Formal analysis, G.G.-C.; Investigation, G.G.-C.; Methodology, G.G.-C.; Project administration, G.G.-C. and F.B.; Supervision, F.B.; Validation, G.G.-C.; Writing—original draft, G.G.-C.; Writing—review and editing, G.G.-C., M.K. and F.B. Visualization, G.G.-C. All authors have read and agreed to the published version of the manuscript.

Funding

Financial support from the Office of Energy Research and Development (OERD) of the Natural Resources Canada (project number NRC-19-109) and the Advanced Clean Energy (ACE) program of the National Research Council of Canada are also appreciated.

Institutional Review Board Statement

Not applicable.

Informed Consent Statement

Not applicable.

Data Availability Statement

Data supporting reported results can be found in the Supplementary Information file.

Acknowledgments

Discussion and contribution with Chris Baxter regarding process simulation and costing and discussion with Ben Yu are appreciated. Financial support from the Office of Energy Research and Development (OERD) of the Natural Resources Canada (project number NRC-19-109) and the Advanced Clean Energy (ACE) program of the National Research Council of Canada are also appreciated.

Conflicts of Interest

The authors declare no conflict of interest.

References

  1. Li, M.; Lu, J.; Chen, Z.; Amine, K. 30 Years of Lithium-Ion Batteries. Adv. Mater. 2018, 30, 1800561. [Google Scholar] [CrossRef] [PubMed] [Green Version]
  2. Mayyas, A.; Steward, D.; Mann, M. The case for recycling: Overview and challenges in the material supply chain for automotive li-ion batteries. Sustain. Mater. Technol. 2019, 19, e00087. [Google Scholar] [CrossRef]
  3. Numfor, S.A.; Omosa, G.B.; Zhang, Z.; Matsubae, K. A Review of Challenges and Opportunities for End-of-Life Vehicle Recycling in Developing Countries and Emerging Economies: A SWOT Analysis. Sustainability 2021, 13, 4918. [Google Scholar] [CrossRef]
  4. Prates, L.; Karthe, D.; Zhang, L.; Wang, L.; O’Connor, J.; Lee, H.; Dornack, C. Sustainability for all? The challenges of predicting and managing the potential risks of end-of-life electric vehicles and their batteries in the Global South. Environ. Earth Sci. 2023, 82, 143. [Google Scholar] [CrossRef]
  5. Ali, H.; Khan, H.A.; Pecht, M. Preprocessing of spent lithium-ion batteries for recycling: Need, methods, and trends. Renew. Sustain. Energy Rev. 2022, 168, 112809. [Google Scholar] [CrossRef]
  6. Ali, H.; Khan, H.A.; Pecht, M.G. Circular economy of Li Batteries: Technologies and trends. J. Energy Storage 2021, 40, 102690. [Google Scholar] [CrossRef]
  7. Baum, Z.J.; Bird, R.E.; Yu, X.; Ma, J. Lithium-Ion Battery Recycling—Overview of Techniques and Trends. ACS Energy Lett. 2022, 7, 712–719. [Google Scholar] [CrossRef]
  8. Zhang, Y.S.; Schneider, K.; Qiu, H.; Zhu, H.L. A perspective of low carbon lithium-ion battery recycling technology. Carbon Capture Sci. Technol. 2022, 5, 100074. [Google Scholar] [CrossRef]
  9. Jamal, H.; Khan, F.; Hyun, S.; Min, S.W.; Kim, J.H. Enhancement of the ionic conductivity of a composite polymer electrolyte via surface functionalization of SSZ-13 zeolite for all-solid-state Li-metal batteries. J. Mater. Chem. A 2021, 9, 4126–4137. [Google Scholar] [CrossRef]
  10. Jamal, H.; Khan, F.; Si, H.R.; Kim, J.H. Enhanced compatibility of a polymer-based electrolyte with Li-metal for stable and dendrite-free all-solid-state Li-metal batteries. J. Mater. Chem. A 2021, 9, 27304–27319. [Google Scholar] [CrossRef]
  11. Friebe CLex-Balducci, A.; Schubert, U.S. Sustainable Energy Storage: Recent Trends and Developments toward Fully Organic Batteries. ChemSusChem 2019, 12, 4093–4115. [Google Scholar] [CrossRef] [PubMed] [Green Version]
  12. Nguyen, T.P.; Easley, A.D.; Kang, N.; Khan, S.; Lim, S.M.; Rezenom, Y.H.; Wooley, K.L. Polypeptide organic radical batteries. Nature 2021, 593, 61–66. [Google Scholar] [CrossRef]
  13. Gonzales-Calienes, G.; Yu, B.; Bensebaa, F. Development of a Reverse Logistics Modeling for End-of-Life Lithium-Ion Batteries and Its Impact on Recycling Viability—A Case Study to Support End-of-Life Electric Vehicle Battery Strategy in Canada. Sustainability 2022, 14, 15321. [Google Scholar] [CrossRef]
  14. Quebec, G. Green Battery Production. It’s All Powered by Québec; Investissement Québec: Montreal, QC, Canada, 2022. [Google Scholar]
  15. MarketsandMarkets. Lithium-Ion Battery Recycling Market—Global Forecast to 2030; MarketsandMarkets: Pune, India, 2021; p. 201. [Google Scholar]
  16. Alpha. Lithium Miners News for the Month of April 2023. 2023. Available online: https://seekingalpha.com/article/4596705-lithium-miners-news-for-the-month-of-april-2023 (accessed on 15 May 2023).
  17. S&P. Commodities 2023: Lithium Prices Likely to See Support from Tight Supply, Bullish EV Demand. 2022. Available online: https://www.spglobal.com/commodityinsights/en/market-insights/latest-news/metals/122222-lithium-prices-likely-to-see-support-in-2023-from-tight-supply-bullish-ev-demand (accessed on 15 May 2023).
  18. Onat, N.C.; Kucukvar, M.; Tatari, O. Towards Life Cycle Sustainability Assessment of Alternative Passenger Vehicles. Sustainability 2014, 6, 9305–9342. [Google Scholar] [CrossRef] [Green Version]
  19. Kallitsis, E.; Korre, A.; Kelsall, G.H. Life cycle assessment of recycling options for automotive Li-ion battery packs. J. Clean. Prod. 2022, 371, 133636. [Google Scholar] [CrossRef]
  20. Ciez, R.E.; Whitacre, J.F. Examining different recycling processes for lithium-ion batteries. Nat. Sustain. 2019, 2, 148–156. [Google Scholar] [CrossRef]
  21. Jiang, S.; Hua, H.; Zhang, L.; Liu, X.; Wu, H.; Yuan, Z. Environmental impacts of hydrometallurgical recycling and reusing for manufacturing of lithium-ion traction batteries in China. Sci. Total Environ. 2022, 811, 152224. [Google Scholar] [CrossRef] [PubMed]
  22. Sun, X.; Luo, X.; Zhang, Z.; Meng, F.; Yang, J. Life cycle assessment of lithium nickel cobalt manganese oxide (NCM) batteries for electric passenger vehicles. J. Clean. Prod. 2020, 273, 123006. [Google Scholar] [CrossRef]
  23. Mohr, M.; Peters, J.F.; Baumann, M.; Weil, M. Toward a cell-chemistry specific life cycle assessment of lithium-ion battery recycling processes. J. Ind. Ecol. 2020, 24, 1310–1322. [Google Scholar] [CrossRef]
  24. Blömeke, S.; Scheller, C.; Cerdas, F.; Thies, C.; Hachenberger, R.; Gonter, M.; Spengler, T.S. Material and energy flow analysis for environmental and economic impact assessment of industrial recycling routes for lithium-ion traction batteries. J. Clean. Prod. 2022, 377, 134344. [Google Scholar] [CrossRef]
  25. Xia, X.; Li, P. A review of the life cycle assessment of electric vehicles: Considering the influence of batteries. Sci. Total Environ. 2022, 814, 152870. [Google Scholar] [CrossRef] [PubMed]
  26. ANL. Modeling the Performance and Cost of Lithium-Ion Batteries for Electric-Drive Vehicles; Argonne National Laboratory: Lemont, IL, USA, 2011; p. 121. [Google Scholar]
  27. Nguyen-Tien, V.; Dai, Q.; Harper, G.D.; Anderson, P.A.; Elliott, R.J. Optimising the geospatial configuration of a future lithium ion battery recycling industry in the transition to electric vehicles and a circular economy. Appl. Energy 2022, 321, 119230. [Google Scholar] [CrossRef]
  28. Baxter, C.P.; Plugatyr, A.; Ben, Y. Processing Black Mass into a Mixed Nickel/Cobalt Hydroxide Precipitate and Industrial Grade Lithium Carbonate: A Techno-Economic Analysis Perspective. In Proceedings of the 61st Annual Conference of Metallurgists, Montreal, QC, Canada, 21–24 August 2022. [Google Scholar]
  29. Lima, M.C.C.; Pontes, L.P.; Vasconcelos, A.S.M.; de Araujo Silva Junior, W.; Wu, K. Economic Aspects for Recycling of Used Lithium-Ion Batteries from Electric Vehicles. Energies 2022, 15, 2203. [Google Scholar] [CrossRef]
  30. Lander, L.; Cleaver, T.; Rajaeifar, M.A.; Nguyen-Tien, V.; Elliott, R.J.; Heidrich, O.; Offer, G. Financial viability of electric vehicle lithium-ion battery recycling. iScience 2021, 24, 102787. [Google Scholar] [CrossRef]
  31. Arshad, F.; Li, L.; Amin, K.; Fan, E.; Manurkar, N.; Ahmad, A.; Chen, R. A Comprehensive Review of the Advancement in Recycling the Anode and Electrolyte from Spent Lithium Ion Batteries. ACS Sustain. Chem. Eng. 2020, 8, 13527–13554. [Google Scholar] [CrossRef]
  32. Cusenza, M.A.; Bobba, S.; Ardente, F.; Cellura, M.; Di Persio, F. Energy and environmental assessment of a traction lithium-ion battery pack for plug-in hybrid electric vehicles. J. Clean. Prod. 2019, 215, 634–649. [Google Scholar] [CrossRef]
  33. Dunn, J.B.; Gaines, L.; Kelly, J.C.; James, C.; Gallagher, K.G. The significance of Li-ion batteries in electric vehicle life-cycle energy and emissions and recycling’s role in its reduction. Environ. Sci. Technol. 2021, 55, 5189. [Google Scholar] [CrossRef]
  34. Dai, Q.; Kelly, J.C.; Gaines, L.; Wang, M. Life Cycle Analysis of Lithium-Ion Batteries for Automotive Applications. Batteries 2019, 5, 48. [Google Scholar] [CrossRef] [Green Version]
  35. Hendrickson, T.P.; Kavvada, O.; Shah, N.; Sathre, R.; Scown, C.D. Life-cycle implications and supply chain logistics of electric vehicle battery recycling in California. Environ. Res. Lett. 2015, 10, 014011. [Google Scholar] [CrossRef]
  36. Heath, G.A.; Ravikumar, D.; Hansen, B.; Kupets, E. A critical review of the circular economy for lithium-ion batteries and photovoltaic modules—Status, challenges, and opportunities. J. Air Waste Manag. Assoc. 2022, 72, 478–539. [Google Scholar] [CrossRef]
  37. Larouche, F.; Tedjar, F.; Amouzegar, K.; Houlachi, G.; Bouchard, P.; Demopoulos, G.P.; Zaghib, K. Progress and Status of Hydrometallurgical and Direct Recycling of Li-Ion Batteries and Beyond. Materials 2020, 13, 801. [Google Scholar] [CrossRef] [Green Version]
  38. Islam, M.T.; Iyer-Raniga, U. Lithium-Ion Battery Recycling in the Circular Economy: A Review. Recycling 2022, 7, 33. [Google Scholar] [CrossRef]
  39. Chen, M.; Ma, X.; Chen, B.; Arsenault, R.; Karlson, P.; Simon, N.; Wang, Y. Recycling End-of-Life Electric Vehicle Lithium-Ion Batteries. Joule 2019, 3, 2622–2646. [Google Scholar] [CrossRef]
  40. Kannangara, M.; Shadbahr, J.; Vasudev, M.; Yang, J.; Zhang, L.; Bensebaa, F.; Bergerson, J. A standardized methodology for economic and carbon footprint assessment of CO2 to transport fuels: Comparison of novel bicarbonate electrolysis with competing pathways. Appl. Energy 2022, 325, 119897. [Google Scholar] [CrossRef]
  41. Greenwood, M.; Wentker, M.; Leker, J. A bottom-up performance and cost assessment of lithium-ion battery pouch cells utilizing nickel-rich cathode active materials and silicon-graphite composite anodes. J. Power Sources Adv. 2021, 9, 100055. [Google Scholar] [CrossRef]
  42. Kelly, J.C.; Wang, M.; Dai, Q.; Winjobi, O. Energy, greenhouse gas, and water life cycle analysis of lithium carbonate and lithium hydroxide monohydrate from brine and ore resources and their use in lithium ion battery cathodes and lithium ion batteries. Resour. Conserv. Recycl. 2021, 174, 105762. [Google Scholar] [CrossRef]
  43. US EPA. Application of Life-Cycle Assessment to Nanoscale Technology: Lithium-Ion Batteries for Electric Vehicles; United States Environmental Protection Agency: Washington, DC, USA, 2013.
  44. Recharge. PEFCR—Product Environmental Footprint Category Rules for High Specific Energy Rechargeable Batteries for Mobile Applications; Recharge: Brussels, Belgium, 2018; p. 98. [Google Scholar]
  45. Nordelöf, A.; Poulikidou, S.; Chordia, M.; Bitencourt de Oliveira, F.; Tivander, J.; Arvidsson, R. Methodological Approaches to End-Of-Life Modelling in Life Cycle Assessments of Lithium-Ion Batteries. Batteries 2019, 5, 51. [Google Scholar] [CrossRef] [Green Version]
  46. Dai, Q.; Kelly, J.C.; Dunn, J.; Benavides, P.T. Update of Bill-of-materials and Cathode Materials Production for Lithium-ion Batteries in the GREET Model 2018; Argonne National Laboratory: Lemont, IL, USA, 2018. [Google Scholar]
  47. Kim, H.C.; Wallington, T.J.; Arsenault, R.; Bae, C.; Ahn, S.; Lee, J. Cradle-to-Gate Emissions from a Commercial Electric Vehicle Li-Ion Battery: A Comparative Analysis. Environ. Sci. Technol. 2016, 50, 7715–7722. [Google Scholar] [CrossRef]
  48. Majeau-Bettez, G.; Hawkins, T.R.; Stromman, A.H. Life cycle environmental assessment of lithium-ion and nickel metal hydride batteries for plug-in hybrid and battery electric vehicles. Environ. Sci. Technol. 2011, 45, 4548–4554. [Google Scholar] [CrossRef]
  49. Baxter, C. Unpublished Internal Technical Report. Recycling of Li-Ion Batteries: Trade-Off Case 2; Energy, Mining and Environment Research Center; National Research Council Canada: Ottawa, ON, Canada, 2022; p. 96. [Google Scholar]
  50. AACE. AACE International Recommended Practice No. 18R-97; Association for the Advancement of Cost Engineering: Fairmont, WV, USA, 2020. [Google Scholar]
  51. Bank of Canada. Daily Exchange Rates. 2023. Available online: https://www.bankofcanada.ca/rates/exchange/daily-exchange-rates/ (accessed on 30 May 2023).
  52. InfoMine. Mining Cost Service: Electric Power—Canada; InfoMine: Vancouver, BC, Canada, 2018. [Google Scholar]
  53. InfoMine. Mining Cost Service: Cost Indexes and Metal Prices; InfoMine: Vancouver, BC, Canada, 2018. [Google Scholar]
  54. InfoMine. Mining Cost Service: Labor—Canada; InfoMine: Vancouver, BC, Canada, 2018. [Google Scholar]
  55. InfoMine. Mining Cost Service: Supplies; InfoMine: Vancouver, BC, Canada, 2018. [Google Scholar]
  56. ISO. ISO 14044. Environmental Management—Life Cycle Assessment-Requirements and Guidelines; ISO: Geneva, Switzerland, 2006. [Google Scholar]
  57. ISO. ISO 14040 Environmental Management—Lide Cycle Assessment-Principles and Framework; ISO: Geneva, Switzerland, 2006. [Google Scholar]
  58. Masibi, P.; Kannangara, M. NRC open LCA Collaboration Server: Reference Manual; National Research Council of Canada, Energy, Mining and Environment: Ottawa, ON, Canada, 2022; Volume 1. [Google Scholar]
  59. GBA. GBA GHG Rulebook 2022; Global Battery Alliance: Alexandria, VA, USA, 2022. [Google Scholar]
  60. Nickel Institute. How to Determine GHG Emissions from Nickel Metal Class 1 Production; Nickel Institute: Toronto, ON, Canada, 2022. [Google Scholar]
  61. Huijbregts, M.A.; Steinmann, Z.J.; Elshout, P.M.; Stam, G.; Verones, F.; Vieira, M.; Van Zelm, R. ReCiPe2016: A harmonised life cycle impact assessment method at midpoint and endpoint level. Int. J. Life Cycle Assess. 2017, 22, 138–147. [Google Scholar] [CrossRef]
  62. Dai, Q.; Spangenberger, J.; Ahmed, S.; Gaines, L.; Kelly, J.C.; Wang, M. EverBatt: A Closed-Loop Battery Recycling Cost and Environmental Impacts Model; Argonne National Laboratory: Lemont, IL, USA, 2019; p. 88. [Google Scholar]
  63. CER. All Sources of Energy. 2021. Available online: https://www.cer-rec.gc.ca/en/data-analysis/energy-markets/provincial-territorial-energy-profiles/provincial-territorial-energy-prosfiles-quebec.html (accessed on 21 March 2023).
  64. ANL. Nickel Life Cycle Analysis and Additions in the GREET® Model; ANL: Lemont, IL, USA, 2023. [Google Scholar]
  65. Thies, C.; Kieckhäfer, K.; Spengler, T.S. Activity analysis based modeling of global supply chains for sustainability assessment. J. Bus. Econ. 2020, 91, 215–252. [Google Scholar] [CrossRef]
  66. Nickel Institute. Life Cycle Assessment of Nickel Products; Nickel Institute: Toronto, ON, Canada, 2020; p. 119. [Google Scholar]
  67. Kelly, J.C.; Dai, Q.; Wang, M. Globally regional life cycle analysis of automotive lithium-ion nickel manganese cobalt batteries. Mitig. Adapt. Strateg. Glob. Chang. 2020, 25, 371–396. [Google Scholar] [CrossRef]
  68. ANL. GREET; ANL: Lemont, IL, USA, 2022. [Google Scholar]
  69. ANL. Update of the Manganese Pathway in GREET 2021; ANL: Lemont, IL, USA, 2021. [Google Scholar]
  70. ANL. Lithium Pathway Updates and Additions in the GREET® Model; ANL: Lemont, IL, USA, 2020. [Google Scholar]
  71. BNEF. The Cost of Producing Battery Precursors in the DRC; Bloomberg NEF: New York, NY, USA, 2021. [Google Scholar]
  72. Zheng, Z.; Chen, M.; Wang, Q.; Zhang, Y.; Ma, X.; Shen, C.; Wang, Y. High Performance Cathode Recovery from Different Electric Vehicle Recycling Streams. ACS Sustain. Chem. Eng. 2018, 6, 13977–13982. [Google Scholar] [CrossRef]
  73. Ma, X.; Chen, M.; Zheng, Z.; Bullen, D.; Wang, J.; Harrison, C.; Wang, Y. Recycled cathode materials enabled superior performance for lithium-ion batteries. Joule 2021, 5, 2955–2970. [Google Scholar] [CrossRef]
  74. Wagner-Wenz, R.; van Zuilichem, A.J.; Göllner-Völker, L.; Berberich, K.; Weidenkaff, A.; Schebek, L. Recycling routes of lithium-ion batteries: A critical review of the development status, the process performance, and life-cycle environmental impacts. MRS Energy Sustain. 2023, 10, 1–34. [Google Scholar] [CrossRef]
  75. Akhmetov, N.; Manakhov, A.; Al-Qasim, A.S. Li-Ion Battery Cathode Recycling: An Emerging Response to Growing Metal Demand and Accumulating Battery Waste. Electronics 2023, 12, 1152. [Google Scholar] [CrossRef]
  76. Nasser, O.A.; Petranikova, M. Review of Achieved Purities after Li-ion Batteries Hydrometallurgical Treatment and Impurities Effects on the Cathode Performance. Batteries 2021, 7, 60. [Google Scholar] [CrossRef]
  77. Zhang, R.; Meng, Z.; Ma, X.; Chen, M.; Chen, B.; Zheng, Y.; Wang, Y. Understanding fundamental effects of Cu impurity in different forms for recovered LiNi0.6Co0.2Mn0.2O2 cathode materials. Nano Energy 2020, 78, 105214. [Google Scholar] [CrossRef]
  78. Yu, X.; Li, W.; Gupta, V.; Gao, H.; Tran, D.; Sarwar, S.; Chen, Z. Current Challenges in Efficient Lithium-Ion Batteries’ Recycling: A Perspective. Glob. Chall. 2022, 6, 2200099. [Google Scholar] [CrossRef]
Figure 1. High-level description of the three recycling supply chain stages for the battery cathode active materials.
Batteries 09 00375 g001
Figure 2. Key stages of the proposed methodology for benchmarking recycled battery materials.
Batteries 09 00375 g002
Figure 3. EV LIB cathode active material recycling system boundary and high-level process flow diagram.
Batteries 09 00375 g003
Figure 4. System boundary and process flow diagram of cathode active material production from virgin materials: Li, Ni, Mn, and Co.
Batteries 09 00375 g004
Figure 5. Hydrometallurgical solvent extraction process flow diagram. Based on Ref. [49].
Batteries 09 00375 g005
Figure 6. EoL cut-off approach. Boxes indicate main process unit, full arrows mean material flows, and broken arrows indicate spent/scrap materials. Based on Ref. [45].
Batteries 09 00375 g006
Figure 7. Breakdown of global warming potential of the CAM supply chain from recycled battery materials in two Canadian provinces (Quebec and Ontario) with different electricity carbon intensities.
Batteries 09 00375 g007
Figure 8. Recycled content (%) in the cathode active material sensitivity analysis.
Batteries 09 00375 g008
Figure 9. Comparison of net environmental benefits and costs of NMC battery cathode recycling between this and previous published studies. Based on Refs. [19,20,21,22,23,24,27,30].
Batteries 09 00375 g009
Figure 10. Tornado charts of influence on GHG emissions of recycling processing emissions, recycled content in CAM, and recovery rate of precursor cathode active material in the hydrometallurgical recycling process of (a) nickel sulfate, (b) cobalt sulfate, and (c) lithium carbonate.
Batteries 09 00375 g010aBatteries 09 00375 g010b
Figure 11. Comparison of cost and GHG emissions of NMC 811 LIB cathode active material supply chain in different locations. QC—Quebec, ON—Ontario, US—United States, DRC—Democratic Republic of Congo, CH—Chile, AU—Australia. (a,b) for recycled battery materials. (c,d) for virgin materials.
Batteries 09 00375 g011aBatteries 09 00375 g011b
Table 1. Recent studies on LCA and TEA of LIB recycling.
ReferenceRegionSupply Chain Processes at EoL 1Environmental Impact Indicator 2Cost ModelCost IndicatorsRemark 3
[19]ChinaT-D-R11 impact categories, Recipe 2016n/an/aBattery pack
[20]UST-RGWPProcess-based modelRelithiation costsBattery cell, NMC, NCA, LFP
[21]ChinaT-D-RGWP, CED, MDP, HTPn/an/aBattery cell, NMC, LFP
[22]ChinaT-D-RPED, GWP, AP, POCP, EP, HTPn/an/aBattery pack, NMC622
[23]EuropeC-T-D-RGWP, ADP, AP, CED, HTPn/an/aBattery cell, NMC, LFP, NCA, SIB
[24]Germany GWPCost factorsRevenues, profitsBattery pack, NMC
[25]Various D-RGWPn/an/a-
[26]USn/an/aBatPac model, bottom-upCapital and operating costsBattery pack, NMC, NCA, LFP
[27]UKC-T-D-Rn/aEverBatt modelRevenues, profitsBattery cell, NMC
[28]CanadaRn/aProcess simulation, bottom-upCapital and operating costsBlack mass, NMC
[29]BrazilD-Rn/aBusiness modelCapital and operating costsBattery pack, NMC
[30]UKRn/aEverBatt modelRevenues, profitsBattery pack, NMC, NCA, LFP, LMO
1 C: collection; T: transportation; D: dismantling; R: recycling. 2 GWP: global warming potential; CED: cumulative energy demand; MDP: mineral depletion potential; PED: primary energy demand; AP: acidification potential; POCP: photochemical oxidant creation potential; EP: eutrophication potential; ADP: abiotic resource depletion potential; HTTP: human toxicity potential. 3 NMC: lithium nickel manganese cobalt oxide; LFP: lithium iron phosphate; NCA: lithium nickel cobalt aluminum oxide; SIB: sodium-ion battery.
Table 2. Mass balance of the hydrometallurgical recycling process with solvent extraction.
InputAmount (kg/h)OutputAmount (kg/h)
Sulphuric acid (98 wt%)4000Nickel sulfate1940
Lime1220Cobalt sulfate460
Sulphur dioxide320Manganese sulfate42
Magnesia520Lithium carbonate 380
Sodium hydroxide (pellets)66Reductive acid leach residue disposal1060
Sodium carbonate (100 wt%)2200Primary neutralization residue disposal880
Flocculant0.58Manganese and magnesium residue3200
Fresh water makeup7200Mixed hydroxide precipitation residue220
Makeup DEHPA82Glauber salt8400
Makeup C27228Brine discharge420
Makeup diluent840Total17,002
Miscellaneous consumables525
Total17,002
Table 3. Total LIB recycling capital cost.
DescriptionValue, kCAD
Total Direct Cost 1 [A]126,122
Total Indirect Cost 2 [B = 30% × A]37,837
Total Cost [A + B]163,959
Contingency 3 [C = 30% × (A + B)] 49,188
Owner’s Cost Excluded
Total Project Cost [A + B + C]213,146
1 Direct costs are the costs associated with procurement, installation, and construction of all permanent equipment and facilities, including but not limited to all equipment, materials, and infrastructure, site preparation (earthworks, roads), buildings, utilities, and distribution systems. 2 Indirect costs are the costs associated with procurement (or rent), installation, and construction of all temporary equipment, facilities, and services, including but not limited to lodging, warehouses, freight, first fills, EPCM and third-party engineering, vendor representatives, start-up, and commissioning. 3 Contingency is an integral part of the cost estimate which accounts for additional expenses to be incurred during execution of the project’s scope. Contingency covers items that cannot be explicitly defined at the current level of the project definition. It should be assumed that the contingency amount will be spent.
Table 4. Total LIB recycling operating cost.
DescriptionCAD/y
Reagent50,260,153
Shipping and Disposal 19,325,384
Labour12,041,607
Other 25,872,877
Contingency 37,749,734
Total85,249,755
1 Includes a fixed rate for sulfates and lithium carbonate packaging and shipping. A disposal rate for inert residues and Glauber salt is added. Black mass collection and transportation are not included. 2 Includes natural gas, power, maintenance (2.5% of capital cost), and supplies. 3 Ten percent of total operating cost per year.
Table 5. Baseline comparison of virgin and recycled battery materials. Parameter: cathode material manufacturing cost (CAD/kg CAM).
UpstreamMidstreamDownstreamOverall
Transportation 1Recycling 2Conversion (Precursor CAM) and Refining (CAM) 3
Recycled battery materials—QC1.80 × 10−110.641.214.9
Mining, beneficiation, and refining 4Conversion (precursor CAM) and refining (CAM) 5Overall
Virgin materials—China13.615.028.6
1 Transportation cost from battery collection sites to dismantling facilities through recycling facility [13]. 2 Recycling processing cost of precursor cathode active materials. 3 Battery precursor cathode material and cathode active material production costs in North America from EverBatt tool. 4 Mining, beneficiation, and refining of raw material costs obtained from EverBatt tool. 5 Battery precursor cathode material and cathode active material production costs in China from EverBatt tool.
Table 6. Baseline comparison of virgin and recycled battery materials. Parameter: cathode material manufacturing life cycle GHG emissions (kg CO2e/kg CAM).
UpstreamMidstreamDownstreamOverall
Transportation 1Recycling 2Conversion (Precursor CAM) and Refining (CAM) 3
Recycled battery materials—QC5.51 × 10−26.544.33109
Mining, beneficiation, extraction, and refining 4Conversion (precursor CAM) and refining (CAM) 5Overall
Virgin materials—China0.012411.50238
1 Transportation GHG emissions from battery collection sites to dismantling facilities through recycling facility [13]. 2 Recycling processing GHG emissions of precursor cathode active materials. 3 Battery precursor cathode material and cathode active material production GHG emissions estimated using openLCA software. 4 Mining, beneficiation, and refining of raw material GHG emissions in China obtained from EverBatt tool. 5 Battery precursor cathode material and cathode active material production GHG emissions in China from EverBatt tool.
Disclaimer/Publisher’s Note: The statements, opinions and data contained in all publications are solely those of the individual author(s) and contributor(s) and not of MDPI and/or the editor(s). MDPI and/or the editor(s) disclaim responsibility for any injury to people or property resulting from any ideas, methods, instructions or products referred to in the content.

