Article

Predicting Ionic Conductivity in Thin Films of Garnet Electrolytes Using Machine Learning

by
Natalia Kireeva
1,*,
Aslan Yu. Tsivadze
1 and
Vladislav S. Pervov
2
1
Frumkin Institute of Physical Chemistry and Electrochemistry RAS, Leninsky Prosp, 31, Moscow 119071, Russia
2
Kurnakov Institute of General and Inorganic Chemistry RAS, Leninsky Prosp, 31, Moscow 119071, Russia
*
Author to whom correspondence should be addressed.
Batteries 2023, 9(9), 430; https://doi.org/10.3390/batteries9090430
Submission received: 21 May 2023 / Revised: 19 July 2023 / Accepted: 16 August 2023 / Published: 22 August 2023

Abstract

:
All-solid-state batteries (ASSBs) are the important attributes of the forthcoming technologies for electrochemical energy storage. A key element of ASSBs is the solid electrolyte materials. Garnets are considered promising candidates for solid electrolytes of ASSBs due to their chemical stability with Li metal anodes, reasonable kinetic characteristics ( σ L i ∼ 10 3 –10 4 S · cm 1 ) and a wide electrochemical window. This study is aimed at the analysis of the experimental data available for garnet thin films, examining the ionic conductivity through the film/substrate lattice mismatch, the elastic properties and the difference in the thermal expansion characteristics of the film and the substrate, the deposition temperature of the film, and the melting point and the dielectric constant of the substrate. Based on the results of this analysis and by introducing the corresponding characteristics involved as the descriptors, the quantitative models for predicting the ionic conductivity values were developed. Some important characteristic features for ion transport in garnet films, which are primarily concerned with the film/substrate misfit, elastic properties, deposition temperature, cation segregation and the space charge effects, are discussed.

1. Introduction

One of the basic elements of the electrochemical energy storage solutions of the near-term future is the all-solid-state batteries (ASSBs) [1,2,3]. These technologies can be considered as one of the most satisfying a demand systems of the new generation, offering enhanced safety [4,5,6].
Among the most investigated solid electrolytes, garnet-structured compounds Li x La 3 M 2 O 12 [7,8,9,10] attract considerable attention. These compounds exhibit a number of attractive characteristics such as a wide electrochemical window, possible compatibility with Li metal anodes as well as adequate transport characteristics. They are known to have the following polytypes: two cubic and one tetragonal (Figure 1). The tetragonal polymorph of the space group I4 1 /acd is characterized by the complete Li ordering, where Li occupies all three different available sites: 4-coordinated 8a site, two octahedral—16f, and 32g sites. The cubic polymorph (c-LLZO) is characterized by a disordered Li distribution: Li + partially occupies the sites with tetrahedral (24d) and octahedral coordination (48g and 96h), where Li cations are located depending on the Li content and the composition of the garnet structure. This difference results in Li-ion conductivity of the cubic polymorph that is about two orders of magnitude higher. Usually, the stabilization of the superionic phase is achieved through the aliovalent doping [11]. Alternatively, the superionic phase can be stabilized by Li deficiency [12] or by proton exchange [13]. Accordingly, based on the experimental data, the obtaining of c-LLZO garnet films with no doping, which has been performed in a number of studies, may be explained as a consequence of the Li loss [14] or as the result of the strain stabilization.
This study is aimed at the analysis of the collected experimental data on the Li-ion conductivity in garnet films considering a number of affecting factors. One of them is the strain influence. In recent decades, strain engineering was explored as an effective way to modulate material properties [16,17,18,19]. Thus, strain engineering was successfully applied for tuning the band structure [20,21], in valleytronics [22], for tuning ferroic properties [17,23,24], phase stabilization and transitions [25,26,27,28,29], Li ion [30,31,32,33] and oxygen ion [18,34,35,36,37] conductivity control.
The conductivity values in the films are highly dependent on the interaction between the film and substrate materials. Achieving a coherent connection can be facilitated by avoiding large misfit values, utilizing materials with closely matched elastic characteristics, mitigating the negative effects of space charge layer formation [38,39,40,41], and minimizing substantial differences in thermal expansion coefficients. In [40], Joachim Maier emphasized, “As Frenkel [42] has already pointed out, and as was quantified very early in the electrochemistry of liquid electrolytes, deviations from local electroneutrality and, consequently, from bulk stoichiometry occur in regions close to the surface… This implies that the thermodynamic equilibrium must consider surface-surface interactions (transport of the cation from the free to the contacted surface)”. Additionally, many of the oxides employed as solid-state electrolytes possess lithiophobic surfaces with uneven morphologies [28]. Thus, even post-annealing treatments can enhance Li-ion transport characteristics at the interfaces. Such treatments might focus on the transformation from lithiophobicity to lithiophilicity [43,44] or enhancement of characteristics through voltammetric methods [45]. Among recent studies potentially valuable not only for investigation but also for modulating grain boundaries, the work of Reichert et al. [46] should be mentioned. The latter could be of principal importance for various reasons. An illustration is provided in Figure 2, where the variation in migration energy barrier is depicted for grain boundaries containing amorphized domains compared to those with a non-amorphized structure [47].
The questions regarding the role of amorphization processes in garnet solid electrolyte thin films have been discussed in various studies, yielding, however, conflicting conclusions [5,48,49]. This inconsistency in the provided results is evidently associated with the complexity of the processes occurring at the interfaces. In [50], the authors delve into the relationship between the presence and interaction of defects at incommensurate interfaces with low-melting fusibility (leading to the formation of eutectic non-autonomous phases). This phenomenon can be attributed to the significant weakening of bonds within interacting substructures. It is known from the T-x diagrams that the highest concentration of discontinuities of solid solutions generally corresponds to the melting point of eutectic compositions [51].
Through an analysis of the very limited experimental data available for garnet thin films, certain characteristics impacting Li-ion conductivity were identified. Among the parameters influencing Li-ion conductivity in garnet thin films, one can distinguish film/ substrate misfit, the elastic properties of both the film and substrate, differences in their thermal expansion characteristics, deposition temperature, dielectric constant of the substrate, as well as the compound composition. The machine learning approaches involved in this study, namely Long Short-Term Memory (LSTM) neural networks and probabilistic backpropagation Bayesian neural networks (PBP), have demonstrated the potential for addressing problems with very limited available data.
One of the most important conclusions of this study is the emphasized role of (i) the elastic properties of the film and the substrate with the defined range of values for the elastic characteristics that correspond to the enhancement of ionic conductivity values, (ii) the ratio of the melting point of the substrate and the deposition temperature, (iii) the dielectric constant of the substrate, as well as (iv) the cation segregation-related processes as the characteristics which came to the fore as a result of the analysis of the experimental data available.

2. Materials and Methods

2.1. Methodology

Artificial neural networks are among the most popular machine learning methods, with an ever-growing interest in their methodology directly associated with the principles of human-level reasoning [52]. Recurrent Neural Networks (RNNs) are artificial deep learning feed-forward neural networks that transmit information across different time steps through connections between the hidden layers of the individual nets composing the RNN. This allows the weights of these connections to be shared over time. RNNs, as an efficient type of neural networks, have several modifications. One of the most known types of RNNs is the Long Short-Term Memory Neural Networks (LSTM) [53,54]. This modification is widely acknowledged for its ability to preserve valuable information across the time, thus preventing its loss during the training process. It consists of a set of recurrently connected memory cells that replace the conventional nonlinear units of an RNN. These memory cells contain three types of gates organized in a single general unit: input, output, and forget units. This architecture allows the storage of information over a prolonged period of time, in contrast to the simple RNN architecture characterized by gradient vanishing during the training.
The input vectors x i t with descriptor values are presented to the cell. Subsequently, the cell can activate one of the mechanisms depending on the training data already seen and currently considered: the input gate can remain closed, the input data can be transferred to the training while preserving the cell state C t , or the forget option (activated by the forget gate f t ) can reset the cell state vector to zero. Finally, the cell state can be shared with the hidden layer of the next network, or used exclusively for the current output gate (Figure 3a).
For the forward pass of the LSTM neural network, w i h represents the weight of the connection from unit i to the unit in the hidden layer. The input to the unit in the hidden layer at time t is denoted as a t j , and the activation of unit h at time t is b h t . The equations in Figure 2a are presented for the network comprising I input units, H hidden units, and K output units. Nonlinear and differentiable activation functions are assumed.
The parameters of LSTM were optimized using Bayesian optimization methods. Bayesian optimization [55,56,57] is an efficient approach for optimizing black-box functions. Bayesian optimization techniques consist of three consecutive and repeated steps: (i) using the prior to define the point for function evaluation, (ii) evaluating the function f(x) value at this point, (iii) updating the prior with the new data <x, f(x)>. Surrogate acquisition functions are used for the first step, which are introduced to replace the unknown black-box functions evaluating the value of the function at a given point. The most widely used acquisition functions are: (i) improvement-based (Probability of Improvement (PI), Expected Improvement (EI)), (ii) optimistic (Upper Confidence Bound (UCB)), (iii) information-based (Thompson sampling (TS), Entropy Search (ES), Predictive Entropy Search (PES)) [55]. The approximation of the function values usually involves Gaussian Processes as the most popular methodology or alternative probabilistic methods which allow to introduce the prior probability.
The second approach is the Probabilistic Backpropagation Bayesian Neural Networks (PBP) [58] (Figure 3b). Given data D = {x n ,y n } n = 1 N , where x n R D and corresponding scalar variables y n R , y n = f(x n ; W ) + ϵ n , where f(·; W ) is the output value with weights given by W and noise variables ϵ n .
The likelihood of target variable given weights W and noise precision γ :
p ( y | W , X , γ ) = n = 1 N N ( y n | f ( x n ; W ) , γ 1 )
PBP does not use the point estimates of the weight during the training process instead the set of the Gaussians is generated during the training process in order to approximate the activations:
p ( W | λ ) = l = 1 L i = 1 V l j = 1 V l 1 + 1 N ( w i j , l | 0 , λ 1 )
where w i j , l is the weights and λ is a precision parameter. The details on how the prior for λ is chosen are given in the original publication.
The posterior distribution for the parameters W , γ and λ can then be obtained according to Bayes’ rule as follows:
p ( W , γ , λ | D ) = p ( y | W , X , γ ) p ( W | λ ) p ( λ ) p ( γ ) p ( y | X )
The output predictions are performed using predictive posterior distribution:
p ( y t a r g e t | x t a r g e t , D ) = p ( y t a r g e t | x t a r g e t , W , γ ) p ( W , γ , δ | D ) d γ d λ d W
where p(y t a r g e t |x t a r g e t , W , γ ) = N (y t a r g e t |f(x t a r g e t ), γ ).
At the end of the forward stage, PBP computes the logarithm of the marginal probability of the target variable. In the second phase, the network propagates the gradient of this quantity with respect to the means and the variances of the approximate Gaussian posterior, which are finally used to update the corresponding values of the means and the variances of the posterior approximation of the Gaussians. The update rule used by PBP is not a standard. Let f(w) correspond to an arbitrary likelihood function for the weights. The weights are updated according to the Bayes’ rule:
s ( w ) = Z 1 f ( w ) N ( w | m , v )
where Z is the normalization constant. Updated values for the mean and the variance are obtained using the gradient of the logarithm of the normalization constant Z:
m n e w = m + v l o g Z m
v n e w = v v 2 l o g Z m 2 2 l o g Z v
The Shapley explainability [59] analysis has been used in this study to evaluate the contribution of the data descriptors. The Shapley value [60]-based analysis is the method adopted from cooperative game theory. This approach evaluates the distribution of the gain earned by the team among its members. In regression, one may interpret it as the value of the dependent parameter, while the individual members of the game are the descriptors (independent variables) involved in the modeling. The evaluated global Shapley value Φ f (i) can be considered as the part of the model’s accuracy associated with the individual descriptors and can be defined as:
i N Φ f ( i ) = E p ( x , y ) [ f y ( x ) ]
where p(x,y) is the labelled data distribution, f y (x) is the model’s predicted value, and N is the number of features. The local Shapley values correspond to the explainability of the features on data point x:
ϕ v ( i ) = N i | S | ! ( n | S | 1 ) ! n ! [ v ( S i ) v ( S ) ]
The feature values are added one at a time, averaged over all orderings the team is picked.

2.2. Computational Procedures

The leave-one-out procedure is used for the validation of models. For the optimization of the model’s parameters, the validation compounds were separated from the training set.
The Spearmint-PESC package was used for the Bayesian optimization of LSTM parameters: the number of neurons, the dropout value, and the number of epochs were subjected to optimization. The parameters were optimized within the defined range using the Predictive Entropy Search (PES) [61] acquisition function: the number of neurons was varied from 5 to 100, the dropout was varied in the entire range from 0.0 to 1.0, and the number of epochs was varied from 80 to 500. As a result of the optimization, LSTM was used as it is realized in the Keras library with the following parameters: the dropout = 0.06, the batch size = 1, the number of epochs in training = 3200, the number of neurons = 12.
For PBP, the following parameters of the methods were used: the number of hidden units = 5 and the number of epochs is 100.
These two best models were used for target property prediction both individually and jointly. The ensemble prediction, where the ionic conductivity value for each of the predicted compounds was assessed as the average value between the predictions made by these two approaches, showed the best performance.

3. Results and Discussion

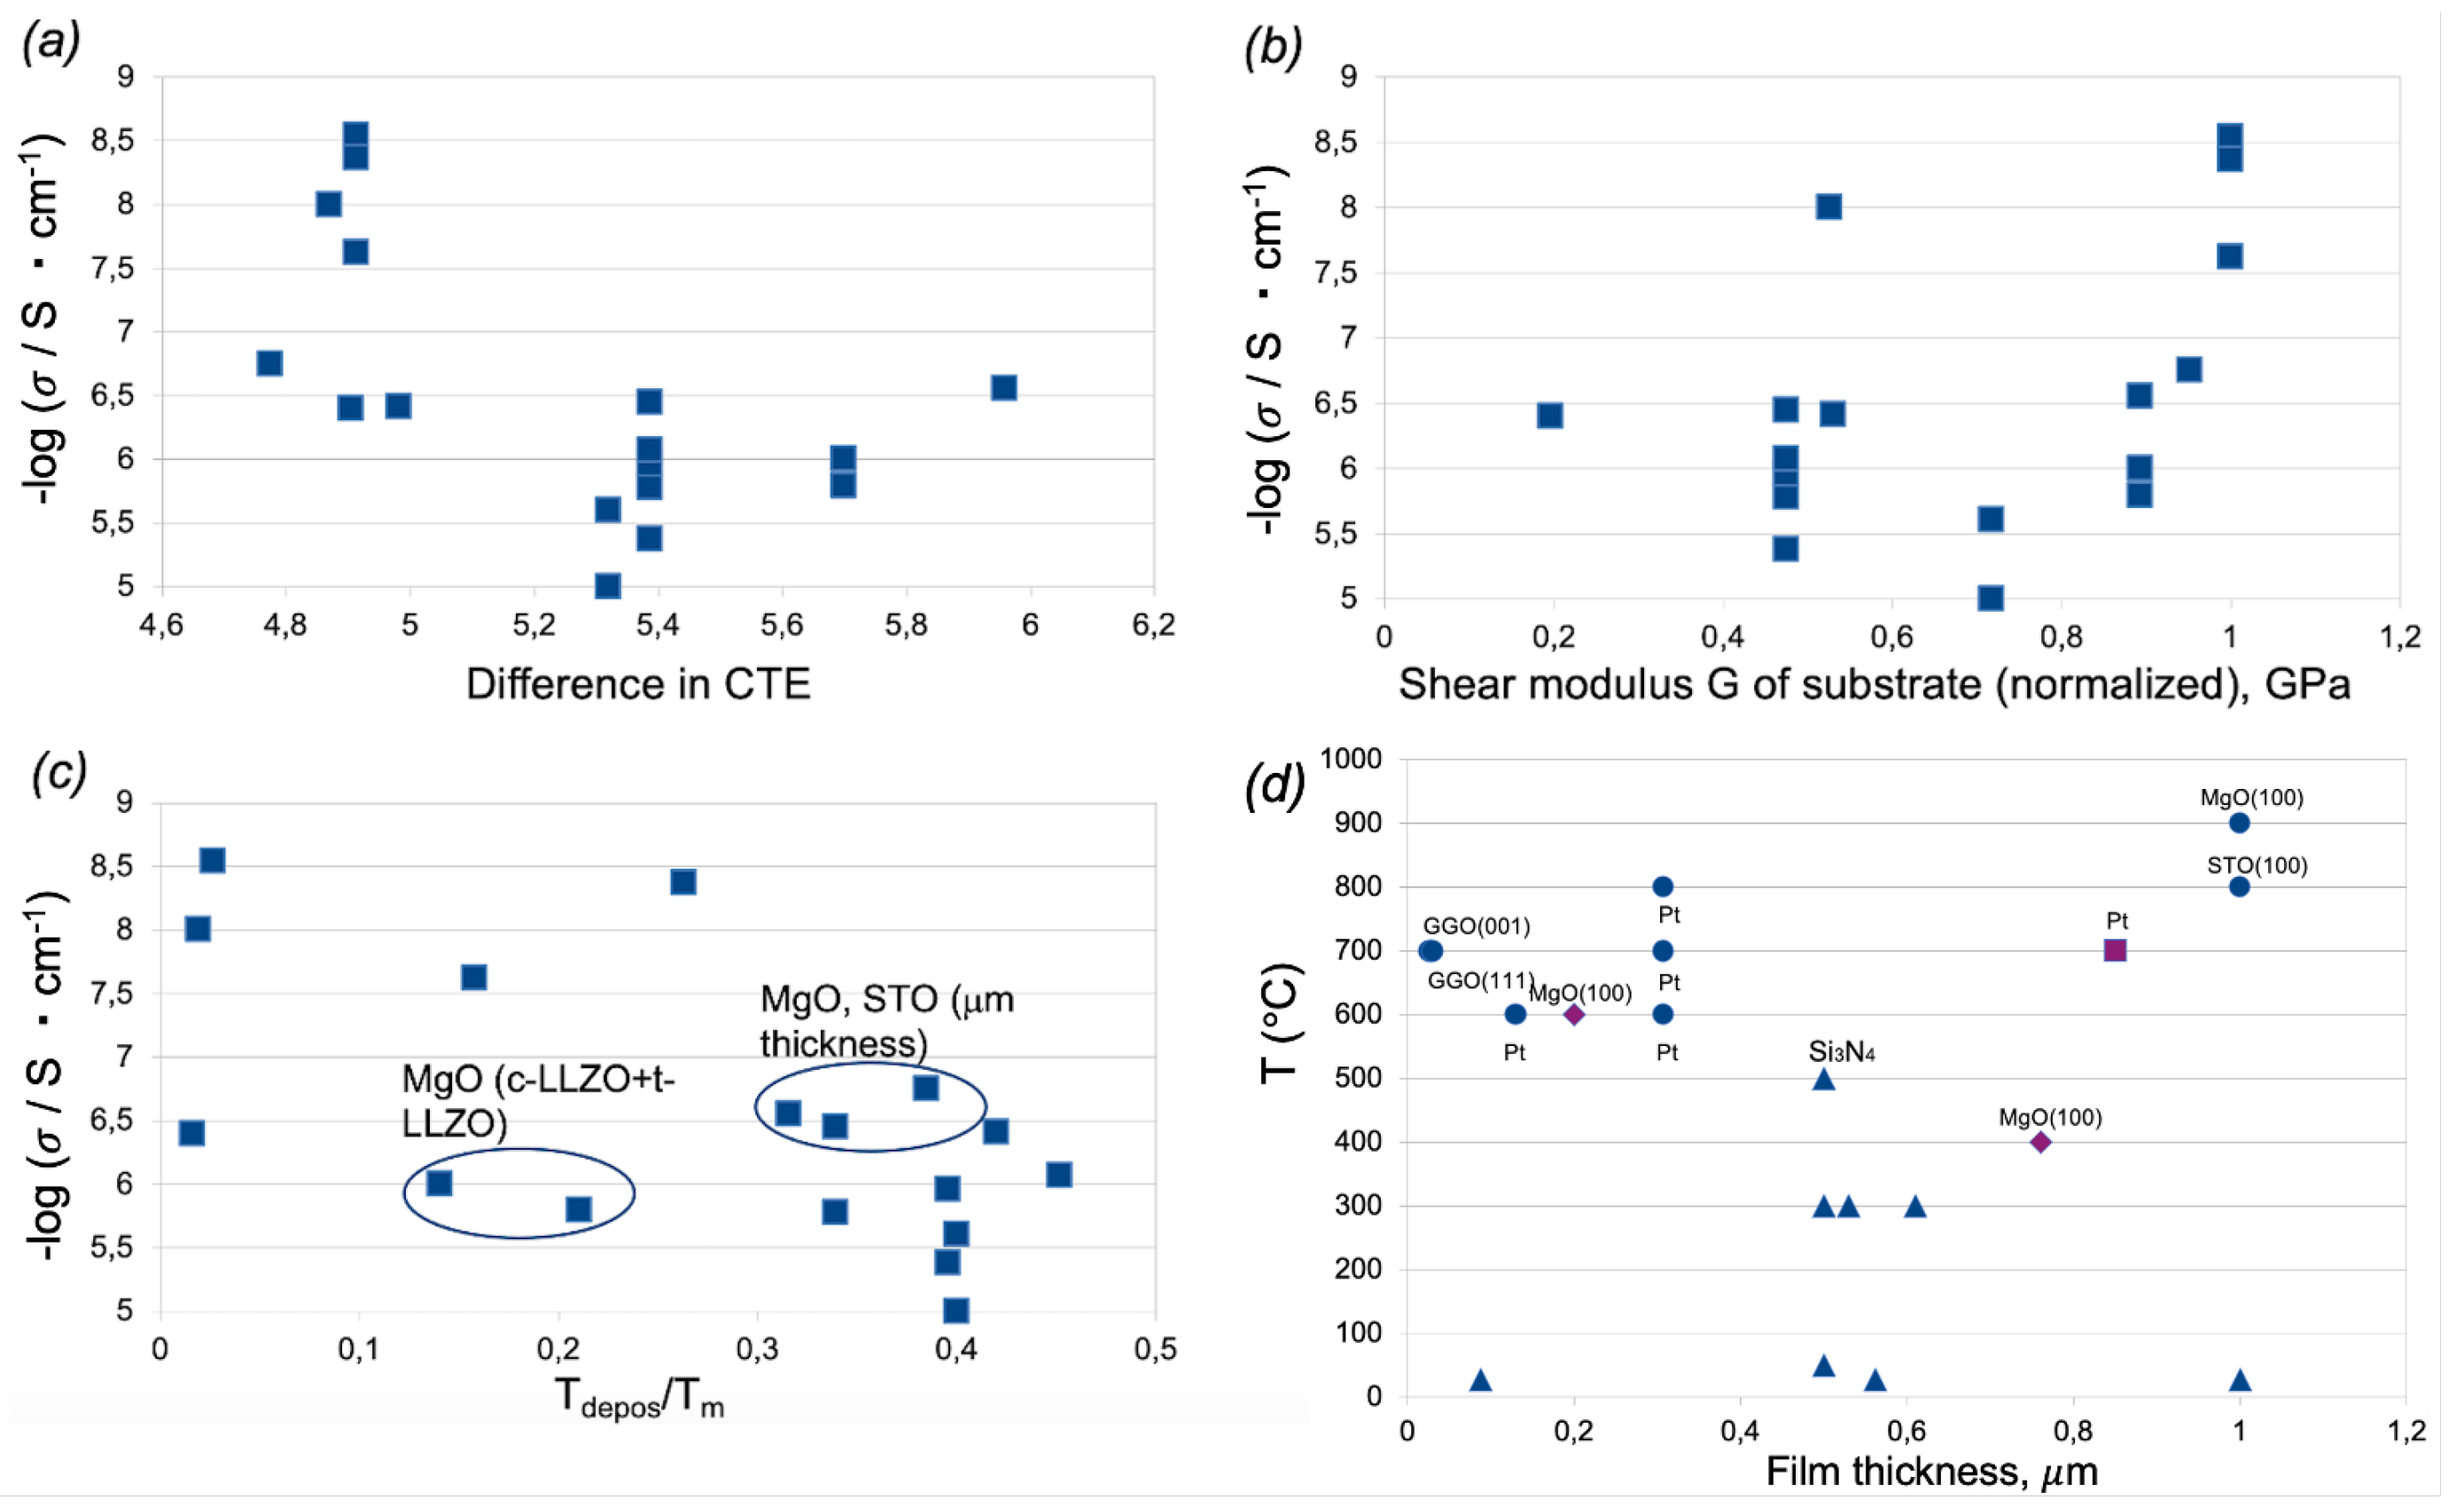
3.1. Analysis of Experimental Data on Ionic Conductivity Values in Garnet Thin Films

The experimental data on Li-ion conductivity values in garnet films are very limited in comparison to those related to the bulk structures. The collected data comprise the information on twenty-nine garnet films. The information includes composition, deposition method, processing history, obtained type of structure (with cubic or tetragonal symmetry or amorphous), film thickness, and conductivity values (see Table 1).
One can see that garnet films were obtained with a variety of deposition methods, including sol-gel, pulsed laser deposition (PLD), radio frequency (RF) magnetron sputtering, and chemical vapor deposition (CVD). Deposited films represent all possible variants of the structure: the cubic polymorph (c-LLZO), the tetragonal polymorph (t-LLZO), their mixture, as well as the amorphous phases.
The substrates are represented quite narrowly by compounds of three space groups of symmetry of crystal structures, Pm 3 ¯ m, Fm 3 ¯ m, and Ia 3 ¯ d, and are represented by several amorphous and crystalline substrates: Si, Si oxides and nitrides, Pt, titanates, and ruthenates of Sr 2 + , MgO, ITO, and Gd3Ga5O 12 are used. The lattice constants, elastic properties, coefficients of thermal expansion, and dielectric constants of the substrates are given in Table 2.

3.2. Models of Strain

The strain-induced effects observed in most cases of the contacts of two interfaces, when one of them is a thin film (we avoid considering extreme cases like van der Waals-type interactions, e.g., muscovite mica [77]), are the most viable way to flexibly modulate the properties of thin films. Several models describing the strain mechanisms in the films are acknowledged in the literature [78].
The Matthews–Blakeslee equilibrium model [79] describes stress as a function of the film thickness h, Burgers vector b, shear modulus G, Poisson ratio ν , dislocation geometry α (the angle between the dislocation line and its Burgers vector), and λ (the angle between the direction of the slip plane and the direction perpendicular to the intersection of the slip plane and the interface). According to this model, the interface structure is affected by two forces: (i) the force resulting from the misfit strain and (ii) the force from the tension in the dislocation line:
F ϵ = 2 G ( 1 + ν ) ( 1 ν ) b h ϵ cos λ
F l = G b 2 4 π ( 1 ν ) ( 1 ν cos 2 α ) ( l n h b + 1 )
The second model is the Matthews, Mader and Light kinetic model [80]:
F = β [ 1 e x p ( α ) ]
α = 2 G b 3 ρ ( 1 + ν ) cos Φ cos 2 λ D 0 e x p ( U / k T ) ( 1 ν ) k T
β = f [ b ( 1 ν cos 2 Θ ) / 8 π h ( 1 + ν cos λ ) ] l n h b
where ρ is the dislocation density, cos Θ and cos λ are dislocation geometry parameters, G is the shear modulus in GPa, D 0 represents diffusion coefficients for dislocations, and U is the activation energy in eV.
This model extends the system’s description by introducing thermodynamic and kinetic parameters, as well as accounting for dislocation density. This makes it possible to neglect the system’s equilibrium requirements and take into account time-dependent changes and deposition rate.
Both models are based on calculations published earlier in the study by Frank and van der Merwe [81]. The model proposed by Cammarata et al. extends the description to include the impact of surface free energy, volume elastic energy of the film, and reduction in interfacial free energy (Cammarata, Sieradzki, and Spaepen model [82,83]).
One of the classical models, the Prandtl-Tomlinson model [84], also known as the Frenkel–Kontorova model [85,86] (the model was independently introduced by two different groups, thus, in the literature, both names can be found), serves as the basis for describing a wide spectrum of problems in various fields of condensed matter science [87]. One of the applications of the Frenkel–Kontorova model aligns with the strain-related behavior in film/substrate systems and relates to describing processes investigated in inorganic supramolecular chemistry of misfit and eutectic inorganic compounds. Here, the misfit-induced processes significantly affect the system’s behavior, self-organization, and physical properties [88,89]. This extended model describes a one-dimensional chain placed in a periodic potential and introduces the incommensurability parameter γ = b/h (where b is the bond length of the free chain and h is the period of the potential), the number of chain bonds N, and the energy parameter Z = 2 π A/(kh 2 ) (where k is the parameter characterizing the elasticity of the chain, and A is the amplitude of the periodic potential) [90] (Figure 4).
These model parameters were studied for their impact on the probability of chain fragmentation for specific misfit values and characteristic energies. This model offers a solid foundation for considering potential chemical interactions between the substrate and the films.
Extending the Prandtl–Tomlinson (Frenkel–Kontorova) model to describe epitaxial strain in the films, the film is depicted as a spring subjected to an external periodic potential. Here, the spring constant corresponds to the elastic characteristics of the film, and the potential well depth corresponds to those of the substrate. Further extending this model and incorporating theoretical results from [91], this potential well depth can be employed to describe the film-substrate adhesion.
In subsequent models developed in this field, particular emphasis has been placed on the misfit values of the lattice constants of the film and the substrate. In another study [91], the authors, drawing from experimental data on the application of interfacial stress, introduced structural phase diagrams with film thickness and lattice misfit as the main parameters. This allowed them to differentiate regions of coherent and incoherent stable and pseudomorphic structures, along with the area of strain spinodal decomposition for strong and weak substrate adhesion. Two modes of film growth are distinguished: (i) Stranski–Krastanov (SK) and (ii) Volmer–Weber (VW). The latter involves the nucleation of solid clusters from the vapor phase (resulting in island-like formation of the film), while the former represents a compromise between VW and Frank van der Merwe growth types. The former provides two-dimensional growth, allowing the formation of a monolayer when atoms from layer N-1 are fully deposited before layer N starts forming.

3.3. Descriptors Refinement

The models developed in this study are based on introducing specific parameters that describe the objects and details of the deposition process, which are hereafter referred to as descriptors. These descriptors establish a connection between the introduced characteristics and Li-ion conductivity. The experimental methods for obtaining garnet films are quite diverse, and this diversity, combined with the limited available data, makes it challenging to quantitatively describe much of the information related to film growth. In Figure 5, Li-ion conductivity is plotted as a function of several parameters that were selected following preliminary data analysis. These parameters include the difference in coefficients of thermal expansion (a), the shear modulus of the substrate (b), and the ratio of the deposition temperature to the melting point of the substrate (c). A similar trend with the shear modulus was observed for both the film and the substrate materials in terms of Pugh’s ratio.
Based on the analysis of the experimental data, it can be assumed that there is a range of values for the elastic characteristics of the substrate materials (e.g., within the range of shear modulus G values) for which the physical contact between the film and substrate is optimal (Figure 5b).
The conducted analysis of the impact of the T d e p o s /Tm ratio reveals the following observations: (i) enhanced conductivity values can be distinguished in garnet thin films deposited on ITO and MgO substrates. In the case of the MgO substrate, the thin films (with thicknesses of 200 and 760 nm) exhibited two phases, tetragonal and cubic, as a result of deposition (Figure 5d; shown with diamond markers), (ii) an increase in the film’s thickness may also be responsible for the stabilization of alternative phases, as observed for the Pt substrate, where the tetragonal polymorph was present due to film deposition (Figure 5d; t-LLZO is shown with square markers).
The parameters that were initially considered as descriptors during the preliminary search are as follows: (i) the film thickness, (ii) the misfit between the film and substrate materials, (iii) the deposition temperature (inverse value), (iv) the difference in thermal expansion coefficients between the film and the substrate, (v) the ratio of the deposition temperature to the melting point of the substrate, (vi) electronegativities for the substrate and film cations (considered individually or as a ratio), (vii) the shear modulus, (viii) parameters evaluating the elastic properties of the film and the substrate (please refer below), (ix) Pugh’s ratio, (x) the product of the ratio of elastic characteristics of the substrate and the thickness of the film, as well as the deposition temperature and the difference in coefficients of thermal expansion between the substrate and the film (please refer to the parameter accounting for thermally-induced macro-strain), (xi) the dielectric constant of the substrate, and (xii) the working pressure during the process of film deposition.
The final set of descriptors includes seven parameters: (i) inverse deposition temperature, (ii) ratio of the deposition temperature to the melting point of the substrate, (iii) normalized shear modulus, (iv) the elastic properties of the film, described as follows: E ( 1 ν ) h , where E, in GPa, represents Young’s modulus (characterizing materials’ stress-strain relationships), h is the film thickness, and ν is Poisson’s ratio (the ratio of transverse contraction or strain to axial strain), (v) the misfit value, (vi) the dielectric constant of the substrate, and (vii) the product of the following three parameters: ratio of the elastic characteristics of the substrate and the thickness of the film, the deposition temperature, and the difference in the coefficients of thermal expansion between the film and substrate materials (accounting for thermally-induced macro-strain): E substrate ( 1 ν substrate ) h film · T depos · Δ CTE (substrate-film).
The importance of considering the ratio of the deposition temperature to the melting point is determined by several factors: first, if this ratio is below one-third, it implies that dislocation movement is the dominant mechanism of plastic deformation, making misfit value, elastic characteristics, and film thickness values even more crucial [92]; second, the likelihood of secondary phase formation and reactions at the interfaces significantly increases (this assumption is valid at least for Ta-doped LLZO compounds deposited on Si 3 N 4 substrate); third, due to the previous point, the ratio of the deposition temperature to the melting point of the substrate becomes an important factor describing the possibility of achieving a coherent interface between two contacting surfaces.
Surprisingly, using the film thickness as the individual descriptor parameter was insufficient. This result should be considered as an artifact related to the experimental data available. Based on the available misfit data, one can infer a positive impact from the presence of compressive strain. In the context of this study, it is notable that the majority of the experimental data regarding garnet films are situated within the region of coherent stable interfaces.
Based on the experimental data, one can identify the c-LLZO garnet film deposited on Pt substrates using LA-CVD deposition. Despite the misfit value of 8%, the conductivity is not as high as anticipated from other experimental data for c-LLZO. Thus, the compound with a tetragonal structure and a close misfit value (9% misfit) exhibits superior kinetic characteristics. This discrepancy can be explained by the film thickness of c-LLZO exceeding 1 μ m.
For the c-LLZO film deposited on the STO substrate, one can assume the substantial contribution of Ti redox processes leading to the formation of a space charge layer due to the interaction of the redox center with the oxygen vacancies formed as a result of the high-energy sputtering process. This assumption is supported by the findings in [93]. It was demonstrated that the binding of Li becomes less energetically favorable with an increase in oxygen vacancies at the surface, which can have a negative impact on the film-surface contact and, consequently, on Li-ion conductivity.
When analyzing the effect of substrate composition, one can highlight the following observations. The c-LLZO film deposited on SrRuO 3 is characterized by a film thickness in the micrometer range (4.3 μ m) along with enhanced ionic conductivity. Possible explanations for this behavior are associated with the substrate composition, which might assist in stabilizing lattice oxygen at the film surface, thereby preventing the formation of oxygen vacancies and subsequent space charge formation. In Li-rich layered oxide cathode materials, Ru is known to play a stabilizing role in oxygen redox processes [94,95].
Figure 5a represents the difference in the coefficient of thermal expansion that reflects the thermally induced contribution to the macrostrain of the films. The smaller difference corresponds to higher Li-ion conductivity values.
Analyzing the elastic characteristics of the substrate and the film compounds, it is possible to suggest the existence of a certain range of elastic modulus values for the substrate (shear modulus, Young’s modulus, or Pugh’s ratio) that are close but not identical to those of the film, resulting in enhanced conductivity (Pugh’s ratio for the considered garnet compounds is approximately 1.72). However, these obtained values differ from the widely accepted recommendations for similar elastic properties of film and substrate materials [96].
For two LLZO films, high ionic conductivity values could be attributed to tin segregation. The positive effect of Sn on Li-ion conductivity might be related to the functionalization of grain boundaries (GBs) through intermediate phase formation. Several studies have revealed Sn segregation in ITO films at high temperatures. In [97], it was demonstrated that SnO2 films interact with the LLZTO garnet structure at 200 °C, leading to the formation of LixSn and Li 2 O. This interaction significantly enhances the contact between the two phases, reducing interfacial resistance (from 1100 to 25 Ω cm 2 ) and transforming the interface from lithiophobic to lithiophilic. Similar processes can be assumed in the case of Sn segregation.
Conversely, the opposite trend, presumably for the same reasons, is observed with Si contribution. Si can easily interact with substrate materials, forming secondary insulating SiO 2 phases.
It is noteworthy that for the Gd3Ga5O 12 (GGG) substrate, the high conductivity values can be explained by the substrate adopting the same structure type as the garnet cubic polymorphs of the films (affected by microstructure and texture), nanosize effects [98], as well as the dominant contribution of interface conductivity due to the film thickness of approximately 30 nm.

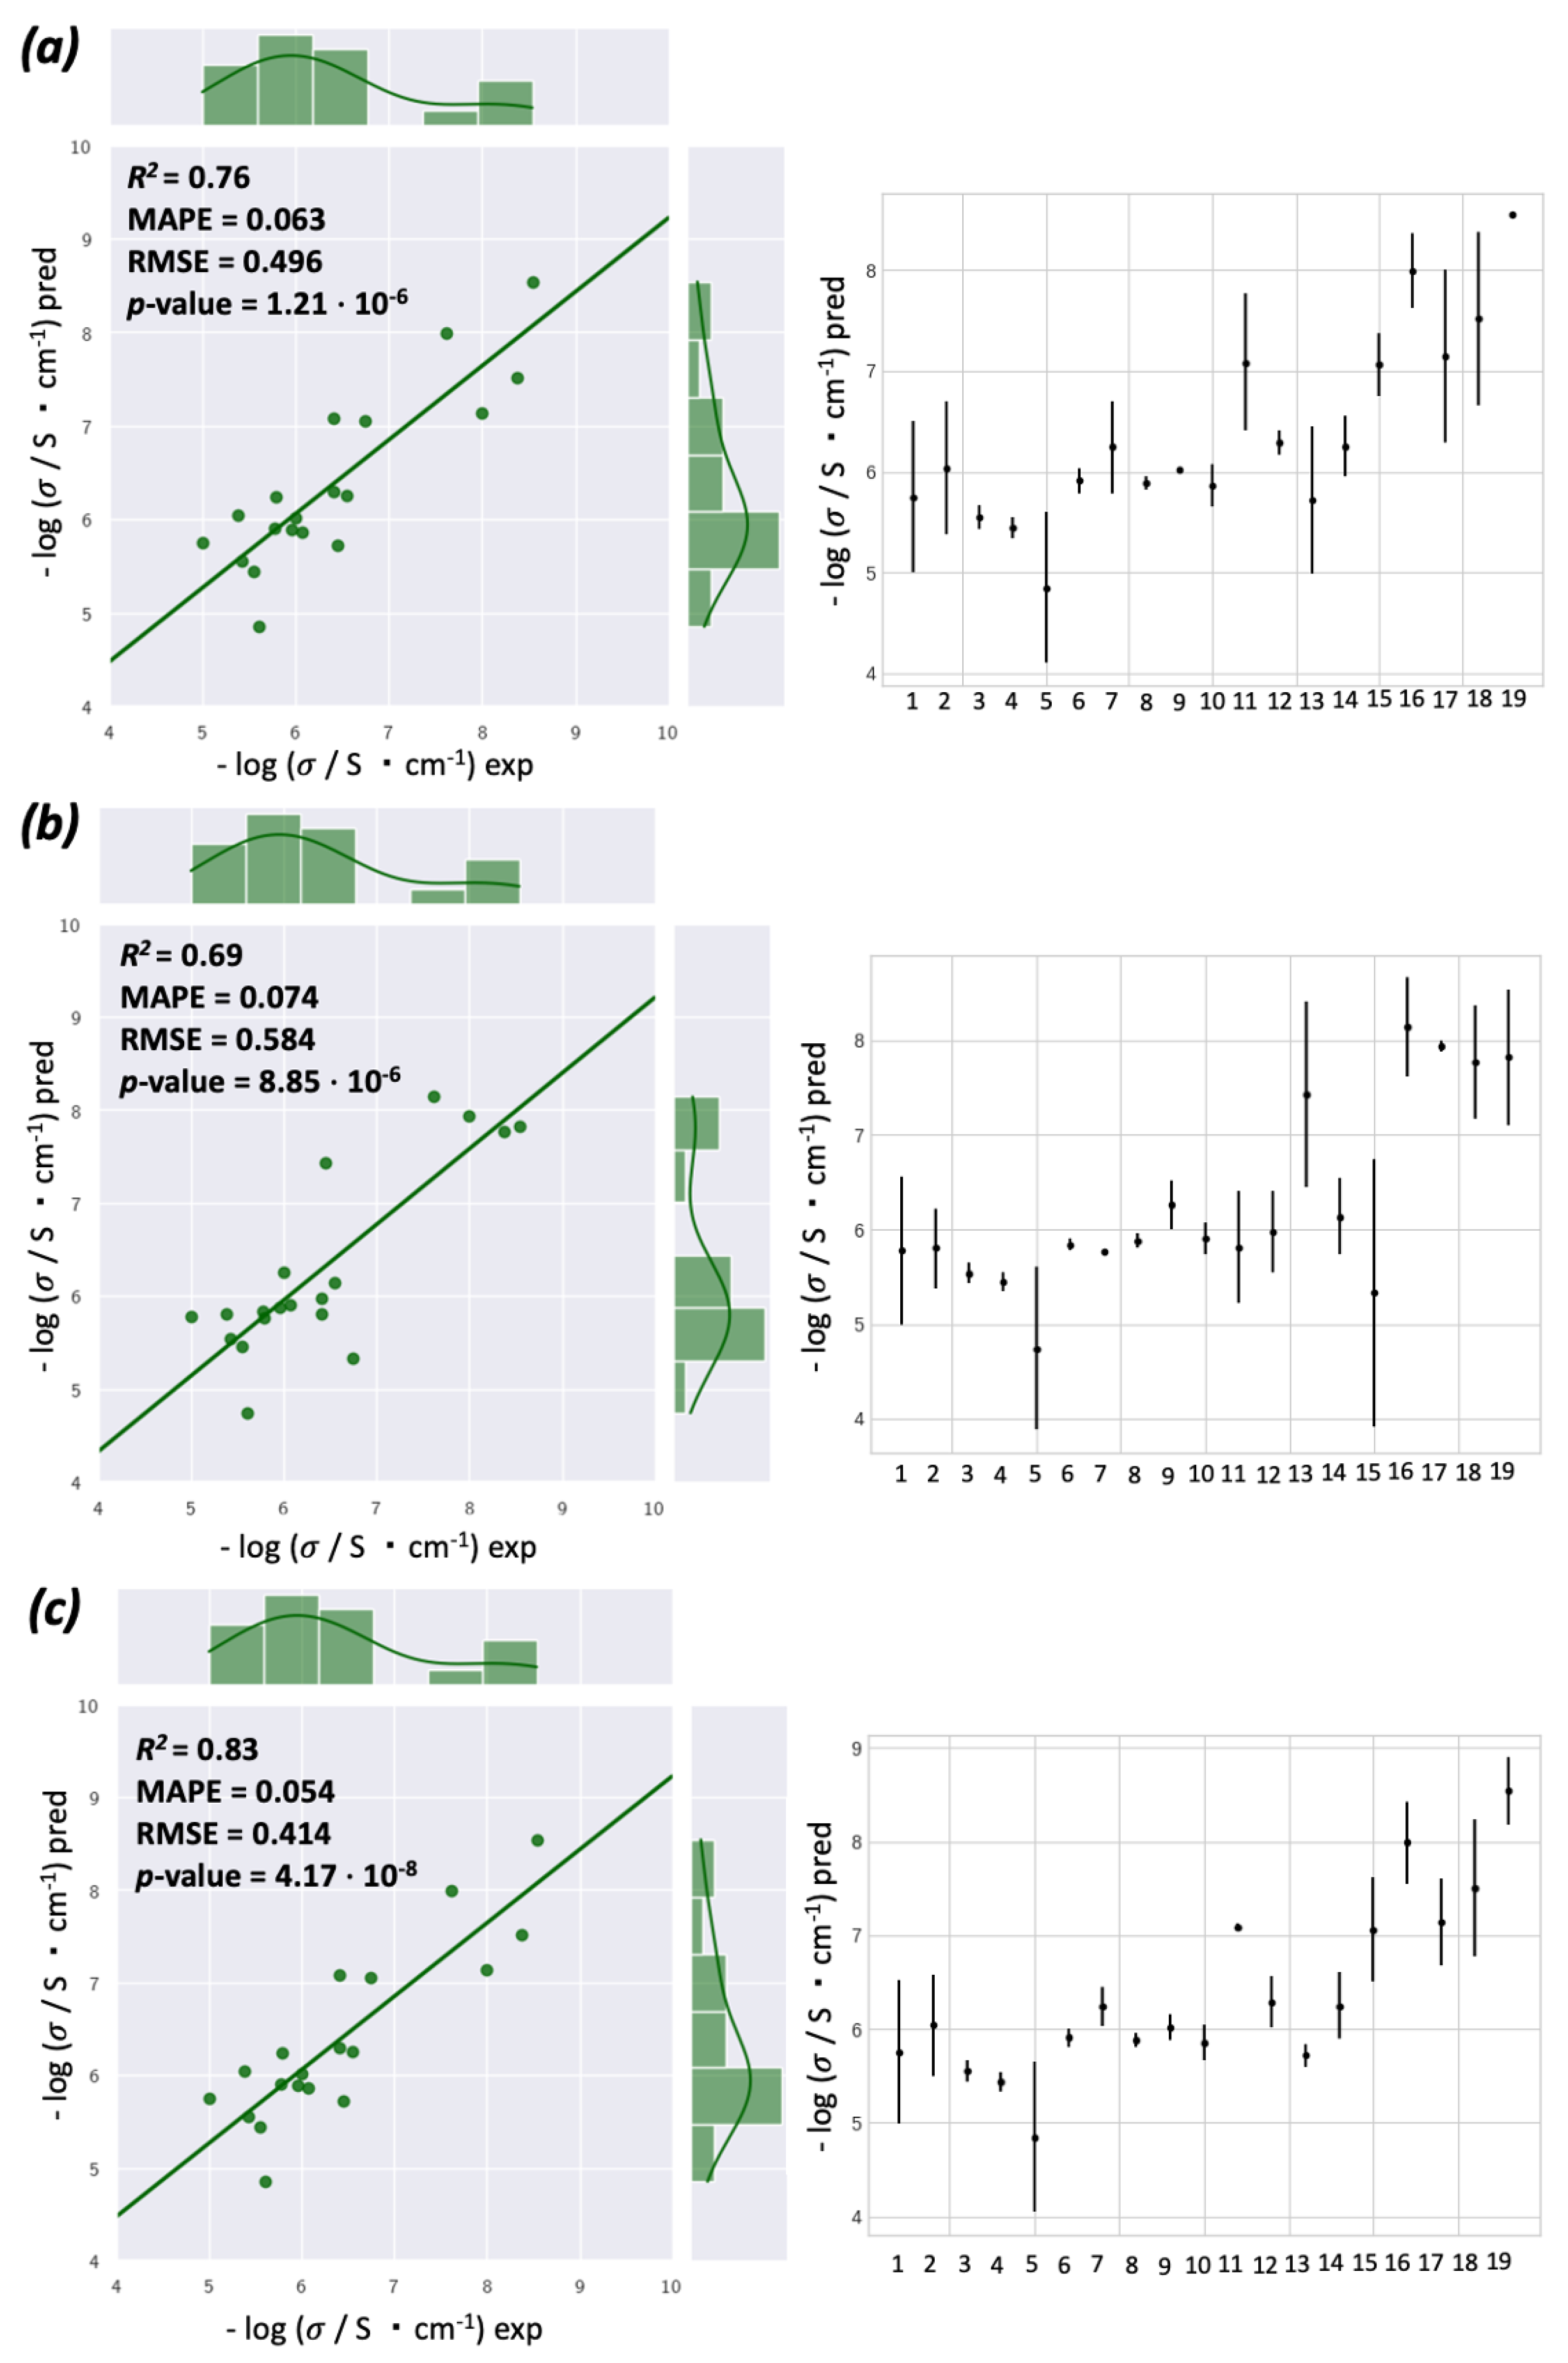
3.4. Machine Learning Modeling and Data Analysis

In recent years, machine learning (ML) has actively integrated into the fields of chemistry and materials science, opening fundamentally new opportunities for designing new compounds/materials or functionalities. Thus, materials informatics methodologies have been successfully applied for the rational screening of compounds with tailored characteristics [99,100,101,102,103], predicting crystal structures [104], designing experiments [105,106,107], using natural language processing for experimental data acquisition and analysis [108,109], analyzing data from physicochemical characterization methods [110,111], and microstructural informatics [112,113,114].
Machine learning processes input data (quantitative characteristics or images) to derive information based on predefined goals. In this study, ML is applied for supervised learning in a regression task, where methods uncover relationships between input parameters and the final target characteristics by presenting input parameters in line with the corresponding values of the target property.
Quantitative models for predicting ionic conductivity values were obtained using LSTM [53] and probabilistic backpropagation (PBP) [58] neural networks. Figure 6 represents the results of leave-one-out cross-validation of the models for predicting the ionic conductivity values in garnet films for the available experimental data using both ML methods. The determination coefficient R 2 of 0.69, 0.76 and 0.83, root mean square error RMSE value of 0.584, 0.496 and 0.414 and mean average percentage error MAPE value of 0.074, 0.063 and 0.054, for LSTM, PBP and their averaged prediction, respectively. The right part of this figure represents the results of assessing the uncertainty of the predictions for individual compounds, obtained as the standard deviation for the corresponding average value. All compounds are predicted within a range of three σ . The final model, which is used as the reference, predicts certain compounds with significant discrepancies between the experimental and predicted conductivity values. One such example is the Ta-LLZO deposited on Si3N4 at 500 °C, where the conductivity values are overestimated, and the discrepancy can be assessed as 0.73 in log( σ t o t ). Other outliers are the LLZO films deposited on the Gd3Ga5O12 substrate. The possible reasons for this discrepancy may be the substantially different thickness of the deposited films compared to other experimental data, which does not exceed 50 nm. The discrepancy values are −0.765 and 0.805 log( σ t o t ), respectively. The puzzling observation regarding the absence of film thickness in the final set of parameters chosen for modeling may be related to the presence of several outlying observations. All three of these compounds are predicted with the largest standard deviation of the predicted value based on the averaging over 100 models.
The analysis of the impact of individual descriptors on Li-ion conductivity using Shapley explainability theory is shown in Figure 7. This figure illustrates the averaged contribution of each parameter for the analyzed data, as well as the marginal impact of each parameter across a range of values.
From these figures, one can observe the dominant contribution of the parameters ratio mp/T d e p o s , shear modulus G, and misfit to the value of the modeled property. The second plot demonstrates the range of Shapley values for each considered parameter for the entire dataset. The Shapley value corresponding to the film-substrate misfit is very focused, while the importance of the ratio Tm/T d e p o s and shear modulus varies across a wide range of values.

4. Conclusions

In this study, experimental data on Li-ion conductivities in the films of garnet solid electrolytes have been analyzed and modeled. Among the parameters that emerged as the most important for the ionic conductivity in garnet thin films, one can distinguish the deposition temperature, the melting point of the substrate material, the shear modulus of the substrate, the elastic properties of the film (including information on Young’s modulus, Poisson’s ratio, and film thickness), as well as the parameter introduced in this study representing the product of three parameters: elastic characteristics, deposition temperature, and the difference in the thermal expansion coefficient for the film and the substrate materials. This parameter combines both the elastic and temperature contributions to stress. The role of a substrate composition in processes observed at film-substrate interfaces was discussed in the context of cation segregation, formation of secondary phases, and space charge affecting the functional characteristics of the films.
Possible ways to optimize Li-ion transport characteristics include amorphization processes and the use of sacrificed Li source compounds.
The developed models exhibit good predictivity, with the largest determination coefficient R 2 = 0.83 and RMSE = 0.414. The introduced dielectric constant of the substrate was found to improve the model predictivity. The impact of the descriptors on the model’s predictivity has been assessed, prioritizing the role of the ratio of the substrate’s melting temperature to the deposition temperature, the elastic characteristics of the substrate, and the film-substrate misfit.

Author Contributions

Conceptualization, N.K. and V.S.P.; methodology, N.K.; validation, N.K.; data curation, N.K.; writing—original draft preparation, N.K.; writing—review and editing, N.K., V.S.P. and A.Y.T.; supervision, V.S.P. and A.Y.T.; project administration, V.S.P.; funding acquisition, V.S.P. All authors have read and agreed to the published version of the manuscript.

Funding

This research was funded by the Russian Foundation for Basic Research (Project No. 17-03-00835).

Data Availability Statement

The data presented in this study are available on request from the corresponding author.

Acknowledgments

Authors acknowledge the Russian Foundation for Basic Research (Project No. 17-03-00835) for the support. For the visualization of the structures VESTA software has been used. Keras, SHAP and Seaborn packages were used.

Conflicts of Interest

The authors declare no conflict of interest.

References

  1. Goodenough, J.B.; Singh, P. Review—Solid Electrolytes in Rechargeable Electrochemical Cells. J. Electrochem. Soc. 2015, 162, A2387. [Google Scholar] [CrossRef]
  2. Lotsch, B.V.; Maier, J. Relevance of solid electrolytes for lithium-based batteries: A realistic view. J. Electroceramics 2017, 38, 128–141. [Google Scholar] [CrossRef]
  3. Bachman, J.C.; Muy, S.; Grimaud, A.; Chang, H.H.; Pour, N.; Lux, S.F.; Paschos, O.; Maglia, F.; Lupart, S.; Lamp, P.; et al. Inorganic Solid-State Electrolytes for Lithium Batteries: Mechanisms and Properties Governing Ion Conduction. Chem. Rev. 2016, 116, 140–162. [Google Scholar] [CrossRef]
  4. Oudenhoven, J.F.M.; Baggetto, L.; Notten, P.H.L. All-Solid-State Lithium-Ion Microbatteries: A Review of Various Three-Dimensional Concepts. Adv. Energy Mater. 2011, 1, 10–33. [Google Scholar] [CrossRef]
  5. Garbayo, I.; Struzik, M.; Bowman, W.J.; Pfenninger, R.; Stilp, E.; Rupp, J.L.M. Glass-Type Polyamorphism in Li-Garnet Thin Film Solid State Battery Conductors. Adv. Energy Mater. 2018, 8, 1702265. [Google Scholar] [CrossRef]
  6. Huang, K.J.; Ceder, G.; Olivetti, E.A. Manufacturing scalability implications of materials choice in inorganic solid-state batteries. Joule 2021, 5, 564–580. [Google Scholar] [CrossRef]
  7. Thangadurai, V.; Kaack, H.; Weppner, W.J.F. Novel Fast Lithium Ion Conduction in Garnet-Type Li5La3M2O12 (M = Nb, Ta). J. Am. Ceram. Soc. 2003, 86, 437–440. [Google Scholar] [CrossRef]
  8. Thangadurai, V.; Weppner, W. Effect of sintering on the ionic conductivity of garnet-related structure Li5La3Nb2O12 and In- and K-doped Li5La3Nb2O12. J. Solid State Chem. 2006, 179, 974–984. [Google Scholar] [CrossRef]
  9. Murugan, R.; Thangadurai, V.; Weppner, W. Effect of lithium ion content on the lithium ion conductivity of the garnet-like structure Li5 + xBaLa2Ta2O11.5 + 0.5x (x = 0–2). Appl. Phys. A 2008, 91, 615–620. [Google Scholar] [CrossRef]
  10. Murugan, R.; Thangadurai, V.; Weppner, W. Fast Lithium Ion Conduction in Garnet-Type Li7La3Zr2O12. Angew. Chem. Int. Ed. 2007, 46, 7778–7781. [Google Scholar] [CrossRef]
  11. Chen, Y.; Rangasamy, E.; Liang, C.; An, K. Origin of High Li+ Conduction in Doped Li7La3Zr2O12 Garnets. Chem. Mater. 2015, 27, 5491–5494. [Google Scholar] [CrossRef]
  12. Li, J.; Liu, Z.; Ma, W.; Dong, H.; Zhang, K.; Wang, R. Low-temperature synthesis of cubic phase Li7La3Zr2O12 via sol-gel and ball milling induced phase transition. J. Power Sources 2019, 412, 189–196. [Google Scholar] [CrossRef]
  13. Orera, A.; Larraz, G.; Rodriguez-Velamazan, J.A.; Campo, J.; Sanjuan, M.L. Influence of Li and H Distribution on the Crystal Structure of Li7–xHxLa3Zr2O12 (0 =< x =<5) Garnets. Inorg. Chem. 2016, 55, 1324–1332. [Google Scholar] [CrossRef]
  14. Bernstein, N.; Johannes, M.D.; Hoang, K. Origin of the Structural Phase Transition in Li7La3Zr2O12. Phys. Rev. Lett. 2012, 109, 205702. [Google Scholar] [CrossRef]
  15. Wagner, R.; Redhammer, G.J.; Rettenwander, D.; Senyshyn, A.; Schmidt, W.; Wilkening, M.; Amthauer, G. Crystal Structure of Garnet-Related Li-Ion Conductor Li7–3xGaxLa3Zr2O12: Fast Li-Ion Conduction Caused by a Different Cubic Modification? Chem. Mater. 2016, 28, 1861–1871. [Google Scholar] [CrossRef]
  16. Rondinelli, J.M.; Spaldin, N.A. Structure and Properties of Functional Oxide Thin Films: Insights From Electronic-Structure Calculations. Adv. Mater. 2011, 23, 3363–3381. [Google Scholar] [CrossRef]
  17. Schlom, D.G.; Chen, L.Q.; Fennie, C.J.; Gopalan, V.; Muller, D.A.; Pan, X.; Ramesh, R.; Uecker, R. Elastic strain engineering of ferroic oxides. MRS Bull. 2014, 39, 118–130. [Google Scholar] [CrossRef]
  18. Keppner, J.; Schubert, J.; Ziegner, M.; Mogwitz, B.; Janek, J.; Korte, C. Influence of texture and grain misorientation on the ionic conduction in multilayered solid electrolytes—Interface strain effects in competition with blocking grain boundaries. Phys. Chem. Chem. Phys. 2018, 20, 9269–9280. [Google Scholar] [CrossRef]
  19. Hwang, H.Y.; Iwasa, Y.; Kawasaki, M.; Keimer, B.; Nagaosa, N.; Tokura, Y. Emergent phenomena at oxide interfaces. Nat. Mater. 2012, 11, 103–113. [Google Scholar] [CrossRef]
  20. Aslan, O.B.; Datye, I.M.; Mleczko, M.J.; Sze Cheung, K.; Krylyuk, S.; Bruma, A.; Kalish, I.; Davydov, A.V.; Pop, E.; Heinz, T.F. Probing the Optical Properties and Strain-Tuning of Ultrathin Mo1-xWxTe2. Nano Lett. 2018, 18, 2485–2491. [Google Scholar] [CrossRef]
  21. Choi, S.Y.; Kim, S.D.; Choi, M.; Lee, H.S.; Ryu, J.; Shibata, N.; Mizoguchi, T.; Tochigi, E.; Yamamoto, T.; Kang, S.J.L.; et al. Assessment of Strain-Generated Oxygen Vacancies Using SrTiO3 Bicrystals. Nano Lett. 2015, 15, 4129–4134. [Google Scholar] [CrossRef] [PubMed]
  22. Sohier, T.; Gibertini, M.; Campi, D.; Pizzi, G.; Marzari, N. Valley-Engineering Mobilities in Two-Dimensional Materials. Nano Lett. 2019, 19, 3723–3729. [Google Scholar] [CrossRef] [PubMed]
  23. Martin, L.W.; Rappe, A.M. Thin-film ferroelectric materials and their applications. Nat. Rev. Mater. 2016, 2, 16087. [Google Scholar] [CrossRef]
  24. Schlom, D.G.; Chen, L.Q.; Eom, C.B.; Rabe, K.M.; Streiffer, S.K.; Triscone, J.M. Strain Tuning of Ferroelectric Thin Films. Annu. Rev. Mater. Res. 2007, 37, 589–626. [Google Scholar] [CrossRef]
  25. Xu, Y.; Park, J.H.; Yao, Z.; Wolverton, C.; Razeghi, M.; Wu, J.; Dravid, V.P. Strain-Induced Metastable Phase Stabilization in Ga2O3 Thin Films. ACS Appl. Mater. Interfaces 2019, 11, 5536–5543. [Google Scholar] [CrossRef] [PubMed]
  26. Sagotra, A.K.; Cazorla, C. Stress-Mediated Enhancement of Ionic Conductivity in Fast-Ion Conductors. ACS Appl. Mater. Interfaces 2017, 9, 38773–38783. [Google Scholar] [CrossRef] [PubMed]
  27. Li, F.; Li, J.; Zhu, F.; Liu, T.; Xu, B.; Kim, T.H.; Kramer, M.J.; Ma, C.; Zhou, L.; Nan, C.W. Atomically Intimate Contact between Solid Electrolytes and Electrodes for Li Batteries. Matter 2019, 1, 1001–1016. [Google Scholar] [CrossRef]
  28. Aidhy, D.S.; Rawat, K. Coupling between interfacial strain and oxygen vacancies at complex-oxides interfaces. J. Appl. Phys. 2021, 129, 171102. [Google Scholar] [CrossRef]
  29. Gupta, S.; Sachan, R.; Narayan, J. Nanometer-Thick Hexagonal Boron Nitride Films for 2D Field-Effect Transistors. ACS Appl. Nano Mater. 2020, 3, 7930–7941. [Google Scholar] [CrossRef]
  30. Chen, B.; Ju, J.; Ma, J.; Du, H.; Xiao, R.; Cui, G.; Chen, L. Strain tunable ionic transport properties and electrochemical window of Li10GeP2S12 superionic conductor. Comput. Mater. Sci. 2018, 153, 170–175. [Google Scholar] [CrossRef]
  31. Jia, M.; Wang, H.; Sun, Z.; Chen, Y.; Guo, C.; Gan, L. Exploring ion migration in Li2MnSiO4 for Li-ion batteries through strain effects. RSC Adv. 2017, 7, 26089–26096. [Google Scholar] [CrossRef]
  32. O’Rourke, C.; Morgan, B.J. Interfacial strain effects on lithium diffusion pathways in the spinel solid electrolyte Li-doped MgAl2O4. Phys. Rev. Mater. 2018, 2, 045403. [Google Scholar] [CrossRef]
  33. Wei, J.; Ogawa, D.; Fukumura, T.; Hirose, Y.; Hasegawa, T. Epitaxial Strain-Controlled Ionic Conductivity in Li-Ion Solid Electrolyte Li0.33La0.56TiO3 Thin Films. Cryst. Growth Des. 2015, 15, 2187–2191. [Google Scholar] [CrossRef]
  34. Korte, C.; Keppner, J.; Peters, A.; Schichtel, N.; Aydin, H.; Janek, J. Coherency strain and its effect on ionic conductivity and diffusion in solid electrolytes—An improved model for nanocrystalline thin films and a review of experimental data. Phys. Chem. Chem. Phys. 2014, 16, 24575–24591. [Google Scholar] [CrossRef] [PubMed]
  35. Harrington, G.F.; Cavallaro, A.; McComb, D.W.; Skinner, S.J.; Kilner, J.A. The effects of lattice strain, dislocations, and microstructure on the transport properties of YSZ films. Phys. Chem. Chem. Phys. 2017, 19, 14319–14336. [Google Scholar] [CrossRef] [PubMed]
  36. Wen, K.; Lv, W.; He, W. Interfacial lattice-strain effects on improving the overall performance of micro-solid oxide fuel cells. J. Mater. Chem. A 2015, 3, 20031–20050. [Google Scholar] [CrossRef]
  37. Rupp, J.L.M.; Fabbri, E.; Marrocchelli, D.; Han, J.W.; Chen, D.; Traversa, E.; Tuller, H.L.; Yildiz, B. Scalable Oxygen-Ion Transport Kinetics in Metal-Oxide Films: Impact of Thermally Induced Lattice Compaction in Acceptor Doped Ceria Films. Adv. Funct. Mater. 2014, 24, 1562–1574. [Google Scholar] [CrossRef]
  38. Jamnik, J.; Maier, J.; Pejovnik, S. Interfaces in solid ionic conductors: Equilibrium and small signal picture. Solid State Ionics 1995, 75, 51–58. [Google Scholar] [CrossRef]
  39. Maier, J. Space Charge Regions in Solid Two Phase Systems and Their Conduction Contribution—II Contact Equilibrium at the Interface of Two Ionic Conductors and the Related Conductivity Effect. Berichte Bunsenges. Phys. Chem. 1985, 89, 355–362. [Google Scholar] [CrossRef]
  40. Maier, J. Ionic conduction in space charge regions. Prog. Solid State Chem. 1995, 23, 171–263. [Google Scholar] [CrossRef]
  41. Li, C.; Maier, J. Ionic space charge effects in lithium fluoride thin films. Solid State Ionics 2012, 225, 408–411. [Google Scholar] [CrossRef]
  42. Frenkel, J. Kinetic Theory of Liquids; Oxford University Press: New York, NY, USA, 1946. [Google Scholar]
  43. Wang, S.H.; Yue, J.; Dong, W.; Zuo, T.T.; Li, J.Y.; Liu, X.; Zhang, X.D.; Liu, L.; Shi, J.L.; Yin, Y.X.; et al. Tuning wettability of molten lithium via a chemical strategy for lithium metal anodes. Nat. Commun. 2019, 10, 4930. [Google Scholar] [CrossRef] [PubMed]
  44. Cha, E.; Yun, J.H.; Ponraj, R.; Kim, D.K. A mechanistic review of lithiophilic materials: Resolving lithium dendrites and advancing lithium metal-based batteries. Mater. Chem. Front. 2021, 5, 6294–6314. [Google Scholar] [CrossRef]
  45. Chen, Y.T.; Jena, A.; Pang, W.K.; Peterson, V.K.; Sheu, H.S.; Chang, H.; Liu, R.S. Voltammetric Enhancement of Li-Ion Conduction in Al-Doped Li7–xLa3Zr2O12 Solid Electrolyte. J. Phys. Chem. C 2017, 121, 15565–15573. [Google Scholar] [CrossRef]
  46. Reichert, S.; Flemming, J.; An, Q.; Vaynzof, Y.; Pietschmann, J.F.; Deibel, C. Improved evaluation of deep-level transient spectroscopy on perovskite solar cells reveals ionic defect distribution. arXiv 2019, arXiv:1910.04583. [Google Scholar]
  47. Zhu, Y.; Wu, S.; Pan, Y.; Zhang, X.; Yan, Z.; Xiang, Y. Reduced Energy Barrier for Li+ Transport Across Grain Boundaries with Amorphous Domains in LLZO Thin Films. Nanoscale Res. Lett. 2020, 15, 153. [Google Scholar] [CrossRef] [PubMed]
  48. Koresh, I.; Tang, Z.; Troczynski, T. A novel approach to prepare Li-La-Zr-O solid state electrolyte films by suspension plasma spray. Solid State Ionics 2021, 368, 115679. [Google Scholar] [CrossRef]
  49. Koresh, I.; Klein, B.A.; Tang, Z.; Michaelis, V.K.; Troczynski, T. Li ion transport properties of amorphous/crystalline Li-La-Zr-Nb-O solid electrolyte thick films prepared by suspension plasma spraying. Solid State Ionics 2022, 380, 115938. [Google Scholar] [CrossRef]
  50. Pervov, V.S.; Zotova, A.E. On Some Problems of Inorganic Supramolecular Chemistry. ChemPhysChem 2013, 14, 3865–3867. [Google Scholar] [CrossRef]
  51. Anosov, V.; Pogodin, S. Fundamental Principles of Physical-Chemical Analysis; AS: Moskow, Russia, 1947; pp. 269–309. [Google Scholar]
  52. Hassabis, D.; Kumaran, D.; Summerfield, C.; Botvinick, M. Neuroscience-Inspired Artificial Intelligence. Neuron 2017, 95, 245–258. [Google Scholar] [CrossRef]
  53. Hochreiter, S. Long Short-Term Memory. Neural Comput. 1997, 9, 1735–1780. [Google Scholar] [CrossRef] [PubMed]
  54. Graves, A. Supervised Sequence Labelling with Recurrent Neural Networks Supervised Sequence Labelling with Recurrent Neural Networks. Ph.D. Thesis, Technical University of Munich, Munich, Germany, 2008. [Google Scholar]
  55. Shahriari, B.; Swersky, K.; Wang, Z.; Adams, R.P.; de Freitas, N. Taking the Human Out of the Loop: A Review of Bayesian Optimization. Proc. IEEE 2016, 104, 148–175. [Google Scholar] [CrossRef]
  56. Kushner, H.J.; Yin, G. Stochastic Approximation Algorithms and Applications; Springer: New York, NY, USA, 1997. [Google Scholar]
  57. Mockus, J.; Tiesis, V.Z.A. Toward Global Optimization: Chapter The Application of Bayesian Methods for Seeking the Extremum; Elsevier: Amsterdam, The Netherlands, 1978; Volume 2. [Google Scholar]
  58. Hernandez-Lobato, J.; Adams, R. Probabilistic Backpropagation for Scalable Learning of Bayesian Neural Networks. In Proceedings of the Machine Learning Research, Lille, France, 7–9 July 2015; Volume 37. [Google Scholar]
  59. Frye, C.; Mijolla, D.; Begley, T.; Cowton, L.; Stanley, M.; Feige, I. Shapley Explainability on the Data Manifold. arXiv 2021, arXiv:2006.01272. [Google Scholar]
  60. Shapley, L. A value for n-person games. Contribution to the Theory of Games; Princeton University Press: Princeton, NJ, USA, 1953. [Google Scholar]
  61. Hernandez-Lobato, J.M.; Hoffman, M.W.; Ghahramani, Z. Predictive entropy search for efficient global optimization of black-box functions. In Advances in Neural Information Processing Systems; Curran Associates, Inc.: Red Hook, NY, USA, 2014; pp. 918–926. [Google Scholar]
  62. Chen, R.J.; Huang, M.; Huang, W.Z.; Shen, Y.; Lin, Y.H.; Nan, C.W. Sol–gel derived Li–La–Zr–O thin films as solid electrolytes for lithium-ion batteries. J. Mater. Chem. A 2014, 2, 13277–13282. [Google Scholar] [CrossRef]
  63. Kalita, D.; Lee, S.; Lee, K.; Ko, D.; Yoon, Y. Ionic conductivity properties of amorphous Li–La–Zr–O solid electrolyte for thin film batteries. Solid State Ionics 2012, 229, 14–19. [Google Scholar] [CrossRef]
  64. Katsui, H.; Goto, T. Impedance of Cubic Li7La3Zr2O12 Film Deposited on Strontium Ruthenate Substrate by Chemical Vapor Deposition. Mater. Today Proc. 2017, 4, 11445–11448. [Google Scholar] [CrossRef]
  65. Kazyak, E.; Chen, K.H.; Wood, K.N.; Davis, A.L.; Thompson, T.; Bielinski, A.R.; Sanchez, A.J.; Wang, X.; Wang, C.; Sakamoto, J.; et al. Atomic Layer Deposition of the Solid Electrolyte Garnet Li7La3Zr2O12. Chem. Mater. 2017, 29, 3785–3792. [Google Scholar] [CrossRef]
  66. Kim, S.; Hirayama, M.; Taminato, S.; Kanno, R. Epitaxial growth and lithium ion conductivity of lithium-oxide garnet for an all solid-state battery electrolyte. Dalton Trans. 2013, 42, 13112–13117. [Google Scholar] [CrossRef]
  67. Loho, C.; Djenadic, R.; Bruns, M.; Clemens, O.; Hahn, H. Garnet-Type Li7La3Zr2O12Solid Electrolyte Thin Films Grown by CO2-Laser Assisted CVD for All-Solid-State Batteries. J. Electrochem. Soc. 2016, 164, A6131–A6139. [Google Scholar] [CrossRef]
  68. Loho, C.; Djenadic, R.; Mundt, P.; Clemens, O.; Hahn, H. On processing-structure-property relations and high ionic conductivity in garnet-type Li5La3Ta2O12 solid electrolyte thin films grown by CO2-laser assisted CVD. Solid State Ionics 2017, 313, 32–44. [Google Scholar] [CrossRef]
  69. Nong, J.; Xu, H.; Yu, Z.; Zhu, G.; Yu, A. Properties and preparation of Li–La–Ti–Zr–O thin film electrolyte. Mater. Lett. 2015, 154, 167–169. [Google Scholar] [CrossRef]
  70. Song, S.; Xu, Y.; Ruan, Y.; Wang, H.; Zhang, D.; Thokchom, J.; Mei, D. Isomeric Li-La-Zr-O Amorphous-Crystalline Composite Thin-Film Electrolytes for All-Solid-State Lithium Batteries. ACS Appl. Energy Mater. 2021, 4, 8517–8528. [Google Scholar] [CrossRef]
  71. Park, J.S.; Cheng, L.; Zorba, V.; Mehta, A.; Cabana, J.; Chen, G.; Doeff, M.M.; Richardson, T.J.; Park, J.H.; Son, J.W.; et al. Effects of crystallinity and impurities on the electrical conductivity of Li–La–Zr–O thin films. Thin Solid Film. 2015, 576, 55–60. [Google Scholar] [CrossRef]
  72. Rawlence, M.; Filippin, A.N.; Wäckerlin, A.; Lin, T.Y.; Cuervo-Reyes, E.; Remhof, A.; Battaglia, C.; Rupp, J.L.M.; Buecheler, S. Effect of Gallium Substitution on Lithium-Ion Conductivity and Phase Evolution in Sputtered Li7–3xGaxLa3Zr2O12 Thin Films. ACS Appl. Mater. Interfaces 2018, 10, 13720–13728. [Google Scholar] [CrossRef] [PubMed]
  73. Reinacher, J.; Berendts, S.; Janek, J. Preparation and electrical properties of garnet-type Li6BaLa2Ta2O12 lithium solid electrolyte thin films prepared by pulsed laser deposition. Solid State Ionics 2014, 258, 1–7. [Google Scholar] [CrossRef]
  74. Tadanaga, K.; Egawa, H.; Hayashi, A.; Tatsumisago, M.; Mosa, J.; Aparicio, M.; Duran, A. Preparation of lithium ion conductive Al-doped Li7La3Zr2O12 thin films by a sol–gel process. J. Power Sources 2015, 273, 844–847. [Google Scholar] [CrossRef]
  75. Tan, J.; Tiwari, A. Fabrication and Characterization of Li7La3Zr2O12 Thin Films for Lithium Ion Battery. ECS Solid State Lett. 2012, 1, Q57–Q60. [Google Scholar] [CrossRef]
  76. Zarabian, M.; Bartolini, M.; Pereira-Almao, P.; Thangadurai, V. X-ray Photoelectron Spectroscopy and AC Impedance Spectroscopy Studies of Li-La-Zr-O Solid Electrolyte Thin Film/LiCoO2 Cathode Interface for All-Solid-State Li Batteries. J. Electrochem. Soc. 2017, 164, A1133–A1139. [Google Scholar] [CrossRef]
  77. Jiang, J.; Zhang, L.; Hu, Y.; Guo, Y.; Chen, Z.; Jia, R.; Pendse, S.; Xiang, Y.; Wang, G.C.; Shi, Y.; et al. Metal–Insulator Transition of Single-Crystal V2O3 through van der Waals Interface Engineering. ACS Nano 2023, 17, 11783–11793. [Google Scholar] [CrossRef]
  78. Fluri, A.; Pergolesi, D.; Wokaun, A.; Lippert, T. Stress generation and evolution in oxide heteroepitaxy. Phys. Rev. B 2018, 97, 125412. [Google Scholar] [CrossRef]
  79. Matthews, J.; Blakeslee, A. Defects in epitaxial multilayers. J. Cryst. Growth 1974, 27, 118–125. [Google Scholar] [CrossRef]
  80. Matthews, J.W.; Mader, S.; Light, T.B. Accommodation of Misfit Across the Interface between Crystals of Semiconducting Elements or Compounds. J. Appl. Phys. 1970, 41, 3800–3804. [Google Scholar] [CrossRef]
  81. Van Der Merwe, J.H. Crystal Interfaces. Part I. Semi-Infinite Crystals. J. Appl. Phys. 1963, 34, 117–122. [Google Scholar] [CrossRef]
  82. Cammarata, R.C.; Sieradzki, K. Effects of surface stress on the elastic moduli of thin films and superlattices. Phys. Rev. Lett. 1989, 62, 2005–2008. [Google Scholar] [CrossRef] [PubMed]
  83. Cammarata, R.C.; Sieradzki, K.; Spaepen, F. Simple model for interface stresses with application to misfit dislocation generation in epitaxial thin films. J. Appl. Phys. 2000, 87, 1227–1234. [Google Scholar] [CrossRef]
  84. Prandtl, L. Ein Gedankenmodell zur kinetischen Theorie der festen Körper. Z. Angew. Math. Mech. 1928, 8, 85–106. [Google Scholar] [CrossRef]
  85. Frenkel, Y.I.; Kontorova, T.A. To the Theory of Plastic Deformation and Twinning. Zh. Eksp. Teor. Fiz. 1938, 8, 89. [Google Scholar]
  86. Frenkel, Y.; Kontorova, T. On the Theory of Plastic Deformation and Twinning. Zh. Eksp. Teor. Fiz. 1938, 8, 1340. [Google Scholar]
  87. Braun, O.; Yuri, S.K. The Frenkel-Kontorova Model: Concepts, Methods, and Applications; Springer: Berlin/Heidelberg, Germany, 2004. [Google Scholar]
  88. Pervov, V.S.; Makhonina, E.V. Incommensurate suprastructures: New problems of inorganic solid-state chemistry. Russ. Chem. Rev. 2000, 69, 481. [Google Scholar] [CrossRef]
  89. Pervov, V.S.; Mikheikin, I.D.; Makhonina, E.V.; Butskii, V.D. Supramolecular ensembles in eutectic alloys. Russ. Chem. Rev. 2003, 72, 759–768. [Google Scholar] [CrossRef]
  90. Mikheikin, I.D.; Kuznetsov, M.Y.; Makhonina, E.V.; Pervov, V.S. Defects in Inorganic Suprastructures with Incommensurate Structural Elements: The Static Frenkel–Kontorova Model for Finite Systems. Dokl. Phys. Chem. 2001, 376, 52–55. [Google Scholar] [CrossRef]
  91. Bruinsma, R.; Zangwill, A. Structural transitions in epitaxial overlayers. J. Physique 1986, 47, 2055–2073. [Google Scholar] [CrossRef]
  92. Sills, R.B.; Bertin, N.; Aghaei, A.; Cai, W. Dislocation Networks and the Microstructural Origin of Strain Hardening. Phys. Rev. Lett. 2018, 121, 085501. [Google Scholar] [CrossRef] [PubMed]
  93. Connell, J.G.; Zhu, Y.; Zapol, P.; Tepavcevic, S.; Sharafi, A.; Sakamoto, J.; Curtiss, L.A.; Fong, D.D.; Freeland, J.W.; Markovic, N.M. Crystal Orientation-Dependent Reactivity of Oxide Surfaces in Contact with Lithium Metal. ACS Appl. Mater. Interfaces 2018, 10, 17471–17479. [Google Scholar] [CrossRef]
  94. Assat, G.; Tarascon, J.M. Fundamental understanding and practical challenges of anionic redox activity in Li-ion batteries. Nat. Energy 2018, 3, 373–386. [Google Scholar] [CrossRef]
  95. Saubanère, M.; McCalla, E.; Tarascon, J.M.; Doublet, M.L. The intriguing question of anionic redox in high-energy density cathodes for Li-ion batteries. Energy Environ. Sci. 2016, 9, 984–991. [Google Scholar] [CrossRef]
  96. Thouless, M.D. Modeling the Development and Relaxation of Stresses in Films. Annu. Rev. Mater. Sci. 1995, 25, 69–96. [Google Scholar] [CrossRef]
  97. Chen, Y.; He, M.; Zhao, N.; Fu, J.; Huo, H.; Zhang, T.; Li, Y.; Xu, F.; Guo, X. Nanocomposite intermediate layers formed by conversion reaction of SnO2 for Li/garnet/Li cycle stability. J. Power Sources 2019, 420, 15–21. [Google Scholar] [CrossRef]
  98. Maier, J. Defect chemistry at interfaces. Solid State Ionics 1994, 70/71, 43. [Google Scholar] [CrossRef]
  99. Lee, D.; You, D.; Lee, D.; Li, X.; Kim, S. Machine-Learning-Guided Prediction Models of Critical Temperature of Cuprates. J. Phys. Chem. Lett. 2021, 12, 6211–6217. [Google Scholar] [CrossRef]
  100. Yang, G.; Wu, K. Two-dimensional nonlinear optical materials predicted by network visualization. Mol. Syst. Des. Eng. 2019, 4, 586–596. [Google Scholar] [CrossRef]
  101. Patel, A.G.; Johnson, L.; Arroyave, R.; Lutkenhaus, J.L. Design of multifunctional supercapacitor electrodes using an informatics approach. Mol. Syst. Des. Eng. 2019, 4, 654–663. [Google Scholar] [CrossRef]
  102. Kireeva, N.V.; Tsivadze, A.Y.; Pervov, V.S. Modeling ionic conductivity and activation energy in garnet-structured solid electrolytes: The role of composition, grain boundaries and processing. Solid State Ionics 2023, 399, 116293. [Google Scholar] [CrossRef]
  103. Kireeva, N.; Solov’ev, V.P. Machine learning analysis of microwave dielectric properties for seven structure types: The role of the processing and composition. J. Phys. Chem. Solids 2021, 156, 110178. [Google Scholar] [CrossRef]
  104. Graser, J.; Kauwe, S.K.; Sparks, T.D. Machine Learning and Energy Minimization Approaches for Crystal Structure Predictions: A Review and New Horizons. Chem. Mater. 2018, 30, 3601–3612. [Google Scholar] [CrossRef]
  105. Young, S.R.; Maksov, A.; Ziatdinov, M.; Cao, Y.; Burch, M.; Balachandran, J.; Li, L.; Somnath, S.; Patton, R.M.; Kalinin, S.V.; et al. Data mining for better material synthesis: The case of pulsed laser deposition of complex oxides. J. Appl. Phys. 2018, 123, 115303. [Google Scholar] [CrossRef]
  106. Borvick, E.; Anderson, A.Y.; Barad, H.N.; Priel, M.; Keller, D.A.; Ginsburg, A.; Rietwyk, K.J.; Meir, S.; Zaban, A. Process-Function Data Mining for the Discovery of Solid-State Iron-Oxide PV. ACS Comb. Sci. 2017, 19, 755–762. [Google Scholar] [CrossRef] [PubMed]
  107. Takeda, H.; Fukuda, H.; Nakano, K.; Hashimura, S.; Tanibata, N.; Nakayama, M.; Ono, Y.; Natori, T. Process optimisation for NASICON-type solid electrolyte synthesis using a combination of experiments and bayesian optimisation. Mater. Adv. 2022, 3, 8141–8148. [Google Scholar] [CrossRef]
  108. Olivetti, E.A.; Cole, J.M.; Kim, E.; Kononova, O.; Ceder, G.; Han, T.Y.J.; Hiszpanski, A.M. Data-driven materials research enabled by natural language processing and information extraction. Appl. Phys. Rev. 2020, 7, 041317. [Google Scholar] [CrossRef]
  109. He, T.; Huo, H.; Bartel, C.J.; Wang, Z.; Cruse, K.; Ceder, G. Precursor recommendation for inorganic synthesis by machine learning materials similarity from scientific literature. Sci. Adv. 2023, 9, eadg8180. [Google Scholar] [CrossRef]
  110. Torrisi, S.B.; Carbone, M.R.; Rohr, B.A.; Montoya, J.H.; Ha, Y.; Yano, J.; Suram, S.K.; Hung, L. Random forest machine learning models for interpretable X-ray absorption near-edge structure spectrum-property relationships. NPJ Comput. Mater. 2020, 6, 109. [Google Scholar] [CrossRef]
  111. Tiong, L.C.O.; Kim, J.; Han, S.S.; Kim, D. Identification of crystal symmetry from noisy diffraction patterns by a shape analysis and deep learning. NPJ Comput. Mater. 2020, 6, 196. [Google Scholar] [CrossRef]
  112. Xu, L.; Hoffman, N.; Wang, Z.; Xu, H. Harnessing structural stochasticity in the computational discovery and design of microstructures. Mater. Des. 2022, 223, 111223. [Google Scholar] [CrossRef]
  113. Wodo, O.; Broderick, S.; Rajan, K. Microstructural informatics for accelerating the discovery of processing-microstructure-property relationships. MRS Bull. 2016, 41, 603–609. [Google Scholar] [CrossRef]
  114. Aquistapace, F.; Amigo, N.; Troncoso, J.F.; Deluigi, O.; Bringa, E.M. MultiSOM: Multi-layer Self Organizing Maps for local structure identification in crystalline structures. Comput. Mater. Sci. 2023, 227, 112263. [Google Scholar] [CrossRef]
Figure 1. Garnet-structured solid state electrolytes: (a) garnet polymorphs: the schemes of Li distribution for two cubic polymorphs; (b) the difference in Li sites in cubic and tetragonal polymorphs. The part of the figure is reprinted with permission from refs. [14,15]. Copyright of the American Chemical and Physical Societies.
Batteries 09 00430 g001
Figure 2. Illustration of the migration barrier and Li vacancy concentration for the grain boundaries with a presence of the amorphized domains as well as for the grain boundaries with non-amorphized structure. The figure is reprinted with permission from [47] (licensed under CC BY-ND 2.0).
Batteries 09 00430 g002
Figure 3. Principal scheme of (a) Long Short-Term Memory Neural Networks (LSTM) and (b) Probabilistic Backpropagation Bayesian Neural Networks (PBP).
Batteries 09 00430 g003
Figure 4. Elastic chain in a periodic potential of the substrate: h is a period of the potential of substrate, k is the elastic characteristics of the chain, A is the amplitude of the potential. Reprinted with permission from ref. [90]. (Copyright of Springer).
Batteries 09 00430 g004
Figure 5. Li-ion conductivity values in garnet films as a function of (a) the difference in coefficients of thermal expansion, (b) shear modulus G of the substrate, GPa, (c) the ratio of the deposition temperature and the melting point, (d) diagram film thickness vs. T (°C) of deposition.
Batteries 09 00430 g005
Figure 6. Experimental vs. predicted Li-ion -log conductivity values for LSTM (a), PBP (b) models and their averaged prediction values (c) using leave-one-out cross-validation procedure in line with (right part of the figure) standard deviation of the predictions averaged over 100 models. The numbers at X axis correspond to the following published studies in list of references: 1—[65], 2—[66], 3—[68], 4—[68], 5—[65], 6—[61], 7—[70], 8—[61], 9—[75], 10—[61], 11—[62], 12—[69], 13—[61], 14—[73], 15—[74], 16—[5], 17—[64], 18—[5], 19—[5].
Batteries 09 00430 g006
Figure 7. Results of Shapley explainability analysis of the descriptors involved in this study: the summary of marginalized and averaged impact of model’s descriptors.
Batteries 09 00430 g007
Table 1. Experimental data on Li-ion conductivity in the considered garnet film electrolytes: the target compound/precursors, the method of deposition and its temperature, the substrate, the structure of deposited film, the film thickness and the ionic conductivity values.
Ref.Target Compound/PrecursorsMethod of DepositionDeposition TemperatureSubstrateStructureFilm Thickness, nmConductivity, S cm−1
[62]Li-La-Zr solSol-gel: spin-coating600Si-Ptamorphous307 nm1.67 × 10 6
[62]Li-La-Zr solSol-gel: spin-coating700Si-Ptamorphous307 nm1.10 × 10 6
[62]Li-La-Zr solSol-gel: spin coating800Si-Ptamorphous307 nm8.53 × 10 7
[62]Li-La-Zr solSol-gel: spin coating600Si-Ptamorphous130 nm3.56 × 10 7
[5]Li 6.19 Al 0.28 La 3 Zr 1.75 Ta 0.25 O 12 PE-CVD50Si 3 N 4 amorphous500 nm2.86 × 10 9
[5]Li 6.19 Al 0.28 La 3 Zr 1.75 Ta 0.25 O 12 PE-CVD300Si 3 N 4 amorphous500 nm2.39 × 10 8
[5]Li 6.19 Al 0.28 La 3 Zr 1.75 Ta 0.25 O 12 PE-CVD500Si 3 N 4 amorphous500 nm4.27 × 10 9
[63]Li–La–Zr–ORF magnetron sputtering27SiO 2 -Siamorphous561 nm4.00 × 10 7
[64]LLZOCVD950SrRuO 3 c-LLZO4500 nm1.40 × 10 5
[65]Li tert-butoxide, La tris-diisopropylformamidinate, tetrakis(dimethylamido)zirconium, trimethylaluminiumALD27Si (100)amorphous86.5 nm1.00 × 10 8
[66]LLZOPLD700GGG (001)c-LLZO26.2 nm2.50 × 10 6
[66]LLZOPLD700GGG (111)c-LLZO30.3 nm1.00 × 10 5
[67]2,2,6,6-tetramethyl-3,5-heptanedionato lithium, lanthanum (III) acetylacetonate hydrate, zirconium (IV) acetylacetonateLA-CVD700Ptt-LLZO850 nm4.20 × 10 6
[68]2,2,6,6-tetramethyl-3,5-heptanedionato lithium, lanthanum (III) acetylacetonate hydrate, tantalum (V) tetraethoxyacetylacetonateLA-CVD600Ptamorphous500 nm2.10 × 10 8
[69]LLTOMagnetron sputtering300ITOamorphous530.4 nm3.68 × 10 6
[69]LLZTOMagnetron sputtering300ITOamorphous611.5 nm2.83 × 10 6
[70]LLZOSol-gel: spin-coating600Si (100)amorphous720 nm3.90 × 10 7
[68]2,2,6,6-tetramethyl-3,5-heptanedionato lithium, lanthanum (III) acetylacetonate hydrate, tantalum (V) tetraethoxyacetylacetonateLA-CVD700Ptc-LLZO1400 nm2.93 × 10 7
[69]Li 0.33 La 0.56 TiO 3 , Li 7 La 3 Zr 2 O 12 (LLTO)RF magnetron sputtering300ITOamorphous530.4 nm3.68 × 10 6
[69]Li 0.33 La 0.56 TiO 3 , Li 7 La 3 Zr 2 O 12 (LLTO)RF magnetron sputtering300ITOamorphous611.5 nm2.83 × 10 6
[69]Li 0.33 La 0.56 TiO 3 , Li 7 La 3 Zr 2 O 12 (LLTO)RF magnetron sputtering300ITOamorphous593.6 nm6.18 × 10 7
[71]Li 7 La 3 Zr 2 O 12 PLD600MgO (100)c-LLZO+t-LLZO200 nm1.61 × 10 6
[72]Li 7 La 3 Zr 2 O 12 , Li 2 O, Ga 2 O 3 RF magnetron sputtering27MgO (100)amorphous600 nm1.61 × 10 5
[73]Li 6 BaLa 2 Ta 2 O 12 PLD550MgO (100)c-LLZO200 nm1.70 × 10 6
[74]Li-La-Zr solSol-gel: dip-coating900MgO (100)c-LLZO1000 nm2.80 × 10 7
[75]LLZOPLD27STO (100)amorphous1000 nm3.35 × 10 7
[75]LLZOPLD800STO (100)c-LLZO1000 nm1.78 × 10 7
[76]Li-La-Zr solSol-gel: spin-coating400MgO (100)t-LLZO+c-LLZO+
La 2 Zr 2 O 7
760 nm1.00 × 10 6
Table 2. Types of substrates for garnet film deposition for collected experimental data: crystal structure, coefficient of thermal expansion, lattice constant and the corresponding lattice mismatch values of the film (c-LLZO) and the substrate, the elastic properties of the substrate and the dielectric constant values.
SubstrateCrystal StructureLattice Constant/ Mismatch α , K−1Poisson’s Coefficient ν Young’s Modulus E, GPaBulk Modulus B, GPaShear Modulus G, GPaDielectric Constant ϵ r
Si (100)amorphous 2.6 × 10 6 0.2216297.766.3911.68
Si 3 N 4 amorphous 3.3 × 10 6 0.27297241116.910
SiO 2 amorphous 5.6 × 10 7 0.177336.831.23.9
SrRuO 3 Cubic, Pm 3 ¯ m3.95/−0.091.03 × 10 5 0.31161192.360.1na
PtCubic, Fm 3 ¯ m3.92/−0.098.9 × 10 6 0.3816823060.8758
ITOamorphous 8.5 × 10 6 0.331169943.63.33
MgO (100)Cubic, Fm 3 ¯ m4.212/−0.031.5 × 10 5 0.18249155105.59.5
SrTiO 3 (100)Cubic, Pm 3 ¯ m3.94/−0.092.98 × 10 5 0.24277173111.7300
GGG (001), (111)Cubic, Ia 3 ¯ d12.383/−0.058.2 × 10 6 0.2822216986.712.24
Disclaimer/Publisher’s Note: The statements, opinions and data contained in all publications are solely those of the individual author(s) and contributor(s) and not of MDPI and/or the editor(s). MDPI and/or the editor(s) disclaim responsibility for any injury to people or property resulting from any ideas, methods, instructions or products referred to in the content.

