Article

On the Electrochemical Properties of Carbon-Coated NaCrO2 for Na-Ion Batteries

Department of Mechanical, Materials and Aerospace Engineering, Illinois Institute of Technology, Chicago, IL 60616, USA
*
Author to whom correspondence should be addressed.
Current address: Department of Chemical and Environmental Engineering, Faculty of Science and Engineering, University of Nottingham, Ningbo 315100, China.
Batteries 2023, 9(9), 433; https://doi.org/10.3390/batteries9090433
Submission received: 8 June 2023 / Revised: 14 July 2023 / Accepted: 21 August 2023 / Published: 24 August 2023
(This article belongs to the Special Issue Rechargeable Batteries)

Abstract

:
NaCrO2 is a promising cathode for Na-ion batteries. However, further studies of the mechanisms controlling its specific capacities and cycle stability are needed for real-world applications in the future. This study reveals, for the first time, that the typical specific capacity of ~110 mAh/g reported by many researchers when the charge/discharge voltage window is set between 2.0 and 3.6 V vs. Na/Na+ is actually controlled by the low electronic conductivity at the electrode/electrolyte interface. Through wet solution mixing of NaCrO2 particles with carbon precursors, uniform carbon coating can be formed on the surface of NaCrO2 particles, leading to unprecedented specific capacities at 140 mAh/g, which is the highest specific capacity ever reported in the literature with the lower and upper cutoff voltages at the aforementioned values. However, such carbon-coated NaCrO2 with ultrahigh specific capacity does not improve cycle stability because with the specific capacity at 140 mAh/g the Na deintercalation during charge is more than 50% Na ions per formula unit of NaCrO2 which leads to irreversible redox reactions. The insights from this study provide a future direction to enhance the long-term cycle stability of NaCrO2 through integrating carbon coating and doping.

Graphical Abstract

1. Introduction

NaCrO2, as a promising cathode material for use in Na-ion batteries (NIBs), has been studied extensively [1,2,3,4,5,6,7,8,9,10,11,12,13,14,15,16,17,18,19]. One of the important advantages of NaCrO2 is its high thermal stability and thus good safety [3]. Accelerating calorimetry experiments have revealed that exothermic reactions do not take place for NaCrO2 until 250 °C [3]. Another advantage of NaCrO2 is that it contains no expensive Co element (the prices of Co, Ni and Cr are $15.20/lb, $6.41/lb and $3.27/lb, respectively, per Daily Metal Prices as of 12 August 2020), making NaCrO2-based batteries extremely attractive from the cost viewpoint. Note that Co’s price is high because its global reserves are only 7.1 million metric tons, whereas the global Cr reserves are 44 million metric tons. In addition, the rhombohedral (R 3 ¯ m) O3-type NaCrO2 has a relatively high average voltage, good energy density and cycle stability in comparison with other sodium transition metal oxides with layered structure (such as NaFeO2, NaMnO2, NaTiO2 and NaCoO2) [20]. O3-type NaCrO2 is capable of deintercalating 0.5 moles of sodium ions per formula unit up to Na0.5CrO2 reversibly, providing a theoretical capacity of ~125 mAh/g [5,8,9]. However, deintercalation of Na ions beyond Na0.5CrO2 is irreversible, with a theoretical charge capacity of ~235 mAh/g but with a discharge capacity of only ~90 mAh/g [8]. This irreversible capacity loss has been attributed to the irreversible migration of Cr ions from the octahedral sites in CrO2 slabs to both tetrahedral and octahedral sites in the Na layer [5,9]. Unfortunately, even for deintercalation of 0.5 moles of Na ions from NaCrO2 to Na0.5CrO2, the specific capacity still displays gradual decay over cycles [5,8,11,12,13,14,15,16,17,18,19], indicating the presence of capacity decay mechanisms even when de/intercalation are between NaCrO2 and Na0.5CrO2.
To minimize the capacity decay of O3-NaCrO2, multiple strategies have been studied [7,11,12,13,14,15,16,17,18,19]. Carbon coating is one of the strategies studied [7,14]. In this regard, Ding et al. [7] have used a solid-state reaction process by mixing citric acid powder with Na2CO3 and Cr2O3 powders and heating the mixture at 900 °C in Ar for 5 h to form carbon coating. Their study shows an initial discharge capacity of 116 mAh/g at the current density of 5 mA/g and 95% capacity retention over 40 cycles. Later, Yu et al. [14] re-investigate the carbon coating strategy using pitch as the carbon source and converting it to carbon coating at 750 °C. The result is a carbon-coated NaCrO2 cathode with improved electrical conductivity from 8 × 10⁻⁵ S/cm for bare NaCrO2 to 0.47 S/cm for the coated counterpart. Further, the initial specific capacity of NaCrO2 has increased from 112 mAh/g for bare NaCrO2 to 121 mAh/g for coated NaCrO2 at C/6 rate, and the cycle stability has improved dramatically, displaying 90% capacity retention after 300 cycles at C/6 rate. Other coatings have been studied as well. For example, Wu et al. [21] constructed a carbon-LaF3 layer on the NaCrO2 particle surface by pyrolysis of PVDF and La2(CO3)3·8H2O. The co-coated cathode delivers 92.6% of cycle retention at 2C over 400 cycles. Wang et al. [22] investigated Cr2O3-coated NaCrO2 and showed less deteriorated capacity fade at relatively high rates over bare NaCrO2. Similarly, Ikhe et al. [23] have applied Cr2O3 coating to Al-doped NaCrO2, which also exhibited improved long-term cycle retention.
Doping NaCrO2 has been studied as well. Examples include the Ti dopant at the Cr site exhibiting 80% capacity retention after 800 cycles at 1C [15], the Mn dopant at the Cr site displaying 94.8% capacity retention after 200 cycles [16], and the Ca dopant at the Na site with 76% capacity retention after 500 cycles [17]. The improvement of Ti doping is attributed to the more stable O3-structure and the delayed phase transition of rhombohedral O3 → monoclinic O’3 → monoclinic P3 during charge because of the stronger Ti-O bond relative to the Cr-O bond [15], whereas the enhancement from Mn doping is ascribed to the minimization of volume change during cycles [16] and the improvement of Ca doping has been related to the strong interaction between Ca2+ and O2− leading to less interlayer expansion [17].
In light of the prior investigations [7,14,21], the present study aims to answer two fundamental questions: (i) whether the widely observed ~110 mAh/g specific capacity of NaCrO2 at the upper cutoff voltage (UCV) of 3.6 V vs. Na/Na+ is limited by thermodynamics or by kinetics (such as by the electrical conductivity at the electrode/electrolyte interface) and (ii) what would be the effective method(s) to form a uniform carbon coating on NaCrO2 particles with no undesirable chemical reactions between the coating and NaCrO2 so that outstanding electrochemical properties can be achieved. By investigating several different dry-powder mixing and wet-chemical mixing methods with different conditions, this study reveals that wet-chemical mixing method is more effective in forming a uniform carbon coating than dry-powder mixing method and can greatly boost the initial discharge specific capacity of carbon-coated NaCrO2 to 140 mAh/g when the UCV = 3.6 V, the highest discharge specific capacity with the UCV at 3.6 V vs. Na/Na+ ever reported in the literature. This result indicates that the rate-limiting step in the sodiation/desodiation of NaCrO2 is the low electronic conductivity at the electrode/electrolyte interface.

2. Materials and Methods

2.1. Material Synthesis

To obtain NaCrO2 crystals, Na2CO3 (Sigma Aldrich (Sofia, Bulgaria), ≥99.5%) and Cr2O3 (Sigma Aldrich, ≥98%) particles were first mixed using a mortar and pestle in a 1:1 molar ratio. Then, the mixture was ball milled for 10 h at room temperature in Ar using an 8000M SPEX Mill with a 10:1 ball-to-powder charge ratio. Stainless steel (SS) balls of 6.4 mm in diameter and an SS container were utilized for ball milling. After ball milling, the mixture was collected and pressed into pellets, which were divided into two groups for either one-step synthesis or two-step synthesis. Specifically, pellets of one-step synthesis were subjected to tube furnace heating once, while pellets of two-step synthesis were subjected to tube furnace treatment twice with the addition of a carbon source as explained below. All the samples discussed below are summarized in Table 1.
For one-step synthesis, pellets of 10-h ball milled mixture were ground into powder and mixed with 25 wt.% polyacrylonitrile (PAN, Sigma Aldrich, MW 150,000) powder. The powder mixture obtained from this process was pressed into pellets again. Then, they were subjected to a solid-state reaction for 5 h in Ar. Some pellets were held at 750 °C, and this set of samples was named “PN1-C” hereafter. Other pellets were held at 900 °C, and these samples were termed as “PN2-C”. In addition, some pellets of 10-h ball-milled mixture were directly subjected to tube furnace treatment without a carbon source to form bare NaCrO2 samples in one-step synthesis. There were three different heating conditions for making bare NaCrO2 samples in one-step synthesis. The bare NaCrO2 powder derived from heating at 750 °C for 5 h in Ar was denoted as “B1”, whereas the bare powders from heating at 900 °C for 5 h and 2 h in Ar were termed as “B2” and “B3”, respectively.
As for two-step synthesis, all pellets of 10-h ball milled mixture were subjected to heating at 900 °C for 2 h in Ar to form NaCrO2 first. Once these NaCrO2 pellets were collected, they were ground into powder and mixed with three different carbon sources. The first set of NaCrO2 powder was mixed with 25 wt.% PAN powder as the carbon source, then pressed into pellets and finally subjected to heating at either 750 °C or 900 °C for 1 h in Ar. The resulting powder from 750 °C heating was named as “PN3-C”, whereas the powder from 900 °C was denoted as “PN4-C”. The second set of NaCrO2 powder was mixed with 50 wt.% citric acid (Sigma Aldrich, ≥99%) powder as the carbon source, then pressed into pellets and finally subjected to 650 °C treatments for 10 min in Ar. This set of samples was labeled as “ca-C”. The third set of NaCrO2 powder was mixed with 30 wt.% sucrose powder, then pressed into pellets, and finally subjected to heating at 650 °C for 10 min in Ar. The powder from this process was denoted as “s1-C”.
The carbon-coated NaCrO2 powder synthesized using a wet-chemical mixing method was obtained using the following procedure and conditions. First, sucrose powder (Sigma Aldrich, MW 342.3, ≥99.5%) was dissolved in pyrimidine (ThermoFisher (Waltham, MA, USA), MW 80.09, ≥98%) solvent. Separately, the bare NaCrO2 powder synthesized at 900 °C mentioned above was dispersed in ethanol and then mixed with sucrose dissolved in pyrimidine using a magnetic mixer. The weight ratio of sucrose to NaCrO2 powders in the mixture was 3:10. Ethanol and pyrimidine of the mixed suspension were vaporized at 100 °C, while maintaining mechanical stirring using the magnetic mixer at 120 rpm. Once vaporization was completed, the dried powder was collected in a crucible and subjected to heating at 650 °C for 1 h in Ar to form carbon-coated NaCrO2 powder, which was termed “s2-C”.
To avoid exposure to air, all pellet preparation was conducted in an Ar-filled glovebox (H2O < 0.1 ppm and O2 < 0.1 ppm). Further, pellets were loaded into an Al2O3 crucible, which was covered with Parafilm® before the crucible was transferred from the glovebox to a tube furnace with flowing Ar gas. After sample loading the tube furnace was evacuated down to 2 × 10⁻² torr and purged with Ar three times before heating. After a high-temperature reaction, the Al2O3 crucible was covered with new Parafilm® immediately. This Parafilm® sealing process took less than 5 s and did not expose the sample to air because the crucible was at the end of the tube furnace filled with flowing Ar gas. The Al2O3 crucible was then transferred to the glovebox immediately for pellet collection. The collected pellet was ground to a fine powder using a mortar and pestle and stored in the glovebox for the next steps.

2.2. Material Characterization

Structural analysis of different types of NaCrO2 was performed using a Bruker D2 diffractometer with a Cu Kα source (5–100° 2θ, 0.0202144E steps, 0.5 s/step, 0.6 mm divergence slit, 2.5° Soller slits, 3 mm scatter screen height). The phases present were identified with the aid of the PDF-4+ database and the internal standard Si crystals (5 wt.% in all powder samples). The existence of carbon coating was analyzed using Raman spectroscopy (Renishaw inVia™) with 514 nm of excitation wavelength and a grating of 1800 lines per mm. The size and morphology of the NaCrO2 powder particles were observed using field emission scanning electron microscopy (JSM-6701F JEOL FESEM). Samples were coated with silver via a sputter coater before FESEM observation. To further confirm the particle size and identify the coating thickness and elemental distribution, FEI Talos F200X TEM/STEM with the capability for high-resolution TEM imaging in the Center for Nanoscale Materials (CNM) at Argonne National Laboratory (ANL) was utilized.

2.3. Battery Fabrication and Evaluation

NaCrO2 cells were formed with a Na chip as the reference and counter electrode using a CR2032 coin cell machine (MTI Corp., Richmond, CA, USA). The Na chip was made by slicing a Na chuck, pressing the slice into a pancake, and then punching a Na chip from the pancake. The thickness of the Na chip made in this study was ~225 μm. The cathode was formed by mixing NaCrO2 powder (active material), super P carbon black (CB, MTI® (Richmond, BC, Canada) Super P conductive CB, ≥99%), and poly(vinylidene fluoride) (PVDF, Oakwood Chemical (Steele City, SC, USA)) in a weight ratio of 8:1:1, 7:2:1 or 6:3:1 in adequate N-methylpyrrolidone (NMP, Acros Organics (Geel, Belgium), 99.5%) solvent. Mixing of these cathode ingredients was carried out in four steps, as described below.
First, PVDF was completely dissolved in NMP by subjecting the PVDF/NMP mixture to 8-min sonication in a sonicator and then shear mixing using a THINKY machine for 5 min at 2000 rpm. Second, CB was added to the PVDF solution and subjected to 8-min sonication and 5-min THINKY machine mixing at 2000 rpm. Third, half of the active material was added to the PVDF + CB slurry and subjected to 8-min sonication and 5-min THINKY machine mixing. Finally, the last half active material was added to the PVDF + CB + NaCrO2 slurry and subjected to 8-min sonication and 5-min THINKY machine mixing. This four-step mixture procedure resulted in a uniformly mixed slurry which was then cast on an Al foil. The coated Al foil was then heated in a vacuum oven at 60 °C for 6 h and 120 °C for another 6 h. The active material loading in each cathode was calculated by weighing aluminum foils before and after heating. The electrolyte used was 1.0 M sodium hexafluorophosphate (NaPF6, Sigma Aldrich, 98%) in propylene carbonate (PC, Sigma Aldrich, MW 102.09, 99.7%) with 2 vol% of fluoroethylene carbonate (FEC, Sigma Aldrich, MW 106.05, ≥99%). All coin cells were charged/discharged at 0.25C (1C = 125 mA/g NaCrO2) using Neware BTS3000 Battery Testers for 50 cycles between 2.0 and 3.6 V vs. Na/Na+.

3. Results and Discussion

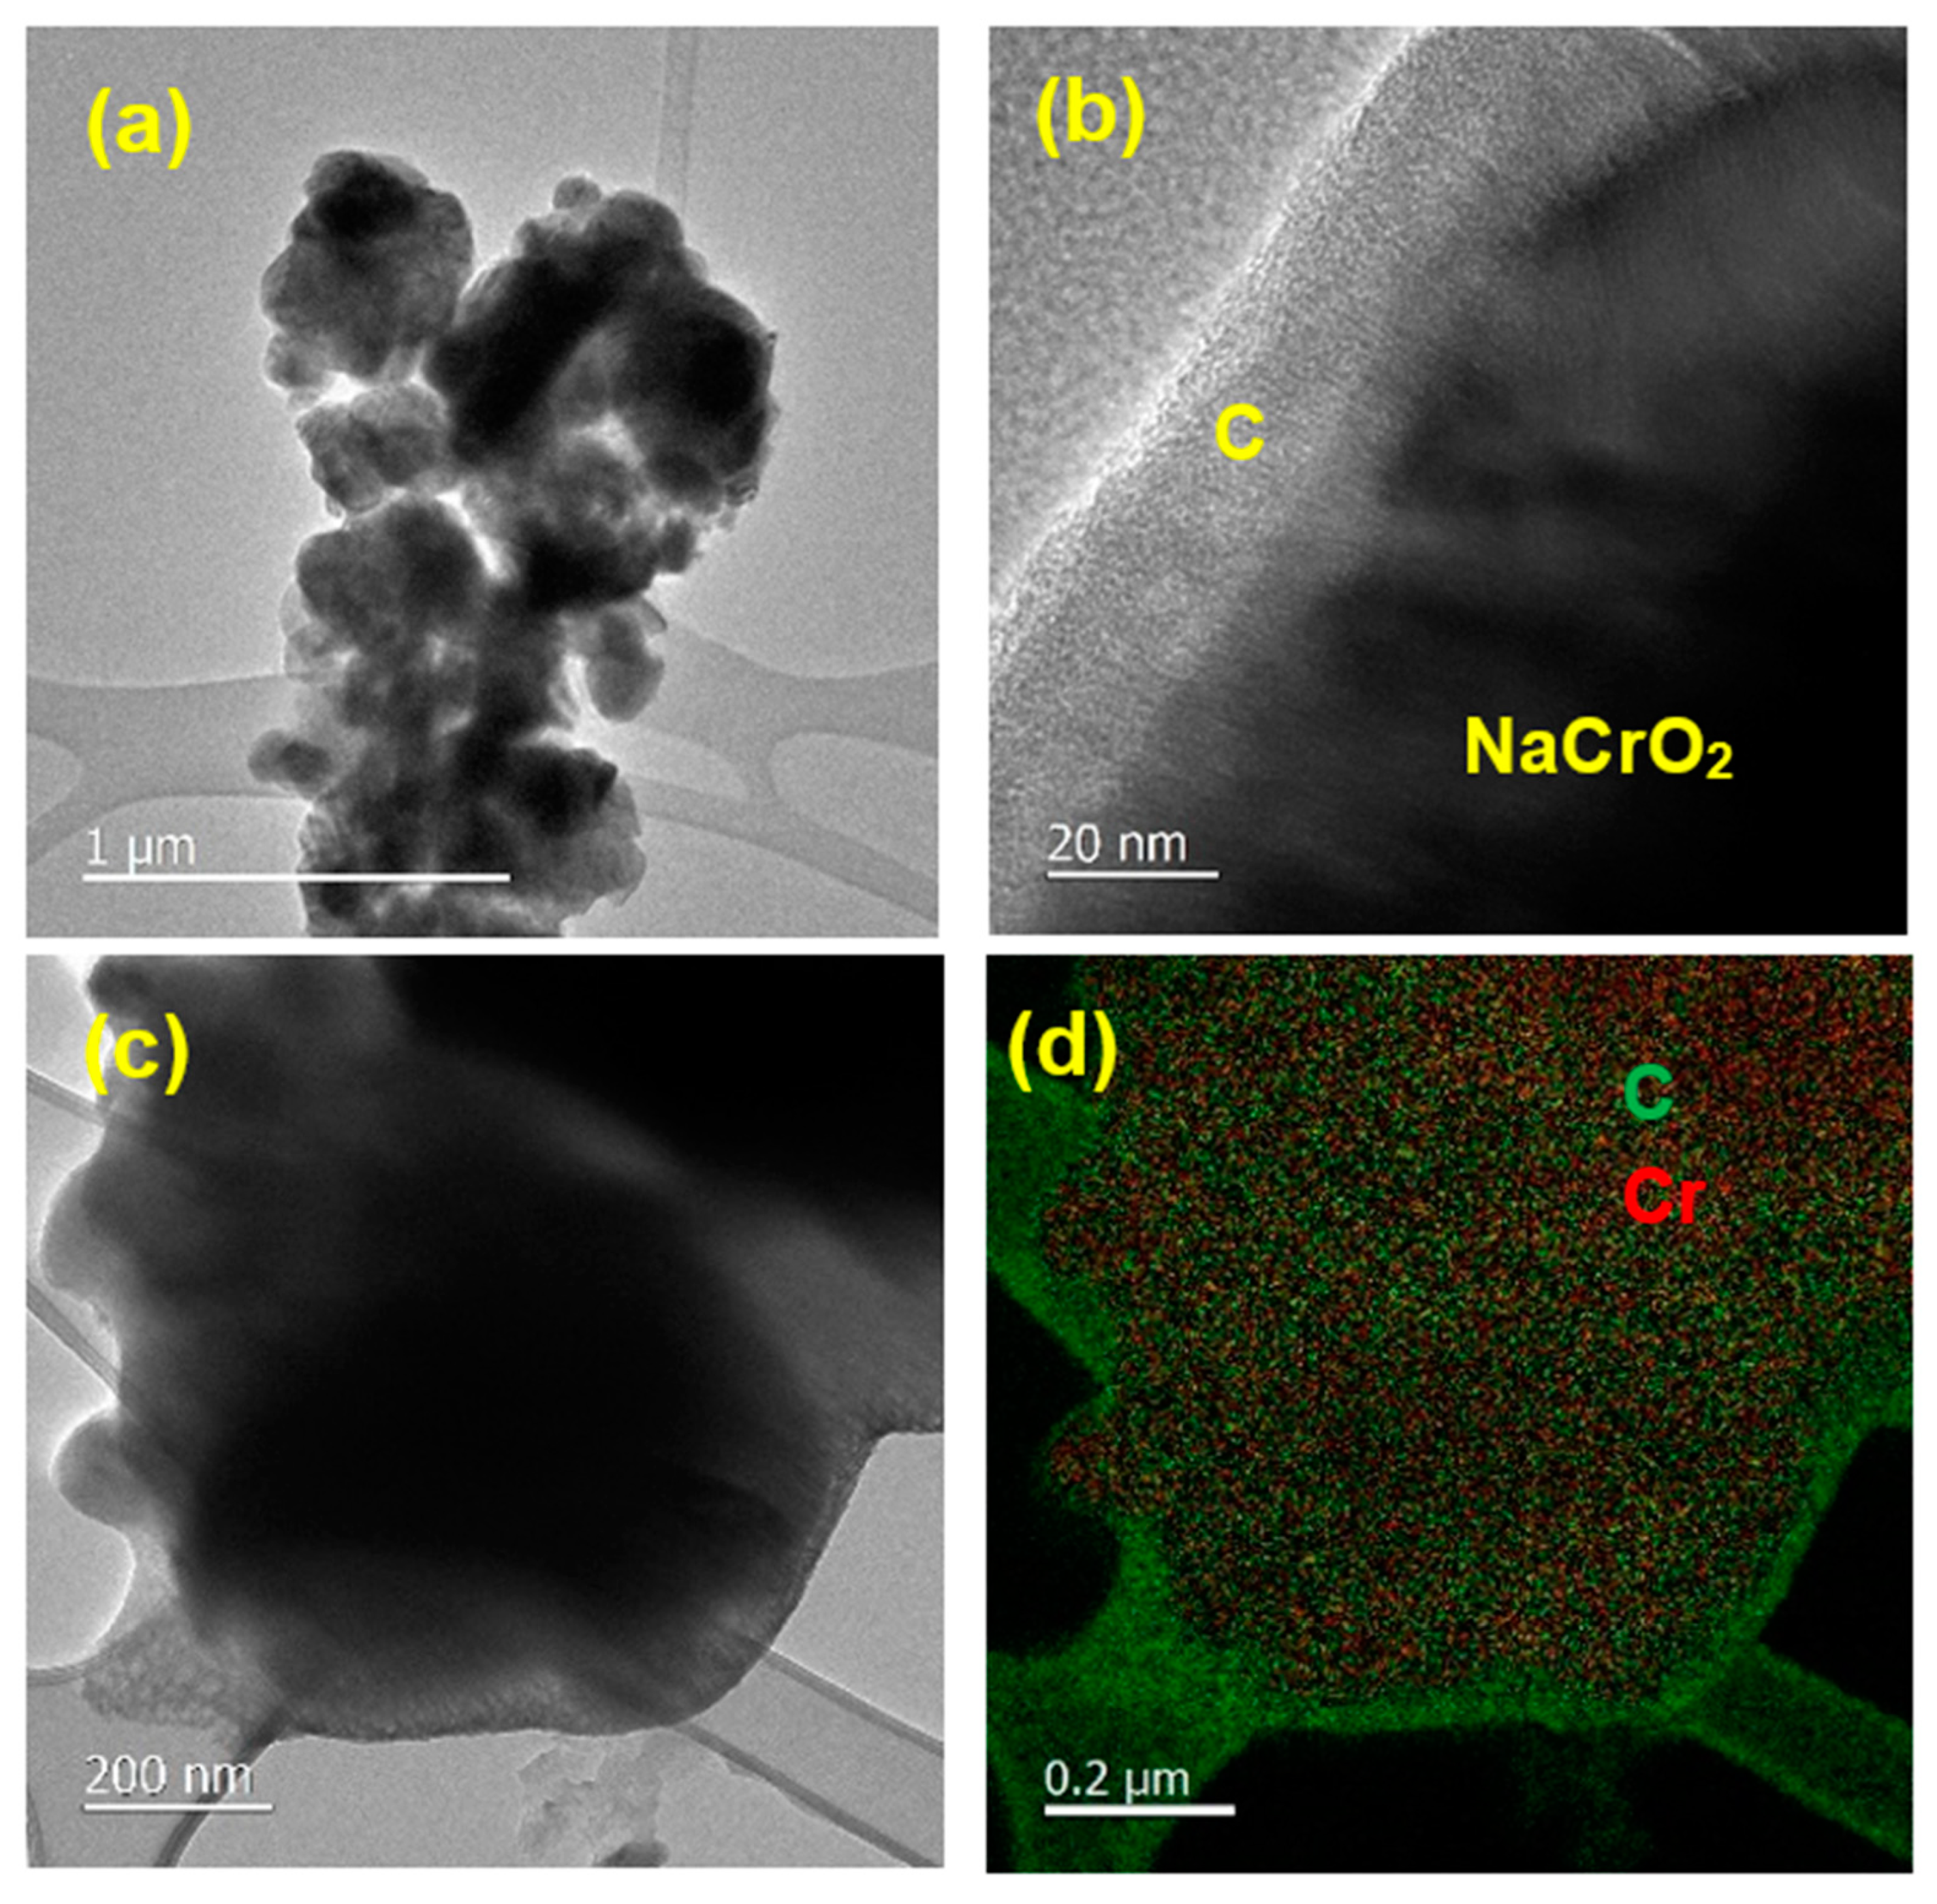
3.1. SEM and TEM Characterization

Figure 1a presents a SEM image of the s1-C sample, showing that most particles range from ~30 nm to 150 nm with a few exceptions. These particles are extremely fine when compared to the previously reported NaCrO2 particles with only 1-h ball milling at ambient temperature before 900 °C high-temperature reaction [11]. Figure 1b is the typical SEM image of the B2 sample. It is clear that the particle sizes of the B2 sample (~80 nm to 400 nm) are larger than those of the s1-C sample. The difference is obviously due to the longer reaction time of B2 at 900 °C than s1-C (5 h vs. 2 h) because the ball milling time and the first treatment temperatures are the same for both samples. The second treatment of the s1-C sample at 650 °C is not expected to have much influence on particle sizes because the second treatment temperature and time (650 °C and 10 min) are much lower than the first treatment ones (900 °C and 2 h). Note that the SEM images of these two samples are presented in Figure 1 because they cover the entire range of the particle sizes of NaCrO2 synthesized at 900 °C in this study.
TEM analysis of s2-C particles confirms the particle size analysis via SEM. As shown in Figure 2, s2-C particles have sizes ranging from ~60 to 300 nm. The particle sizes of s2-C are similar to those of s1-C (Figure 1a) because both have been subjected to a 900 °C reaction for 2 h before the carbon coating treatment at 650 °C (Table 1). The carbon coating of s2-C powder is found to be about 20 nm thick (Figure 2b) and uniform on the surface of NaCrO2 particles (Figure 2d). Note that the elemental mapping is done in a transmission mode (3D projection), and thus both carbon and chromium appear to distribute uniformly inside the carbon-rich surface.
It is interesting to note that the particles of both s1-C and B2 samples do not exhibit hexagonal morphology. In contrast, our previous study [11] reveals that ball milling of Na2CO3 + Cr2O3 powder mixture for 1 h at ambient temperature followed by a 900 °C reaction can lead to hexagonal morphology, reflecting the crystal structure symmetry of NaCrO2 (hexagonal O3). The lack of hexagonal particles in the present study can be attributed to its longer ball milling time (10 h) before the 900 °C reaction because all other conditions are the same between the two studies. Furthermore, longer ball milling time results in nanoparticles. This is the precise reason why the 10 h ball-milled powder mixture does not lead to hexagonal morphology because hexagonal morphology requires large flat surfaces derived from the basal plane of hexagonal crystals (see Figure S1 in Supplementary Materials) along with small side surfaces. Such large flat surfaces require crystal growth of nanoparticles to become large particles (>~500 nm, see Figure S1). Thus, 10 h ball milling combined with a 900 °C reaction for 2 h or 5 h is not sufficient for nanoparticles to grow into large particles with hexagonal morphology. In contrast, 1 h ball milling combined with a 900 °C reaction for 1 h is sufficient to obtain NaCrO2 particles of diameter about 500 nm and larger with hexagonal morphology (Figure S1).

3.2. X-ray Diffraction Analysis

A comparison of the XRD patterns of three bare NaCrO2 samples (B1, B2 and B3) is shown in Figure 3. All three samples contain O3-NaCrO2, Na-deficient P2-NaxCrO2 as an intermediate compound in the synthesis of O3-NaCrO2, impurity O3-CrO2, and Si (added as the internal standard). The peaks from O3-NaCrO2 match ICDD No. 00-025-0819 well, whereas both P2-NaxCrO2 and O3-CrO2 have been identified in the previous studies after detailed Pawley and Rietveld refinements [12,13]. It has been shown that the formation of P2-NaxCO2 in the final product is due to some loss of Na2CO3 during synthesis because of the high vapor pressure of the Na source. The formation of O3-CrO2 has been attributed to the short time exposure of NaCrO2 powder to ambient air when mixing NaCrO2 powder with the Si internal standard and during XRD data collection, because NaCrO2 is sensitive to moisture in air [14]. The reaction between NaCrO2 and moisture results in a slight phase separation of NaCrO2 to a trace amount of O3-CrO2 and NaOH [12].
With the aid of the internal standard Si, the lattice parameters of three bare samples have been determined and summarized in Table 2. Note that 750 °C reaction leads to the lowest lattice parameter c (15.8529 Å), whereas 900 °C reaction for 5 h results in the highest lattice parameter c (15.9769 Å) with 900 °C reaction for 2 h having the intermediate lattice parameter c (15.9577 Å). These results indicate that increasing the reaction temperature from 750 to 900 °C leads to a larger c parameter, and so does increasing the reaction time at 900 °C.
Figure 4 compares the XRD patterns of PN1-C, PN2-C, PN3-C and PN4-C samples. Several interesting phenomena are noted in Figure 4. First, chromium carbides, likely Cr7C3 and Cr3C2, are found in two-step synthesized PN3-C and PN4-C samples, unambiguously revealing that reactions between NaCrO2 and the CO, H2, CH4 and/or C derived from the decomposition of PAN can take place at both 750 and 900 °C. However, the reaction is much stronger, and more carbides are formed at 900 °C than at 750 °C. Second, the formation of the carbides is avoided in one-step synthesized PN1-C and PN2-C samples even though their reaction temperatures are 750 and 900 °C, respectively. One possible reason for such interesting phenomena is that in one-step synthesis the reaction between Na2CO3 and Cr2O3 releases CO2 gas as shown in Equation (1) [10], which forms a gaseous envelope and prevents the reactions between the newly formed NaCrO2 with the CO, H2, CH4 and/or C derived from the decomposition of PAN. Although there are no reactions between the newly formed NaCrO2 and the decomposition products of PAN in one-step synthesis, the gas evolution during the formation of NaCrO2 could break the carbon coating on the surface of NaCrO2 and prevent conformal contact between them.
Na2CO3 + Cr2O3 = 2NaCrO2 + CO2
A comparison of the XRD patterns of ca-C, s1-C, and s2-C samples is shown in Figure 5. Note that these samples are formed in two-step synthesis, but none of them has any carbide formation because the second step for the carbon coating formation is conducted at 650 °C for 10 min only. This is in sharp contrast to PN3-C and PN4-C, both of which have carbide formation because their second step for the carbon coating formation is conducted at higher temperatures (750 and 900 °C, respectively). The XRD patterns of ca-C, s1-C and s2-C are almost identical to that of the B3 sample, suggesting that the carbon coatings on the surface of NaCrO2 particles for ca-C, s1-C, and s2-C samples, if present, are amorphous. Finally, it should be emphasized that all samples, regardless of being formed at 750 or 900 °C, contain the O3-NaCrO2 phase, indicating that the O3-NaCrO2 phase can be formed at either 750 or 900 °C even though the lattice parameters, a and c, have altered at different temperatures and holding times. This phenomenon is consistent with many studies, revealing that O3-NaCrO2 starts to form at ~640 °C [10], while most studies have used 900 °C to synthesize O3-NaCrO2 [5,7,8,9,18].

3.3. Raman Spectroscopy Results

Figure 6 shows the Raman spectra of B1, PN1-C, ca-C, and s1-C samples. For the B1 sample, there is one major peak at 569 cm−1 and a small peak at ~486 cm−1. These two peaks likely originated from the A1g and E1g modes of transition metal (TM)−O vibrations of the layered hexagonal R 3 ¯ m symmetry of NaCrO2 crystals, respectively. This proposal is based on the previous studies by Kendrick’s group [24] and Amine’s group [25] in analyzing layered hexagonal Na[Ni1/3Fe1/3Mn1/3]O2 material with R 3 ¯ m symmetry, showing that the A1g and E1g modes of TM-O vibrations of Na[Ni1/3Fe1/3Mn1/3]O2 appear at 580 and 490 cm−1, respectively. No carbon D band and G band are present in this sample because B1 does not have carbon coating treatment. Note that the A1g peak of NaCrO2 at 569 cm−1 is also present in all carbon-coated samples, whereas the weak E1g peak of NaCrO2 at 486 cm−1 is barely visible because of the presence of carbon coating. In addition, PN1-C, ca-C, and s1-C all contain carbon D bands at ~1360 cm−1 and G bands at ~1580 cm−1 [26,27] because all of these samples have carbon coatings. Furthermore, they all possess carbon 2D bands at ~2720 cm−1 and D+D’ bands at ~2970 cm−1 although these two peaks are very broad and merge into one.
To evaluate the quality of carbon coating on PN1-C, ca-C, and s1-C, we have applied Breit-Wigner-Fano (BWF) and Lorentzian methods to fit D and G peaks, respectively [28]. The G band generally corresponds to crystalline graphitic structure, while the D band is attributed to the disorder carbon layer [26,27]. The intensity ratio of D to G peaks, ID/IG, is often used to estimate the degree of perfection of graphene planes. Since the positions of Raman spectra are determined by the fixed wavelength of 514 nm, we can thus calculate and compare the ID/IG of each sample, which are listed in Table 3. The lower ID/IG value of 0.42 from s1-C powder signifies less imperfection in the carbon structure. In contrast, PN1-C exhibits a higher ID/IG value, which could be related to highly defective graphite formation. All three carbon-coated powders show the full width at the half maximum (FWHM) the of D band larger than 100 cm−1, which suggests that amorphous carbon structures are formed in these samples [27]. This is consistent with the presence of the D+D’ band, which is activated by defective graphite [29]. Taking the XRD and Raman results together, it can be concluded that carbon coatings in PN1-C, ca-C and s1-C are amorphous.

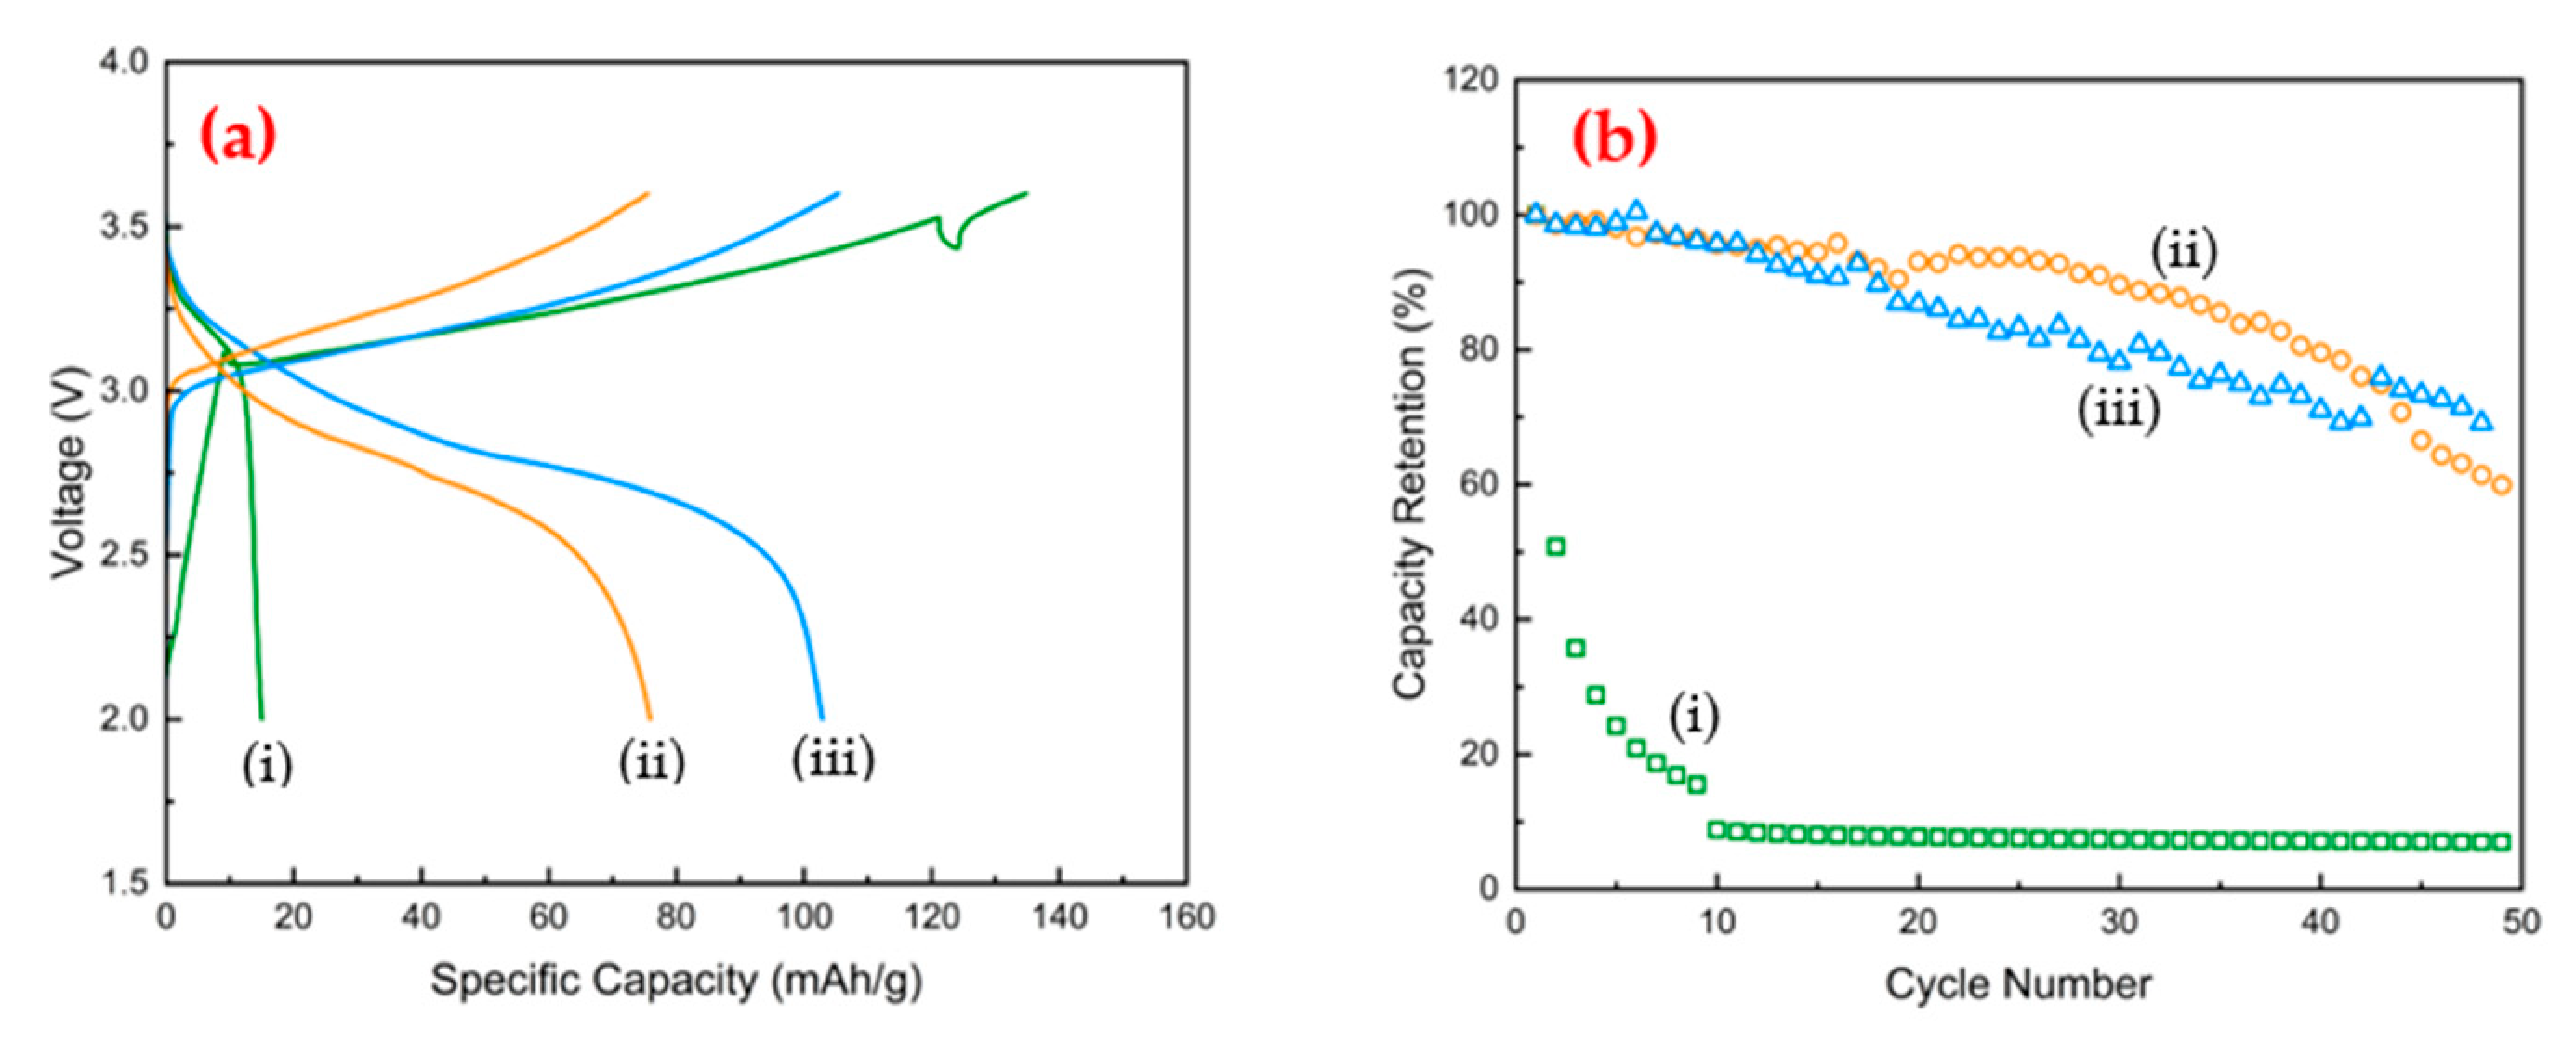
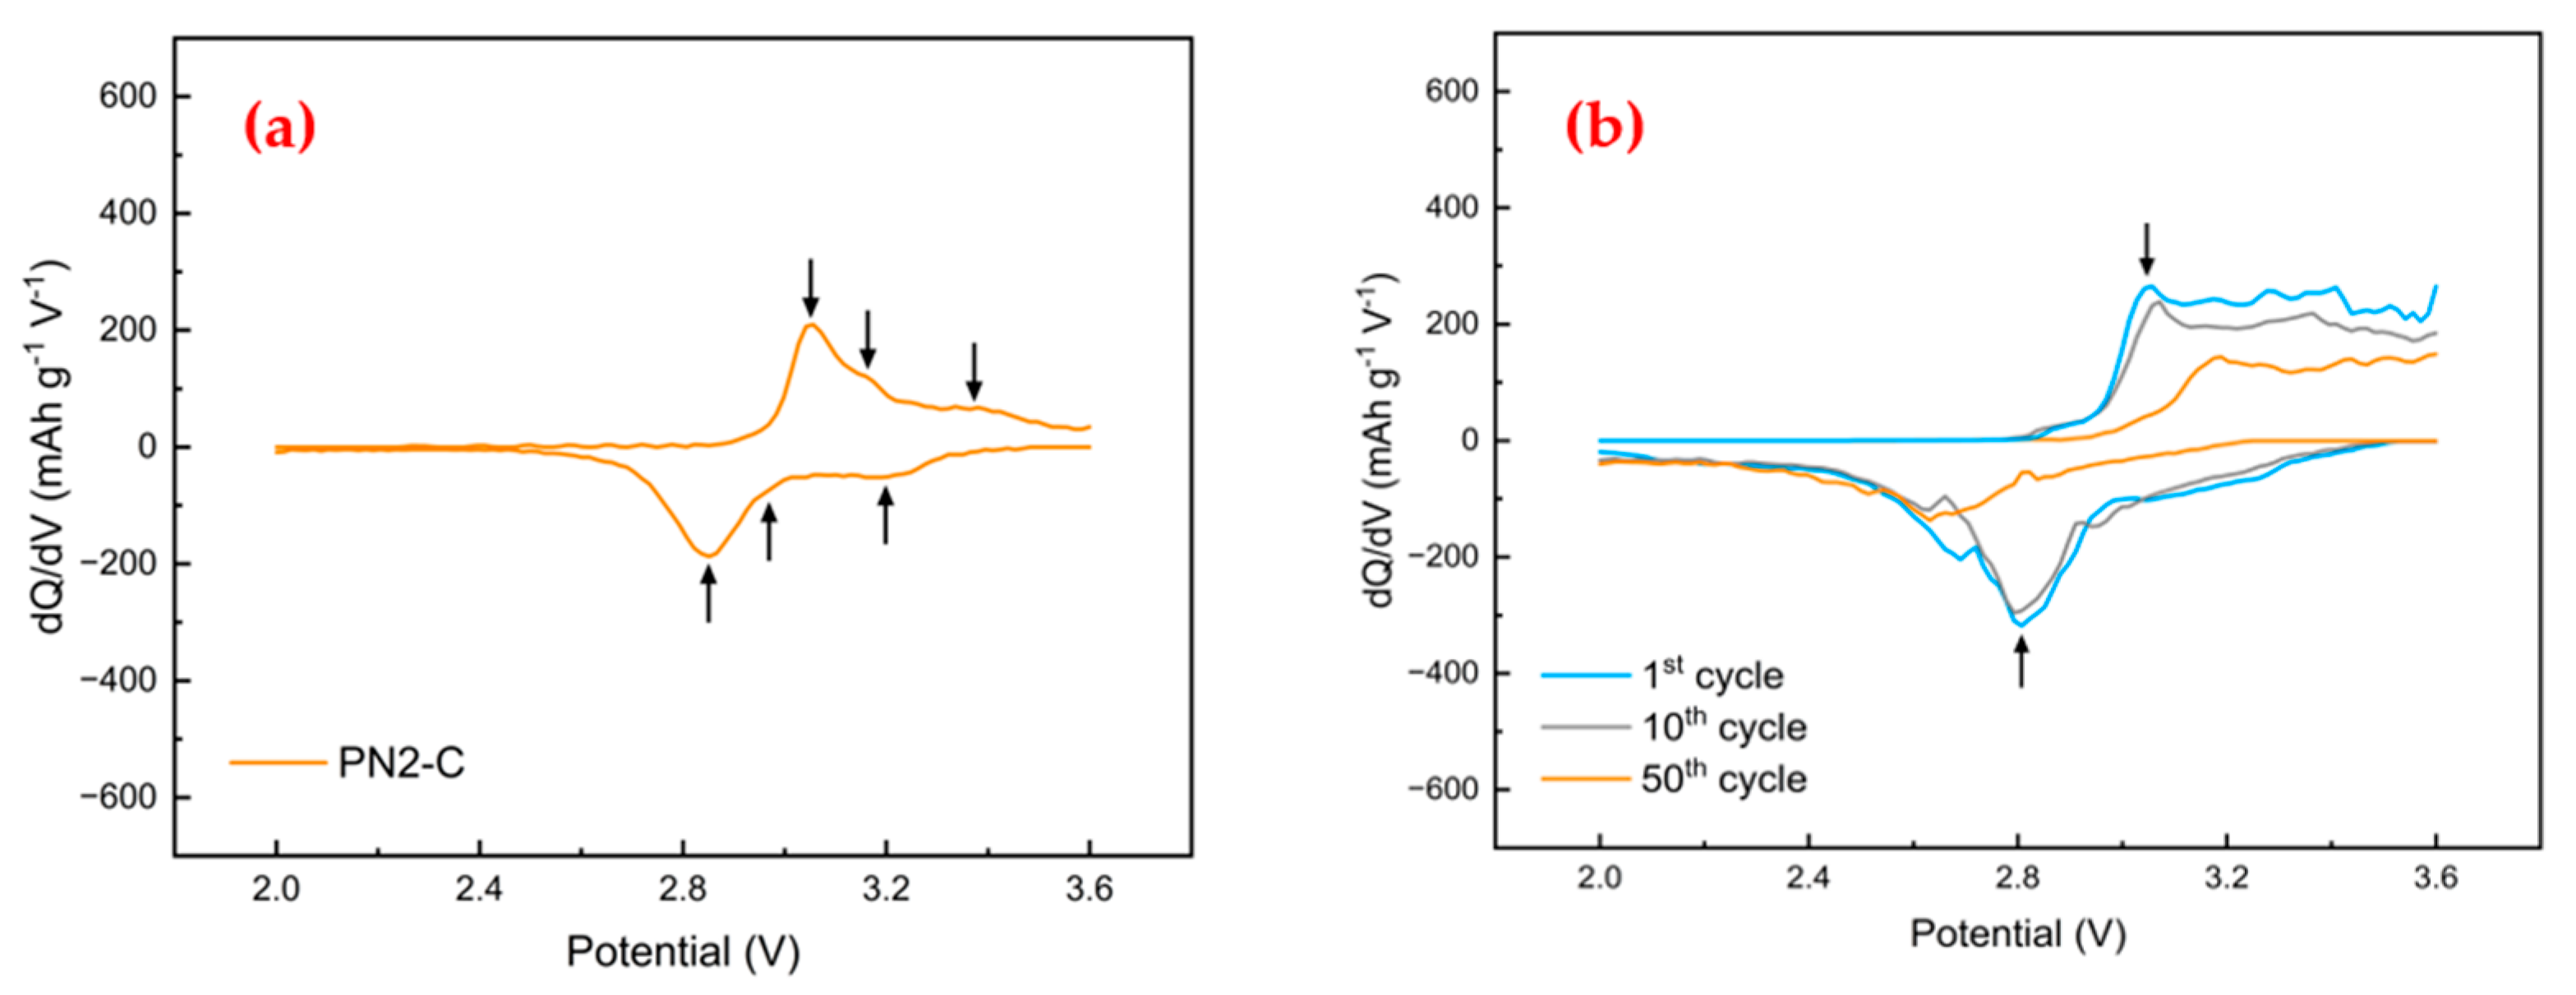
3.4. Battery Cell Evaluation

Figure 7a,b show the first charge/discharge voltage profiles and cycle stability of bare NaCrO2 electrodes (B3) as a function of carbon black (CB) loading. It is noted that when CB loading is 10 wt.%, the specific capacity of B3 is very low with a discharge capacity of only about 17 mAh/g. However, as CB loading increases, the specific capacity improves. When CB loading increases to 30 wt.%, the specific discharge capacity becomes 102 mAh/g, approaching the typical value of 110 mAh/g reported by many researchers [5,7,8,9,11,13,14]. These data unambiguously indicate that NaCrO2 has poor electronic conductivity and requires the addition of a large amount of CB to ensure the formation of an electronically conductive network so that most NaCrO2 particles can participate in redox reactions. It should be noted that a previous study [13] only added 10 wt.% CB and obtained the initial specific discharge capacity of ~100 mAh/g. The present study requires a 30 wt.% CB to achieve the similar specific capacity because NaCrO2 particles in this study are significantly smaller than those in the previous study [13], i.e., 80 to 400 nm for the present study versus 200 nm to 5 µm for the previous study. This result is consistent with previous studies [30,31] which demonstrated that in order to ensure most electrode active particles of very small sizes in contact with a CB network, a large amount of CB is required. Note that although small particle sizes of NaCrO2 can improve the ion diffusion by shortening the pathways and may result in higher initial capacity, materials with small particle sizes (and thus high surface area) lead to the accumulation of side products generated from electrolyte decomposition, which ultimately results in poor cycling performance.
B3 cells with 10 wt.% CB not only have low specific capacities, but also exhibit very poor cycle stability. As shown in Figure 7b, B3 cells with 20 and 30 wt.% CB display relatively high capacity retention at around 70% after 50 cycles, whereas B3 cells with 10 wt.% CB exhibit rapid capacity decay and almost die after 10 cycles. The good capacity retention exhibited by 20 wt.% and 30 wt.% CB samples can be ascribed to their high CB concentrations which ensure the participation of most NaCrO2 particles in redox reactions for many cycles. In contrast, B3 cells with 10 wt.% CB do not have sufficient CB to ensure the participation of active NaCrO2 particles for many cycles. Instead, some active NaCrO2 particles lose contact with the CB network after a few cycles, thereby leading to the observed drastic decay of the specific capacity in about 10 cycles. Thus, at least 20 wt.% CB is required for the bare NaCrO2 particles synthesized in this study to achieve their specific capacity at the 110 mAh/g level and to possess reasonable capacity retention.
The specific capacities and cycle stabilities of B3 cells displayed in Figure 7 are also consistent with their coulombic efficiencies. As shown in Figure S2, B3 cells with 10 wt.% CB have a low coulombic efficiency in the first cycle (80%) and gradually increases to 98% only after eight cycles. The low coulombic efficiency of these cells can be attributed to the loss of active NaCrO2 particles from participation in the redox reactions, as mentioned above. In contrast, the other two B3 cells with 20 and 30 wt.% CB have high coulombic efficiencies of about 98% in the first cycle immediately. Clearly, their higher CB concentrations are responsible for the observed high coulombic efficiencies because most active NaCrO2 particles in these cells are in contact with the CB networks even after extensive cycling.
The charge/discharge voltage profiles and cycle stability of carbon-coated NaCrO2 half cells with 10 wt.% CB are shown in Figure 8. The electrochemical properties of these cells can be compared with B3 cells with 10 wt.% CB is shown in Figure 7 directly. It can be seen that all carbon-coated NaCrO2 cells have higher specific capacities than the corresponding B3 cells with 10 wt.% CB. For example, PN1-C, PN2-C, and s1-C cells have the first discharge-specific capacities at 39, 56 and 60 mAh/g, respectively, all of which are higher than 17 mAh/g delivered by B3 cells with 10 wt.% CB. The improved specific capacities are no doubt due to the presence of the carbon coating. However, the degree of improvement varies with the carbon coating conditions. Specifically, PN1-C exhibits small improvement in the specific capacity, likely owing to its low synthesis temperature at 750 °C for the formation of NaCrO2, while all other cells with synthesis temperature at 900 °C. As discussed previously, synthesis at 750 °C results in O3-NaCrO2 powder with lower P2-NaxCrO2 and O3-CrO2 concentrations than synthesis at 900 °C. However, a previous study using synchrotron radiation [10] has revealed that O3-NaCrO2 crystals start to form by solid-state reaction between Cr2O3 and Na2CO3 reactants at ~640 °C and continue to change from highly-defective NaCrO2 crystals with poor thermal stability to a less-defective Na-richer NaCrO2 crystals at 900 °C. This may be the reason why PN2-C and s1-C cells with NaCrO2 synthesized at 900 °C exhibit higher specific capacities than PN1-C cells with NaCrO2 synthesized at 750 °C.
Although the specific capacities of PN1-C, PN2-C and s1-C are higher than those of B3 cells with 10 wt.% CB, they are not as high as those of B3 cells with 30 wt.% CB, suggesting that the carbon coating of these NaCrO2 powders is not high quality. The likely reason for the low coating quality of PN1-C and PN2-C powder is the gas evolution during the formation of NaCrO2 in the one-step synthesis of PN1-C and PN2-C powder, which could break the carbon coating on the surface of NaCrO2 and prevent conformal contact between the carbon coating and NaCrO2 core. The low quality of the carbon coating on s1-C powder can be attributed to the mixing of NaCrO2 and sucrose in dry powder form, which makes it difficult to form a uniform and continuous carbon coating on the entire surface of NaCrO2 particles.
In sharp contrast, when NaCrO2 powder dispersed in ethanol is mixed with sucrose dissolved in pyrimidine, a continuous carbon coating can be formed after vaporization of the solvents followed by carbonization of sucrose (Figure 2). Such carbon-coated NaCrO2 (i.e., s2-C powder) has the same sucrose loading (30 wt.%) as s1-C powder, but offers unprecedented specific capacities at 142 mAh/g and 139 mAh/g for the first and second discharges, respectively (Figure 8c). These specific capacities are significantly higher than 110 mAh/g typically reported for bare NaCrO2 [5,7,8,9,11,13,14]. In other words, this set of half cells are definitely extracting out and inserting more than 50% Na ions per formula unit during charging and discharging, respectively. The very high initial specific capacities of s2-C are attributed to its uniform carbon coating because of its unique wet mixing of the carbon source and NaCrO2 particles before high-temperature carbonization reactions. The uniform carbon coating allows all NaCrO2 particles to participate in redox reactions, thereby very high specific capacities are delivered.
It should be emphasized that the phenomenon of ~140 mAh/g specific capacity higher than the typical value of ~110 mAh/g is scientifically interesting and technologically important. Although the specific capacity of ~110 mAh/g is widely reported for the charge/discharge voltage window between 2.0 and 3.6 V vs. Na/Na+ [5,7,8,9,11,13,14], we propose that this specific capacity is controlled by the kinetic factor, i.e., the electronic conductivity at the electrode/electrolyte interface is the rate-limiting step for Na-ion de/intercalation in the charge/discharge processes. Our present data unambiguously reveals that with the presence of a uniform carbon coating, the rates of Na-ion de/intercalation at the electrode/electrolyte interface can increase dramatically even though the charge/discharge voltage window remains constant between 2.0 and 3.6 V vs. Na/Na+. This proposal is also consistent with a previous study [14] showing the increase in the specific capacity of NaCrO2 from 112 mAh/g for bare NaCrO2 to 121 mAh/g for carbon-coated NaCrO2, thereby supporting the notion that the electronic conductivity at the electrode/electrolyte interface is the rate-limiting step for Na-ion de/intercalation in the charge/discharge processes. The present study can further increase the specific capacity from the previous 121 mAh/g [14] to ~140 mAh/g because the previous study used a dry powder mixing procedure to form the carbon coating whereas the present study uses a wet solution mixing procedure to form a uniform carbon coating and thus ultrahigh specific capacity.
It should be pointed out that with the initial specific capacity of s2-C cells at ~140 mAh/g, the Na extraction during charge is more than 50% Na ions per formula unit of NaCrO2. Earlier studies [8,9] have established that when more than 50% Na ions per formula unit are extracted during charge, the crystal structure of O3-NaCrO2 will change to O’3-type layered structure, then to P’3-type structure, and finally to another O3-type layered structure. The last crystal structure, once formed, cannot reversibly change back to the original O3-NaCrO2 structure [8,9]. As a result, redox reactions are not reversible and capacity decays very fast when more than 50% Na ions are deintercalated from O3-NaCrO2 crystals [8]. The present study is consistent with the previous finding [8,9] because the specific capacity has decreased to 71 mAh/g (~50% capacity loss) after only 50 cycles (Figure 8c). Therefore, the present study shows that a uniform carbon coating can increase the specific capacity to ultrahigh levels, but cannot improve the cycle stability.
To further understand the effects of carbon coating, dQ/dV analysis of several charge/discharge curves in Figure 8 has been performed. As shown in Figure 9a, the PN2-C cell has an oxidation peak at 3.06 V with two shoulder peaks at 3.16 V and 3.38 V. The corresponding reduction peaks are at 2.85 V, 2.97 V and 3.18 V, respectively. The oxidation peak at 3.06 V and its corresponding reduction peak at 2.85 V are related to the Cr3+/Cr4+ redox couple [7,32,33]. The other two oxidation peaks at 3.16 V and 3.38 V and their corresponding reduction peaks at 2.97 V and 3.18 V are associated with the order/disorder phase transitions, as reported by other studies [32,33]. For the 1st cycle of s2-C cells, the oxidation peak related to the Cr3+/Cr4+ redox is also located at 3.06 V (nearly identical to the Cr3+/Cr4+ oxidation peak position of PN2-C), revealing that the quality of carbon coating does not shift the Cr3+/Cr4+ oxidation voltage. However, the two shoulder peaks observed with PN2-C at 3.16 V and 3.38 V become difficult to distinguish for s2-C cells. This complication is likely due to the overlap of the Cr3+/Cr4+ redox peak with two order/disorder phase transformation peaks caused by the heterogeneous distribution of carbon-coated NaCrO2 in the electrode. In spite of this complication, a clear trend is observed, that is, the Cr3+/Cr4+ oxidation peak gradually shifts to higher voltages as the cycle number increases, owing to the increased polarization caused by cell degradation. As for the reduction in the 1st cycle of s2-C, the major peak appears at 2.81 V, which corresponds to the Cr3+/Cr4+ reduction, whereas the order/disorder phase transformations induce a broad yet weak peak at ~3.1 V. Again, these reduction peaks do not appear to be influenced significantly by the quality of carbon coating. However, it is obvious that the Cr3+/Cr4+ reduction peak gradually shifts to lower voltages as the cycle number increases, likely caused by cell degradation. Last but not least, the intensities of both Cr3+/Cr4+ oxidation and reduction peaks decrease as the cycle number increases, reflecting gradually decreased specific capacities. In short, the dQ/dV analysis reveals that uniform carbon coating does not change the oxidation/reduction potentials of NaCrO2. The enhanced specific capacity observed in Figure 8c is thus primarily due to the kinetic enhancement of the redox reactions at the electrode/electrolyte interface.
Before closing, it is worth mentioning that even for B3 and s1-C cells which have intercalated less than 50% Na ions per formula unit of NaCrO2 in discharge (i.e., the discharge specific capacity <125 mAh/g), capacity decay also takes place as shown in Figure 7b and Figure 8d. However, the capacity decay mechanism for these cells is related to the gradual irreversible migration of Cr ions from the octahedral sites in CrO2 slabs to both tetrahedral and octahedral sites in the interslab layer, as established previously [5,9] and, in some cases, related to the loss of contact of NaCrO2 with the conductive CB network as in the case of B3 cells with 10 wt.% CB (Figure 7b). In addition, it is interesting to note that s1-C cells have displayed an initial increase in the specific capacity in the first eight cycles before exhibiting gradual capacity decay afterward (Figure 8d). Such fluctuation is likely due to the nonuniform and discrete carbon coating on s1-C particles, which is formed by dry mixing of sucrose powder with NaCrO2 particles before high-temperature carbonization reactions. The nonuniform and discrete carbon coating in s1-C fails to connect all NaCrO2 particles in the electrode initially. As a result, only partial particles are activated at the initial cycles. Accompanied by the expansion/contraction of NaCrO2 particles during cycling, the conductive network formed by CB and carbon coating is gradually formed and provides increasing paths for ion/electron exchange between particles, which leads to an increasing capacity at the beginning. However, as charge/discharge cycles continue, other capacity decay mechanisms, such as the gradual irreversible migration of Cr ions from the octahedral sites in CrO2 slabs to both tetrahedral and octahedral sites in the interslab layer, become dominant and thus result in gradual capacity decay after eight cycles (Figure 8d).
Last but not least, it should be pointed out that CB has contributed to the storage capacity, particularly for cells with 30 wt.% CB. To estimate the CB contribution, we have fabricated 100% CB electrodes and built their half cells with a Na chip as the counter electrode and the same electrolyte as NaCrO2 half cells. The charge/discharge curves of 100% CB half cells are shown in Figure S3. Based on the data from the 100% CB half cells, we have estimated the contribution of CB in NaCrO2 half cells. For B3 cells with 30 wt.% CB, our estimation leads to 84 mAh/g-NaCrO2 after consideration of the CB contribution to the storage capacity, whereas the specific capacity becomes 102 mAh/g-NaCrO2 if we assume no CB contribution (see Table 1). The same estimation method is applied to s2-C cells with 10 wt.% CB. In this case, the estimated specific capacity is 136.5 mAh/g-NaCrO2 after consideration of the CB contribution, whereas the specific capacity is 141 mAh/g-NaCrO2 if we assume no CB contribution (Table 1). Note that the specific capacity of 136.5 mAh/g-NaCrO2 exhibited by s2-C cells after consideration of the CB contribution is still substantially larger than the typical specific capacity of 110 mAh/g-NaCrO2 reported in the literature [5,7,8,9,11,13,14].
In short, the present study reveals that uniform carbon coatings can address the issue of losing contact with the CB network and greatly enhance the specific capacity initially but cannot solve the problem of the gradual irreversible migration of Cr ions from the octahedral sites in CrO2 slabs to tetrahedral and octahedral sites in the interslab layer. Previous research has proven that doping is effective in circumventing this problem [15,16,17]. Therefore, combining the strategies of doping and carbon coating is essential to take advantage of ultrahigh specific capacity derived from wet solution mixing, which is helpful to strengthen the structural stability of NaCrO2 during severe sodiation/desodiation.

4. Concluding Remarks

The present study has investigated dry powder mixing and wet solution mixing of NaCrO2 with carbon precursors at several carbon coating formation temperatures and their effects on the electrochemical properties of carbon-coated NaCrO2. Based on this study, the following conclusions can be made.
  • NaCrO2 reacts with carbon precursors such as PAN at 750 and 900 °C to form carbides. Thus, to form a carbon coating on NaCrO2, the carbonization temperature should be at 650 °C, at which there is no reaction of NaCrO2 with carbon precursors and in-situ formed carbon.
  • One-step reaction to synthesize NaCrO2 crystals and carbon coating simultaneously can be done at 900 °C without the formation of carbides because the gas evolution in forming NaCrO2 via the reaction between Na2CO3 and Cr2O3 creates a gaseous envelope and prevents the reactions between the newly formed NaCrO2 with the carbon precursor and in-situ formed carbon. However, such carbon coating does not have high quality because the gas evolution during the formation of NaCrO2 could break the carbon coating on the surface of NaCrO2 and prevent conformal contact between them.
  • Ultrafine NaCrO2 particles (diameter < 600 nm) require high CB loading (20–30 wt.% CB) in the electrode to achieve the typical specific capacity of 110 mAh/g.
  • Carbon-coated NaCrO2 particles formed via dry powder mixing offer higher specific capacities and better cycle stability than bare NaCrO2, even with the CB loading at 10 wt.%.
  • Carbon-coated NaCrO2 particles formed via wet solution mixing provide unprecedented specific capacities at 140 mAh/g, which is substantially higher than the typical specific capacity of 110 mAh/g with the LCV and UCV at 2.0 and 3.6 V vs. Na/Na+, respectively.
  • The specific capacity at 140 mAh/g achieved with carbon-coated NaCrO2 unambiguously reveals that the typical specific capacity of 110 mAh/g reported by many researchers is controlled by the kinetic factor, i.e., the electronic conductivity at the electrode/electrolyte interface is the rate-limiting step for Na-ion de/intercalation of NaCrO2.
  • Although carbon-coated NaCrO2 particles formed via wet solution mixing provide unprecedented specific capacities, cycle stability is not improved because with the specific capacity at 140 mAh/g the Na deintercalation during charge is more than 50% Na ions per formula unit of NaCrO2, which leads to irreversible redox reactions.
  • Based on the present study, one possible direction to improve the cycle stability of NaCrO2 in the future is the integration of carbon coating and doping, which remains to be investigated in the future.

Supplementary Materials

The following supporting information can be downloaded at: https://www.mdpi.com/article/10.3390/batteries9090433/s1, Figure S1: FESEM image of NaCrO2 particles formed via ball milling at ambient temperature for 1 h followed by high-temperature reaction at 900 °C for 1 h [11]; Figure S2: Coulombic efficiencies of B3 half cells as a function of CB loading in the cathode: (i) 10 wt.%, (ii) 20 wt.%, and (iii) 30 wt.%; Figure S3: The charge/discharge voltage profiles of 100% CB half cells.

Author Contributions

Conceptualization, L.L.S. and Z.S.; methodology, L.L.S., Z.S. and M.A.; formal analysis, Z.S., Z.W. and L.L.S.; data curation, Z.S., Z.W. and L.L.S.; writing—original draft preparation, Z.S.; writing—review and editing, L.L.S. and M.A.; supervision, L.L.S.; project administration, L.L.S.; funding acquisition, L.L.S. All authors have read and agreed to the published version of the manuscript.

Funding

This research was funded by the U.S. National Science Foundation under the award number: DMR–1709959.

Data Availability Statement

The data presented in this study is contained within the article and Supplementary Materials.

Acknowledgments

The use of the Center for Nanoscale Materials (CNM) was supported by the U. S. Department of Energy, Office of Science, Office of Basic Energy Sciences, under Contract No. DE-AC02-06CH11357. The assistance in the TEM data collection provided Yuzi Liu at Argonne National Laboratory is greatly appreciated.

Conflicts of Interest

The authors declare no conflict of interest.

References

  1. Wang, P.F.; You, Y.; Yin, Y.X.; Guo, Y.G. Layered Oxide Cathodes for Sodium-Ion Batteries: Phase Transition, Air Stability, and Performance. Adv. Energy Mater. 2018, 8, 1701912. [Google Scholar] [CrossRef]
  2. Han, M.H.; Gonzalo, E.; Singh, G.; Rojo, T. A Comprehensive Review of Sodium Layered Oxides: Powerful Cathodes for Na-Ion Batteries. Energy Environ. Sci. 2015, 8, 81–102. [Google Scholar] [CrossRef]
  3. Xia, X.; Dahn, J.R. NaCrO2 Is a Fundamentally Safe Positive Electrode Material for Sodium-Ion Batteries with Liquid Electrolytes. Electrochem. Solid State Lett. 2012, 15, 2012–2015. [Google Scholar] [CrossRef]
  4. Zhou, Y.N.; Ding, J.J.; Nam, K.W.; Yu, X.; Bak, S.M.; Hu, E.; Liu, J.; Bai, J.; Li, H.; Fu, Z.W.; et al. Phase Transition Behavior of NaCrO2 during Sodium Extraction Studied by Synchrotron-Based X-Ray Diffraction and Absorption Spectroscopy. J. Mater. Chem. A 2013, 1, 11130–11134. [Google Scholar] [CrossRef]
  5. Komaba, S.; Takei, C.; Nakayama, T.; Ogata, A.; Yabuuchi, N. Electrochemical Intercalation Activity of Layered NaCrO2 vs. LiCrO2. Electrochem. Commun. 2010, 12, 355–358. [Google Scholar] [CrossRef]
  6. Chen, C.Y.; Matsumoto, K.; Nohira, T.; Hagiwara, R.; Fukunaga, A.; Sakai, S.; Nitta, K.; Inazawa, S. Electrochemical and Structural Investigation of NaCrO2 as a Positive Electrode for Sodium Secondary Battery Using Inorganic Ionic Liquid NaFSA-KFSA. J. Power Sources 2013, 237, 52–57. [Google Scholar] [CrossRef]
  7. Ding, J.J.; Zhou, Y.N.; Sun, Q.; Fu, Z.W. Cycle Performance Improvement of NaCrO2 Cathode by Carbon Coating for Sodium Ion Batteries. Electrochem. Commun. 2012, 22, 85–88. [Google Scholar] [CrossRef]
  8. Komaba, S.; Nakayama, T.; Ogata, A.; Shimizu, T.; Takei, C.; Takada, S.; Hokura, A.; Nakai, I. Electrochemically Reversible Sodium Intercalation of Layered NaNi0.5Mn0.5O2 and NaCrO2. ECS Trans. 2009, 16, 43–55. [Google Scholar] [CrossRef]
  9. Kubota, K.; Ikeuchi, I.; Nakayama, T.; Takei, C.; Yabuuchi, N.; Shiiba, H.; Nakayama, M.; Komaba, S. New Insight into Structural Evolution in Layered NaCrO2 during Electrochemical Sodium Extraction. J. Phys. Chem. C 2015, 119, 166–175. [Google Scholar] [CrossRef]
  10. Luo, M.; Ortiz, A.L.; Guo, F.; Shi, Z.; Li, L.; Ren, Y.; Zhang, X.; Chen, Z.; Shaw, L.; Chen, W. Mechanical Activation Enhanced Solid-State Synthesis of NaCrO2 Cathode Material. Materialia 2019, 5, 100172. [Google Scholar] [CrossRef]
  11. Sawicki, M.; Ortiz, A.L.; Luo, M.; Shaw, L. Structural-Defect-Controlled Electrochemical Performance of Sodium Ion Batteries with NaCrO2 Cathodes. ChemElectroChem 2017, 4, 3222–3230. [Google Scholar] [CrossRef]
  12. Luo, M.; Ortiz, A.L.; Shaw, L. Unraveling Processing-Structure-Electrical Conductivity Relationships of NaCrO2 Cathodes for Na-Ion Batteries. J. Electrochem. Soc. 2019, 166, 3546–3553. [Google Scholar] [CrossRef]
  13. Luo, M.; Ortiz, A.L.; Shaw, L. Enhancing the Electrochemical Performance of NaCrO2 through Structural Defect Control. ACS Appl. Energy Mater. 2020, 3, 7216–7227. [Google Scholar] [CrossRef]
  14. Yu, C.-Y.; Park, J.-S.; Jung, H.-G.; Chung, K.-Y.; Aurbach, D.; Sun, Y.-K.; Myung, S.-T. NaCrO2 Cathode for High-Rate Sodium-Ion Batteries. Energy Environ. Sci. 2015, 8, 2019–2026. [Google Scholar] [CrossRef]
  15. Li, W.; Wang, Y.; Hu, G.; Peng, Z.; Cao, Y.; Zeng, Y.; Du, K. Ti-Doped NaCrO2 as Cathode Materials for Sodium-Ion Batteries with Excellent Long Cycle Life. J. Alloys Compd. 2019, 779, 147–155. [Google Scholar] [CrossRef]
  16. Wang, Y.; Cui, P.; Zhu, W.; Feng, Z.; Vigeant, M.J.; Demers, H.; Guerfi, A.; Zaghib, K. Enhancing the Electrochemical Performance of an O3–NaCrO2 Cathode in Sodium-Ion Batteries by Cation Substitution. J. Power Sources 2019, 435, 226760. [Google Scholar] [CrossRef]
  17. Zheng, L.; Bennett, J.C.; Obrovac, M.N. Stabilizing NaCrO2 by Sodium Site Doping with Calcium. J. Electrochem. Soc. 2019, 166, A2058–A2064. [Google Scholar] [CrossRef]
  18. Wang, Y.; Li, W.; Hu, G.; Peng, Z.; Cao, Y.; Gao, H.; Du, K.; Goodenough, J.B. Electrochemical Performance of Large-Grained NaCrO2 Cathode Materials for Na-Ion Batteries Synthesized by Decomposition of Na2Cr2O7·2H2O. Chem. Mater. 2019, 31, 5214–5223. [Google Scholar] [CrossRef]
  19. Liang, L.; Sun, X.; Denis, D.K.; Zhang, J.; Hou, L.; Liu, Y.; Yuan, C. Ultralong Layered NaCrO2 Nanowires: A Competitive Wide-Temperature-Operating Cathode for Extraordinary High-Rate Sodium-Ion Batteries. ACS Appl. Mater. Interfaces 2019, 11, 4037–4046. [Google Scholar] [CrossRef]
  20. Yabuuchi, N.; Kubota, K.; Dahbi, M.; Komaba, S. Research Development on Sodium-Ion Batteries. Chem. Rev. 2014, 114, 11636–11682. [Google Scholar] [CrossRef]
  21. Wu, J.; Hu, G.; Du, K.; Peng, Z.; Huang, M.; Fan, J.; Gong, Y.; Guan, D.; Shi, Y.; Liu, R.; et al. Inhibiting Electrochemical Phase Transition of NaCrO2 with Long-Cycle Stability by Surface Fluorination Treatment. Electrochim. Acta 2022, 403, 139641. [Google Scholar] [CrossRef]
  22. Wang, S.; Chen, F.; Zhu, T.Y.; He, X.D.; Liao, J.Y.; Zhang, L.M.; Ding, X.; Hu, Q.; Chen, C.H. In Situ-Formed Cr2O3 Coating on NaCrO2 with Improved Sodium Storage Performance. ACS Appl. Mater. Interfaces 2020, 12, 44671–44678. [Google Scholar] [CrossRef] [PubMed]
  23. Ikhe, A.B.; Park, W.B.; Manasi, M.; Ahn, D.; Sohn, K.S.; Pyo, M. Unprecedented Cyclability and Moisture Durability of NaCrO2 Sodium-Ion Battery Cathode via Simultaneous Al Doping and Cr2O3 Coating. ACS Appl. Mater. Interfaces 2023, 15, 14958–14969. [Google Scholar] [CrossRef]
  24. Song, T.; Chen, L.; Gastol, D.; Dong, B.; Marco, J.F.; Berry, F.; Slater, P.; Reed, D.; Kendrick, E. High-Voltage Stabilization of O3-Type Layered Oxide for Sodium-Ion Batteries by Simultaneous Tin Dual Modification. Chem. Mater. 2022, 34, 4153–4165. [Google Scholar] [CrossRef]
  25. Xie, M.; Luo, R.; Lu, J.; Chen, R.; Wu, F.; Wang, X.; Zhan, C.; Wu, H.; Albishri, H.M.; Al-Bogami, A.S.; et al. Synthesis-Microstructure-Performance Relationship of Layered Transition Metal Oxides as Cathode for Rechargeable Sodium Batteries Prepared by High-Temperature Calcination. ACS Appl. Mater. Interfaces 2014, 6, 17176–17183. [Google Scholar] [CrossRef] [PubMed]
  26. Darjazi, H.; Bottoni, L.; Moazami, H.R.; Rezvani, S.J.; Balducci, L.; Sbrascini, L.; Staffolani, A.; Tombesi, A.; Nobili, F. From Waste to Resources: Transforming Olive Leaves to Hard Carbon as Sustainable and Versatile Electrode Material for Li/Na-ion Batteries and Supercapacitors. Mater. Today Sustain. 2023, 21, 100313. [Google Scholar] [CrossRef]
  27. Nagpure, S.C.; Bhushan, B.; Babu, S.S. Raman and NMR Studies of Aged LiFePO4 Cathode. Appl. Surf. Sci. 2012, 259, 49–54. [Google Scholar] [CrossRef]
  28. Ren, Y.; Xiang, L.; Yin, X.; Xiao, R.; Zuo, P.; Gao, Y.; Yin, G.; Du, C. Ultrathin Si Nanosheets Dispersed in Graphene Matrix Enable Stable Interface and High Rate Capability of Anode for Lithium-ion Batteries. Adv. Funct. Mater. 2022, 32, 2110046. [Google Scholar] [CrossRef]
  29. Merlen, A.; Buijnsters, J.G.; Pardanaud, C. A Guide to and Review of the Use of Multiwavelength Raman Spectroscopy for Characterizing Defective Aromatic Carbon Solids: From Graphene to Amorphous Carbons. Coatings 2017, 7, 153. [Google Scholar] [CrossRef]
  30. Liu, W.R.; Guo, Z.Z.; Young, W.S.; Shieh, D.T.; Wu, H.C.; Yang, M.H.; Wu, N.L. Effect of Electrode Structure on Performance of Si Anode in Li-ion Batteries: Si Particle Size and Conductive Additive. J. Power Sources 2005, 140, 139–144. [Google Scholar] [CrossRef]
  31. Wang, C.; Sawicki, M.; Emani, S.; Liu, C.; Shaw, L. Na3MnCO3PO4—A High Capacity, Multi-Electron Transfer Redox Cathode Material for Sodium Ion Batteries. Electrochim. Acta 2015, 161, 322–328. [Google Scholar] [CrossRef]
  32. Jakobsen, C.L.; Brighi, M.; Andersen, B.P.; Ducrest, G.; Černý, R.; Ravnsbæk, D.B. Expanded Solid-Solution Behavior and Charge-Discharge Asymmetry in NaxCrO2 Na-ion Battery Electrodes. J. Power Sources 2022, 535, 231317. [Google Scholar] [CrossRef]
  33. Tsuchiya, Y.; Takanashi, K.; Nishinobo, T.; Hokura, A.; Yonemura, M.; Matsukawa, T.; Ishigaki, T.; Yamanaka, K.; Ohta, T.; Yabuuchi, N. Layered NaxCrxTi1–xO2 as Bifunctional Electrode Materials for Rechargeable Sodium Batteries. Chem. Mater. 2016, 28, 7006–7016. [Google Scholar] [CrossRef]
Figure 1. FESEM images: (a) s1-C and (b) B2 samples.
Batteries 09 00433 g001
Figure 2. TEM analysis of s2-C powder: (a) a TEM image showing particle sizes of carbon-coated NaCrO2 in the range of ~60–300 nm, (b) a HRTEM image revealing the carbon coating thickness at ~20 nm, (c) the TEM image of a particle for elemental mapping shown in (d), and (d) TEM elemental mapping of the particle in (c), revealing the presence of a uniform carbon coating on the surface of NaCrO2 particle (color code: red—Cr and green—C). The TEM sample is supported by a carbon grid.
Batteries 09 00433 g002
Figure 3. XRD patterns of (a) B1, (b) B2 and (c) B3 samples. All samples contain O3-NaCrO2, P2-NaxCrO2, O3-CrO2, and Si (internal standard).
Batteries 09 00433 g003
Figure 4. XRD patterns: (a) PN1-C, (b) PN2-C, (c) PN3-C and (d) PN4-C. PN3-C and PN4-C contain carbides, whereas PN1-C and PN2-C do not.
Batteries 09 00433 g004
Figure 5. XRD patterns of (a) s1-C, (b) ca-C and (c) s2-C samples.
Batteries 09 00433 g005
Figure 6. Raman spectra of B1, PN1−C, ca−C, and s1−C samples. Major peaks are indicated.
Batteries 09 00433 g006
Figure 7. (a) The first charge/discharge voltage profiles and (b) cycle stability of B3 half cells as a function of CB loading in the cathode: (i) 10 wt.%, (ii) 20 wt.%, and (iii) 30 wt.%.
Batteries 09 00433 g007
Figure 8. The first charge/discharge voltage profiles of (a) PN1-C and PN2-C cells, and (b) s1-C cell, all of which contain 10 wt.% CB. (c) Selected charge/discharge voltage profiles of s2-C cells with 10 wt.% CB. (d) Cycle stability of s1-C cell with 10 wt.% CB.
Batteries 09 00433 g008
Figure 9. dQ/dV curves of several cells: (a) the 1st charge/discharge cycle of the PN2−C cell shown in Figure 7a, and (b) the 1st, 10th and 50th cycles of the s2−C cell shown in Figure 8c.
Batteries 09 00433 g009
Table 1. Sample preparation details.
Sample IDCarbon SourceFirst TreatmentSecond TreatmentCB Loading in Electrode First Discharge Capacity
TemperatureTimeTemperatureTime
B1None750 °C5 hN/AN/AN/AN/A
B2None900 °C5 hN/AN/AN/AN/A
B3None900 °C2 hN/AN/A10 wt.%
20 wt.%
30 wt.%
17 mAh/g
78 mAh/g
102 mAh/g
PN1-CPAN750 °C5 hN/AN/A10 wt.%39 mAh/g
PN2-CPAN900 °C5 hN/AN/A10 wt.%56 mAh/g
PN3-CPAN900 °C2 h750 °C1 hN/AN/A
PN4-CPAN900 °C2 h900 °C1 hN/AN/A
ca-CCitric acid900 °C2 h650 °C10 minN/AN/A
s1-CDry sucrose900 °C2 h650 °C10 min10 wt.%60 mAh/g
s2-CSucrose in solution900 °C2 h650 °C1 h10 wt.%141 mAh/g
Table 2. Key results from the XRD patterns of three bare samples.
Sample IDPeak Position of (003)d Spacing of (003), ÅPeak Position of (104)d Spacing of (104), Åa Parameter (Å)c Parameter (Å)
B116.7635°5.284341.7791°2.16032.975415.8529
B216.6324°5.325641.6376°2.16732.979315.9769
B316.6526°5.319241.6982°2.16432.975015.9577
Table 3. The D/G intensity ratio of carbon-coated samples.
Sample IDPN1-Cca-Cs1-C
ID/IG Ratio0.620.470.42
D-band FWHM (cm−1)124.30396193.6068139.47941
Disclaimer/Publisher’s Note: The statements, opinions and data contained in all publications are solely those of the individual author(s) and contributor(s) and not of MDPI and/or the editor(s). MDPI and/or the editor(s) disclaim responsibility for any injury to people or property resulting from any ideas, methods, instructions or products referred to in the content.

