Article

Conditioning Solid-State Anode-Less Cells for the Next Generation of Batteries

by
Manuela C. Baptista
1,2,3,
Beatriz Moura Gomes
1,2,3,
Diana Capela
2,4,
Miguel F. S. Ferreira
2,4,
Diana Guimarães
2,4,
Nuno A. Silva
2,4,
Pedro A. S. Jorge
2,4,
José J. Silva
5 and
Maria Helena Braga
1,3,6,*
1
Engineering Physics Department, Engineering Faculty, University of Porto, 4200-465 Porto, Portugal
2
Physics and Astronomy Department, Sciences Faculty, University of Porto, 4169-007 Porto, Portugal
3
MatER—Materials for Energy Research Laboratory, Engineering Faculty, University of Porto, 4200-465 Porto, Portugal
4
Center for Applied Photonics, INESC TEC, 4169-007 Porto, Portugal
5
Mota Ceramic Solutions Portugal, Apartado 8, Meirinhas, 3106-601 Pombal, Portugal
6
LAETA-INEGI, Institute of Science and Innovation in Mechanical and Industrial Engineering, 4200-465 Porto, Portugal
*
Author to whom correspondence should be addressed.
Batteries 2023, 9(8), 402; https://doi.org/10.3390/batteries9080402
Submission received: 14 June 2023 / Revised: 4 July 2023 / Accepted: 19 July 2023 / Published: 2 August 2023
(This article belongs to the Special Issue Rechargeable Batteries)

Abstract

:
Anode-less batteries are a promising innovation in energy storage technology, eliminating the need for traditional anodes and offering potential improvements in efficiency and capacity. Here, we have fabricated and tested two types of anode-less pouch cells, the first using solely a copper negative current collector and the other the same current collector but coated with a nucleation seed ZnO layer. Both types of cells used the same all-solid-state electrolyte, Li2.99Ba0.005ClO composite, in a cellulose matrix and a LiFePO4 cathode. Direct and indirect methods confirmed Li metal anode plating after charging the cells. The direct methods are X-ray photoelectron spectroscopy (XPS) and laser-induced breakdown spectroscopy (LIBS), a technique not divulged in the battery world but friendly to study the surface of the negative current collector, as it detects lithium. The indirect methods used were electrochemical cycling and impedance and scanning electron microscopy (SEM). It became evident the presence of plated Li on the surface of the current collector in contact with the electrolyte upon charging, both directly and indirectly. A maximum average lithium plating thickness of 2.9 µm was charged, and 0.13 µm was discharged. The discharge initiates from a maximum potential of 3.2 V, solely possible if an anode-like high chemical potential phase, such as Li, would form while plating. Although the ratings and energy densities are minor in this study, it was concluded that a layer of ZnO, even at 25 °C, allows for higher discharge power for more hours than plain Cu. It was observed that where Li plates on ZnO, Zn is not detected or barely detected by XPS. The present anode-less cells discharge quickly initially at higher potentials but may hold a discharge potential for many hours, likely due to the ferroelectric character of the electrolyte.

1. Introduction

We still vividly remember the periods of confinement forced upon us by the COVID-19 pandemic. However, it is also hard to forget the positive impact that the absence of human intervention had on our environment, such as rivers becoming more transparent and significant improvements in air quality [1]. It is crucial to focus on these changes because a better habitat inevitably leads to a better quality of life. Minimizing the adverse effects humanity has caused on the planet is essential and urgent. Therefore, it is necessary to research and develop technologies capable of harnessing clean energy sources (such as solar, wind, and tidal energy) and storing that energy efficiently (using batteries, capacitors, and fuel cells, for example).
Energy storage plays a critical role because the primary sources of clean energy are only sometimes available. Consequently, energy storage technologies must be sustainable as well. There is a growing demand for energy storage devices with higher energy density, faster charging capabilities, cost-effectiveness, and longer life cycles to reduce the negative environmental impacts associated with their products and make them more environmentally friendly [2].
Sustainability has never been more critical than it is today. When discussing sustainability, we often tend to focus solely on environmental care. However, it should be viewed as a complex puzzle comprising various aspects, including environmental respect, human rights, equality, and economic growth. Therefore, careful analysis of the materials used and the production processes must ensure that the final product is sustainable.
To achieve these objectives, there is increasing research in developing batteries that do not contain hazardous or environmentally harmful materials while maintaining high safety standards [3]. A promising approach is using anode-less battery configurations, particularly those utilizing solid-state electrolytes [4,5].
A typical commercial lithium-ion battery consists of an anode, cathode, separator with electrolyte, and anodic and cathodic current collectors. However, in an anode-less battery, only an anode current collector is in the initial assembly. Our batteries are based on this anode-less configuration and employ solid-state electrolytes, resulting in an all-solid-state battery (Figure 1) [6].
Anode-less cells have gained attention in the battery industry due to their ease of assembly, enhanced safety, cost-effectiveness, and improved sustainability, as they eliminate the need for pure lithium metal layers in the manufacturing process. Recent years have witnessed a surge in research focusing on this configuration, evident from the growing number of review papers published on the subject [7,8,9,10,11,12,13,14,15,16,17,18].
While there are relatively few original papers on anode-less cells in the solid state, notable references include the work of Neudecker et al. (2000) [19], who presented a novel lithium-free thin-film battery with an in situ Li coating on the Cu anode current collector during the charging step. This work was later cited by Bates et al. (2000) [20]. Lee, Liu, and Tracy (2003) [21] assembled an anode-free solid-state battery (AFSSB) with a different configuration, namely SS/LiPON/Li1.3V2O5/Cu, fabricated on a stainless steel (SS) substrate using sequential thin-film deposition methods. Westover et al. (2019) [22] worked with a solid LiPON electrolyte, highlighting the importance of achieving a homogeneous, pore-free morphology for anode-less battery success. Zegeye et al. (2020) [23] developed a surface-rolled ultrafine polymer solid-state electrolyte for anode-free solid-state batteries. Wang et al. (2020) [24] presented a “Li-free” battery using the solid electrolyte Li7La3Zr2O12 (LLZO). The cell was fabricated by depositing lithium directly from a composite cathode of NCA/PEO onto a copper current collector through the LLZO electrolyte. This cell underwent 50 cycles at a C/19 rate, showing initial capacities of 0.8 mAh cm−2 and nearly 100% coulombic efficiency. In 2022/2023, numerous interdisciplinary studies focused on advancing anode-less or anode-free cell configurations across multiple fields [25,26,27,28,29,30,31,32,33,34,35,36,37,38,39,40,41].
Regarding cathode materials, layered transition metal oxides such as LiCoO2 (LCO) and LiNixMnyCozO2 (NMC) have been popularly employed in commercial applications. However, these materials contain cobalt, a metal with significant environmental and social impacts [42]. The search for alternative cathode materials has intensified recently, leading to increased LiFePO4 (LFP) use. LFP has several advantages, including a flat voltage profile, low cost, abundance, and environmental compatibility. However, it has limitations regarding theoretical energy density and conductivity when compared, for example, with NMC [43]. The experimental energy density for LFP batteries typically ranges from 120 to 180 Wh kg−1 (experimental plateau potential 3.2–3.3 V). For NMC 611 batteries, the experimental energy density can range from 150 to 250 Wh kg−1 (average potential 3.6 V) [44]. For NMC 9055 batteries, the experimental energy density can range from 170 to 280 Wh kg−1 (average potential 3.6 V).
One critical component in anode-less batteries is the separator or solid-state electrolyte. Developing high-performance solid-state electrolytes is essential for enabling safe and efficient battery operation. Among the various types of solid-state electrolytes, ferroelectric electrolytes have garnered significant interest. These materials are also piezoelectric and pyroelectric and can be polarized spontaneously or under an applied electric field.
We have introduced glass electrolytes with high ionic conductivity, a wide electrochemical window, and excellent thermal stability [45,46,47]. The authors demonstrated that ferroelectric dipoles enabled by ionic transport could align in an electric field, contributing to the development of solid-state batteries.
Regarding current collectors, copper is employed in anode-less batteries as it does not react with lithium and therefore is the traditional choice as an anode current collector. Copper current collectors have been used in various battery designs, including lithium-ion, lithium-sulfur, and lithium-air batteries [44]
In a study conducted by Guerreiro et al. (2022) [48], the authors investigated the surface chemical potentials of various materials for potential use in lithium-ion battery interfaces. They found that zinc oxide (ZnO) exhibited equalization of surface chemical potentials at the interface with copper (CC). Moreover, they observed the presence of a negatively charged region at the interface, which they believed would facilitate the nucleation of lithium during the charging process.
This finding suggested that n-type ZnO semiconductor holds promise as a material candidate for improving the performance of lithium batteries. By promoting efficient lithium nucleation and deposition at the electrode interface, the equalization of surface chemical potentials and a negatively charged region could enhance battery performance, reducing resistive elements and improving charging characteristics.
Laser-induced breakdown spectroscopy (LIBS) is a highly effective analytical technique widely utilized for elemental analysis of diverse materials [49,50,51]. This method involves directing a focused laser beam onto the surface of a sample, which results in localized ablation and plasma formation. The intense laser pulse generates a high-temperature plasma plume comprising atoms and ions from the sample material. As these excited atoms and ions return to their stable state, they emit photons collected by a spectrometer. The emitted light contains unique spectral lines for each element present in the sample, enabling the identification of its composition.
Compared to commonly used techniques like scanning electron microscopy (SEM) or energy-dispersive X-ray spectroscopy (EDX), LIBS offers several advantages, including speed, sensitivity to light elements, and minimal sample preparation. It is particularly useful for electrode analysis and can facilitate electrode mapping, which provides valuable information about the spatial characterization of electrode materials and helps meet strict requirements for heavy metal composition [52,53]. Electrode mapping allows for visualizing element distribution and behavior across the electrode surface, which is critical for performance optimization and troubleshooting.
This paper presents a groundbreaking concept of an all-solid-state battery without an anode. Initially, the study is focused on a cell comprising only a copper current collector (negative CC) where the nucleation of lithium occurs. Subsequently, the surface of this current collector was coated with ZnO, as proper cell optimization and conditioning are essential for achieving suitable electrochemical performance.
In summary, developing sustainable energy storage technologies, particularly anode-less batteries with solid-state electrolytes, is paramount for minimizing the negative environmental impacts of energy production and consumption. Efforts are underway to explore alternative cathode materials and develop high-performance solid-state electrolytes to improve the safety and efficiency of anode-less batteries.
The present anode-less batteries may become competitive, as they do not require being fabricated in the glovebox or dry room because they do not contain alkali metals before being charged.

2. Experimental Section

2.1. Materials

2.1.1. Current Collector: Copper

Copper foils are used as current collectors as they have suitable electrical conductivity, stable chemical properties against lithium, suitable flexibility, and are easy to process at a reasonable cost. For this purpose, copper sheets from Alfa Aesar, 99.9% metal, 0.127 mm thick, with (40 × 40) mm2, were prepared with a connector of (1 × 60) mm2 to be employed as current collectors, CC.

2.1.2. Surface-Coating Layer: ZnO Solution Deposition

From the interfacial engineering perspective, the surface of the anodic current collector should be modified to optimize lithium nucleation and diffusion. Recently, Guerreiro et al. [48] presented oxides with the potentiality of becoming nucleation centers such as ZnO (n-type semiconductor).
A solution composed of zinc oxide (ZnO) (90%), polyvinylidene fluoride (PVDF) (10%), and N-Methyl-2-Pyrrolidone (NMP) was prepared (for 1 g solute, 3 mL of solvent was added) and left to stir for 2 h at 60 °C. The solution was doctor bladed on copper, forming a thin coating layer, then placed in a vacuum oven at 70 °C overnight.
The materials employed were from Alfa Aesar: ZnO 99.99% with powder diameters <74 µm, Nanografi Nano Technology: PVDF binder for battery, and Sigma-Aldrich (Darmstadt, Germany): NMP.

2.1.3. Cathode: LiFePO4

The LiFePO4 cathode solution was prepared from lithium iron phosphate (LFP) powder (80%), carbon black (10%), and polyvinylidene fluoride (PVDF) (10%). N-Methyl-2-Pyrrolidone (NMP) was added to the mixture (for 1 g solute, 5 mL of solvent was added) and stirred for 2 h at 60 °C. The slurry was deposited on a carbon-coated Al foil as a thin, continuous layer, then placed in a vacuum oven at 70 °C overnight. After drying, the cathode foil is cut into a (40 × 40) mm2 square and glued to a Cu CC using electrical conductor glue.
The cathode reagents were acquired from TMAX Battery Equipments: LFP 98.71% powder; Alfa Aesar: Carbon black super P® 99+%; Nanografi Nano Technology: PVDF binder for battery; Sigma-Aldrich: NMP; and MSE Supplies: single-side conductive carbon-coated aluminum foil.

2.1.4. Separator: Cellulose with Solid Electrolyte Li2.99Ba0.005ClO

The solid electrolyte impregnated in a cellulose sheet was used as an electrolyte and separator. The electrolyte used was Li2.99Ba0.005ClO, synthesized by water solvation and dried at 250 °C, as presented by Braga et al. [3,47]. Five-gram samples of Li+ ferroelectric-glass electrolyte were synthesized by adding LiCl, Li(OH), and Ba(OH)2 precursors to deionized water in a Teflon container in the stoichiometric ratios. The precursors used were from Sigma-Aldrich: LiOH 98%, LiCl ≥99%, and Ba(OH)2~95% pure. After drying, the material was ground in with a Retsch Planetary Ball Mill in a hermetic agate container and five balls with a diameter of 20 mm for 40 min (300 rpm). The electrolyte powder was mixed with absolute ethanol. The thermoplastic polyvinyl acetate (PVAc) (C4H6O2)n in the ratio in weight 80% Li2.99Ba0.005ClO + 20% PVAc was added to the electrolyte/ethanol mixture [54], obtaining a homogeneous mixture, which is impregnated onto the cellulose sheet. Adding PVAc, commonly presented as white glue, improves the hygroscopic character, maintaining the dielectric properties of the electrolyte while promoting electrical contact and mechanical adhesion between the electrodes and the electrolyte. Ultimately, these separators were dried inside the glove box at 90 °C with Ar-filled O2 and H2O < 1 ppm.

2.1.5. Laminated Film

Aluminum-laminated film (70 × 160) mm2 was cut and folded in half by the most significant dimension and through the pouch case forming machine. The shape where the cell components were tack was obtained.
In summary, the primary cell components’ features are shown in Table 1.

2.2. Methods

2.2.1. Pouch Cells Fabrication

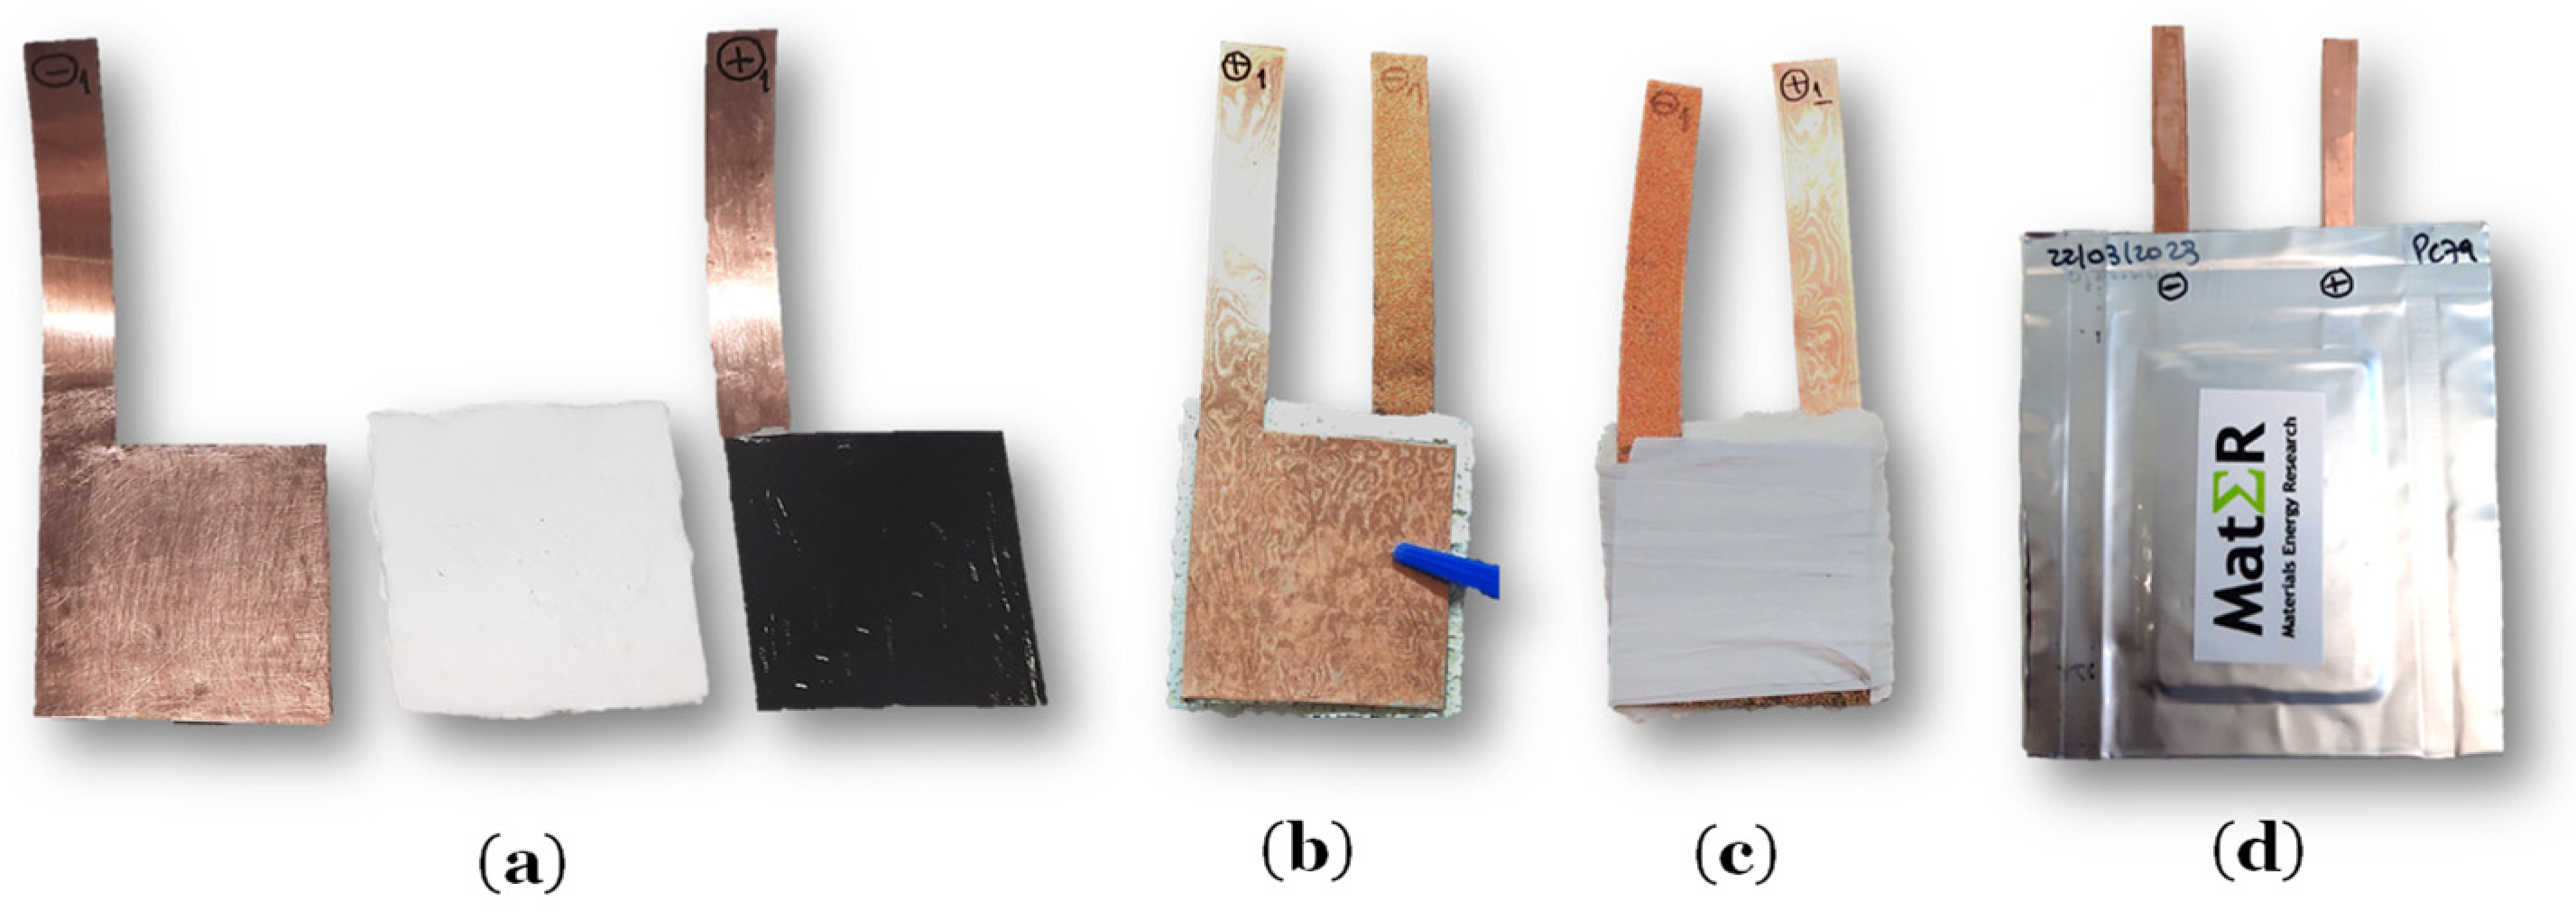
Small pouch cells were assembled inside the controlled atmosphere glove box (O2 and H2O < 1 ppm). In Figure 2a, the materials used are shown separately; in Figure 2b, the elements were joined; in Figure 2c, Teflon tape was used to keep all the components together; and finally, in Figure 2d, the cell was closed in a vacuum and sealed using the following ACEY equipment: (1) pouch case forming machine; (2) top and side heat sealing machine; (3) vacuum pre-sealing machine; and (4) secondary vacuum sealing machine.

2.2.2. Electrochemical Measurements

A cycling protocol then evaluated the electrochemical performance of the all-solid-state pouch cells through charge and discharge tests. A Biologic VMP-300 potentiostat/galvanostat/impedance spectroscope was used for testing these cells.
The initial step, where there is a need to perform lithium deposition on the anode current collector, was achieved through two stages. The first stage was programmed with a constant current (CC) of 50 µA (start value) and increased to 150 µA until 3.7 V was reached, and the second stage was programmed with a constant voltage (CV) of 3.7 V for 30 h.
In addition, the electrochemical tests were performed with external physical resistances connected in parallel with the pouch cells. External physical resistances are intended to unambiguously control the cell’s discharge, not making it dependent on the amplifier of the potentiostat or the variation in the cell’s internal resistance. The measuring instrument functions only as a voltmeter connected in parallel with the external resistance. All the circuit’s resistances are therefore taken into account.
PEIS stands for potentiostatic electrochemical impedance spectroscopy. It is a specific variation in electrical impedance spectroscopy that focuses on analyzing the electrochemical properties of materials and systems. In PEIS, a potentiostat is used to control the electrochemical potential of the sample while measuring its impedance response across a range of frequencies. By applying a small amplitude AC (50 mV) signal on top of a fixed DC potential, PEIS can provide valuable information about the kinetics of electrochemical processes, such as resistivity and capacitance, as well as the structural and compositional characteristics, charge transfer reactions, electrode reactions, and diffusion processes occurring at the electrode–electrolyte interface. This technique is widely utilized in various fields, including electrochemistry, corrosion studies, battery research, and fuel cell development, to characterize and optimize the performance of electrochemical systems.

2.2.3. Samples Preparation for XPS, SEM, EDX, and LIBS Analysis

The electrochemical cycles were programmed for the cells, concluding the test with a charge so as to a maximum plated Lithium thickness was analyzed. Subsequently, all samples were prepared within a controlled atmosphere glove box, ensuring oxygen (O2) and water (H2O) levels below 1 ppm. The cells were opened, and the surfaces were marked, analyzed, and cut accordingly. For XPS and SEM/EDX analyses, the samples were approximately 1 cm2 in size, while LIBS required samples of about (2 × 4) cm2. All samples were placed in a vacuum within the glove box until they were ready for analysis. In the case of XPS and SEM/EDX, four samples were collected from the negative current collector, and one sample was taken from the positive electrode. For LIBS analysis, one sample was obtained from each side.

2.2.4. XPS, SE()M, and EDX Analysis

X-ray photoelectron spectroscopy (XPS), scanning electron microscopy (SEM), and energy-dispersive X-ray spectroscopy (EDX) analyses were performed to analyze the surfaces of the anode current collector and cathode.
The XPS technique allows analytical information from the top layer of the sample’s surface, approximately 10 nm thick. The surface must be free of contamination. The geometry of the sample surface strongly impacts the analytical thickness and sensitivity. The Kratos Axis Ultra HSA equipment was used in these analyses, with survey analysis for two points and region of interest (ROI) analysis for one point on each sample. X-ray source power was 15 kV (90 W), pass energy in the survey analysis was 160 eV, and in the ROI, it was 40 eV. The primary purpose of this analysis is to obtain information about the presence of lithium in the anode current collector. The Casa XPS software (version 2.3.24PR1.0) was used to analyze the recorded spectra.
The SEM/EDX analyses were performed using a High resolution (Schottky) Environmental Scanning Electron Microscope with X-Ray Microanalysis and Electron Backscattered Diffraction analysis FEI Quanta 400 FEG ESEM/EDAX Genesis X4M.

2.2.5. Laser-Induced Breakdown Spectroscopy (LIBS)

This work used a fiber laser for inducing the breakdown spectroscopy, which brings an advantage over more conventional lasers since it yields a high beam quality that enables a minimal focus, proving a high spatial resolution. Furthermore, having much higher repetition rates (up to 100 kHz) allows for faster analysis when combined with fast spectrometers. The fiber laser used was ytterbium-doped (company MW Technologies is headquartered in Maia, Portugal, model PFL-1064-FL-10 kW) and emitted 1064.8 nm pulses with a diameter of 0.51 mm. The laser was used in burst mode with a repetition rate of 20 kHz. This experiment used a Gaussian-shaped pulse with a 100 ns pulse width, with an energy of approximately 570 μJ.
The beam undergoes expansion through an ×12 beam expander before being precisely focused onto the sample surface using a 10 cm plano-convex lens. The resulting spectrum is collected using 200 μm optical fiber with collimators and redirected to three spectrometers (Avantes, model AvaSpec-ULS2048CL-EVO, resolution < 0.1 nm), acquiring signals between 220 and 485 nm and 612 and 821 nm. The spectral information was collected using an integration time of 30 μs.
A burst of 40 laser shots was performed for each spot, with a step size of 0.1 mm distance between spots. For the data analysis, we first removed the background contribution using asymmetric least squares before constructing elemental maps by computing an estimate of the peak area intensity with a step size of 0.1 mm distance between spots in X and a step size of 0.2 mm distance in Y.

3. Results and Discussion

The glassy electrolytes of the A2.99M0.005ClO (A = Li, Na, K, and M = Mg, Ca, Sr, Ba) class have a standard and distinct characteristic, their ferroelectric character. These materials polarize spontaneously, which can be reversed by applying an electric field [55].
The solid electrolyte selected was Li2.99Ba0.005ClO, a ferroelectric rich in Li ions, with a dielectric constant εr at RT and 0.1 Hz between 107 and 109 [56] and a theoretical specific capacity of 1099 mAh g−1.
The lithium ions required to form a metal layer can originate from LiFePO4 (active material) or solely from the solid electrolyte. Note also that the theoretical specific capacity of LiFePO4 is 120 mAh g−1 considering that the discharge is 70% of its total capacity, forming Li0.3FePO4, making it the limiting capacity of the cell.
Very simplistically, the lithium metal layer is formed at the charge stage, and the presence of this element is confirmed at the discharge. Here, we prove the capacity of plating lithium from the ferroelectric-glass electrolyte onto the negative current collector in the anode-less configuration using pouch cells. Our attention is focused on the negative current collector as, on the positive electrode, the active material is the well-known LiFePO4.
Approaches are used for two different architectures to enhance the plating of Li on the copper current collector. The first is Cu/Li2.99Ba0.005ClO composite in cellulose/LiFePO4/Cu pouch cell. In the second, a nucleation seed of ZnO is doctor bladed onto the copper of the negative current collector, Cu/ZnO/Li2.99Ba0.005ClO composite in cellulose/LiFePO4/Cu pouch cell.

3.1. Performance of the Cu/Li2.99Ba0.005ClO Composite in Cellulose/LiFePO4/Cu Pouch Cell with Cu as a Negative Current Collector

3.1.1. Electrochemical Cycling

It is crucial to design the test protocol for the cells. The cells must rest for at least one week before being analyzed to optimize their performance while consolidating the interfaces.
In general, in a constant current and constant voltage (CCCV) charging scheme, a constant current is applied up to a threshold potential, then charging continues at a constant potential to reach a maximum capacity value. The discharge is performed with an external resistor R e x t . The potentiostat is connected in parallel with the resistor. The current is obtained by making Δ V = R e x t I where Δ V is measured with the potentiostat in the resting mode, and the resistor is material, not induced by the amplifier.
Notice that the first charge cycle is crucial and the most difficult due to the lack of active material on the negative electrode. However, copper foil has been selected to perform this function as it is lithium’s traditional current collector.
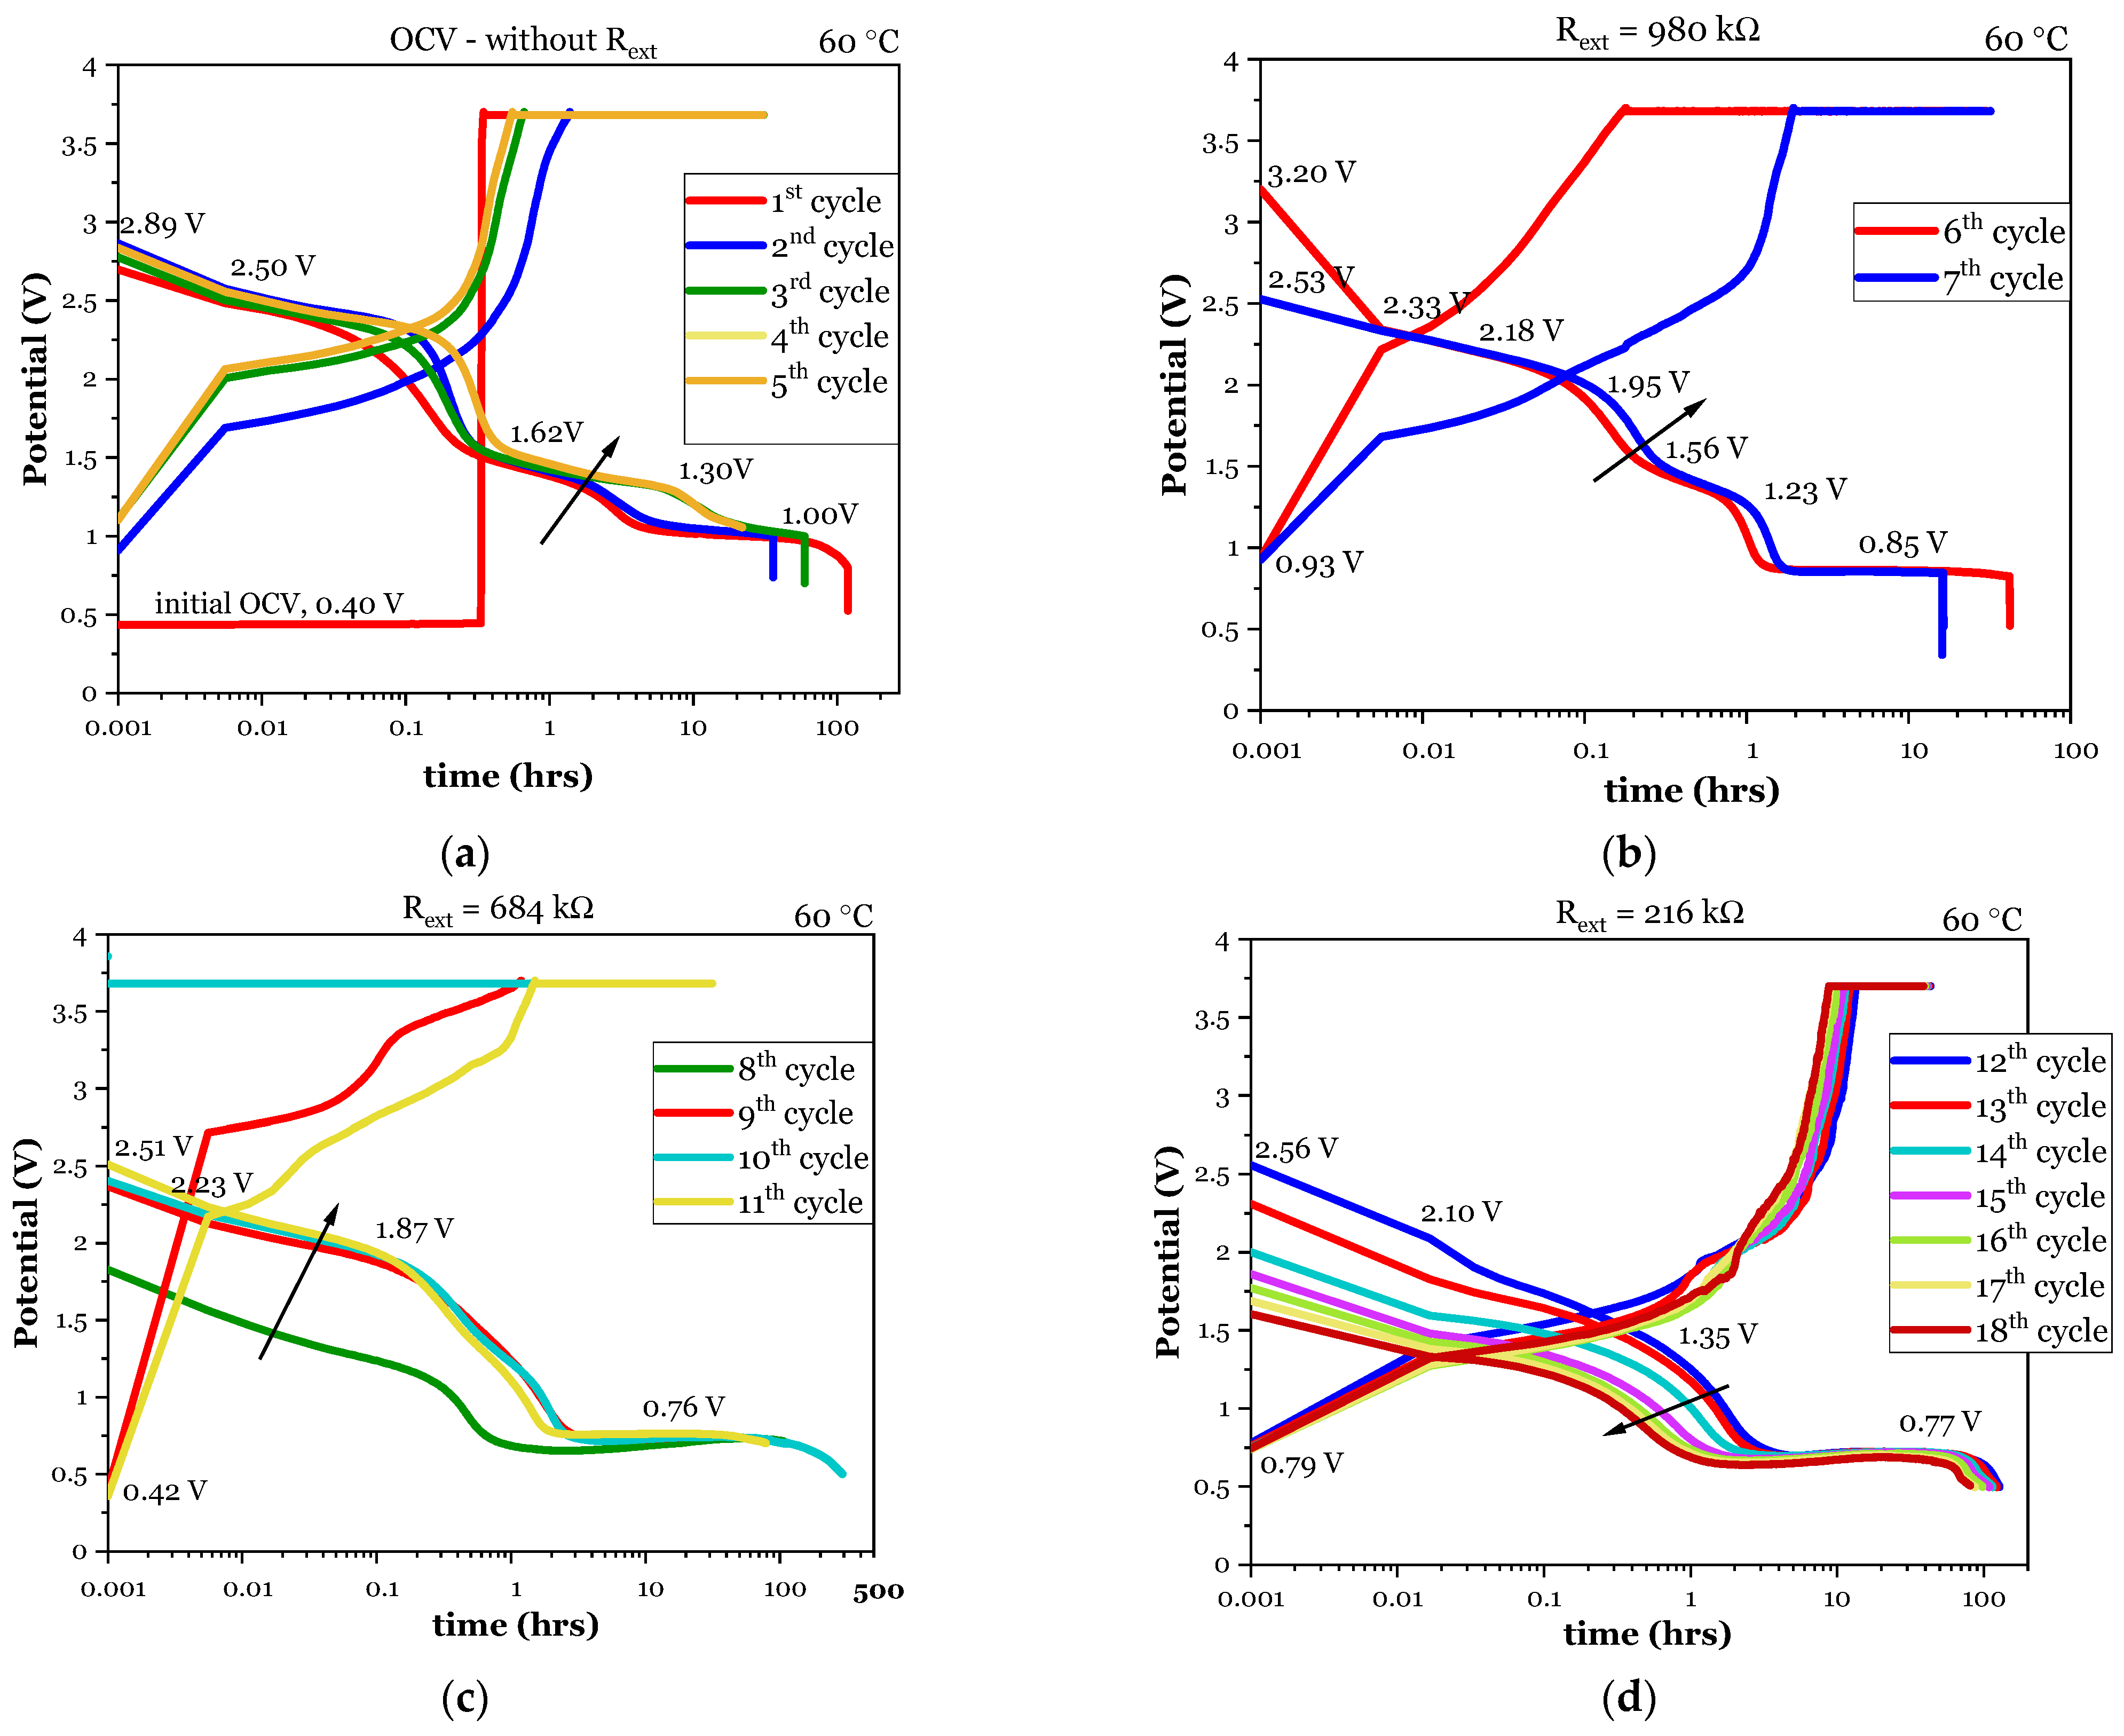
The Cu/Li2.99Ba0.005ClO composite in cellulose/LiFePO4/Cu pouch cell is initially tested at open circuit voltage (OCV) without external resistance. Afterward, an external resistance of 980 kΩ was added, followed by a 684 kΩ, and finally, a 216 kΩ. A parameter that significantly affects cell performance is the output current, which herein depends on the applied external resistance.
The cells were immersed in the sandbox at 60 °C, an optimum temperature as the electrolyte’s ionic conductivity and dielectric constant raised above the glass transition Tg between 40 °C and 60 °C. However, minor temperature variations drastically affect the behavior of the cell.
The analysis of Figure 3a reveals that the OCV, conversely expected, is not the better choice to discharge the lithium initially plated on the negative current collector. The best results were obtained at 980 and 684 kΩ. It is observed herein again that the ferroelectric-glass electrolyte cells, independently of the mobile cation A+, function better in a closed circuit due to the positive feedback electronic surface conduction established in the cell [3,47].
By analyzing Figure 3b,c carefully, it is possible to verify that a discharge plateau is obtained from 2.5 to 1.8 V for the first 20 min. In Figure 3b, it is shown that the cell that initially showed an OCV of 0.4 V could discharge from a maximum potential of 3.2 V, which only the formation of a higher chemical potential layer, such as lithium, can explain.
Figure 3c presents the electrochemical cycling corresponding to the external resistance of 684 kΩ, obtaining a discharge plateau at approximately 2.5 to 1.9 V in the first 20 min and a plateau at ~0.8–0.6 V from 2 to 300 h. Lowering this resistance to 216 kΩ, Figure 3d, discharge profiles obtained become a little worse, not showing an increase in capacity with cycling as shown with all the previous resistors; however, a discharge plateau from 2.56 to 1.35 V is still obtained in the first 1–2 h and a plateau at ~0.77 V from 2 to 100 h.
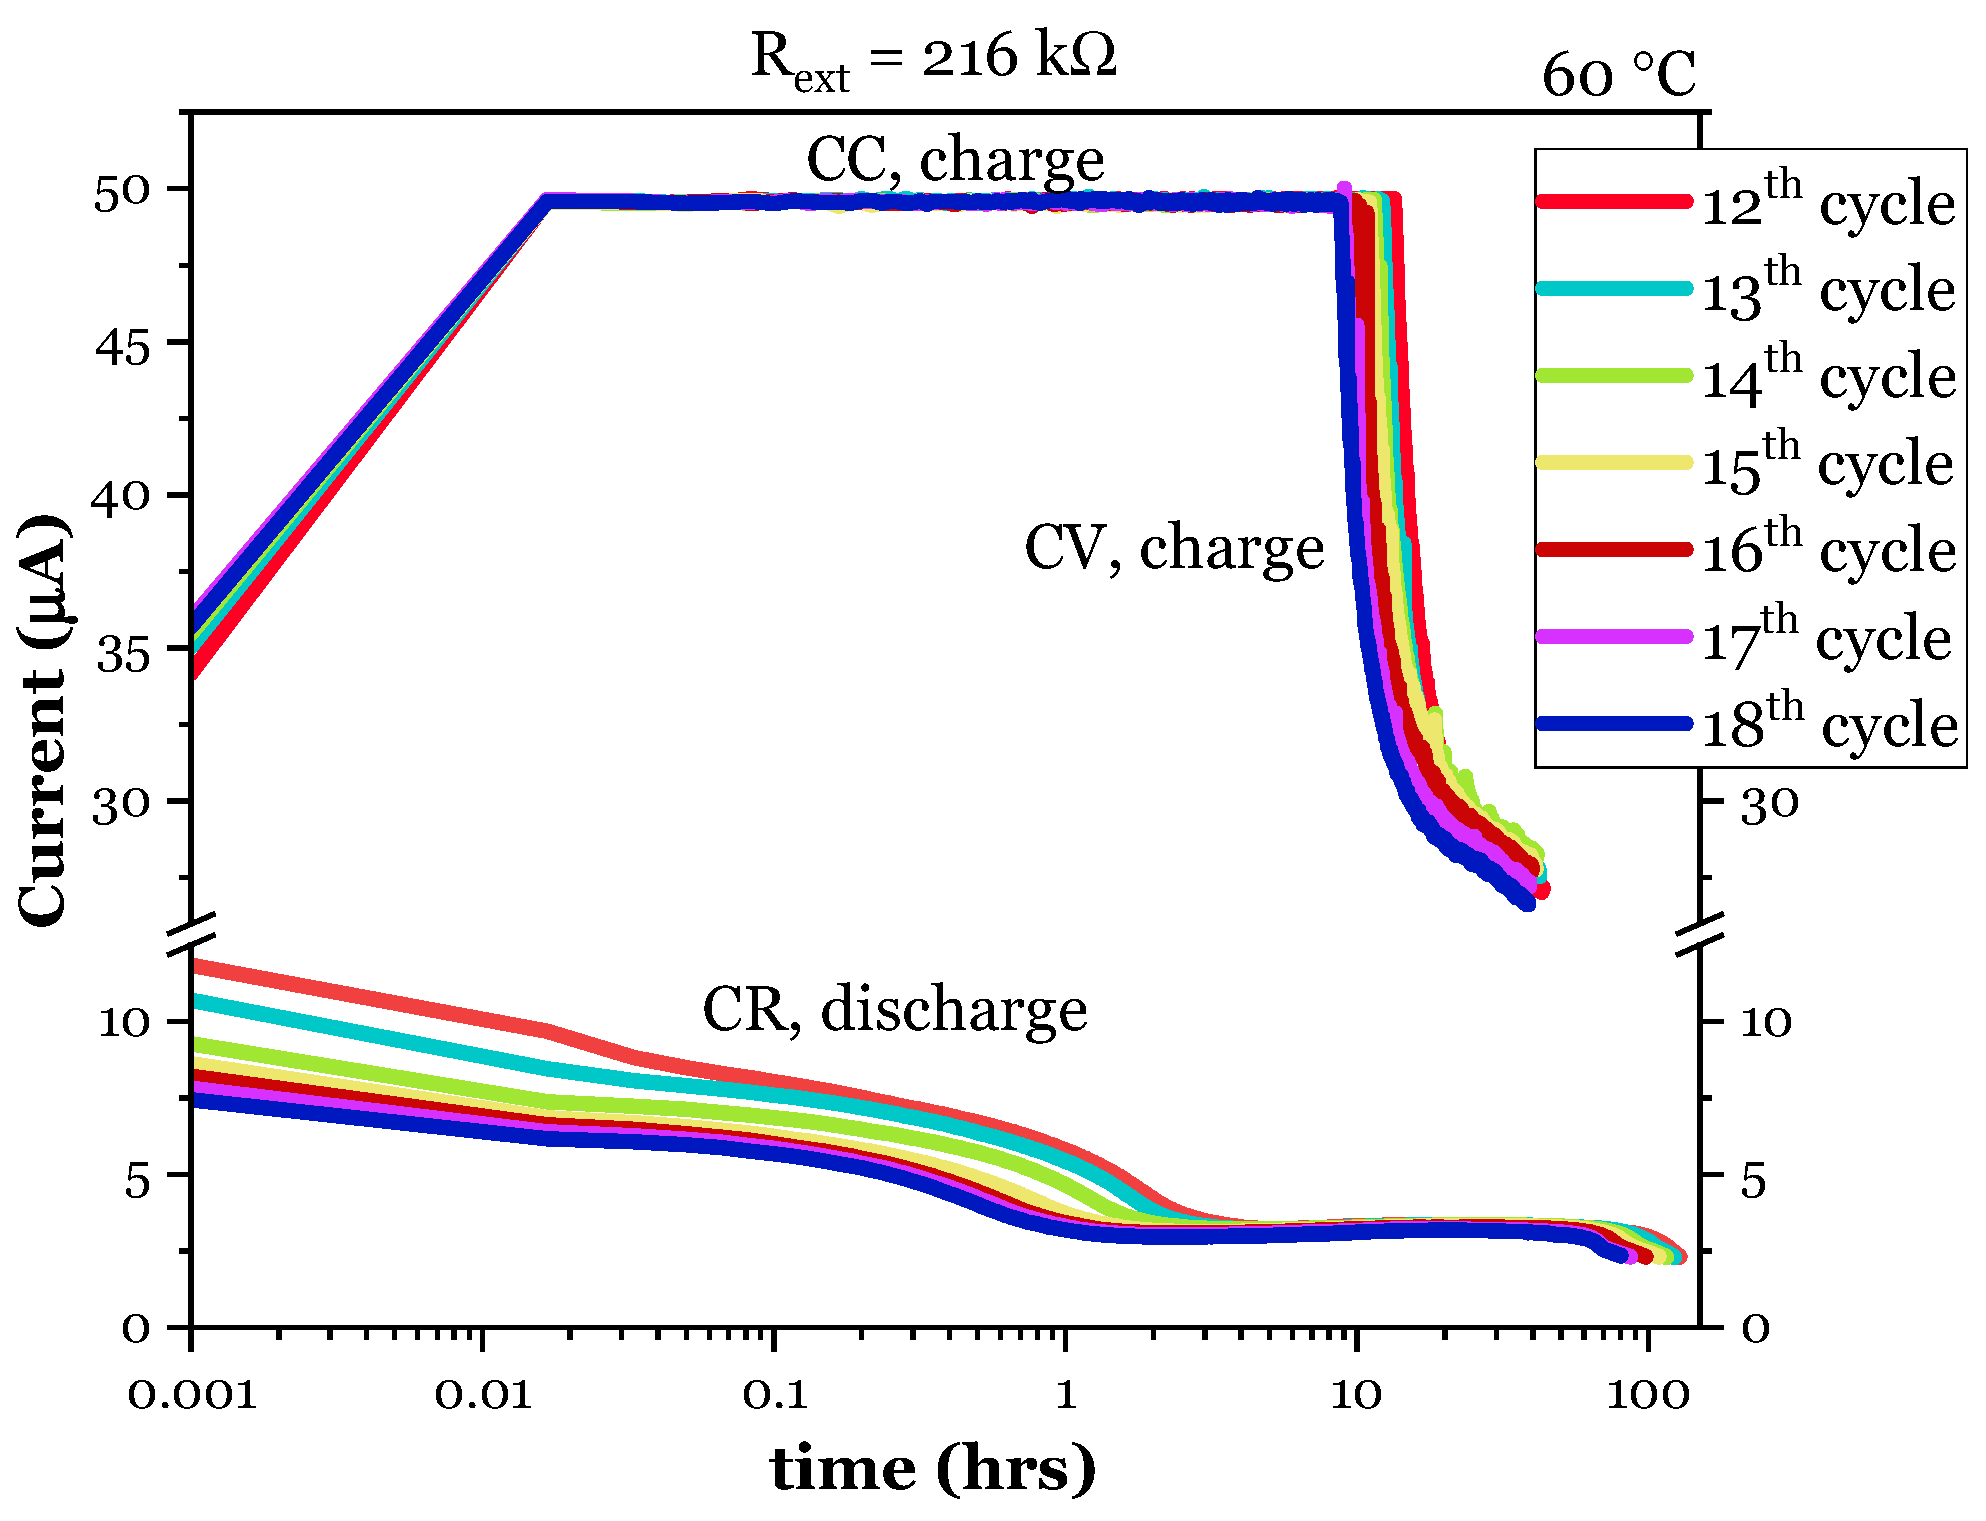
The discharge currents in this first conditioning stage were still tiny, even with the external resistor of 216 kΩ, Figure 4. However, this current is measured directly on the resistor. It, therefore, is the direct value of the current in the external circuit, accounting for all sources of energy dissipation in the circuit.
More data on the discharge performance are shown in Figure 4 and Table 2. However, these are just preliminary results intended to be analyzed from the C-rating and energy and power densities in the future. These results are guiding pinpoints to subsequent optimizations.

3.1.2. XPS Analyses

Through XPS analysis on the surface of the negative current collector, it is intended to detect the presence of lithium to understand if nucleation and plating have occurred.
The strategy was to perform two surveys on each sample and then analyze the region of interest (ROI) for the chosen elements, considering the materials potentially present on the negative current collector.
As the cell was cycled before its disassembly, while it was charged, lithium is expected to be found on the negative electrode, pristine and/or as Li2O, as it is difficult to avoid contact with the air entirely.
In samples 1 to 4, the surface charging effect was corrected, assuming that the lowest energy peak of C 1s corresponds to the reference value (Ref. C 1s 285.0 eV).
Surface charging effect correction was not performed in sample C5 as it requires a proper interpretation of the C 1s peak, considering the sample’s local composition.
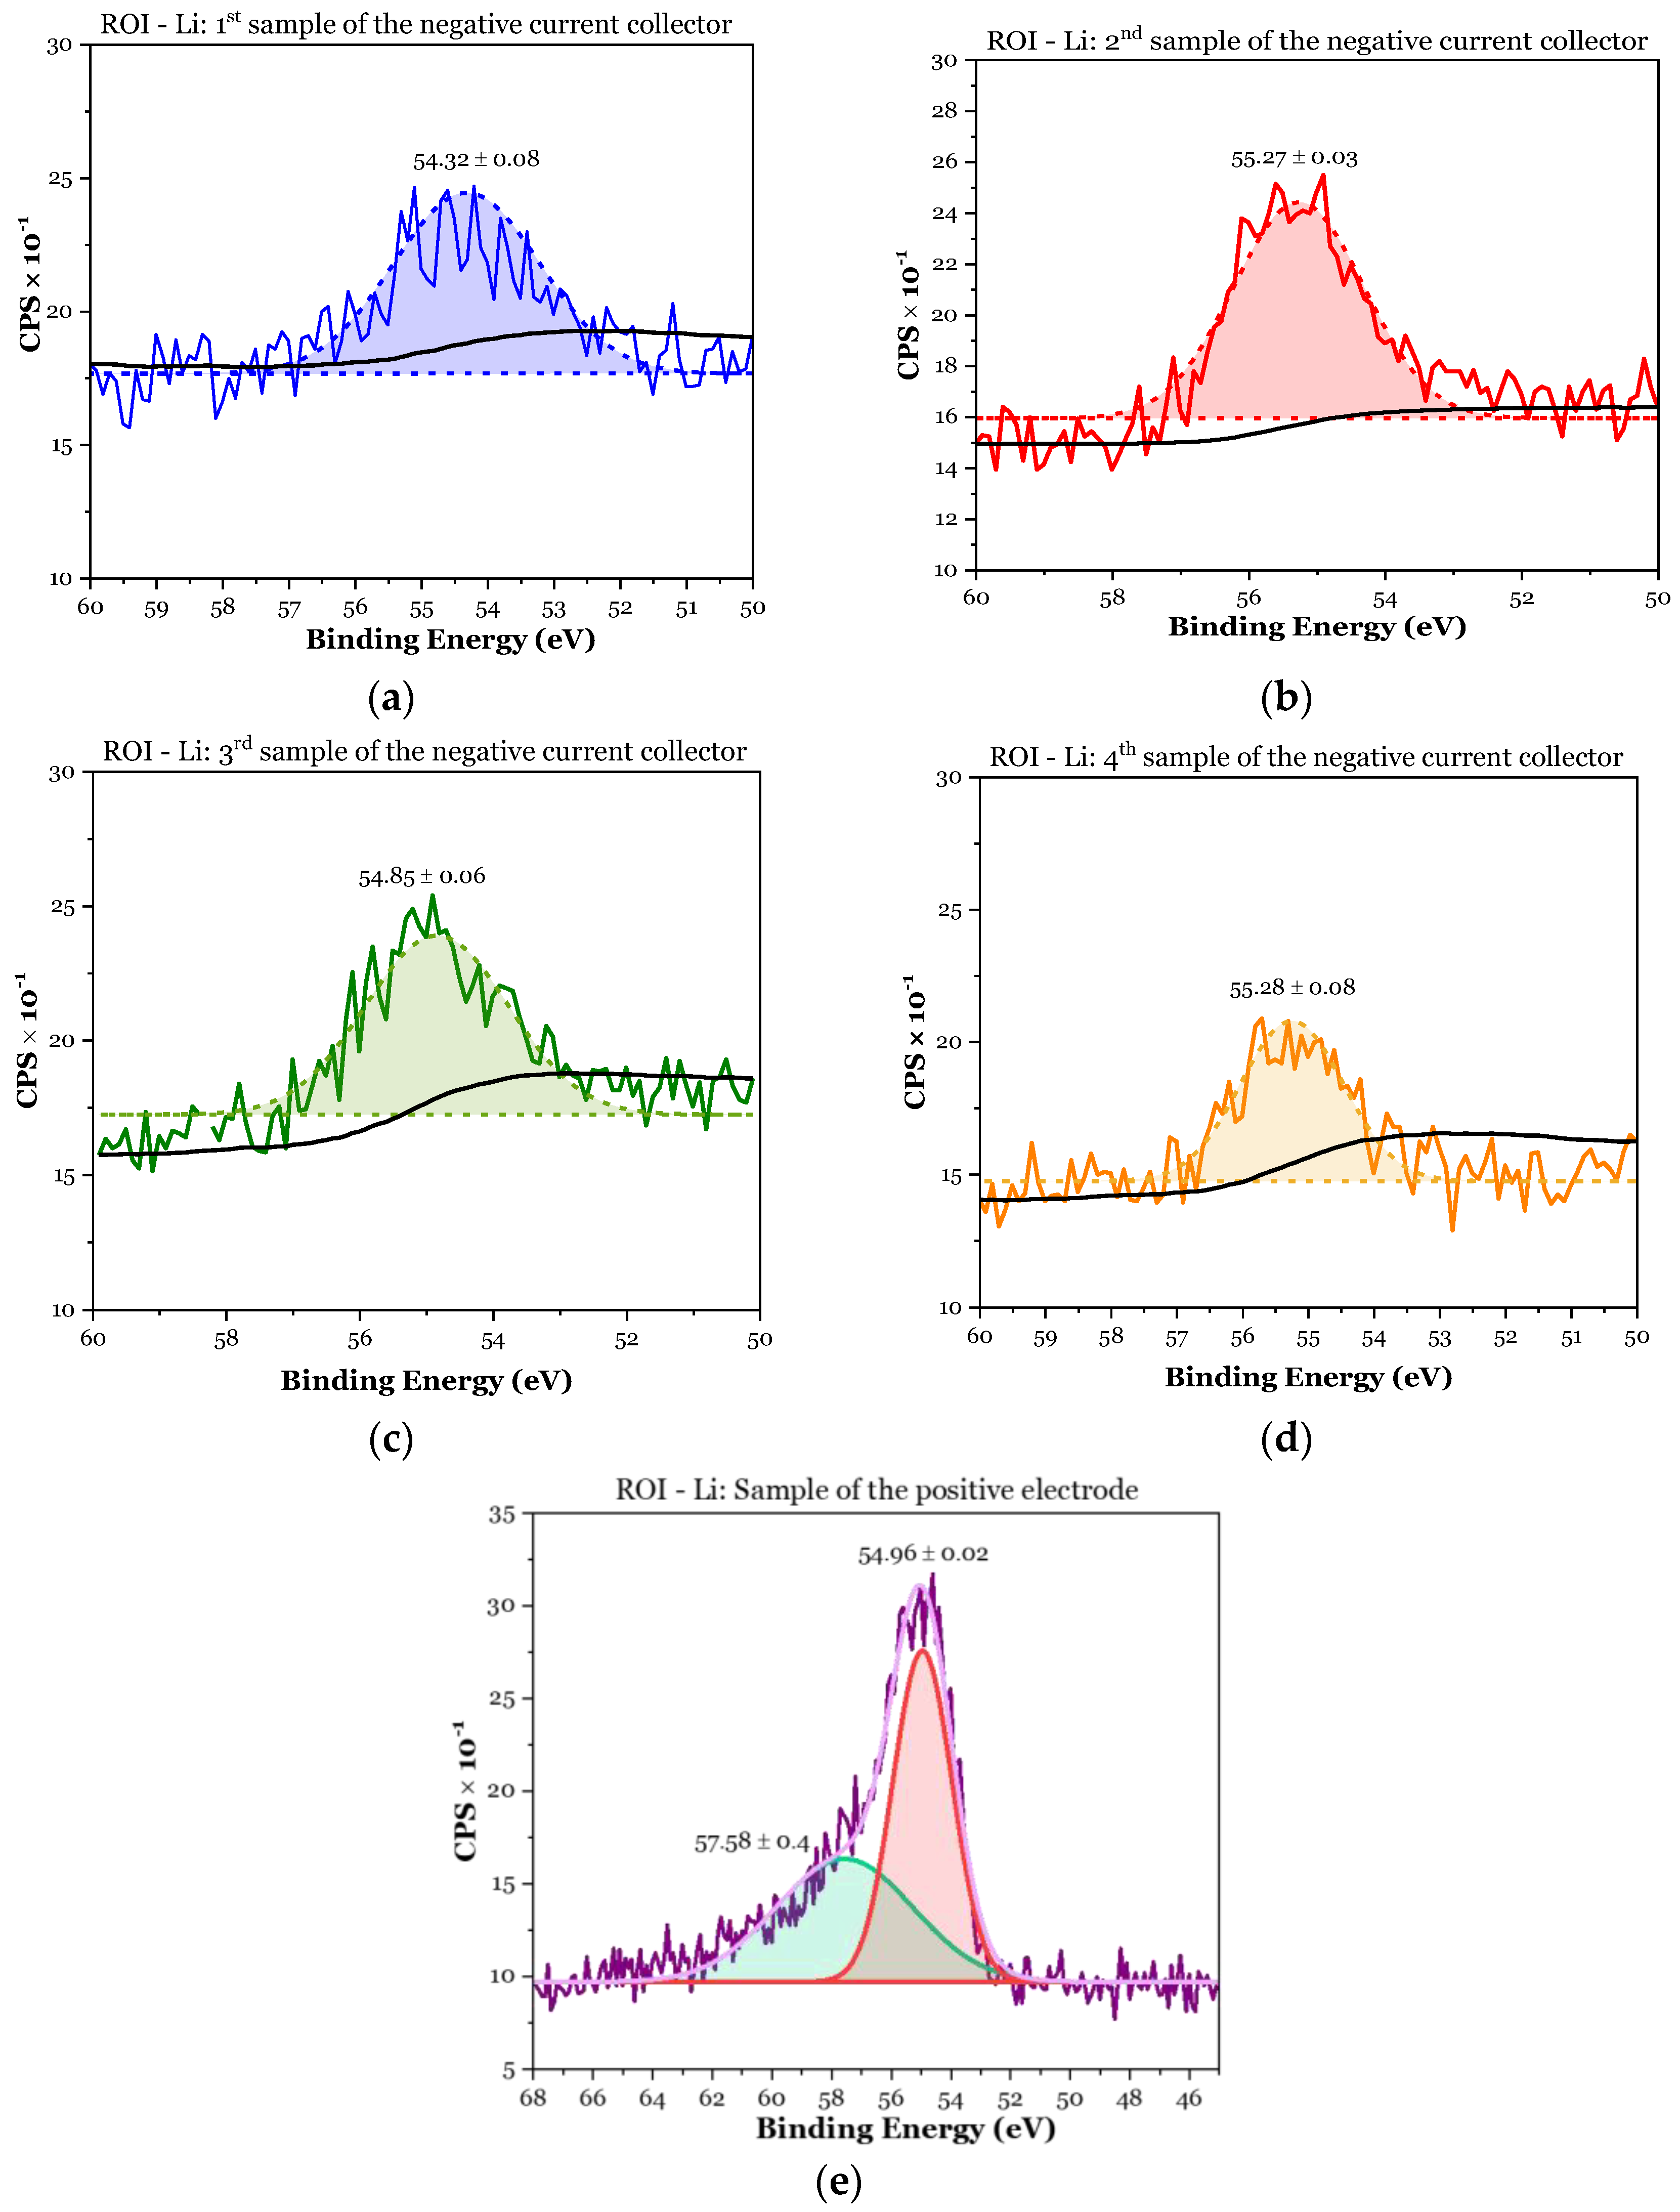
From the analyses of the negative electrode current collector samples, it becomes unequivocal that Li metal is plated on the copper negative current collector. If the discharge from 3.2 V shown in Figure 3b leaves little doubt about the effectiveness of plating Li from the electrolyte while charging, the XPS that detects the presence of the peak corresponding to Li 1s is explicit, as demonstrated in Figure 5. The Li peaks were fitted by a Gaussian function after determining the XPS background as implemented in OriginPro 2020®, OriginLab Corporation, USA. The results in Table 3 were obtained by summary analysis of the spectra with integral peak measurement, without structure modeling, and with a simple model of the background (Shirley/linear), also shown in Figure 6a–d.
The Li 1s in Figure 5 and Figure 6 varied from 54.32 ± 0.08 to 55.28 ± 0.08. The NIST database lists Li 1s varying from 54.60 to 55.35, which agrees with the results obtained herein. Likewise, Li/O2 1s is listed as 55.35 [57], LiOH 54.90 [58], and Li2CO3 55.12 [59]; all of them are possible products of the subsequent reaction between the plated Li and air. The Cu collector is barely observed. The LiCl, one of the precursors of the electrolyte, is not observed as it varies from 55.80 [58] to 56.20 [60].
The analyses of Figure 5 and Figure 6 and Table 3 demonstrate that the Li 1s is not only from Li2.99Ba0.005ClO as the x(Li)/x(Cl) = 2.99 relative stoichiometry is not matched with the ratio in the samples, being higher. Copper is just slightly detected, and Ba is not detected.
Analyzing the spectra obtained by XPS, it is shown that after charging, the anode-less cell contains Li metal plated on the negative current collector’s surface, demonstrating that a Li film is plated on the Cu surface.
Li metal is also likely to have been plated on the positive electrode while discharging, as shown in Figure 6e, peak 54.96 ± 0.02. The Li metal equalizes its chemical potential with the cathode’s, avoiding transforming the anode-less pouch cell into a symmetric cell.
In particular, the atomic percentage of Li,   x ( Li ) Cu   >   x ( Li ) Li 2.99 Ba 0.005 ClO ,
First sample (negative CC): 8.8 at.% > 2.99 × 1.2 at.% = 3.6 at.%;
Second sample (negative CC): 12.6 at.% > 2.99 × 3.9 at.% = 11.7 at.%;
Third sample (negative CC): 12.6 at.% > 2.99 × 2.8 at.% = 8.4 at.%;
Fourth sample (negative CC): 8.1 at.% > 2.99 × 2.2 at.% = 6.6 at.%;
First sample (positive electrode): 33.4   at . %   > ( 2.99 × 0.1   at . % = 0.3   at . % )   Li 2.99 Ba 0.005 ClO + 2.3   at . %   LiFePO 4 .
The same conclusions are obtained directly by LIBS analyses and indirectly by SEM/EDX, as shown hereafter.

3.1.3. LIBS Maps

Considering the configuration and order of the materials in the pouch cell assembly, the analysis by the LIBS technique has two main objectives: (i) detect the presence of Li; (ii) correlate the presence of Li with elements that are in direct contact with the surface under analysis; (iii) estimate the degree of homogeneity of the plated layer.
Figure 7 presents the distribution profiles; of Li Figure 7a and Cl Figure 7b. Li and Cl were both detected in this collector, exhibiting an inhomogeneous distribution with areas of increased accumulation. Since both elements are not part of the collector matrix, this result implies that they probably migrated from the electrolyte. Analyzing the presence of Li, where Cl is also present, no match is observed, which may suggest that Li results from nucleation in the current collector and not from direct contact with the electrolyte.
On the positive electrode side, the surface is already composed of Li and Fe originating from its composition (LiFePO4). In Figure 8a,b, it is possible to observe the uneven distribution of each element despite seeming to be a similar pattern. The XPS shows a considerable difference in atomic fractions between Li and Fe, not expected for LiFePO4, x(Li)/x(Fe) = 15, which agrees with the analyses from LIBS that show spots of what is likely plated lithium.

3.1.4. SEM and EDS Analysis

In this study, SEM is not the technique that allows us to obtain direct information essential to understanding the operation of this anode-less pouch cell configuration. However, it brings complementary information.
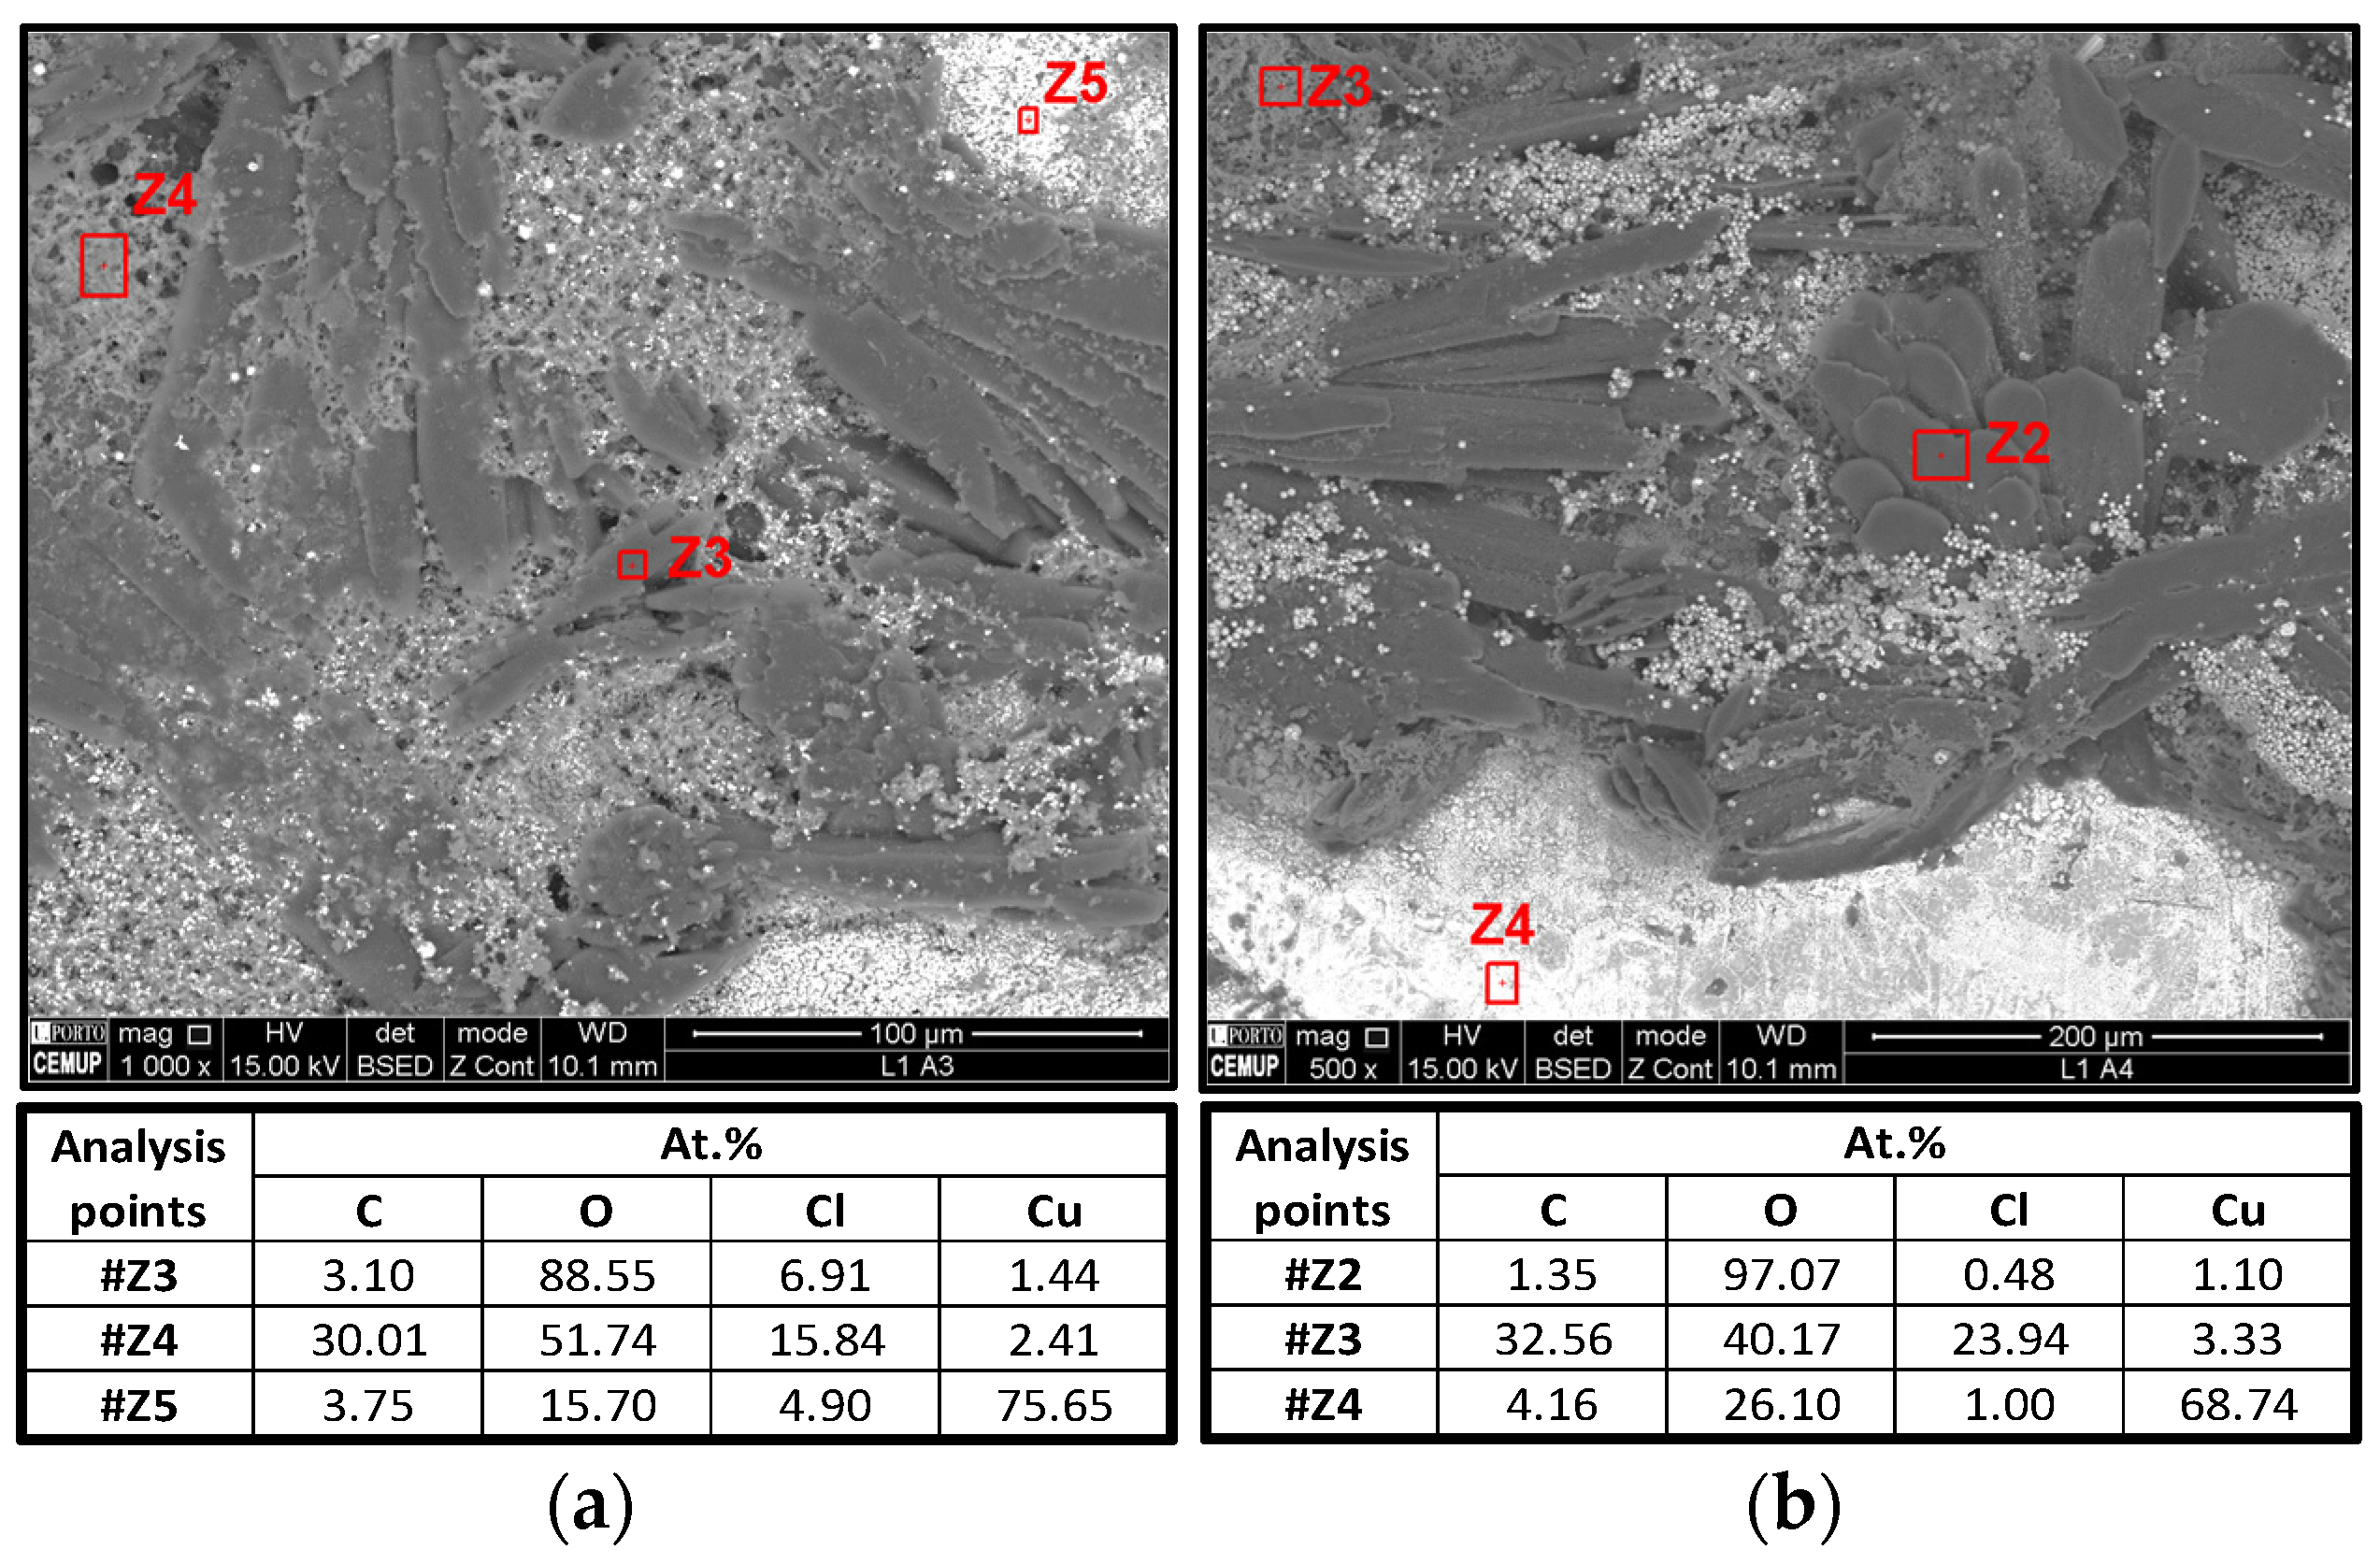
With the SEM images, it is possible to validate the presence and composition of a new phase on the surface of the negative current collector, the focus of this study, which is not homogeneous after electrochemical cycling but seems to derive from the plating of the Li+ in the electrolyte (Z4 Figure 9a and Z3 Figure 9b).
Through the EDX analyses at the selected points, the following accounts can be made:
1.
Z3 (left) and Z2 (right) almost only show oxygen, likely corresponding to Li metal oxidation;
2.
Z4 (left) and Z3 (right) show an unequivocal amount of Cl that ought to be from the electrolyte, Li2.99Ba0.005ClO;
3.
Z5 (left) and Z4 (right) are the current collector base, i.e., Cu.
Notably, the zones corresponding to 1 and 2, lithium and electrolyte, respectively, show many different morphologies, with the metal showing to be less dense (darker with backscattering electrons) and like a metallic phase plated on the collector from the electrolyte. The powdery character of the electrolyte in the zones corresponding to 2 is unequivocal.

3.2. Performance of the Cu/ZnO/Li2.99Ba0.005ClO Composite in Cellulose/LiFePO4/Cu Pouch Cell with ZnO@Cu as a Negative Current Collector

The next step in this research is focused on two main objectives: (i) optimize the discharge potential threshold with a higher potential for a longer time; (ii) increase the discharge current by decreasing the external resistor connected to the cell.
It is crucial to work on the surface of the negative current collector to maximize lithium nucleation, as already mentioned in the introduction [48,56]. Here, we propose to nucleate the Li onto zinc oxide, which was deposited on the copper foil, after being prepared into a solution similar to the cathode’s precursor solutions prepared with PVDF and NMP, where the active material is the ZnO.

3.2.1. Electrochemical Cycling

In this study, the current is calculated directly from the potential and value of the external resistance, as highlighted before.
The study of the electrochemical performance of ZnO as nucleation seed in the negative current collector started with an external resistance of 4.7 MΩ, decreasing to 980, 550, and 217 kΩ, respectively. This cell was immersed in a sand bath only at 25 °C. This way, the cell was at a constant temperature although kept at more practical operational conditions.
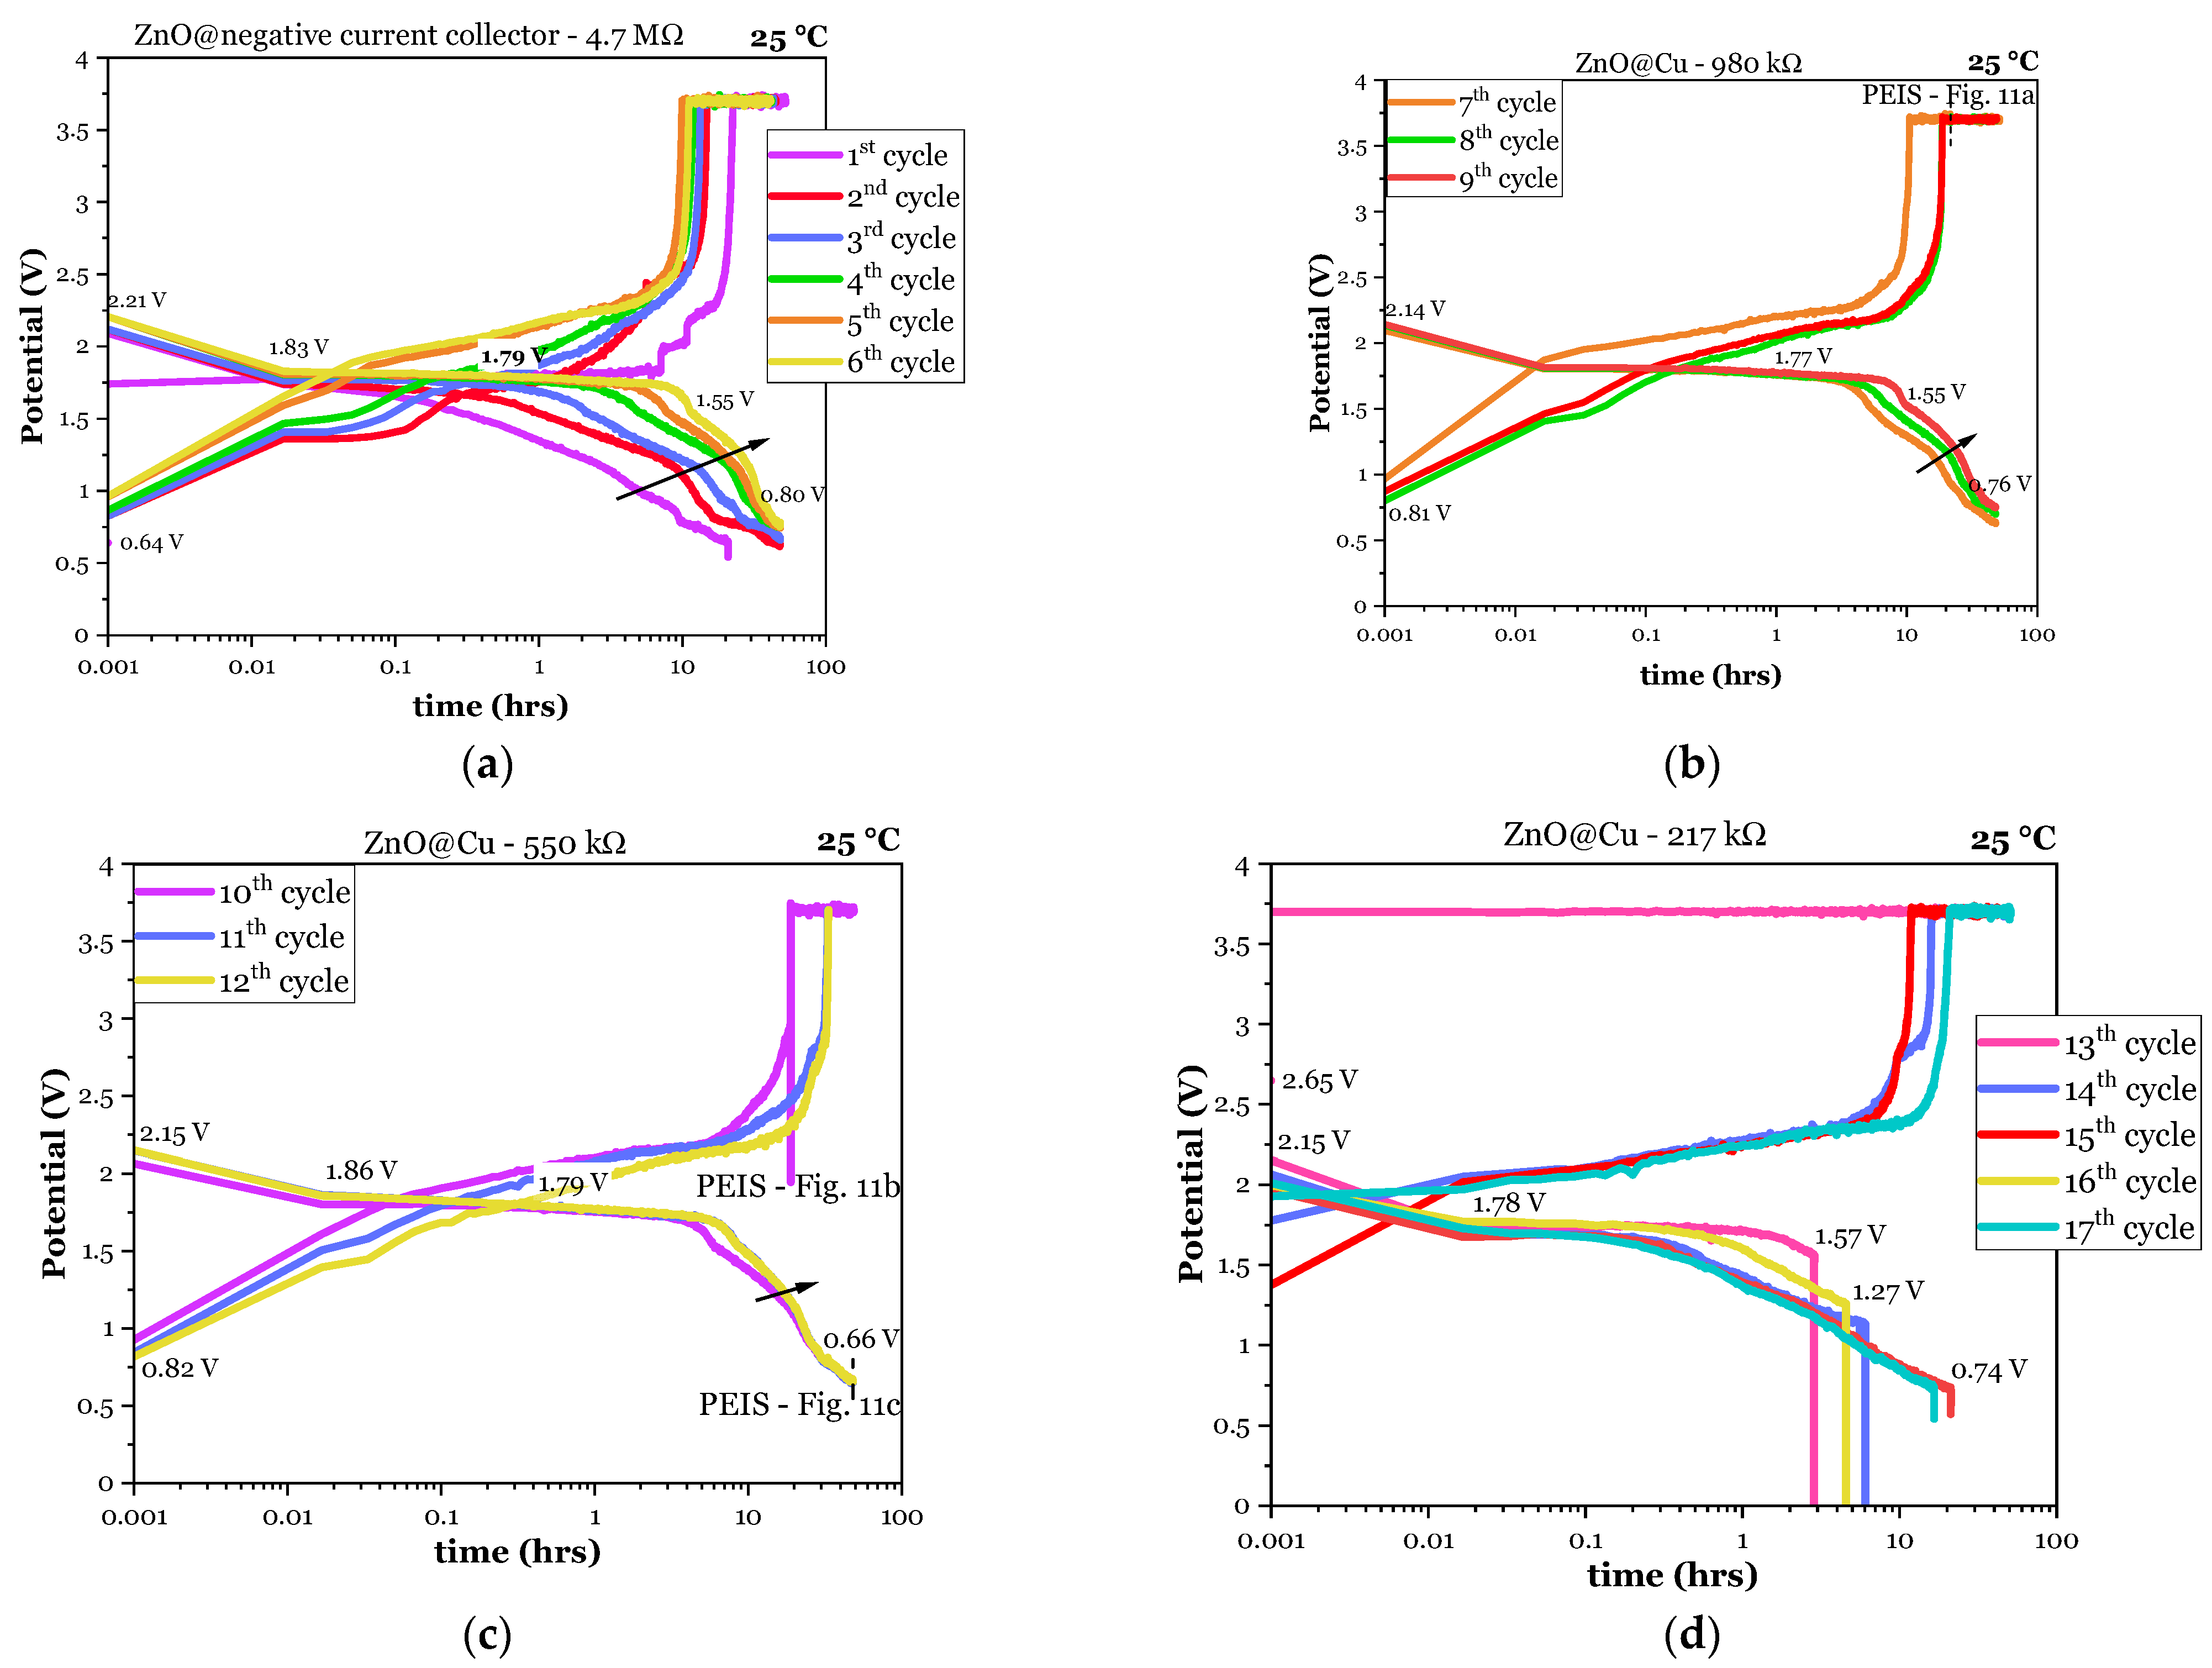
In Figure 10a, electrochemical performance is presented for pouch cell cycling with a parallel external resistance of 4.7 MΩ. Notice in Figure 10a that a constant current of 50 µA was initially applied to charge the cell, increased to 100 µA, and finally to 150 µA, reaching a plateau of 3.7 V after approximately 23 h (first cycle). The constant charging current of 150 µA was maintained in the following cycles. From Figure 10a, it is possible to conclude that the cell optimizes over time, i.e., a plateau starting at 2.21 V is demonstrated while discharging in the sixth cycle, whereas, in the first cycle, the cell begins discharging at 1.75 V.
In Figure 10b, electrochemical performance corresponds to Rext = 980 kΩ. Keeping the same conditions and changing only the external resistance connected in parallel with the pouch cell made it possible to obtain reasonable results. The initial charge corresponds to a constant current of 150 µA, and then the charge is performed at a constant voltage, and as expected, the current decreases. Table 4 shows the Li-plated features associated with charge. The maximum plated thickness was 2.9 μm on the 16th cycle.
Figure 10b shows the potential over time and a plateau at approximately 1.77 V during 8 h, with a tendency to optimize as in the previous cycles. Although the initial potential is not as high as shown in Figure 3, the discharge remains at a higher potential for many more hours, less than 15 min in Figure 3b to 8 h in Figure 10b.
This study’s next step was to gradually vary the external resistance to increase the current. The electrochemical performance of the cell with a parallel resistance of 550 kΩ remains similar to the previous. The 10th cycle had a stop where an electrochemical impedance measurement was performed; however, the behavior after this measurement was as expected. In the 11th and 12th cycles, the charging stage was completed only at CC (Figure 10c) because it was intended to understand the influence of CV removal in the discharge. The 11th and 12th cycles performed better than those previously charged at CV.
No doubts remain about the success of ZnO as a seed. The potential to achieve higher energy densities is significantly higher when the ZnO layer is applied to the negative current collector, even when the cell is cycled at 25 °C.
Table 4 and Table 5 show the first performance data, such as the thickness of the plated Li, considering the layer had been deposited homogeneously through all the surface area during charge. Table 5 shows the discharged capacity for a maximum imposed discharge time of 48 h and the corresponding maximum and average potentials. Most of the discharges could have lasted for hundreds of hours, although at approximately 0.7 V.
Figure 11 shows the electrochemical impedance analyses performed in different steps; the first was performed during the 7th cycle while charging in CV mode, Figure 10b; the second was performed during the 10th cycle while charging in CC mode, Figure 10c; the third was performed at the end of the 12th cycle, after discharging at constant resistance, Figure 10c.
The PEIS analyses reveal that while charging, only one semicircle in the Nyquist plot is observed, corresponding to the ionic conductivity of the electrolyte σ = 1 R ( d A ) . In Figure 11a,b, the semicircle corresponds to the parallel between C1 and R2, where R2 is the resistance of the capacitor conducing to the ionic conductivity σ (Figure 11). The capacitor is ZnO/Li2.99Ba0.005ClO/LiFePO4. Li+ is, therefore, the capacitor’s mobile element with the highest natural frequency observed below 7 MHz.
When the cell is in the trend of being charged, the ionic conductivity in the bulk is similar to at OCV, likely due to the coulombic forces getting stronger at the interfaces, where the charge is accumulated, not producing a considerable effect at the bulk.
It is also possible that part of the semicircle corresponding to the parallel circuit R2 and C1 is also due to the ZnO/Li2.99Ba0.005ClO interface electrical double-layer capacitor EDLC, spontaneously formed to align the electrochemical potentials between the negative current collector and the electrolyte.
In Figure 11c, the Nyquist plot obtained while discharging shows another semicircle corresponding to R3 parallel to C2, Figure 11c,d. This latter semicircle likely corresponds to the electrical double-layer capacitor EDLC Li2.99Ba0.005ClO/LiFePO4 spontaneously formed to equalize the electrochemical potentials between the electrolyte and the positive electrode, meanwhile with Li+ accumulation at the cathode side upon discharge.
The impedance in Figure 11c is much higher than in Figure 11a,b, even if Figure 11b,c were obtained during the same cycle. The resistance corresponding to Li2.99Ba0.005ClO/LiFePO4 interface is coherent with the Li metal likely plated on the cathode due to a deficient diffusion toward the cathode’s bulk.

3.2.2. XPS Analysis

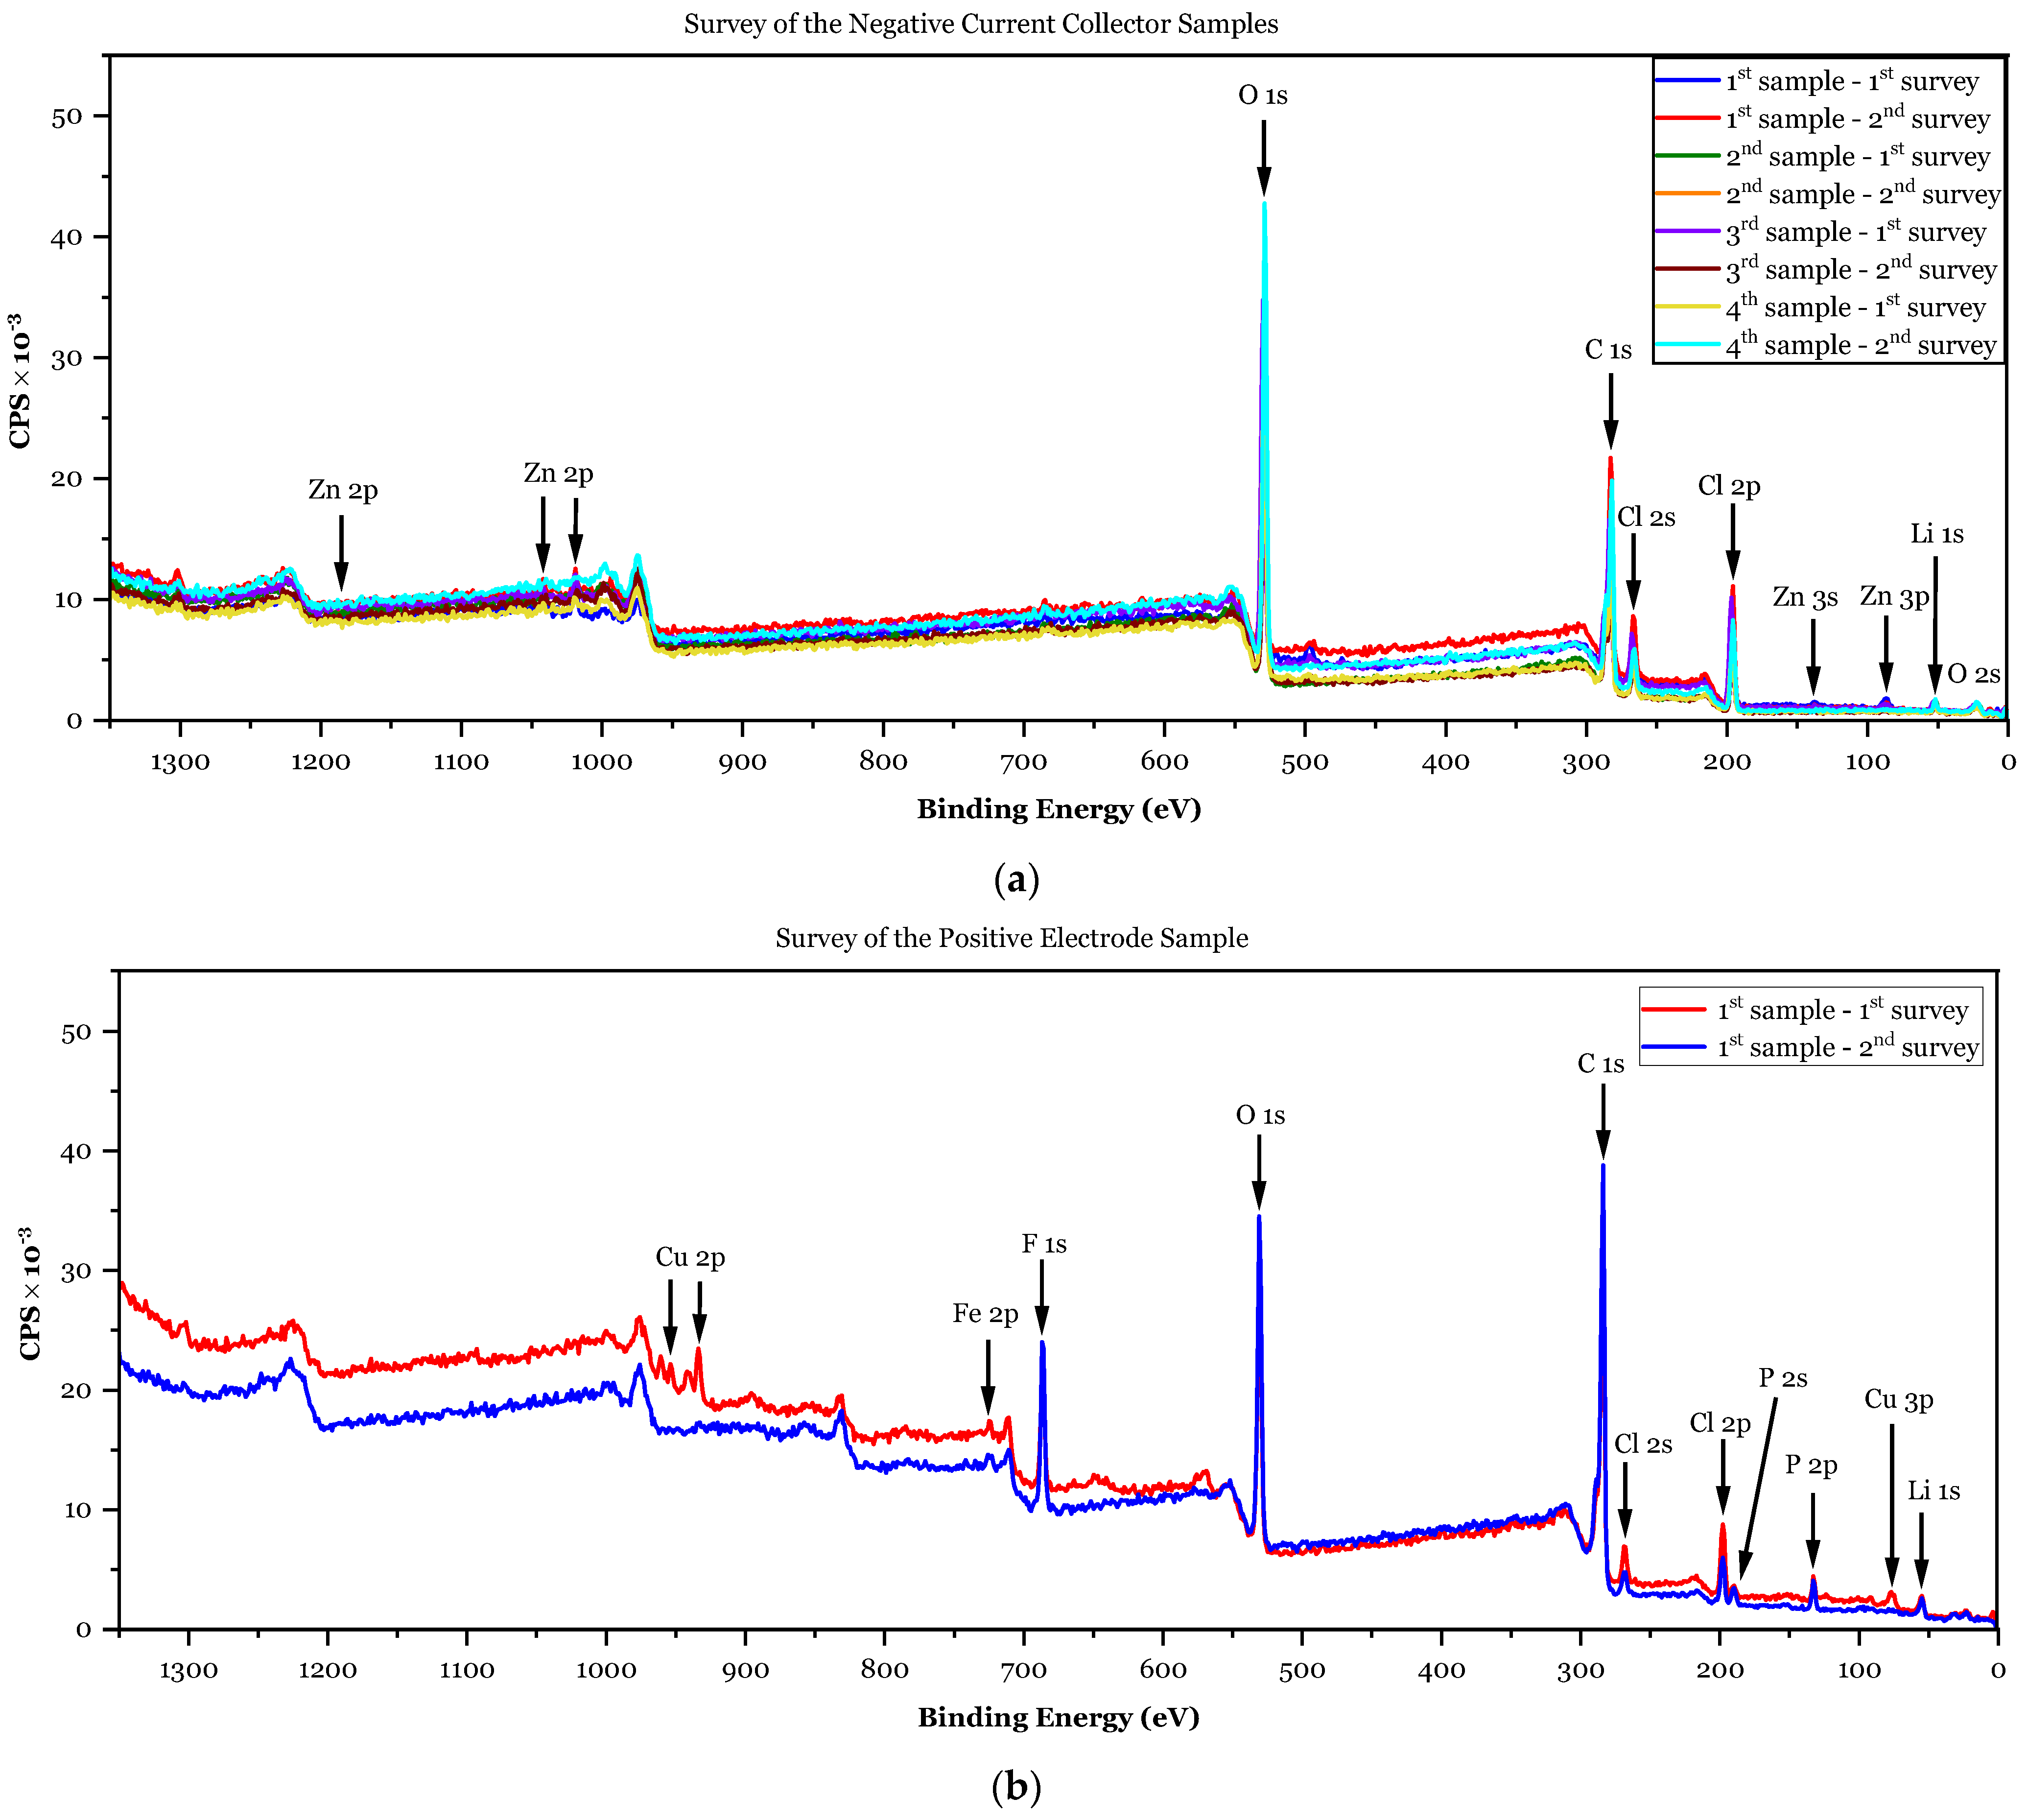
Following the same procedure mentioned before, after cycling the pouch cell Cu/ZnO/Li2.99Ba0.005ClO composite in cellulose/LiFePO4/Cu, it was disassembled, and the samples were prepared for XPS analysis (Figure 12).
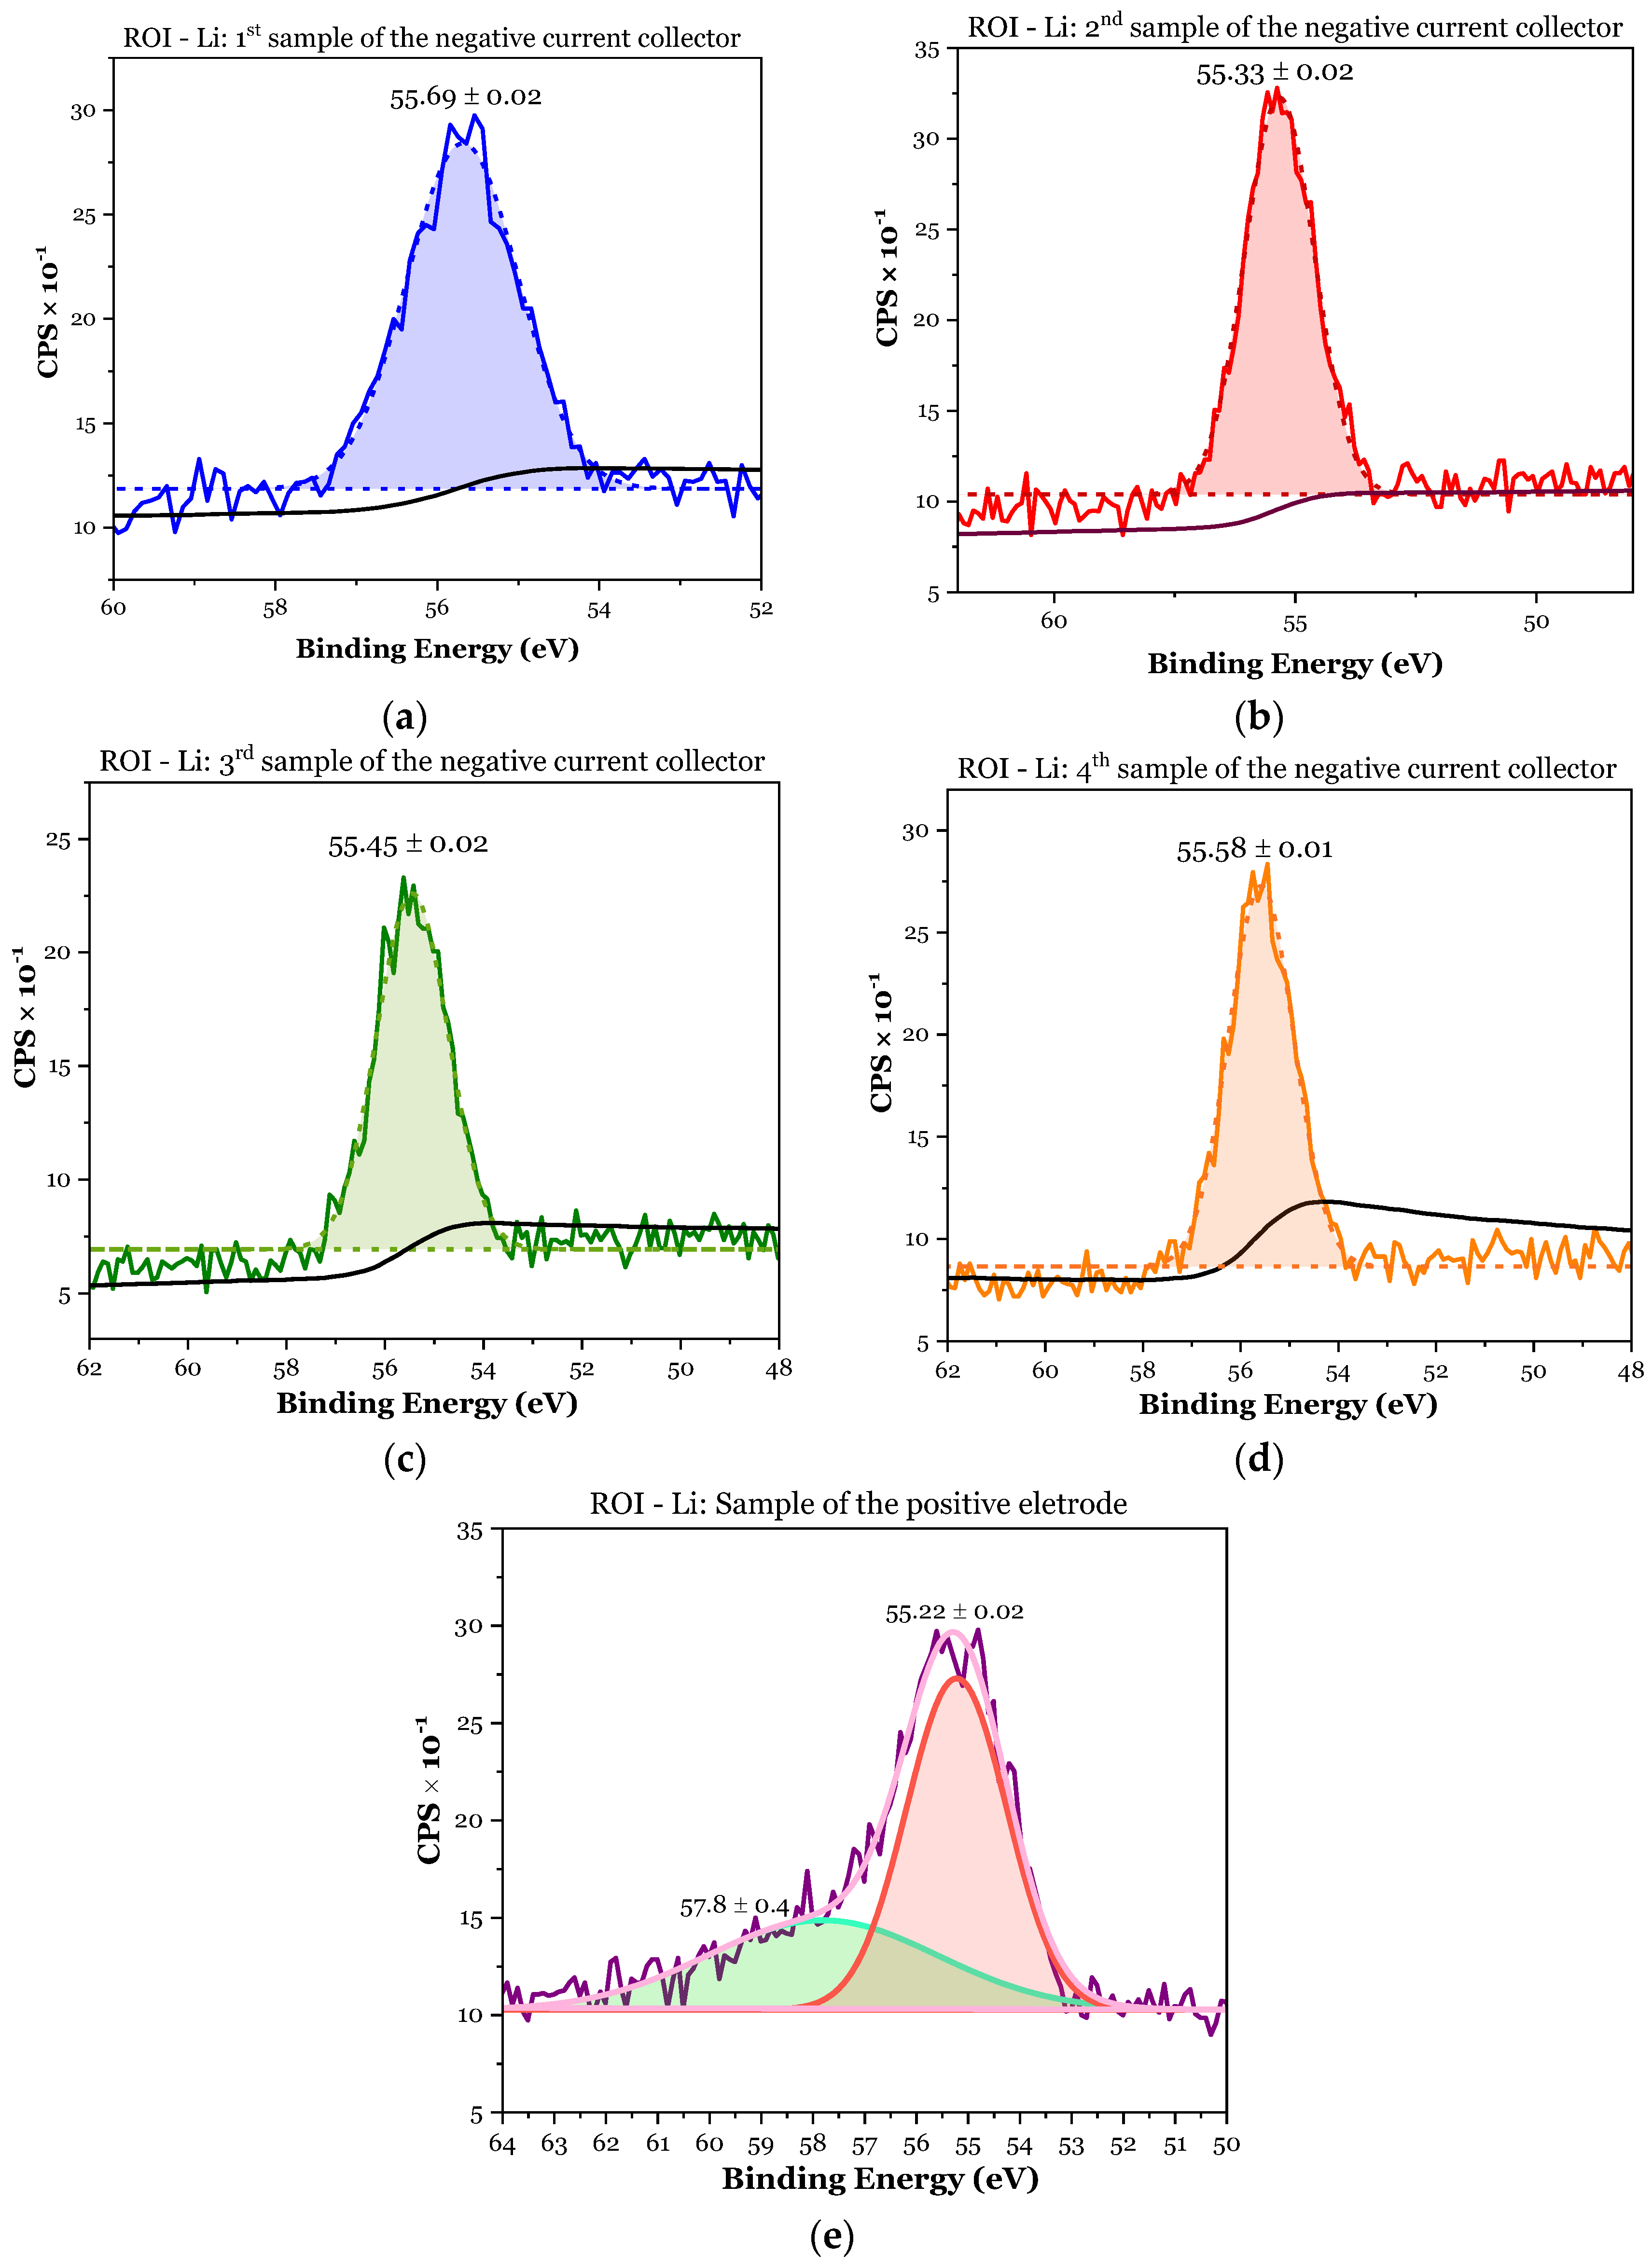
According to the XPS in Figure 12 and Figure 13, and Table 6, the Cu/ZnO/Li2.99Ba0.005ClO composite in cellulose/LiFePO4/Cu pouch cell shows a higher atomic concentration of lithium than the cell without ZnO. Conversely, the Zn from the ZnO seed layer is barely detected by XPS, reinforcing what was demonstrated with the electrochemical cycling. The ZnO is an active seed center that stabilizes the discharge, although reducing approximately 15% the first discharge and plateau potentials.
Following the same calculations as for the cell where the negative current collector is plain Cu, not coated with ZnO, the atomic percentage of Li, x ( Li ) ZnO > x ( Li ) Li 2.99 Ba 0.005 ClO ,
First sample (negative CC): 17.3 at.% < 2.99 × 8.3 at.% = 24.8 at.%;
Second sample (negative CC): 20.9 at.% > 2.99 × 3.8 at.% = 11.4 at.%;
Third sample (negative CC): 23.7 at.% > 2.99 × 5.2 at.% = 15.5 at.%;
Fourth sample (negative CC): 21.8 at.% > 2.99 × 4.9 at.% = 14.7 at.%;
First sample (positive electrode): 24.2   at . %   > ( 2.99 × 1.6   at . % = 4.8   at . % )   Li 2.99 Ba 0.005 ClO + 1.7   at . %   LiFePO 4 .
As expected, the deposition of Li is not uniform, and therefore there are different atomic percentages for the Li among the four samples obtained from the same current collector.
Interestingly, the first sample is the only one in which the atomic percentage of Li is lower than the corresponding Li2.99Ba0.005ClO, indicating that the Li is likely from the electrolyte due to its contact with the negative current collector. It is also the sample where the presence of Zn was detected more. Thus, where Zn is no longer detected, the presence of Li is higher than the corresponding electrolyte stoichiometry; in other words, the presence of ZnO on the surface of the current collector helps the nucleation of Li.
The positive electrode in Figure 13e shows, as in the cell without ZnO in Figure 6e, two peaks, the 55.22 eV possibly corresponding to Li or Li/O2 and the 57.8 likely corresponding to the Li in LiFePO4.

3.2.3. LIBS Maps

Figure 14 displays Li’s and Cl’s atomic distribution profiles on the negatively charged current collector constituted by Cu coated with ZnO. Here, again, the maximum distribution of Li does not correspond to the maximum distribution of Cl, denoting that Li is independent of the presence of an electrolyte.
The presence of Li does not match the presence of Zn either, as observed with XPS. In general, where the Li seems to be in a higher percentage, the Zn is less observed (Figure 15).
The positive electrode, LiFePO4 cathode, in the pouch cell Cu/ZnO/Li2.99Ba0.005ClO composite in cellulose/LiFePO4/Cu shows a heterogeneous distribution of Li and Fe (Figure 16a,b). Figure 16a shows the variation in the Li along the positive electrode, suggesting that Li may also have been plated on the positive electrode upon cycling, as pointed out before, as also shown in Figure 12 and Figure 13 and Table 6.

3.2.4. SEM and EDX Analyses

With the results obtained by SEM and EDX in Figure 17, it is possible to reinforce what was previously mentioned; the presence of Zn is inversely proportional to the presence of O corresponding to the oxidation of Li (Z2 in Figure 17a,b). The least dense materials are darker in SEM microphotographs obtained with backscattering electrons.
The Li and Li/O2 are likely the least dense material (Z2 in Figure 17a,b), followed by the electrolyte Li2.99Ba0.005ClO on ZnO (Z3 in Figure 17a,b). The morphology of the phase corresponding to Z2 (likely Li metal) is very similar to the correspondent in Figure 9, and both grow from regions containing electrolyte (Z3) Figure 17.
The ZnO-coated layer mixed with the PVDF binder upon cell fabrication should correspond to Z1 in both Figure 17a,b.
The needles in Z4 and Z5 of Figure 17a and Z4 of Figure 17b are likely ZnCl2-ZnO. Zinc chloride can crystallize into various forms, including needle-like or prismatic crystals, depending on the specific conditions of the crystallization process. The formation of needle-shaped crystals in ZnCl2 can be observed when the compound is slowly crystallized from a solution with appropriate solvent and temperature conditions. However, it is important to note that other factors, such as impurities or additives in the crystallization process, can also influence crystal morphology.

4. Conclusions

The main priority of this study was (1) to analyze the Li plated from the electrolyte onto the negative electrode current collector by direct techniques, such as XPS and LIBS; (2) to analyze it by indirect techniques, where the Li is not detected, such as SEM/EDX and electrochemical cycling; (3) to identify the best conditioning parameters, including external resistance (from OCV to 216 kΩ), temperature (60 and 25 °C), charge method and discharge time (3 to 300 h), and nucleation seed introduced by doctor blading ZnO onto the negative current collector.
It is concluded that plating the lithium anode upon charge is possible, at 25 °C, without ever applying pressure. ZnO is a valid nucleation center allowing higher discharge power during the first hours.
The anode-less Cu/Li2.99Ba0.005ClO/LiFePO4/Cu pouch cells show at least two stages, one at a higher potential that corresponds to a fast discharge and a long, robust plateau at lower potentials that may be stable for hundreds of hours depending on the output current.
An optimization upon cycling with increasing capacity is observed for the smaller currents. It is also concluded that the cells have an optimum discharge current that is not the lowest; keeping them on the shelf at OCV is inconvenient for longer lives. This latter feature was observed previously with ferroelectric electrolytes of this family.
We conclude that a long path toward faster discharge rates is still necessary. Still, the results tackle several pathways toward a reliable all-solid-state anode-less battery.

Author Contributions

Original draft: M.C.B.; pouch cells fabrication and testing: M.C.B. and B.M.G.; LIBS experiments design and conceptualization: D.C., M.F.S.F., D.G., N.A.S. and P.A.S.J.; review of state of the art: M.C.B., D.C., D.G., N.A.S. and J.J.S.; conceptualization, formal analysis, and supervision: M.H.B.; review and editing: all. All authors have read and agreed to the published version of the manuscript.

Funding

This research was funded by the CAVALI project, reference POCI-01-0247-FEDER-047728, co-funded by the ERDF, through the COMPETE 2020, under the PORTUGAL 2020 Partnership Agreement; the Portuguese Foundation for Science and Technology FCT UIDP/50022/2020 Emerging Technologies—LAETA; PTDC/QUI-ELT/2593/2021 “Redox-active Metal-Organic Frameworks as Electrode Materials for Lithium-Ion Batteries” project; NGS—New Generation Storage, reference PRR-C644936001-00000045, funded by agency for competitiveness and innovation, I.P., and CVB—Cadeia de Valor das Baterias em Portugal, reference PRR—C644864613-00000003, funded by agency for competitiveness and innovation, I.P.

Data Availability Statement

The authors may provide all data upon reasonable request.

Acknowledgments

M.H.B. acknowledges John B. Goodenough’s endowment to the MatER—Materials for Energy Research lab, FEUP.

Conflicts of Interest

The authors declare no conflict of interest.

References

  1. Rume, T.; Islam, S.M.D.U. Environmental Effects of COVID-19 Pandemic and Potential Strategies of Sustainability. Heliyon 2020, 6, e04965. [Google Scholar] [CrossRef] [PubMed]
  2. Coppez, G.; Chowdhury, S.; Chowdhury, S.P. The Importance of Energy Storage in Renewable Power Generation: A Review. In Proceedings of the 45th International Universities Power Engineering Conference UPEC2010, Cardiff, UK, 31 August–3 September 2010. [Google Scholar]
  3. Braga, M.H.; Murchison, A.J.; Ferreira, J.A.; Singh, P.; Goodenough, J.B. Glass-Amorphous Alkali-Ion Solid Electrolytes and Their Performance in Symmetrical Cells. Energy Environ. Sci. 2016, 9, 948–954. [Google Scholar] [CrossRef]
  4. Salvatierra, R.; Chen, W.; And, J.T.-A.E. What Can Be Expected from “Anode-Free” Lithium Metal Batteries? Adv. Energy Sustain. Res. 2021, 2, 2000110. [Google Scholar] [CrossRef]
  5. Pal, S.; Zhang, X.; Babu, B.; Lin, X.; Wang, J.; Vlad, A. Materials, Electrodes and Electrolytes Advances for next-Generation Lithium-Based Anode-Free Batteries. Oxf. Open Mater. Sci. 2022, 2, itac005. [Google Scholar] [CrossRef]
  6. Zhang, J.G. Anode-Less. Nat. Energy 2019, 4, 637–638. [Google Scholar] [CrossRef]
  7. Li, P.; Kim, H.; Ming, J.; Jung, H.-G.; Belharouak, I.; Sun, Y.-K. Quasi-Compensatory Effect in Emerging Anode-Free Lithium Batteries. eScience 2021, 1, 3–12. [Google Scholar] [CrossRef]
  8. Tian, Y.; An, Y.; Wei, C.; Jiang, H.; Xiong, S.; Feng, J.; Qian, Y. Recently Advances and Perspectives of Anode-Free Rechargeable Batteries. Nano Energy 2020, 78, 105344. [Google Scholar] [CrossRef]
  9. Xie, Z.; Wu, Z.; An, X.; Yue, X.; Wang, J.; Abudula, A.; Guan, G. Anode-Free Rechargeable Lithium Metal Batteries: Progress and Prospects. Energy Storage Mater. 2020, 32, 386–401. [Google Scholar] [CrossRef]
  10. Tong, Z.; Bazri, B.; Hu, S.-F.; Liu, R.-S. Interfacial Chemistry in Anode-Free Batteries: Challenges and Strategies. J. Mater. Chem. A Mater. 2021, 9, 7396. [Google Scholar] [CrossRef]
  11. Heubner, C.; Maletti, S.; Auer, H.; Hüttl, J.; Voigt, K.; Lohrberg, O.; Nikolowski, K.; Partsch, M.; Michaelis, A. From Lithium-Metal toward Anode-Free Solid-State Batteries: Current Developments, Issues, and Challenges. Adv. Funct. Mater. 2021, 31, 2106608. [Google Scholar] [CrossRef]
  12. Park, S.H.; Jun, D.; Lee, G.H.; Lee, S.G.; Lee, Y.J. Toward High-Performance Anodeless Batteries Based on Controlled Lithium Metal Deposition: A Review. J. Mater Chem. A Mater. 2021, 9, 14656–14681. [Google Scholar] [CrossRef]
  13. Shao, A.; Tang, X.; Zhang, M.; Bai, M.; Ma, Y. Challenges, Strategies, and Prospects of the Anode-Free Lithium Metal Batteries. Adv. Energy Sustain. Res. 2022, 3, 2100197. [Google Scholar] [CrossRef]
  14. Yao, W.; Zou, P.; Wang, M.; Zhan, H.; Kang, F.; Yang, C. Design Principle, Optimization Strategies, and Future Perspectives of Anode-Free Configurations for High-Energy Rechargeable Metal Batteries. Electrochem. Energy Rev. 2021, 4, 601–631. [Google Scholar] [CrossRef]
  15. Nanda, S.; Gupta, A.; Manthiram, A. Anode-Free Full Cells: A Pathway to High-Energy Density Lithium-Metal Batteries. Adv. Energy Mater. 2020, 11, 2000804. [Google Scholar] [CrossRef]
  16. Julien, M.; Armand, P. Zaghib Building Better Batteries in the Solid State: A Review. Materials 2019, 12, 3892. [Google Scholar] [CrossRef] [Green Version]
  17. Wu, B.; Chen, C.; Raijmakers, L.H.J.; Liu, J.; Danilov, D.L.; Eichel, R.-A.; Notten, P.H.L. Li-Growth and SEI Engineering for Anode-Free Li-Metal Rechargeable Batteries: A Review of Current Advances. Energy Storage Mater. 2023, 57, 508–539. [Google Scholar] [CrossRef]
  18. Yang, T.; Luo, D.; Liu, Y.; Yu, A.; Chen, Z. Anode-Free Sodium Metal Batteries as Rising Stars for Lithium-Ion Alternatives. iScience 2023, 26, 105982. [Google Scholar] [CrossRef]
  19. Neudecker, B.J.; Dudney, N.J.; Bates, J.B. “Lithium-Free” Thin-Film Battery with In Situ Plated Li Anode. J. Electrochem. Soc. 2000, 147, 517–523. [Google Scholar] [CrossRef]
  20. Bates, J.B.; Dudney, N.J.; Neudecker, B.; Ueda, A.; Evans, C.D. Thin-Film Lithium and Lithium-Ion Batteries. Solid State Ion. 2000, 135, 33–45. [Google Scholar] [CrossRef] [Green Version]
  21. Lee, S.H.; Liu, P.; Tracy, C.E. Lithium Thin-Film Battery with a Reversed Structural Configuration SS/Li/Lipon/LixV2O5/Cu. Electrochem. Solid-State Lett. 2003, 6, A275. [Google Scholar] [CrossRef]
  22. Westover, A.S.; Dudney, N.J.; Sacci, R.L.; Kalnaus, S. Deposition and Confinement of Li Metal along an Artificial Lipon-Lipon Interface. ACS Energy Lett. 2019, 4, 651–655. [Google Scholar] [CrossRef]
  23. Zegeye, T.A.; Su, W.N.; Fenta, F.W.; Zeleke, T.S.; Jiang, S.K.; Hwang, B.J. Ultrathin Li6.75La3Zr1.75Ta0.25O12-Based Composite Solid Electrolytes Laminated on Anode and Cathode Surfaces for Anode-Free Lithium Metal Batteries. ACS Appl. Energy Mater. 2020, 3, 11713–11723. [Google Scholar] [CrossRef]
  24. Wang, M.J.; Carmona, E.; Gupta, A.; Albertus, P.; Sakamoto, J. Enabling “Lithium-Free” Manufacturing of Pure Lithium Metal Solid-State Batteries through in Situ Plating. Nat. Commun. 2020, 11, 5201. [Google Scholar] [CrossRef] [PubMed]
  25. Gu, D.; Kim, H.; Lee, J.-H.; Park, S. Surface-Roughened Current Collectors for Anode-Free All-Solid-State Batteries. J. Energy Chem. 2022, 70, 248–257. [Google Scholar] [CrossRef]
  26. Huang, W.-Z.; Liu, Z.-Y.; Xu, P.; Kong, W.-J.; Huang, X.-Y.; Shi, P.; Wu, P.; Zhao, C.-Z.; Yuan, H.; Huang, J.-Q. High-Areal-Capacity Anode-Free All-Solid-State Lithium Batteries Enabled by Interconnected Carbon-Reinforced Ionic-Electronic Composites. J. Mater. Chem. A Mater. 2023, 11, 12713–12718. [Google Scholar] [CrossRef]
  27. Lohrberg, O.; Voigt, K.; Maletti, S.; Auer, H.; Nikolowski, K.; Heubner, C.; Michaelis, A. Benchmarking and Critical Design Considerations of Zero-Excess Li-Metal Batteries. Adv. Funct. Mater. 2023, 33, 2214891. [Google Scholar] [CrossRef]
  28. Asano, H.; Liu, J.; Ueno, K.; Dokko, K.; Kojima, T.; Takeichi, N.; Miyuki, T.; Yamakawa, Y.; Watanabe, M. Enhancing the Reversibility of Li Deposition/Dissolution in Sulfur Batteries Using High-Concentration Electrolytes to Develop Anode-Less Batteries with Lithium Sulfide Cathode. J. Power Sources 2023, 554, 232323. [Google Scholar] [CrossRef]
  29. Zheng, X.; Liu, Z.; Sun, J.; Luo, R.; Xu, K.; Si, M.; Kang, J.; Yuan, Y.; Liu, S.; Ahmad, T. Constructing Robust Heterostructured Interface for Anode-Free Zinc Batteries with Ultrahigh Capacities. Nat. Commun. 2023, 14, 76. [Google Scholar] [CrossRef] [PubMed]
  30. Fuchs, T.; Becker, J.; Haslam, C.G.; Lerch, C.; Sakamoto, J.; Richter, F.H.; Janek, J. Current-Dependent Lithium Metal Growth Modes in “Anode-Free” Solid-State Batteries at the Cu| LLZO Interface. Adv. Energy Mater. 2023, 13, 2203174. [Google Scholar] [CrossRef]
  31. Hsueh, T.-H.; Wang, M.-C.; Liu, S.-E.; Wu, B.-H.; Li, Y.-C.; Tsai, D.-G.; Chang, S.-M.; Shiue, A.; Chin, K.-Y. Sputtered Silver on the Current Collector for Anode-Less NMC111 Gel Polymer Electrolyte Lithium Batteries. Electrochem. Commun. 2023, 150, 107478. [Google Scholar] [CrossRef]
  32. Li, S.; Zhu, H.; Liu, Y.; Wu, Q.; Cheng, S.; Xie, J. Space-Confined Guest Synthesis to Fabricate Sn-monodispersed N-doped Mesoporous Host toward Anode-Free Na Batteries. Adv. Mater. 2023, 2301967. [Google Scholar] [CrossRef] [PubMed]
  33. Dahunsi, O.J.; Gao, S.; Kaelin, J.; Li, B.; Razak, I.B.A.; An, B.; Cheng, Y. Anode-Free Na Metal Batteries Developed by Nearly Fully Reversible Na Plating on the Zn Surface. Nanoscale 2023, 15, 3255–3262. [Google Scholar] [CrossRef] [PubMed]
  34. Dahunsi, O.J.; Li, B.; An, B.; Abdul Razak, I.B.; Xia, F.; Gao, S.; Chen, J.; Li, G.; Cheng, Y. Directing High-Efficiency Na Plating with Carbon–Aluminum Junction Interfaces for Anode-Free Na Metal Batteries. Energy Fuels 2023, 37, 7522–7529. [Google Scholar] [CrossRef]
  35. Liu, Z.; Lu, Z.; Guo, S.; Yang, Q.-H.; Zhou, H. Toward High Performance Anodes for Sodium-Ion Batteries: From Hard Carbons to Anode-Free Systems. ACS Cent. Sci. 2023, 9, 1076–1087. [Google Scholar] [CrossRef] [PubMed]
  36. Jo, C.-H.; Sohn, K.-S.; Myung, S.-T. Feasible Approaches for Anode-Free Lithium-Metal Batteries as Next Generation Energy Storage Systems. Energy Storage Mater. 2023, 57, 471–496. [Google Scholar] [CrossRef]
  37. Li, Y.; Feng, X.; Lieu, W.Y.; Fu, L.; Zhang, C.; Ghosh, T.; Thakur, A.; Wyatt, B.C.; Anasori, B.; Liu, W. MXene-Based Anode-Free Magnesium Metal Battery. Adv. Funct. Mater. 2023, 2303067. [Google Scholar] [CrossRef]
  38. Wang, C.; Zheng, Y.; Chen, Z.; Zhang, R.; He, W.; Li, K.; Yan, S.; Cui, J.; Fang, X.; Yan, J. Robust Anode-Free Sodium Metal Batteries Enabled by Artificial Sodium Formate Interface. Adv. Energy Mater. 2023, 13, 2204125. [Google Scholar] [CrossRef]
  39. Ming, F.; Zhu, Y.; Huang, G.; Emwas, A.-H.; Liang, H.; Cui, Y.; Alshareef, H.N. Co-Solvent Electrolyte Engineering for Stable Anode-Free Zinc Metal Batteries. J. Am. Chem. Soc. 2022, 144, 7160–7170. [Google Scholar] [CrossRef]
  40. Liu, S.; Jiao, K.; Yan, J. Prospective Strategies for Extending Long-Term Cycling Performance of Anode-Free Lithium Metal Batteries. Energy Storage Mater. 2022, 54, 689–712. [Google Scholar] [CrossRef]
  41. Liang, P.; Sun, H.; Huang, C.; Zhu, G.; Tai, H.; Li, J.; Wang, F.; Wang, Y.; Huang, C.; Jiang, S. A Nonflammable High-Voltage 4.7 V Anode-Free Lithium Battery. Adv. Mater. 2022, 34, 2207361. [Google Scholar] [CrossRef]
  42. Lee, Y.G.; Fujiki, S.; Jung, C.; Suzuki, N.; Yashiro, N.; Omoda, R.; Ko, D.S.; Shiratsuchi, T.; Sugimoto, T.; Ryu, S.; et al. High-Energy Long-Cycling All-Solid-State Lithium Metal Batteries Enabled by Silver–Carbon Composite Anodes. Nat. Energy 2020, 5, 299–308. [Google Scholar] [CrossRef]
  43. Hebert, A.; McCalla, E. The Role of Metal Substitutions in the Development of Li Batteries, Part I: Cathodes. Mater. Adv. 2021, 2, 3474–3518. [Google Scholar] [CrossRef]
  44. Salgado, R.M.; Danzi, F.; Oliveira, J.E.; El-Azab, A.; Camanho, P.P.; Braga, M.H. The Latest Trends in Electric Vehicles Batteries. Molecules 2021, 26, 3188. [Google Scholar] [CrossRef] [PubMed]
  45. Braga, M.H.; Oliveira, J.E.; Murchison, A.J.; Goodenough, J.B. Performance of a Ferroelectric Glass Electrolyte in a Self-Charging Electrochemical Cell with Negative Capacitance and Resistance. Appl. Phys. Rev. 2020, 7, 011406. [Google Scholar] [CrossRef]
  46. Braga, M.H. Coherence in the Ferroelectric A3ClO (A = Li, Na) Family of Electrolytes. Materials 2021, 14, 2398. [Google Scholar] [CrossRef] [PubMed]
  47. Braga, M.H.; Ferreira, J.A.; Stockhausen, V.; Oliveira, J.E.; El-Azab, A. Novel Li3ClO Based Glasses with Superionic Properties for Lithium Batteries. J. Mater. Chem. A Mater. 2014, 2, 5470–5480. [Google Scholar] [CrossRef] [Green Version]
  48. Guerreiro, A.N.; Baptista, M.C.; Maia, B.A.; Braga, M.H. Interfacial Chemistry with ZnO: In Operando Work Functions in Hetero Cells. ACS Appl. Energy Mater. 2022, 5, 9811–9822. [Google Scholar] [CrossRef]
  49. Gaudiuso, R.; Melikechi, N.; Abdel-Salam, Z.A.; Harith, M.A.; Palleschi, V.; Motto-Ros, V.; Busser, B. Laser-Induced Breakdown Spectroscopy for Human and Animal Health: A Review. Spectrochim. Acta Part B Spectrosc. 2019, 152, 123–148. [Google Scholar] [CrossRef]
  50. Ferreira, M.F.S.; Capela, D.; Silva, N.A.; Gonçalves, F.; Lima, A.; Guimarães, D.; Jorge, P.A.S. Comprehensive Comparison of Linear and Non-Linear Methodologies for Lithium Quantification in Geological Samples Using LIBS. Spectrochim. Acta Part B Spectrosc. 2022, 195, 106504. [Google Scholar] [CrossRef]
  51. Anglos, D.; Detalle, V. Cultural Heritage Applications of LIBS. Laser-Induced Breakdown Spectroscopy: Theory and Applications. Springer Ser. Opt. Sci. 2014, 182, 531–554. [Google Scholar] [CrossRef]
  52. Smyrek, P.; Bergfeldt, T.; Seifert, H.J.; Pfleging, W. Laser-Induced Breakdown Spectroscopy for the Quantitative Measurement of Lithium Concentration Profiles in Structured and Unstructured Electrodes. J. Mater. Chem. A Mater. 2019, 7, 5656–5665. [Google Scholar] [CrossRef] [Green Version]
  53. Peng, L.; Sun, D.; Su, M.; Han, J.; Dong, C. Rapid Analysis on the Heavy Metal Content of Spent Zinc–Manganese Batteries by Laser-Induced Breakdown Spectroscopy. Opt. Laser. Technol. 2012, 44, 2469–2475. [Google Scholar] [CrossRef]
  54. Danzi, F.; Camanho, P.P.; Braga, M.H. An All-Solid-State Coaxial Structural Battery Using Sodium-Based Electrolyte. Molecules 2021, 26, 5226. [Google Scholar] [CrossRef] [PubMed]
  55. Baptista, M.C.; Khalifa, H.; Araújo, A.; Maia, B.A.; Souto, M.; Braga, M.H. Giant Polarization in Quasi-Adiabatic Ferroelectric Na+ Electrolyte for Solid-State Energy Harvesting and Storage. Adv. Funct. Mater. 2023, 33, 2212344. [Google Scholar] [CrossRef]
  56. Guerreiro, A.N.; Maia, B.A.; Khalifa, H.; Baptista, M.C.; Braga, M.H. What Differentiates Dielectric Oxides and Solid Electrolytes on the Pathway toward More Efficient Energy Storage? Batteries 2022, 8, 232. [Google Scholar] [CrossRef]
  57. Shek, M.L.; Hrbek, J.; Sham, T.K.; Xu, G.-Q. A Soft X-Ray Study of the Interaction of Oxygen with Li. Surf. Sci. 1990, 234, 324–334. [Google Scholar] [CrossRef]
  58. Contour, J.P.; Salesse, A.; Froment, M.; Garreau, M.; Thevenin, J.; Warin, D. Analysis by Electron-Microscopy and XPS of Lithium Surfaces Polarized in Anhydrous Organic Electrolytes. J. De Microsc. Et De Spectrosc. Electron. 1979, 4, 483–491. [Google Scholar]
  59. Contarini, S.; Rabalais, J.W. Ion Bombardment-Induced Decomposition of Li and Ba Sulfates and Carbonates Studied by X-Ray Photoelectron Spectroscopy. J. Electron. Spectros. Relat. Phenomena. 1985, 35, 191–201. [Google Scholar] [CrossRef]
  60. Wren, A.G.; Phillips, R.W.; Tolentino, L.U. Surface Reactions of Chlorine Molecules and Atoms with Water and Sulfuric Acid at Low Temperatures. J. Colloid. Interface. Sci. 1979, 70, 544–557. [Google Scholar] [CrossRef]
Figure 1. Schematics of battery cell configurations (a) Li+ ion, (b) Li metal, and (c) anode-less.
Batteries 09 00402 g001
Figure 2. Cell assembly: (a) materials; (b) cell; (c) cell protected by Teflon tape; (d) vacuum-closed and sealed cell.
Batteries 09 00402 g002
Figure 3. Electrochemical performance of a Cu/Li2.99Ba0.005ClO composite in cellulose/LiFePO4/Cu pouch cell with plain copper as a negative current collector (a) discharge at OCV, without external resistance; (b) after connecting an external resistance of 980 kΩ; (c) after altering the external resistance to 684 kΩ; (d) after adjusting the external resistance to 216 kΩ. All potentials were measured in the external resistance. Black arrow indicates the crescent cycle number.
Batteries 09 00402 g003
Figure 4. Cycling current for Cu/Li2.99Ba0.005ClO composite in cellulose/LiFePO4/Cu pouch cell with plain copper as a negative current collector measured in the external resistance of 216 kΩ. CC: constant current charge; CV constant voltage charge; CR constant external (material) resistance discharge.
Batteries 09 00402 g004
Figure 5. XPS analyses survey of the surface of the four samples corresponding to (a) the negative current collector, plain Cu; (b) the positive electrode, LiFePO4 cathode.
Batteries 09 00402 g005
Figure 6. XPS analyses for the regions of interest (ROI) of Li 1s peaks on the surfaces of the samples corresponding to the negative current collector (ad) solely constituted by Cu; (e) the positive electrode, LiFePO4. The peaks 54.32 ± 0.08 to 55.28 ± 0.08 likely correspond to Li metal or subproducts of its reaction with air. The peak 57.58 ± 0.4 is likely correspondent to the Li in LFP remaining in the cathode after charge. The dotted lines in (ad) are Gaussians obtained after removing the background (black line). In (e) the Gaussians in green and red were summed up into the pink line.
Batteries 09 00402 g006
Figure 7. LIBS maps of the negative current collector of the Cu/Li2.99Ba0.005ClO/LiFePO4/Cu pouch cell with just Cu on the negative side: (a) Li; (b) Cl.
Batteries 09 00402 g007
Figure 8. Maps of the positive electrode—LiFePO4 of the Cu/Li2.99Ba0.005ClO/LiFePO4/Cu pouch cell: (a) Li; (b) Fe.
Batteries 09 00402 g008
Figure 9. SEM backscattering microphotographs of two samples (a) 3rd and (b) 4th in Table 3, corresponding to the copper negative current collector of the Cu/Li2.99Ba0.005ClO/LiFePO4/Cu, after being cycled; EDX obtained the corresponding normalized atomic percentages.
Batteries 09 00402 g009
Figure 10. The potential difference for a Cu/ZnO/Li2.99Ba0.005ClO composite in cellulose/LiFePO4/Cu pouch cell while cycling with external resistance of (a) 4.7 MΩ; (b) 980 kΩ; (c) 550 kΩ; and (d) 217 kΩ. (b,c) show the points where the experiment was paused to perform PEIS.
Batteries 09 00402 g010
Figure 11. Potentiostatic electrochemical impedance spectroscopy (PEIS) measurements for Cu/ZnO/Li2.99Ba0.005ClO composite in cellulose/LiFePO4/Cu pouch cell while performing (a) the CV step in the 7th cycle; (b) the CC step in 10th cycle; (c) end of the 12th cycle after the CRext step; (d) equivalent circuit.
Batteries 09 00402 g011
Figure 12. XPS survey analyses of the surfaces of the samples corresponding to (a) the negative current collector, Cu, with a layer of ZnO; (b) the positive electrode, LiFePO4 of the Cu/ZnO/Li2.99Ba0.005ClO composite in cellulose/LiFePO4/Cu pouch cell.
Batteries 09 00402 g012
Figure 13. Regions of interest (ROI) in the XPS analyses of the Li 1s of the surfaces of the samples corresponding to (ad) the negative current collector, with an artificial layer of ZnO and (e) the positive electrode, LiFePO4 of the Cu/ZnO/Li2.99Ba0.005ClO composite in cellulose/LiFePO4/Cu pouch cell. The peaks 55.22 ± 0.02 to 55.69 ± 0.02 likely correspond to Li metal or subproducts of its reaction with air. The peak 57.8 ± 0.4 is likely correspondent to the Li in LFP remaining in the cathode after charge. The dotted lines in (ad) are Gaussians obtained after removing the background (black line). In (e) the Gaussians in green and red were summed up into the pink line.
Batteries 09 00402 g013
Figure 14. The negative current collector LIBS maps of the Cu/ZnO/Li2.99Ba0.005ClO/LiFePO4/Cu cell after electrochemical cycling: (a) Li; (b) Cl.
Batteries 09 00402 g014
Figure 15. The negative current collector LIBS maps of the Cu/ZnO/Li2.99Ba0.005ClO/LiFePO4/Cu cell after electrochemical cycling: (a) Li; (b) Zn.
Batteries 09 00402 g015
Figure 16. The positive electrode LIBS maps of the Cu/ZnO/Li2.99Ba0.005ClO/LiFePO4/Cu cell after electrochemical cycling: (a) Li; (b) Fe.
Batteries 09 00402 g016
Figure 17. SEM backscattering microphotographs of two samples corresponding to the negative current collector surface, with ZnO as the coated layer, and normalized atomic percentages obtained by EDX. The cell studied Cu/ZnO/Li2.99Ba0.005ClO/LiFePO4/Cu; (a,b) two different samples of a negative electrode; Li is likely corresponding to phase Z2.
Batteries 09 00402 g017
Table 1. Typical dimension and weight of the components of the pouch cells.
MeasurementsCurrent Collector
(Cu Foil)
Coated Layer on Negative CollectorCellulose With
80% Li2.99Ba0.005ClO
+ 20% PVAC
Positive
Electrode
Active
Cathode (LiFePO4)
Cu/Li2.99Ba0.005ClO composite in cellulose/LiFePO4/Cu pouch cell with Cu as a negative current collector
Contact area (mm2)1600--202516001600
Thickness (mm)0.127--1.600.10--
Weight (mg)N/A--736.6 (cellulose: 41.4)
Li2.99Ba0.005ClO: 556.2
(27 mg cm−2)
188.4150.7
Cu/ZnO/Li2.99Ba0.005ClO composite in cellulose/LiFePO4/Cu pouch cell with ZnO@Cu as a negative current collector
Contact area (mm2)16001600202516001600
Thickness (mm)0.1270.051.650.15--
Weight (mg)N/A112.7
(7 mg cm−2)
882.7 (cellulose: 42.3)
Li2.99Ba0.005ClO: 672.3
(33 mg cm−2)
501.6210.1
Table 2. Cu/Li2.99Ba0.005ClO composite in cellulose/LiFePO4/Cu pouch cell discharge potentials, capacity, and Li plated weight, volume, and thickness. Surface area A = 16 cm2. All values were determined from voltages measured in the terminals of the external resistor.
External
Resistor
Rext (kΩ)
CycleDischarge
Time
Maximum Discharge
Potential
Average
Discharge
Potential
Discharged
Capacity
Discharged
Li Mass
Discharged
Li Volume
Discharged
Li Thickness *
time (h)Vmax (V)Vav (V)QRext (mAh)mLi (mg)V’Li (mm3)dLi (μm)
9806th423.200.860.0370.0100.0180.011
7th162.530.900.0150.0040.0070.005
6848th1071.830.720.1120.0290.0540.034
9th442.370.760.0490.0130.0240.015
10th2932.410.660.2830.0730.1370.086
11th792.510.760.0870.0230.0420.026
21612th1282.560.680.4040.1050.1960.122
13th1232.310.680.3860.1000.1870.117
14th1152.000.670.3580.0930.1730.108
15th1091.860.660.3340.0870.1620.101
16th981.770.660.2990.0780.1450.091
17th871.690.650.2600.0670.1260.079
18th811.610.640.2400.0620.1170.073
* Considering a homogeneous plating.
Table 3. Summary of the results obtained for weight analysis based on regions of interest (ROI), normalized to 100%, using Cu as the negative current collector.
ElementSensitivity Factor1st Sample Negative CC
at.%
2nd Sample Negative CC
at.%
3rd Sample Negative CC
at.%
4th Sample Negative CC
at.%
1st Sample Positive Electrode
at.%
Li 1s0.0258.812.612.68.133.4
C 1s0.27874.265.665.975.247.0
N 1s0.4771.11.01.31.20.2
O 1s0.7813.215.415.112.19.9
F 1s1N.D. *N.D. *N.D. *N.D. *7.1
P 2p0.486N.D. *N.D. *N.D. *N.D. *2.3
Cl 2p0.8911.23.92.82.20.1
Cu 2p5.321.51.52.31.2N.D. *
Ba 3d12.4N.D. *N.D. *N.D. *N.D. *N.D. *
* Not detected.
Table 4. Cu/ZnO/Li2.99Ba0.005ClO composite in cellulose/LiFePO4/Cu pouch cell capacity and Li plated weight, volume, and thickness through charge. Surface area A = 16 cm2. All values were determined from voltages measured in the terminals of the external resistor.
CycleCharged CapacityPlated LiMass of LiVolume of LiThickness of Li
Q (mAh)xLi (mmol)mLi (mg)V’Li (mm3)dLi (μm)
1st 4.2220.1581.0952.0471.279
2nd3.6860.1380.9561.7871.117
3rd 3.3880.1270.8791.6421.026
4th 3.2440.1210.8411.5730.983
5th 3.0860.1150.8001.4960.935
6th 3.3490.1250.8691.6231.015
7th 4.4200.1651.1462.1431.339
8th 4.9680.1861.2882.4081.505
9th 5.0080.1871.2992.4281.517
10th 5.2300.1951.3562.5351.584
11th 4.9330.1841.2792.3911.495
12th4.9850.1861.2932.4161.510
13th4.7310.1771.2272.2931.433
14th 5.5290.2071.4342.6801.675
15th6.2780.2351.6283.0431.902
16th 9.6460.3602.5024.6762.922
17th 6.4670.2421.6773.1351.959
Table 5. Cu/ZnO/Li2.99Ba0.005ClO composite in cellulose/LiFePO4/Cu pouch cell capacity throughout the charge and discharge steps. Surface area A = 16 cm2. All values were determined from voltages measured in the terminals of the external resistor.
External
Resistor
CycleDischarge
Time
Maximum
Discharge
Potential
Average
Discharge
Potential
Discharged
Current
Discharged
Capacity
Thickness of Li
Rext (kΩ)time (h)ΔVmax (V)ΔVav (V)IRext (μA)QRext (μAh)dLi (μm)
47001st212.090.8790.23.90.001
2nd482.120.8720.28.90.003
3rd482.120.9660.29.90.003
4th482.201.1140.211.40.003
5th482.211.1770.312.00.004
6th482.211.2650.312.90.004
9807th482.091.0041.049.20.015
8th482.131.1071.154.30.016
9th482.141.1991.258.70.018
55010th482.071.0571.992.20.028
11th482.151.0912.095.20.029
12th482.151.0952.095.60.029
21713th2.92.151.6747.722.10.007
14th6.02.061.2775.935.60.011
15th211.970.9404.391.60.028
16th4.62.001.4436.630.50.009
17th172.010.9624.473.60.022
Table 6. Summary of the results obtained for atomic percentage analysis of the regions of interest (ROI), normalized to 100%, for the Cu/ZnO/Li2.99Ba0.005ClO composite in cellulose/LiFePO4/Cu pouch cell negative current collector disassembled after cycling.
ElementSensitivity Factor1st Sample Negative CC
at.%
2nd Sample Negative CC
at.%
3rd Sample Negative CC
at.%
4th Sample Negative CC
at.%
1st Sample Positive Electrode
at.%
Li 1s0.02517.320.923.721.824.2
C 1s0.27851.746.740.345.352.5
N 1s0.4770.60.30.40.50.3
O 1s0.7821.728.330.327.513.1
F 1s1N.D. *N.D. *N.D. *N.D. *6.0
P 2p0.486N.D. *N.D. *N.D. *N.D. *1.7
Cl 2p0.8918.33.85.24.91.6
Fe 2p2.96N.D. *N.D. *N.D. *N.D. *0.6
Zn 2p3.730.4N.D. *0.10.03N.D. *
Ba 3d12.4N.D. *0.05N.D. *N.D. *N.D. *
* Not detected.
Disclaimer/Publisher’s Note: The statements, opinions and data contained in all publications are solely those of the individual author(s) and contributor(s) and not of MDPI and/or the editor(s). MDPI and/or the editor(s) disclaim responsibility for any injury to people or property resulting from any ideas, methods, instructions or products referred to in the content.