Abstract
Thermal propagation events of the traction batteries in electric vehicles are rare. However, their impact on the passengers in form of fire, smoke and heat can be severe. Current data on the dependencies and the reproducibility of thermal propagation is limited despite these major implications. Therefore, a thermal propagation test bench was developed for custom multi pouch experiments. This setup includes a multitude of temperature sensors throughout the module, voltage monitoring and a mass flow sensor. Two distinct experiments were initiated by nail penetration. These show a high degree of reproducibility thus allowing for future experiments regarding the dependencies of initial module temperatures and State of Charge (SoC) variations.
1. Introduction
The move away from commonly used internal combustion engines in the transportation sector offers the chance of reducing its carbon dioxide (CO2) emissions impact [1]. As of 2023, a majority of companies in the automotive sector have focussed their research and development on battery electric cars [2], henceforth called electric vehicles. Current state of the art vehicles use mainly lithium-ion batteries, which the public associates with a high risk of thermal events after numerous reports of cars with battery fires [3], mostly attributed to Thermal Propagation (TP). Thermal Propagation is a self-accelerating destructive process that involves an initial cell abnormally heating itself by internal exothermic reactions called Thermal Runaway (TR) and transferring significant heat to nearby cells, causing them to undergoing TR. Such an unmitigated event can endanger the passengers both onboard and during exit of the vehicle as well as bystanders and surrounding environment. Regulatory steps have been undertaken to introduce risk mitigation of the electric vehicles undergoing Thermal Propagation, notably UN GTR 20 [4] and the derived GB 38301-2020 [5]. It introduced the need of TR detection, subsequent passenger warning features and with a high margin of safety to allow passengers to evacuate before fire can occur. Various TR detection methods have been compared by Koch [6] quantifying reaction times and feasability of different sensor types such as voltage sensors, temperature sensors and pressure sensors.
Previous work has been focused on small modules of cylindrical cells or modules of low single digit pouch or prismatic cells [7]—or full-scale battery testing yielding widly different TP patterns.
It has been shown [8], that repeated single cell testing using various triggers on cylindrical cells yield different results, from the expected opening of the intended bursting disk to sidewall ruptures. Similar variety of testing outcomes have been shown for prismatic cells and pouch cells [9].
Due to the range of different single cell responses, it is uncertain if and how reproducible tests on a custom module level can be achieved. To answer this question, a closed test bench with a costum multi cell setup was designed to study the reproducibility of differrent trigger methods.
2. Materials and Methods
Characteristics of the cell under investigation can be found in Section 2.1. Two thermal runaway test benches are used: nail penetration trigger, Section 2.2.1 and ARC, Section 2.2.2. The thermal propagation test bench setup can be found in Section 2.3.
2.1. Cell under Investigation
One of the first steps towards a test bench is choosing the appropriate cell format and then evaluating the cell’s TR properties. The multiple cell test bench structure and sizing is dependent on the cell type and format.
For the test bench conception, a pouch cell with a NMC 622-cathode was used. The relevant cell characteristics before testing are as follows:
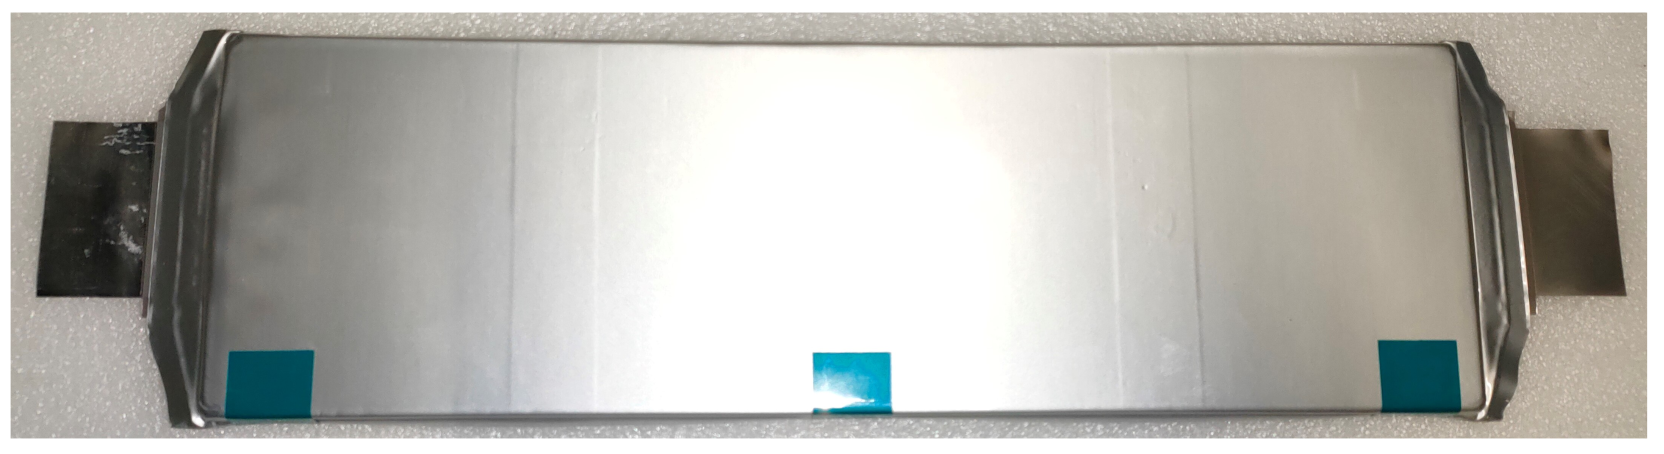
“Begin of Life” (BoL) cells were randomly selected from an incoming shipment (Figure 1).
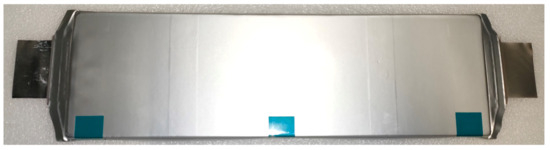
Figure 1.
Cell under investigation. The pouch cell has large cell tabs on the sides, with which it can be electrically connected when testing modules. It can be seen that .
2.2. Thermal Runaway Test Benches
To study the TP characteristics, first a TR of an initial cell has to initiated. For this use, a multitude of trigger methods have been developed to mimic real failure modes [9]. The test bench focuses on the use of nail-penetration, heating and over-charging of the initial cell and the subsequent response from the surrounding cells. As the subsequent TP depends on the cells reactivity, a temperature and state of charge (SoC) zone has to be identified, in which a TR of the initial cell will most likely lead to propagation. The temperature range of the climate chamber, in which the test bench is thermally conditioned, allows for a temperature range of . Using the mean temperature of , a study of single cell reactivity was first conducted using nail penetration and subsequently verified using ARC (Accelerating Rate Calorimetry) measurements. Variables of the nail penetration study are “direction of nail penetration”, “uncycled vs. cycled cells” and “SoC vs. Temperature”.
2.2.1. Nail Penetration Test Bench
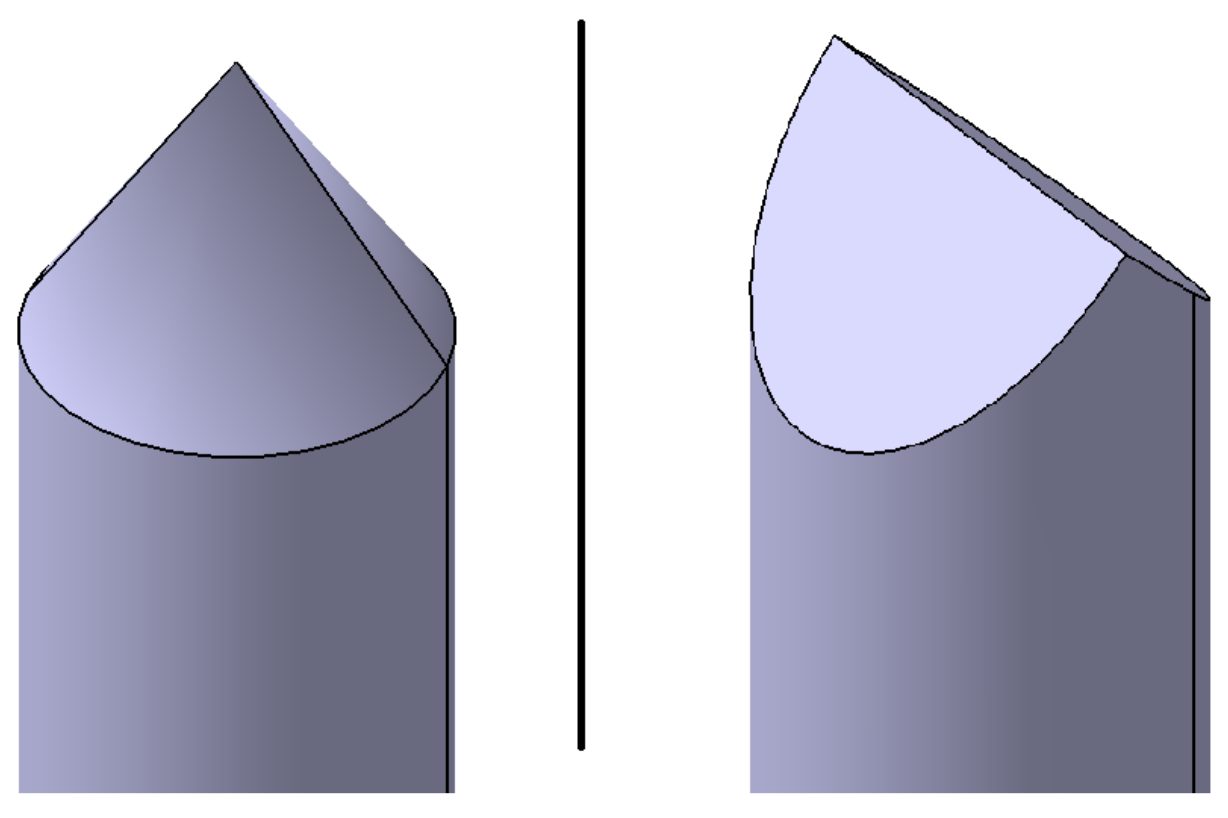
For the trigger method nail penetration, 5 mm diameter nails were used - the respective tip shape depends on the penetration direction relative to the electrode layers (Figure 2). If the nail penetrated orthogonal to the electrode layers, the tip shape was conical (Figure 3). If the nail penetrated parallel to the electrode layers, then a wedge shaped tip was used (Figure 4).
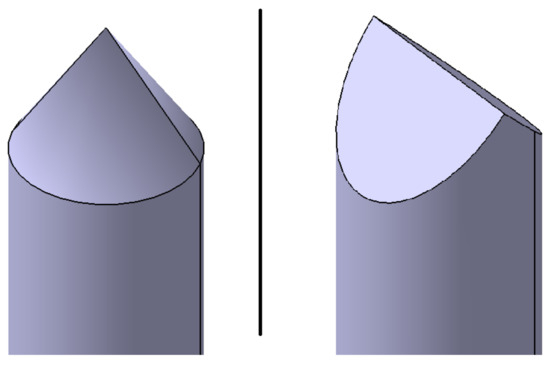
Figure 2.
Schematic view of the two nail tip shapes used, depending on the direction of nail penetration. On the (left), a conical nail tip is shown and on the (right), a wedge shaped tip.
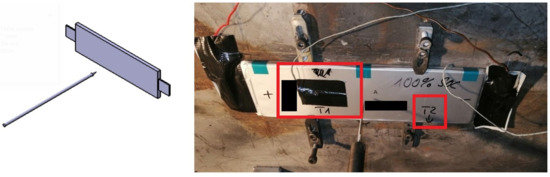
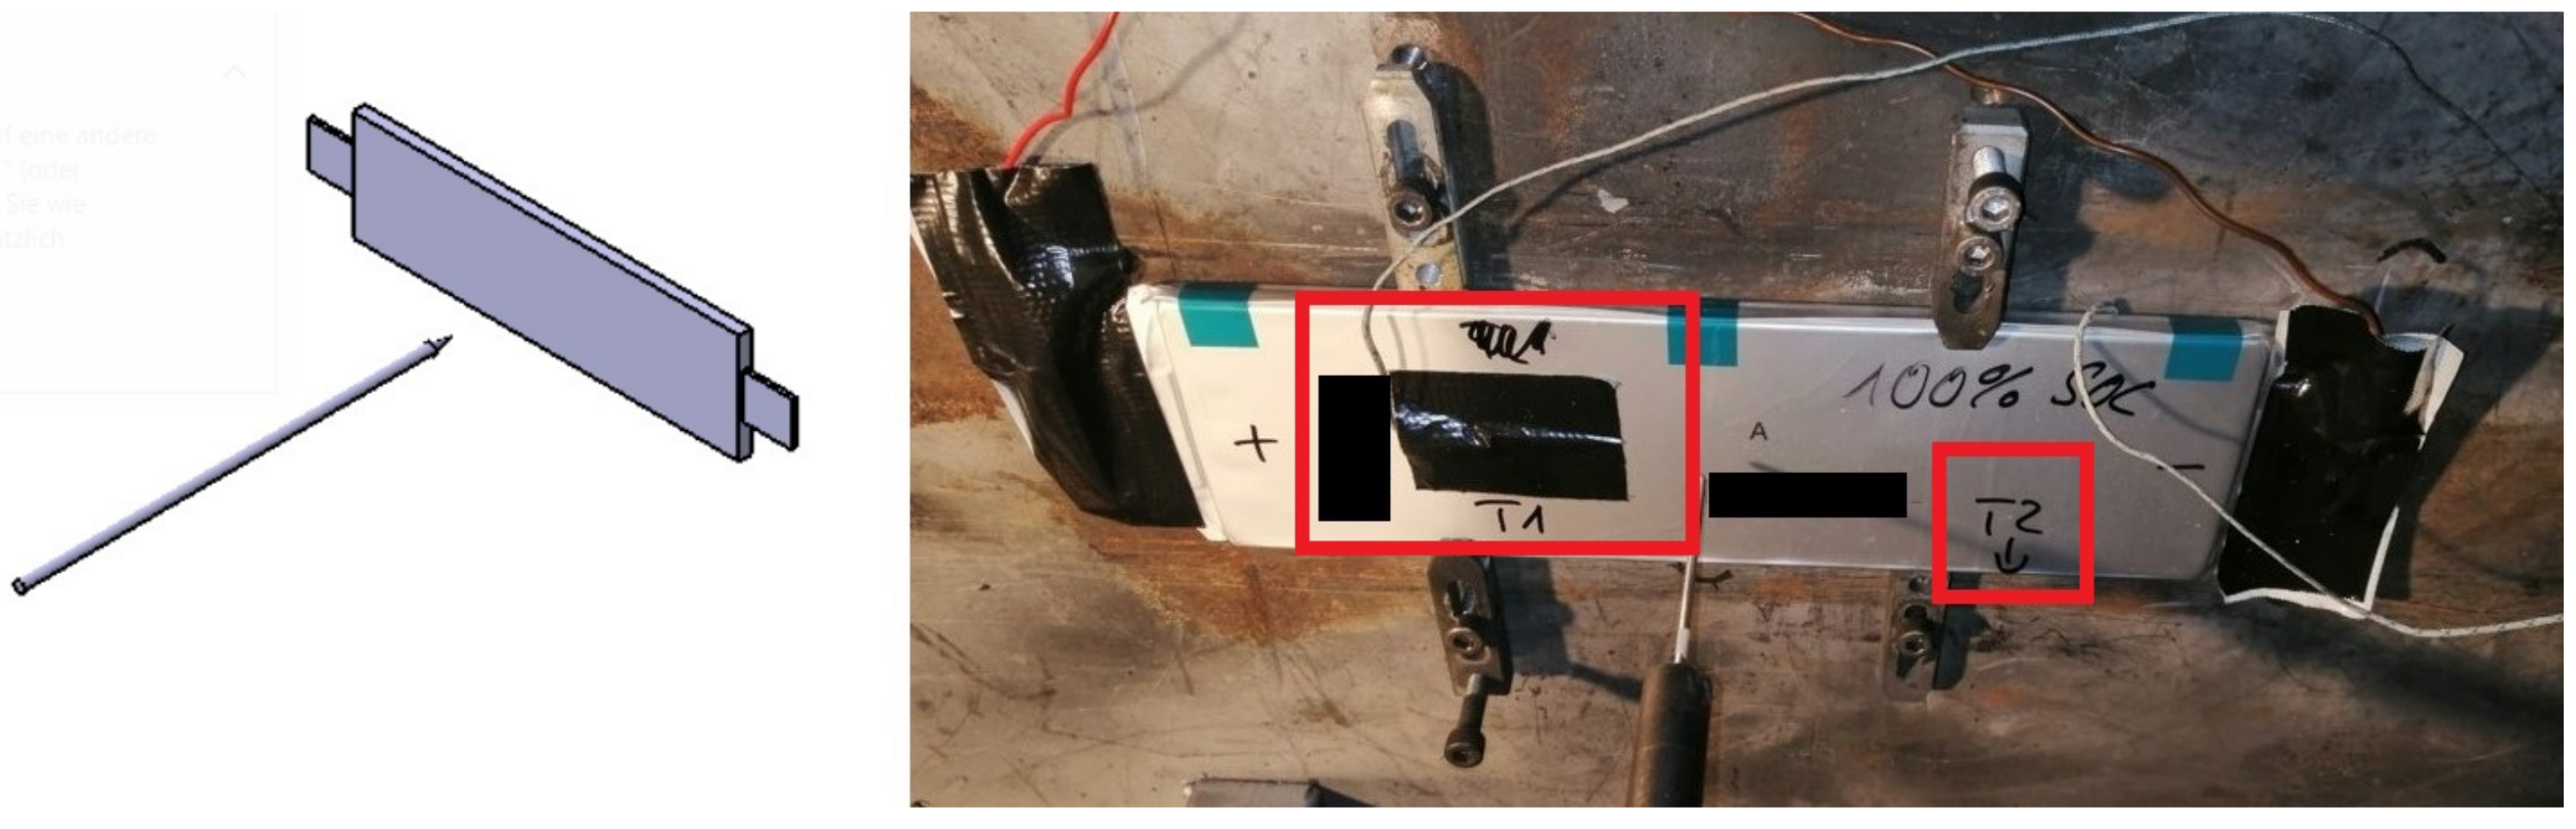
Figure 3.
TR testbench for test case of “Nail penetration orthogonal to electrode layer”. (Left): schematic overview of nail penetration relative to cell, (right): test bench with pouch cell pinned down with red boxes indicating the placements of sensors and .

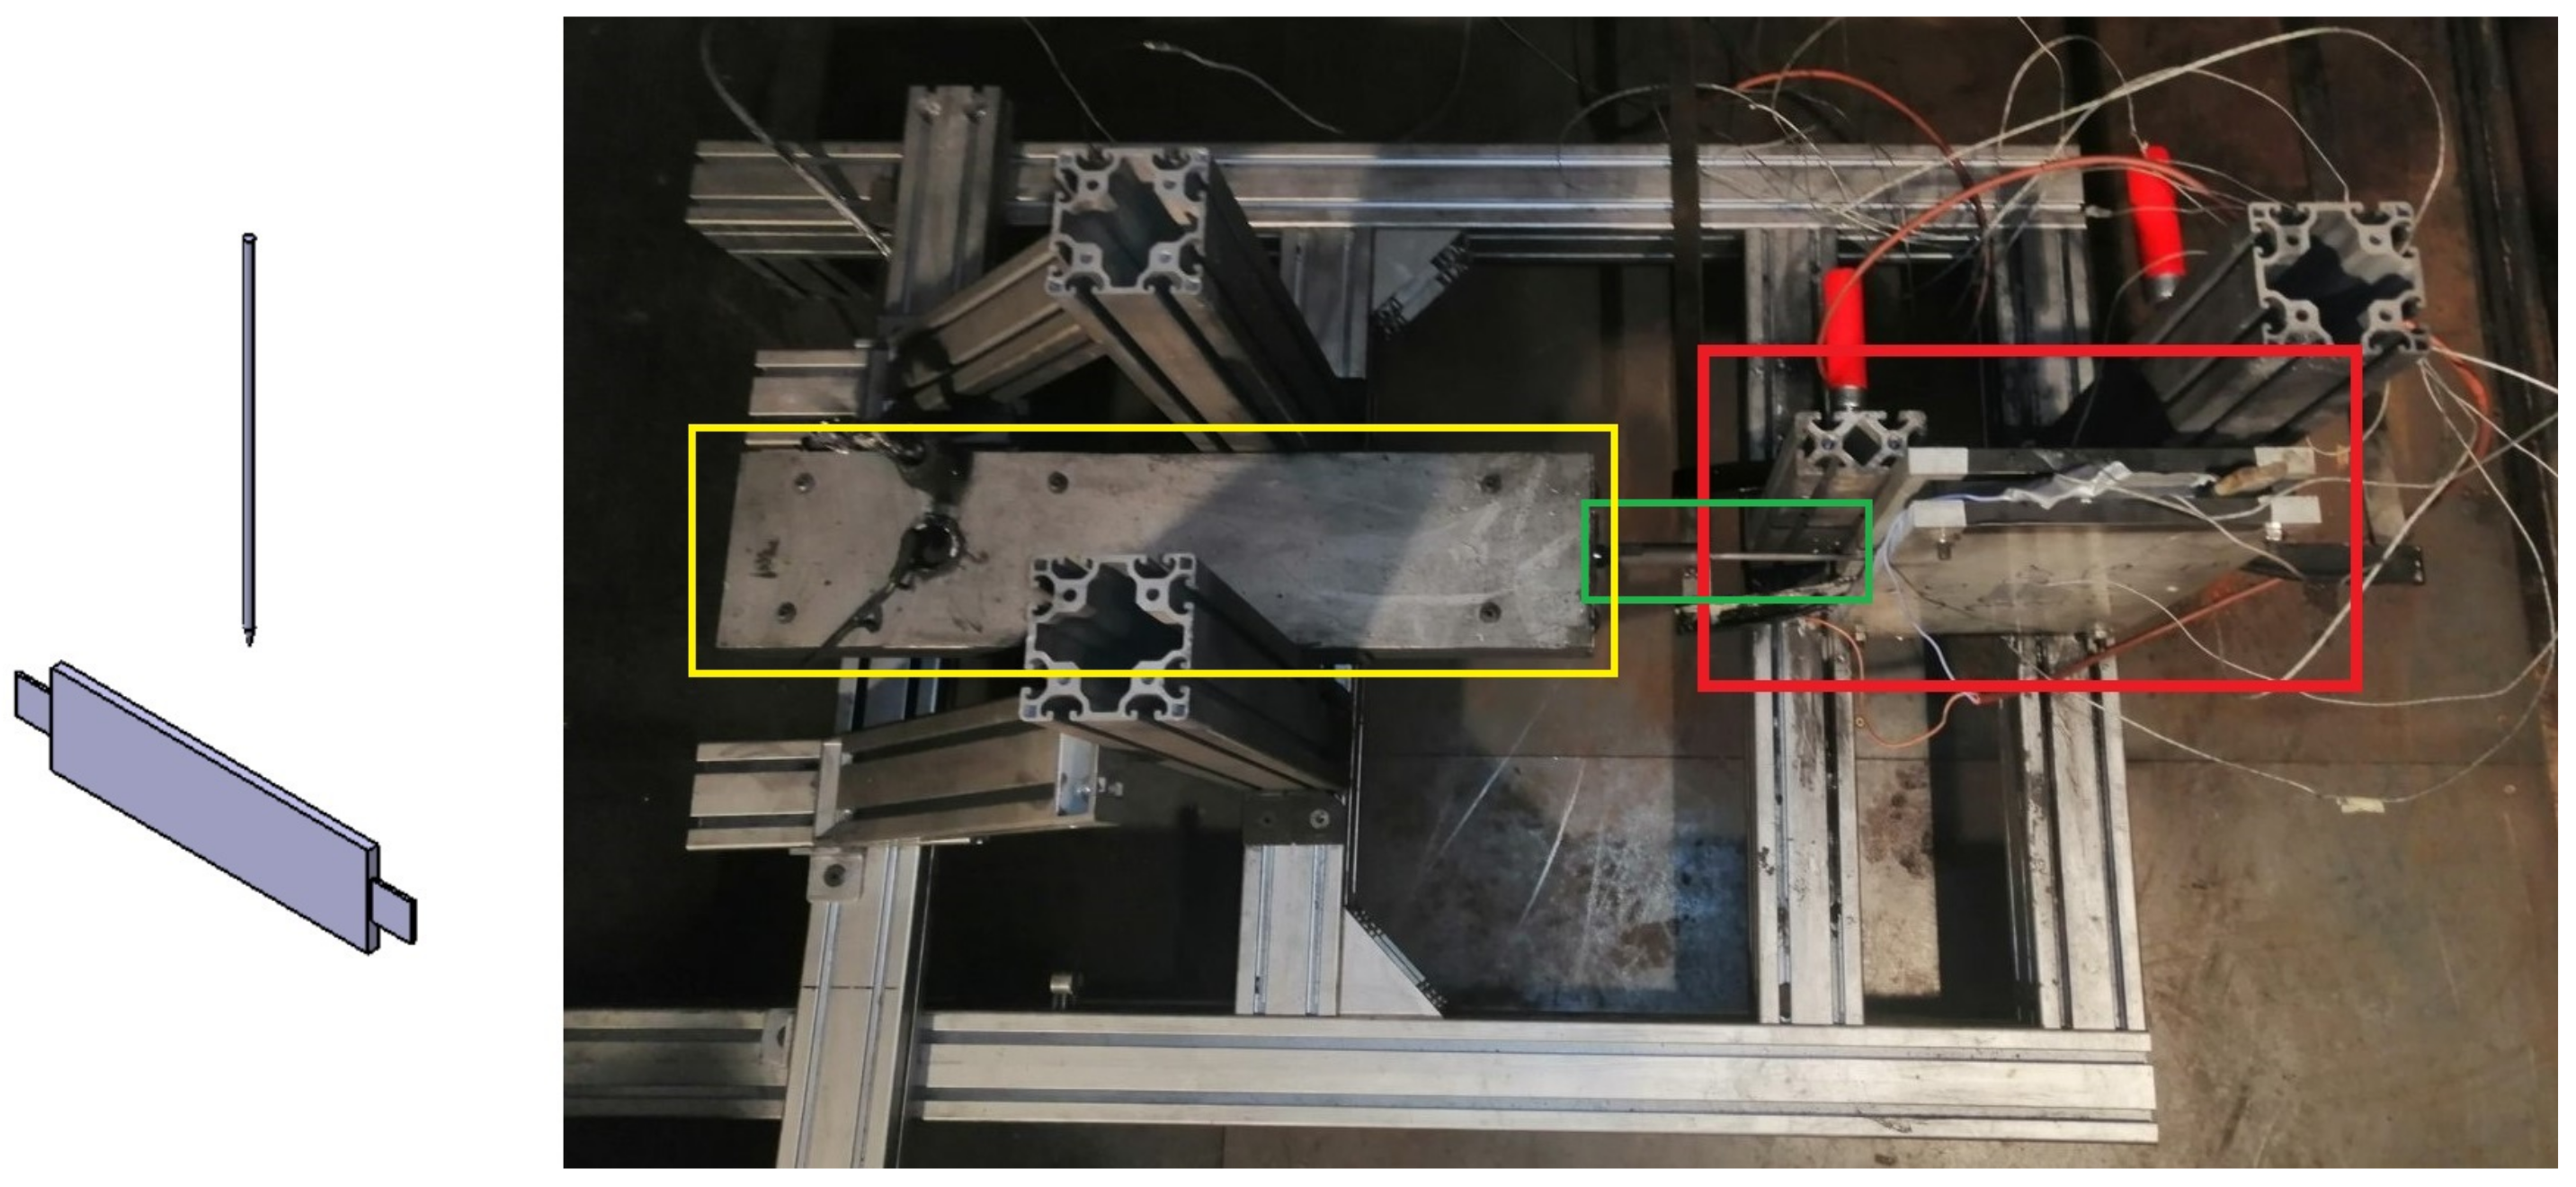
Figure 4.
TR testbench for test case of “Nail penetration parallel to electrode layer”. (Left): schematic overview of nail penetration relative to cell, (right): test bench with pouch cell clamped between two plates (red box) with nail (green box) and hydraulic system for nail penetration (yellow box).
A thermal runaway which would lead to TP can be identified by the resulting released cell energy and subsequent temperature increase. In the preliminary tests, two temperature sensors placed on opposite sides of the cell were used. The placement of can be seen in Figure 3 with an arrow on the cell indicating the placement of on the opposite side of the cell.
Starting with a SoC of , the cell is triggered with the nail. If no TR occurs, the SoC of the next cell is increased by 5 percent increments up to a SoC of , when it is increased by 10 percent increments up to . The final test is at SoC. The test campaign is stopped, once a TR is detected.
2.2.2. ARC
A TR will lead to a TP reaction, if the cell next to the initially triggered cell experiences a thermal event. Literature has named a so-called trigger temperature [10]—below this temperature, the cell is deemed safe with an insignificant heat generation, above this temperature it is expected to react due to significant heat generation. This binary definition does not take into in consideration, that cells are typically connected to structures, which can act as heat sinks and thus pushing the trigger temperature higher. A more realistic, yet difficult, approach would be to take said individual heat flows as well as exothermic reactions within the cell into consideration.
An Accelerated Rate Calorimeter (ARC) is an established method for determining the trigger temperature under adiabatic conditions. A cell is placed inside a reaction chamber (see Figure 5). Once the chamber is closed, a heat-wait-seek (HWS) cycle is started. The system heats up by a small temperature increment, then switches to waiting for a defined time for thermal equilibrium - followed by a seek mode evaluating the temperature increase rate. If a predefined temperature rise is exceeded, then the ARC switches into an Exotherm Mode. Then the ARC provides an adiabatic environment, in which released energy can be measured by temperature increase. If the predefined temperature rise is not exceeded, a new HWS cycle is started. For the experiments, an EV+ ARC manufactured by Thermal Hazard Technology is used. A schematic of the used temperature sensor placement and a view inside of the ARC can be seen in Figure 6.
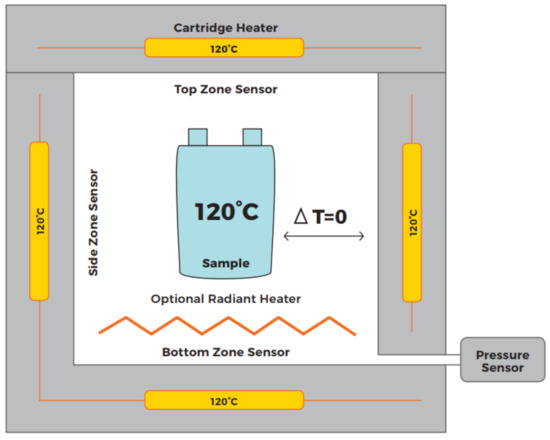
Figure 5.
Schematic overview of an ARC [11]. The cell is in thermal equilibrium with the surrounding reaction chamber and the ARC is seeking for a temperature increase of the cell.

Figure 6.
(Left): Schematic view of the temperature sensor placement on the cell. (Right): View inside the ARC with the sensors attached to the cell before testing.
2.3. Thermal Propagation Test Bench
The test facility, seen in Figure 7, can be split into three functional groups: the multi pouch cell setup test bench (red box), the exhaust system with massflow meter (blue box) and the surrounding environment. The surrounding environment is a test room with an exhaust gas filtration system. All components have been selected and designed with robustness in mind to ensure safety during testing as well as its reusability. A description of the components can be found in Section 2.3.1.
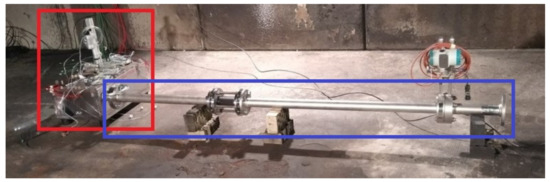
Figure 7.
Overview of the test facility: the mini-module test bench (red box) is connected via flanges to the exhaust system with a massflow meter (blue box), which allows the generated venting gas to vent into the surrounding environment.
2.3.1. Overview of Components
The multi pouch cell setup test bench is a steel case with a removable lid, as seen in Figure 8. To withstand the expected heat and pressure, the test bench consists of 30 mm thick steel for reusability. Two identical test benches were manufactured, each with two flanges placed on opposite sides. The flanges have an inner diameter of 50 mm. The test box can be tempered by using one of the flanges as tempered gas inflow and the other as gas outflow. Using this flange system, also different gases can be filled into the test bench. The test bench is closed before testing, with 16 screws holding down the lid, using Loctite SI 5300 for an airtight seal. A hydraulic system for nail penetration can be attached to the lid and an opening in the center of the lid allows for the nail trigger to pierce into the test chamber. This opening can be closed for experiments with different trigger methods. For the overheating and overcharging trigger experiments, their respective power supplies run through the sides of the steel case. The sensor cables also run through the sides of the test bench. The inside volume of the steel case is called test chamber, in which a cell mount with a cell stack can be placed.
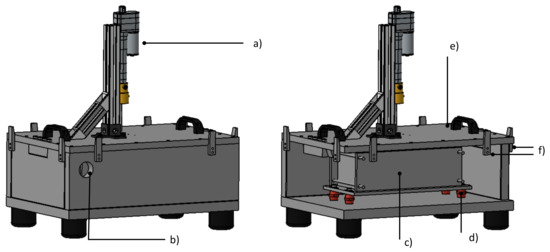
Figure 8.
CAD rendering of test bench. Left: closed test bench. Right: Placement of cell mount within the test chamber. The following components are visible: (a) Hydraulic system for nail penetration (b) Exit for exhaust line (c) Cell mount (d) Low heat conduction post insulators (e) Removable lid (f) Clamping system.
The cell mount is connected to the steel case using low heat conductivity post insulators, reducing heat transfer between the mount and case. The mounting arrangement allows for movement, to trigger different cells. The initial thermal runaway was triggered in cell number 7 (see Figure 12)—one of the two middle cells, causing a thermal propagation in both directions through the cell stack. Two identical cell mounts were manufactured and can be used interchangeably. The placement of the cell mount inside the test bench can be seen schematically in Figure 8 and before testing in Figure 9.

Figure 9.
View of the open test bench with a setup of 12 2p6s-connected pouch cells. The cables are routed through the sides of the box, the red Loctite sealent is already applied in this area.
A multi pouch cell setup consisting of up to 12 of the chosen pouch cells can be placed inside the cell mount. In between the cells and between cells and cell mount, aluminium sheets with cutouts for temperature sensors of Type K are used. The thickness of the sheets are equal to the width of the sensors at 1 mm. A picture taken during the assembly of the multi pouch cell setup can be seen in Figure 10. By using these sheets, through-plane heat conduction from cell to cell can be studied and the temperature sensors are not indenting into the cells. The sheets surrounding cell 4 (counted from the exhaust pipe)—nicknamed the “super sensor cell”—is equipped with more temperature sensors to analyze in-plane (lateral) heat conduction; the sheet between cells 4 and 5 is shown in Figure 10.
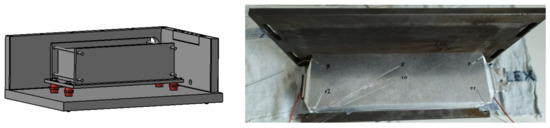
Figure 10.
(Left): Schematic overview of the cell mount connected to the test bench. (Right): Mid-assembly of the cell stack in the cell mount. The aluminium sheet between cell 4 and 5 is placed on top cell 4, the cutouts for the six temperature sensors (–) clearly visible.
The exhaust system is connected through a flange system to the mini-module test bench. The opening on the opposite side of the test bench is closed during an experiment using a blank flange, forcing the created venting gas to flow through the exhaust pipe. The exhaust system has an inner diameter of 50 mm and a total length of 2445 mm. Its individual pieces are as following: (a) metal pipe (length 300 mm), (b) glass cylinder (length 205 mm), (c) metal pipe (length 1210 mm), (d) mass flow meter (integrated into the flange) and (e) metal pipe (length 730 mm).
The glass cylinder in the exhaust system is included to study the travel of hot particles. It is made out of sapphire glass to withstand the expected high gas temperatures. The mass flow meter of type Siemens 7MF0340-1DL01-5AF1-Z A00+B11+E01+Y01+Y02 with SITRANS P320 measures the gas flow (and thus the gas creation) using differential pressure.
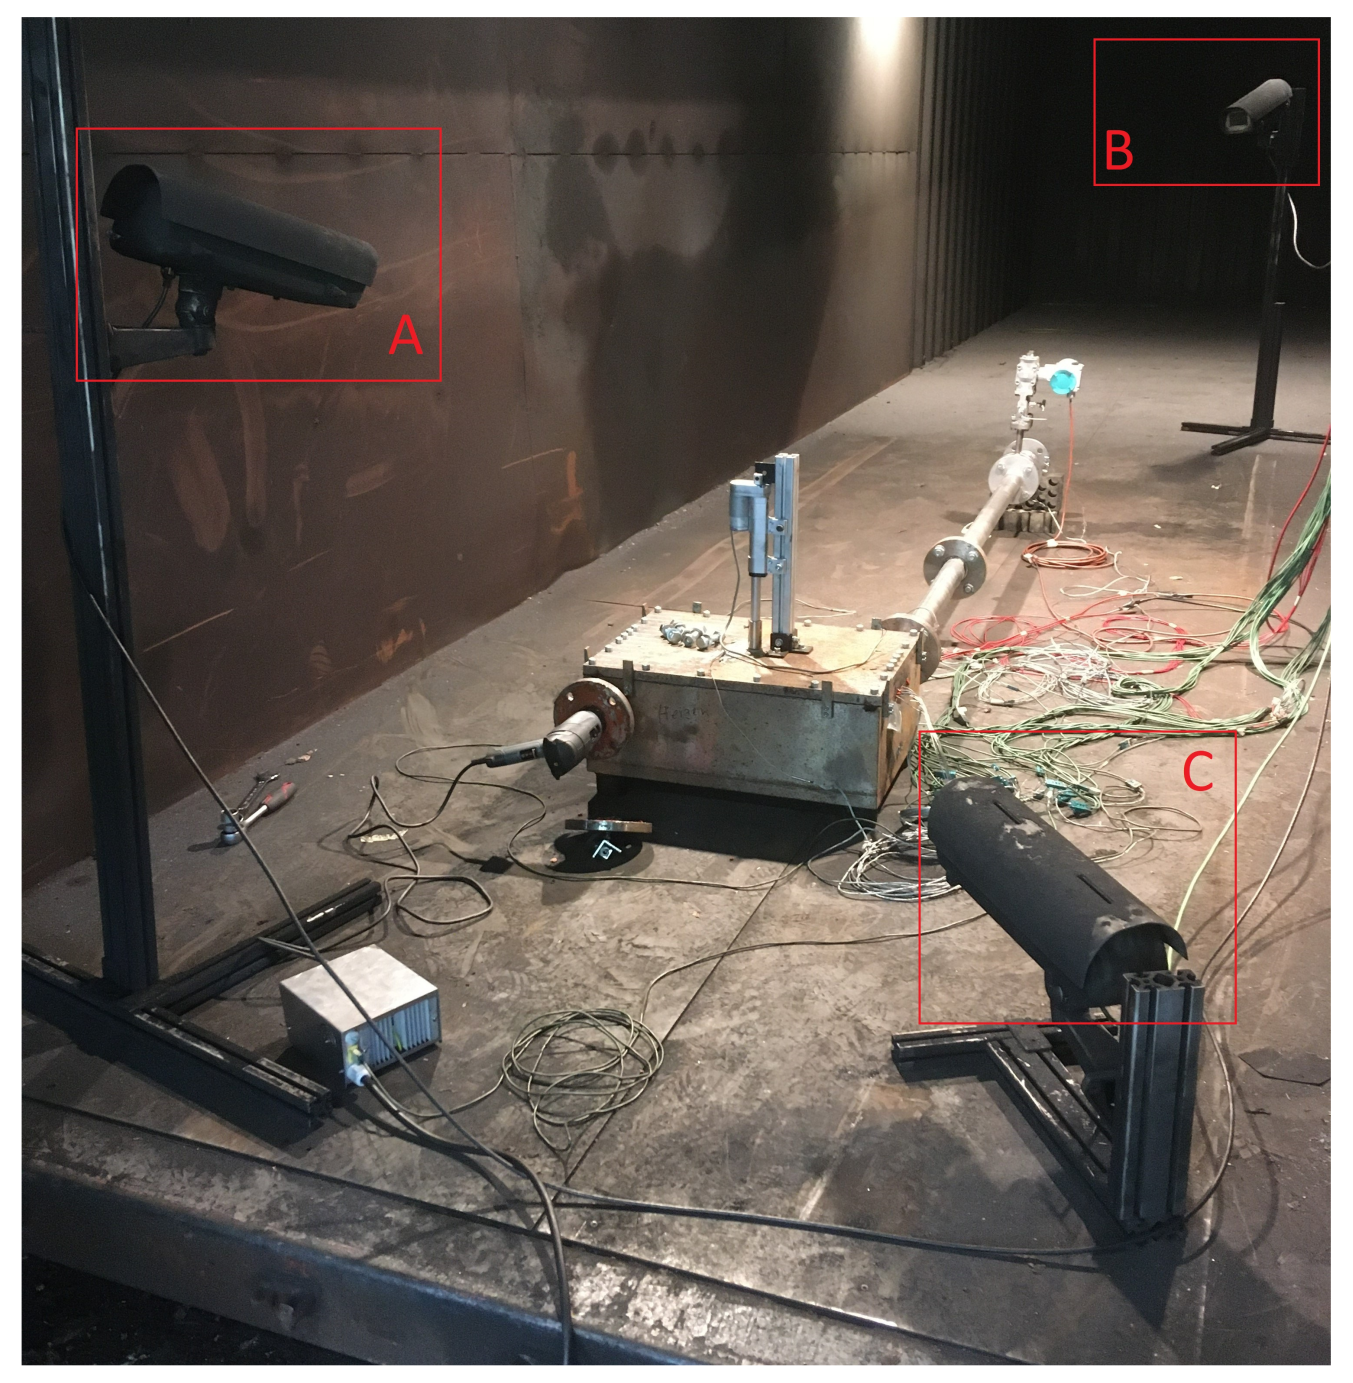
The surrounding environment is a retrofitted shipping container, into which the venting gas is emitted from the test bench. The air volume of the shipping container has its own filter system, which runs during the tests. For first experiments, a larger experiment hall was used. In the surrounding environment, two cameras are placed to observe the setup, as seen in Figure 11. Camera A records the mini-module test bench to detect possible gas leakage and time of entry of the nail into the test bench, whereas camera B focuses on the gas exhaust. Camera C was used initially to capture another angle of the test bench, but was later omitted due to the redundancy to camera A.
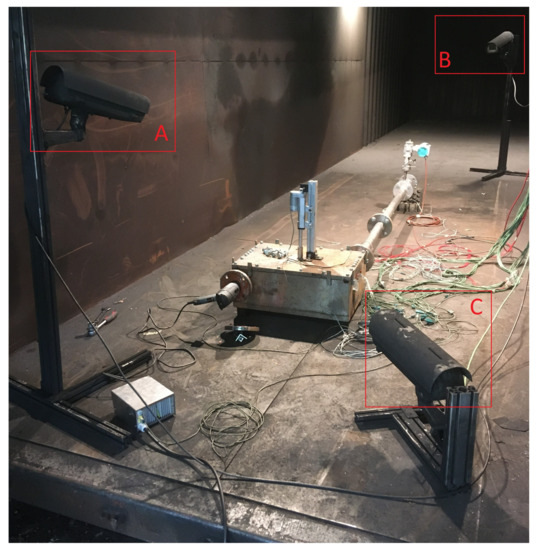
Figure 11.
Camera setup: camera A focuses on the test bench and the hydraulic system for nail penetration, camera B on the exhaust and captures the venting gas. Camera C is used in this setup to record another view angle of the test bench.
2.3.2. Temperature Sensor Placements
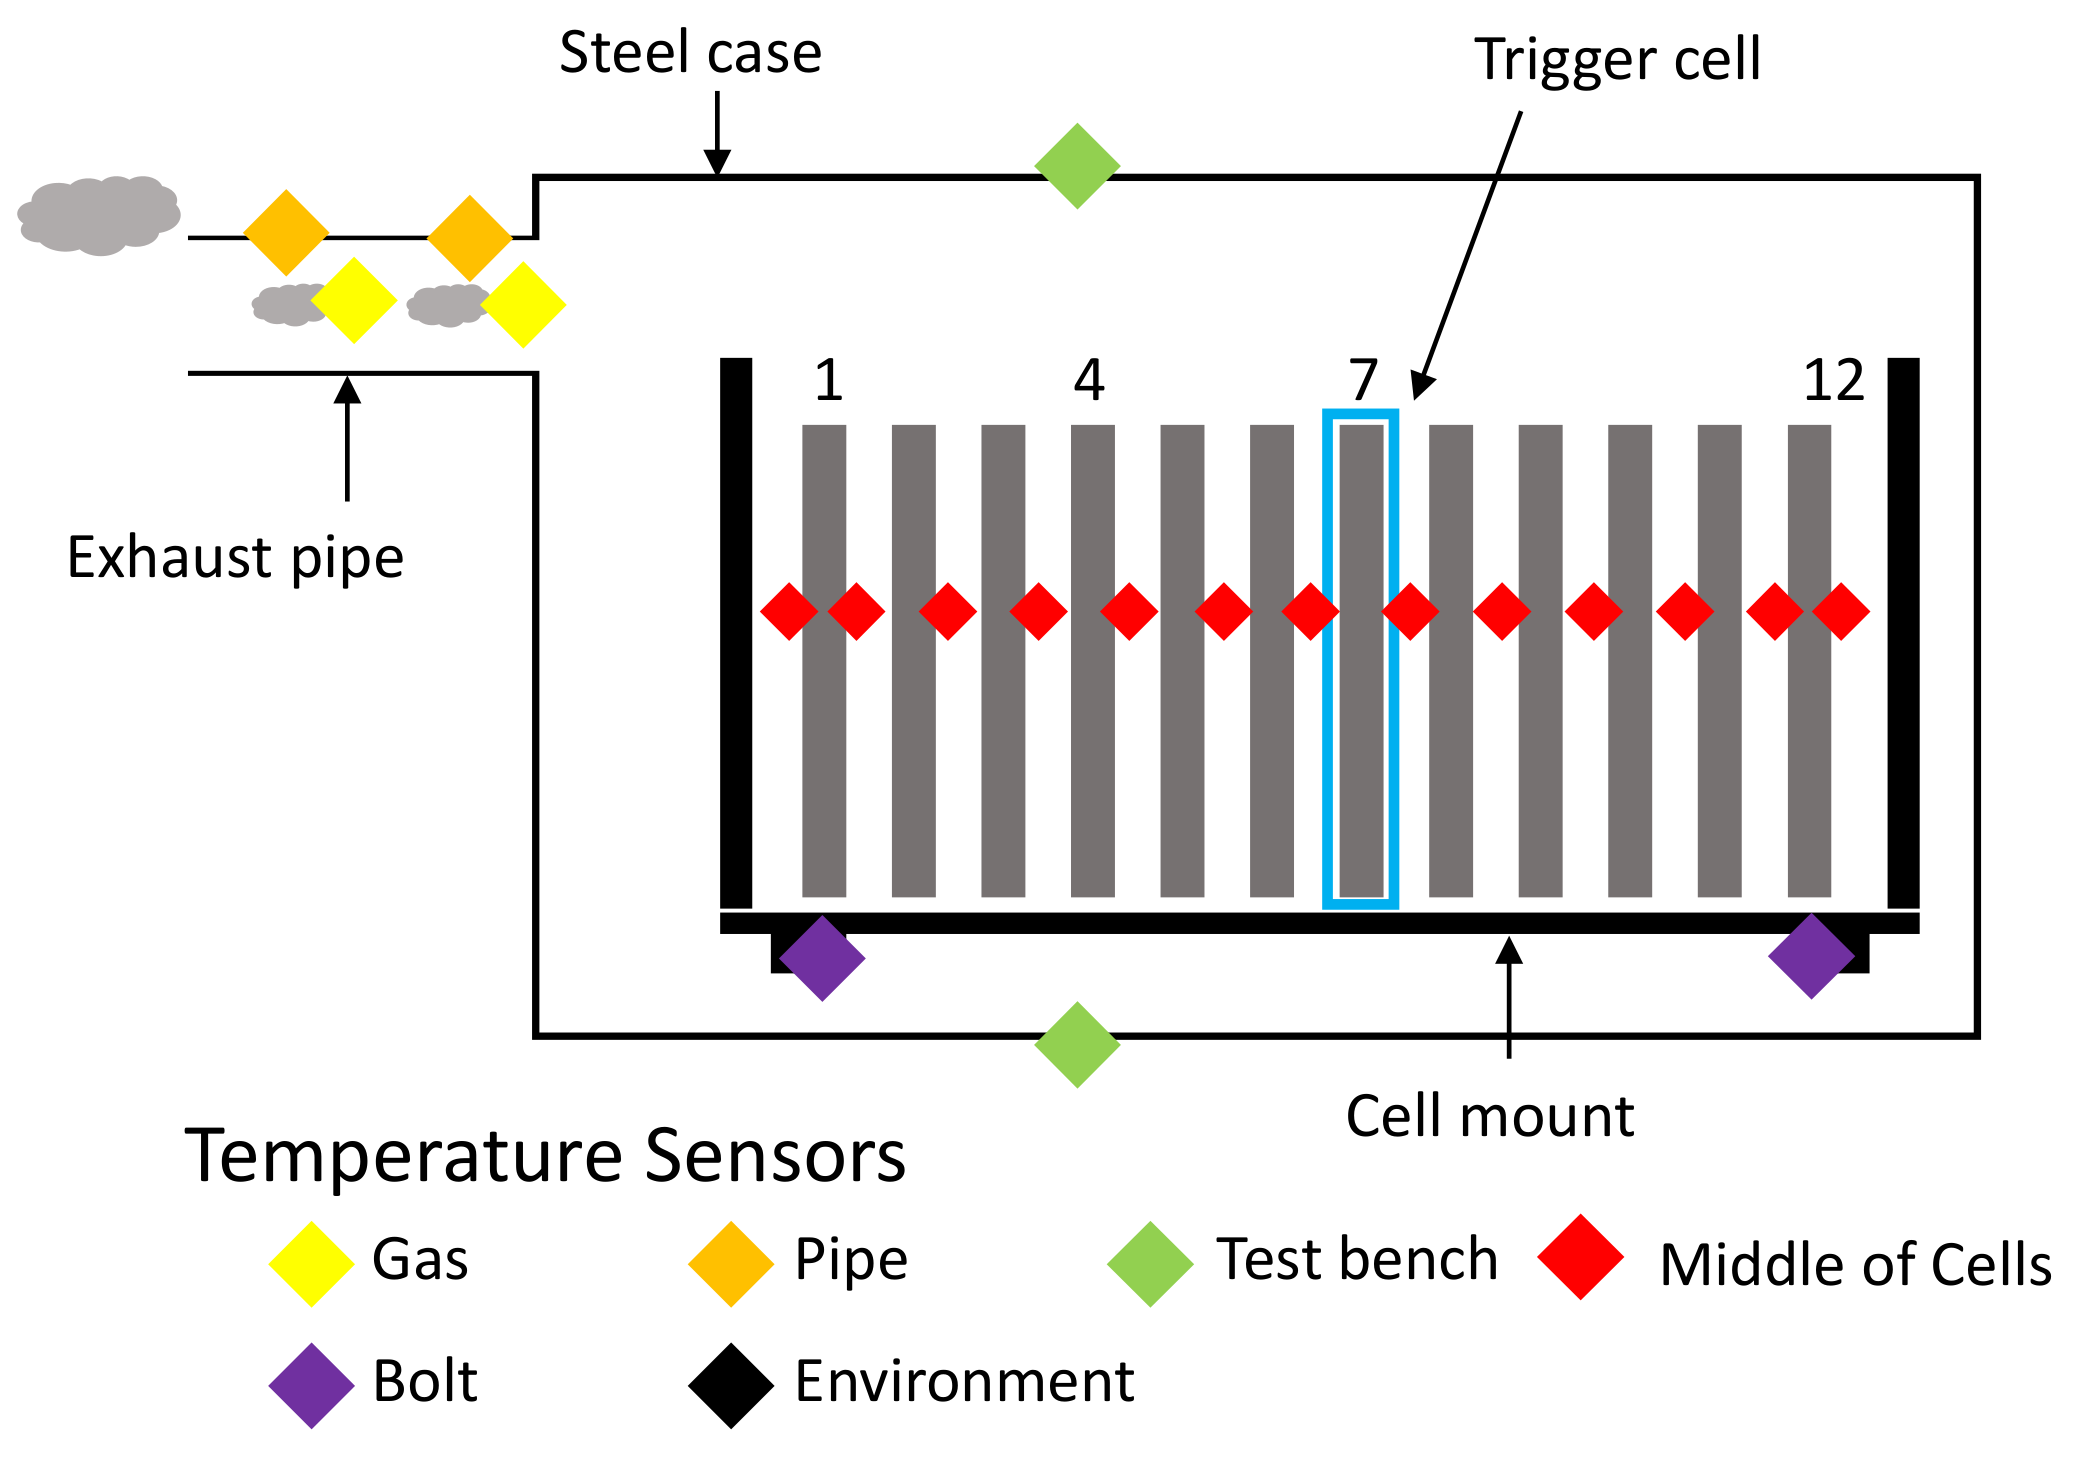
Type K thermocouples are used to measure the temperatures during the experiment, an overview of the placements can be seen in Figure 12. Most are placed in between the cells—to avoid indentation, aluminum sheets with cutouts for the thermocouples are used. The surface temperature of the test chamber is measured with two sensors on the outside—one at the top near the opening for the nail and one at the bottom centrally located. The exhaust gas is measured with sensors inside the exhaust system as well as sensors on the outside of the pipes, allowing for the calculation of heat transfer from venting gas to the pipe. Within the test bench, sensors are placed on the low heat conduction post insulators, which connect the cell mount to the test bench.
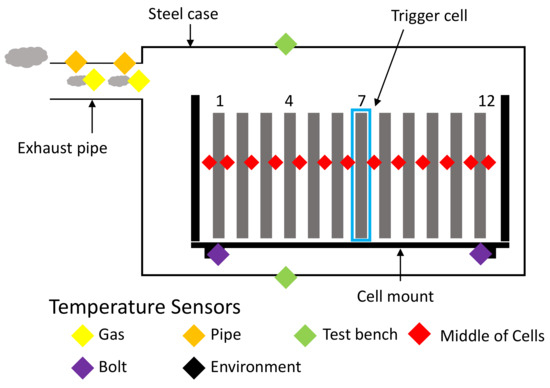
Figure 12.
Schematic overview of the temperature sensor placement across the test bench. Red: 13 centrally located between cells, respectively between cells and cell mount. Orange: On the outside of the exhaust pipe. Yellow: On the inside of the exhaust pipe. Green: Outside surface of the test bench (top and bottom). Purple: Low heat conduction post insulators. Black: Measuring ambient temperatures of the surrounding environment.
The nicknamed “super sensor cell” number 4 has 9 additonal temperature sensors—their placement can be seen in Figure 13. Two extra thermocouples are placed between cells 3 and 4. Additionally, five sensors are placed between cells 4 and 5 and two on the cell tabs.
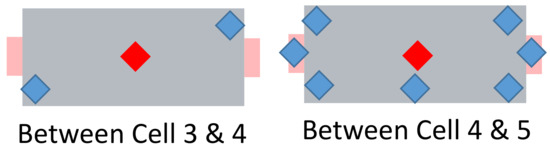
Figure 13.
Schematic view of the nicknamed “super sensor cell”. Red: two centrally located temperature sensors (see Figure 12). Blue: additionally placed sensors.
3. Results
The results of the single cell TR experiments with nail penetration can be found in Section 3.1. The findings of the ARC experiment are presented in Section 3.2. Using the single cell reactivity results, subsequent TP experiments with the multi pouch cell setup in the test bench were carried out, as outlined in Section 3.3.
3.1. Thermal Runaway Triggered by Nail Penetration
As previously stated, two directions of nail penetration relative to the cell are possible, both with different nail tip shapes. The results of these two directions of nail penetration are compared in Section 3.1.1. During the campaign, it became clear, that uncycled cells were not undergoing a TR with significant heat generation. Yet subjecting the cells to a full initial cycle caused the cells to then undergo a TR with significant heat generation once triggered, as shown in Section 3.1.2. Further variations in the temperature and SoC allowed for a Design of Experiment approach for future experiments—the resulting DoE is discussed in Section 3.1.3.
3.1.1. Significance of Nail Penetration Direction in Uncycled Cells
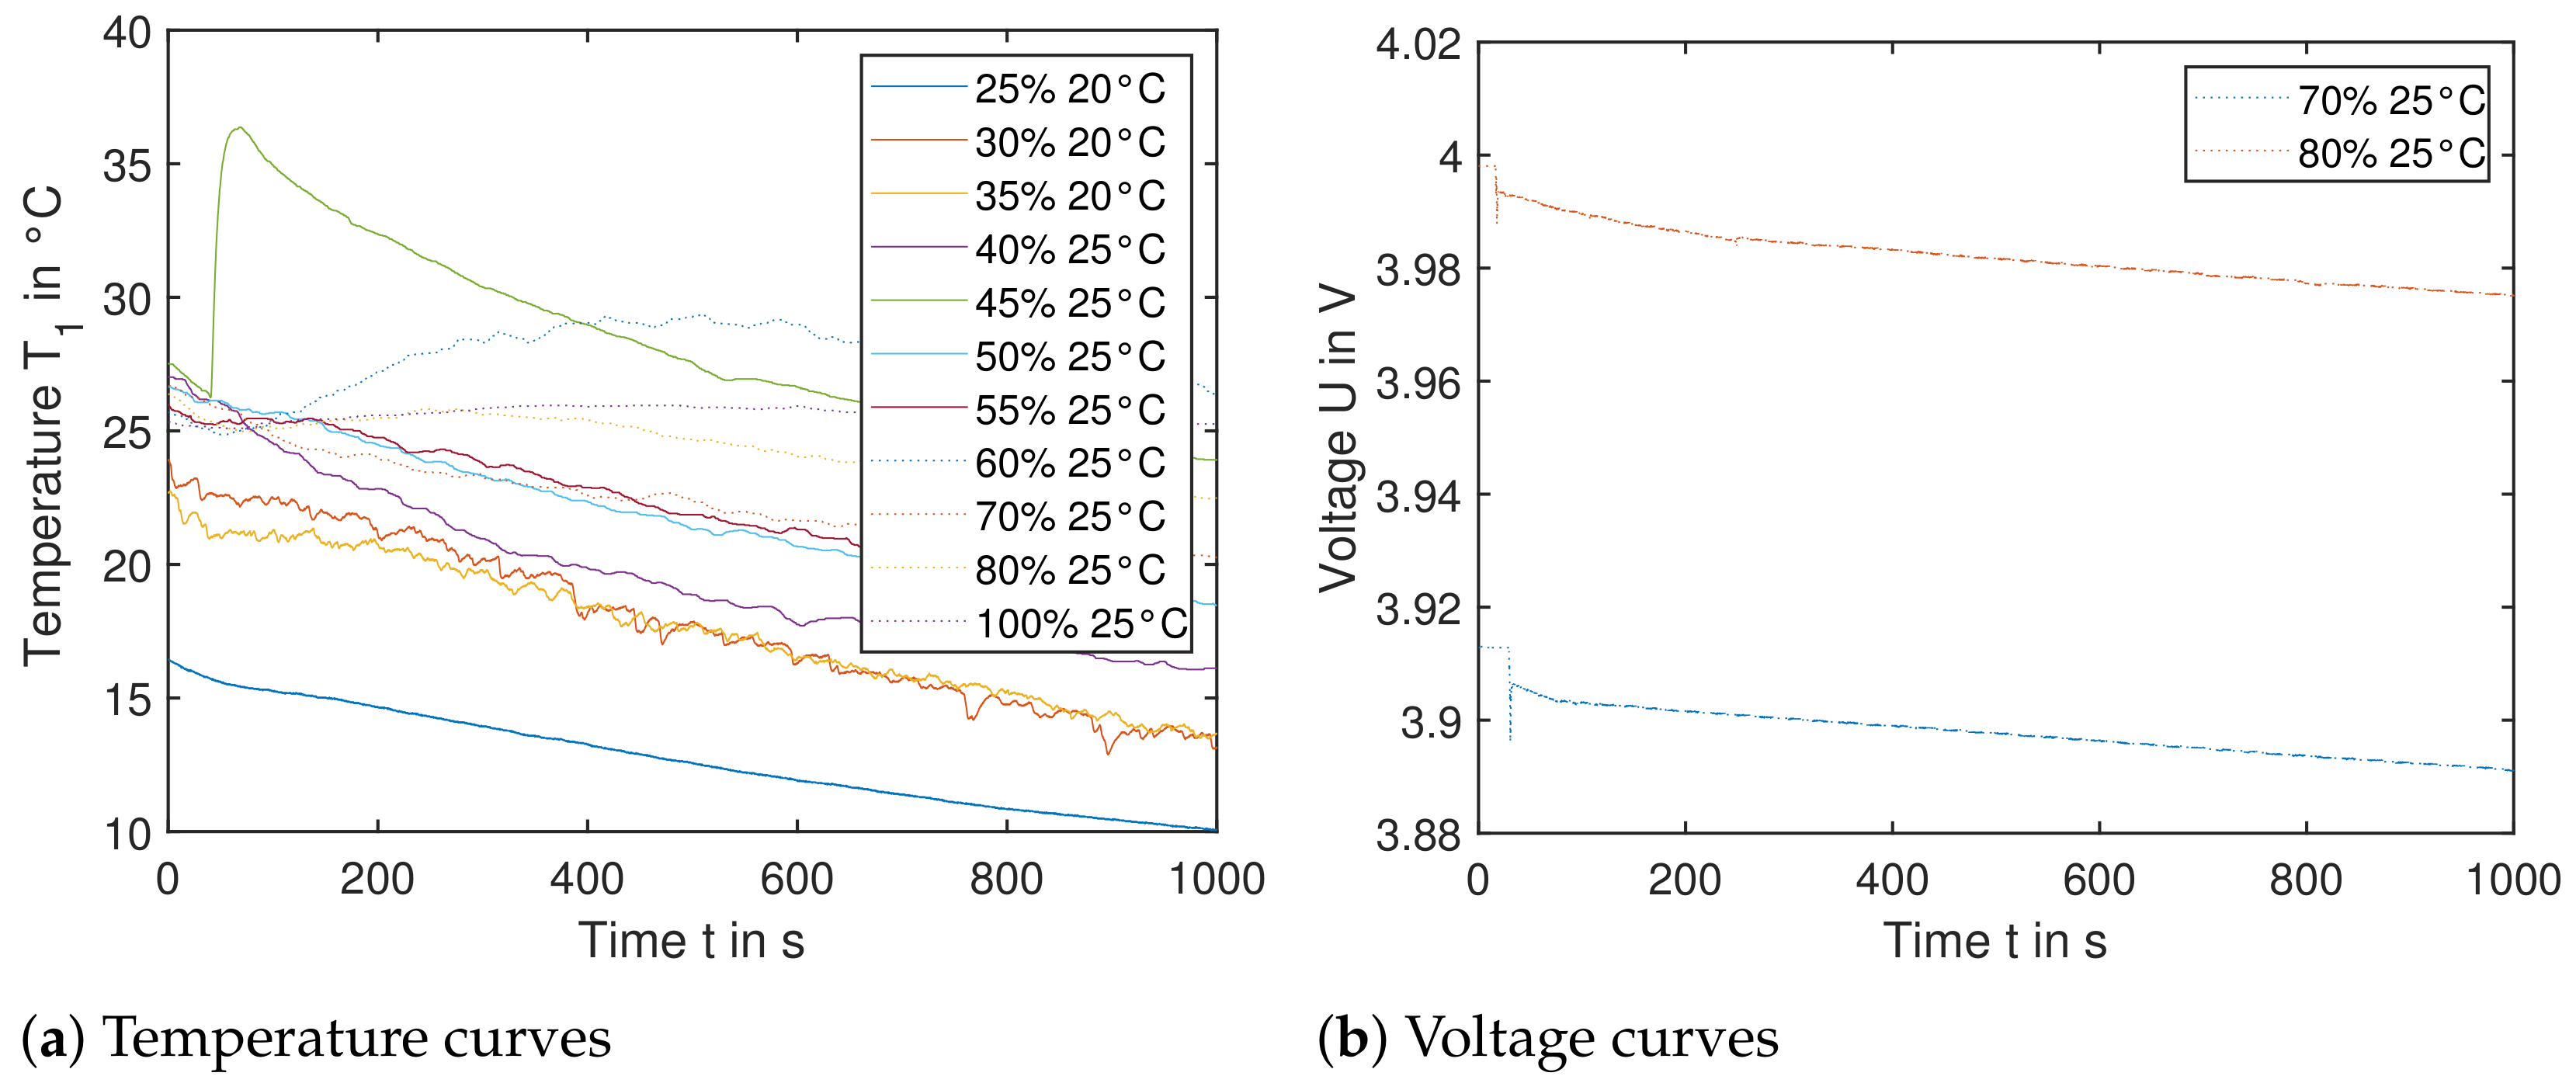
Figure 14a shows the resulting temperature curves of sensor , when the nail triggers the cell orthogonal to the electrode layers. Temperature sensor shows comparable results. The SoC ranges from to . Most curves show a declining temperature over the 1000 s recorded. This is due to the fact, that the experiments were carried out between March and June and the surrounding environment (shipping container) was not tempered. This leads to a significant cooling effect of cells with an SoC of up to . Cells with higher SoC were tested in warmer temperatures, so the temperature difference was less and the cells did not cool down as much. This also explains the initial temperature difference of the experiments—as the cells need to be clamped down as seen in Figure 3, the testing plate was at cooler ambient temperatures. Especially for the first test run with , the setup took longer than initially expected. In the following tests, higher initial temperatures were achieved due to an established setup routine.
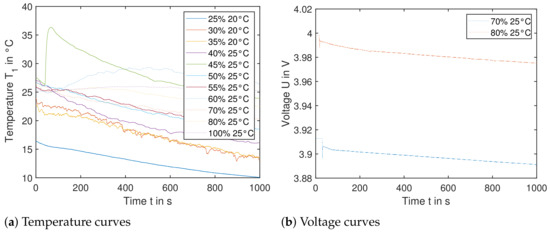
Figure 14.
Single cells triggered by nail orthogonal to electrode layers. (Left): The temperature data from sensor is shown for cells with SoC ranging from to . No significant temperature increase is recorded; therefore the cell reaction in a module would not lead to TP. (Right): The voltage U of cells with starting SoC and is shown. The sudden decrease in the voltage within the first seconds correlates with the moment, when each nail penetrates the cell. The voltage decreases slowly, leading to insignificant heat generation.
Most experiments did not lead to any significant recorded temperature release, yet the setup with SoC does lead to the highest temperature rise of around . The nail has short-circuited the cell, yet the discharge current is insignificant with negligible heat generation—this can be seen in Figure 14b in a slow decrease of the voltage of the respective cell. Literature shows, that triggering a pouch using this method would lead to a significant reaction—yet these cells mentioned in the publication were subjected to a cycle before testing or direct charging to SoC [9].
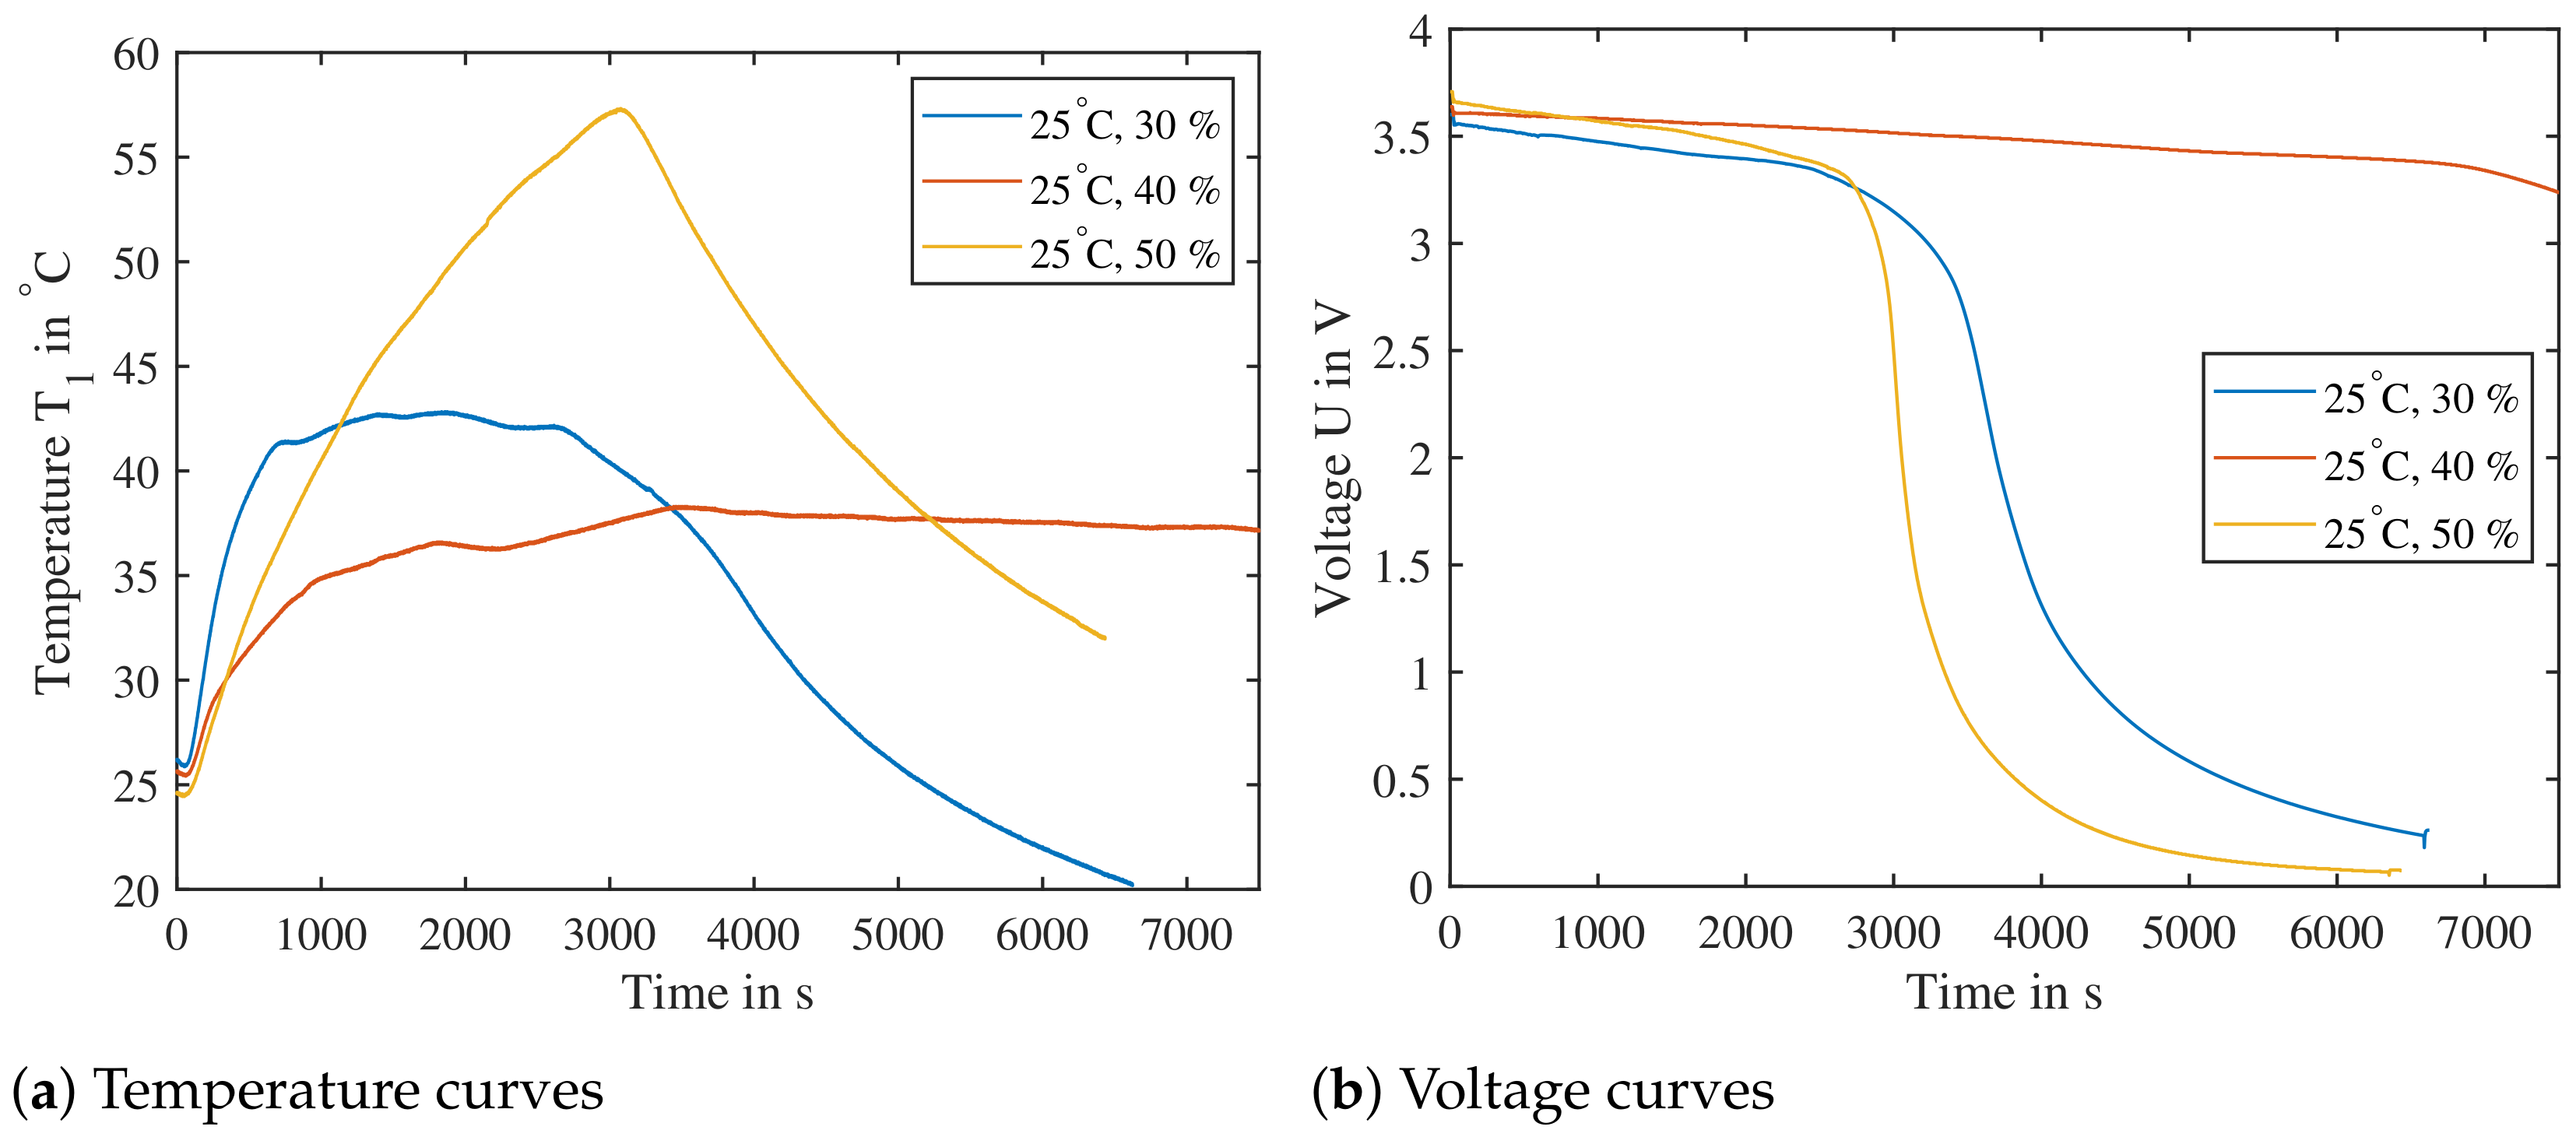
The graph in Figure 15 shows the resulting temperature curves of sensor for an SoC between 30% and 50% after the cells were triggered parallel to the electrode layers. Larger temperature rises can be seen compared to the orthogonal layout. The cell with SoC has a temperature raise of up to , of up to and of up to , yet these TRs would not lead to TP, if a cell was adjacent to it. Typical trigger temperatures—temperatures, where a TR might occur—are above [10]. The ARC experiment, where a critical temperature of TR is determined, shows for a cell at SoC temperatures of around for a TR reaction, as seen in Section 3.2. The preferable direction for nail penetration, if a significant reaction is expected, needs to be parallel to the electrode layers.
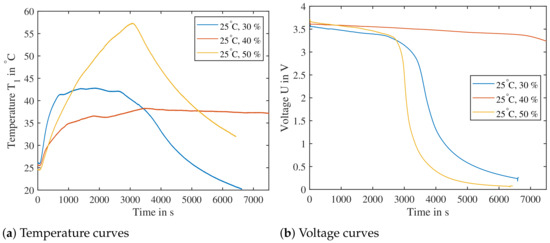
Figure 15.
Single cells triggered by nail parallel to electrode layers. (Left): The temperature data from sensor is shown for cells charged directly to a SoC of , and without cycling. A temperature increase is recorded, yet well below temperatures, where a cell’s reactions could lead to TP. (Right): The cell voltage U is decreasing as the respective cells are undergoing TR.
The cells delivered directly by the cell manufacturer have a low risk of causing a TR reaction that would lead to a TP when penetrated. The results show, that a SoC of would still be considered safe. Yet tests on battery level have shown that nail penetration will lead to Thermal Propagation. For this, the battery underwent a full charge and discharge cycle before test. Therefore the single cell tests need to be repeated with an additional cycle added. Nevertheless, triggering a cell using nail penetration parallel to the electrode layers causes higher rates of heat generation compared to nail penetration orthogonal to electrode layers. Therefore, for the test bench setup nail penetration parallel to the electrode layers is used as the trigger direction.
3.1.2. Uncycled Cells vs. Cycled Cells
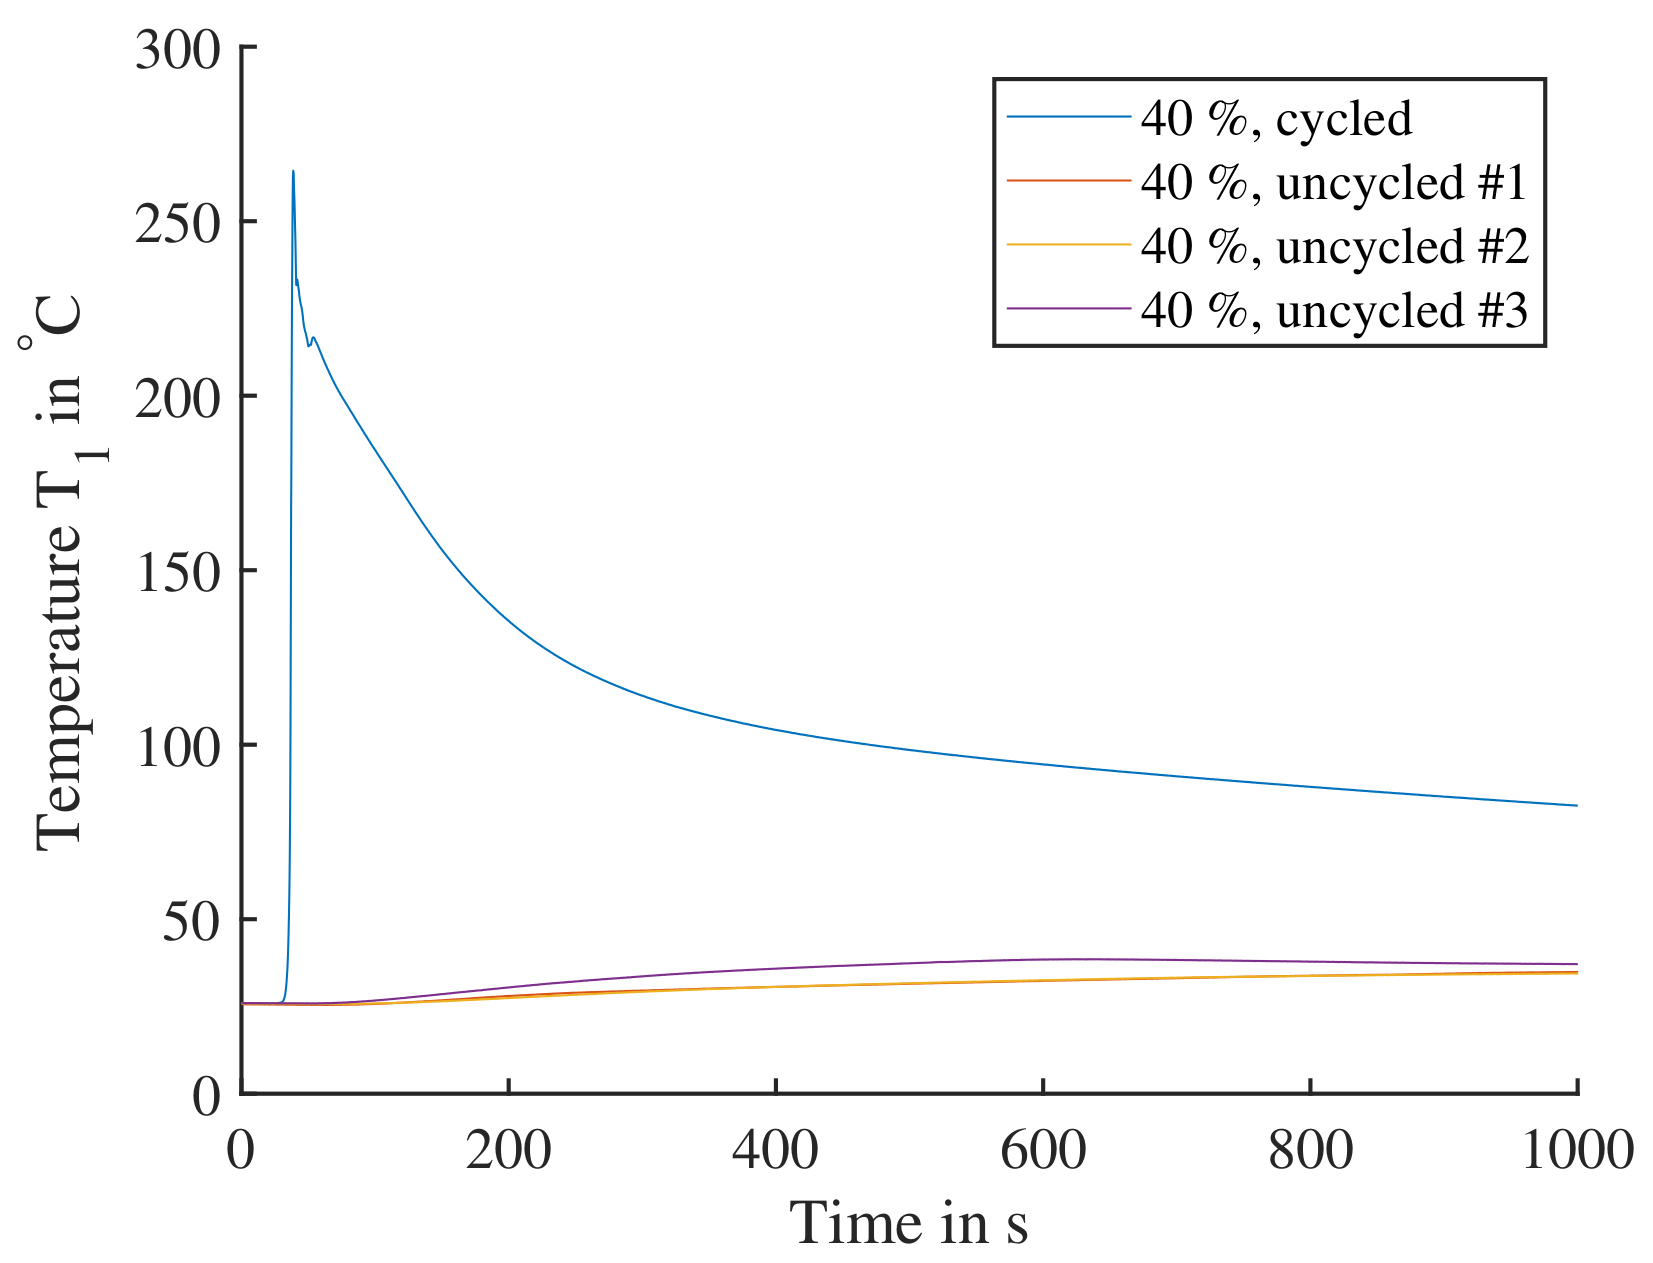
To recreate the battery conditions causing the TP reaction, a full charge and discharge cycle was added to the test procedure before the cell then was charged to the required SoC. In Figure 16, the cell reactions of 40% SoC with and without cycle are shown. The uncycled experiments lead to a slow temperature increase to surface temperatures of less than . For the cell with a previous cycle a rapid increase to a surface temperature of is seen. Cells tested at didn’t produce temperatures higher than , so is the lowest SoC used going forward regarding triggering a TP.

Figure 16.
Single cells triggered by nail penetration parallel to electrode layers. The cells are charged to SoC; one cell with a previous cycle is compared to three cells directly charged to without cycling. The cycled cell shows a significant reaction, where the cell reaction would lead to TP. The three uncycled cells all display a comparable insignificant reaction and would not lead to TP.
Comparing cell reactions from Figure 15 to Figure 16, it can clearly be shown that the cells need to be subjected to a full cycle before any TP testing. Cells with significant calendar aging have been observed to remain their high reactivity that occurs after exposing the cell to at least one cycle. In research from Essl [9] cells were not subjected to a cycle, yet charged directly to SoC for testing, showing significant temperature increases of up to . Testing of cells at SoC, often with previous cycles to determine the exact capacity, is common compared to this work. Analyzing the cell’s chemistry before or after an initial cycle was not in the focus of this work.
3.1.3. Design of Experiment: Temperature and State of Charge
For a nail trigger causing a cell TR reaction, which will likely lead to a TP reaction in a module, the following for the pouch cell used need to apply: (a) exposure of the cell to at least one full cycle before test, (b) trigger using a nail parallel to the electrode layers and (c) a SoC of at least .
Therefore, the temperature and SoC restrictions for the module are as follows: temperatures between and due to limits of the climate chamber and a SoC between and .
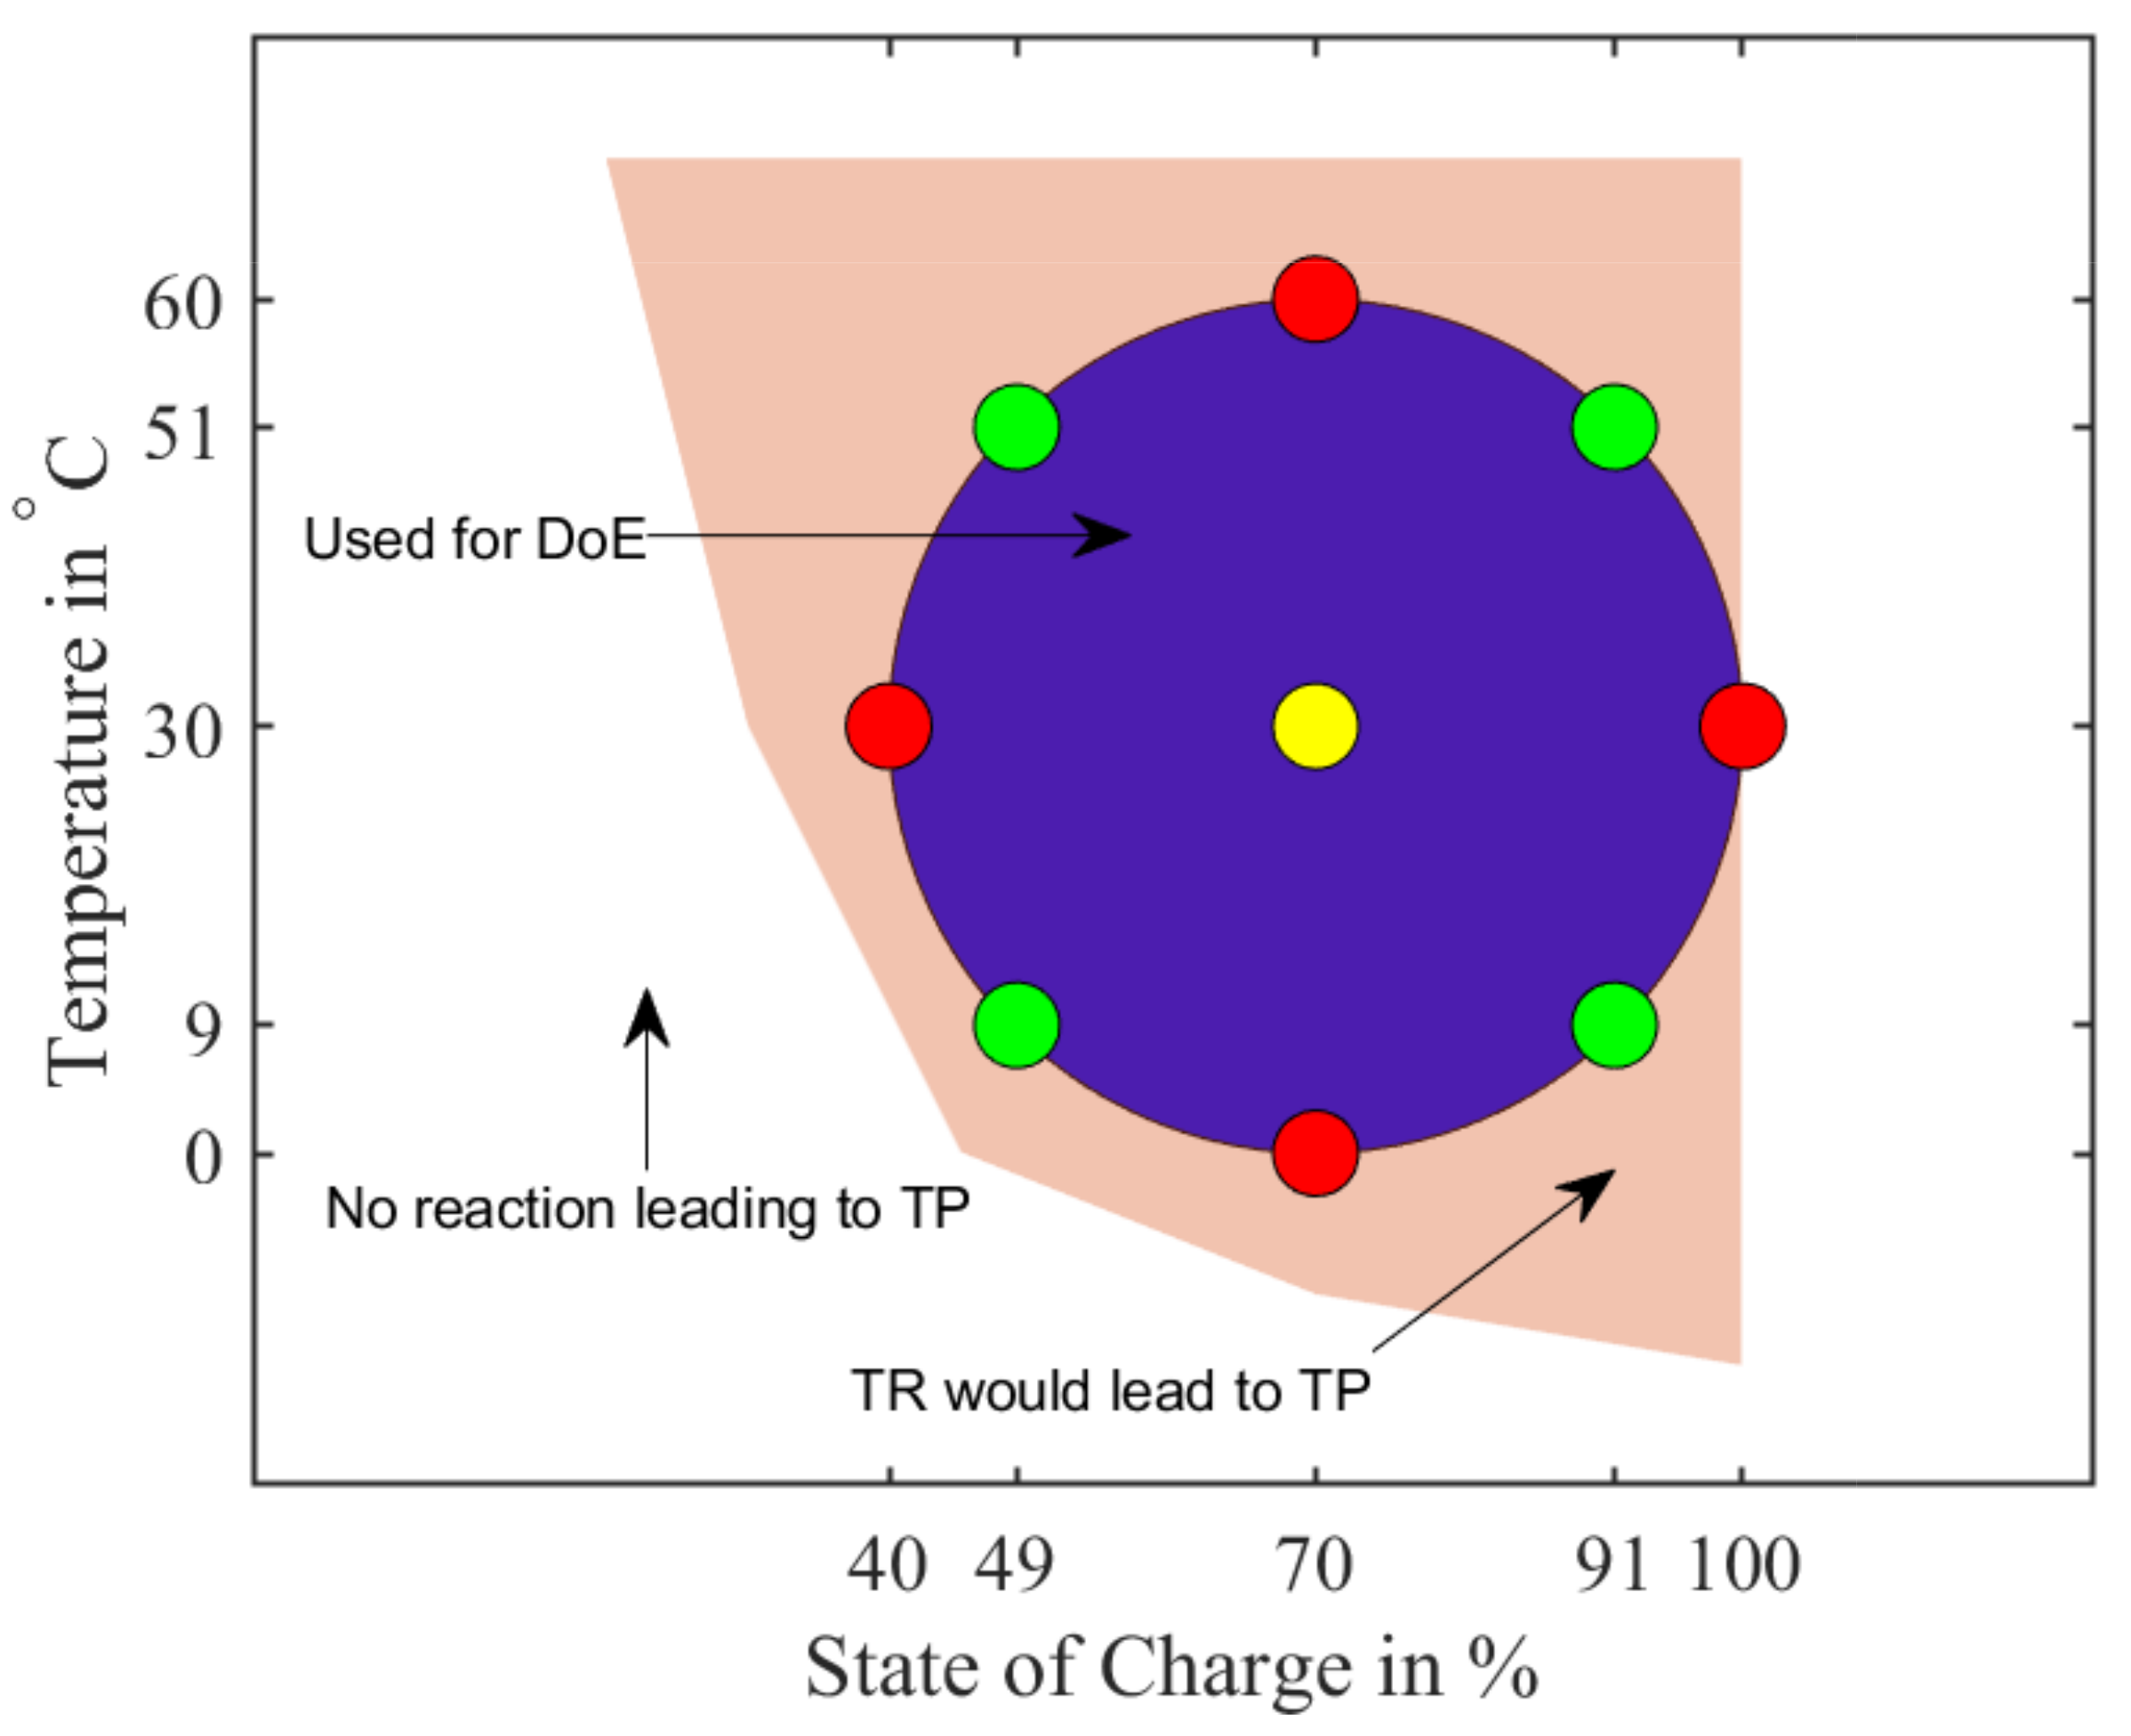
A Design of Experiment (DoE) approach with a central point of at was selected: a central composite design with the two factors ‘temperature’ and ‘SoC’. The aforementioned range of SoC is to and the temperature range is to —these test points are visualized in Figure 17. It includes an area named “TR would lead to TP”, which is supposed to show, that other temperature/SoC-combinations exist, where a TP could be initiated. No experiments were carried out to verify the area—it is included in a symbolic matter.

Figure 17.
Schematic view of the Design of Experiment with a central point (yellow) at and . Red markers have only one variable (T or SoC) varied in regards to the central point, whereas the green markers have both variables changed.
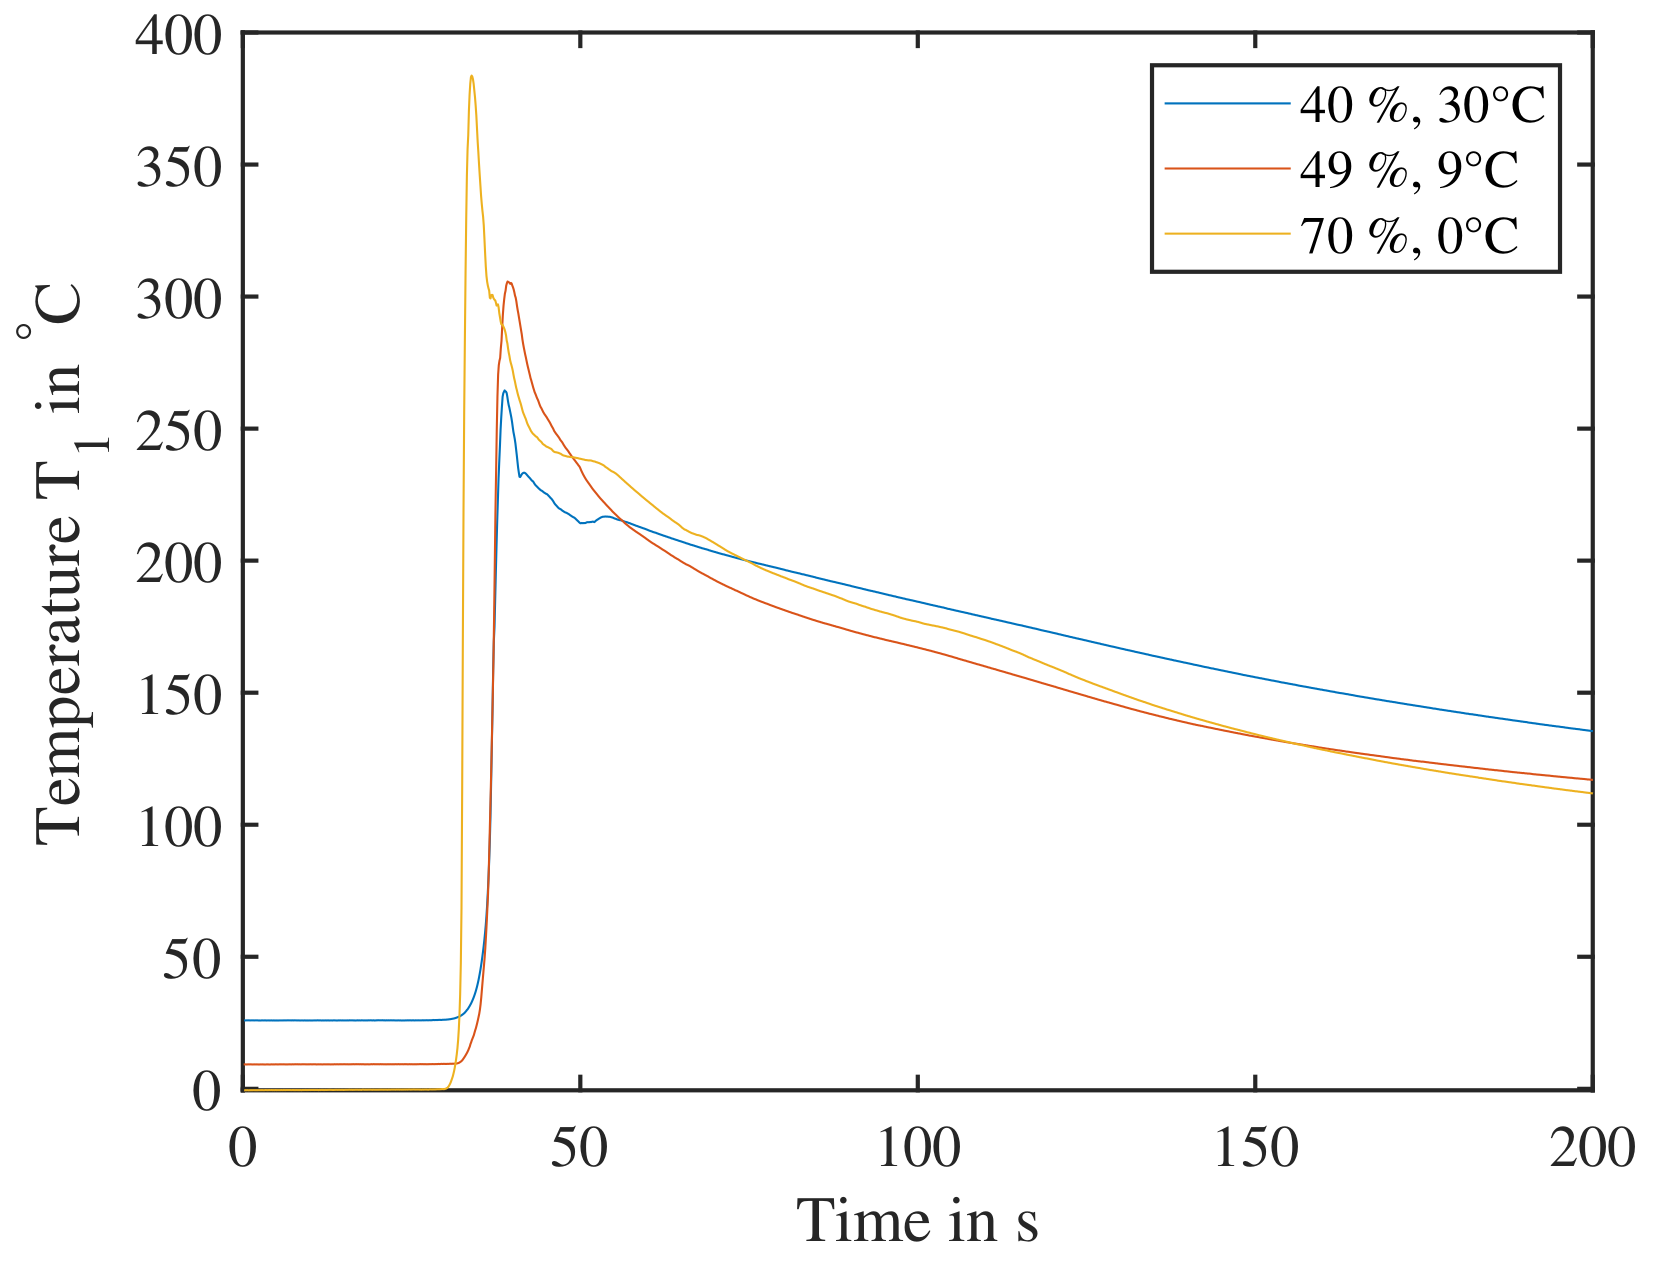
To ensure all test parameters lead to a successful TP, points of low reactivity need to be verified. These points are A ( at ), B ( at ) and C ( at ). All three points are verified in Figure 18—all three generate temperatures well above and it is expected with high probability that a TR will lead to a TP reaction.
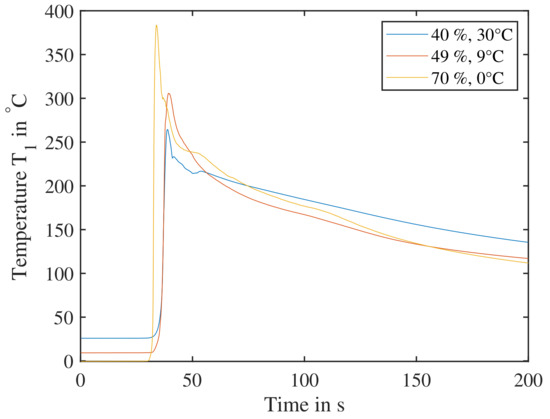
Figure 18.
Combinations of temperature/SoC from the DoE of low expected reactivity tested for their heat release. The cells are triggered parallel to the electrode layers and are subjected to a previous cycle. Cell reaction at point A ( at ), B ( at ) and C ( at ) are shown, all three clearly showing a temperature increase sufficient for triggering a propagation.
3.2. Single Cell Reactivity Using ARC
Using nail penetration at an initial temperature of , the cells from SoC onward displayed a heat release to trigger a propagation (see Figure 18). Yet to ensure, that the temperature reached is sufficiently high to trigger the TP reaction, an ARC experiment using a single cell at the lowest SoC of the DoE of is carried out.
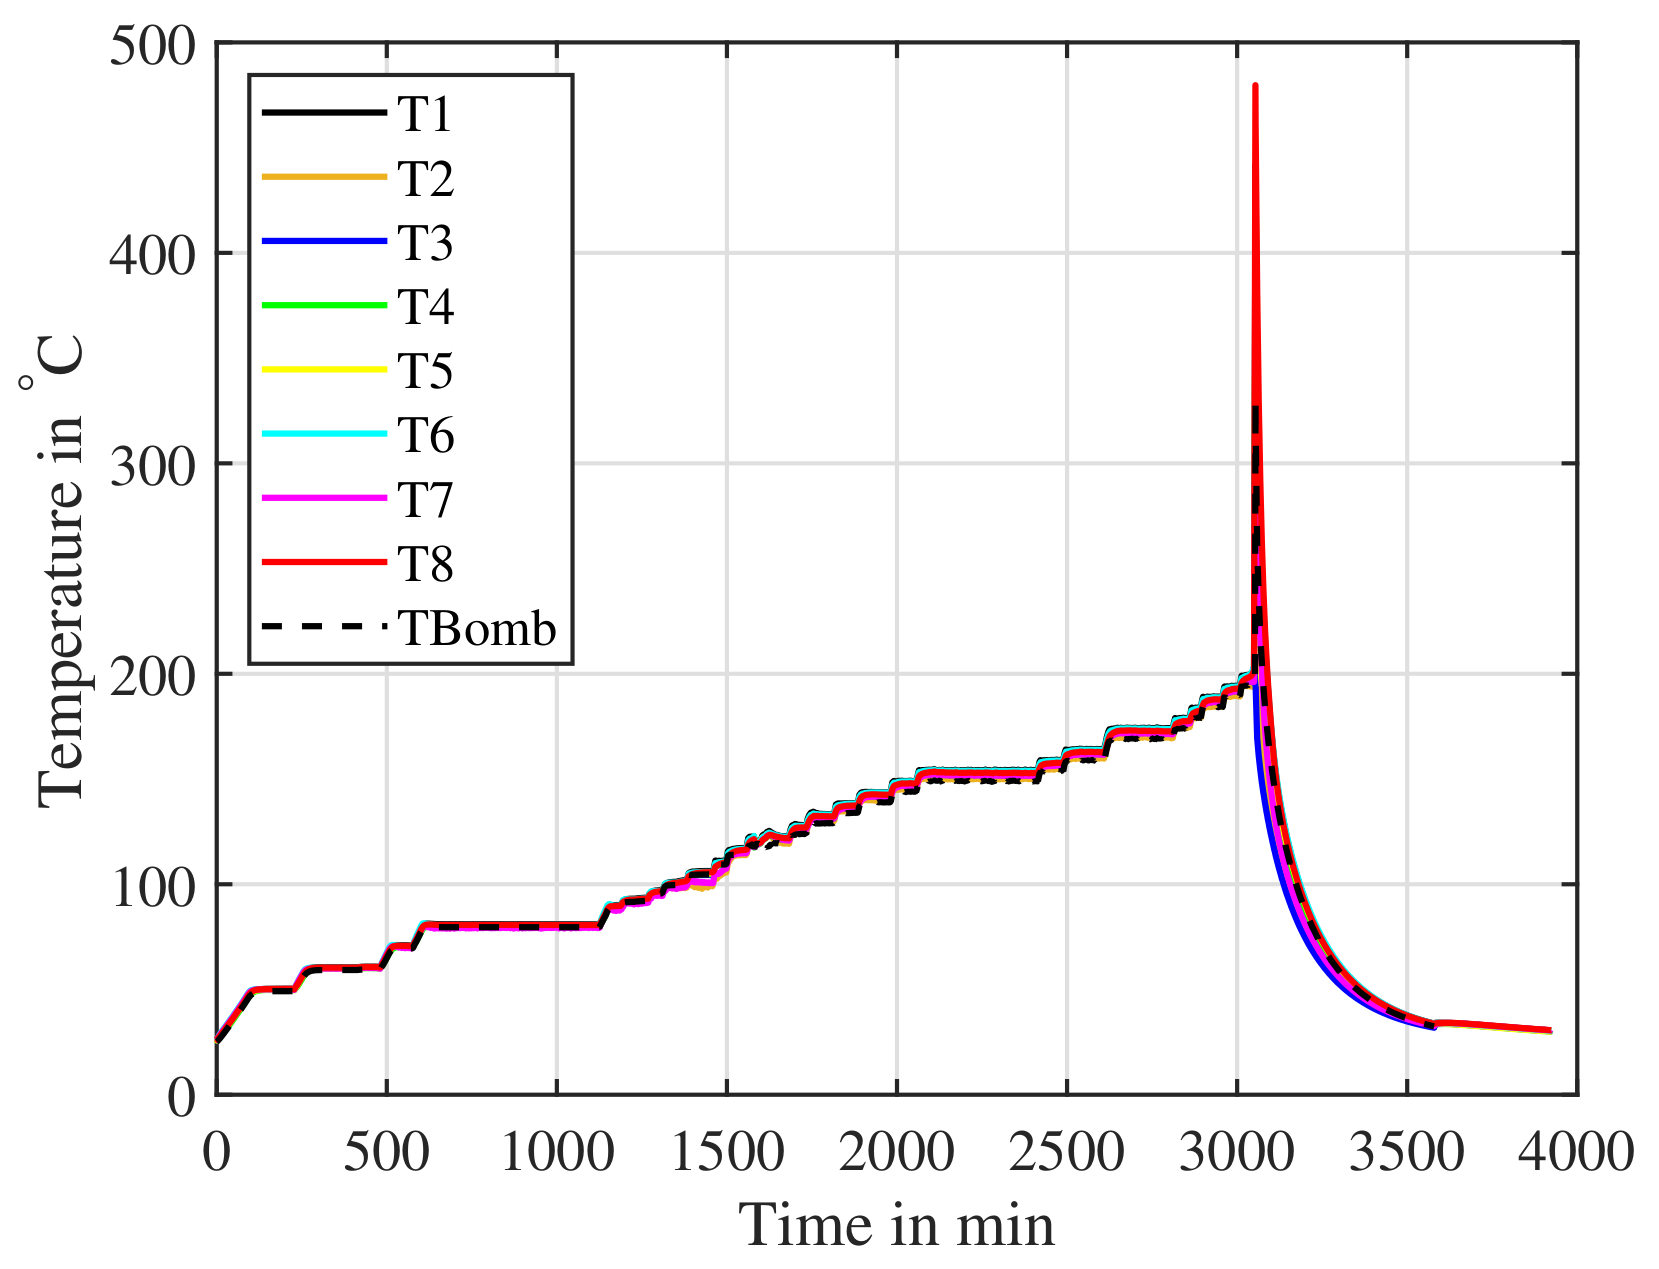
Figure 19 shows the recorded temperatures of the cell during the ARC experiment. The last temperature plateau, before the cell undergoes TR is . The surface temperature of the SoC nail penetration test in Figure 16 is . Therefore, such a triggered cell will be able to cause a TP reaction.

Figure 19.
A cell cycled and then charged to is placed inside an ARC. The cell is slowly heated and the ARC searches for a response from the cell. The ARC detects the thermal runaway from onwards.
3.3. Thermal Propagation Test Bench
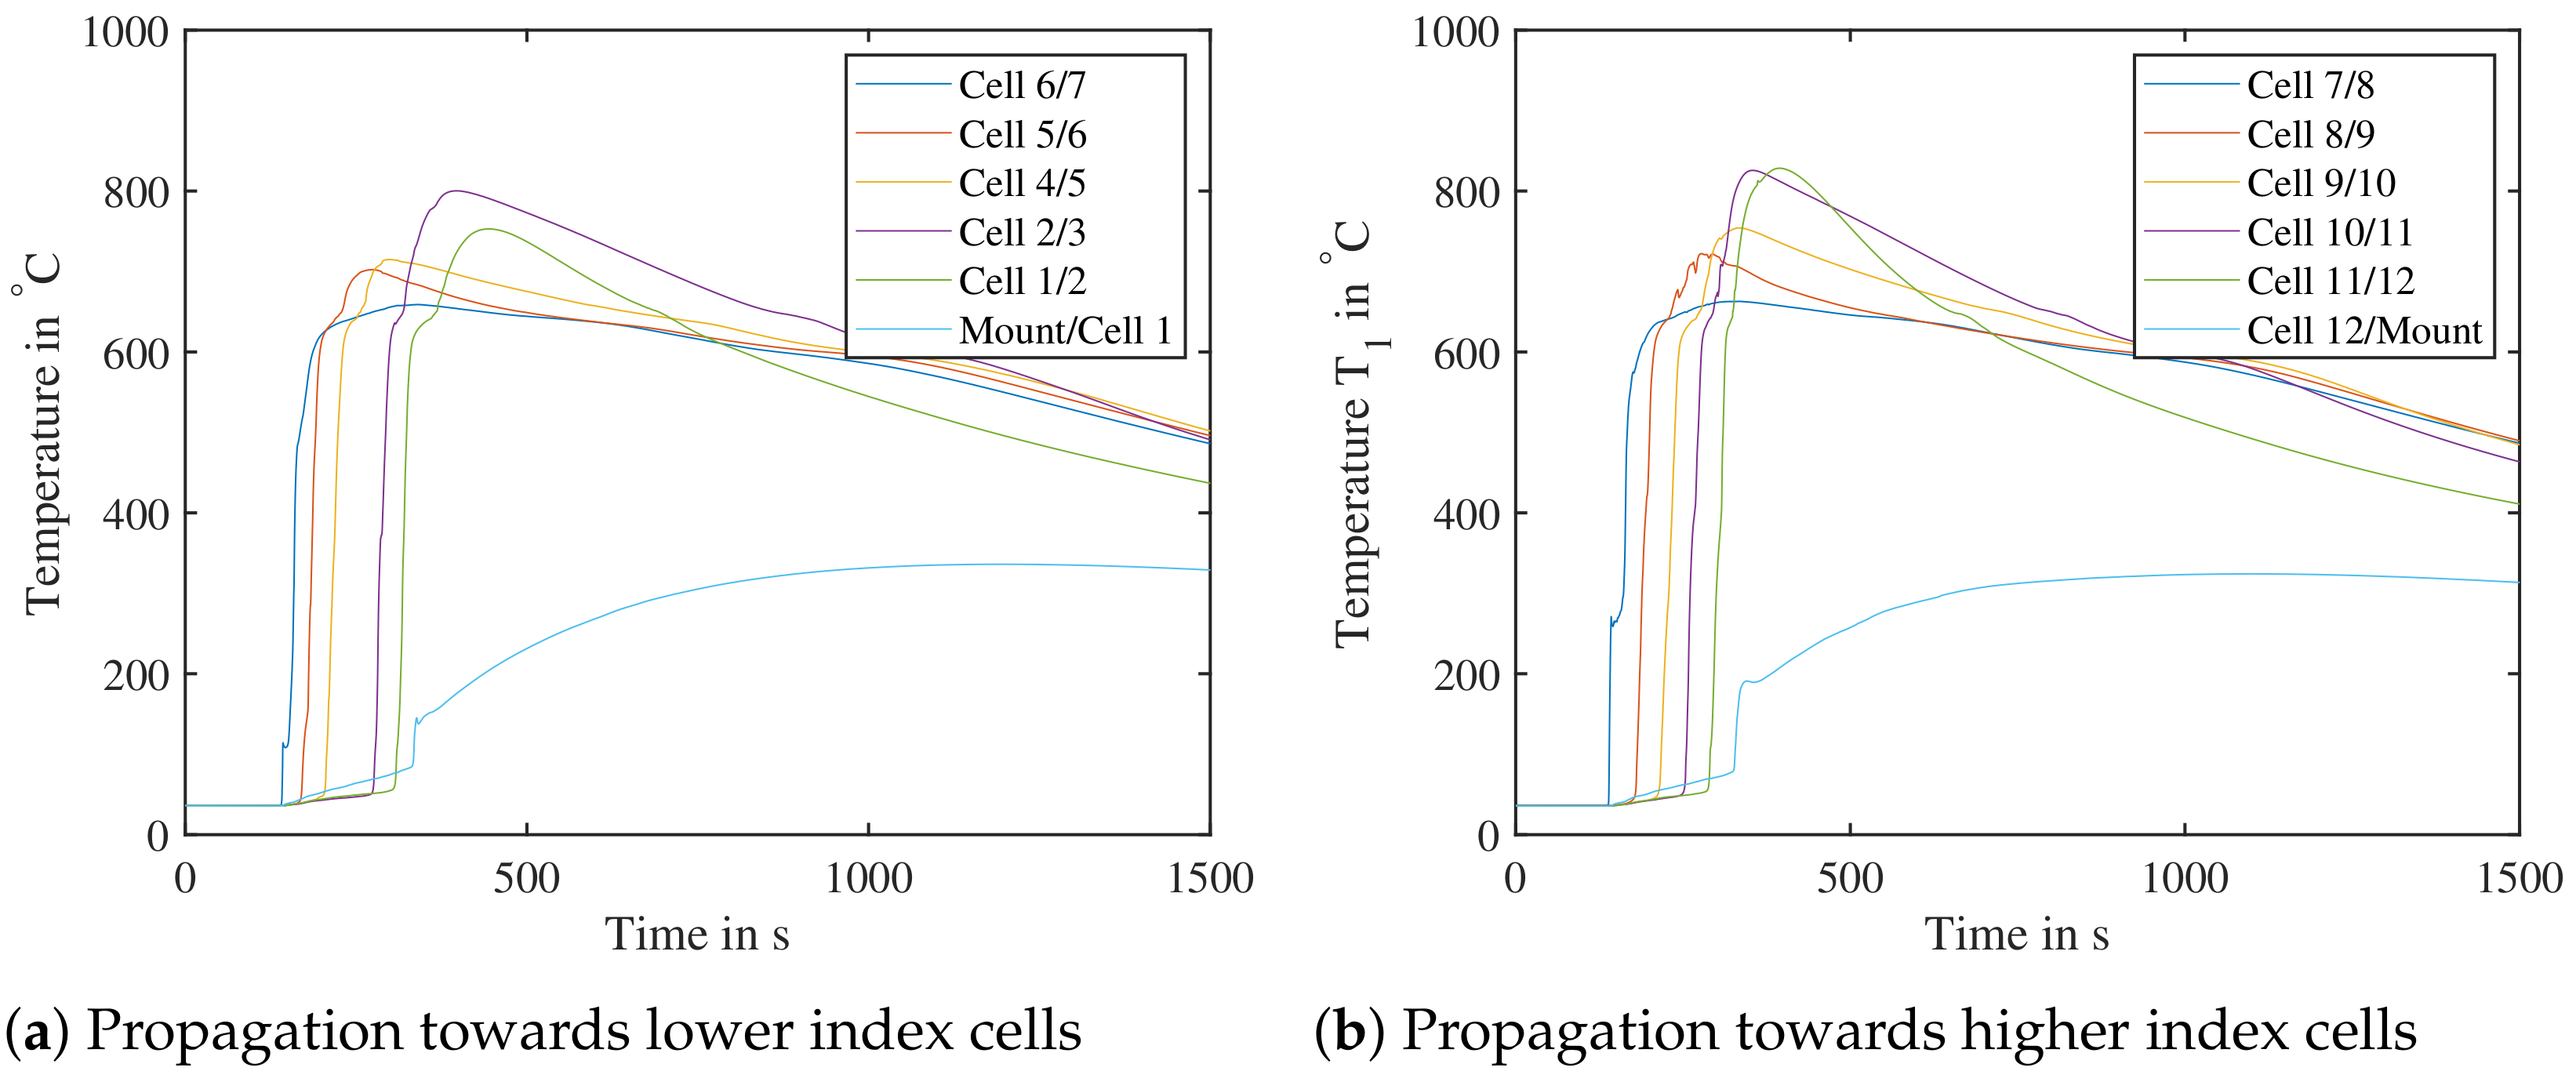
To validate the test bench, two tests at SoC at were carried out: the first trial was with air within the test bench, the second was with nitrogen—to see, if the propagation is affected by the surrounding atmosphere in a cell pack. Figure 20 shows the measured temperatures in the trial run with air. For better overview, only centrally located temperature sensors within the cell pack are shown. The temperature sensor “cell 3/4” is missing due to an error during setup. Before a cell undergoes TR, its base temperature increases at a low rate due to heat conduction. The further away a cell is from the initially triggered cell 7, the higher its maximal temperature tends to become. This cascading effect is observed both in air and nitrogen in both directions - this needs to be studied in further experiments. The sensors named “Mount/Cell 1” and “Cell Mount 12/Mount” are mounted between the last cell and cell mount. This leads to lower measured maximal temperatures, as the cell mount acts as a heat sink.
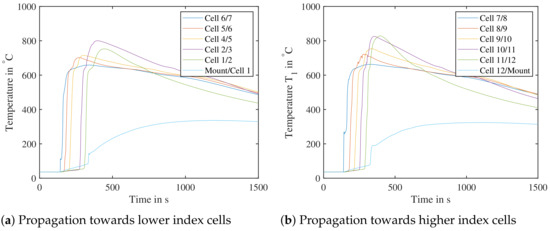
Figure 20.
Test bench validation with air, cell number 7 triggered by nail penetration. The cell pack was tested at an initial setup of SoC at . (Left): Propagation towards cells with lower index—Temperature sensor between cell 3 and 4 missing. (Right): Propagation towards cells with higher index.
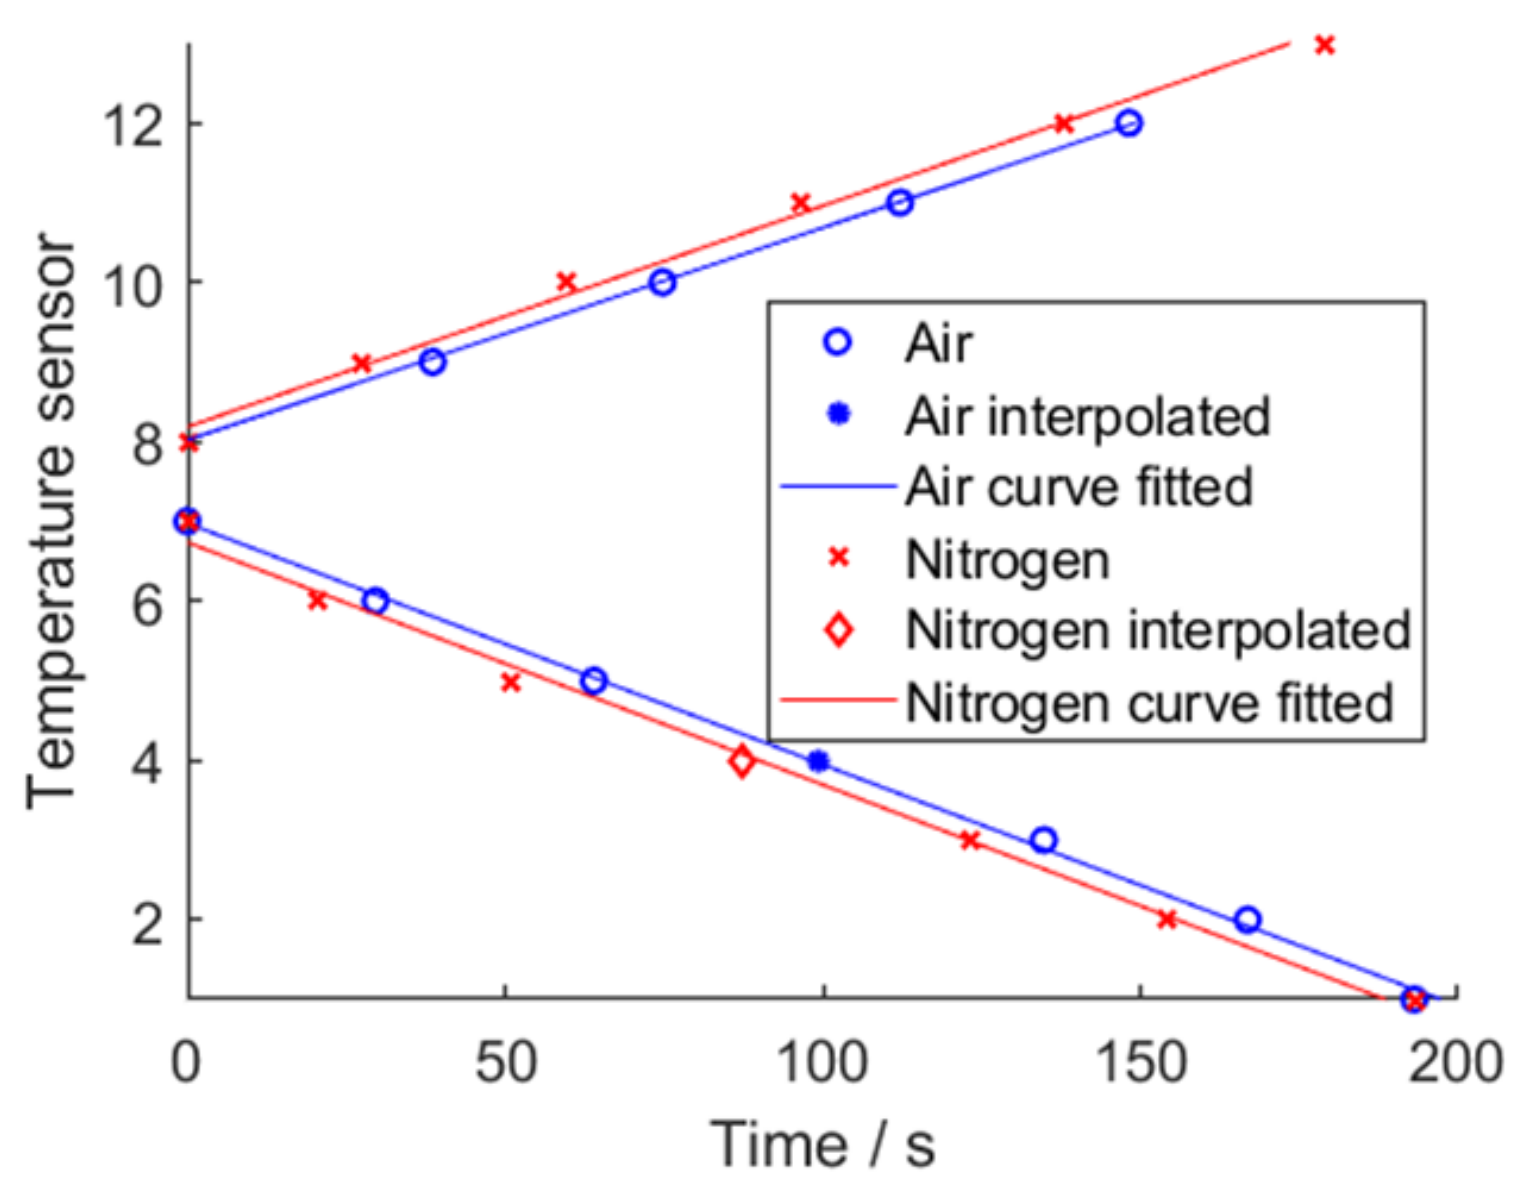
The most direct way to identify whether a cell has undergone TR is to analyze the surface temperature of said cell. A raise of 2 K/s as this threshold limit has been set. These resulting times for each temperature sensor in the cell pack have been visualized in Figure 21. Temperature sensor 1 is between cell mount and cell 1, sensor 2 is between cell 1 and 2, etc.
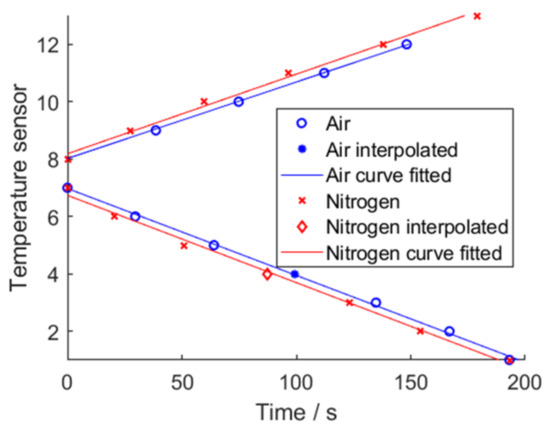
Figure 21.
Visualized propagation through the cell pack in air and nitrogen. Both cell packs was tested at an initial setup of SoC at . Temperature sensor 1 is “Mount/Cell 1”, sensor 2 “Cell 1/2”, etc.
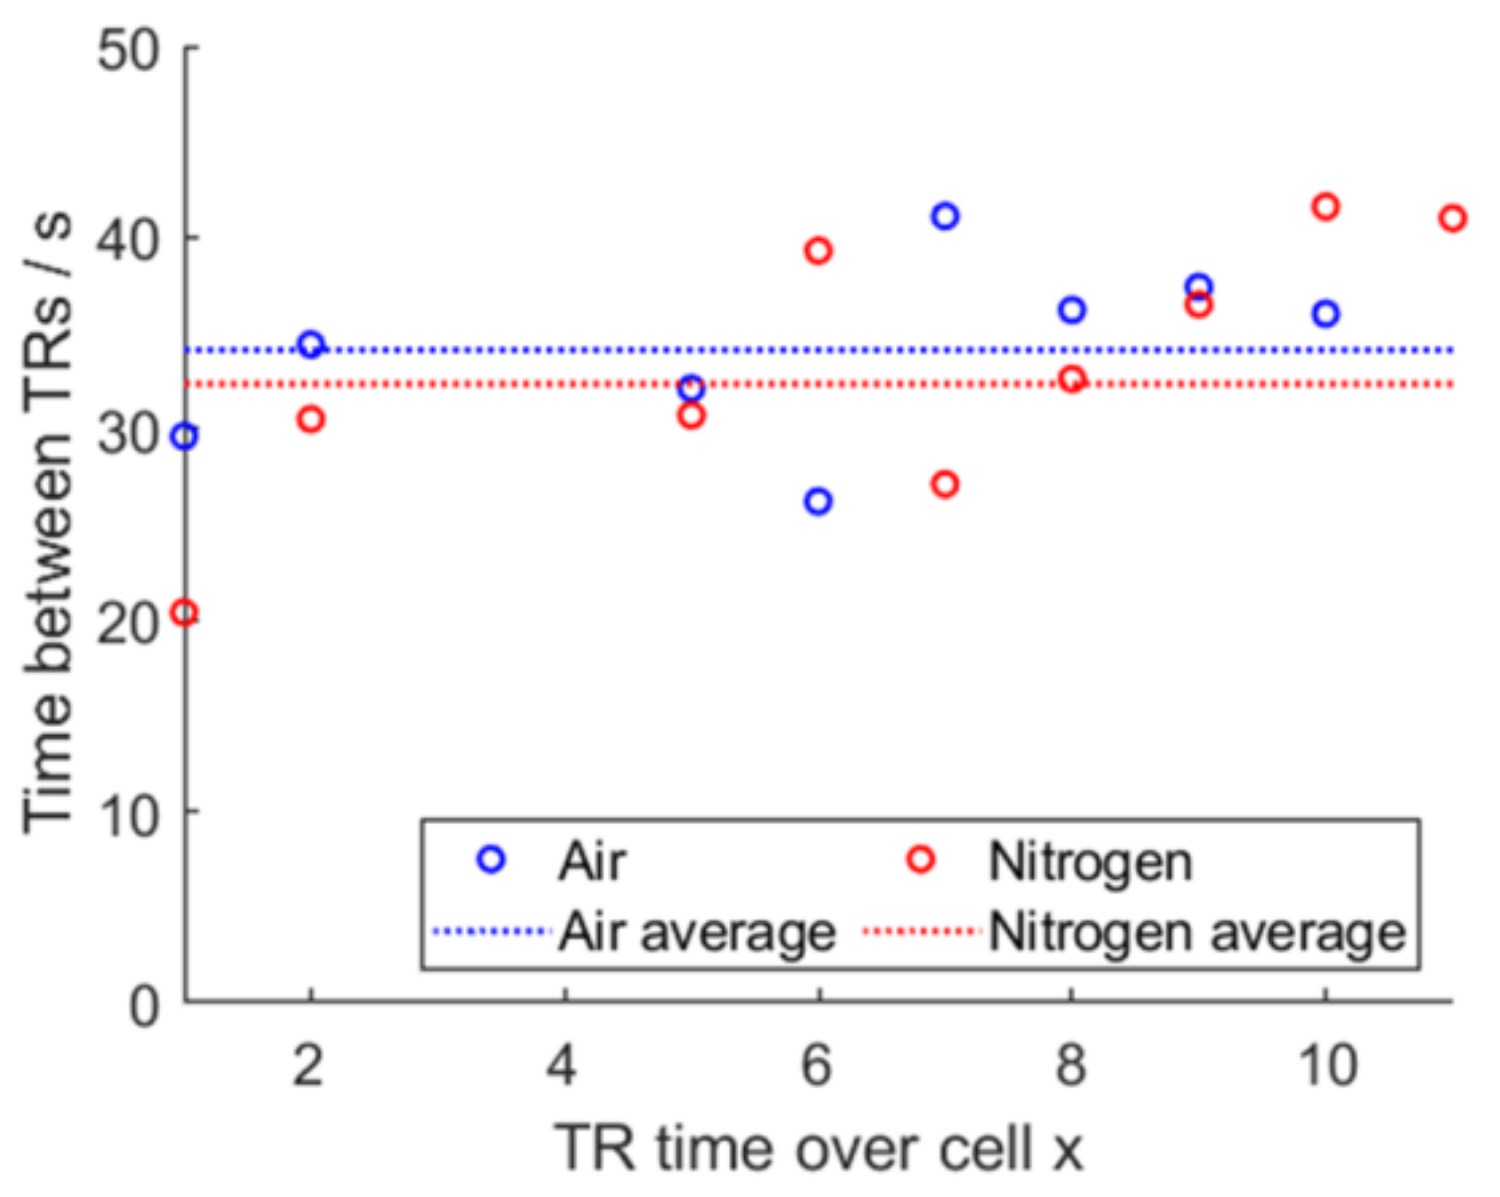
For air, sensor 13 was missing; for air and nitrogen, sensor 4 was missing due to a false setup and was replaced by an interpolation. A sideways V-shape graph for both air and for nitrogen is visible. Instead of plotting the absolute time elapsed since the TP was triggered, calculating the time difference in-between the detected TRs gives Figure 22. The average time for air is 34.1 s and the average time for nitrogen is 32.3 s.
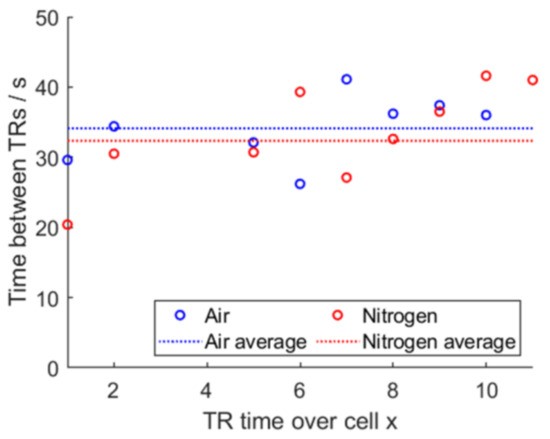
Figure 22.
Propagation time difference and averaged time, air vs. nitrogen.
Comparing the results of air and nitrogen to each other, using statistical analysis, it can be derived:
This shows that tests using air or nitrogen are both yielding results, in which the deviations of the time until the next cell undergoes TR in comparison to the mean value of all times is not of statistical importance. Similar average propagation times hint to a high degree of repeatability between both experiments.
As the trial size was only two, it is presumptuous to assume that all experiments of the DoE will yield similar clear results and thus further testing needs to be carried out. A test bench qualification as well as varying temperature-SoC starting conditions analogue to Figure 17 will be carried out.
4. Conclusions
This work investigated the reactivity of a mass-produced pouch cell and derived a test bench setup for the study of repeatability of Thermal Propagation of a small module. Comparing two possible nail penetration directions in single cell testing, cells only showed a significant reaction when triggered parallel to the electrode layers. Cells without cycling were tested against cycled cells, where cycled cells displayed significant reactivity with higher temperatures in comparison to limited heat release of uncycled cells. For starting temperatures of it was determined, that a cell at SoC will lead to temperatures, which allows for a TP process to be initiated - this was verified using an ARC.
Transferring single cell testing results to the test bench, a two-factor Design of Experiment was created, with SoC ranging from to and temperatures from to . The lower expected reactivity combinations of point A ( at ), point B ( at ) and point C ( at ) were tested and will lead to a TP.
The test bench houses a cell module with temperature sensors between all cells to monitor the TP process. A middle cell is triggered and leads to the start of the propagation. Two tests were carried out, one with an initial air filled test bench and one with an initial nitrogen filled test bench. A thermal runaway of a cell is detected, if the attached temperature sensor measures a temperature increase of 2 K/s. Comparing the resulting propagation times of air and nitrogen yield similar results. The choice of initial gas in the test bench is not of statistical importance. Further qualification of the test bench needs be carried out as well as the proposed DoE with temperature/SoC variations.
Author Contributions
Conceptualization, B.M., J.S. and K.P.B.; methodology, B.M.; software, B.M. and J.S.; investigation, B.M. and J.S.; resources, B.M.; data curation, B.M.; writing—original draft preparation, B.M.; writing—review and editing, B.M.; visualization, B.M. and J.S.; supervision, B.M., J.S. and K.P.B.; project administration, B.M. All authors have read and agreed to the published version of the manuscript.
Funding
This publication was funded by the German Research Foundation (DFG) grant “Open Access Publication Funding/2023–2024/University of Stuttgart” (512689491). The experiments and materials were financed by Mercedes-Benz.
Institutional Review Board Statement
Not applicable.
Informed Consent Statement
Not applicable.
Data Availability Statement
Not applicable.
Acknowledgments
Anja Talke for her cooperation designing the TP test plan and test bench. Jochen Bandlow for his knowledge of process optimization and statistical analysis
Conflicts of Interest
The authors declare no conflict of interest.
Abbreviations
The following abbreviations are used in this manuscript:
| ARC | Accelerating Rate Calorimetry |
| BoL | Begin of Life |
| CAD | Computer Aided Design |
| CO2 | Carbon Dioxide |
| HWS | Heat-Wait-Seek |
| NMC | Nickel Manganese Cobalt |
| SoC | State of Charge |
| TP | Thermal Propagation |
| TR | Thermal Runaway |
References
- Elgowainy, A.; Burnham, A.; Wang, M.; Molburg, J.; Rousseau, A. Well-to-wheels energy use and greenhouse gas emissions of plug-in hybrid electric vehicles. SAE Int. J. Fuels Lubr. 2009, 2, 627–644. [Google Scholar] [CrossRef]
- Exclusive: Global Carmakers Now Target $515 billion for EVs, Batteries. Available online: https://www.reuters.com/business/autos-transportation/exclusive-global-carmakers-now-target-515-billion-evs-batteries-2021-11-10/ (accessed on 1 June 2023).
- Sun, P.; Bisschop, R.; Niu, H.; Huang, X.T. A Review of Battery Fires in Electric Vehicles. Fire Technol. 2008, 10, 1361–1410. [Google Scholar] [CrossRef]
- Global Technical Regulation on the Electric Vehicle Safety (EVS). Available online: https://unece.org/fileadmin/DAM/trans/main/wp29/wp29wgs/wp29gen/wp29registry/ECE-TRANS-180a20e.pdf (accessed on 1 June 2023).
- GB 38301-2020. Available online: https://www.chinesestandard.net/PDFExample/GB38031-2020EN.pdf (accessed on 1 June 2023).
- Koch, S.; Birke, K.; Kuhn, R. Fast Thermal Runaway Detection for Lithium-Ion Cells in Large Scale Traction Batteries. Batteriesn 2018, 4, 16. [Google Scholar] [CrossRef]
- Kwon, B.; Cui, W.; Kannan, P.; Compton, C.; Liao, Y.-T.; Takahashi, F.; Jeevarajan, J.; Juarez-Robles, D.; Parhizi, M. Fire Characterization and Gas Analysis of Lithium-Ion Batteries During Thermal Runaway. In Proceedings of the 51st International Conference on Environmental Systems, Saint Paul, MN, USA, 10 July 2022. [Google Scholar]
- Ouyang, D.; Liu, J.; Chen, M.; Weng, J.; Wang, J. Thermal failure propagation in lithium-ion battery modules with various shapes. Appl. Sci. 2018, 8, 1263. [Google Scholar] [CrossRef]
- Essl, C.; Golubkov, A.W.; Fuchs, A.T. Comparing Different Thermal Runaway Triggers for Two Automotive Lithium-Ion Battery Cell Types. J. Electrochem. Soc. 2020, 167, 130542. [Google Scholar] [CrossRef]
- Tang, X.; Zhang, G.; Wang, X.; Wei, G.; Han, G.; Zhu, J.; Wei, X.; Dai, H. Investigating the critical characteristics of thermal runaway process for LiFePO4/graphite batteries by a ceased segmented method. iScience 2021, 24, 103088. [Google Scholar] [CrossRef] [PubMed]
- Accelerating Rate Calorimeter (ARC) Brochure. Available online: https://www.thermalhazardtechnology.com/contentfiles/downloads/38.pdf (accessed on 1 June 2023).


Disclaimer/Publisher’s Note: The statements, opinions and data contained in all publications are solely those of the individual author(s) and contributor(s) and not of MDPI and/or the editor(s). MDPI and/or the editor(s) disclaim responsibility for any injury to people or property resulting from any ideas, methods, instructions or products referred to in the content. |
© 2023 by the authors. Licensee MDPI, Basel, Switzerland. This article is an open access article distributed under the terms and conditions of the Creative Commons Attribution (CC BY) license (https://creativecommons.org/licenses/by/4.0/).