Abstract
The sustainability of coastal environments is becoming a major issue in the face of constantly changing urban populations correlated with anthropogenic activities. As a result, in-depth knowledge is needed to assess the vulnerability of coastal areas in African cities faced with a profusion of solid waste. In Libreville and Lomé, the aim of the study was to carry out a systematic inventory of coastal macrowaste, and to break down and characterize the data collected at 12 sites and 6 sites, respectively. The methodological approach adopted combines documentary research, direct observations and characterization using the MODECOM tool (household waste characterization method) to reveal the widespread presence of macrowaste in the coastal areas of the two towns. With regard to the MODECOM method, the study is based specifically on the sorting of materials according to three granulometric fractions: >100 mm, between 20 and 100 mm, and <20 mm. In addition to the dimensions of the objects, the classification of solid waste according to its nature enabled thirteen (13) categories of macrowaste to be generated. The results show that the quantity of macrowaste inventoried in Libreville was 654.21 kg, while in Lomé the weight of waste collected was 510 kg. On the whole, the proliferation of solid waste is due to physical factors and human activities, especially economic activities and recreational activities, which increase the rate of production. In terms of sustainable material management, the results point to a prosperous future for the biodegradable, non-biodegradable and inert waste streams.
1. Introduction
Waste production is intrinsically linked to human activity. As a result of population growth, followed by economic growth, changes in consumption habits, urbanization and industrialization, waste management is a major global concern, as the basic social services required for urban life are limited [1]. According to the World Bank, more than half the world’s population currently has no access to a household waste disposal service, resulting in the use of illegal and unregulated landfills by some 4 billion people [2]. Indeed, this situation continues to be a challenge for urban areas around the world, and particularly for the fast-growing cities of the developing world. Africa’s urban population is growing at an annual rate of 3.58%, the highest in the world, and is set to increase from 1.276 billion to 2.5 billion between 2018 and 2050 [3]. Given this growth, annual waste generated in sub-Saharan Africa could triple from 174 to 516 million tons between 2016 and 2050. To date, in these African territories, the waste collection rate is estimated at less than 55%, and the rest of the waste is dumped in the wild. In addition, the recycling rate remains low due to the absence of sorting, intermediate treatment and inappropriate final disposal, which threatens urban sanitation and human health [3]. In African cities, solid waste evacuation and disposal is becoming a public issue around which a variety of players are rallying [4], pointing to a major challenge for urban managers, particularly those in southern countries where effective and efficient management is still lacking in urban centers. This complexity in waste management leads to an upsurge in solid waste. If it is not resolved immediately, the impact on coastal areas will continue to grow, and by 2025, it is estimated that the amount of waste will have risen to 45% [5,6]. Thus, effective solid waste management in coastal areas should be a priority for cities in developing countries [7,8]. With the recent development of the topic and the lack of data regarding the problem of coastal waste in the local area, the characterization of macrowaste is essential, as it will provide real data useful to decision-makers about waste management on the coast, the organization of collection and modes of waste treatment [9], hence the importance of managing solid waste to reduce environmental damage [10]. This study highlights the shortcomings of quantitative and qualitative solid waste inventory approaches. These shortcomings are due to the lack of specific long-term studies. In the process of making waste collection efficient, the local policies of the cities of Libreville and Lomé have set up waste management systems that remain insufficient and limited given the population growth.
Like other African coastal cities, the coastal towns of Libreville and Lomé are faced with limited solid waste management. According to Gerep-environnement quoted in [11], waste generated in the Libreville conurbation is subject to inadequate collection services. Solid waste is only partially collected, despite its increase over the years. In 2011, the collection rate was 224,768 tonnes/year, rising to 441,588 tonnes/year by 2021, and by 2035, projections foresee 906,800 tonnes/year. This represents a daily production of 616 tonnes in 2011, possibly rising to 2484 tonnes by 2035. These figures reveal the irregularity of waste collection and the inadequacy of waste collection, sorting and treatment services in the city [12]. This practice does not spare the estuary coastline, which suffers from insalubrity despite the determination of public and private services to find solutions to protect the environment. The context is similar for the Greater Lomé area. Each inhabitant produces an average of 0.6 kg of waste per day and emits 350,340 tonnes of household waste per year. Of this amount, 89,428 tonnes is collected and landfilled, representing a rate of 29.29%. A tiny proportion, 9000 tonnes, or 2.95%, is recycled as compost by associations and/or NGOs, while the rest is scattered in the countryside without treatment [13,14]. Given the shortcomings observed in the two towns, the system of pre-collection, collection, sorting and processing is inadequate, and the towns languish in insalubrity, with a knock-on effect in coastal areas [15]. As a result of human activity, the waste found on the coast is no longer rubbish to be destroyed, disposed of or buried, but rather a material to be put to good use, in order to give it a second life and reduce the proliferation of waste in nature. It is a problem that needs the ultimate solution. So, when we talk about waste management, we are talking about producing less, then recovering the materials they contain and finally disposing of them in an environmentally safe way. With this in mind, this study highlights the importance of characterizing all the parameters relating to the physical characteristics of macrowaste. Previous studies show that the notion of macrowaste has several classifications that define its concept. Firstly, it is based on the types of constituent materials (plastic, glass, metals, wood, textiles, paper, etc.); secondly, the activities that generate waste, e.g., fishing waste, recreational waste, etc.; and finally, the possible fate of waste in terms of recoverable or non-recoverable materials [16]. Other authors, such as [17,18], use the criterion of classification by diameter to define macrowaste. They define mega waste as having a diameter greater than 100 mm, macrowaste as having a diameter greater than 20 mm, meso-waste as having a diameter greater than 20 mm and between 5 and 20 mm, and microwaste as having a size of less than 5 mm. Furthermore, the United Nations Environment Program referred to by the author [19] specifies that macrowaste is waste visible to the naked eye, from which should be excluded elements of natural origin not transformed by man. In the context of this study, macrowaste is man-made detritus (plastic, aluminum, glass, paper, textiles, etc.) visible to the naked eye, ranging in size from a few millimeters to several meters in areas of high human activity, especially on the coast [20,21]. So, for a little over two decades, the mobilized approach to waste characterization has been the MODECOM approach, which is precisely described in the French AFNOR standard [22]. This approach is commonly used to characterize household solid waste, determining its composition by category and size. Work carried out in Cameroon by [23,24] have routinely used this method to characterize waste deposits. It was also the subject of work by [25] in Mauritania, focusing on the socio-economic context. And recently, in Togo, the work of [26,27] highlighted this method for composting waste and optimizing waste management. In Gabon, on the other hand, the problem of waste management remains a general one, and only aspects relating to waste flows, regulatory frameworks and management policies, and equipment provisions are developed in scientific research. To this end, the application of MODECOM methods to the characterization of coastal waste in the cities of Libreville and Lomé is essential. To date, reliable data for assessing the quality of macrowaste pollution in the cities under study are scarce. This study is therefore the answer to the potential for recovery of materials found in coastal areas, insofar as it will enable decision-makers in the cities of Libreville and Lomé to optimize the choice of treatment in order to minimize environmental risks directly linked to human health [28,29]. This will enable us to recommend an appropriate treatment system and suitable recovery mainly for materials composed of biodegradable, non-biodegradable and inert waste fractions. The aim is to contribute to the reduction in waste proliferation through qualitative and quantitative knowledge of macrowaste in the coastal cities of Libreville and Lomé. Specifically, the aim is to (i) characterize macrowaste by size, (ii) carry out a comparative analysis of macrowaste by type at the sites under study, and (iii) define the distribution of waste by proposing strategies based on management methods. To achieve these objectives, we formulate the following hypotheses: (i) The vulnerability of the coastal zones of Libreville and Lomé is specific to human activities, urban growth and local domestic habits. (ii) The quantitative and qualitative composition of coastal macrowaste is influenced by the inadequacy of waste management infrastructures in the cities of Libreville and Lomé. (iii) Optimizing the choice of waste treatment is possible thanks to knowledge of materials to significantly reduce the accumulation of waste in coastal areas.
2. Results
The diagnosis of macrowaste in Libreville and Lomé reveals a dysfunctional public service, as municipalities lack operational capacity and only partially manage urban waste. The comparative analysis of the results has led to a number of interpretations, which help to draw powerful conclusions from a quantitative and qualitative point of view. In these coastal cities, three main criteria common to the conurbations of Libreville and Lomé were addressed, namely, analysis of macrowaste according to size, categorization of materials according to type, and distribution of said waste with reference to the recommended management method.
2.1. Comparison of Macrowaste by Size
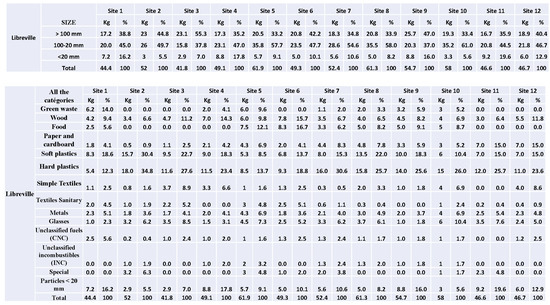
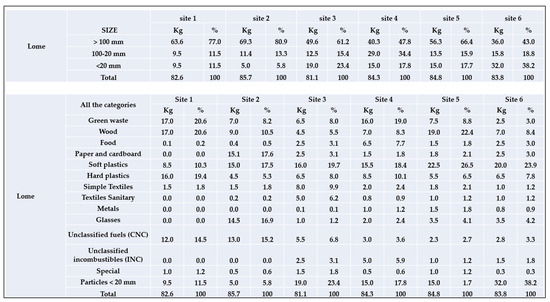
Sorting by size reveals an unequal predominance of macrowaste in the coastal cities. Lomé has a rate of 62.7% for large waste (>100 mm), while Libreville has a lower rate of 39.6%. On the other hand, Libreville has the edge when it comes to materials between 100 and 20 mm in size, with a rate of 48.9% compared with 18.2% of waste collected in Lomé. For the final category of waste (size < 20 mm), Lomé has a higher rate, at 19.1%, compared with 11.6% in Libreville. In light of the above, we can see that waste produced in Lomé dominates two of the three categories used in the size typology (Figure 1).
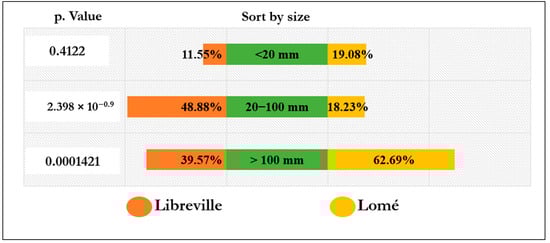
Figure 1.
Comparative analysis of size sorting on all the sites studied. Source: compiled by the authors from field data.
According to Student’s T-test, there was a significant difference (p-value = 0.0001421 < 0.05) between the larger sizes (>100 mm) in Lomé and Libreville. Then, the sizes in the range of (100–20 mm) in our study area reveal a significant difference (p-value = 2.398 × 10−0.9 < 0.05), and finally, a significant difference (p-value = 0.04122 < 0.05) between waste sizes below (20 mm). The composition of waste depends on the daily activities and local consumption habits of each geographical area.
2.2. Comparative Analysis by Category of Macrowaste Collected per Site
This section presents the 13 categories that have been selected to describe proportionally the trends in macrowaste collected at all the sites studied (Table 1).

Table 1.
Nomenclature of waste categories. Sources: Compiled by the authors from references [30] and field data.
Categorization of Coastal Macrowaste in Libreville and Lomé
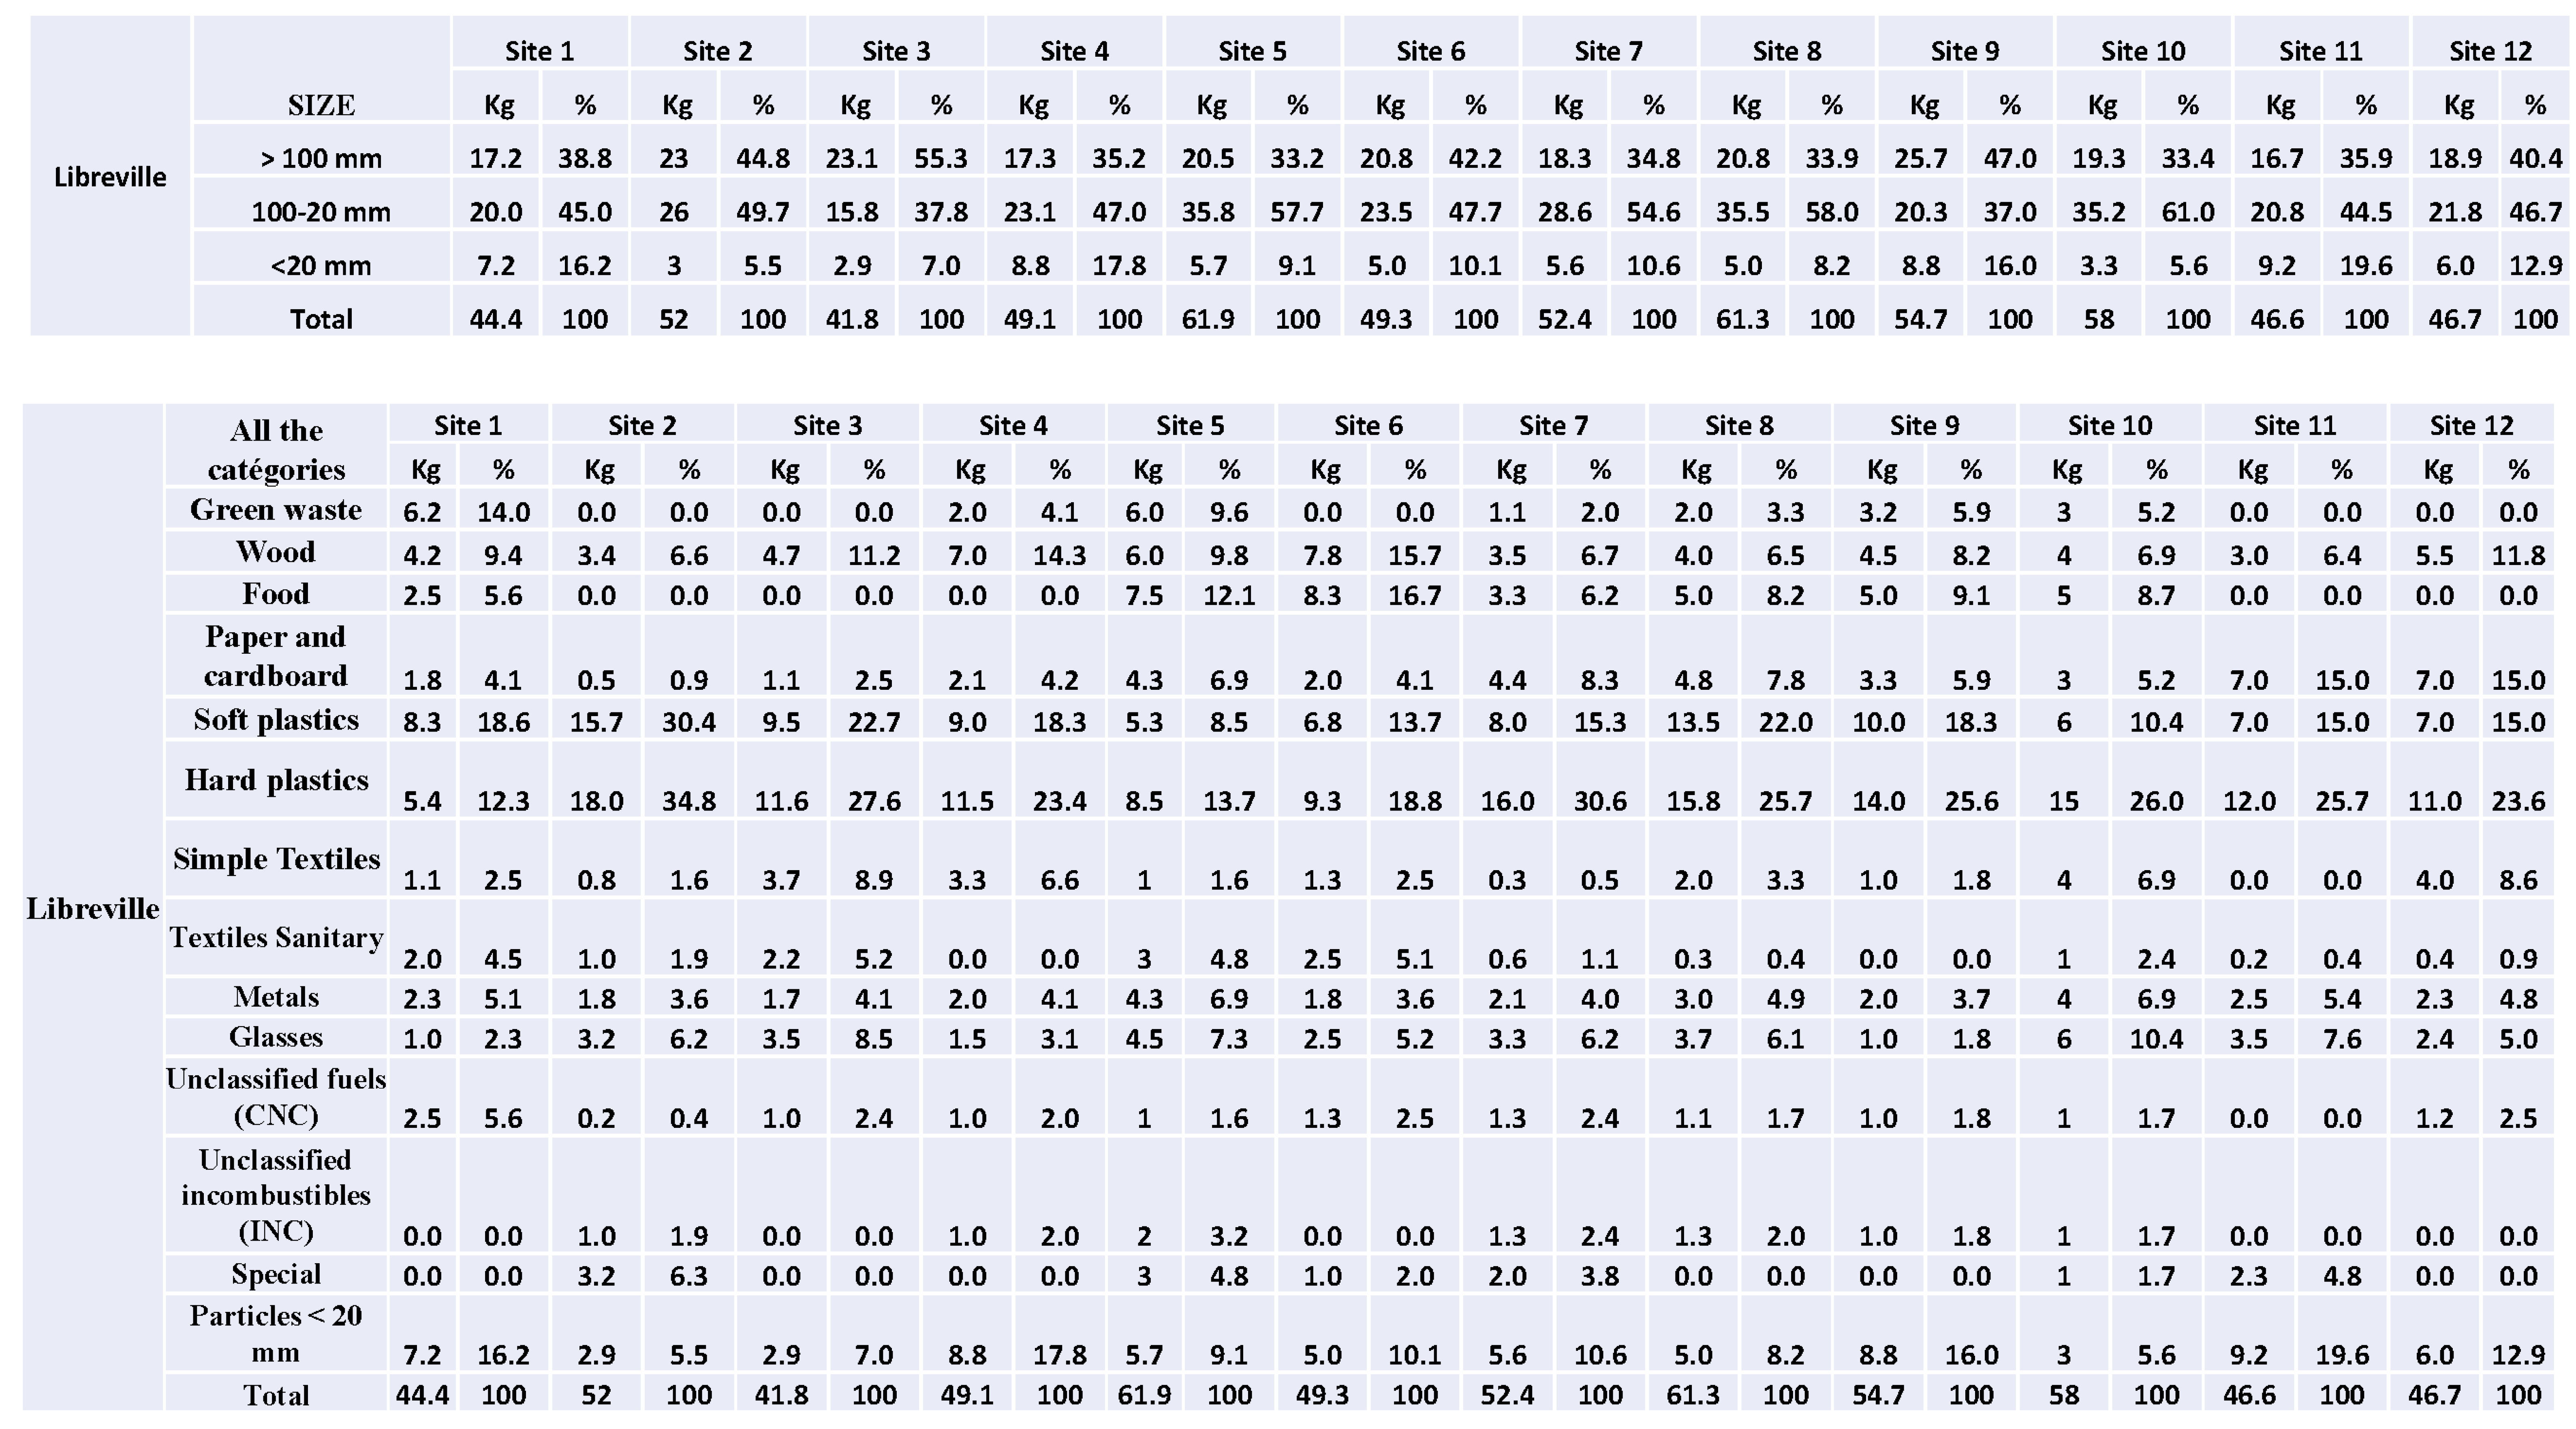
In our study, the distribution of waste proportions by type and by site in the Libreville conurbation is represented by Figure 2 in Appendix A, Figure A1.
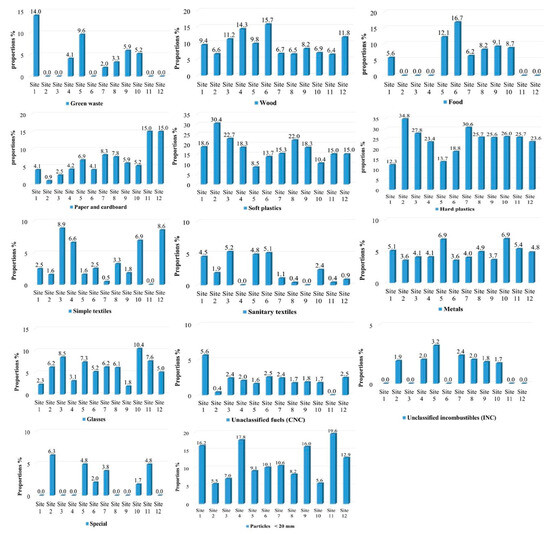
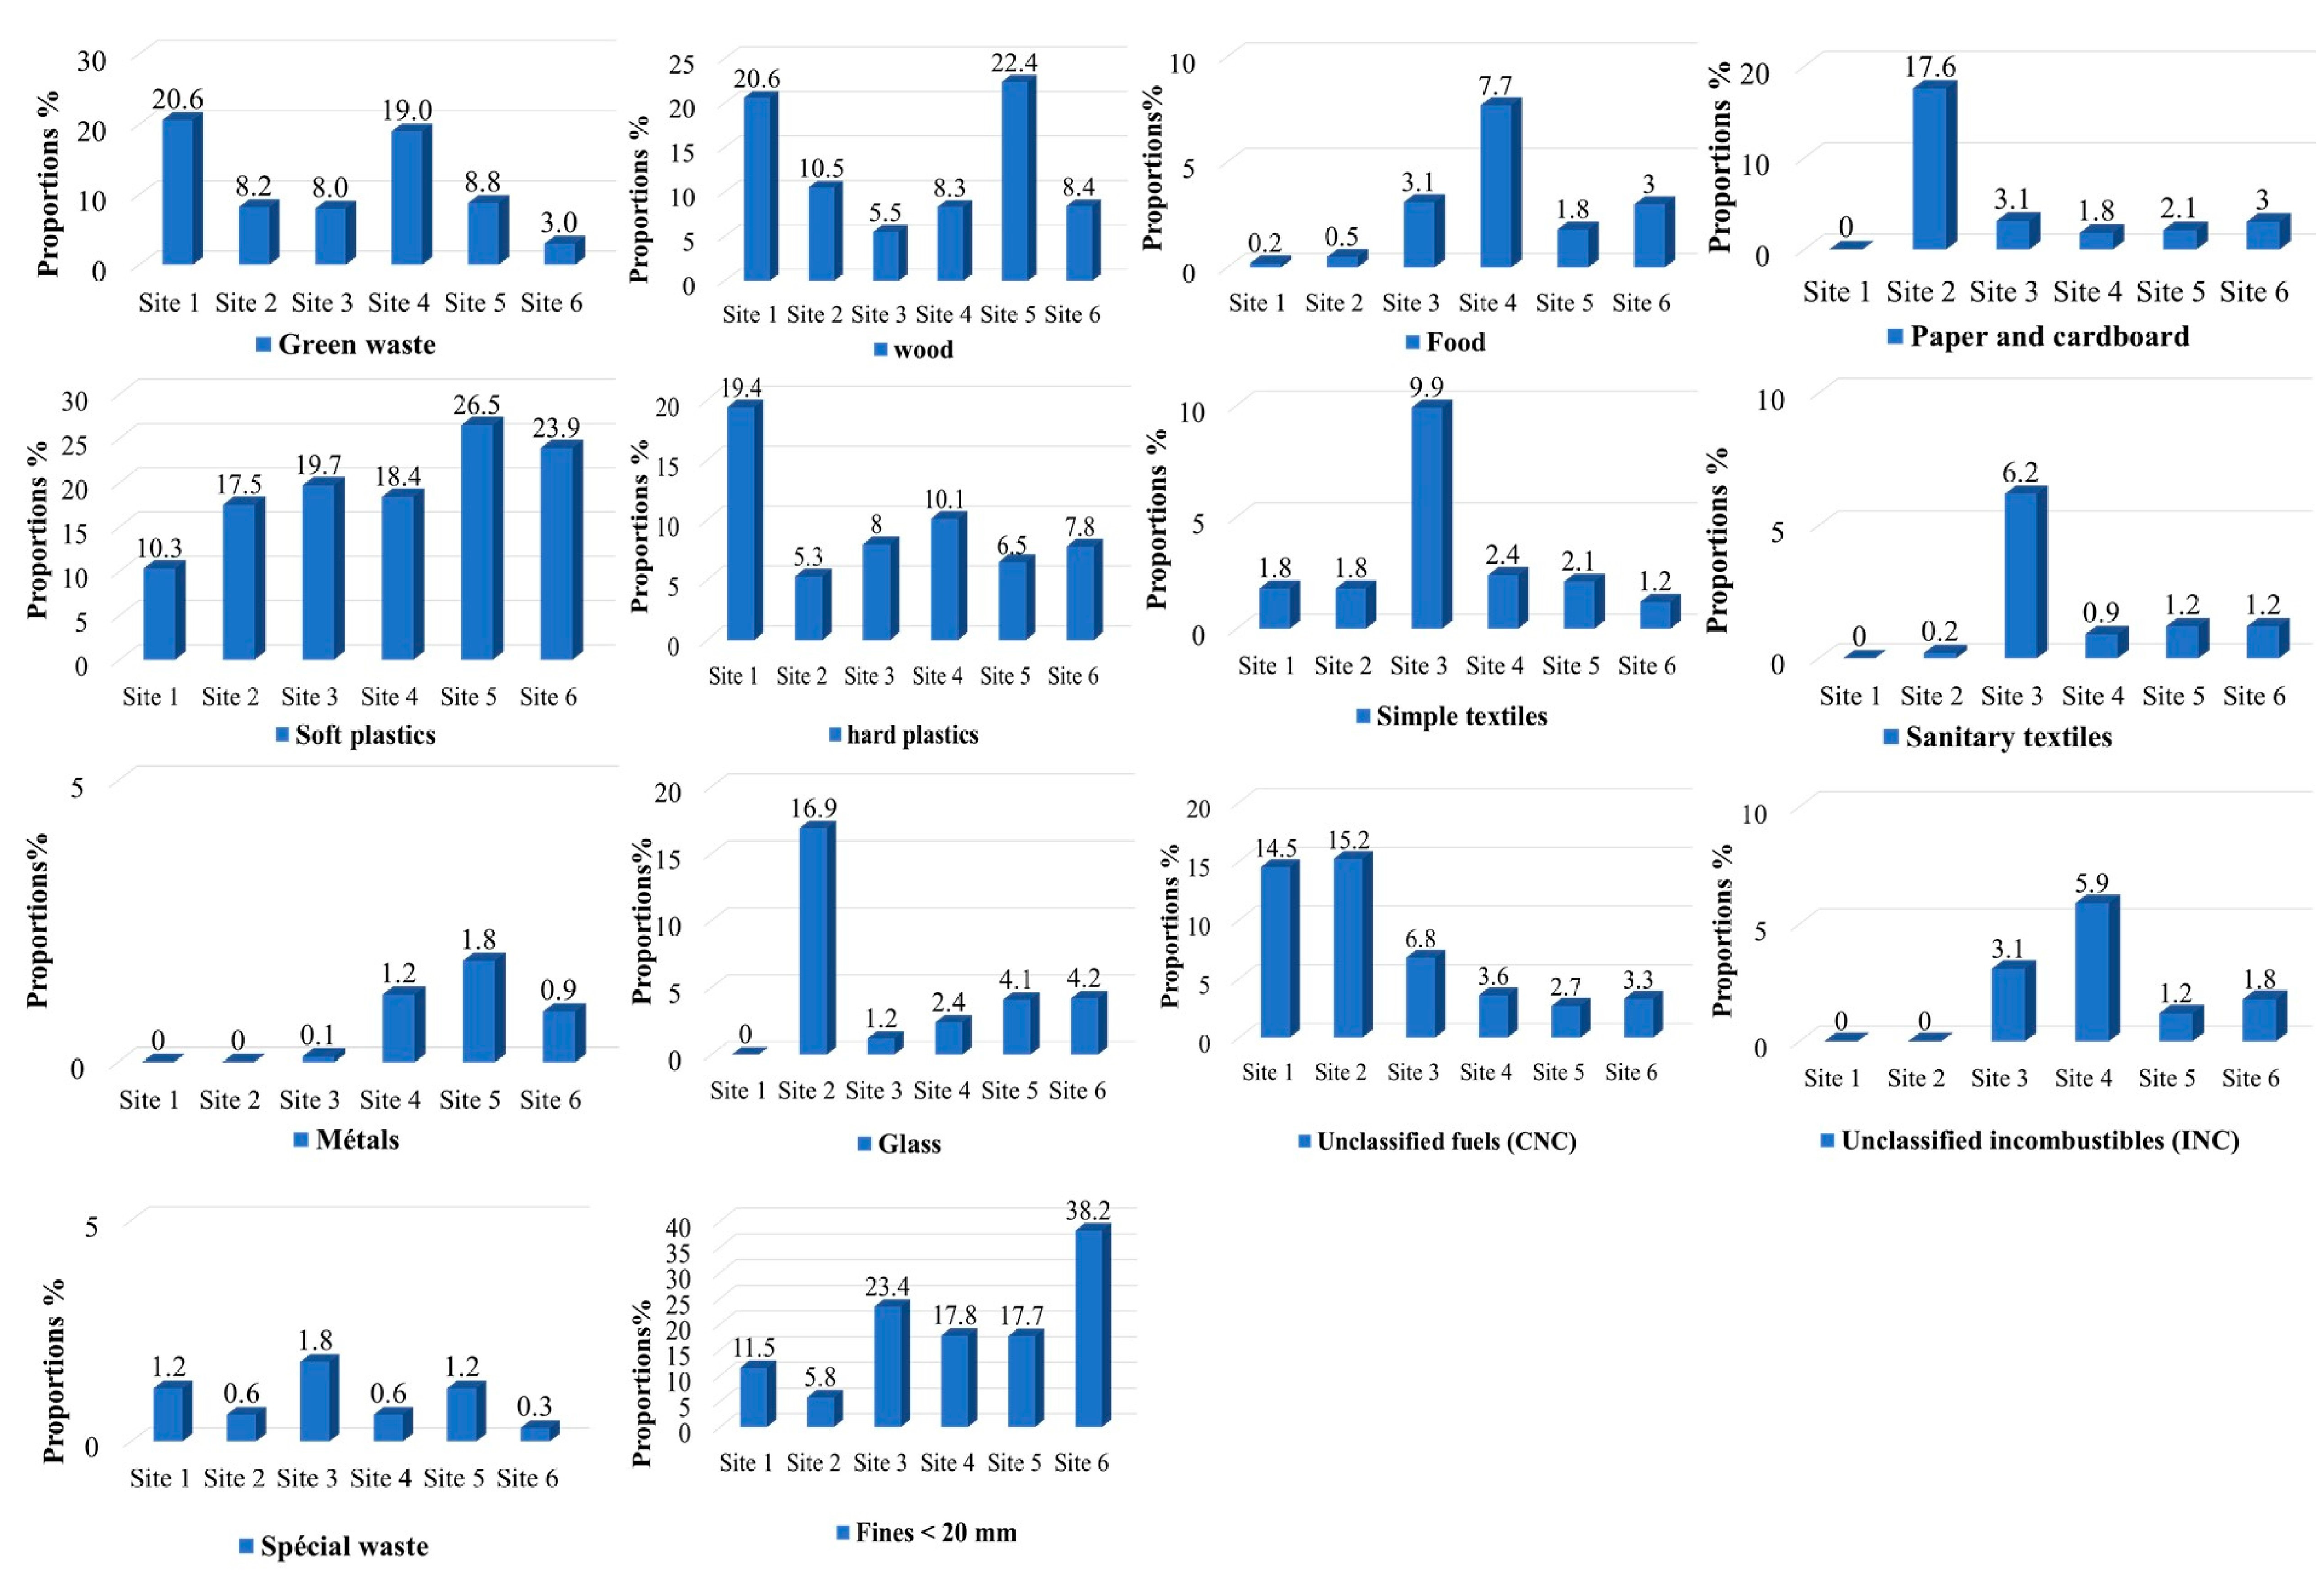
Figure 2.
Proportions of different categories of waste collected along the coastline of Greater Libreville. Source: compiled by the authors from field data.
Of all the green waste, site 1 dominates with a rate of (14%), followed by site 5, which has a rate of (9.6%). For the remaining sites, the values are below 6%. The data for wood waste are different. With a rate of (15.7%), site 6 has the highest value for wood macrowaste, while site 11 has the lowest rate (6.4%). The positioning of site 6 can be explained by the role played by the river Gué-Gué and its tributaries in collecting waste from upstream neighborhoods, which they then drain. This is also an area of high seaside activity, particularly at the Lycée National Léon MBA beach. Similarly, a high proportion of food waste is found at sites 6 (16.7%) and 5 (12.1%). In these areas, it is common to observe lively recreational activities, along with a variety of commercial establishments (restaurants, bars, retail outlets, etc.). At the other ten sites, waste categorized as “food leftovers” does not exceed 10%. Paper and cardboard predominate at site 11 (15.01%). This predominance can be explained by the development of industrial activities, where cardboard is the preferred packaging.
Now let us look at soft plastic waste, mainly from packaging products. Site 2 leads the way in this category of waste, with a rate of (30.4%), while the lowest rate is found in site 5 (8.5%). These results help us to understand, for example, the profusion of plastic linked to the eating habits of city dwellers. Plastic is used almost systematically as packaging by customers for any purchase (at the shopping center or street sale), regardless of the quantity or nature of the product. As well as soft plastic waste, hard plastic waste is also a recurrent part of consumer habits. Hard plastic waste accounts for (34.8%) at site 2, while sites 7 and 10 have similar proportions, at (30.6%) and (26.0%), respectively. The dominance of hard plastic is explained by the strong presence of mineral water bottles. In Greater Libreville, the abundance of hard plastics is also attributable to the mass marketing of kitchen utensils and furniture accessories in general, products accessible to all pockets and/or social strata. In addition, waste from simple textiles and sanitaryware is high at site 3 with values of (8.9%) and (5.2%), respectively. This can be explained by the close proximity between the neighborhood and the coastline, where domestic waste is most prevalent. Metal waste is most prevalent at sites 5 and 10 (6.9%), while the rest of the sites do not exceed 5%. Similarly, glass waste is only present in large quantities at site 10 (10.4%) and in small quantities at site 9 (1.8%). Unclassified combustible waste (CNC) is dominant at site 1 (5.6%), while at the other sites, it is less than (3%). Non-classified incombustible waste (INC) is more significant at site 5 (3.2%), while at the other sites, it is less than (3%). Special waste is more marked at site 2 with a rate of (6.3%). Finally, the category of fine waste is dominant at site 11 with (19.6%) and site 4 with (17.8%), while the other sites are below (16%).
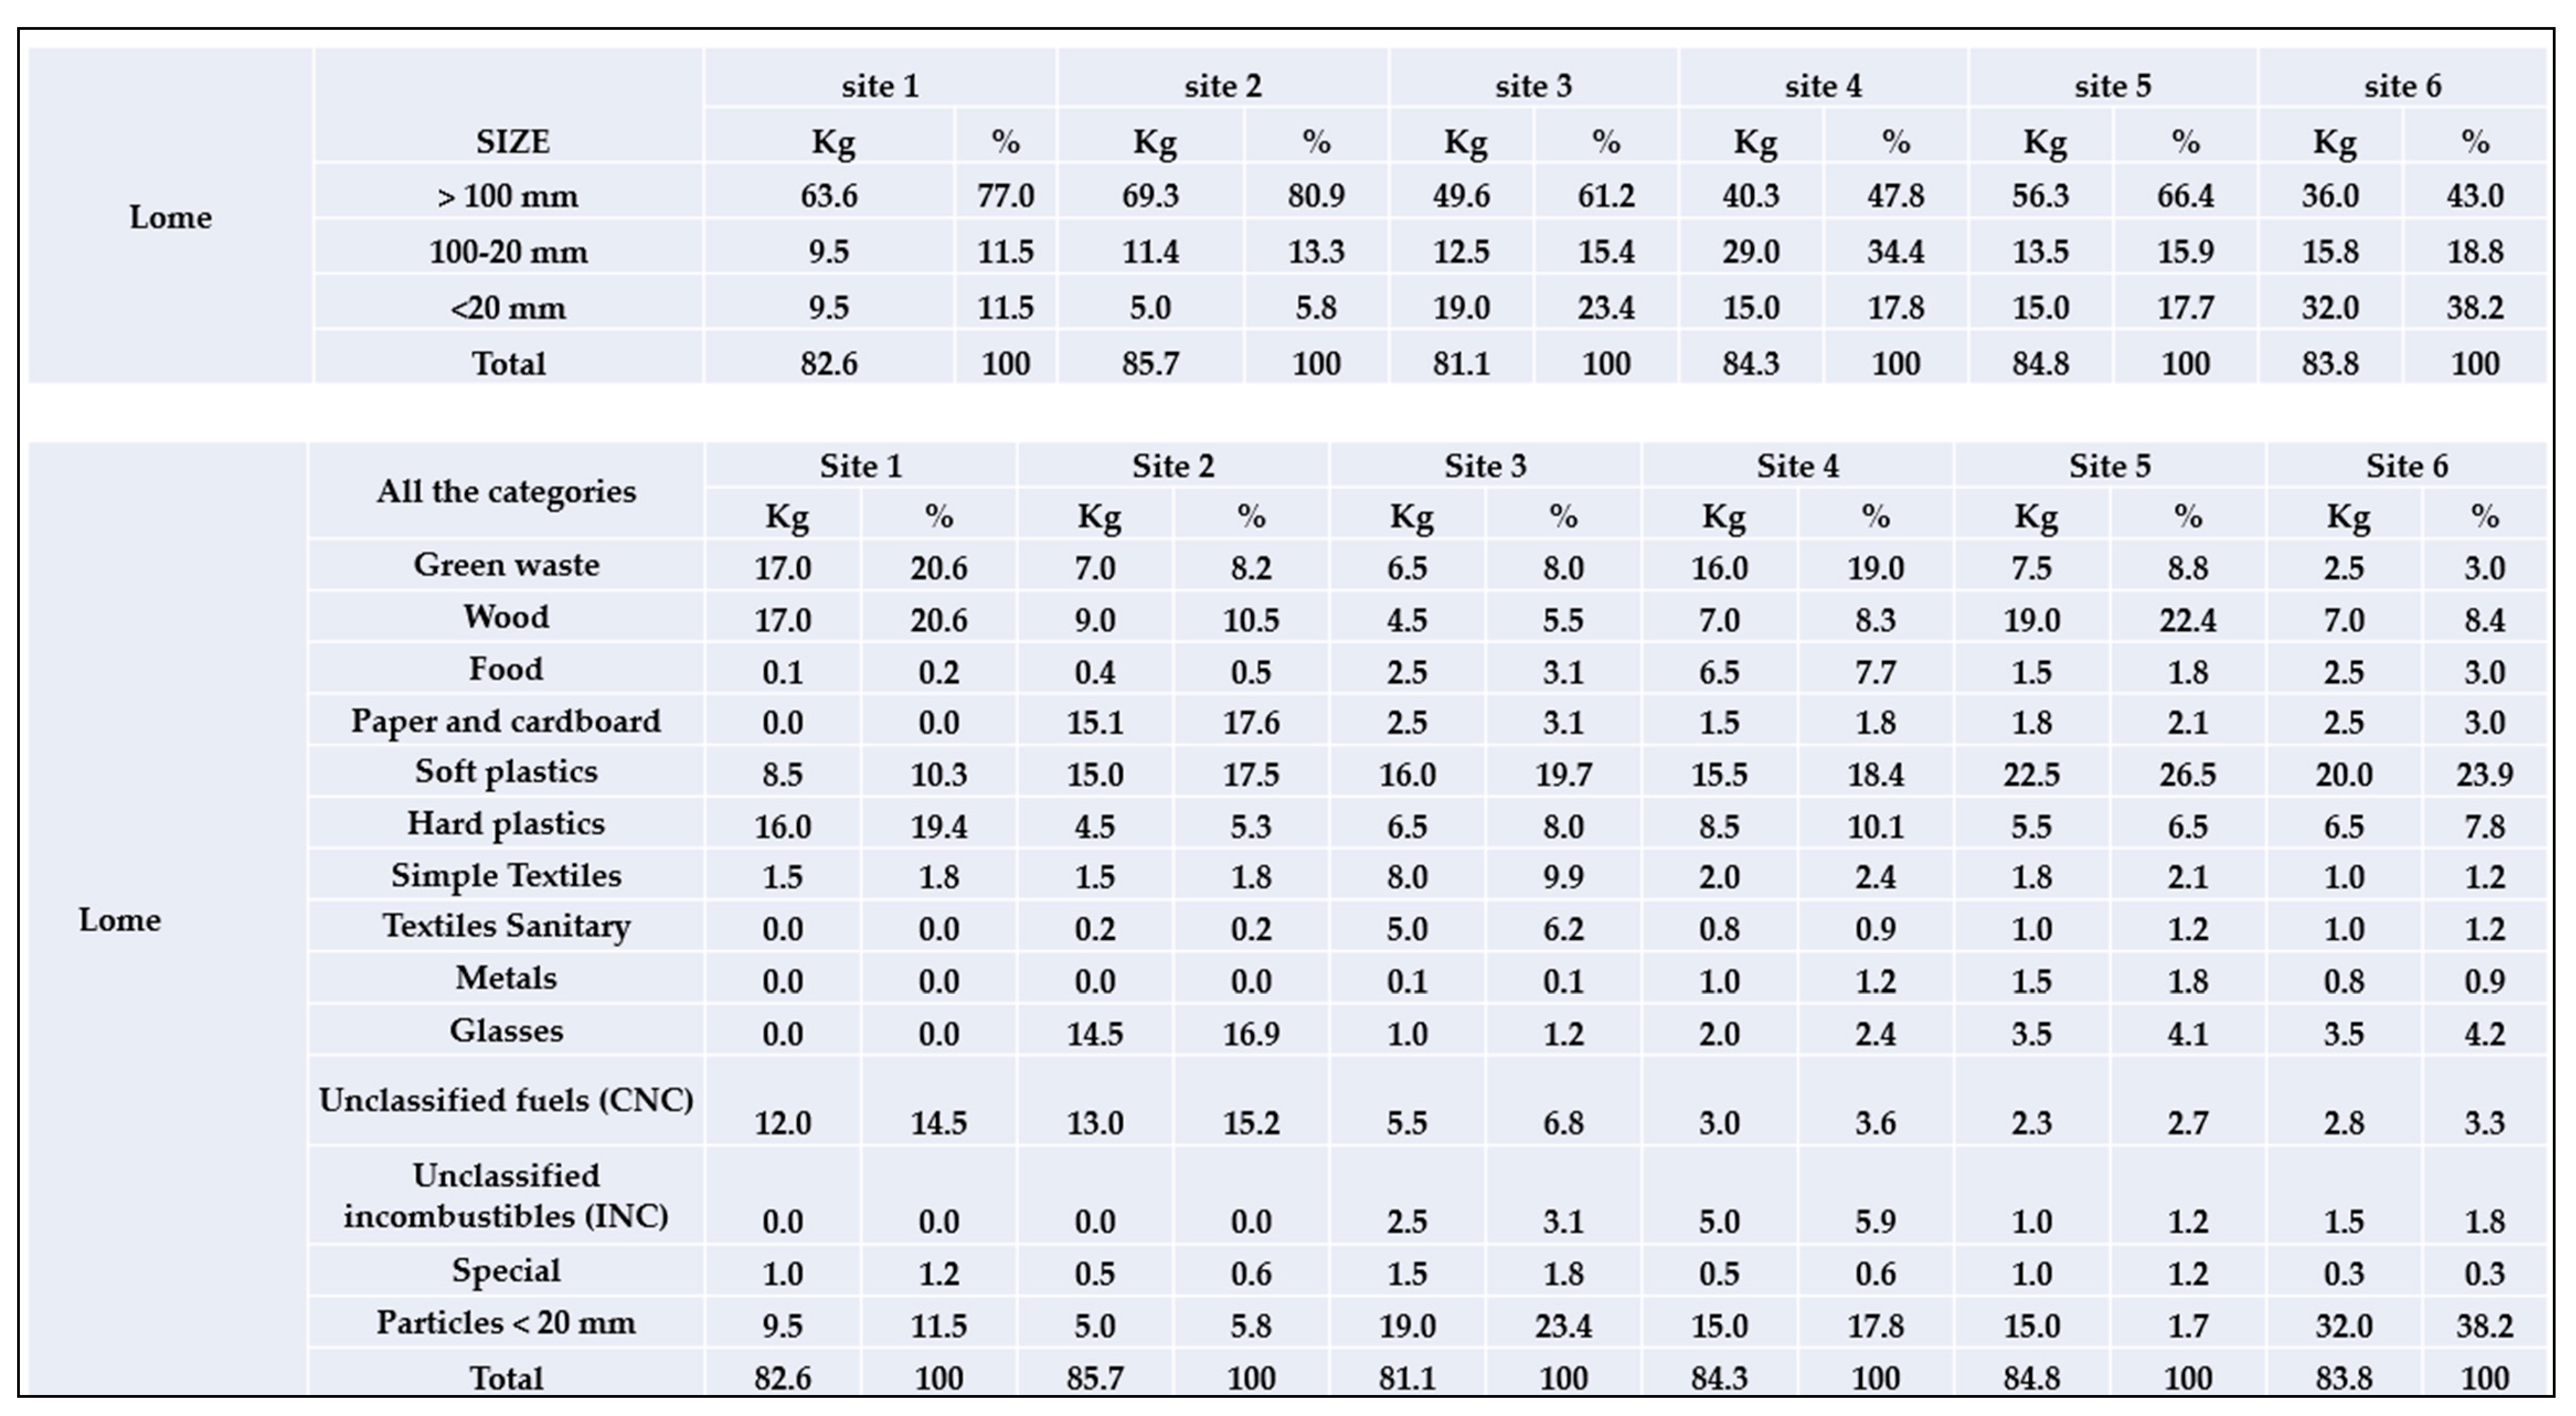
As in Libreville, the categories of waste at the sites collected in the Lomé conurbation are shown in Figure 3 in Appendix A, Figure A2.
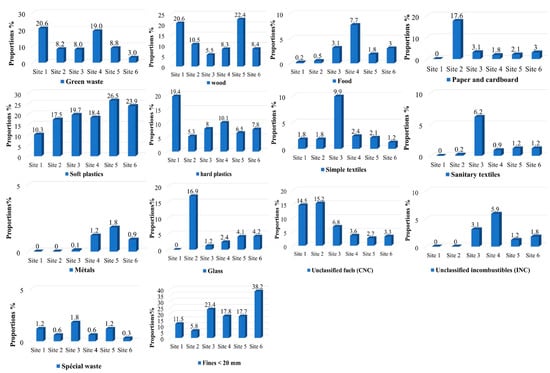
Figure 3.
Typology of waste by site along the coast of Greater Lomé. Source: compiled by the authors from field data.
The first category selected is green waste, dominated by sites 1 and 4 with (20.6%) and (19%), respectively. This rate is thought to be due to market gardening activities and the proliferation of algae on the coast at this time of year. However, site 6 had the lowest rate of green waste (3%) of all the sites studied. Unlike green waste, wood waste has a high rate at site 5 (22.4%). This can be explained by the development of the fishing industry, which includes dugout repair work and fish smoking. Site 3 stands out as having the lowest rate of wood waste (5.5%). With the exception of site 4, which accounted for (7.7%) of food waste, the rest of the sites recorded rates well below (4%). Paper and cardboard waste is exceptionally dominant at site 2 (17.6%), because of the commercial activity at Lomé’s largest market, Asigamé. This generates a lot of cardboard and paper packaging waste, unlike site 1, where there is none. Soft plastic waste is proportionally increasing at all sites (10 to 26.5%), with peaks predominating at site 5 (26.5%), while site 1 has a low proportion (10.3%). This trend explains the diverse and constant use of flexible plastic bags in the local population’s consumption circuit.
Conversely, the category of hard plastic waste is high at site 1 (19.4%), while at the other sites, it is below (10%). With regard to simple textile and sanitary waste, only site 3 has high rates at (9.9%) and (6.2%), respectively. Metal waste is also poorly represented at all sites, with rates of less than 2%. Glass waste collected is highest at site 2 (16.9%), due to the use of breakable bottles produced by recreational activities. Unclassified fuels (CNCs) are more prevalent at sites 2 and 1, at (15.2%) and (14.5%), respectively, influenced by commercial activities and residents living close to the coast. On the other hand, with the exception of site 4, which has a high rate of waste in the unclassified incombustible (INC) category (5.9%), the rest of the sites are less than 3%. Special waste dominates at site 3 (1.8%), while it is low at site 6 (0.3%). Finally, fine waste is more prevalent at site 6 (38.2%) due to the accumulation of sand from the Grand Lomé beach, while site 5 has the lowest proportion (5.8%).
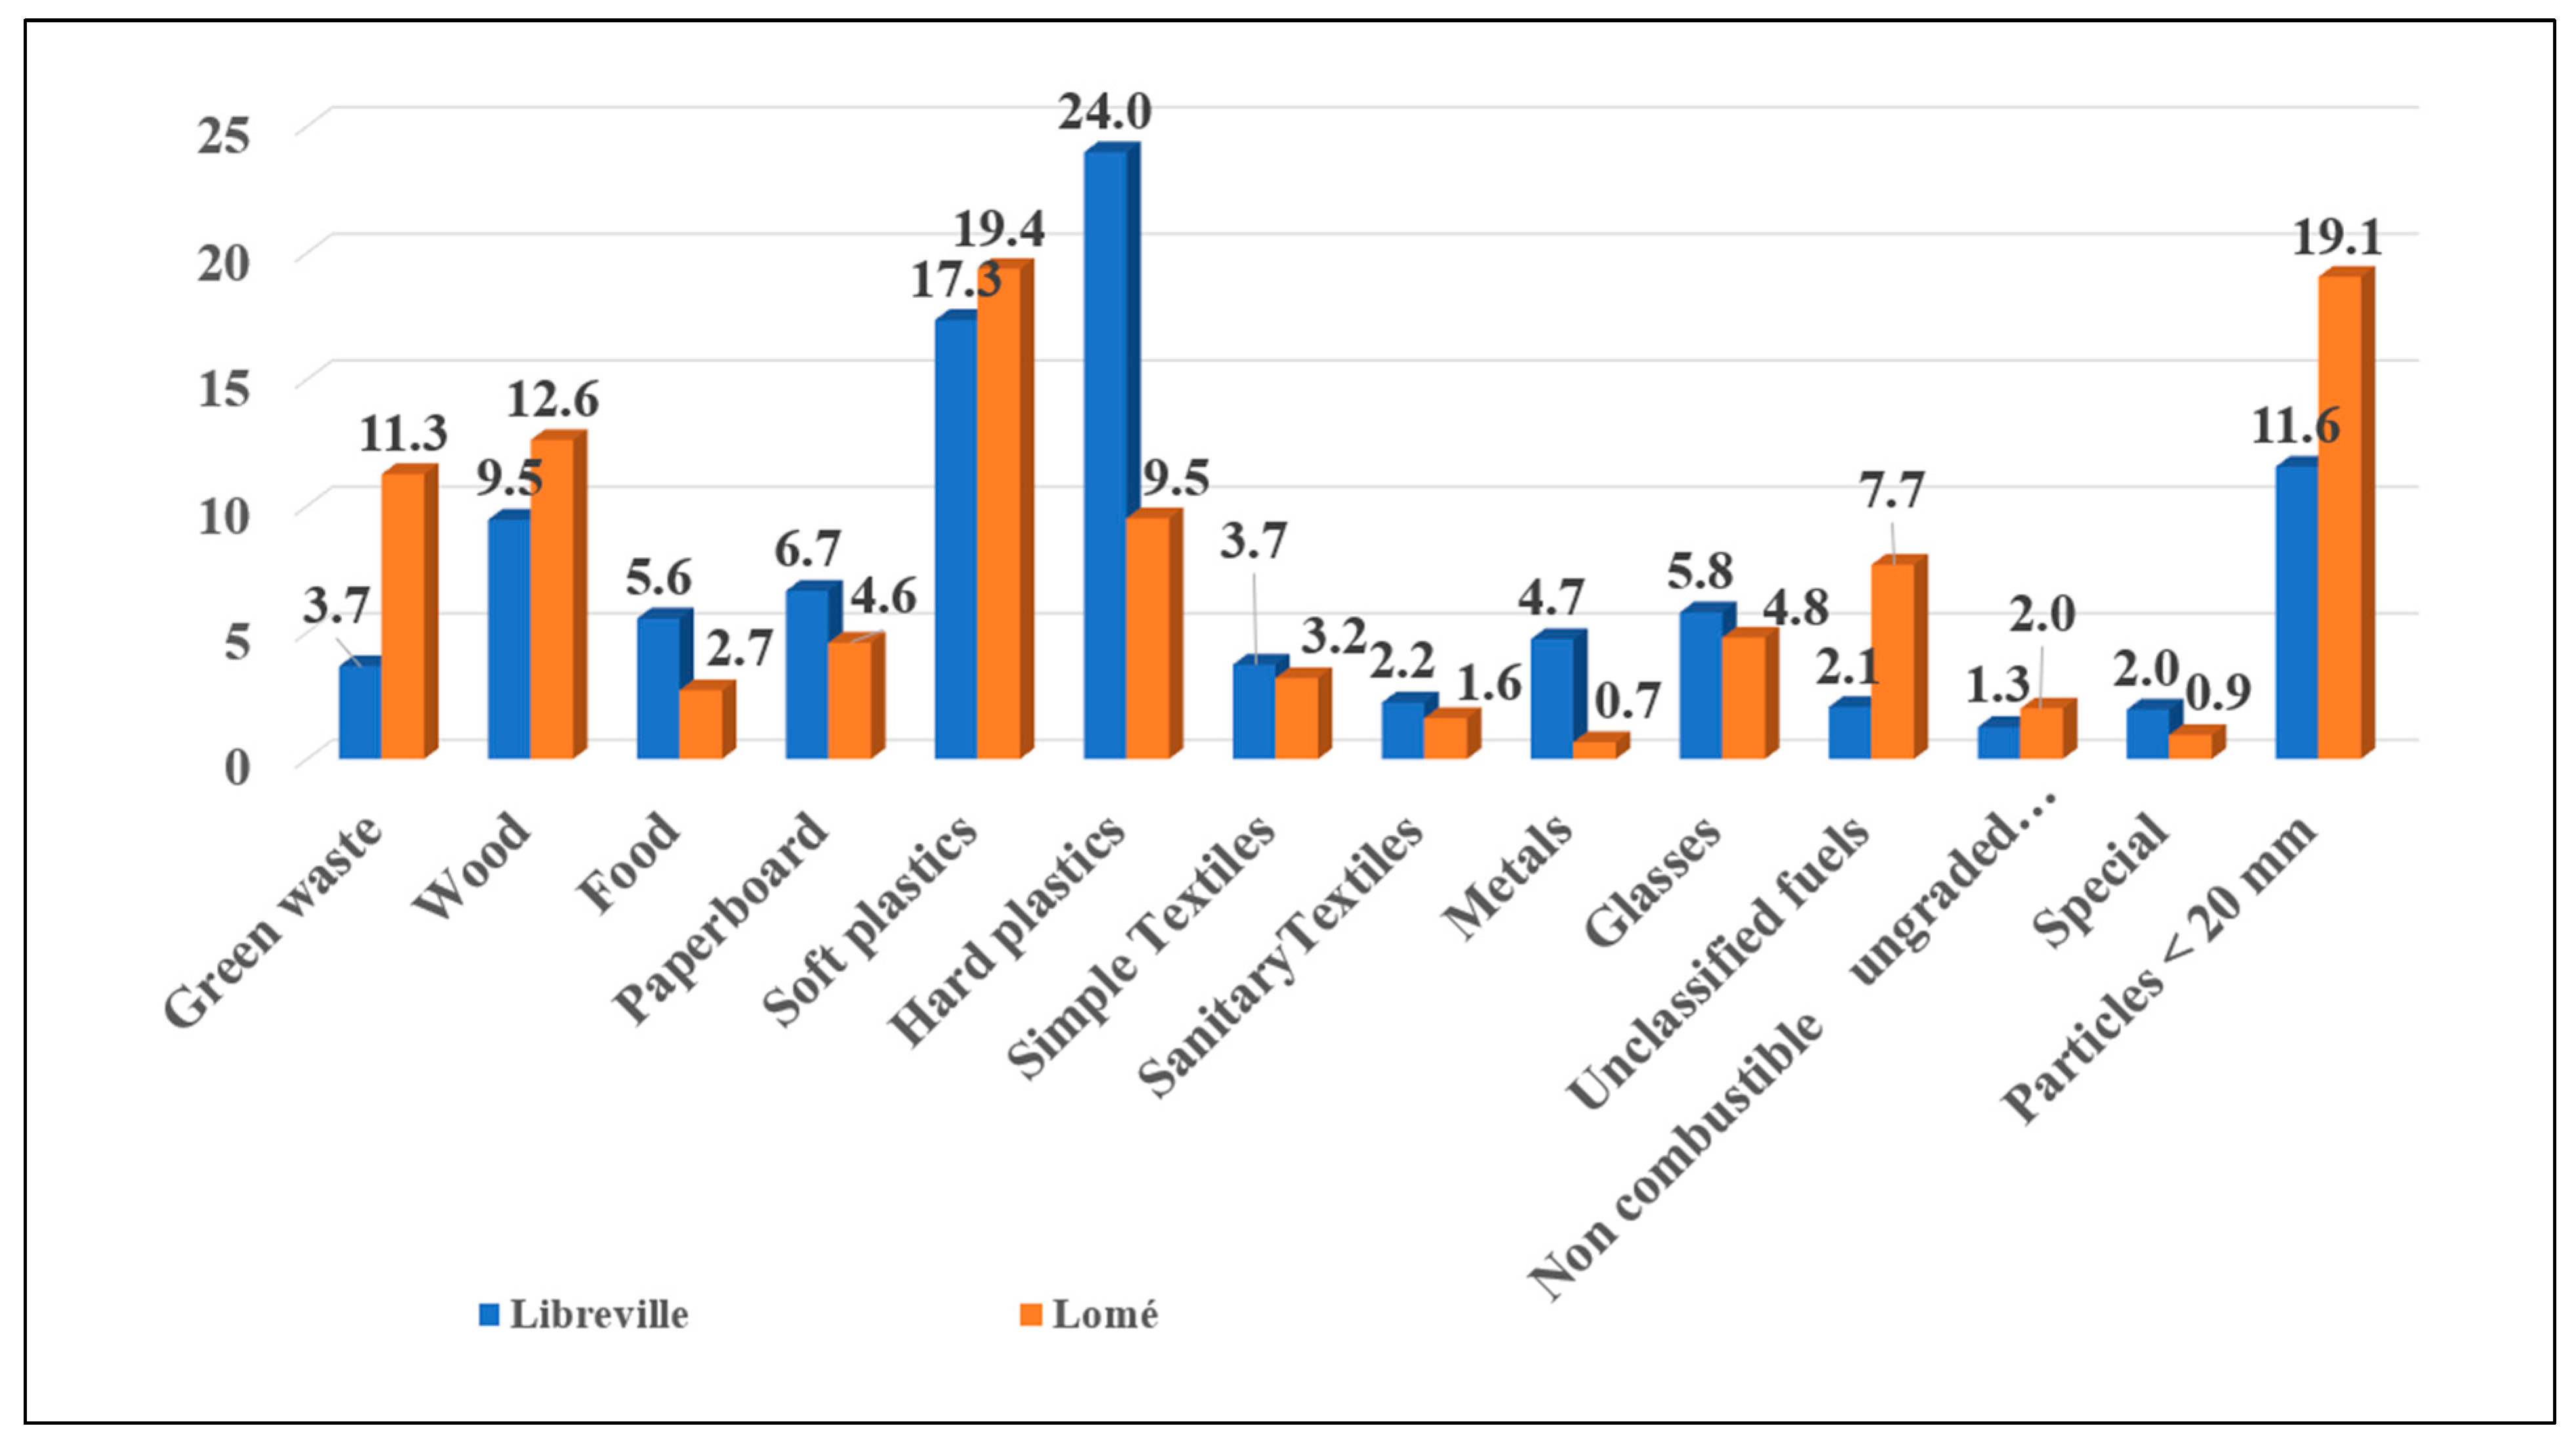
With regard to the sites studied, Figure 4 shows that the coastline of the Libreville conurbation is dominated by hard plastic waste (24.0%), followed by soft plastic waste (17.3%), while the sites of the Lomé conurbation are characterized by the predominance of soft plastic waste (19.4%), followed by fine waste (19.1%).
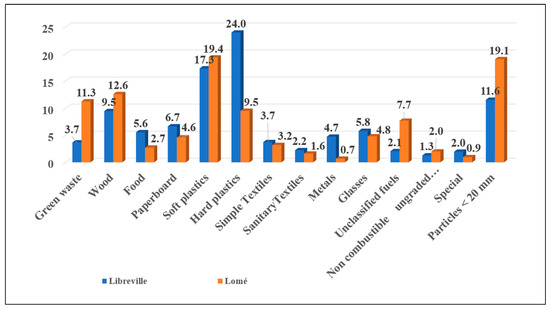
Figure 4.
Comparative summary of overall site data by waste category. Source: compiled by the authors from field data.
As a result, we can deduce that insalubrity is a common sight in the coastal areas of both towns. The results show that the city of Libreville (39.8) has very dispersed waste types. This means that certain types of waste, such as hard plastics, are more representative than fuels not classified as CNCs or sanitary textiles. In Lomé (37.9), on the other hand, waste dispersion is slightly less than in Libreville. Here, soft plastic waste and fine particles have the highest proportions, while metal waste has the lowest. The correlation coefficient of 0.63 shows that plastic waste dominates in both cities but differs in nature: hard plastic (Libreville) and soft plastic (Lomé). Also, the ANOVA test with an adjusted p-value of 0.93 confirms that there is no significant difference in the dominant waste groups. Consequently, these results can be explained by the use of plastic in all areas of life, as well as by the preponderant place it occupies in people’s habits through food packaging, plastic drink bottles and so on. In addition, the dynamics of the sandy shoreline increase the presence of fine waste mixed with debris.
2.3. Breakdown of Waste by Management Method in the Cities Studied
Efficient waste management can only be part of a sustainable vision if there is controlled knowledge of the quantities of waste and its composition, in order to optimize the management method, but also to create recovery channels. In fact, taking into account the distribution of waste according to the management method plays a significant role in preserving a country’s environment and economy. To this end, the data collected in the field are categorized into organic waste (easily biodegradable), non-organic waste known as recyclable (plastics, metals, glass) and inert waste (earth, sand, bricks, stones, tiles, gravel, porcelain, etc.). Generally speaking, the distribution of waste as such makes it possible to broaden the range of waste circularity, with a view to reducing its proliferation along the coastlines of the towns studied. Figure 5 shows the characterization according to the type of transformation or reuse possible for waste in the Libreville conurbation.

Figure 5.
Breakdown of waste fractions according to the type of waste processing collected along the coast of Greater Libreville: (A) biodegradable fractions; (B) non-biodegradable fractions; (C) inert waste fractions. Source: produced by the authors based on field data.
To this end, the biodegradable fractions of waste from the agglomeration’s coastline consist of green waste, food scraps and paper and cardboard. The proportion of these different fractions is as follows: the lowest proportion of the biodegradable fraction is found at site 2 (less than 5%), while the fraction is higher (around 15%) at sites 6, 7, 11 and 12. Green waste is essentially in the majority at sites 1 and 5 (more than 10%). However, green waste rates of less than 10% are estimated for the other sites. Paper and cardboard are produced in large quantities at sites 11 and 12 (15%). Food scraps are more prevalent at sites 6 and 7 (<15%) than at the other sites. Non-biodegradable waste consists of soft and hard plastics, metals and glass. Overall, hard plastic and soft plastic predominate, unlike the other fractions. In fact, hard plastic is the most important, with proportions ranging from 10 to 35% at all sites. After hard plastic comes soft plastic at site 2 with more than (30%), while the other sites have lower values. Finally, glass waste, which varies between (3 and 10%) at all sites, is the least significant.
Inert waste includes unclassified incombustibles (INCs) and fine waste, mainly sand and waste fragments. This waste fraction is essentially made up of sand, pebbles, etc. This type of waste represents 5 to 20% of the total waste, while INCs account for between 1 and 3%.
As in the Libreville conurbation, Figure 6 shows the biodegradable fractions, non-biodegradable fractions and inert waste fractions broken down from the waste collected from the coastline of the Lomé conurbation.
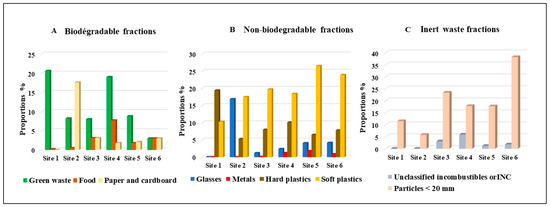
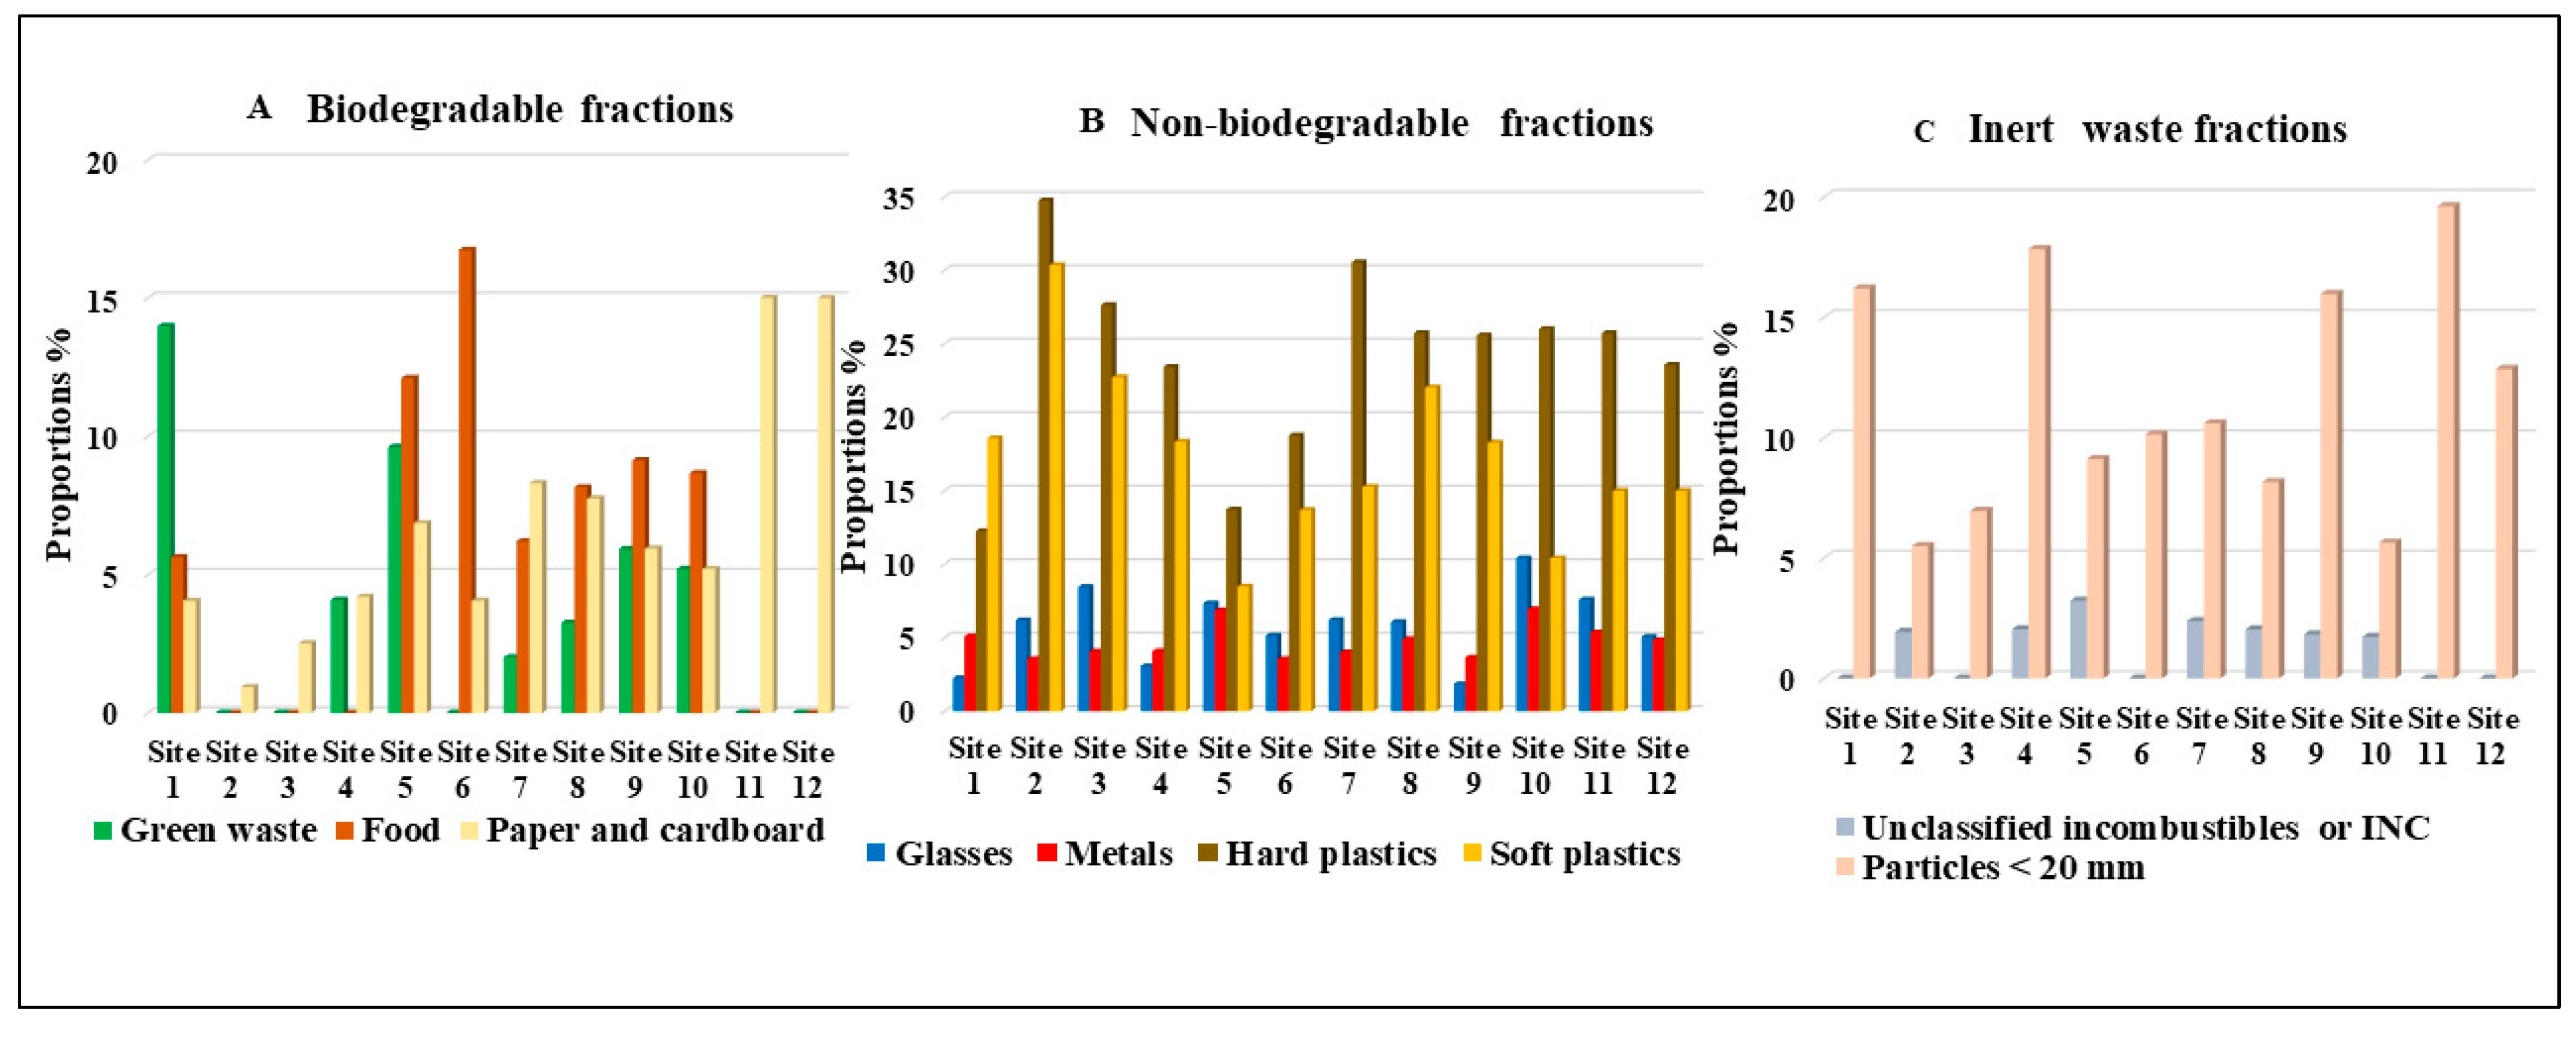
Figure 6.
Breakdown of waste fractions according to the type of processing of waste collected along the coast of Greater Lomé: (A) biodegradable fractions; (B): non-biodegradable fractions; (C) inert waste fractions. Source: compiled by the authors from field data.
The biodegradable fraction is made up of paper and cardboard, food scraps and green waste. The proportion of these different fractions is as follows: the lowest proportion of the biodegradable fraction is found at site 6 with less than (10%), while this fraction is largely produced at sites 2 and 4 at around (30%). Green waste is mainly produced by sites 1 and 4, at more than 15%, while the rest of the sites produce less than 10%. Paper and cardboard are produced in large quantities by site 2 (>25%). Waste made up of food scraps is high at site 4 compared with the other sites. However, the level of production remains below (10%).
Non-biodegradable recyclable waste is made up of plastics, metals and glass. Overall, soft plastic is more important than hard plastic waste, metals and glass waste. In fact, soft plastic is in the majority with proportions of (10–26%), with the exception of site 1 where the proportion of soft plastic is low (10%), while hard plastic is more important only at site 1 (19%). In addition, metal waste is poorly represented at all sites, with proportions of (0–1.8%), while glass waste is more represented at site 2 (16.9%). Inert waste, consisting mainly of sand, shellfish and fragments of solid waste, varies in the range of (0–38%) of total waste. Site 4 has the highest INC waste at (5%), while sites 6 and 3 have high proportions of fine waste at 38% and 23%, respectively. These trends would provide benefits for building materials and construction in the study town.
3. Discussion
The distribution of macrowaste in the coastal cities of Libreville and Lomé reveals the partial management of waste by urban managers. In these urban areas, the systematic inventory and characterization of waste shows that macrowaste is both numerous and diverse. This diversity also concerns the main sources of waste production, in particular local residents, industrial activities on the coast and faulty sewage systems, but also natural factors, such as rain and wind [8,31]. Solid waste of all kinds is easy to collect because it is visible to the naked eye. On the other hand, this ease of finding materials in coastal areas reflects the difficulties of accessing the urban waste collection service. The many dysfunctions that have arisen are sufficient to initiate a detailed examination of the weaknesses preventing sustainable macrowaste management. To this end, this study highlights the comparative analysis of solid waste according to various indicators, based on the MODECOM method. This method recommends separating waste into three fractions: “coarse” (d > 100 mm), “medium” (20 < d < 100 mm) and “fine” (d < 20 mm), for a minimum mass of 500 kg. The breakdown of waste by particle size class shows that Lomé is in first place for waste sizes > 100 mm and <20 mm. Libreville is only at the top of the ranking for waste between 100 and 20 mm in size. The T-test reinforces these superiority/inferiority ratios according to waste stratification in the two coastal cities. It is clear that the presence of waste at each site is largely a function of the daily activities that take place there and, in turn, influences the consumption habits of those involved (residents, businesses, traders, etc.). Unlike the work carried out by [27], the waste was separated into four particle sizes with minimum weights of between 40 and 150 kg—“coarse” (d > 100 mm), “medium” (20 < d < 100 mm), “fine” (8 < d < 20 mm) and “extra-fine” (d < 8 mm)—in order to facilitate sorting by category. Thus, it is important to identify this characteristic because it makes it possible to consider the implementation of mechanical separators in order to optimize solid waste management in developing countries as highlighted by the work of [25,32].
A comparative analysis of the categorization reveals both qualitative and quantitative conclusions. The 13 categories of macrowaste found are heterogeneous. The results of this categorization are identical to those of work already carried out by [33] in Mauritania, by [32,34] in Togo and [35] in Guinea Conakry. In fact, the overall averages of waste collected at all the sites are dominated by hard plastic waste (23.98%) and soft waste (17.35%) in the coastal zone of the Libreville conurbation. The Lomé conurbation, on the other hand, is characterized by an increase in soft plastic waste (19.37%), followed by fine waste (19.05%). This composition is determined by socio-economic activities, urban growth and local eating habits, all of which have an impact on the production and proliferation of waste along coastal areas. Plastic waste predominates in both zones because of the natural factors that influence its movement (wind, rain, waves). But this is also due to human activities, which contribute to the growth and production of waste through the constant use of food packaging, plastic bags and plastic bottles, linked to local habits. One of the main reasons for this is the crisis and lack of confidence in domestic water distribution networks. These networks are of dubious quality, to the extent that people in Lomé resort to water sachets called Pure Water (“AQUA LINDA, EAU COOL, SIAFA, etc.”), and people in Libreville use mineral water bottles (“ANDZA, AKEWA, etc.”). Locally, the water distributed to households by the Société d’Énergie et d’Eau du Gabon (SEEG) poses both a problem of availability, but also of quality [36]. In the same vein, work carried out by showed that plastic waste predominates at all the sites studied. This is also the case for the work, [31] in Indonesia and [37] in Sri Lanka, which also shows that plastics are the most persistent waste in coastal areas. Similarly, the work of [38], which highlights that plastic bottles are the most dominant among other macrowaste found along the coastal zones of Surigao City and that all sampling sites share a common challenge of plastic bottle dominance in their macrowaste density and composition, underscores the urgency of implementing comprehensive waste management strategies. They also point out that macrowaste pollution is a danger to marine life, hampers tourism, incurs heavy financial costs and threatens the health of people living on the coast [39]. Research shows that plastics account for the largest proportion of waste (29%), followed by metals (23%), glass (22%), wood (15%) and paper and textiles (6% and 5%, respectively), all of which are a blight on the coastal landscape. These results corroborate the study by [40] which found that most of the macrowaste washed up on the French Mediterranean coast is plastic (90%). This consists mainly of food packaging, candy waste, corks and much more. The results are similar to those revealed by the work of [41]. In his study, the source of beach litter is characterized by waste from human activities, of which plastic waste accounts for 64% compared with 12% for metals and 24% for all other waste. This trend is also present in the study by [42], where it is found that plastic is the most important product in terms of its presence on the Orans and Ain Témouchent coastlines, even though this category of macrowaste is abandoned in large quantities by beach users on the shoreline influenced by human activities. These proportions are the opposite of those found in the study by [43] because the macrowaste counted on the Annaba coast is dominated by glass waste (78%), plastics (18%) and metals (4%). Consequently, the nature of the waste is dependent on human activities, the responsibility for which is linked to both terrestrial and maritime activities in the two cities studied [44]. Waste characterization is used to highlight the type of treatment required to ensure sustainable waste management.
The comparative analysis of the distribution of materials by fraction according to the management method is indicative of the potential to be taken into consideration for waste recovery in order to reduce the proliferation of waste on the coast. This study shows a breakdown into three categories: biodegradable, non-biodegradable and inert waste. The analysis of the Libreville conurbation shows potential in the non-biodegradable fractions, with plastic waste accounting for more than 30%. Next, the biodegradable fraction is marked by paper and cardboard materials and food scraps, whose proportions exceed 15%. Finally, inert waste is dominated by fine waste at over 16%. In contrast, the results for the Lomé conurbation show that the biodegradable fraction is dominated by green waste, at 20%. Next, the non-biodegradable fraction is marked by a high potential for flexible plastic waste, with values in excess of 25%. Finally, inert waste, similar to the Libreville site, is dominated by fine waste at over 35%. These results reveal the existing potential for waste treatment and recycling materials in coastal cities, hence the need to create waste management channels, mainly for plastics, paper and cardboard, green waste and fine waste. In fact, knowledge of the quality and quantity of waste gives rise to the need to encourage sorting at source, as highlighted by the study carried out by [45].
Knowing the composition of waste is essential if we are to achieve sustainable development, because effective waste management can only be part of a sustainable vision if we have precise knowledge of the evolution of waste flows and, above all, of their composition, as emphasized by [33]. The results of this characterization would serve as a basis for studying the advisability of implementing a waste sorting system, given the many advantages offered by waste treatment, reduction at source and waste minimization as a sustainable waste management strategy [42]. This is also revealed by the work of [43], which highlights that waste management strategies are determined by the different waste fractions with the aim of developing a waste collection and recovery protocol. Maintaining this angle of analysis, the work of [44] highlights the effective solutions inherent in solving the problem of waste, in this case the strategy of adopting the first two levels of waste management as a priority: “reduce” and “reuse”. Consequently, as confirmed by the work of [45], it is essential to replicate good waste management practice in coastal areas, as is the case in Sweden, where integrated waste management is useful for energy production, composting and recycling, in order to reduce the practice of landfilling common in our cities. Measures taken to recover waste could limit environmental degradation and health risks influenced by poor waste management. Poor waste management on beaches degrades their natural beauty, which in turn limits their appeal to tourists. In a similar vein, waste washed up on the coast bears witness to human presence and contributes to the unsightliness of the Mediterranean environment [40]. Similar findings are revealed in the work of [46], which shows that there is a direct correlation between poor solid waste management and the social and environmental consequences of inefficient local waste management practices. Also, the discharge of macrowaste into the environment represents a health risk for users, exposing them to numerous accidents such as potentially dangerous pieces of glass, sharp pieces of wood and visible metal fragments [47]. Furthermore, their proliferation in the wild is a breeding ground for pathogens that expose people to disease [48,49]. Consequently, having noted the consequences of inadequate waste disposal, it is important to diversify waste management methods in order to contribute to the development of local communities [50,51,52]. Increased knowledge of the distribution of coastal macrowaste requires constant monitoring of waste collection sites and the rate of material degradation. In addition, improving the shortcomings observed in these cities requires not only infrastructure reinforcement, but also urban and environmental policies to be adopted, especially specific recycling policies. Experts in the field could, for example, consider sustainable solutions as striking research topics in as yet unexplored coastal areas, as highlighted by [53,54,55]. The systematic characterization of macrowaste is an opportunity to better manage the collection circuit system. It will enable us to trace the quantitative and qualitative data for the two cities, and to propose waste treatment methods. Often lacking in specialized waste laboratories in our study area, this study will prompt further research into the chemical parameters of each material, in order to better assess their recovery. This study will also help guide the overall waste management strategy of local authorities in the coastal zone.
4. Materials and Methods
4.1. Presentation of the Study Sites
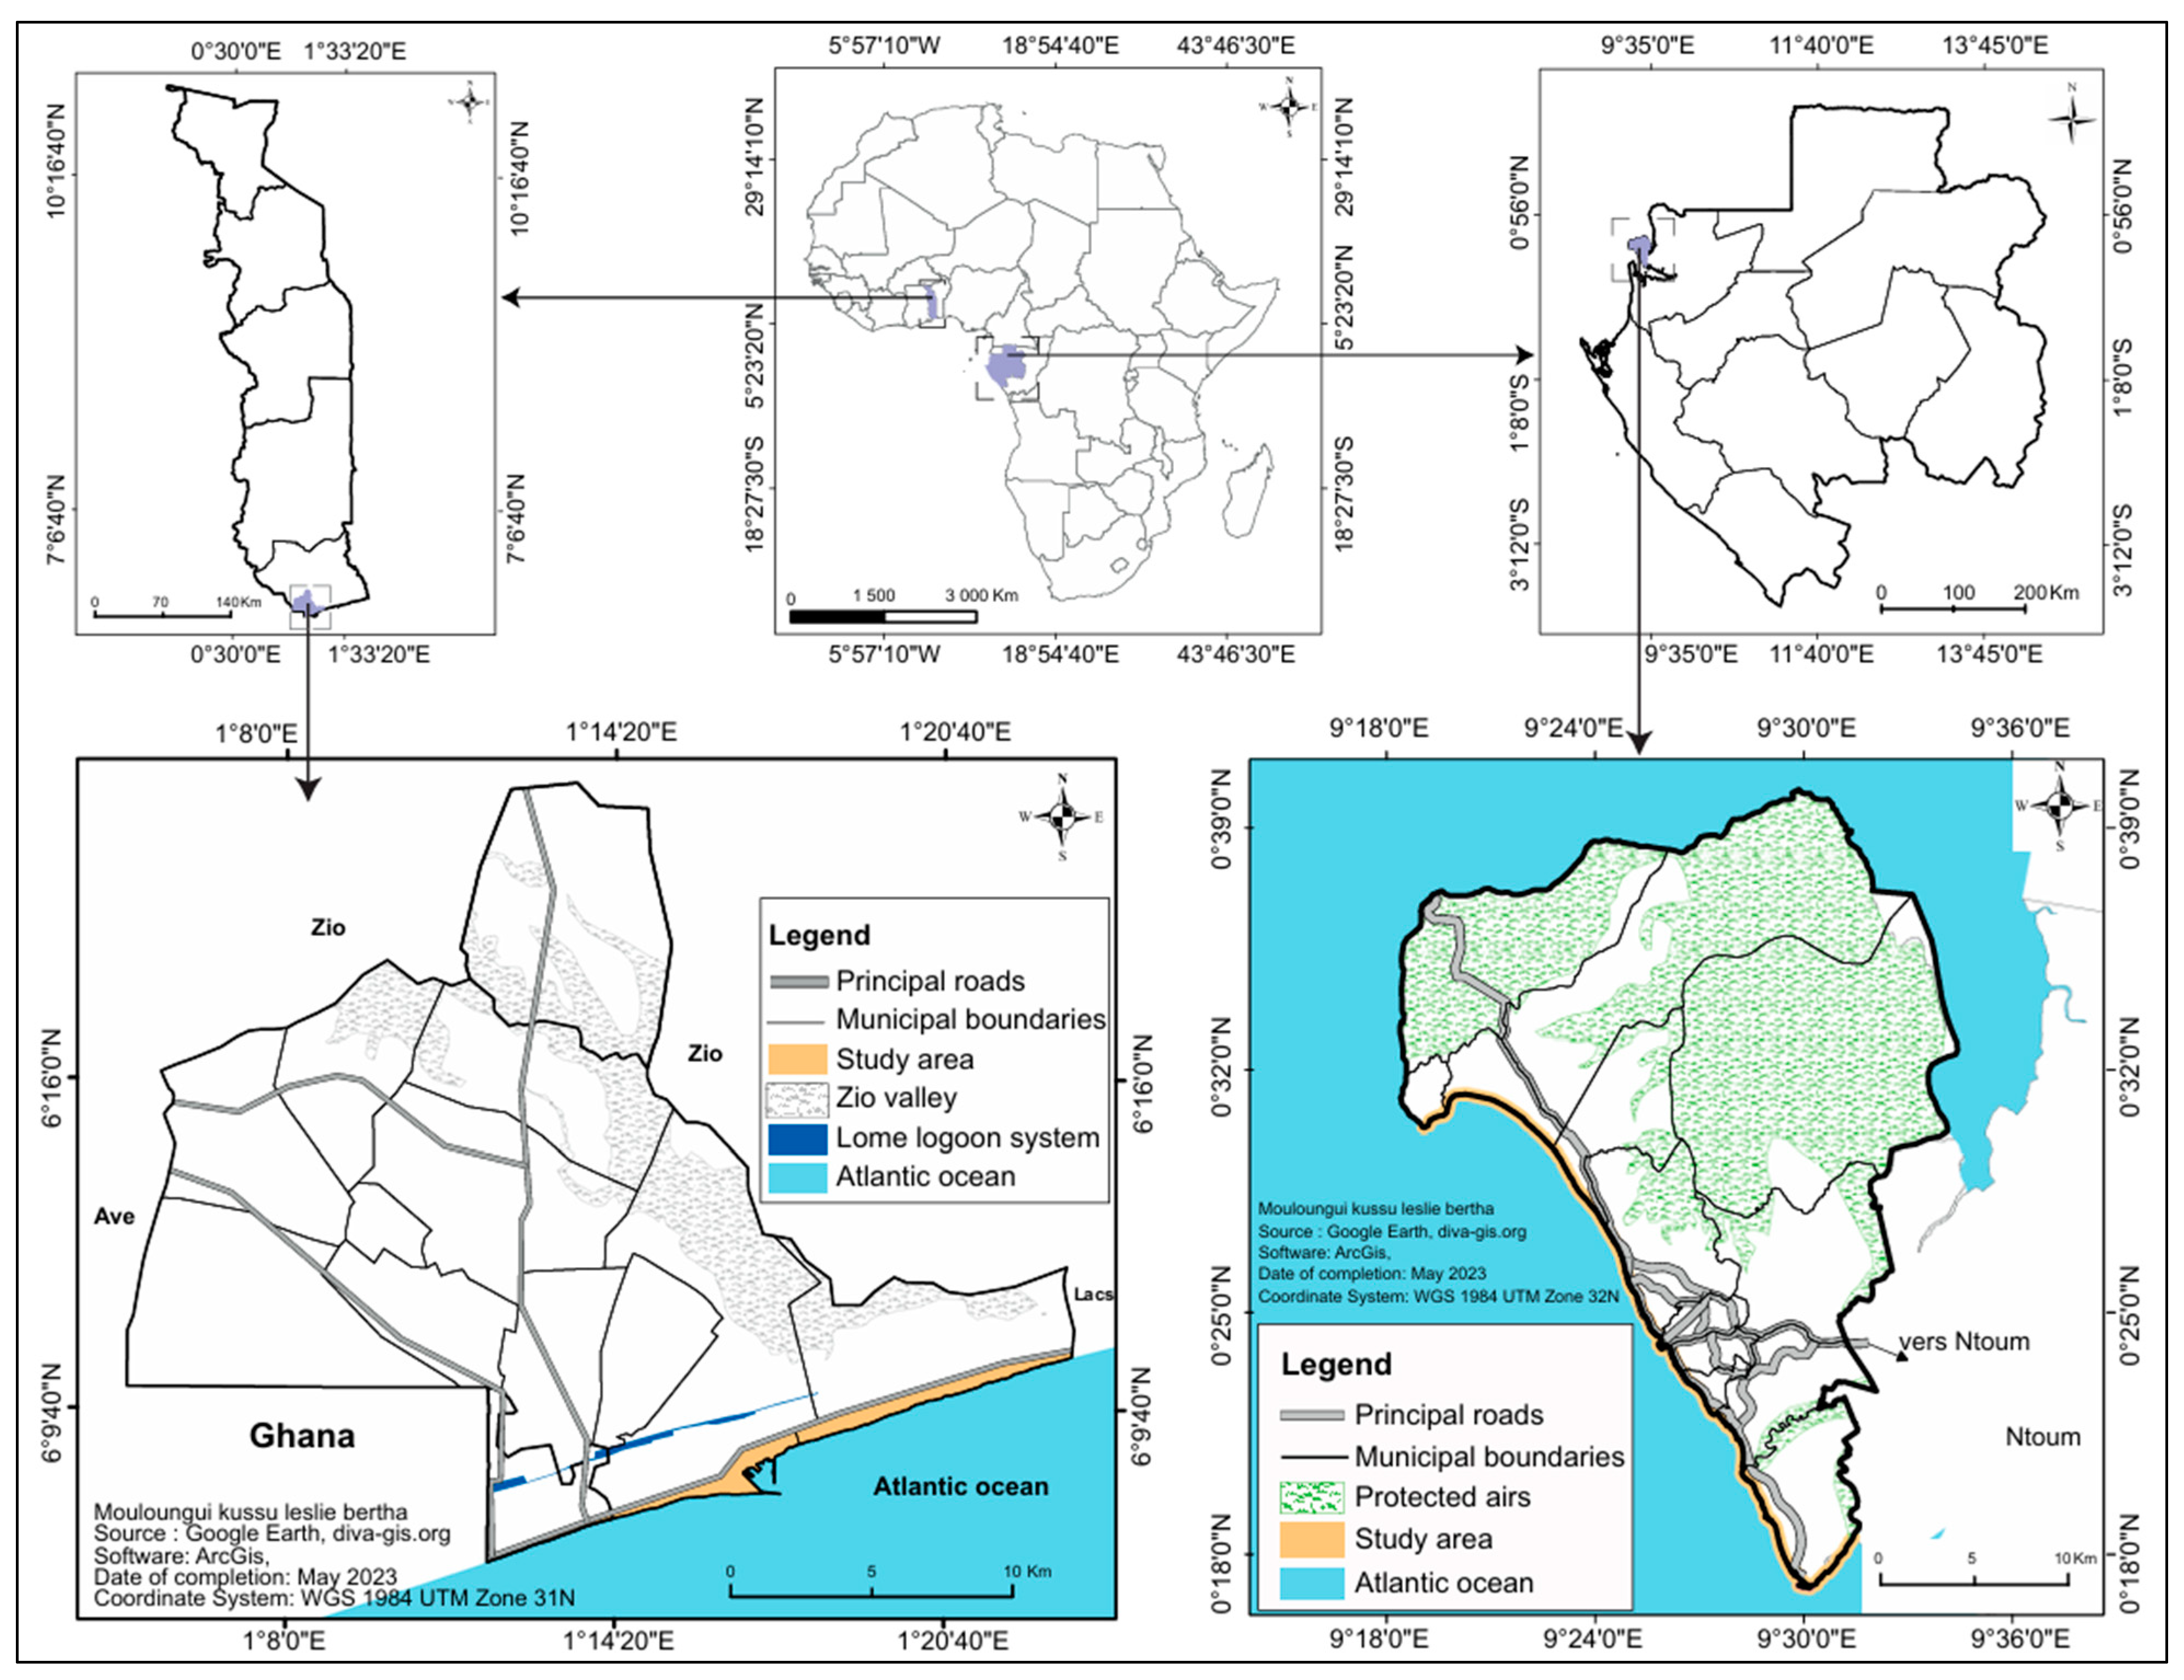
This study is being carried out in two cities, the locations of which are shown in Figure 7. The first is Libreville, the capital of Gabon, a Central African country, and the second is Lomé, the capital of Togo, a West African country.
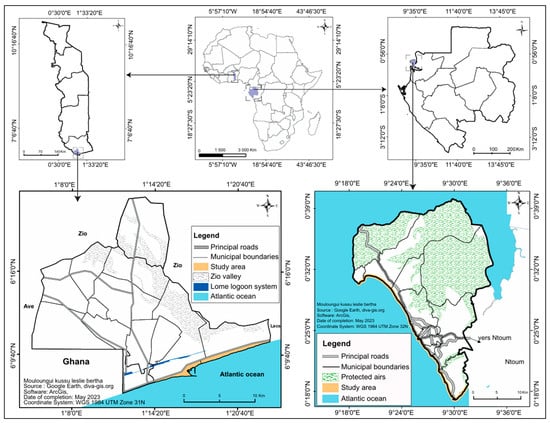
Figure 7.
Location of the study area.
The Togolese capital, Lomé, backs onto the Gulf of Guinea and is located in the south-east of the maritime region. The coordinates that delimit its urban perimeter are latitude north (6°8′50′′ and 6°22′30′′) and longitude east (1°4′0′′ and 1°24′0′′). To the north-east lies the marshy valley of the River Zio, to the south the Atlantic Ocean and to the west the Togo–Ghana border. Lomé is built on the bedrock of the coastal sedimentary basin dating from the Eocene, which covers the entire coastal region of the Gulf of Benin geosystem [56]. Its hydrographic network is dominated by the lagoon system, fed by the River Zio and located between two barrier beaches. Generally speaking, the urban area of Lomé has the characteristics of a coastal town dominated by a gentle relief. It is made up of 13 communes covering a total area of 425.6 km2, with a population of 2,188,376 in 2022 [57]. As a beach city, Lomé runs along the coast of the Gulf of Guinea and borders Ghana from Aflao to the Baguida extension over a distance of more than 20 km.
Like Lomé, Libreville is located in the Gulf of Guinea on the right bank of the Gabon Estuary [58]. Located between 0°23′24′′ and 0°3′00′′ north latitude and between 9°30′62′′ and 9°57′07′′ east longitude, Libreville stretches along the banks of the Komo estuary [59]. It comprises three communes: Akanda, Libreville and Owendo, linked by roads. It is built on a rugged landscape, dotted with numerous hills and valleys crossed by rivers of varying size that flow into the Estuary. It is drained by a hierarchical hydrographic network traversed by 21 catchment areas of irregular size and morphology [60]. It extends 13 kilometers inland and more than 30 kilometers from north to south along the coastline of the Ministère de la Planification et de l’Aménagement du Territoire, 2000, cited by [61]. According to [62], in 2013, Libreville had a population of 703,940, making it the most densely populated city in Gabon. Between 1960 and 1993, the country’s population rose from 447,864 to 1,014,976, and then to 1,811,079 in 2013.
4.2. Methodology for Characterizing Coastal Macrowaste
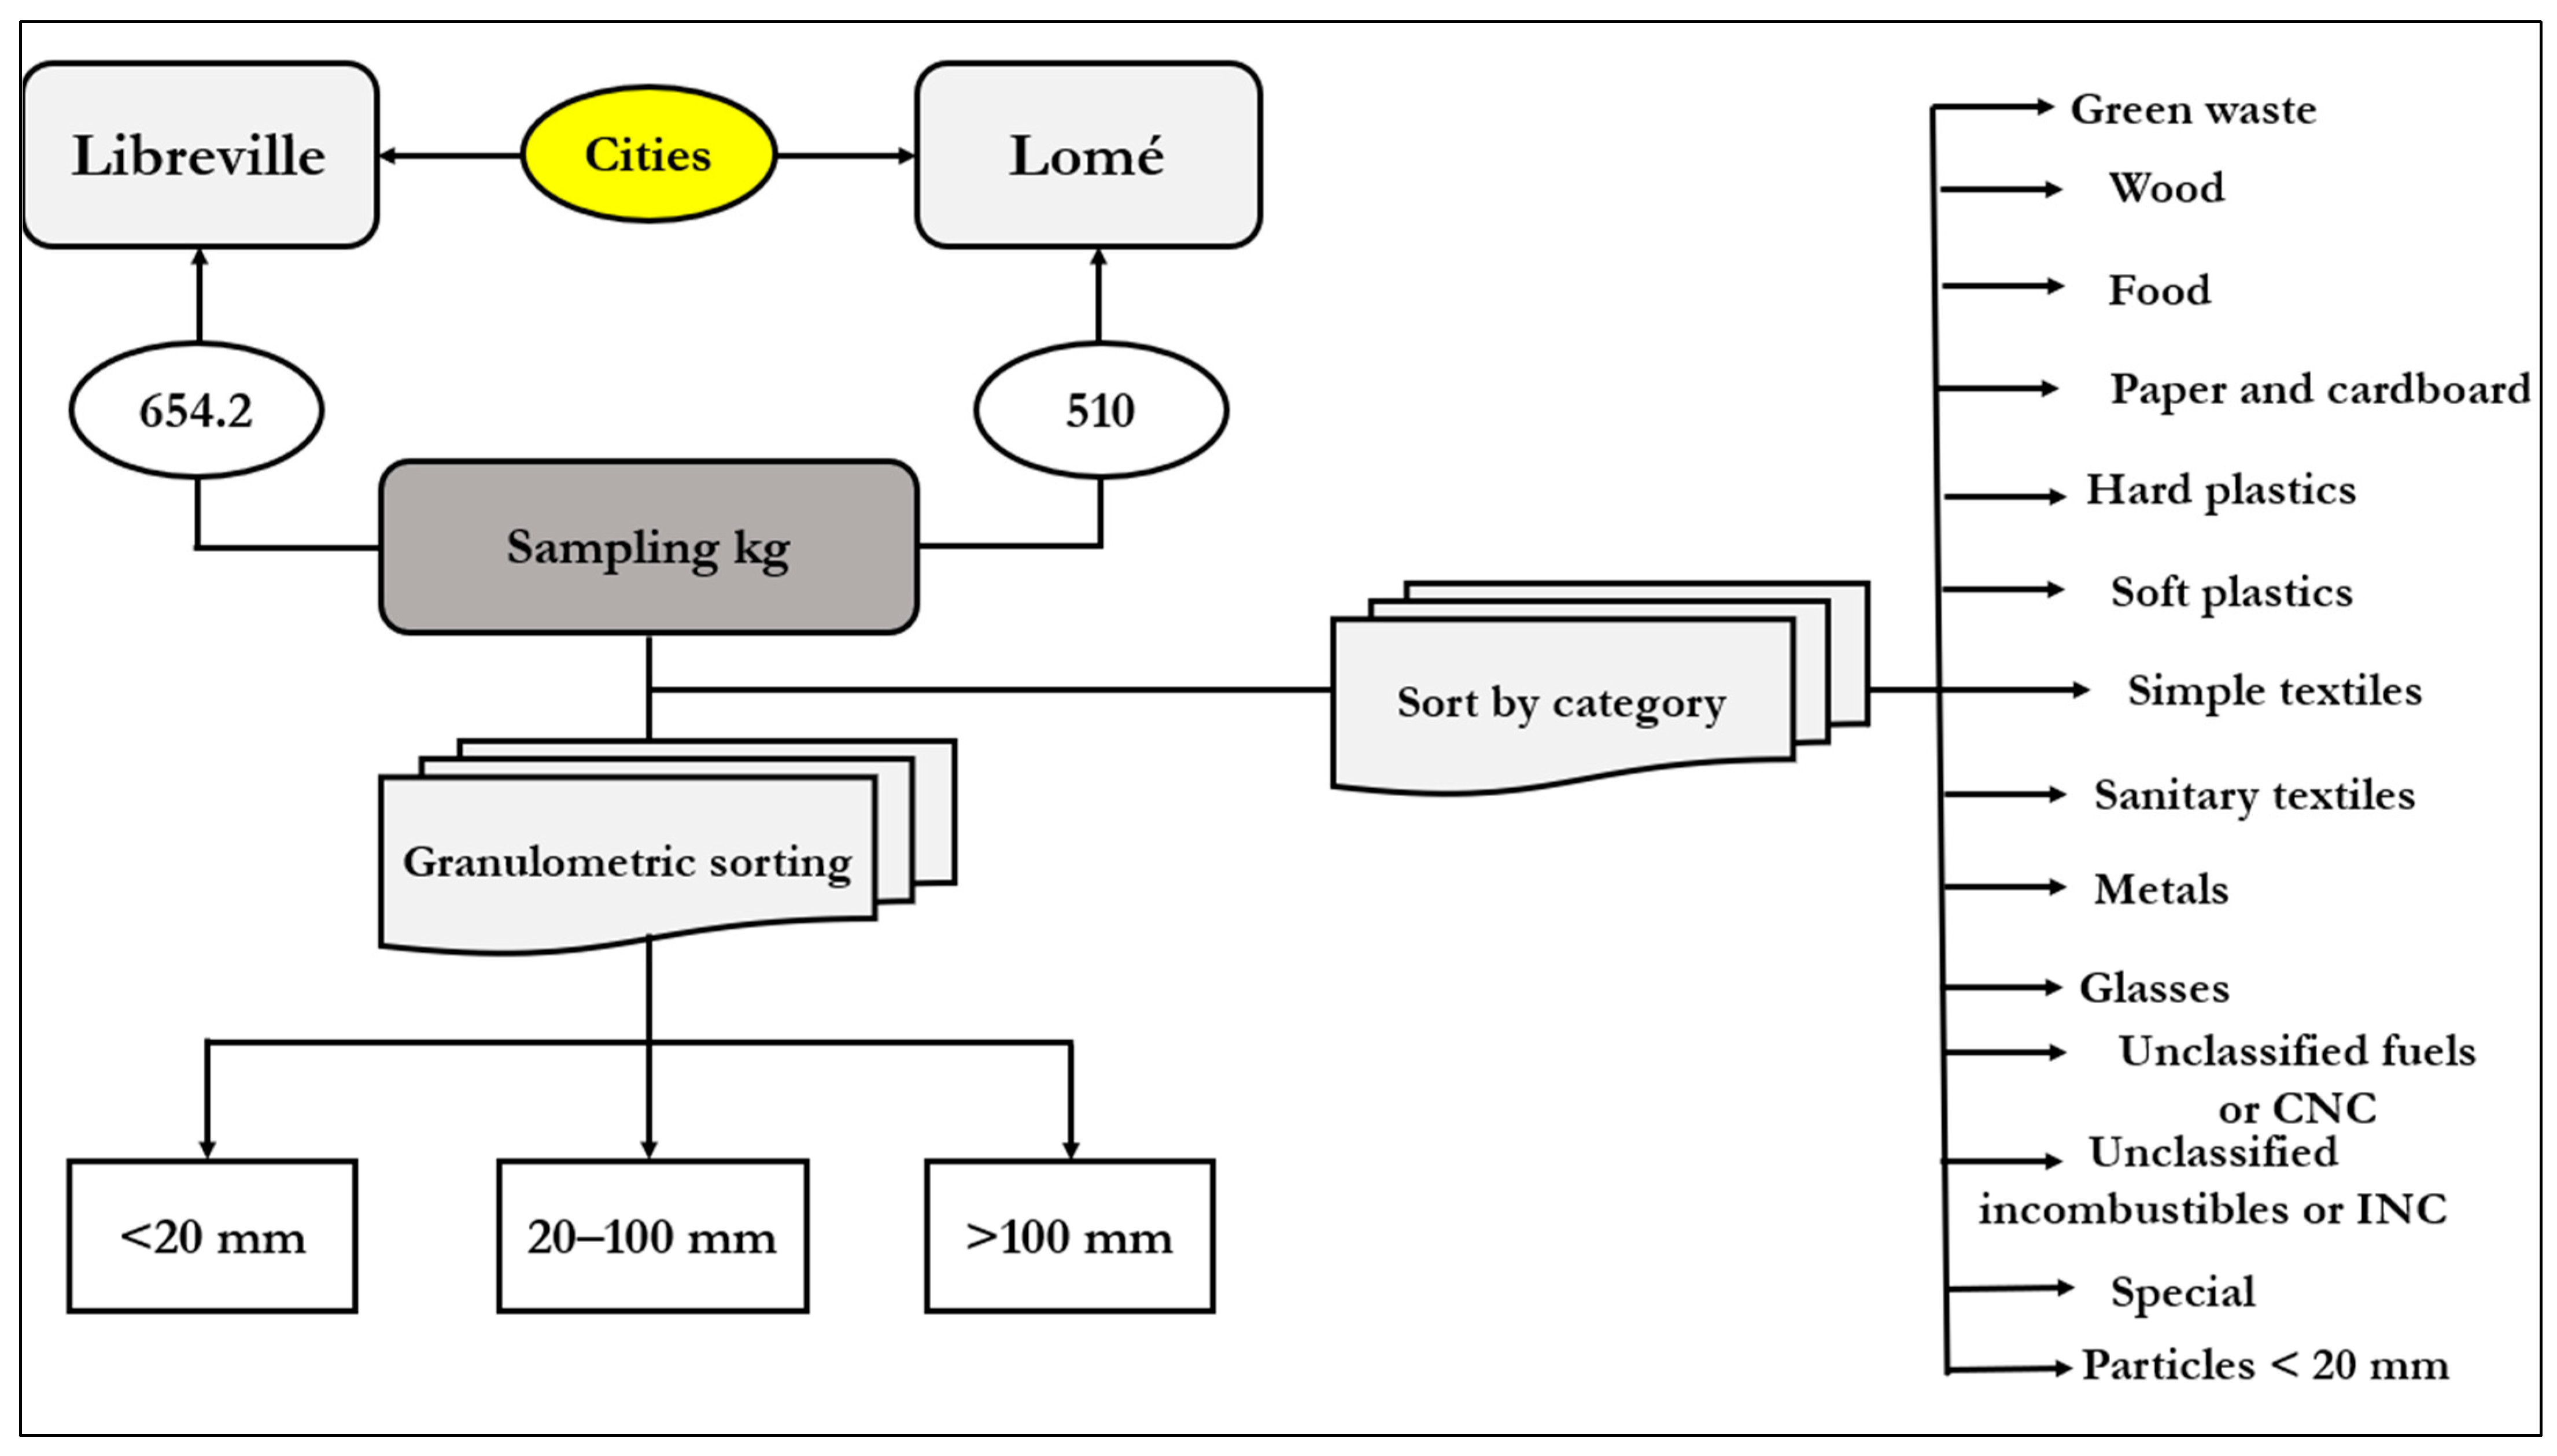
At first glance, the process used in this study to physically characterize macrowaste corresponds to the approaches developed in the work of [27,63]. Their work places particular emphasis on the household waste characterization method (MODECOM). This method is applied in a modular way, i.e., it takes account of the site studied and recommends the solid waste sorting procedure based on an average sampling estimated at 500 kg. Two data collection campaigns were carried out in December 2022 at 12 sites and in February 2023 at 6 sites, in Libreville and Lomé, respectively. Overall, the quantity of waste collected was 654.21 kg, including 617.64 kg for Greater Libreville, and 510 kg, including 502.3 kg for Greater Lomé (Table 2).
Table 2.
Initial and post-characterization mass of each site. Source: authors.
To this end, two types of macrowaste characterization were carried out, one according to the size of the materials and the other according to their nature and/or category (Figure 8).
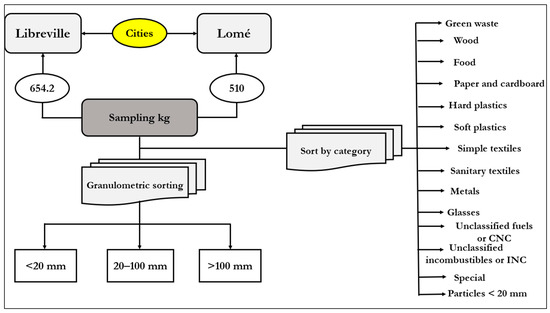
Figure 8.
Stages in the physical characterization of waste. Source: produced by the authors.
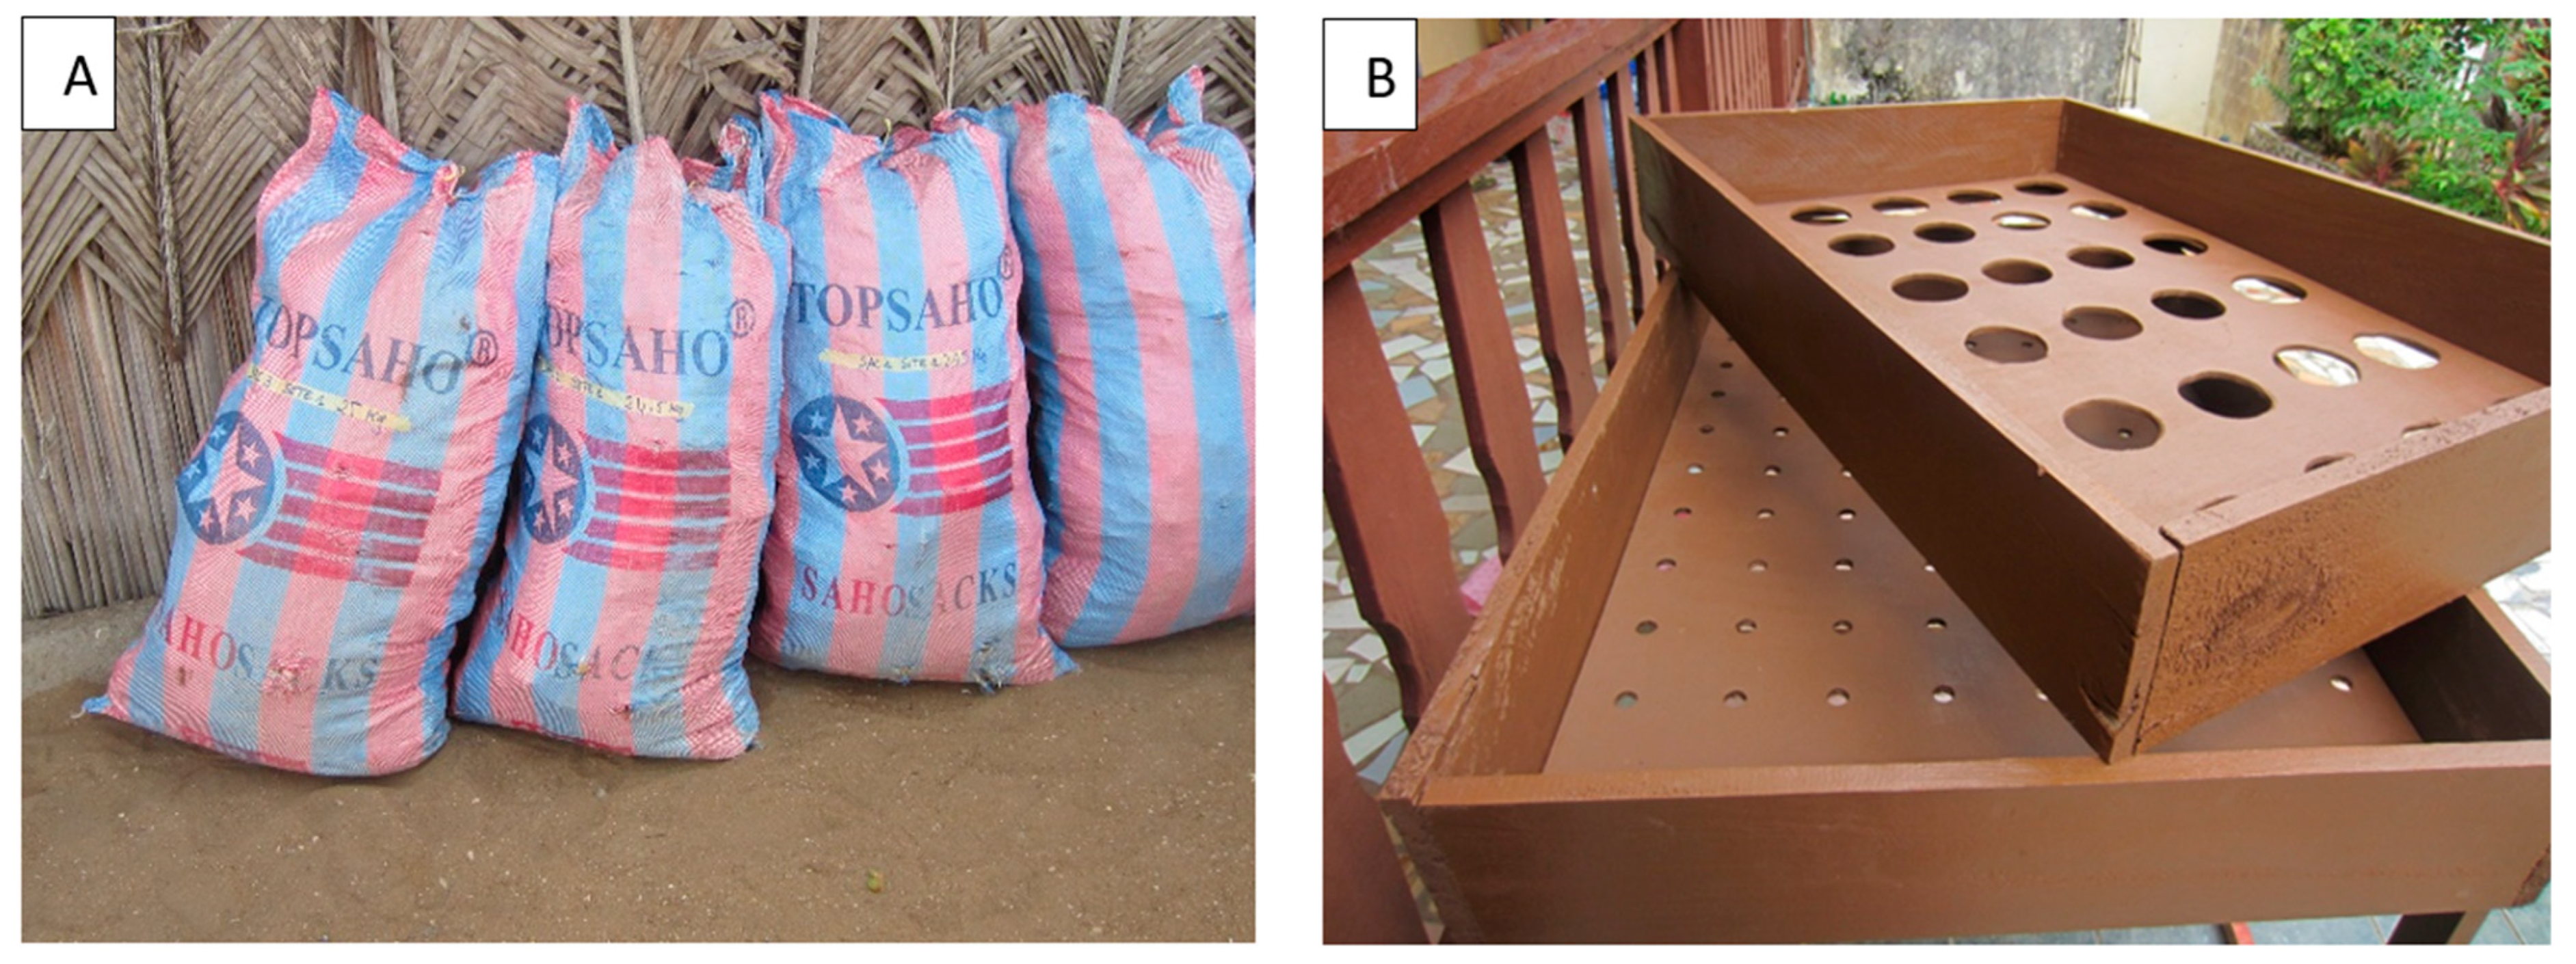
Three particle size fractions were defined for sorting materials according to size: less than 20 mm, between 20 and 100 mm and over 100 mm. This sorting technique was carried out manually on a stackable table with round meshes at each level, arranged in decreasing order of diameter. Contained in rigorously coded bags, the waste is progressively poured onto the table and gently stirred, so that only waste of the corresponding diameters remains (Figure 9).
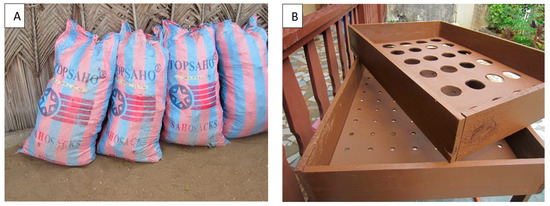
Figure 9.
Samples of coded bags filled with waste after collection (A) and the stackable table for sorting solid waste (B). Source: authors.
They are then sorted by size, classified into 13 categories and weighed in accordance with the MODECOM method [64,65]. Thus, manually sorted waste is separated into 13 categories (Figure 8). Physical characterization provides information on the nature, composition and quantities of solid waste generated in the various study areas.
Collection sites were selected beforehand on a digital map of Greater Lomé and the Libreville conurbation using Google Earth, Qgis (version 3.34.2) and Adobe Illustrato. To sample the waste collection sites, the stratified systematic method was chosen to make our study area homogeneous. The first step was to digitize the coastline of the two study areas. Next, the respective shorelines were divided into strata or segments of 1000 m or 1 km. Then, on each 1000 m segment, a 200 m buffer zone was created at regular 2000 m intervals along the entire length of the shoreline segment. Six sites were selected from Aflao to Kpogan for Greater Lomé, and 12 sites from Akanda to Owendo for Greater Libreville. The surface area of each site is 200,000 m2 corresponding to (200 m × 1000 m) of waste collection [66]. The Locup Map digital smartphone application was used to geolocate the various sites. Finally, the manually collected waste was stored in coded bags for sorting and weighing to determine the quantities of each category. The sum of the weighings should reach 500 kg (minimum) of waste, as recommended by MODECOM. The tools used for characterization were as follows: personal protective equipment (gloves, boots, masks), coded bags for each site, a sorting table measuring 2 m long by 1 m wide (Figure 9), scales (one for masses over 5 kg, one for masses under 5 kg and one precision scale), a notepad and a digital camera (Canon Zoom Lens 5x IS 12.1 MP) for cataloguing the materials collected.
The data were processed mainly using Microsoft Excel, with the first step being to transcribe the data and then carry out the various calculations, before presenting all the results. In addition to this first level of processing, a statistical analysis was carried out using Student’s T-test (R software, version 4.3.1), with the aim of showing the level of significance with a confidence interval of 0.05 between the different sizes of waste collected in the two test study areas. The types of waste identified at each site were compared using an analysis of variance (ANOVA) from RStudio software version 4.3.1. This method was used to determine whether the differences in the percentages of waste collected in Libreville and Lomé were significant (p-value < 0.05). This produced the following results.
5. Conclusions
This study is preliminary work for central and western coastal cities interested in macrowaste. This heterogeneous type of waste affects numerous coastal areas around the world. To this end, an interest in macrowaste characterization has made it possible to provide reference data and information to help decision-makers understand the physical impact of its proliferation on human health and the environment. Consequently, this study helps to demonstrate the urgency of the situation with regard to the vulnerability of coastal areas if no action is taken. However, to achieve this, the breakdown of waste management fractions shows potential in waste reclamation that would considerably reduce waste proliferation and landfill disposal. Consequently, to considerably reduce the proliferation of macrowaste in coastal areas, we need to sort it at source, monitor sources and transfer routes, and install anti-macrowaste nets at outlets to intercept waste. It will serve as an aid to decision-making and a guide to developing comprehensive waste management along coastal zones. The data collected will be used to inform the collection circuit through the characterization of the waste produced. It is a useful tool for influencing public policy on the planning of artisanal recycling in our localities. It will foster the relationship between collectors and manufacturers for the supply of raw materials, within which is the creation of kiosks for the sale of products. Despite initiatives to reduce the proliferation of waste on the coast, the implementation of a collection circuit along the coast by sorting waste will be a lasting benefit for local communities. This study underlines the need for sorting to contribute to a coastal management system. It should be noted, therefore, that this is one of the few studies of solid waste characterization in cities in Africa. Given the results obtained, it is essential to duplicate these types of studies in other cities to better define the composition of waste with a view to its recovery. It should be pointed out that our hypotheses have been verified. Thus, we can say that rational management generates added value, which in turn creates jobs in the recycling sector. It would also help limit environmental degradation and threats to human health.
Author Contributions
Conceptualization, M.V., R.C.Z.E., D.E.M. and L.B.M.K.; methodology, M.V. and L.B.M.K.; software, D.E.M.; validation, M.V. and R.C.Z.E.; formal analysis, M.V. and L.B.M.K.; investigation, D.E.M. and L.B.M.K.; writing—original draft preparation, D.E.M. and L.B.M.K.; writing—review and editing, D.E.M. and L.B.M.K.; visualization, D.E.M. and L.B.M.K.; supervision, R.C.Z.E. and M.V.; project administration, L.B.M.K., M.V. and R.C.Z.E.; funding acquisition, L.B.M.K. All authors have read and agreed to the published version of the manuscript.
Funding
This research was funded by the Regional Centre of Excellence on Sustainable Cities in Africa (CERVIDA-DOUNEDON), the Association of African Universities (AAU) and the World Bank, funding number IDA 5360 TG.
Data Availability Statement
All data can be used upon request.
Acknowledgments
We would like to thank the Regional Centre of Excellence on Sustainable Cities of Africa (CERViDA_DOUNEDON), the Association of African Universities (AAU) and the World Bank for providing the necessary funding that facilitated our research work leading to these results. The authors would like to thank the Laboratoire de Recherche sur la Dynamique des Milieux et des Sociétés of the University of Lomé for their research visit. Our thanks go to Yao Tsoekeo Amedokpo for his contributions and proofreading.
Conflicts of Interest
The authors declare no conflicts of interest.
References
- Tini, A. La Gestion des Déchets Solides Ménagers à Niamey au Niger: Essai Pour une Stratégie de Gestion Durable. Ph.D. Thesis, Institut National de Lyon, Lyon, France, 2003; p. 302. Available online: https://theses.fr/2003ISAL0084 (accessed on 15 September 2023).
- World Bank. Moins de Gâchis, Plus D’économies: La Gestion des Déchets au Cœur du Développement Durable. Available online: https://www.banquemondiale.org/fr/news/feature/2016/03/03/waste-not-want-not---solid-waste-at-the-heart-of-sustainable-development (accessed on 6 November 2024).
- Yachiyo Engineering Co., Ltd. Étude de Collecte D’informations Relatives à la Gestion des Déchets Municipaux Solides dans les villes d’Afrique; RAPPORT FINAL; JICA (Agence Japonaise de Coopération Internationale): Tokyo, Japon, 2022; p. 18. [Google Scholar]
- Sotamenou, J.; Composting: A Sustainable Alternative for Public Solid Waste Management in Cameroon; p. 364. Available online: https://agritrop.cirad.fr/569256/1/document_569256.pdf (accessed on 25 December 2022).
- Jambeck, J.R.; Geyer, R.; Wilcox, C.; Siegler, T.R.; Perryman, M.; Andrady, A.; Narayan, R.; Law, K.L. Plastic waste inputs from land into the ocean. Science 2015, 347, 768–771. [Google Scholar] [CrossRef] [PubMed]
- Herdiansyah, H.; Saiya, H.G.; Afkarina, K.I.I.; Indra, T.L. Coastal Community Perspective, Waste Density, and Spatial Area toward Sustainable Waste Management (Case Study: Ambon Bay, Indonesia). Sustainability 2021, 13, 10947. [Google Scholar] [CrossRef]
- Jin, J.; Wang, Z.; Ran, S. Solid waste management in Macao: Practices and challenges. Waste Manag. 2006, 26, 1045–1051. [Google Scholar] [CrossRef] [PubMed]
- Rezazadeh, M.; Abdoli, M.; Mehrdadi, N.; Mousavinezhad, M. Municipal Solid Waste Management in Coastal line of Gilan Province. Int. J. Adv. Biol. Biomed. Res. 2014, 2, 1638–1649. [Google Scholar]
- Ammar, S.B. Les Enjeux de la Caractérisation des Déchets Ménagers Pour le Choix des Traitements Adaptés Dans les Pays en Développement: Résultats de la Caractérisation dans le Grand Tunis Mise au Point d’un Méthode Adaptée. Ph.D. Thesis, Institut National Polytechnique de Lorraine, Nancy, France, 2006; p. 382. Available online: https://hal.univ-lorraine.fr/tel-01752488 (accessed on 20 January 2023).
- Alshaikh, R.; Abdelfatah, A. Optimization Techniques in Municipal Solid Waste Management: A Systematic Review. Sustainability 2024, 16, 6585. [Google Scholar] [CrossRef]
- Obame, C.N. Recommandations Pour Optimiser la Gestion des Déchets Ménagers sur le Territoire de la Capitale du Gabon, Libreville; Université de Sherbrooke: Sherbrooke, QC, Canada, 2021; p. 95. [Google Scholar]
- Mombo, J.B.; Edou, M. La gestion des déchets solides urbains au Gabon. Geo-Eco-Trop 2005, 29, 89–100. [Google Scholar]
- Kondoh, E.; Bodjona, M.B.; Aziable, E.; Tchegueni, S.; Kili, K.A.; Tchangbedji, G. Etat des lieux de la gestion des déchets dans le Grand Lomé. Int. J. Bio. Chem. Sci. 2019, 13, 2200–2209. [Google Scholar] [CrossRef]
- Messanh, K. Repenser la Gestion des Matières Résiduelles à Lomé AU Togo; Université de Sherbrooke: Sherbrooke, QC, Canada, 2022; p. 80. [Google Scholar]
- Tiankpa, Y. Insalubrite et Gestion des Dechets Menagers dans la Ville de Lome au TOGO. Ph.D. Thesis, Universite de Lome, Lomé, Togo, 2016; p. 355. [Google Scholar]
- Thompson, R.C.; Swan, S.H.; Moore, C.J.; Vom Saal, F.S. Our plastic age. Phil. Trans. R. Soc. B 2009, 364, 1973–1976. [Google Scholar] [CrossRef]
- Barnes, D.K.A.; Galgani, F.; Thompson, R.C.; Barlaz, M. Accumulation and fragmentation of plastic debris in global environments. Phil. Trans. R. Soc. B 2009, 364, 1985–1998. [Google Scholar] [CrossRef]
- Eriksen, M.; Lebreton, L.C.M.; Carson, H.S.; Thiel, M.; Moore, C.J.; Borerro, J.C.; Galgani, F.; Ryan, P.G.; Reisser, J. Plastic Pollution in the World′s Oceans: More than 5 Trillion Plastic Pieces Weighing over 250,000 Tons Afloat at Sea. PLoS ONE 2014, 9, e111913. [Google Scholar] [CrossRef]
- Cheshire, A.; Adler, E. UNEP/IOC Guidelines on Survey and Monitoring of Marine Litter; United Nations Environment Programme: Nairobi, Kenya, 2009. [Google Scholar] [CrossRef]
- Tramoy, R.; Gasperi, J.; Tassin, B. Plastoc: Indicateurs de la Pollution en Macrodéchets Dans L’environnement et Estimation des Flux Issus des Eaux Urbaines; hal-04006271; Laboratoire Eau Environnement et Systèmes Urbains (LEESU): 2022; p. 80. 61 avenue du Général de Gaulle, 94010 Créteil Cedex. 2022. ⟨hal-04006271⟩. Available online: https://hal.science/hal-04006271 (accessed on 13 October 2024).
- Poitou, I. Les macrodéchets littoraux: Une gestion publique empirique en région Provence-Alpes-Côteded’Azur. Méditerranée 2003, 100, 17–22. [Google Scholar] [CrossRef]
- AFNOR. Caractérisation d’un Échantillon de Déchets Ménagers et Assimilés; Eds AFNOR: Saint-Denis, France, 1996; p. 24. [Google Scholar]
- Ngambi, J.R. Déchets Solides Ménagers de la Ville de Yaoundé (Cameroun): De la Gestion Linéaire Vers une Économie Circulaire. Ph.D. Thesis, Université de Nantes angers le mans, Nantes, France, 2015. Available online: https://theses.hal.science/tel-01262368v1/document (accessed on 1 January 2024).
- Mbiadjeu-Lawou, S.P. Quelle Économie Circulaire Spontanée Pour une Ville Moyenne Camerounaise? Le cas des Déchets Solides Ménagers de Bangangté (Cameroun). Ph.D. Thesis, Université le Mans, Le Mans, France, 2019. Available online: https://theses.hal.science/tel-02102804v1/document (accessed on 13 October 2024).
- Aloueimine, S. Methodologie de Caracterisation des Dechets Menagers a Nouakchott (Mauritanie): Contribution a la Gestion des Dechets et Outils d′Aide a la Decision. Master’s Thesis, Université de Limoges, Limoges, Farnce, 2006; p. 195.
- Ogou Affoladé, L.S. Optimisation de la Gestion des Déchets Solides Ménagers en Milieu Urbain: Cas de la Ville de Dapaong au Togo. 2015, p. 68. Available online: http://documentation.2ie-edu.org/cdi2ie/opac_css/index.php?lvl=notice_display&id=29537 (accessed on 13 October 2024).
- Koledzi, K.E. Valorisation des Déchets Solides Urbains dans les Quartiers de Lomé (Togo): Approche Méthodologique Pour une Production Durable de Compost. Ph.D. Thesis, Universite de LOME, Lomé, Togo; Universite de Limoges, Limoges, France, 2011; p. 224. [Google Scholar]
- Mathlouthi, O.; Ayadi, M.T.; Abid, I.G.; Nassour, A. Composting and Mechanical Biological Treatment for Reducing Greenhouse Gas Emissions in Bizerte, Tunisia. Sustainability 2024, 16, 694. [Google Scholar] [CrossRef]
- Hassen, W.; Hassen, B.; El Ouaer, M.; Kouki, S.; Hassen, A. State-of-the-Art and Current Status of Municipal Solid Waste Management on a Global Scale. In Technical Landfills and Waste Management: Volume 2: Municipal Solid Waste Management; Souabi, S., Anouzla, A., Eds.; Springer Nature: Cham, Switzerland, 2024; pp. 87–114. [Google Scholar] [CrossRef]
- Ngahane, E.L.; Mindele, L.U.; Nsavyimana, G.; Bigumandondera, P.; Vasel, J.-L.; Ngnikam, E. Analyse comparative des résultats de caractérisation d’ordures ménagères: Cas des communes de Bembéréké (Bénin), Kinama (Burundi), Gombe et Kimbanseke (RDC). Environ. Ingénierie Développement 2015, 69, 13–22. [Google Scholar] [CrossRef]
- Wulandari, D.; Warmadewanthi; Pandebesie, E.S.; Cahyadi, M.N.; Anityasari, M.; Dwipayanti, N.M.U.; Purnama, I.G.H.; Addinsyah, A. Solid waste management in a coastal area (Study Case: Sukolilo Sub-district, Surabaya). Sustain. Resil. Coast. Manag. 2021, 799, 0142030. [Google Scholar] [CrossRef]
- Kondoh, E. Etude de l’état des Lieux de la Gestion et Caractérisations Physique et Chimique des Déchets Solides Menagers de la Ville de TSEVIE. Ph.D. Thesis, University of Lome-Togo, Lome, Togo, 2022; p. 183. [Google Scholar]
- Aloueimine, S.; Matejka, G.; Zurbrugg, C.; Mohamed, M.S. Caractérisation des déchets urbains de Nouakchott, partie 1: Conception d’une nouvelle méthodologie d’échantillonnage des déchets. Environ. Ingénierie Développement 2006, 44, 1–8. [Google Scholar] [CrossRef]
- Koledzi, K.E.; Baba, G.; Feuillade, G.; Guy, M. Caractérisation physique des déchets solides urbains à Lomé au Togo, dans la perspective du compostage décentralisé dans les quartiers. Environ. Ingénierie Développement 2011, 59, 9. [Google Scholar] [CrossRef]
- Alain, G.; Diaka, S.; Ibouraima, Y.; Yacouba, C. Characterization of solid household waste in Conakry, Republic of Guinea. Afr. Sci. J. 2022, 3, 183–200. [Google Scholar] [CrossRef]
- Essono Milla, D. Caractérisation de L’étalement Urbain et des Inégalités Environnementales à Libreville (Gabon). Ph.D. Thesis, Le Mans Université, Le Mans, France, 2022; p. 396. Available online: https://theses.fr/2022LEMA3007 (accessed on 27 January 2023).
- Hitige, L.; Samarakoon, T. Status of Solid Wastes and its Management in the Coastal Environments of Sri Lanka. Int. J. Environ. Agric. Biotechnol. 2021, 6, 1–9. [Google Scholar] [CrossRef]
- Toring, V.E.C.; Sanchez, R.E.; Gorgonio, F.A.M.; Villacorta, K.L.; Escalante, C.J.C. Assessment of Macro Waste Density and Composition on Residential Coastal Zones in Surigao City, Philippines. United Int. J. Res. Technol. 2024, 5, 51–58. [Google Scholar]
- Chaouch, R.; Abbes, A.; Djebar, A.B. Déchets solides encombrants les plages d’Annaba. Synthèse Rev. Sci. Technol. 2008, 17, 46–56. [Google Scholar]
- Poitou, I.; Kerambrun, L. Pressions Physiques et Impacts Associés Autres Perturbations Physiques Déchets sur le Littoral. IFREMER. 2012, p. 12. Available online: https://dcsmm.milieumarinfrance.fr/content/download/5291/file/MO_PI_07_Dechets_littoral.pdf (accessed on 23 June 2023).
- Dossou-Yovo, C.A. Macro waste on Benin beaches. Int. J. Agric. Environ. Biores. 2021, 6, 199–208. [Google Scholar] [CrossRef]
- Taleb Bendiab, A.A.; Bourahla, A.; Mazri, C.; Bettiche, F.; Harrat, N.; Bendjerad, M.; Benabderrahmane, S. La Recherche Scientifique au Service de L’agriculture et de la Conservation de L’environnement en Algérie; Maison des Universitaires pour L’édition: Oudjlida Tlemcen, Algérie, 2024; pp. 1–27. Available online: https://www.researchgate.net/publication/378856640 (accessed on 19 August 2024).
- Boussaha, A. Macrodéchets dans le Littoral d’Annaba: Bilan, Impact et Gestion Intégrée; Université Badji Mokhtar-Annaba faculté des Sciences Département des Sciences de la Mer: Annaba, Algeria, 2018; p. 142. Available online: https://biblio.univ-annaba.dz/wp-content/uploads/2019/10/These-Boussaha-Asma.pdf (accessed on 11 July 2023).
- Binetti, U.; Silburn, B.; Russell, J.; Van Hoytema, N.; Meakins, B.; Kohler, P.; Desender, M.; Preston-Whyte, F.; Fa’abasu, E.; Maes, T.; et al. First marine litter survey on beaches in Solomon Islands and Vanuatu, South Pacific: Using OSPAR protocol to inform the development of national action plans to tackle land-based solid waste pollution. Mar. Pollut. Bull. 2020, 161, 111827. [Google Scholar] [CrossRef] [PubMed]
- Hamza, C. La Gestion des Dechets Urbains Solides: Cas de la Ville d’ANNABA. Ph.D. Thesis, Université Badji Mokhtar-Annaba, Annaba, Algeria, 2014; p. 136.
- Hussain, C.M.; Paulraj, M.S.; Nuzhat, S. Chapter 1—Source reduction and waste minimization-concept, context, and its benefits. In Source Reduction and Waste Minimization; Hussain, C.M., Paulraj, M.S., Nuzhat, S., Eds.; Elsevier: Amsterdam, The Netherlands, 2022; pp. 1–22. [Google Scholar] [CrossRef]
- Powell, J.T.; Chertow, M.R. Quantity, Components, and Value of Waste Materials Landfilled in the United States. J. Ind. Ecol. 2019, 23, 466–479. [Google Scholar] [CrossRef]
- Macheca, A.D.; Mutuma, B.; Adalima, J.L.; Midheme, E.; Lúcas, L.H.M.; Ochanda, V.K.; Mhlanga, S.D. Perspectives on Plastic Waste Management: Challenges and Possible Solutions to Ensure Its Sustainable Use. Recycling 2024, 9, 77. [Google Scholar] [CrossRef]
- Bolton, K.; Rousta, K. Chapter 4—Solid Waste Management Toward Zero Landfill: A Swedish Model. In Sustainable Resource Recovery and Zero Waste Approaches; Taherzadeh, M.J., Bolton, K., Wong, J., Pandey, A., Eds.; Elsevier: Amsterdam, The Netherlands, 2019; pp. 53–63. [Google Scholar] [CrossRef]
- Urooj, R.; Tariq, N.; Sajjad, N.; Zaheer, N. Socio-Environmental Impacts of Solid Waste Management. Kurd. Stud. 2024, 12, 78–91. [Google Scholar]
- Mansui, J. Oberservation et Modelisation des Macro-Déchets en mer Méditerranéé, de la Large Échelle aux Échelles Côtiere et Littorale. Ph.D. Thesis, Universite de Toulon, Toulon, France; Universite Aix Marseille, Marseille, France, 2015; p. 174. [Google Scholar]
- Ibrahima, A.; Traore, S.S.; Dolo, A.D.M. Assainissement et Risques de Maladies dans la Commune vi du District de Bamako, Mali. ESJ 2023, 19, 136. [Google Scholar] [CrossRef]
- Guylain, N.N.; Benjamin, K.T.; Aimé, K.K. Impact of household waste on the environment and health in the periphery of Kinshasa, DRC. Afr. Sci. J. 2023, 3, 148. [Google Scholar] [CrossRef]
- Raphela, T.; Manqele, N.; Erasmus, M. The impact of improper waste disposal on human health and the environment: A case of Umgungundlovu District in KwaZulu Natal Province, South Africa. Front. Sustain. 2024, 5, 1386047. [Google Scholar] [CrossRef]
- Galgani, F.; Bruzaud, S.; Duflos, G.; Fabre, P.; Gastaldi, E.; Ghiglione, J.; Grimaud, R.; George, M.; Huvet, A.; Lagarde, F.; et al. Pollution des océans par les plastiques et les microplastiques. Bioprocédés Bioprod. 2020, 1–14. [Google Scholar] [CrossRef]
- Amedokpo, Y.T. Problématique des Déplacements Forces de Populations dans L’amenagement de L’agglomeration Urbaine de Lome. Ph.D. Thesis, University of Lomé, Lomé, Togo, 2019; p. 376.
- Ministère de la Planification du Développement et de la Coopération, 5ème Recensement General de la Population et de L’habitat RGPH-5, November 2022. Available online: https://www.togofirst.com/images/2023/RECENSEMENT_RESULTATS_.pdf (accessed on 15 December 2022).
- Galley, Y.G.; Loungou, S. Marquage ethnique, marquage sociopolitique à Libreville et Lomé. Villes Parallèle 2007, 40, 56–79. [Google Scholar] [CrossRef]
- Pottier, P.; Ovono, Z.M.; Faure, F.E.; Bignoumba, G.-S. Les Régions Littorales du Gabon Elément de Réflexion Pour une Planifacation Strategique du Territoire, Raponda-Walker (Gabon); UMR 6554 CNRS; LETG-Nantes Géolittomer: Nantes, France, 2016; Available online: https://fr.scribd.com/document/395919426/reg-litto-Gabon-pdf (accessed on 13 October 2024)ISBN 978-2-9552583-2-3.
- Mombo, J.B.; Itongo, M.T. Gestion du site et risques naturels à Libreville. Gabonica Rev. Cergep 2011, 5, 103–123. [Google Scholar]
- Beka Beka, A. Processus d’urbanisation et habitat au Gabon: Diagnostic et résilience des populations du «Grand Libreville». RegardSuds Numero Spécial, December 2020; 3–20. [Google Scholar]
- Direction Générale de la Statistique (DGS) Libreville. Résultats Globaux du Recensement General de la Population et des Logements de 2013 du Gabon (RGPL2013), October 2015, p.97. Available online: https://gabon.unfpa.org/sites/default/files/pub-pdf/Resultats%20Globaux%20RGPL%281%29.pdf (accessed on 13 October 2024).
- Morvan, B. Méthode de caractérisation des déchets ménagers: Analyse sur produit sec. Environ. Ingénierie Développement 2000, 20, 9–11. [Google Scholar] [CrossRef]
- Madiha, B.; Hamida, L. Contribution à l’Identification et à la Quantification des Déchets Solides Générés par les Estivants Dans la Plage de Corso (Wilaya de Boumerdès, Algérie) Approche Socio-Économique et Écologique. Master’s Thesis, Université Mouloud Mammeri, Tizi Ouzou, Algérie, 2015; p. 78. [Google Scholar]
- Nikiema, B.C.A. Déchets plastiques à Ouagadougou: Caractérisation et Analyse de la Perception des Populations (Burkina Faso). Master’s Thesis, Institut International d’Ingénerie de l’Eau et de l’Environnement, Ouagadougou, Burkina Faso, 2012; p. 62. Available online: http://documentation.2ie-edu.org/cdi2ie/opac_css/doc_num.php?explnum_id=191 (accessed on 13 October 2024).
- Mouloungui Kussu, L.B.; Zoo Eyindanga, R.C.; Vimenyo, M.; Ngawandji, B.N.; Fiagan, K.-A.; Mambani, J.-B. Physical Characterisation and Analysis of the Perception of Potential Risks Associated with the Proliferation of Solid Waste along the Lomé Coastline in Togo. Sustainability 2024, 16, 4968. [Google Scholar] [CrossRef]


Disclaimer/Publisher’s Note: The statements, opinions and data contained in all publications are solely those of the individual author(s) and contributor(s) and not of MDPI and/or the editor(s). MDPI and/or the editor(s) disclaim responsibility for any injury to people or property resulting from any ideas, methods, instructions or products referred to in the content. |
© 2025 by the authors. Licensee MDPI, Basel, Switzerland. This article is an open access article distributed under the terms and conditions of the Creative Commons Attribution (CC BY) license (https://creativecommons.org/licenses/by/4.0/).