Abstract
The processing of copper-bearing scrap makes it possible to reduce the costs and energy consumption of obtaining copper alloy products compared to producing them from primary raw materials. To achieve this, it is necessary to quickly and accurately determine the content of alloying elements in individual scrap elements. However, the copper-bearing scrap obtained at secondary raw materials collection points consists of elements with various surface conditions (due to contamination, shape, paint coatings, roughness, etc.). The paper contains research results on the influence of surface roughness and paint coatings on the measurement result of the content of alloying elements in copper-bearing scrap. Three mobile spectrometers were used for measurements: spark-induced optical emission spectroscopy (OES), X-ray fluorescence spectrometry (XRF) and laser-induced breakdown spectroscopy (LIBS). The tests used elements with different surface roughness (from Ra = 0.03 μm to 6.7 μm) and covered with various types of varnish (alkyd, water-based, oil-phthalic, acrylic, oil-alkyd). It was found that the roughness of Ra < 2 μm does not significantly affect the results of the measurements with the OES and LIBS spectrometers, and a larger scatter of measurement results was observed for the XRF spectrometer compared to OES and LIBS. For Ra > 2 μm, a significant impact of roughness was found on the measurement results (this may result in the erroneous classification of the scrap as an incorrect material group). The influence of paint coatings on the measurement is much stronger compared to surface roughness. Even a single layer of paint can cause a change in the measurement result of the content of alloying elements by more than 10%. In the case of an OES spectrometer, paint coatings may prevent the measurement from being performed (which means that no measurement result can be acquired).
1. Introduction
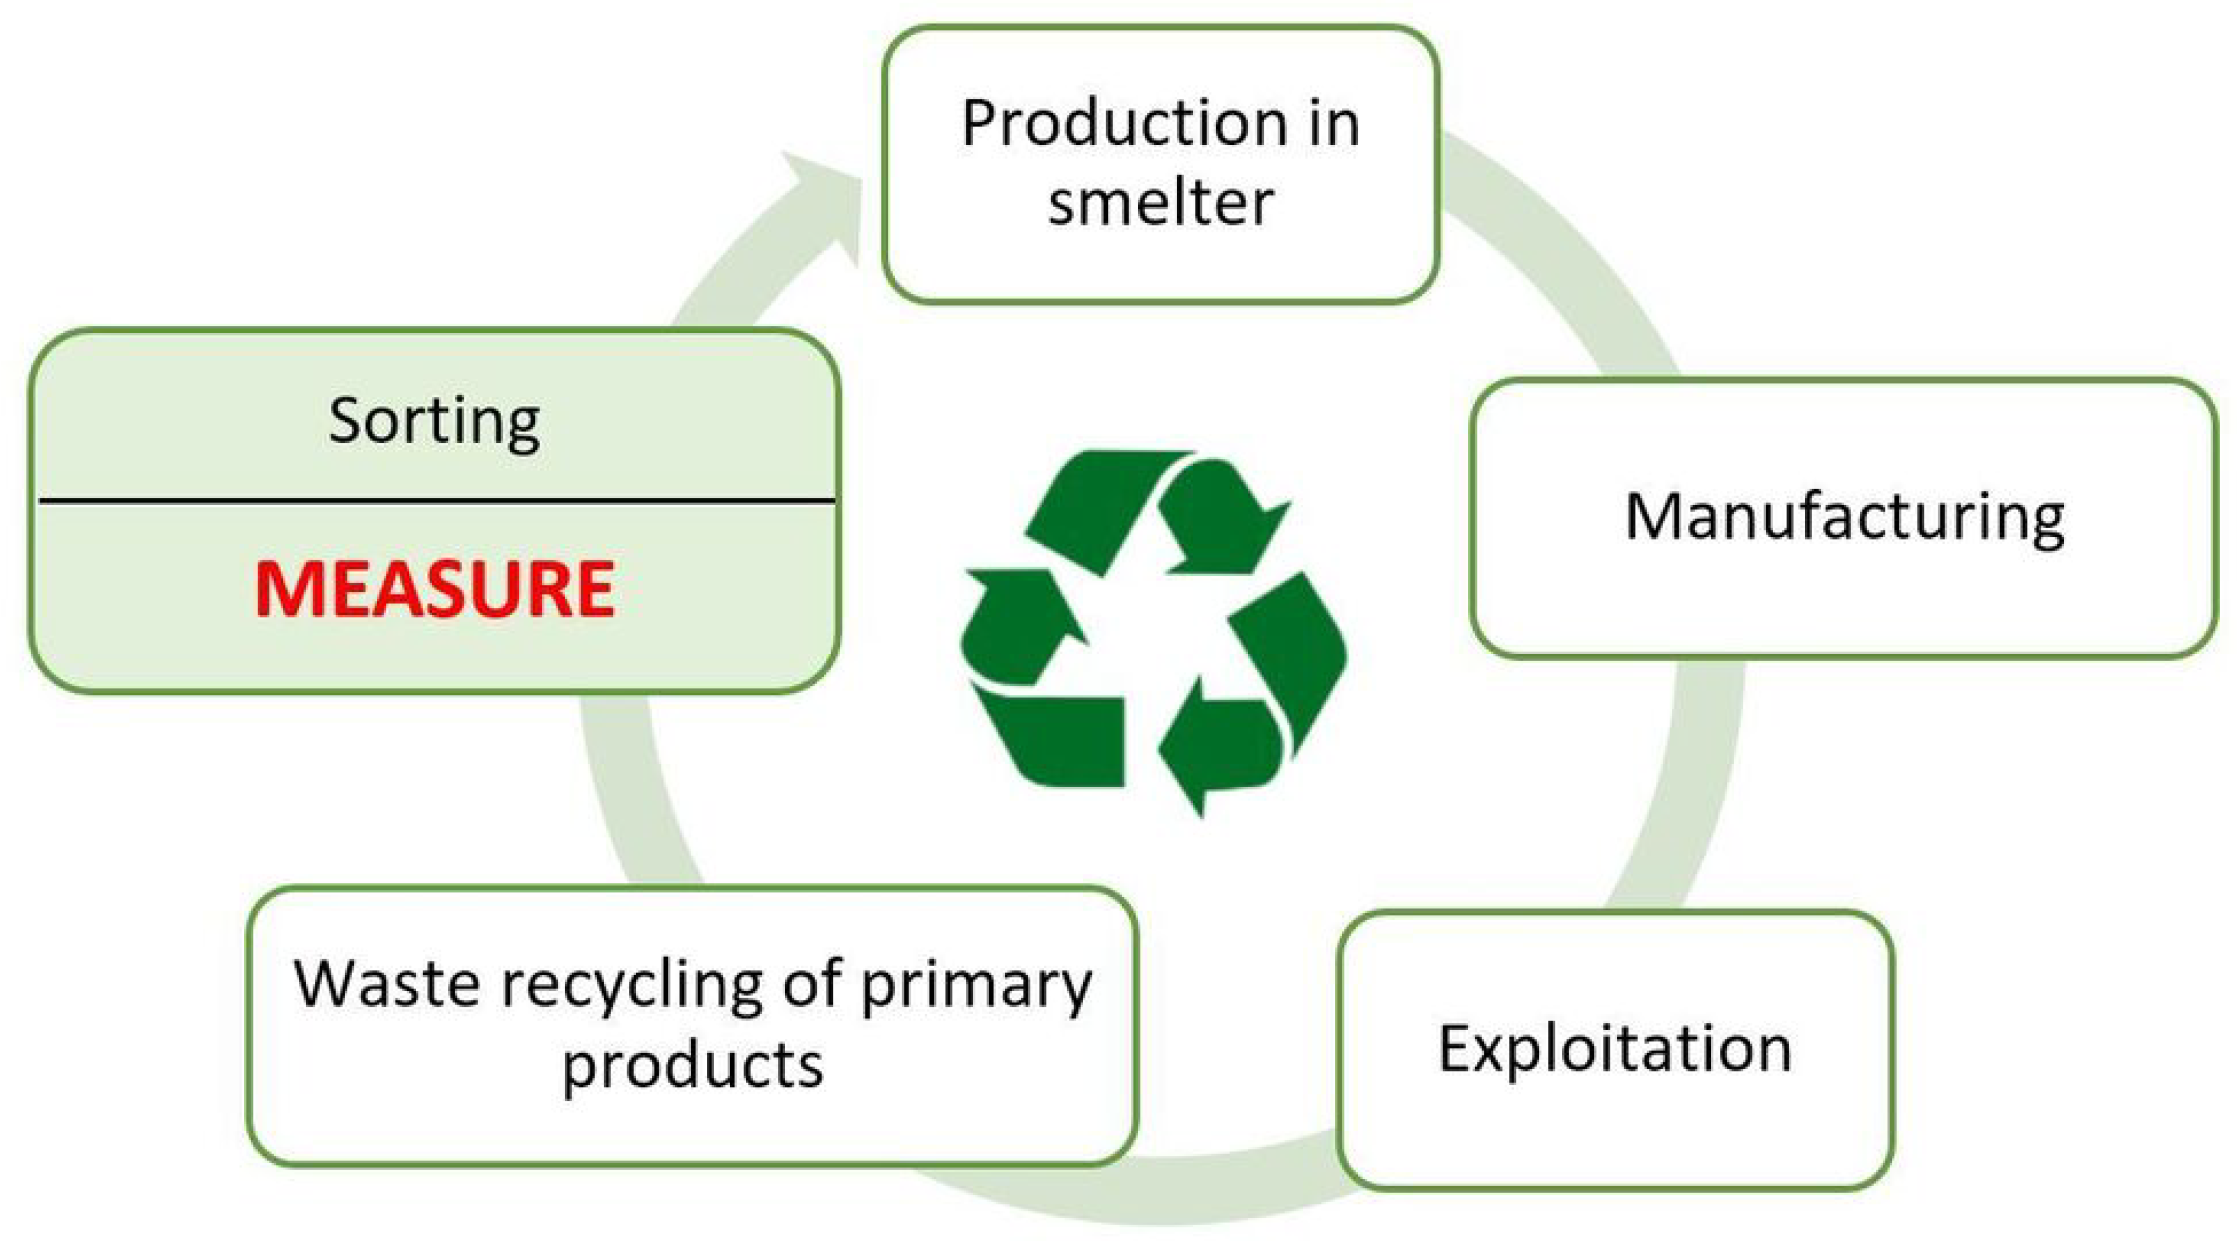
Recycling, i.e., the reprocessing of materials in the production process, is an important factor in reducing the manufacturing costs of copper and its alloys compared to the production of its products from raw materials [1,2]. The undoubted advantage of recycling copper bearing materials, in which the copper content ranges from 10% (ashes and slags) to almost 100% (wires, strips), is that if the copper melting process is carried out correctly, the material obtained does not lose its original properties. The effective use of copper alloy scrap requires its accurate sorting, which allows the scrap to be classified into the appropriate material group. For this purpose, after recovering the recyclables, the chemical composition is first measured, and then the sorting process is carried out. The reliability of the measurement of the chemical composition depends on the surface condition of the copper scrap [3]. The condition of such a surface is related, among other things, to the shape and roughness of the surface and the applied paint coatings. Reliable measurement of chemical composition is essential for the proper segregation of scrap materials into various material groups of copper alloys. In many cases, mobile spectrometer users are not aware of the possibility of incorrect measurement of the chemical composition resulting from an unprepared sample surface. Although the scrap surface appears to be clean during visual inspection, even trace amounts of grease, varnish, and even larger scratches, etc. will cause incorrect measurement results. Obtaining a reliable measurement result is necessary for the correct separation of scrap into proper material groups of copper alloys. The quality of such segregation has important implications during the subsequent melting process of the acquired material groups in the smelter. If the scrap is poorly sorted, it will be necessary to increase or decrease the elemental content of the input material and prolong the smelting process, increasing the cost of obtaining the expected copper alloy. A diagram of the copper-bearing material cycle including scrap measurement and sorting is shown in Figure 1.
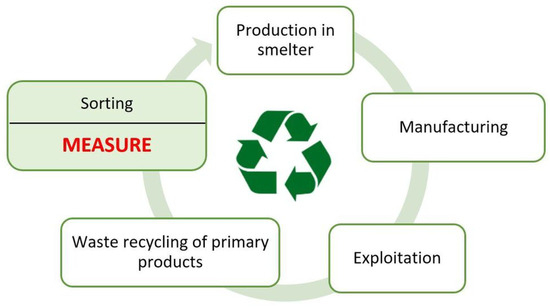
Figure 1.
A diagram of the copper-bearing material cycle.
Scrap metal are used metals that are an important source of industrial metals and alloys, particularly in the production of steel, copper, lead, aluminum, and zinc. Smaller amounts of tin, nickel, magnesium, and precious metals are also recovered from scrap. Scrap is usually blended and remelted to produce alloys similar to or more complex than those from which the scrap was derived [4]. Metal scrap is a collection of elements with very diverse shapes and cleanliness of the surface. The results of laboratory measurements of the chemical composition of prepared samples (cleaned, planed) samples are known. In the industrial automatic sorting process, the number of scrap items is very large. Cleaning and scheduling each sample is impossible. Therefore, it is important to know the influence of the surface condition of the samples (in this case scrap elements) on the result of the chemical composition measurement.
The research goal of the paper is to investigate the influence of the surface condition of copper-bearing scrap elements on the result of measuring the chemical composition with spectrometers used in industrial sorting of scrap. The paper presents the influence of roughness and paint coatings on the measurement results with three spectrometers (spark-OES, XRF, and LIBS). The influence of surface roughness on the measurement results of the Cu, Zn, Sn, Pb, Si, Al and Fe content was determined for scrap elements made of CuZn37, CuSn5Zn5Pb5, CuZn35Pb1.5, CuSn10P and CuZn39Pb3. In the study of the influence of paint coatings with different numbers of layers, the following pairs were taken into account: alkyd paint—spraying on CuZnPb, water paint—spraying on CuZnPb, anticorrosion paint—brush on CuZnSn, oil-alkyd paint—brush on CuZnPb, acrylic enamel—brush on CuZn, and oil-phthalate enamel—brush on CuZnSn.
2. Mobile Spectrometers for Measuring the Content of Chemical Element in Copper Alloys
Effective separation of copper alloy scrap and copper-bearing waste materials requires determining the content of selected alloy elements. To quickly measure the chemical composition of scrap samples, mobile devices based on the following types of spectroscopy are currently used:
- optical emission spectroscopy with spark excitation (OES)
- X-ray fluorescence spectrometry (XRF)
- laser-induced breakdown spectroscopy (LIBS)
Regardless of the measurement method used, operation of the high-tech equipment is simple and intuitive. After starting the device, the user must select a program for a specific material group (e.g., copper alloys, aluminum, iron, etc.), inspect a standard sample and, if necessary, correct the calibration curves to make the measurements as reliable as possible [5,6].
Sorting of scrap metal is carried out by specialized companies that have the necessary infrastructure, including storage areas for the acquired scrap metal, where the segregation process is carried out. Taking into account the conditions of such areas and the condition of scrap metal, especially its surfaces, the measurement methods used should have the following characteristics:
- appropriate accuracy of chemical composition measurement,
- repeatability of measurement results,
- ease of recalibration,
- user safety,
- short time of performing the measurement,
- resistance to atmospheric conditions,
- low sensitivity to surface quality.
The advantage of the devices working with XRF technology is that there is no damage to the surface to be tested, so they are also used to analyze antique objects and those that must not be damaged [7,8,9]. In addition, the technology can be used to measure powders and geodesic materials [10,11,12,13]. Spectrometers operating in LIBS technology [14], due to the better detection of light elements (aluminium, magnesium, silicon, etc.), are used more often for measurements of aluminium alloys [15]. In the case of copper-bearing scrap, they detect e.g., aluminium and silicon bronze better, and the measurement time is much shorter than the XRF method.
Based on the experience of those professionally involved in scrap sorting [16,17], Table 1 shows the advantages and disadvantages of mobile spectrometers.

Table 1.
The advantages and disadvantages of mobile spectrometers.
Reliable measurement of chemical composition using the spark excitation emission spectrometer (OES) requires preparing the surface of the component to be tested. Surface contaminants, e.g., grease, oil, varnish, can effectively prevent the formation of a spark between the electrode and the surface of the component. During the measurement, a protective atmosphere is generated in the immediate vicinity of the measurement point (by providing a protective gas, such as argon). The measurement time with such a spectrometer, considering the preparation of the element, can take 1 to 4 min. It is noteworthy that mobile OES spectrometers are large and heavy devices (a cylinder of protective gas is necessary), and the gun-shaped measuring probe is connected to the central unit via a long cable, making it sometimes cumbersome to perform the measurement. It should be noted that the results of measuring the chemical composition of components with properly prepared surfaces using such a spectrometer are often considered as reference.
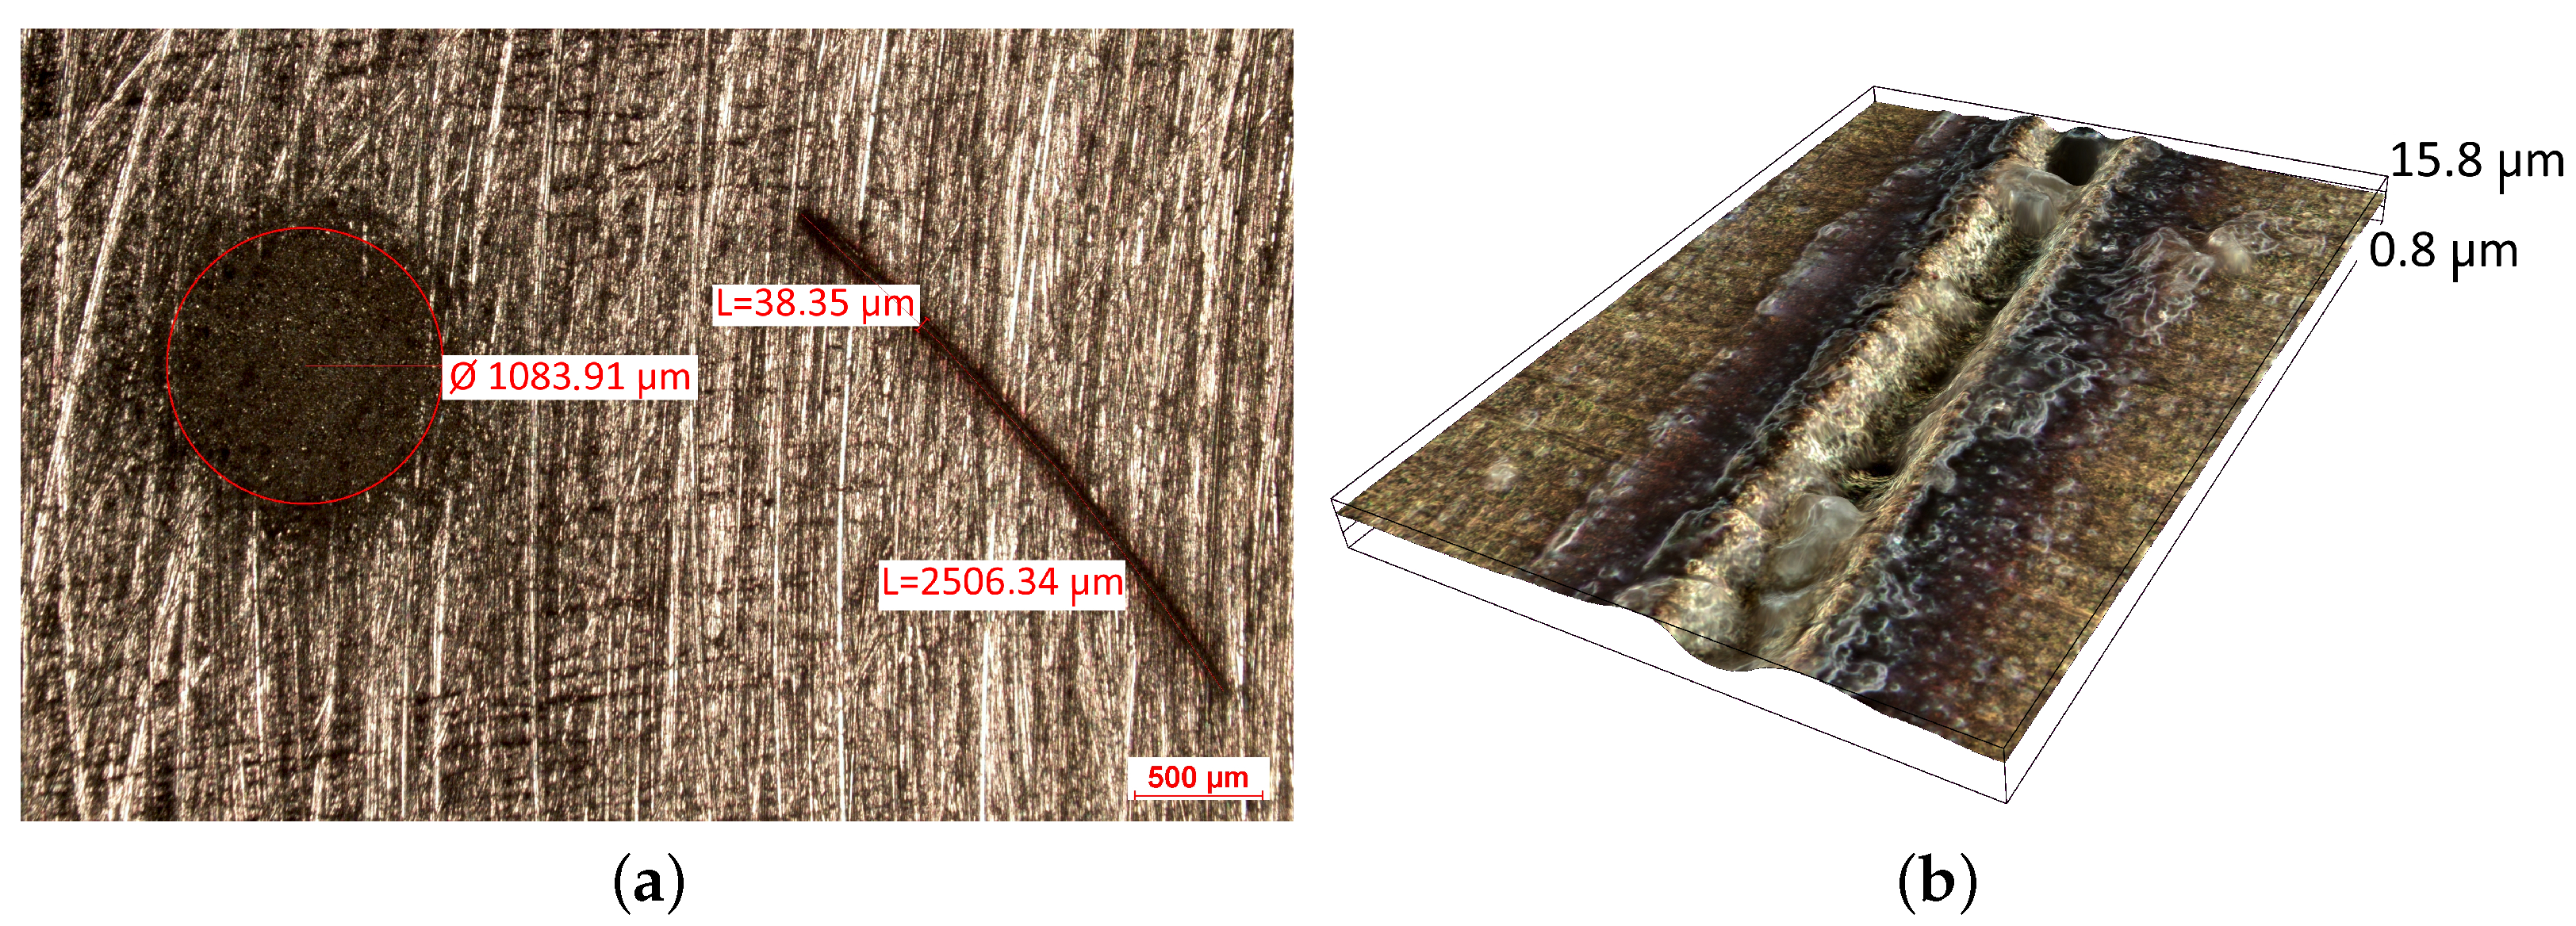
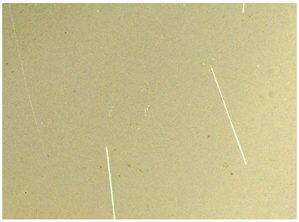
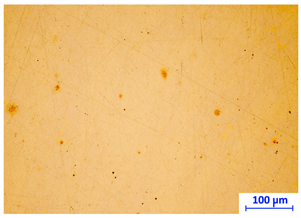
Handheld spectroscopic devices based on the X-ray fluorescence (XRF) and laser-induced breakdown spectroscopy (LIBS) methods [18] allow measurements to be made in a matter of seconds giving them a major advantage over OES spectrometers. The XRF and LIBS [19] spectrometers are small and light enough (to be used with one hand) that they can be freely delivered to the desired measurement site (e.g., to a designated point in a scrap yard), and are ready for operation virtually immediately. These devices do not require the generation of a protective atmosphere around the measurement point. The advantage of the XRF devices is that their measurements are completely nondestructive compared to LIBS technology, where a small scratch of about 2.5 mm in length and 38 μm in width remains after measurement (Figure 2b) and to OES whose measurements leave a pronounced surface indentation of about 1 mm in diameter, Figure 2a.
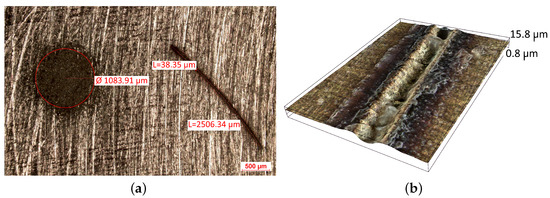
Figure 2.
View of traces left by spectrometer measurements: (a) OES and LIBS (b) LIBS.
Obviously, in the case of scrap testing, this does not matter, and what is important is the reliability of the chemical composition measurement result. During the operation of XRF and LIBS spectrometers, it is necessary to ensure the cleanliness of the measurement window and lenses, which is usually a minor maintenance task.
Measuring the Chemical Composition of Scrap Copper Alloys
The chemical composition of the prepared copper alloy scrap samples was measured with three mobile spectrometers using the following measurement methods:
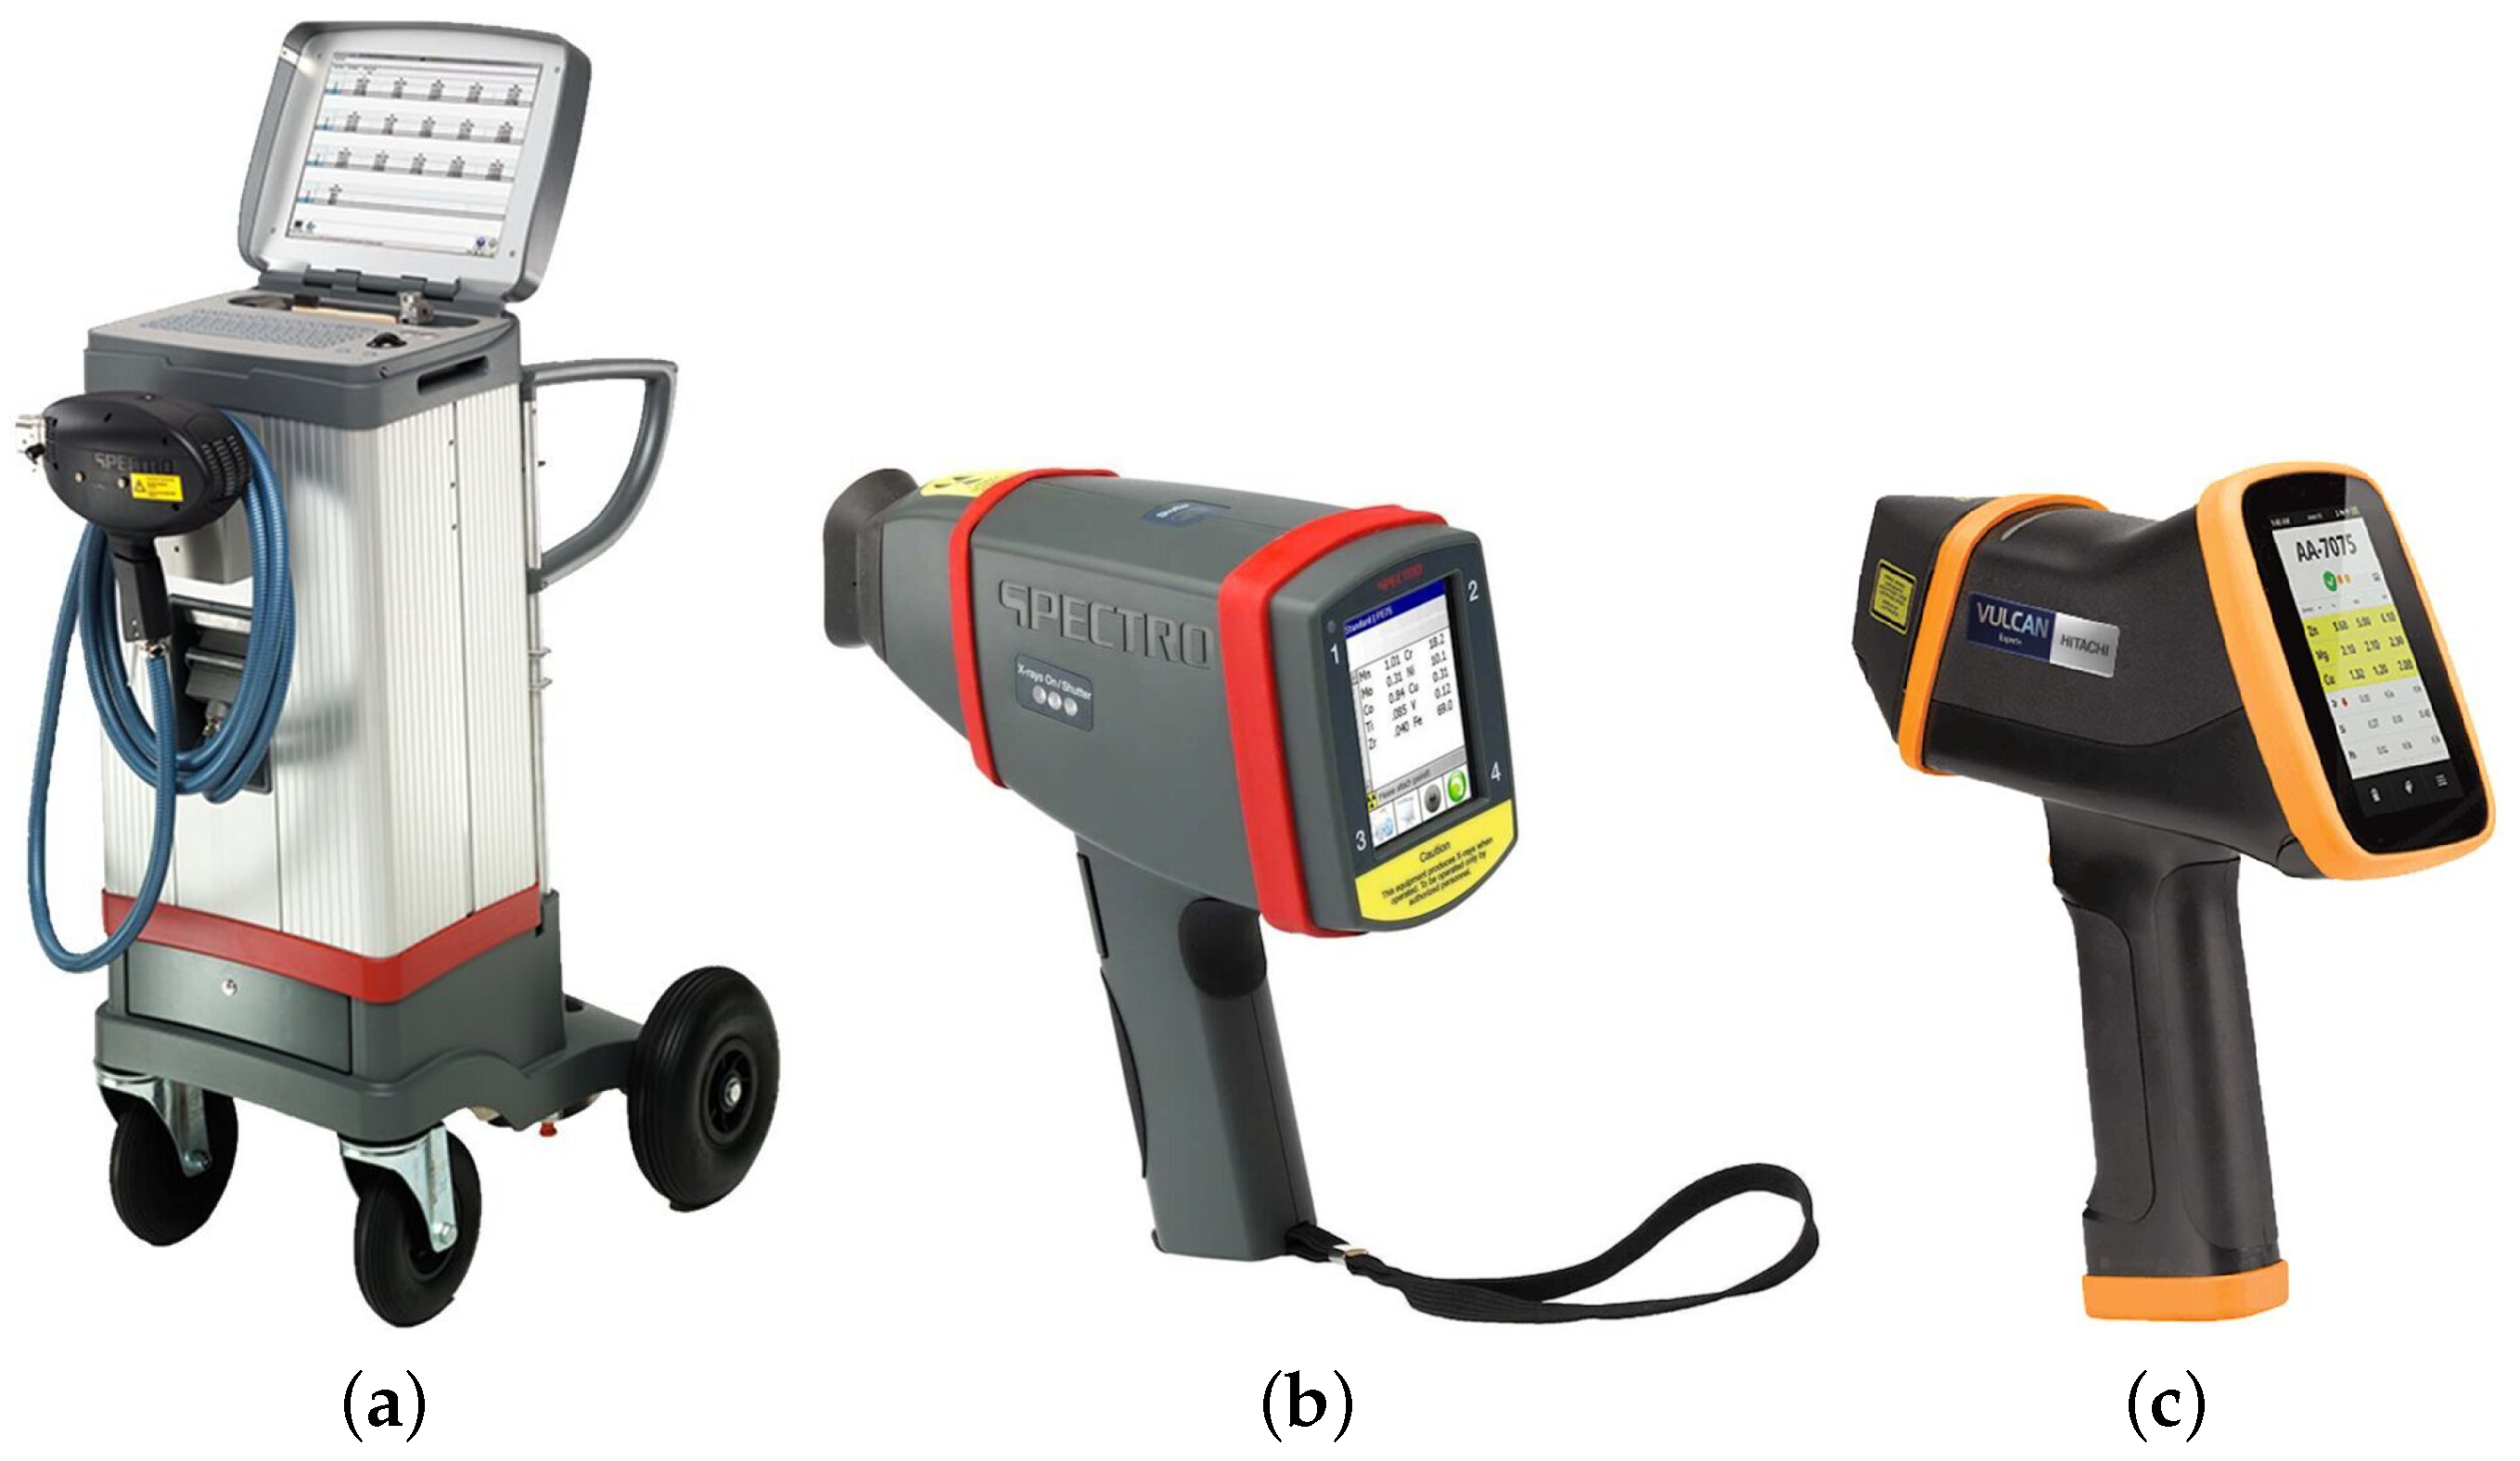
- SPECTROTEST (Figure 3a)—spark-excited optical emission spectroscopy (OES)
 Figure 3. Spectrometers used for chemical composition measurements: (a) OES, (b) XRF, (c) LIBS.
 - Spectro Xsort (Figure 3b)—X-ray fluorescence spectrometry (XRF)
- Hitachi VULCAN Expert (Figure 3c)—laser-induced breakdown spectroscopy (LIBS)
All measurements of the chemical composition of the samples were made under the same environmental conditions (ambient temperature °C and humidity ). Three measurements were made on each surface with a given spectrometer. The middle value (median) determined from the three measurement results was used to present the test results (below in the publication). Note that the results of OES spectrometer measurements made on leveled (planed) and cleaned surfaces are often treated as correct (reference) values. However, in industrial sorting of copper scrap, the requirement for a well-cleaned and planed sample surface is practically impossible to meet, and therefore the results of measurements using OES spectrometers should be thoroughly analyzed, as in the case of LIBS and XRF spectrometers.
3. Review of the Surface Condition of Scrap to Be Sorted When Recycling
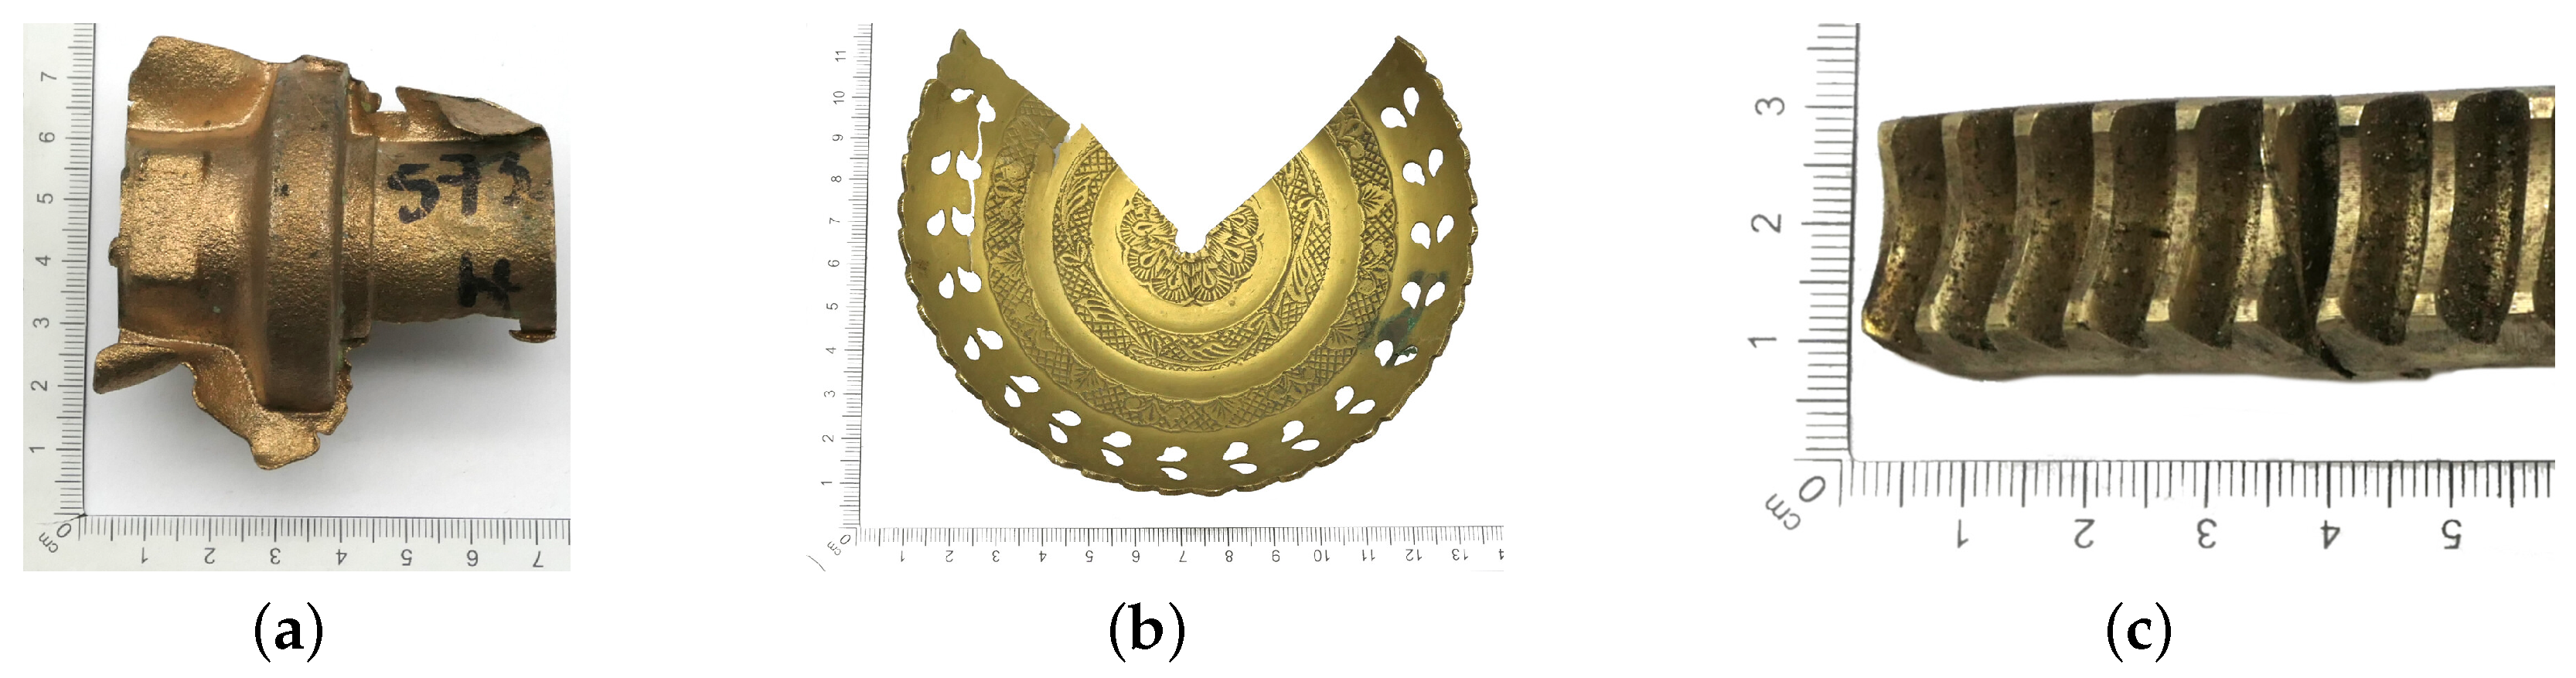
Because large quantities of scrap metal are delivered to the scrap yard, sorting must be carried out quickly and accurately. In some cases, this process can be difficult or impossible to perform due to the form and quality of the material delivered. Copper-bearing materials, in addition to their chemical composition, are mainly classified as postproduction materials and as postamortization/postconsumption materials. The first group is the most desirable material due to the absence or minimal amounts of impurities found on the surface of copper-bearing elements, e.g., defective components (Figure 4a), filling systems (Figure 4b) or punching scraps (Figure 4c). Post-amortization scrap comes from usable components that may have contaminants such as grease, dried oil (Figure 4d), varnish coatings (Figure 4e) or protective coatings, for example, chrome plating (Figure 4f).
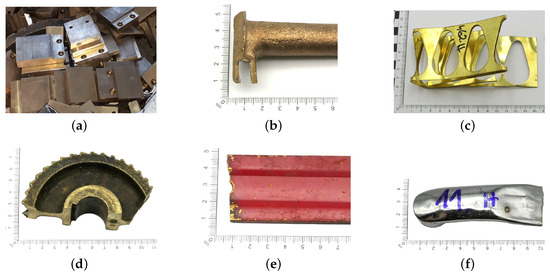
Figure 4.
Surface view of example copper-bearing materials: (a–c) post-production scrap, (d–f) post-amortization scrap.
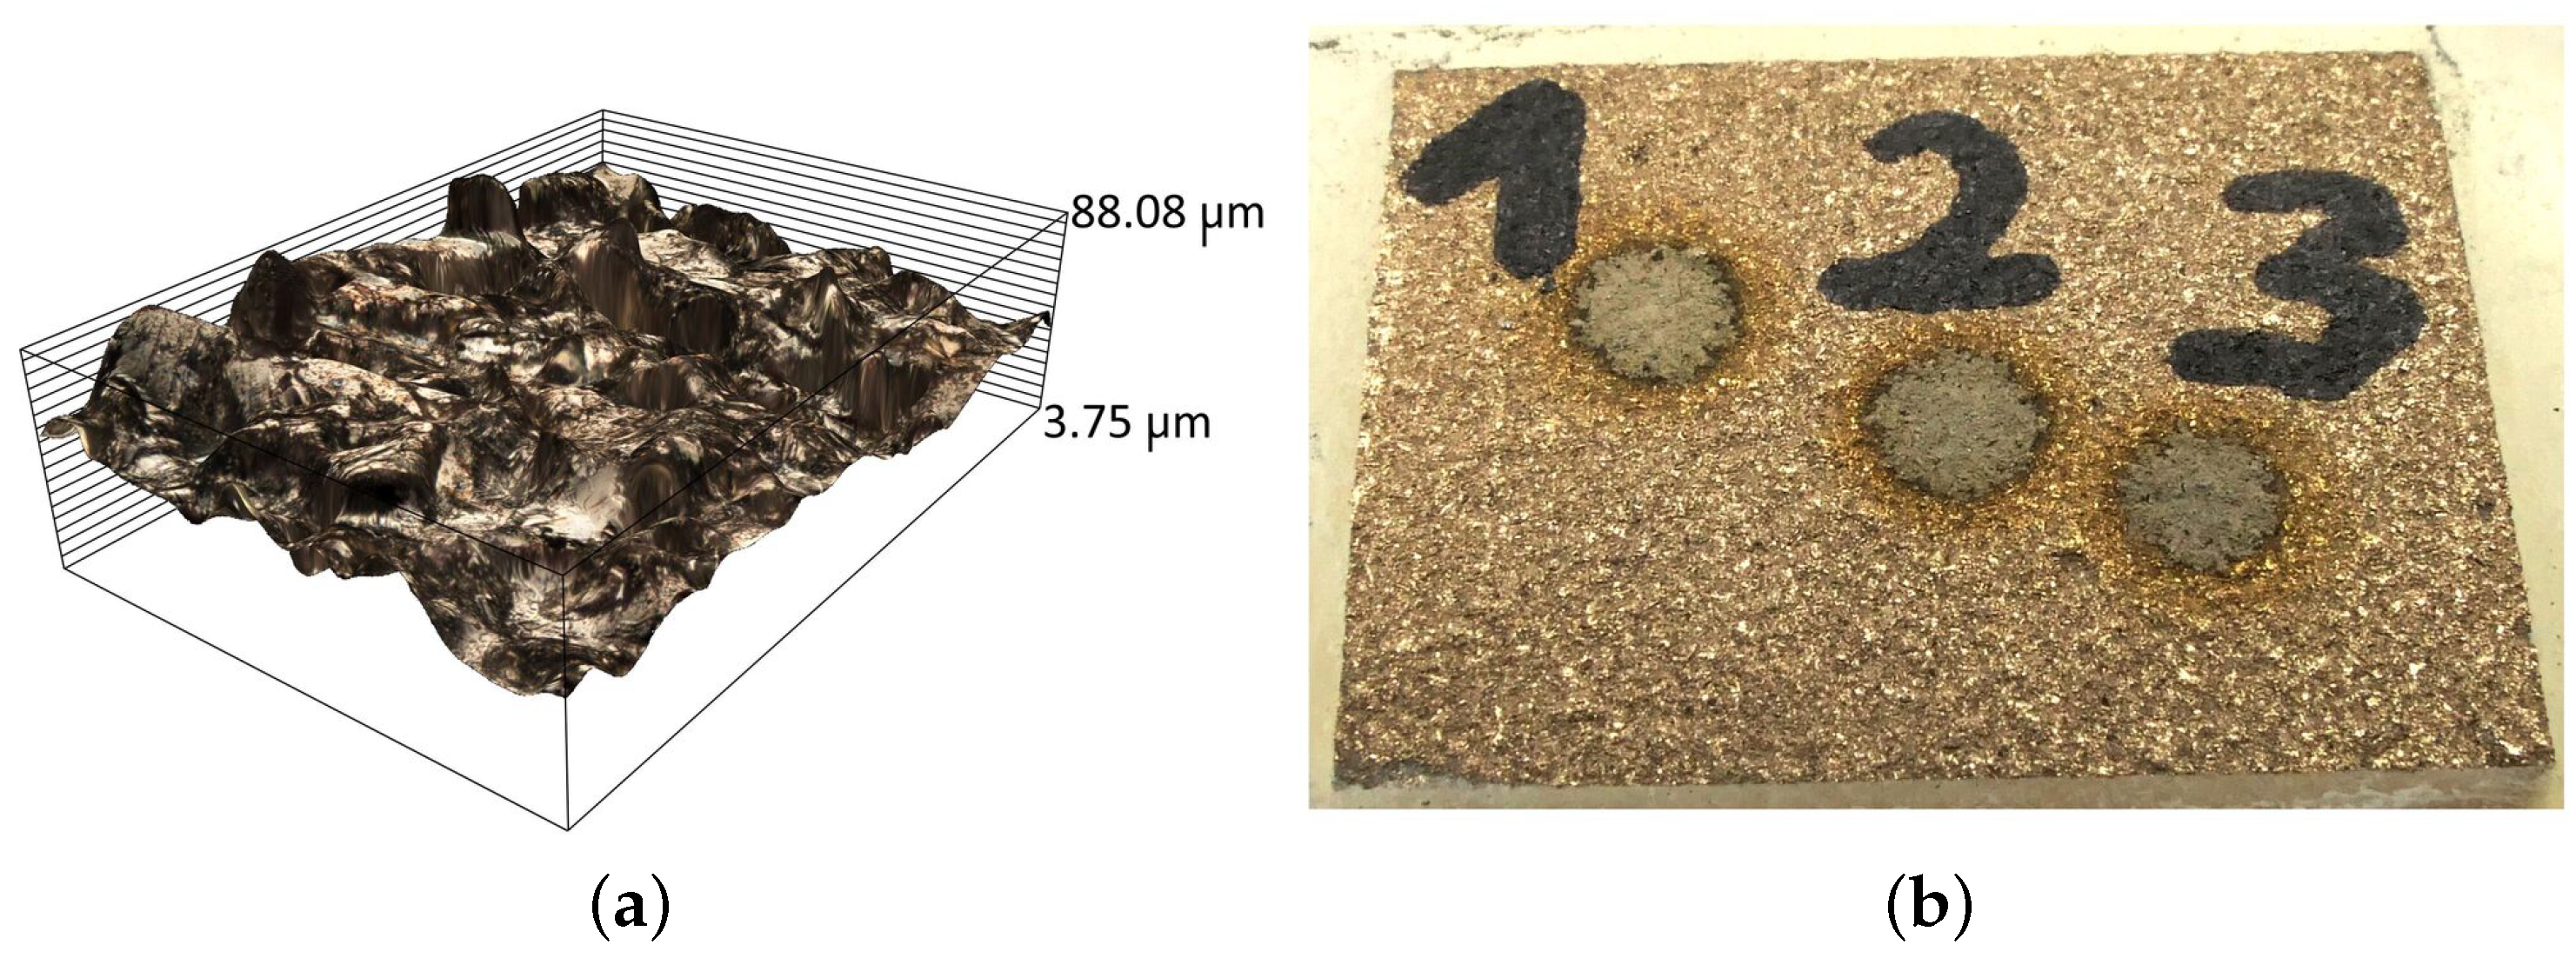
In addition to the cleanliness of the scrap surface, an important factor that affects the efficiency of sorting is the roughness of the surface, which depends on the manufacturing method and operating factors, among others. At present, the main manufacturing technologies are nonabrasive (casting, forming) and shaping (turning, milling). Each of them is characterized by obtaining surfaces with different roughness values. The highest surface roughness occurs in the case of manufacturing parts made in molding compounds (Figure 5a), whose roughness is up to , while the lowest roughness values () are reached when parts are machined using various types of plastic working (Figure 5b). In subtractive manufacturing (Figure 5c) the roughness can vary from to and higher, which depends on the type of machining used.
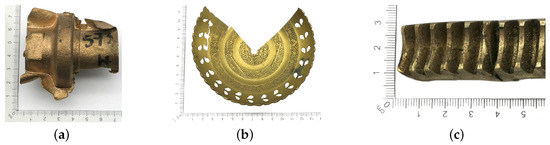
Figure 5.
Examples of scrap pieces of metal parts made using the processes of (a) casting, (b) plastic working, (c) subtractive manufacturing.
Another problem that occurs when measuring the chemical composition under field conditions is the shape of the component being tested. In the case of surfaces with a small radius, such as pipes, bushings, shafts, spheres, etc., the use of an OES spectrometer to measure chemical composition will make it virtually impossible to obtain a correct measurement result. Samples of this type will cause two problems. The first will be related to the gap between the sample and the spectrometer table (Figure 6a), which will prevent the full protective gas atmosphere needed for proper spark and plasma formation. The second concern may arise with spherical samples, where the correct distance between the surface of the sample and the tungsten electrode will not be maintained (Figure 6b). When the scrap pieces are wavy (Figure 6c) regardless of the spectrometer used, the measurement will not be performed correctly. In the case of spectrometers operating with XRF and LIBS technology, it does not matter much if the axis of the spectrometer’s measurement window is perpendicular to the surface to be examined.
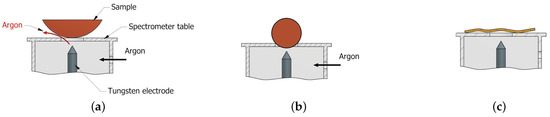
Figure 6.
Problems arising from the shape of the sample when using the OES spectrometer: (a) escape of the gaseous layer, (b) insufficient tungsten electrode—element distance, (c) wavy surface.
In view of the above information on the materials that reach the scrap yard, manufacturers of mobile spectrometers recommend preparing the scrap in terms of removing any contaminants present on the surface and planning the sample, which is particularly important when using spark spectrometers. Taking into account the properties of the scrap to be sorted, two factors that can significantly affect the results of chemical composition measurements were identified: surface roughness and paint coatings.
3.1. Specification of Samples Selected for the Study of the Effect of Roughness on the Results of Chemical Composition Measurements
A copper alloy scrap differentiated by chemical composition, manufacturing technology, and surface layer was selected to investigate the effect of surface roughness [20] on the results of chemical composition measurements. The appearance, material group, and fabrication technology of the selected scrap are presented in Table 2.
Table 2.
The appearance, material group and fabrication technology of the selected scrap.
Table 3 summarizes the results of the measurement of the chemical composition of each material group using OES spectrometers (following the preparation of the sample surface according to the recommendations of the spectrometer manufacturer). The results of the elemental content measurements confirm that the samples belong to the selected material groups.
Table 3.
Measurement results (OES spectrometer) of chemical composition of samples from material groups 1–5.
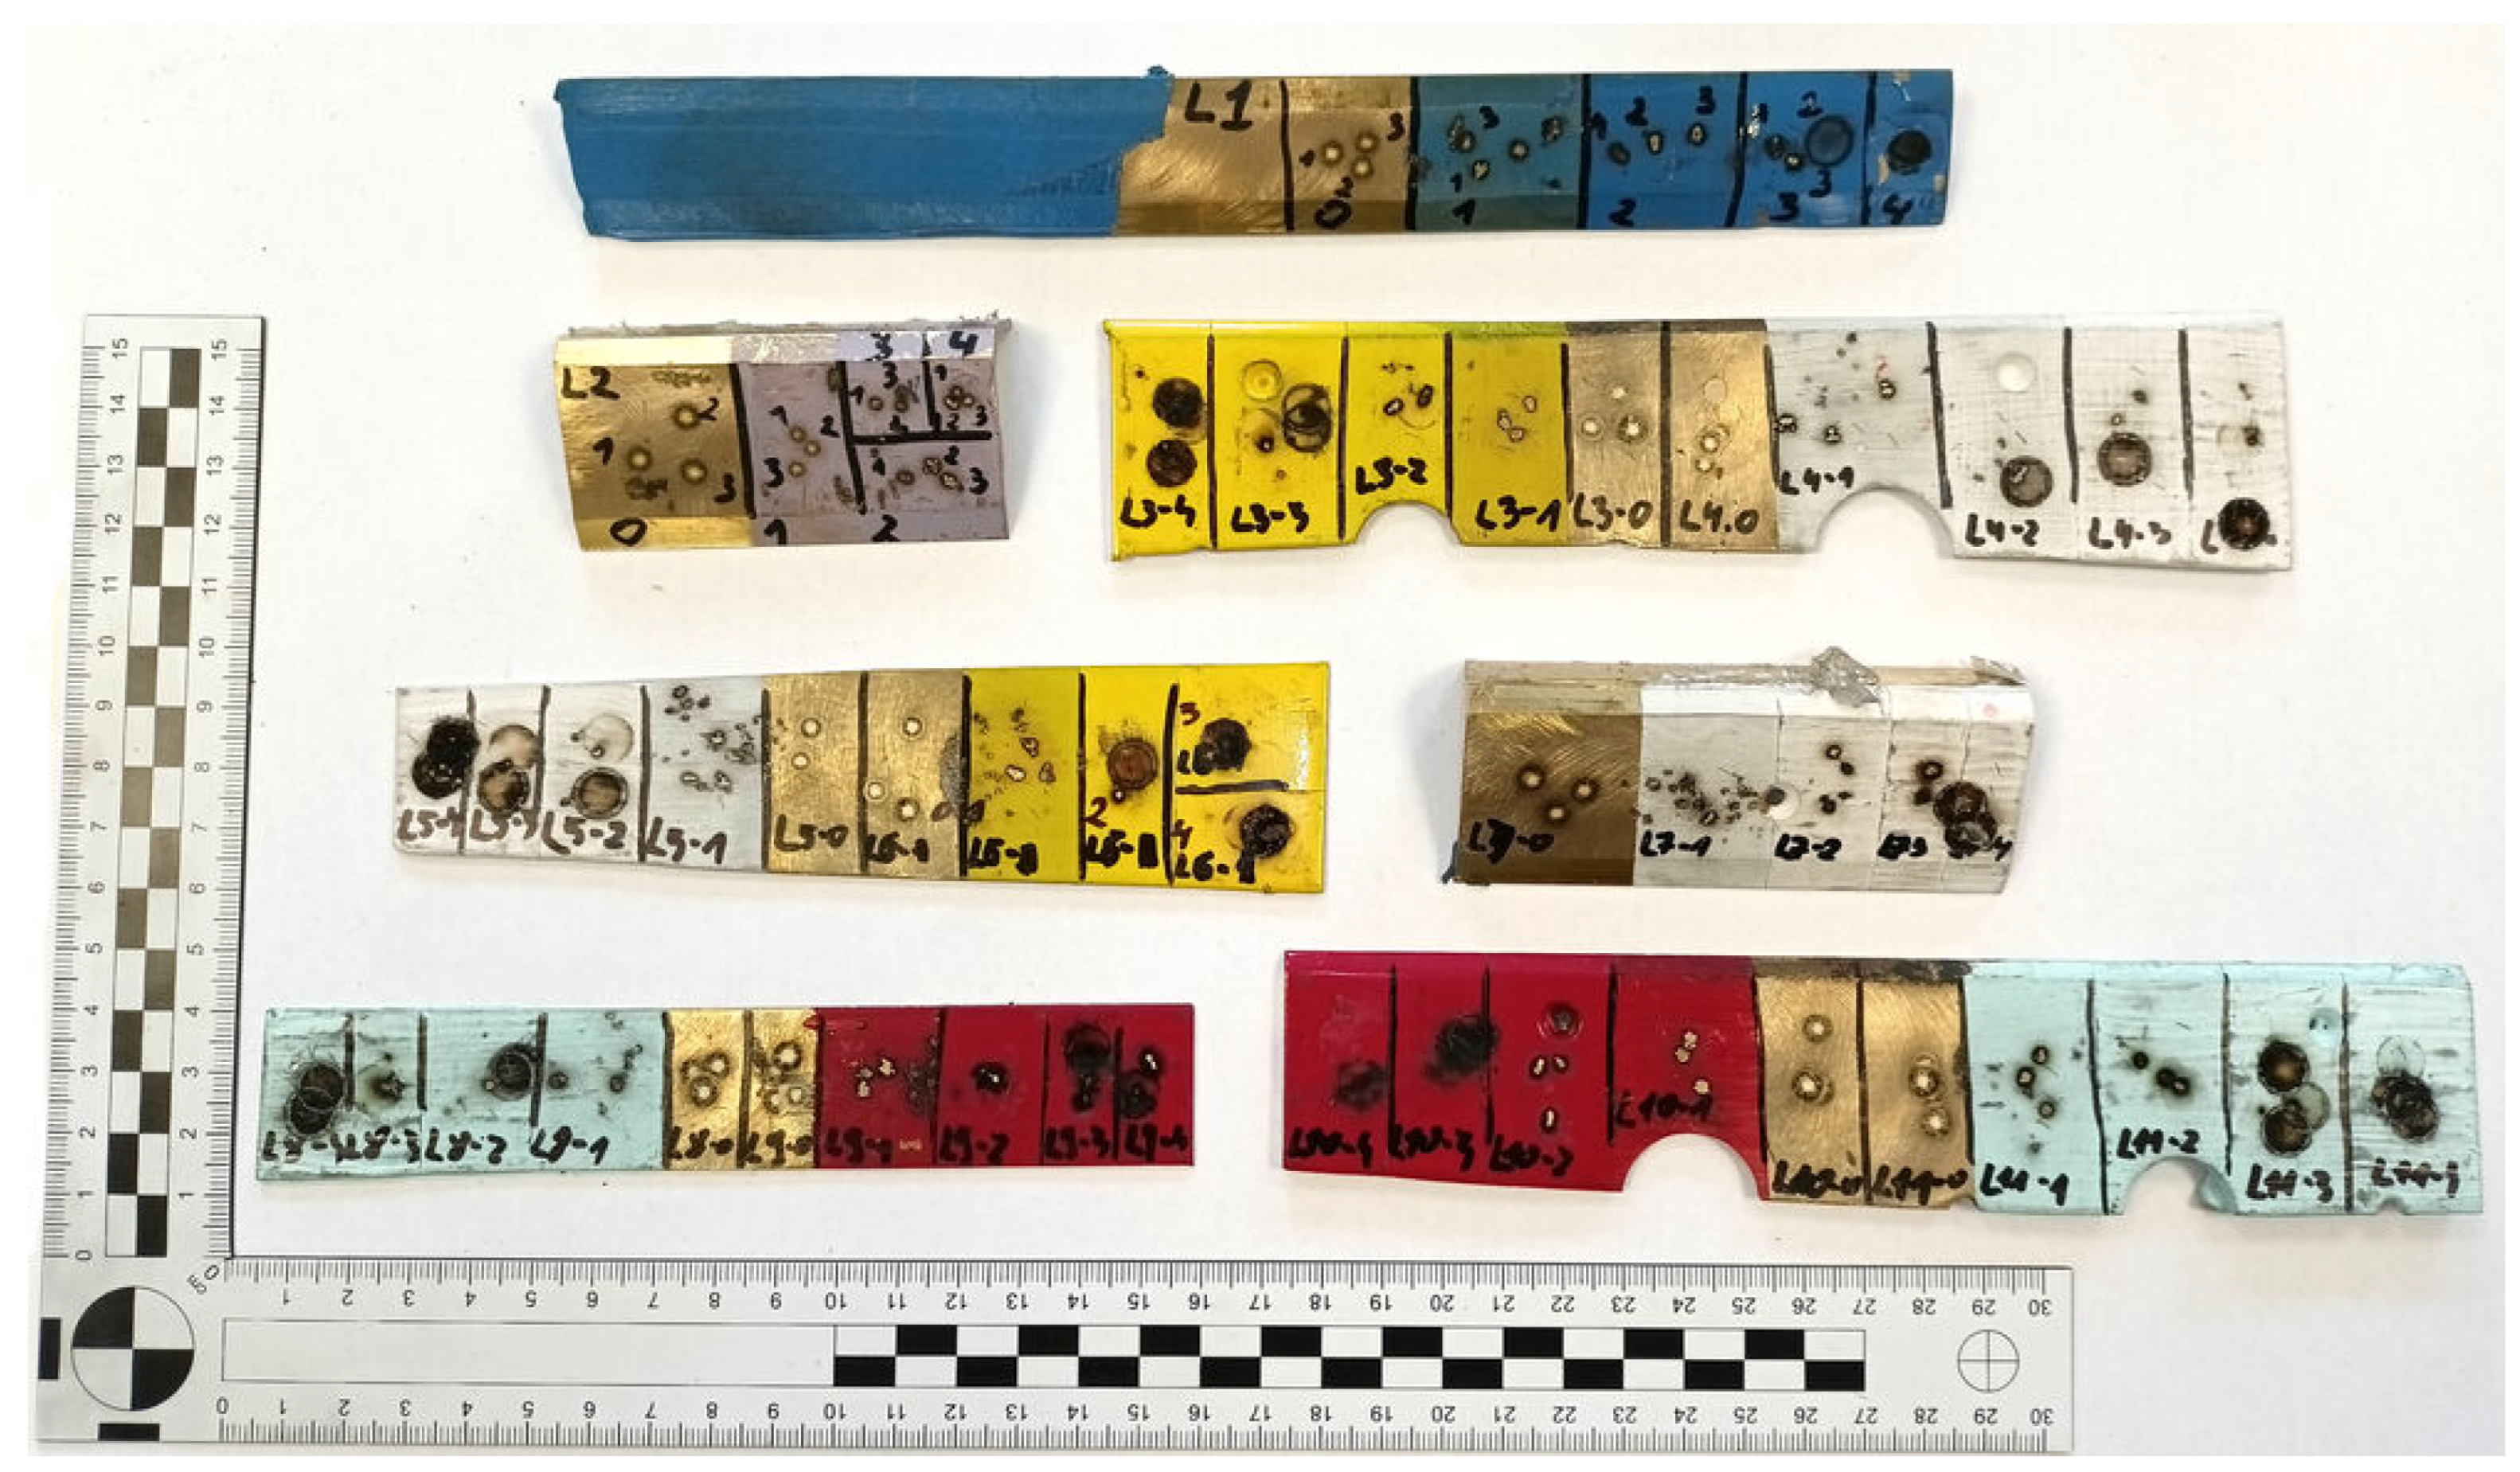
Samples of were cut from each item (the scrap selected for testing), and each sample was assigned its unique ID. For the planned tests, the samples were subjected to abrasive treatment using sandblasting, SiC waterproof sandpaper of different grades and diamond slurry, as listed below:
- 0.
- raw material—no treatment
- 1.
- sandblasting with an abrasive
- 2.
- grinding with P120 grit waterproof sandpaper
- 3.
- grinding with P400 grit waterproof sandpaper
- 4.
- grinding with P800 grit waterproof sandpaper
- 5.
- grinding with P1200 grit waterproof sandpaper
- 6.
- polishing with diamond slurry with grit of 1 μm
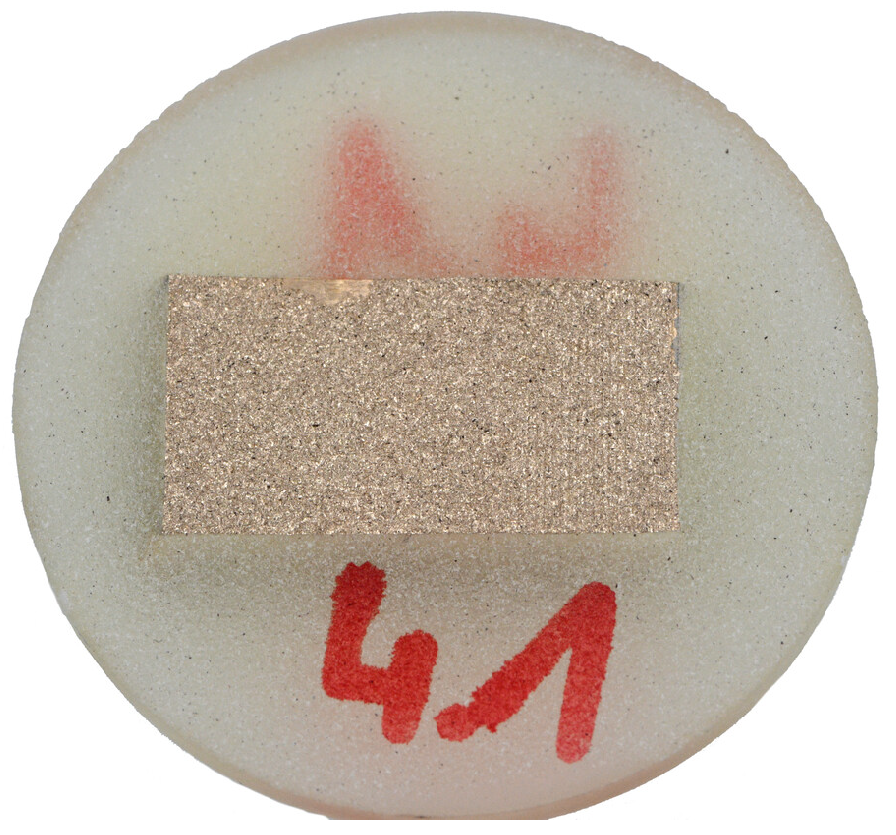
Within each material group, seven samples were prepared and treated according to the above list. Thus, a collection of samples with different surface roughness was obtained in each material group. In order to obtain a stable and reproducible grinding process, each sample was encapsulated (embedded) in Duracryl Plus acrylic resin, as shown in Figure 7.

Figure 7.
An embedded sample.
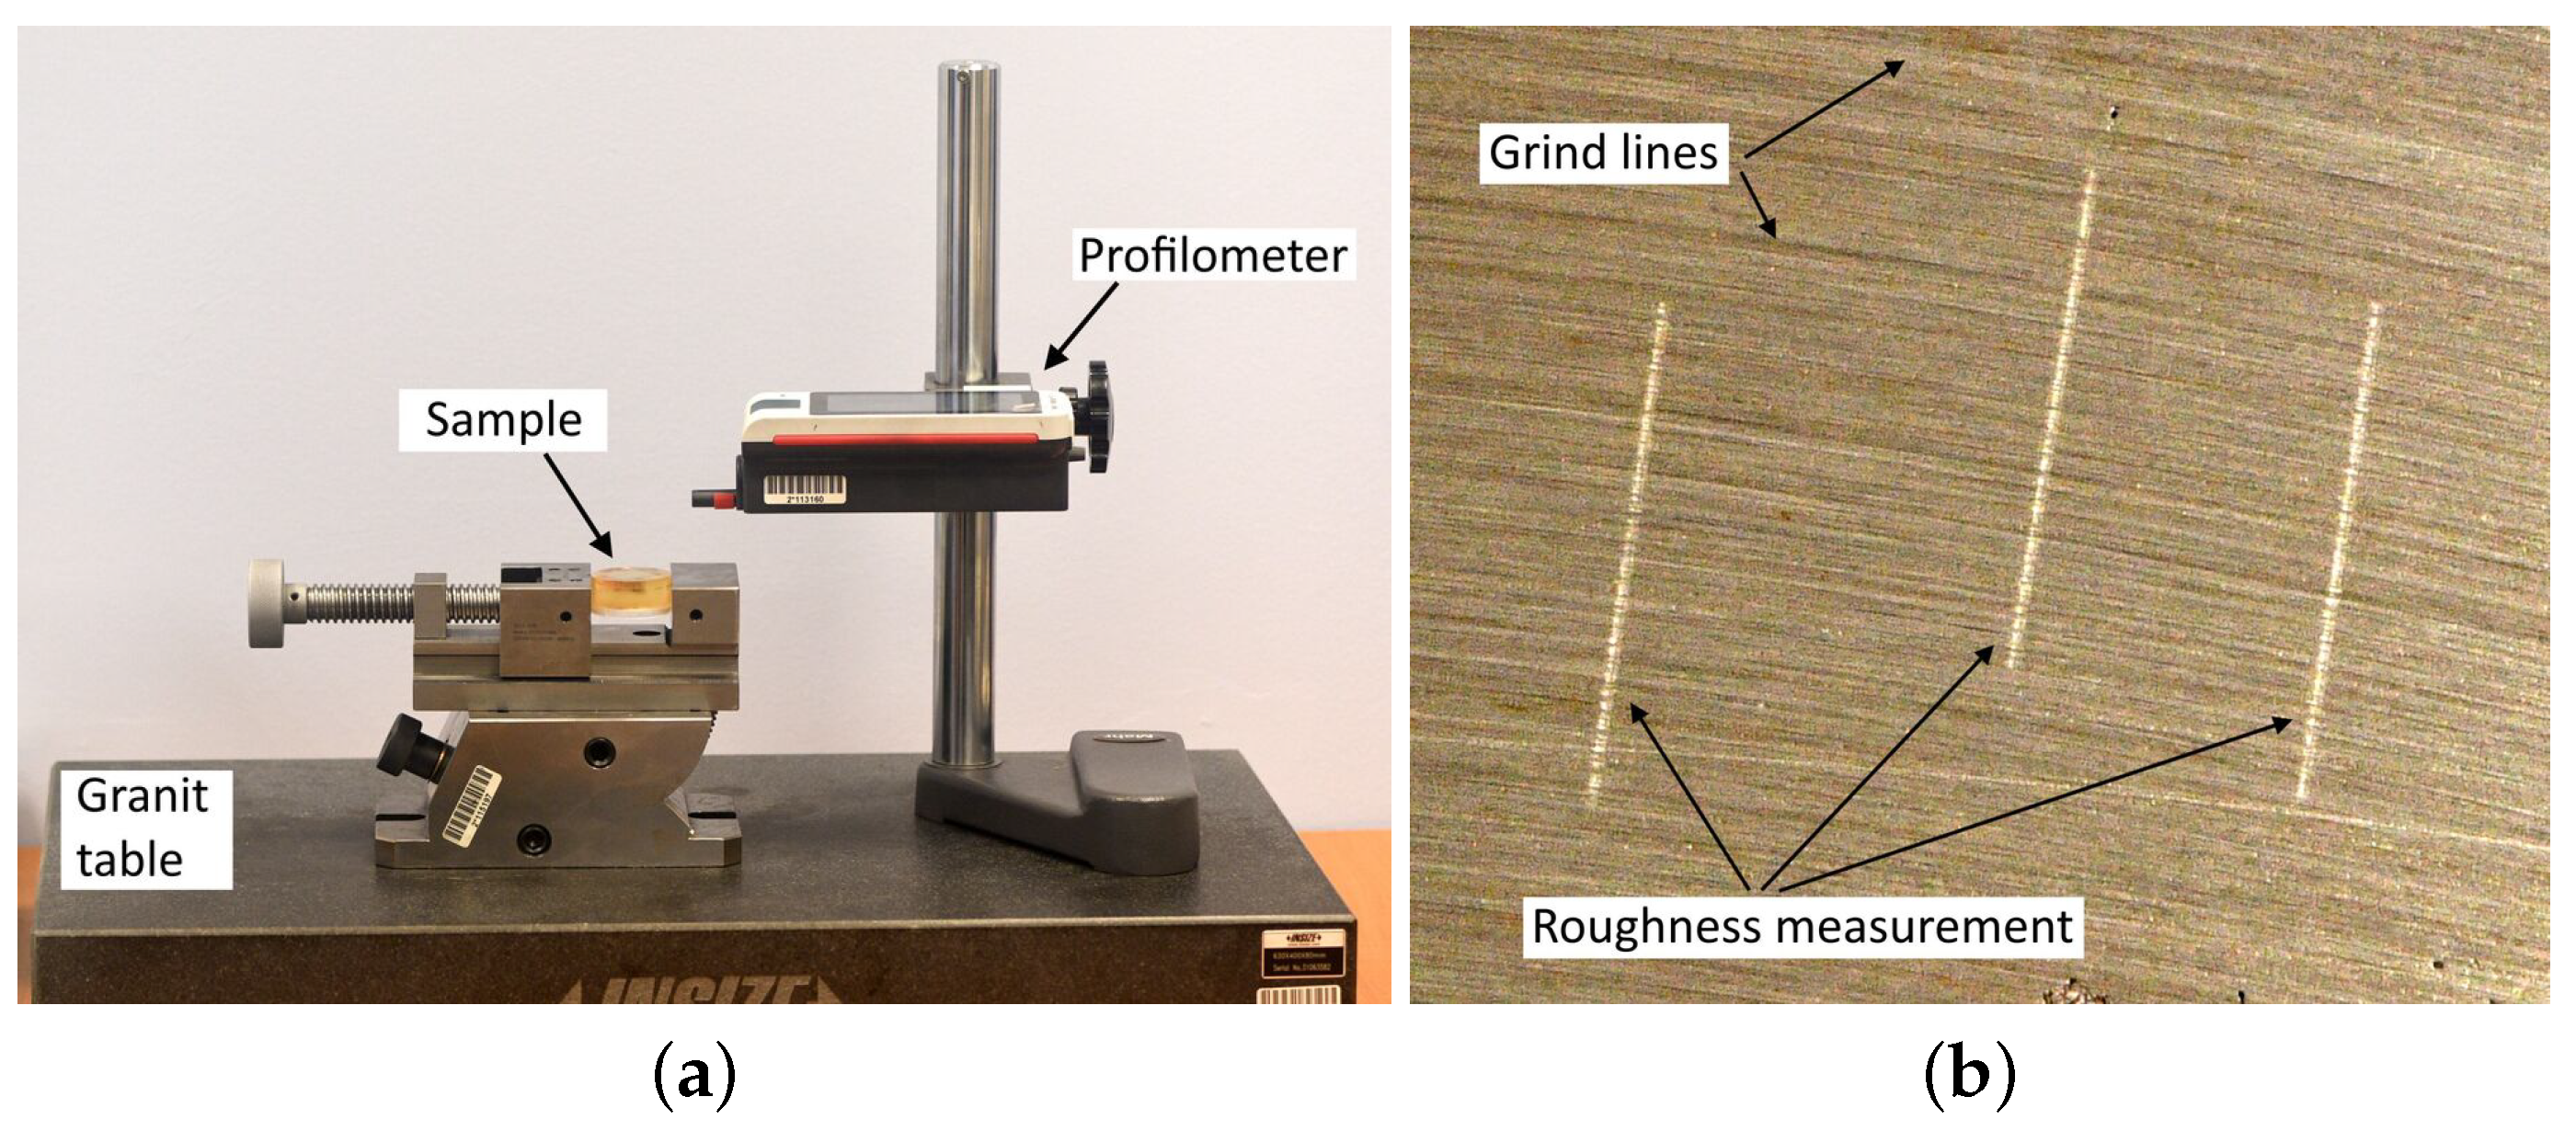
The grinding process was carried out using a Metasinex sample grinder, and the polishing process was carried out using a Mecatech 250 automatic polishing machine [21]. Surface roughness measurements were made with a MarSurf PS 10 contact profilometer [22] with a profile resolution of 8 nm, on the bench shown in Figure 8a. Measurements of the roughness parameter after grinding were made perpendicular to the grinding line (Figure 8b). For samples with raw surfaces, after sandblasting and polishing, where grinding lines were not visible, the measurements were made in random, nonrepeating directions.

Figure 8.
Measurement of surface roughness values. (a) view of the testing bench, (b) the direction of the measurement performed relative to the grinding line.
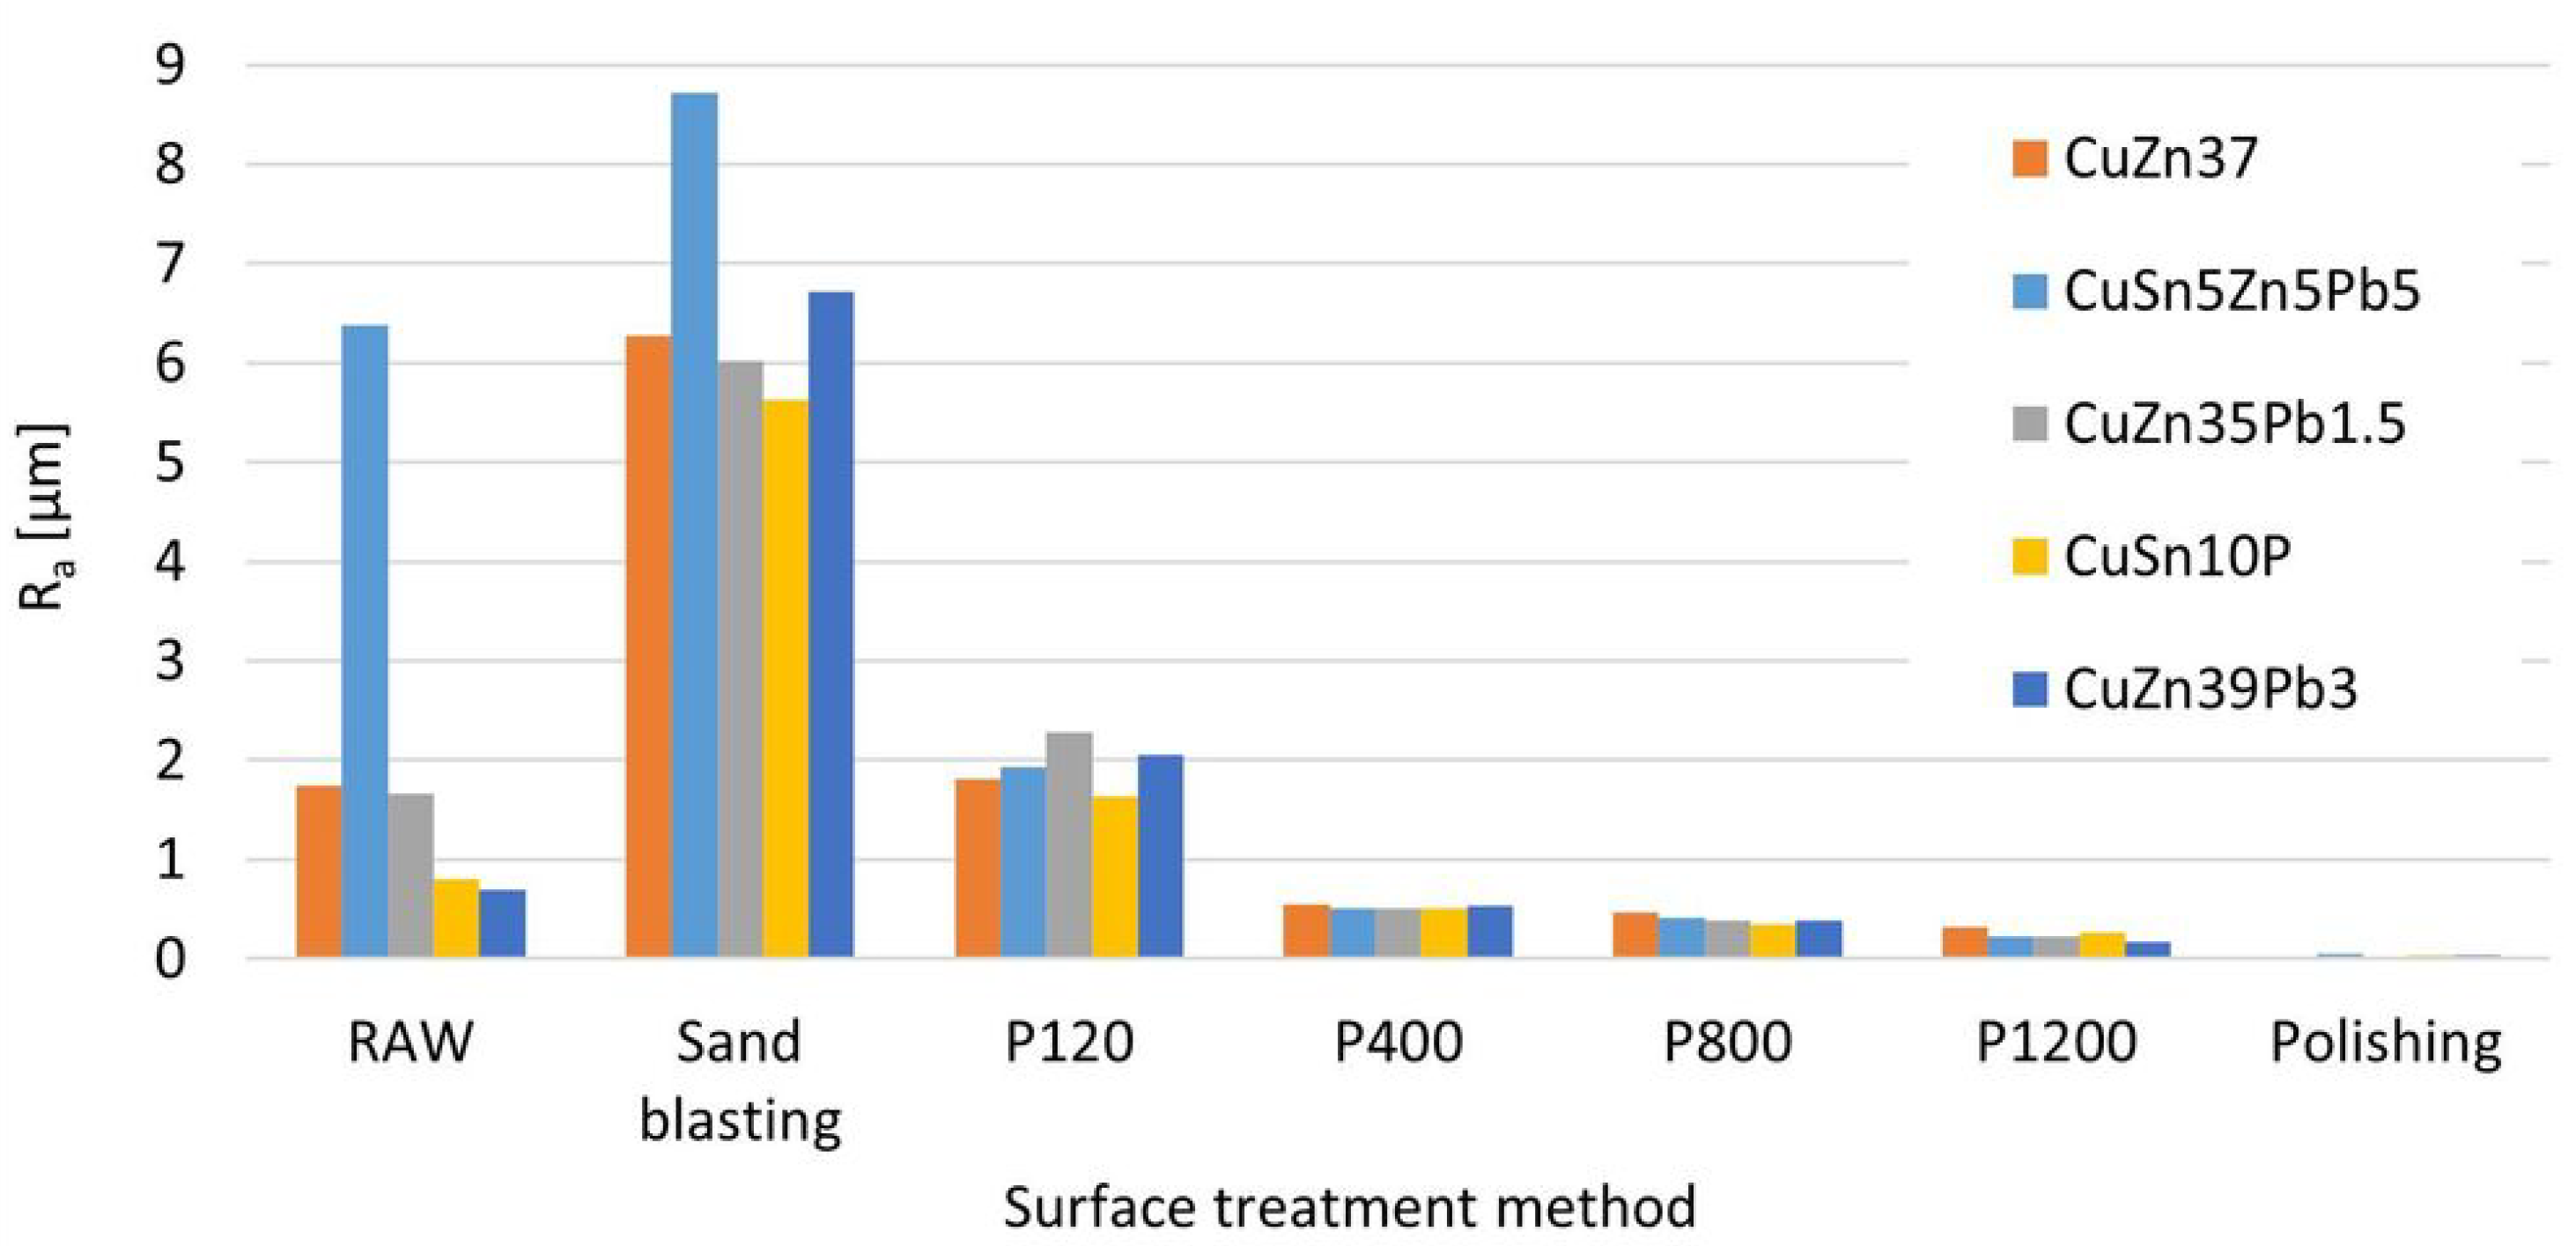
Before studying the effect of surface roughness on the result of measurement of chemical composition, roughness measurements of samples were made. Figure 9 shows the results of the surface roughness measurements of samples with different chemical compositions depending on the treatment used.
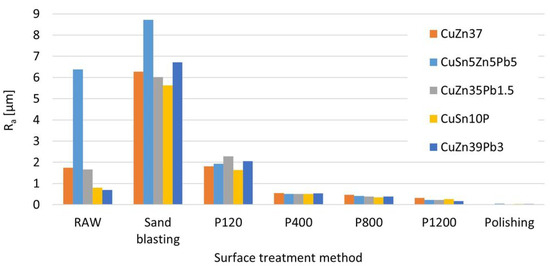
Figure 9.
Surface roughness depending on the abrasive treatment used.
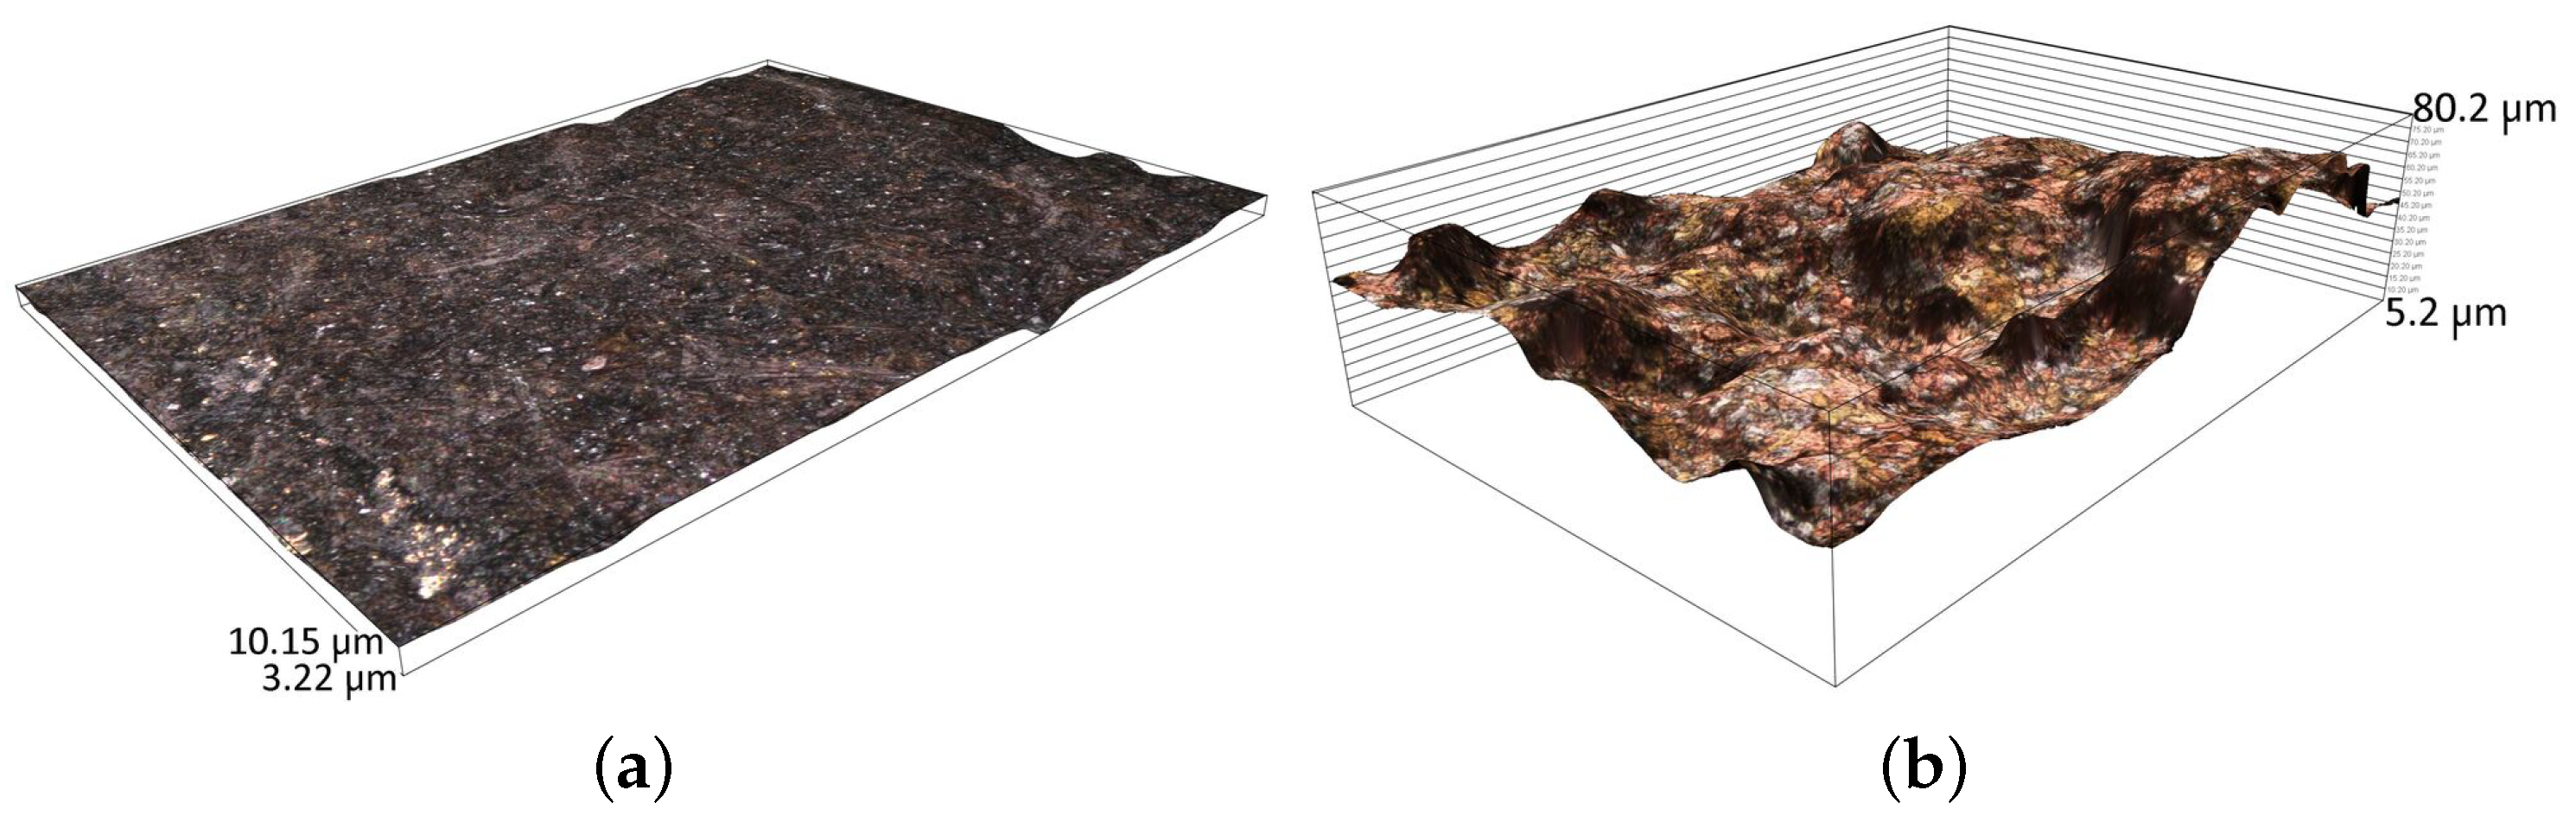
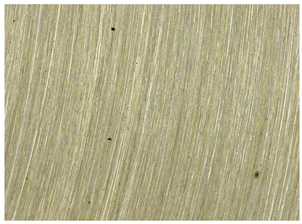
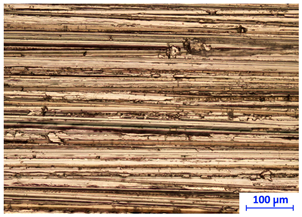
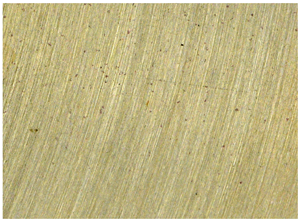
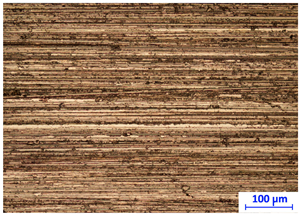
The raw surfaces of the samples have roughness values from for parts made by plastic processing (Figure 10a) to for the cast elements (Figure 10b).
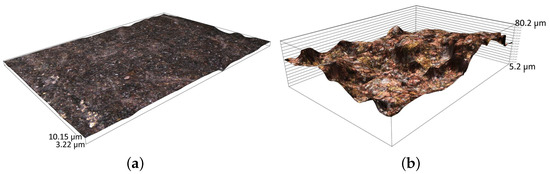
Figure 10.
View of the surface of the raw sample made by: (a) plastic processing and (b) casting technology.
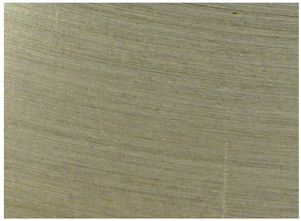
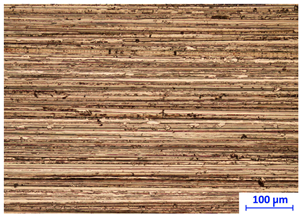
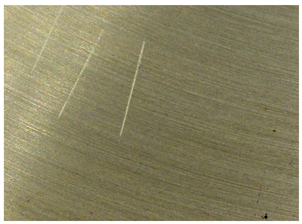
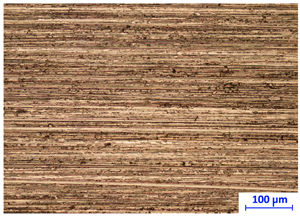
The use of sandblasting to clean the surface of the sample results in a significant increase in the roughness parameter compared to grinding with P120 paper by about 3 times to a value of . In Figure 11a view of the grinding surface before and after measurement with the OES spectrometer is shown (with a visible trace of spark impact).

Figure 11.
View of the surface after sandblasting: (a) before measurement, (b) after measurement with the OES spectrometer. OES measurement points are marked from 1 to 3.
The use of waterproof paper with a grit of P120 and higher is characterized by high surface quality reproducibility regardless of the material from which it is made. Table 4 shows sample surfaces of CuZn37 alloy for wet machining using abrasive papers of different grits and after polishing.
Table 4.
Sample surfaces of CuZn37 alloy for wet machining using abrasive papers of different grits and following polishing (with visible traces caused by roughness measurements).
3.2. Specification of Samples Selected for Testing the Effect of Thickness and Type of Paint Coating on the Measurement Results
To study the effect of thickness and type of paint coating on the results of chemical composition measurements, we selected machined elements from scrap metal (CuZnPb, CuZnSn, CuZn). The surfaces of the selected elements were cleaned using P120-grit sandpaper and then degreased. The following varnish coatings were applied to the so-prepared surfaces:
- AP: alkyd paint—spraying on CuZnPb,
- WP: water paint—spraying on CuZnPb,
- ACP: anti-corrosion paint—brush on CuZnSn,
- OAP: oil-alkyd paint—brush on CuZnPb,
- AE: acrylic enamel—brush on CuZn,
- OPE: oil-phthalate enamel—brush on CuZnSn.
Paint coatings were applied by spraying and painting with a brush (separate for each paint). After applying a layer, regardless of the application method, 24 h of waiting time was allowed before applying another layer. The areas of parts with a uniform layer of paint coating made up the sample for experimental testing. In the case of coatings applied with a brush, each time the brush was washed in a solvent dedicated to the type of paint.
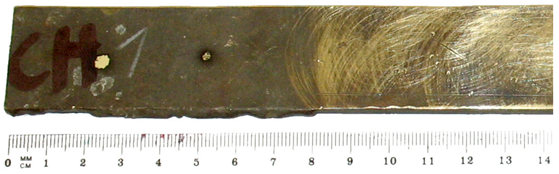
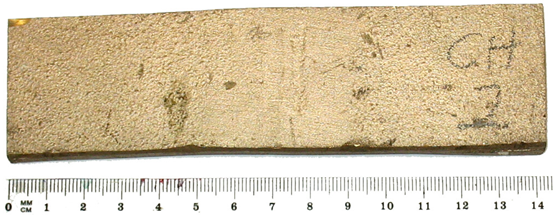
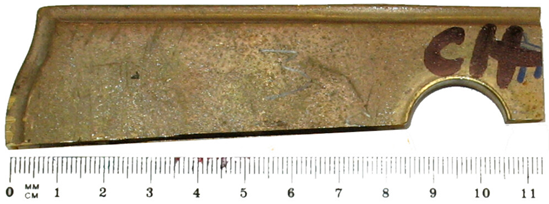
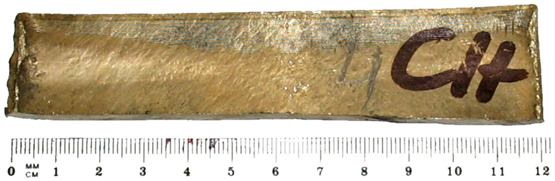
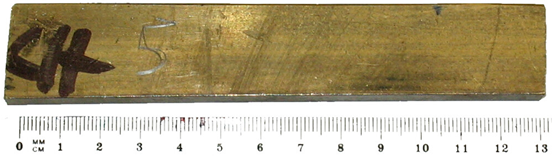
A view of the painted and labeled samples is shown in Figure 12.

Figure 12.
View of the samples after the measurements (with visible traces of OES spectrometer measurements).
4. Assessing the Impact of Surface Condition on Spectrometer Results
To assess the influence of the surface condition of copper-bearing scrap elements on the result of chemical composition measurement, the dependence of the measurement results using OES, XRF, and LIBS spectrometers was determined separately from the surface roughness and the kind and thickness of the paint coatings.
4.1. Effect of Surface Roughness on the Results of Measuring the Content of Selected Chemical Elements
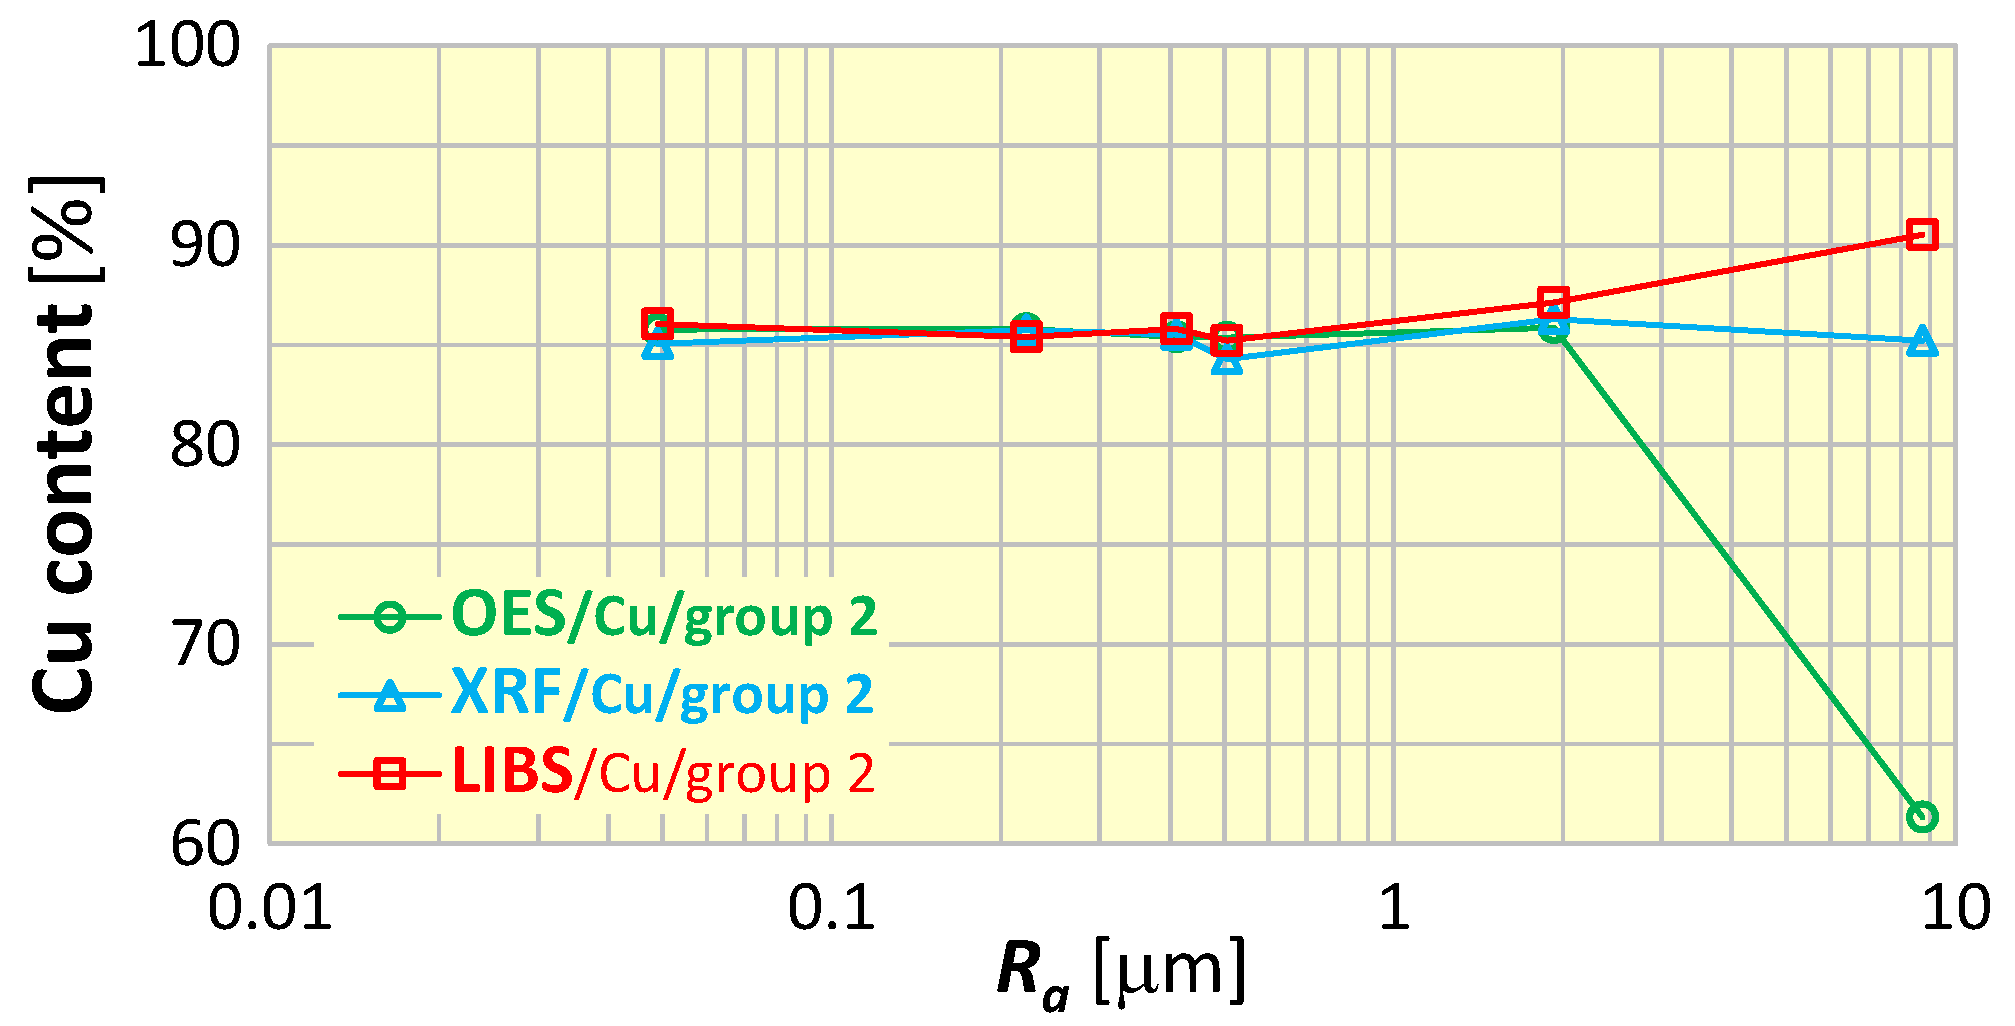
To evaluate the influence of surface roughness on the measurement results, the most important elements in the sorting of scrap copper alloys were selected, i.e., copper (Cu)—as the dominant component, as well as zinc (Zn), tin (Sn) and lead (Pb). Figure 13 shows examples of copper content measurements of samples of material group 2 (CuSn5Zn5Pb5) for various surface roughness. Analyzing the graph in Figure 13, it is easily seen that roughness affects the result of the measurement of copper content and depends on the spectrometer used—there is an increasing trend (for the LIBS spectrometer) and a decreasing trend (for the OES spectrometer).
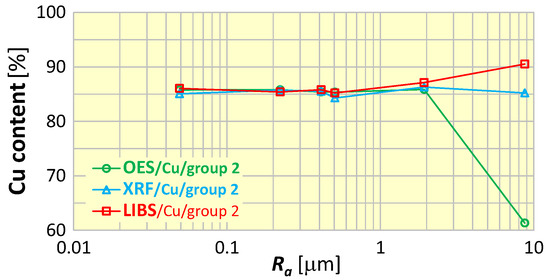
Figure 13.
Dependence of copper content measurement results on the surface roughness of material group 2 samples (CuSn5Zn5Pb5).
To highlight the influence of roughness while reducing the differences in measurement results caused by other factors (e.g., related to the basic errors of spectrometer measurements), the following index was proposed.
where: —the result of measuring the content of the selected element for the sample with roughness , —the result of measuring the content of the selected element for the sample with the smallest roughness .
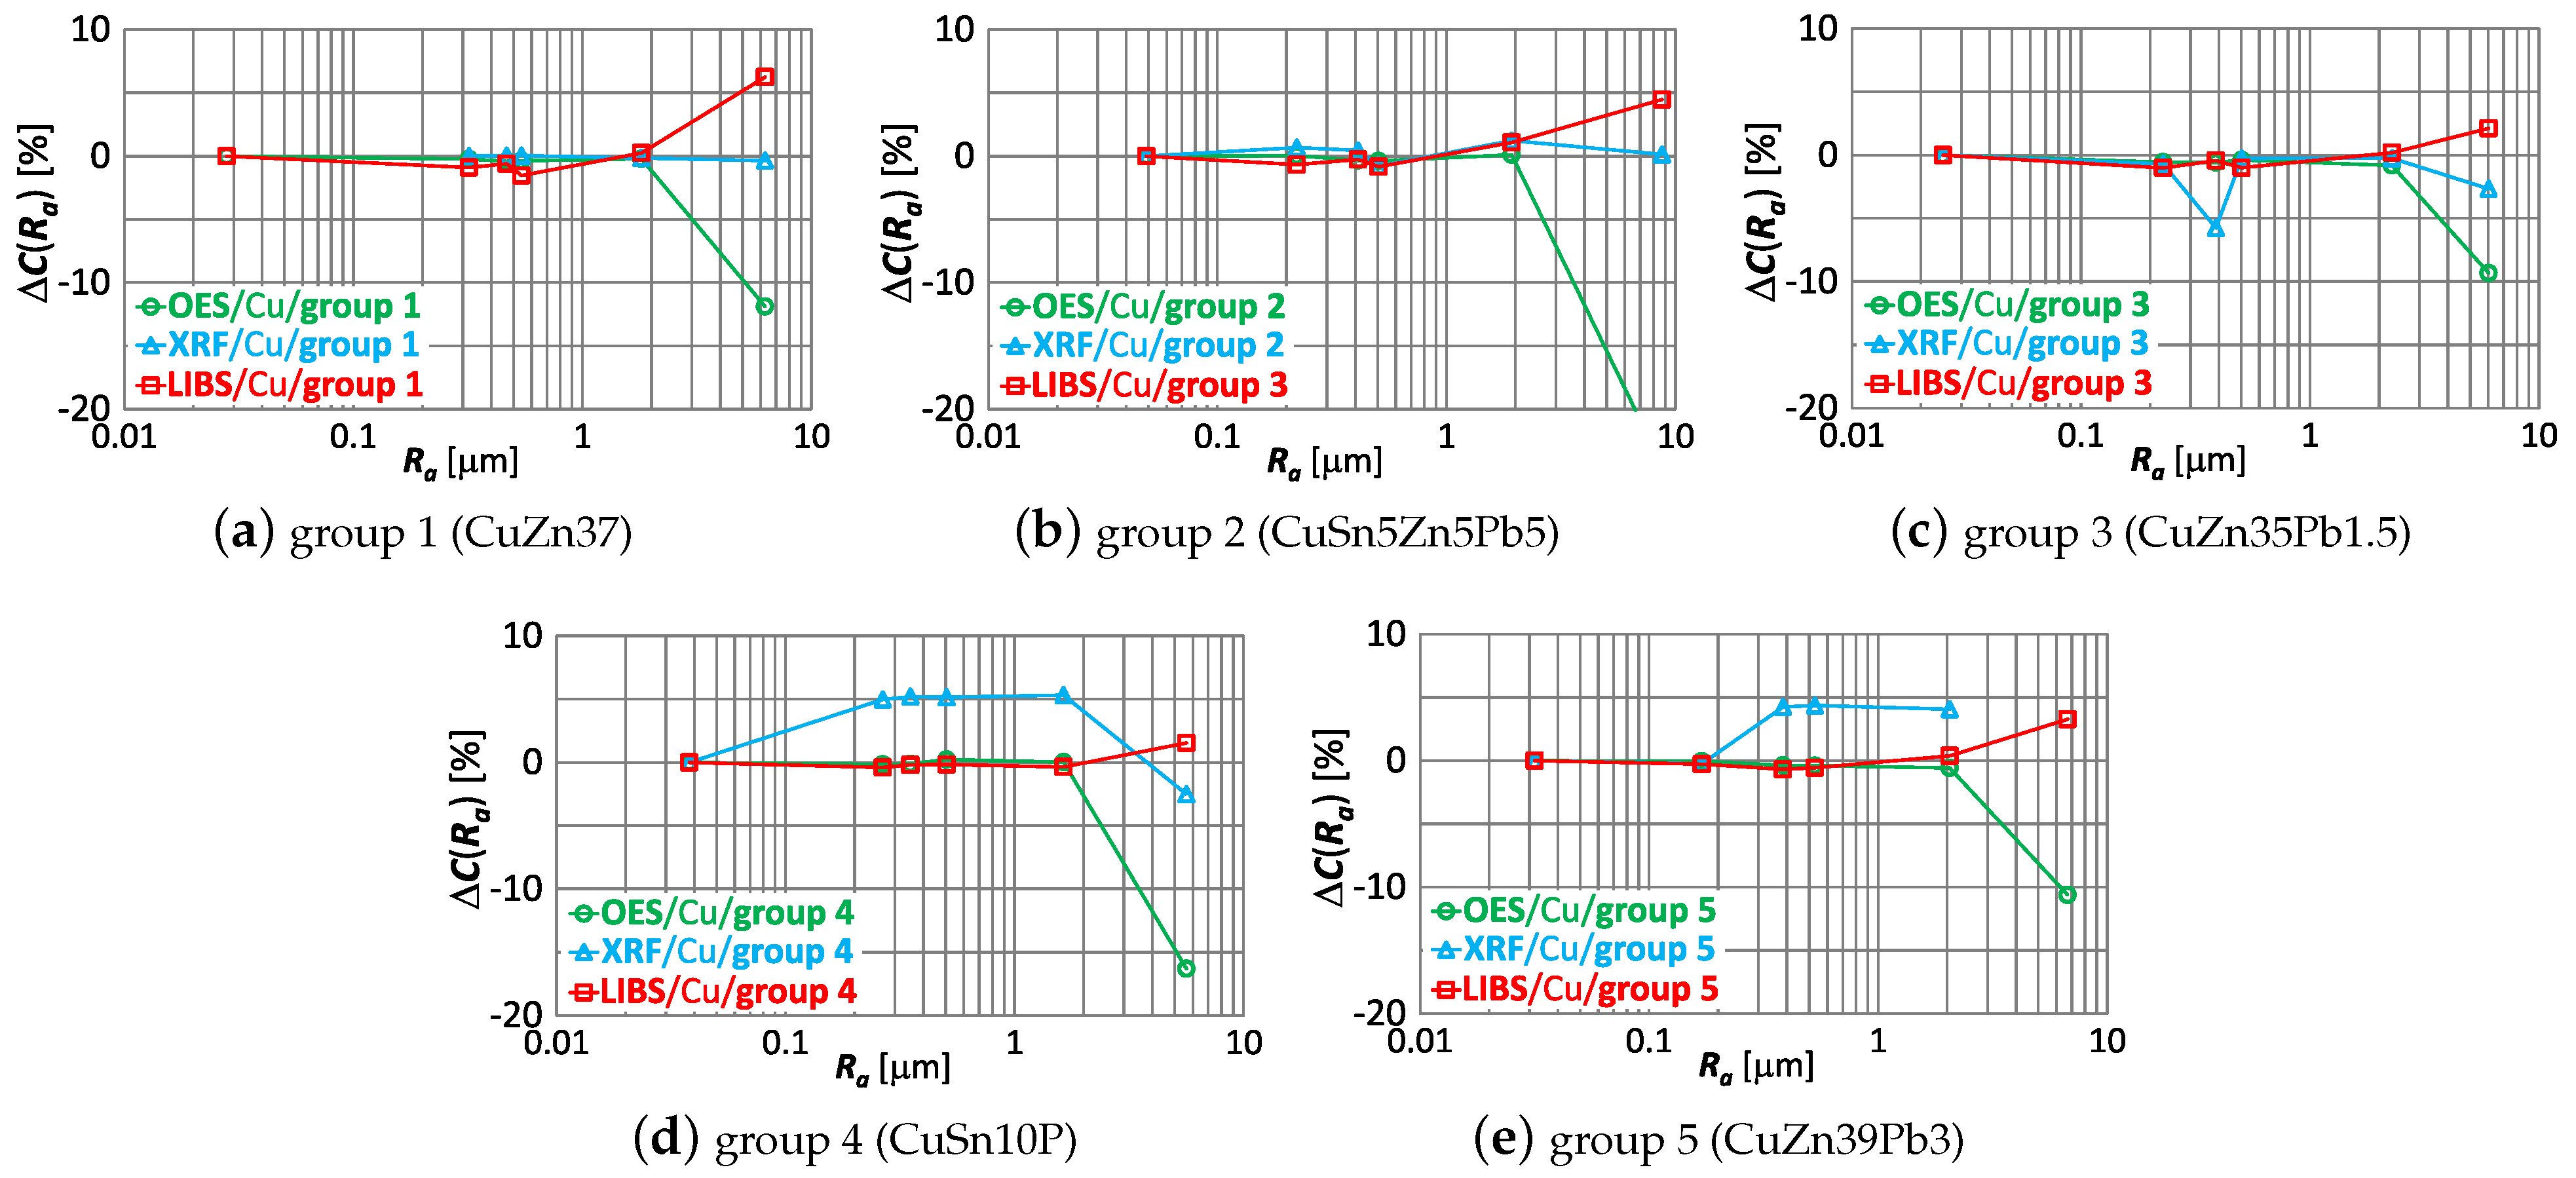
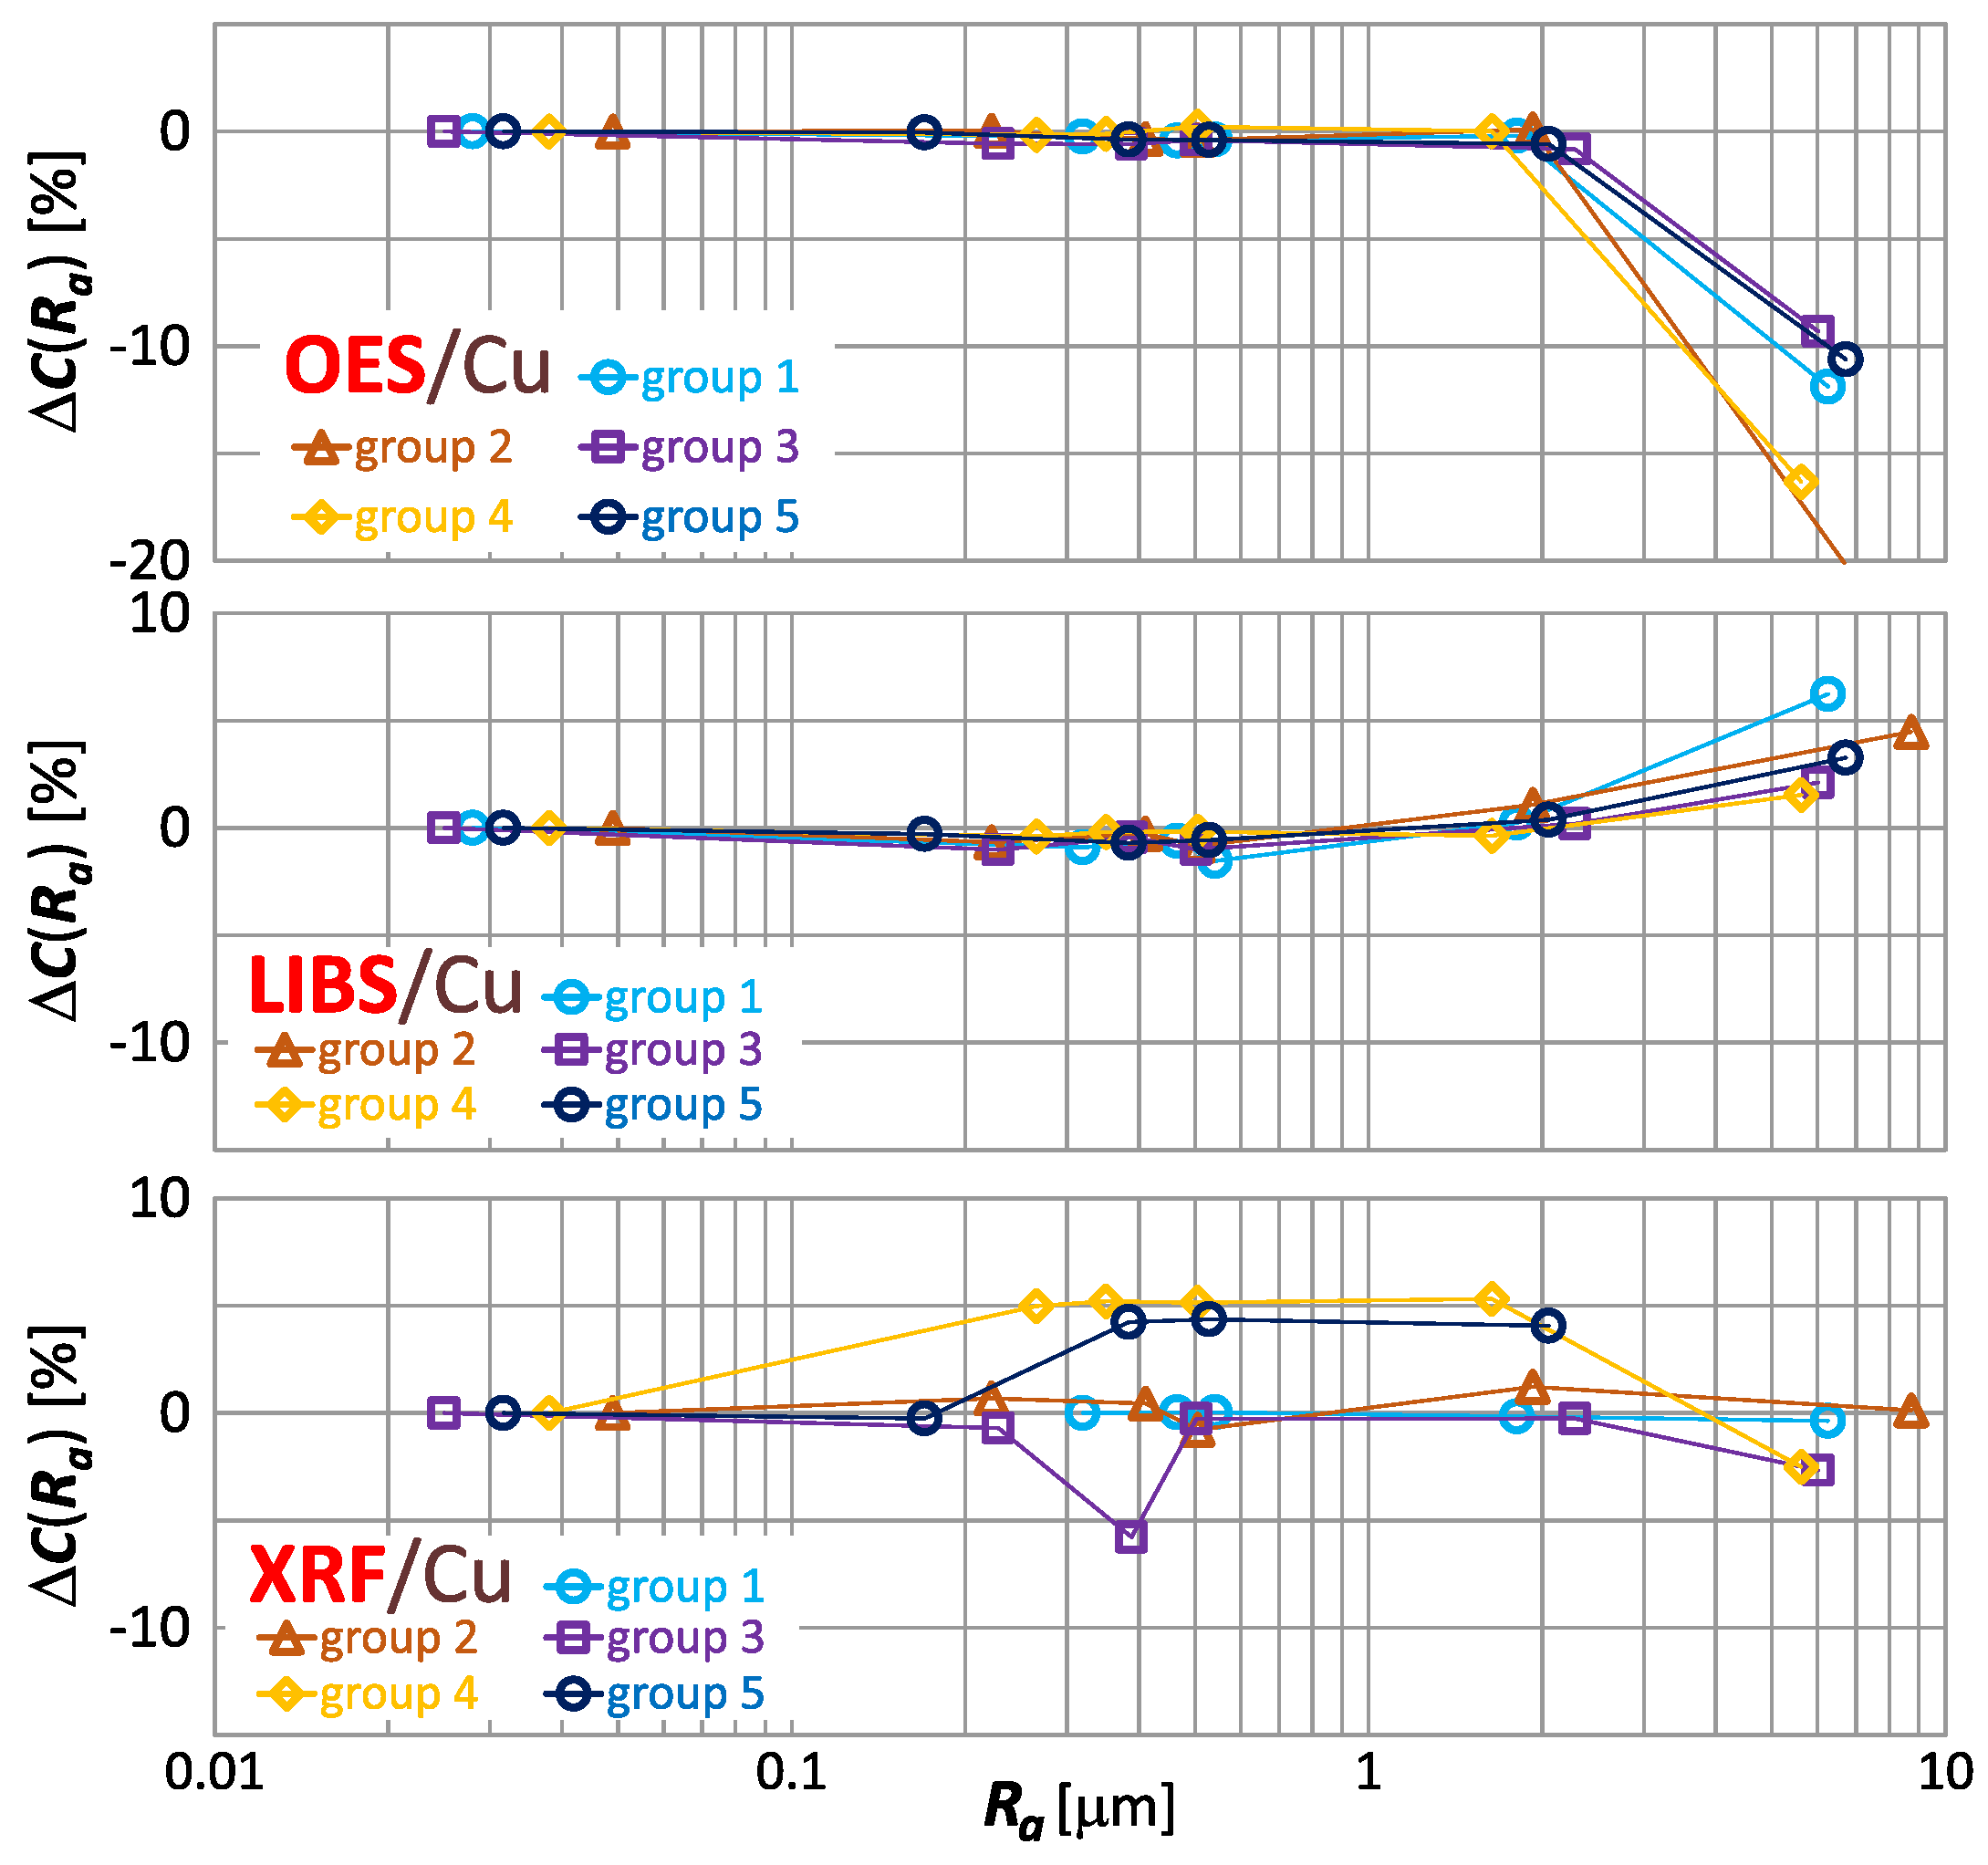
Using (1) was obtained for the smallest roughness value for all samples—which means that has identical first points. The effect of roughness on the results of measurements made by OES, LIBS and XRF spectrometers of the copper content of samples of material groups 1–5 is shown by the characteristic in Figure 14.
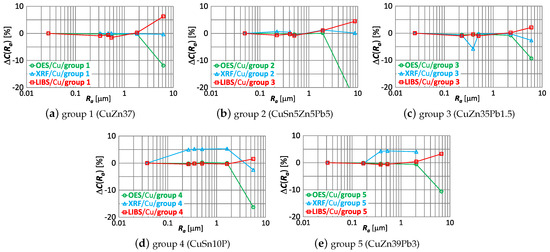
Figure 14.
characteristics for copper content measurements of material group 1−5 samples using OES, LIBS and XRF spectrometers.
Comparing the correlations in Figure 14, it can be observed that the increase in roughness (expressed by the measure) correlates with:
- an increase in the copper content measurement result using the LIBS spectrometer,
- decreasing the measurement result using the OES spectrometer,
- ambiguous variation in the XRF spectrometer measurement results.
To facilitate the analysis of the effect of roughness on the result of copper content measurement, the index were grouped according to the spectrometers used. In Figure 15, the index is presented for the measurements taken by means of OES, LIBS, and XRF.
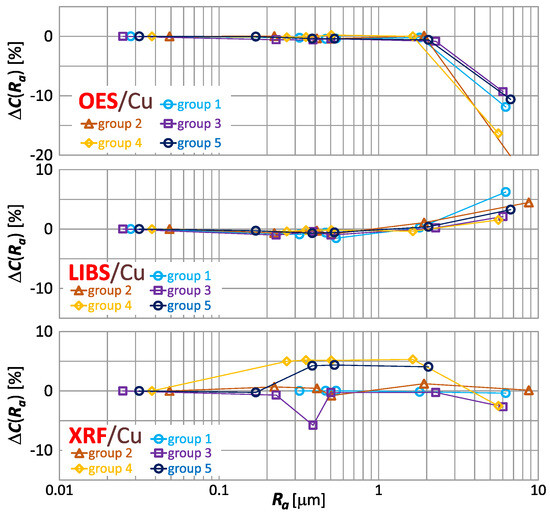
Figure 15.
characteristics for copper content measurements of material group 1−5 samples using OES, LIBS and XRF spectrometers.
Graphs in Figure 15 confirm the previously described observations concerning the dependence of the copper results obtained with the different spectrometers—the results of measurements with the OES and LIBS spectrometers maintain consistent trends, while the determination of the trend is troublesome for the XRF spectrometer.
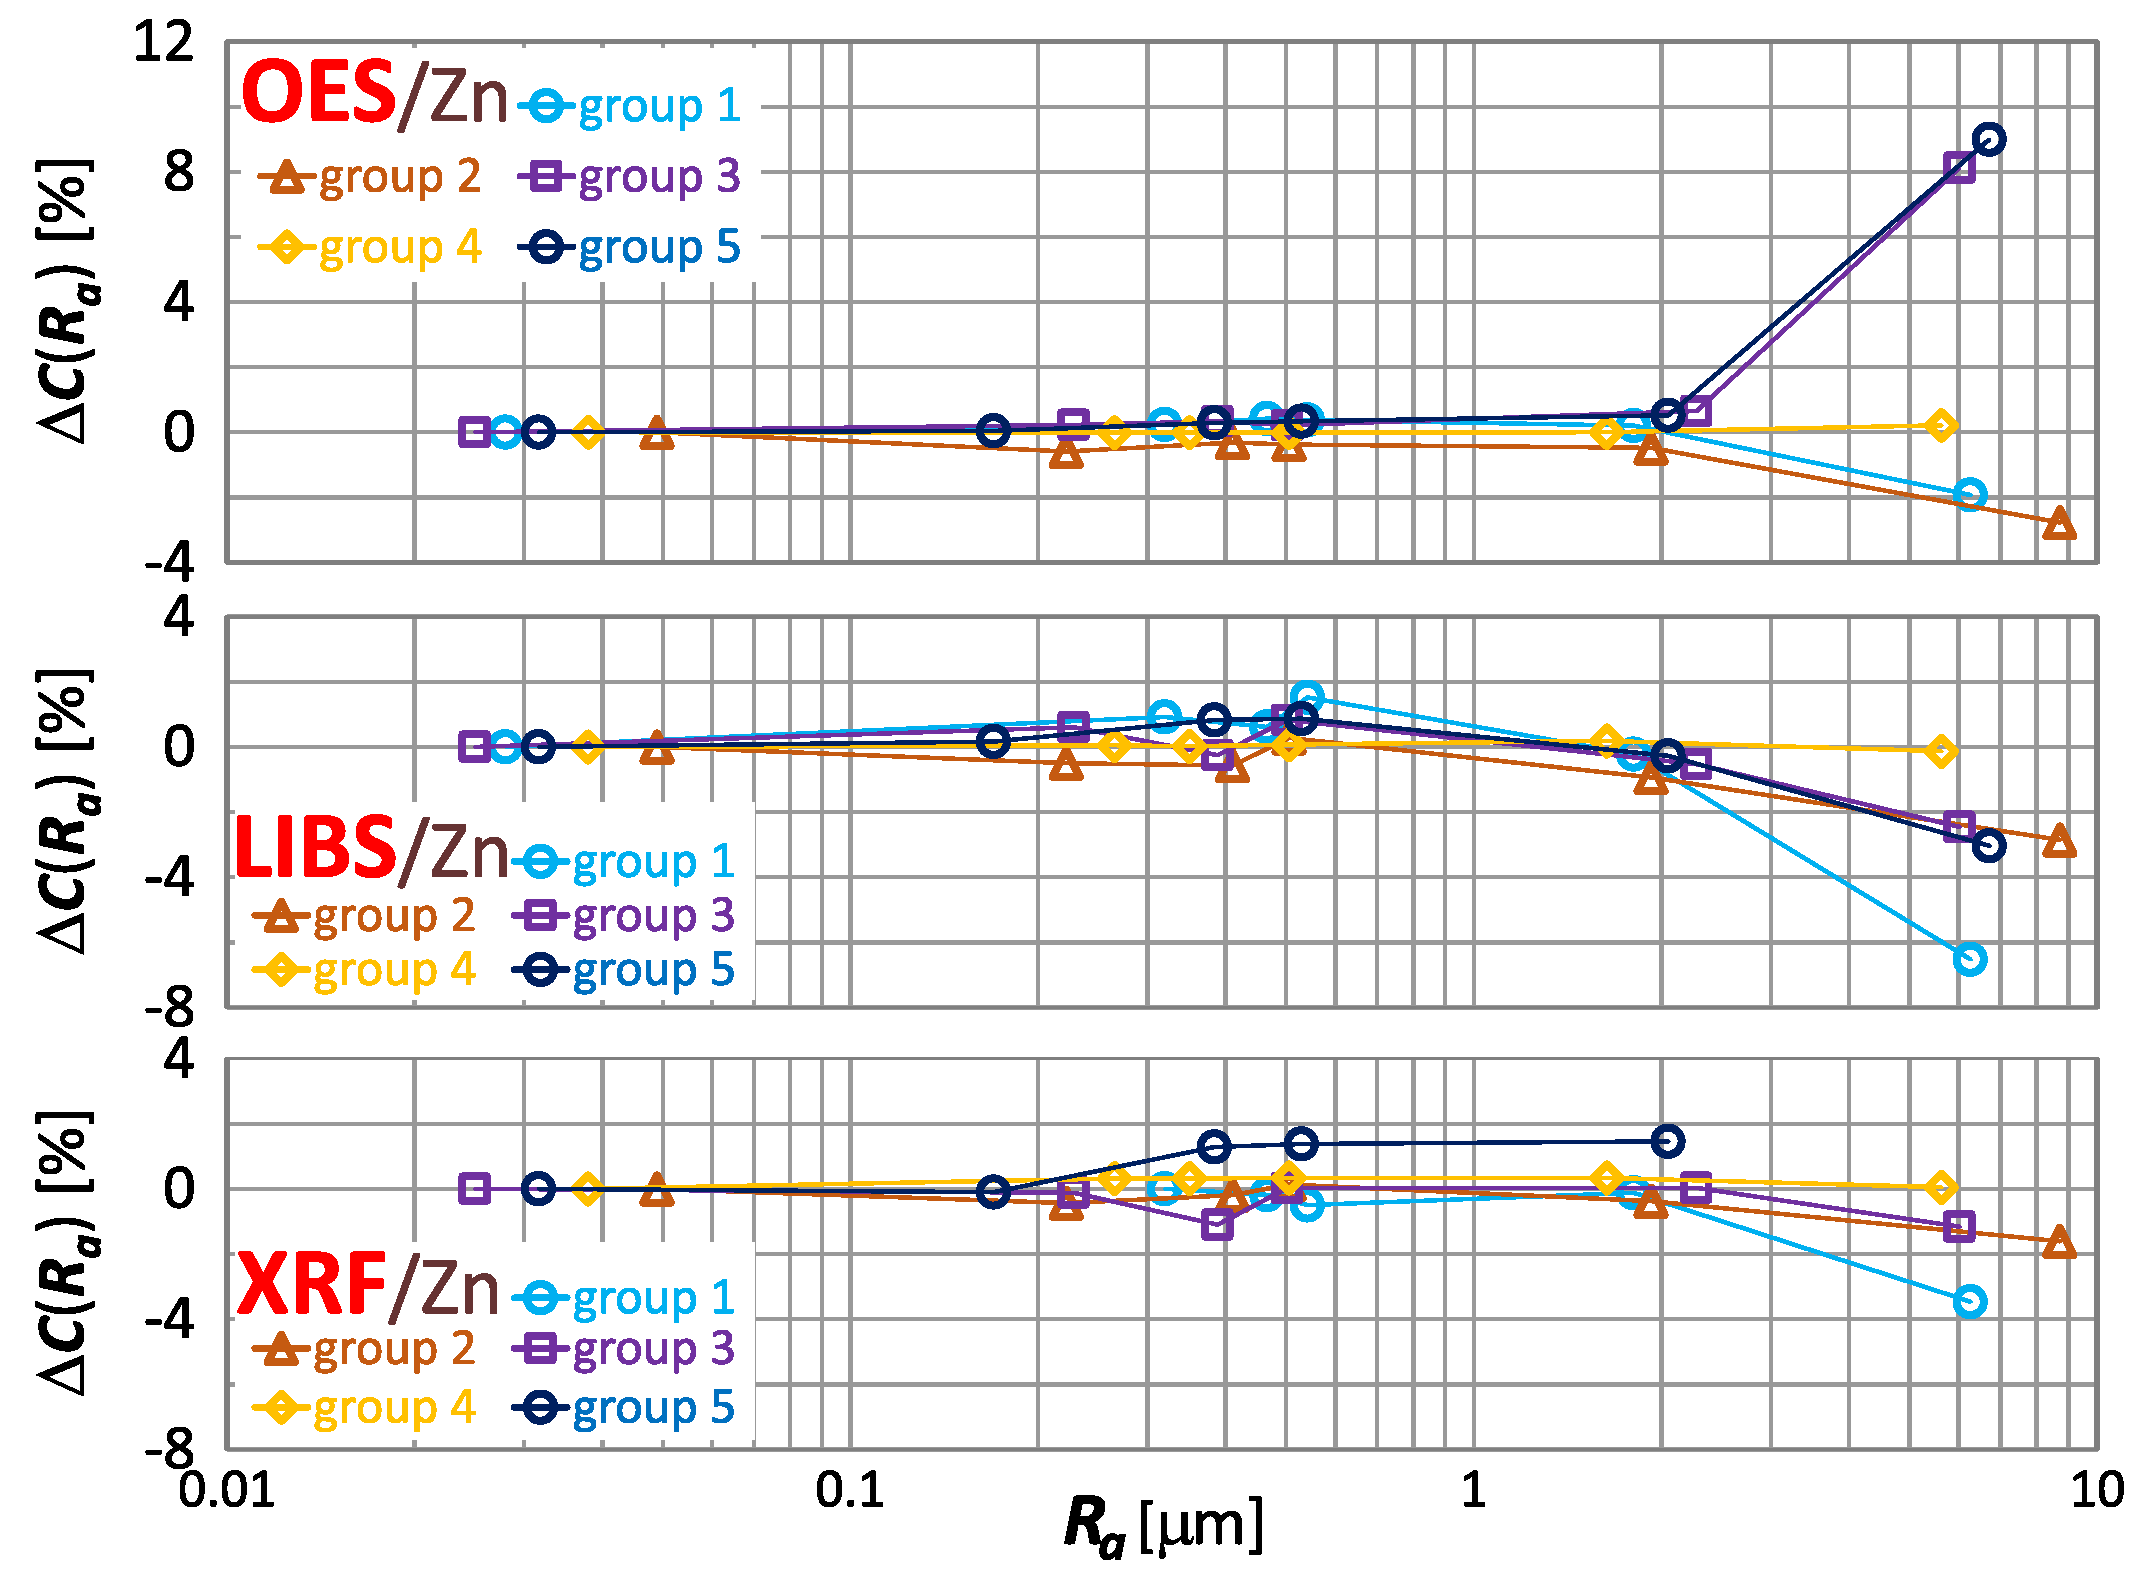
The effect of roughness on the result of zinc, tin and lead content measurement is included in Figure 16, Figure 17 and Figure 18 respectively.
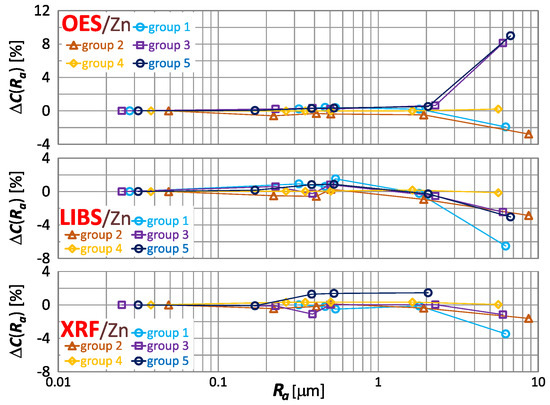
Figure 16.
characteristics for zinc content measurements of material group 1−5 samples using OES, LIBS and XRF spectrometers.
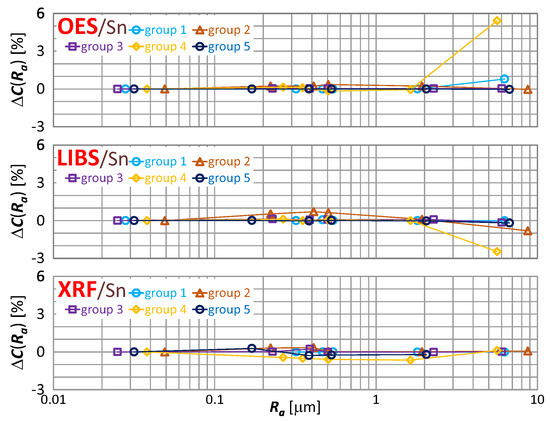
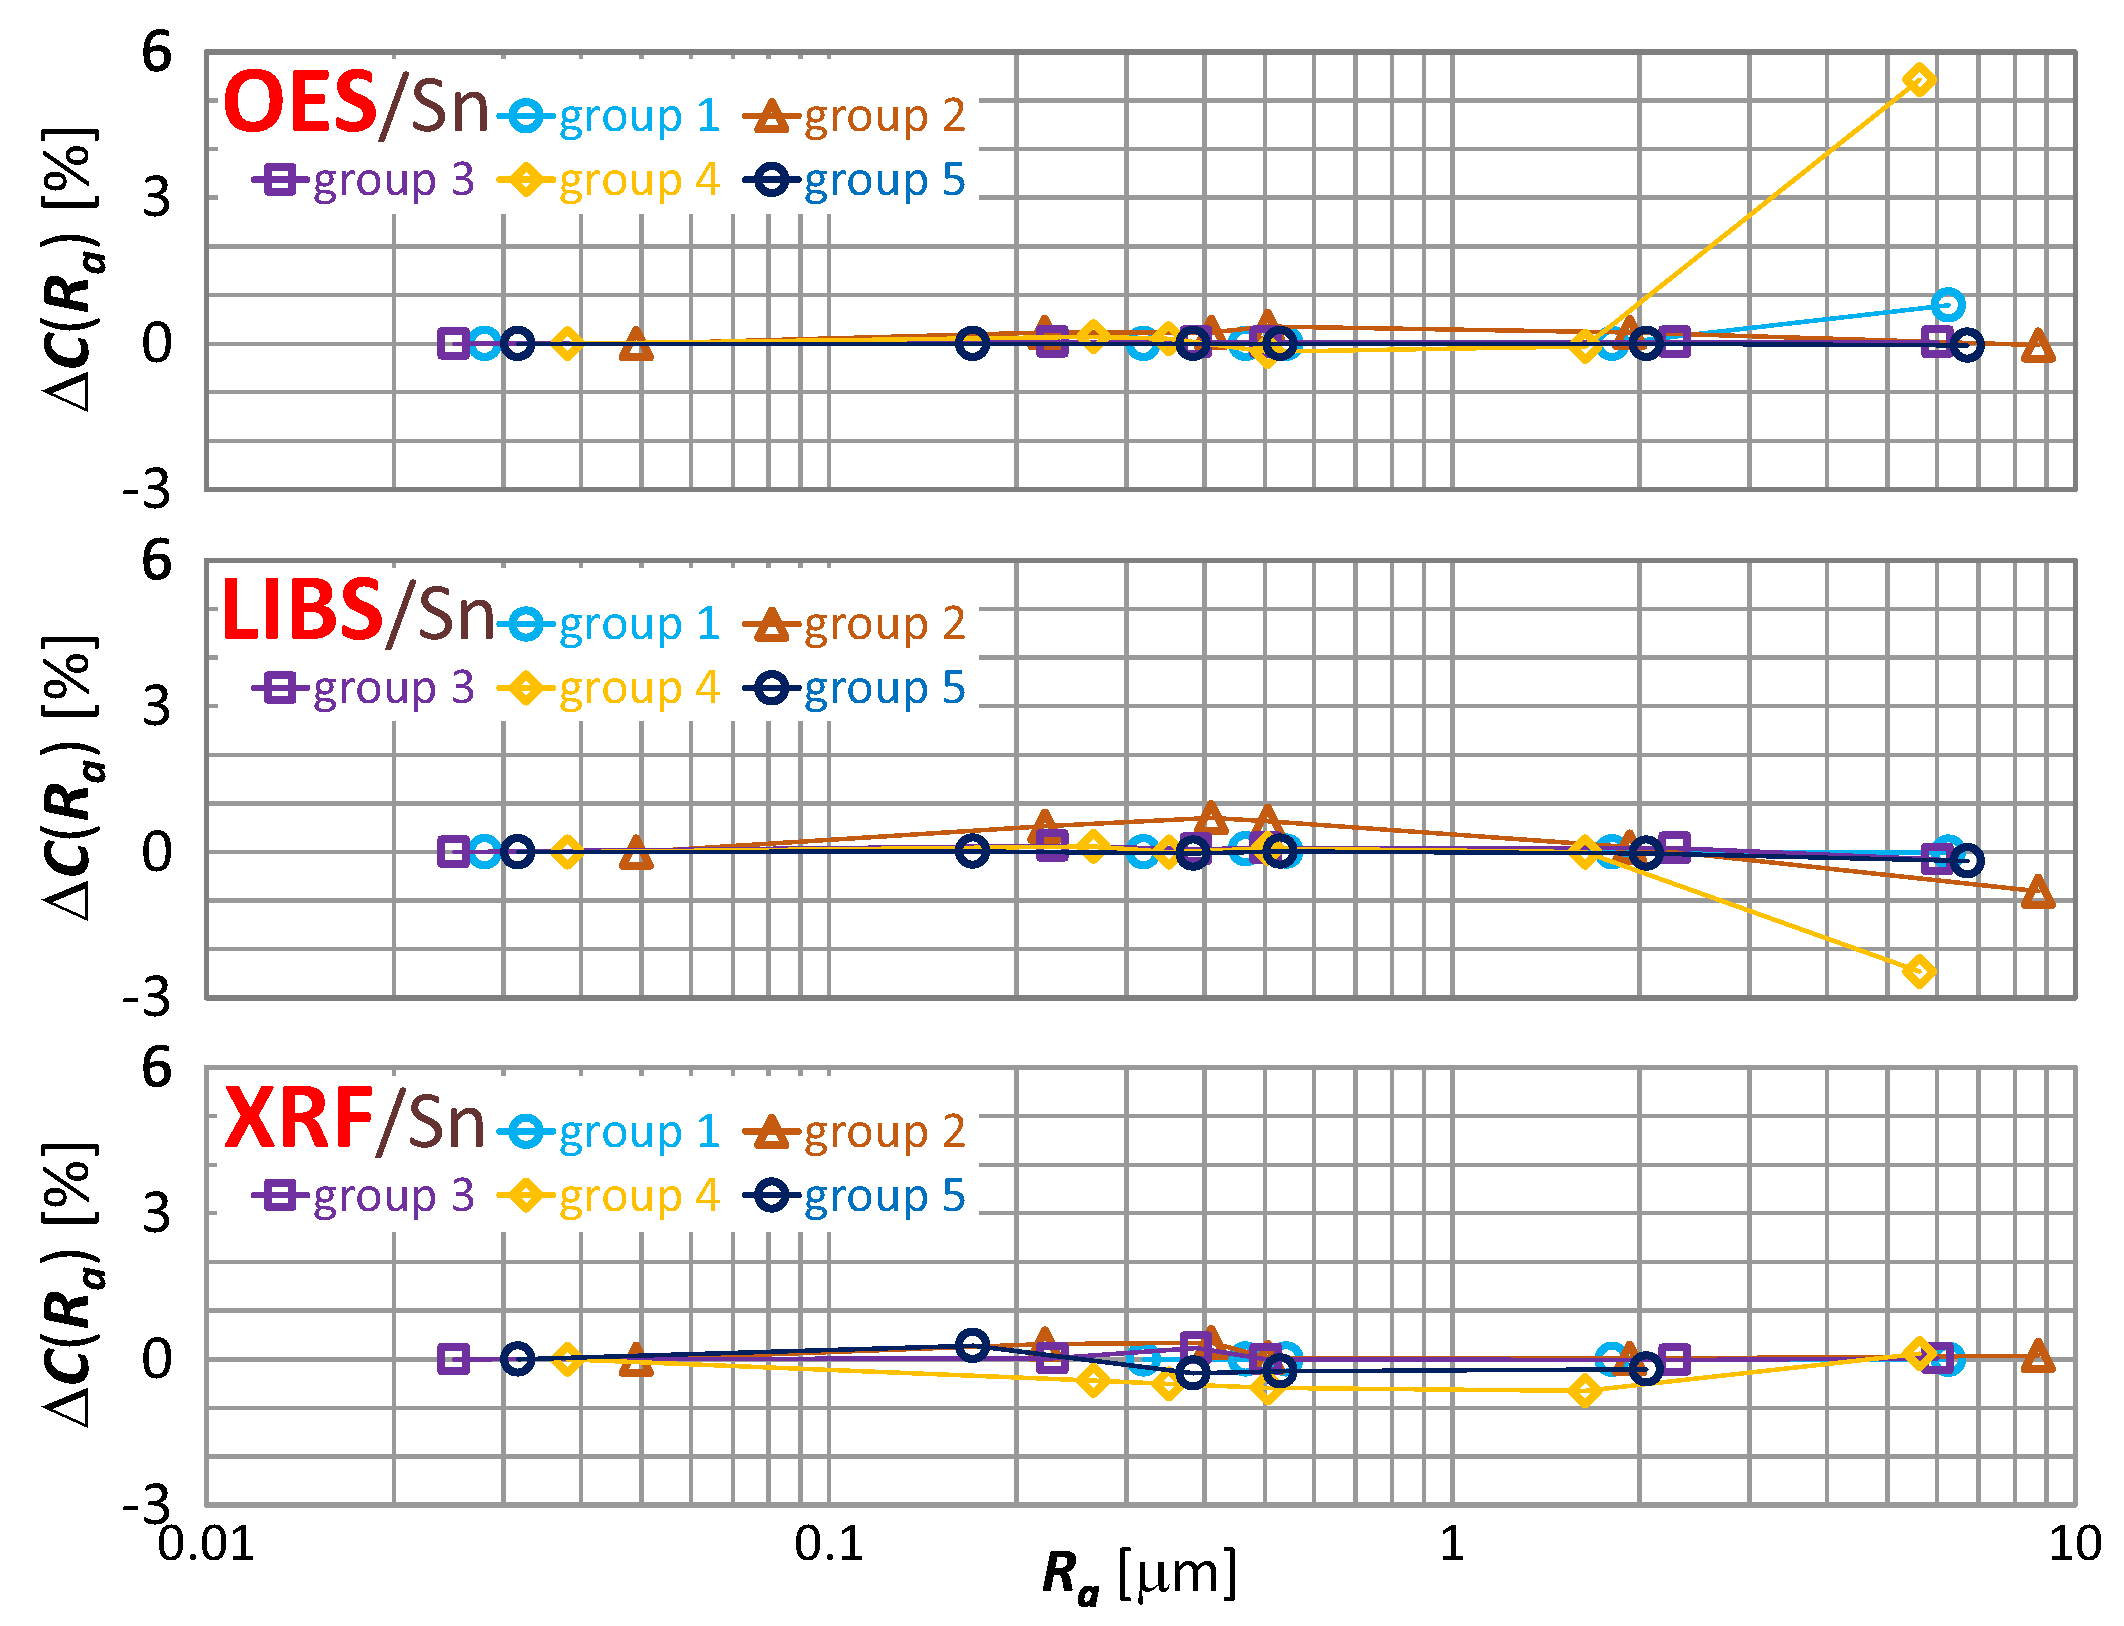
Figure 17.
characteristics for tin content measurements of material group 1−5 samples using OES, LIBS and XRF spectrometers.
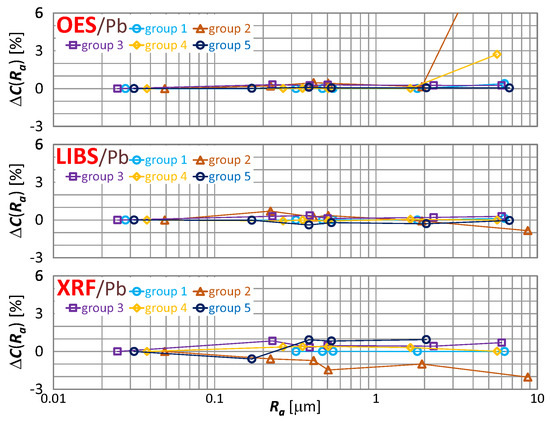
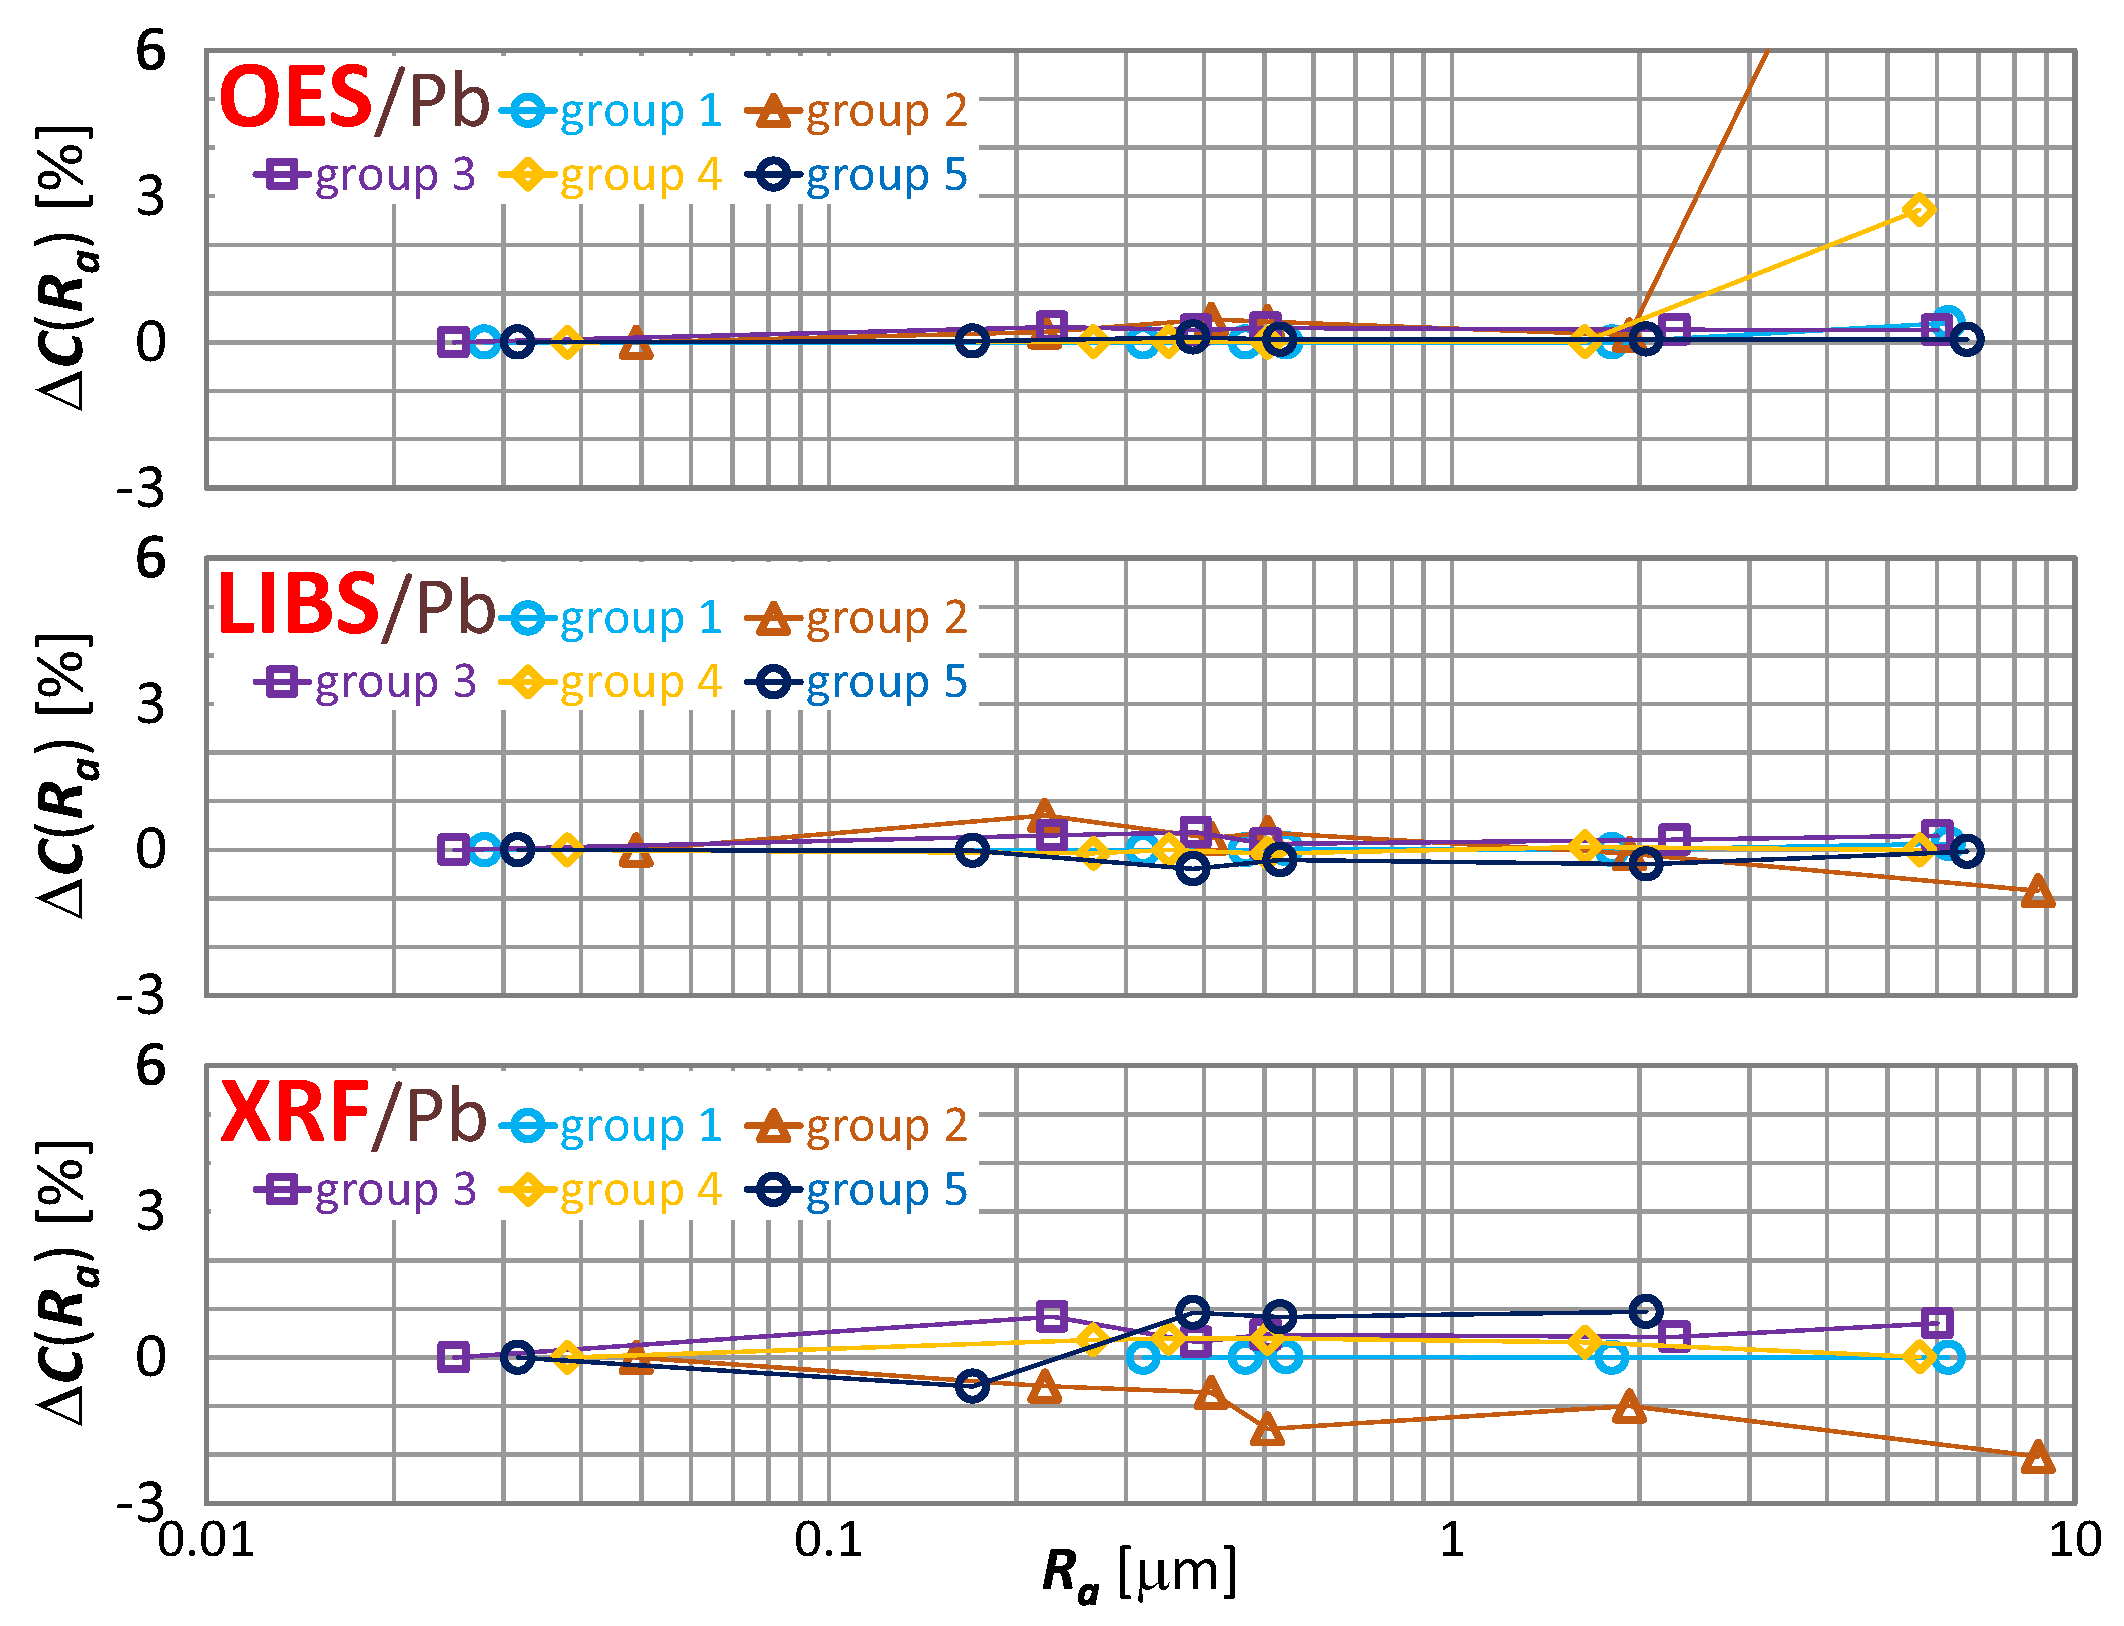
Figure 18.
characteristics for lead content measurements of material group 1−5 samples using OES, LIBS and XRF spectrometers.
By way of analyzing the index , it may be concluded that a significant effect of surface roughness on the content of copper, zinc, tin and lead in scrap copper alloys occurs for . The results of XRF spectrometer measurements are characterized by the absence of a clear trend in contrast to OES and LIBS spectrometers, and it is difficult to accept surface roughness as the prevailing cause of this variability.
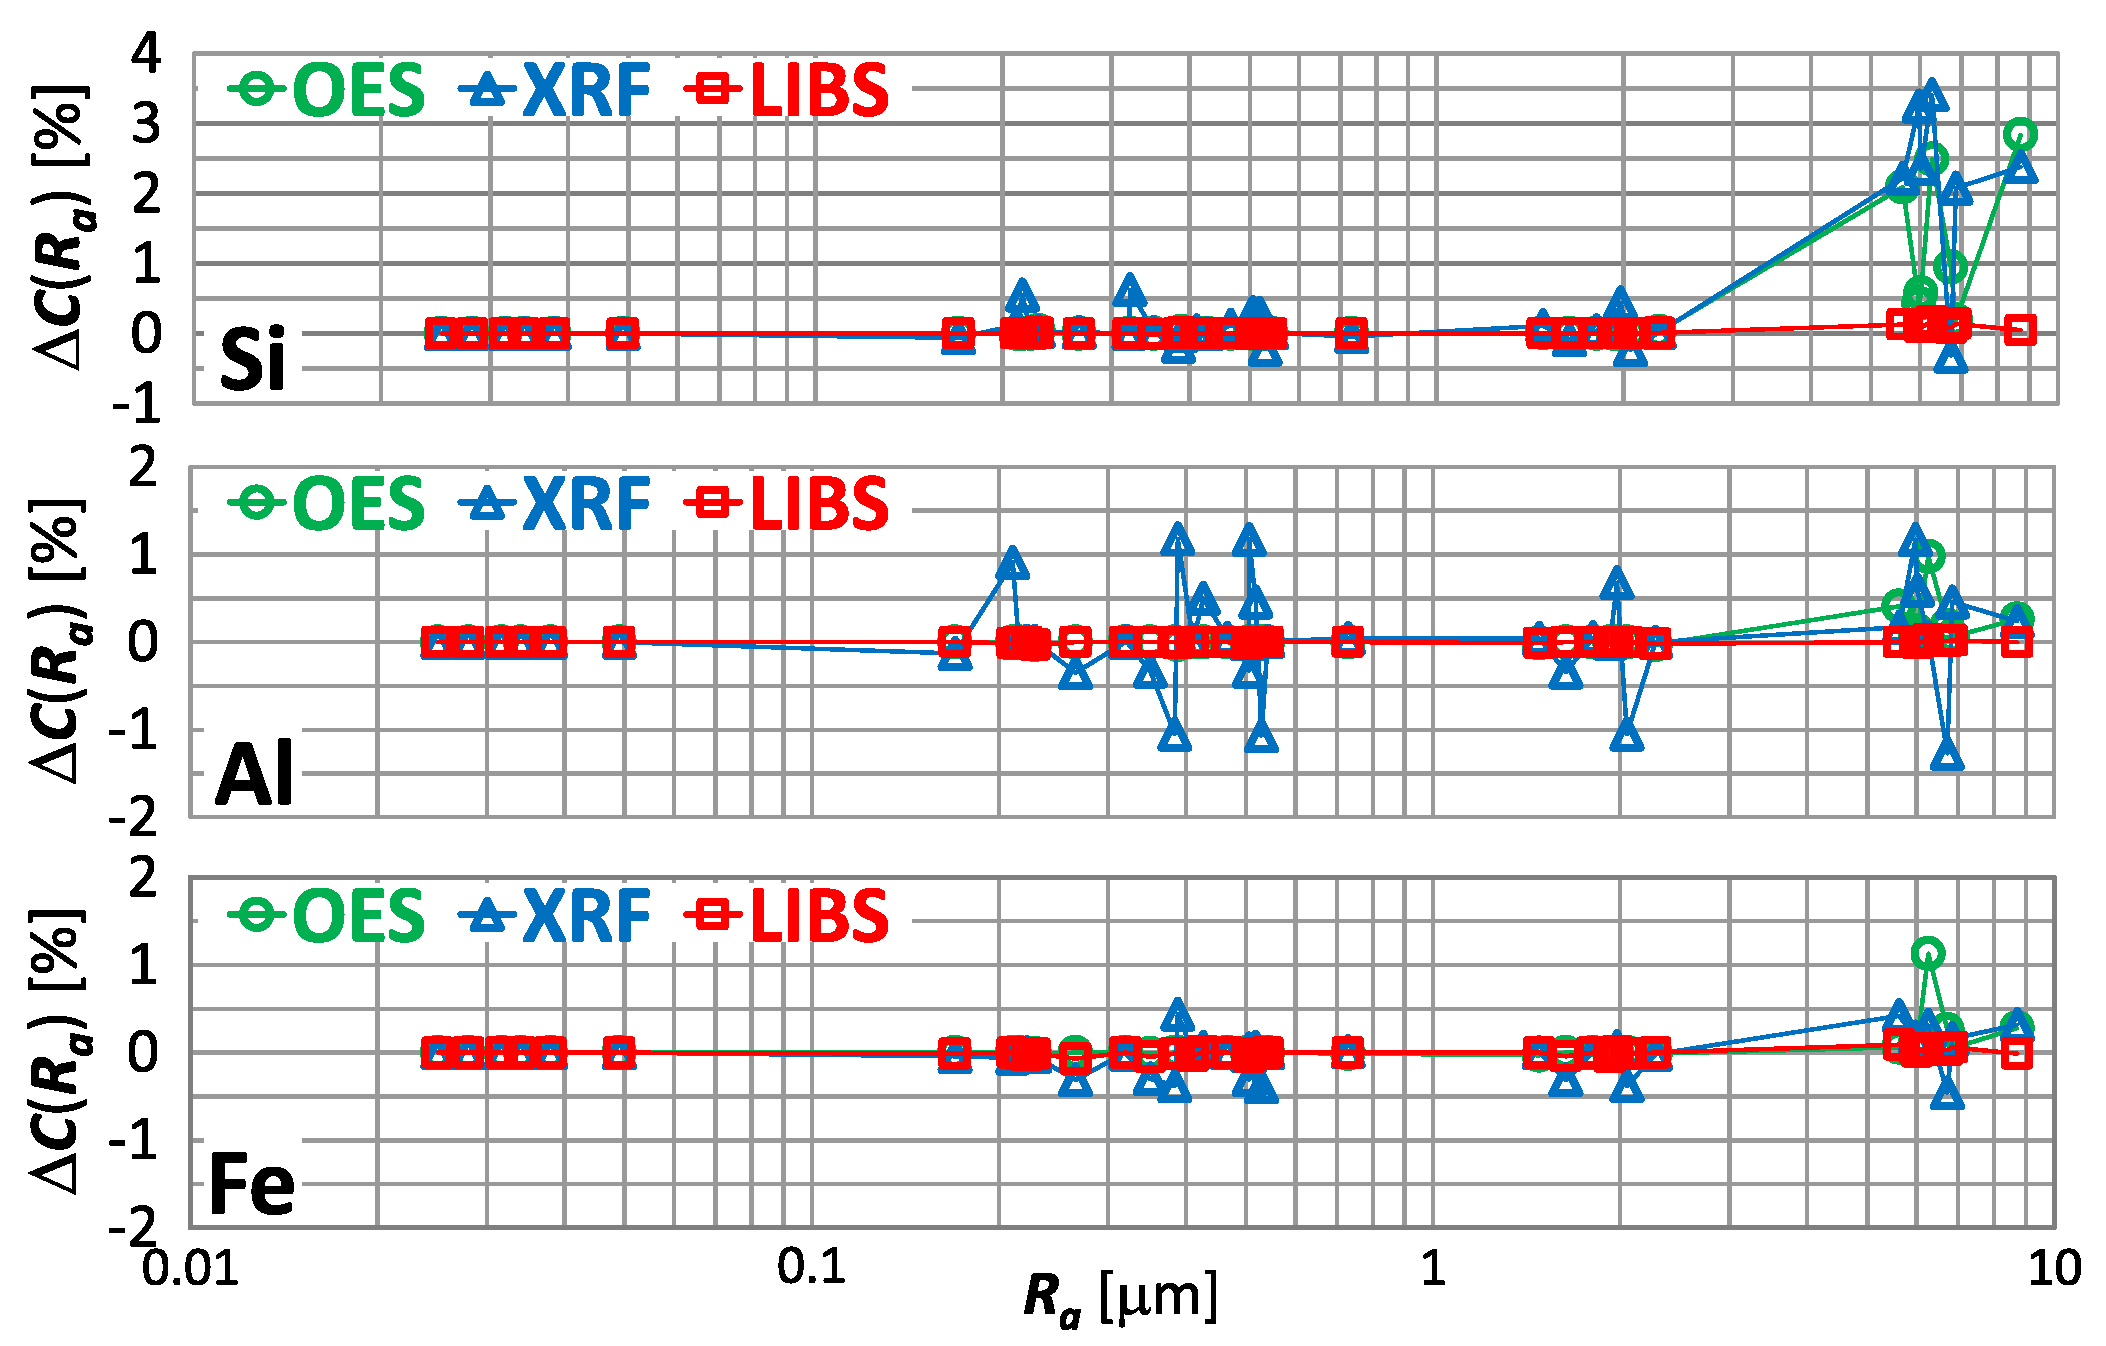
There are other elements present in copper alloy scrap. In Figure 19 is shown for the measurement of the silicon, aluminum and iron content respectively, using OES, XRF and LIBS spectrometers.

Figure 19.
characteristics for silicon, aluminum and iron content measurements of material group 1−5 samples using OES, LIBS and XRF spectrometers.
Having analyzed the index from Figure 19, for a significant influence of the sample roughness on the result of measurement of silicon, aluminum and iron content in copper alloy scrap taken by OES and XRF spectrometers is evident. For the OES spectrometer, this influence manifests itself as an overestimation of the measurement results. And for the XRF spectrometer, the variation in measurement results is evident for Ra > 0.2 μm.
In Table 5 the dominant trends of changes in the result of measurement of the content of individual elements caused by an increase in the roughness of the measured sample are listed.
Table 5.
Summary of the dominant trend of changes in the result of measuring the content of individual elements with an increase in the roughness of the measured surface.
4.2. Effect of Thickness and Type of Paint Coating on the Results of Measuring the Content of Selected Elements
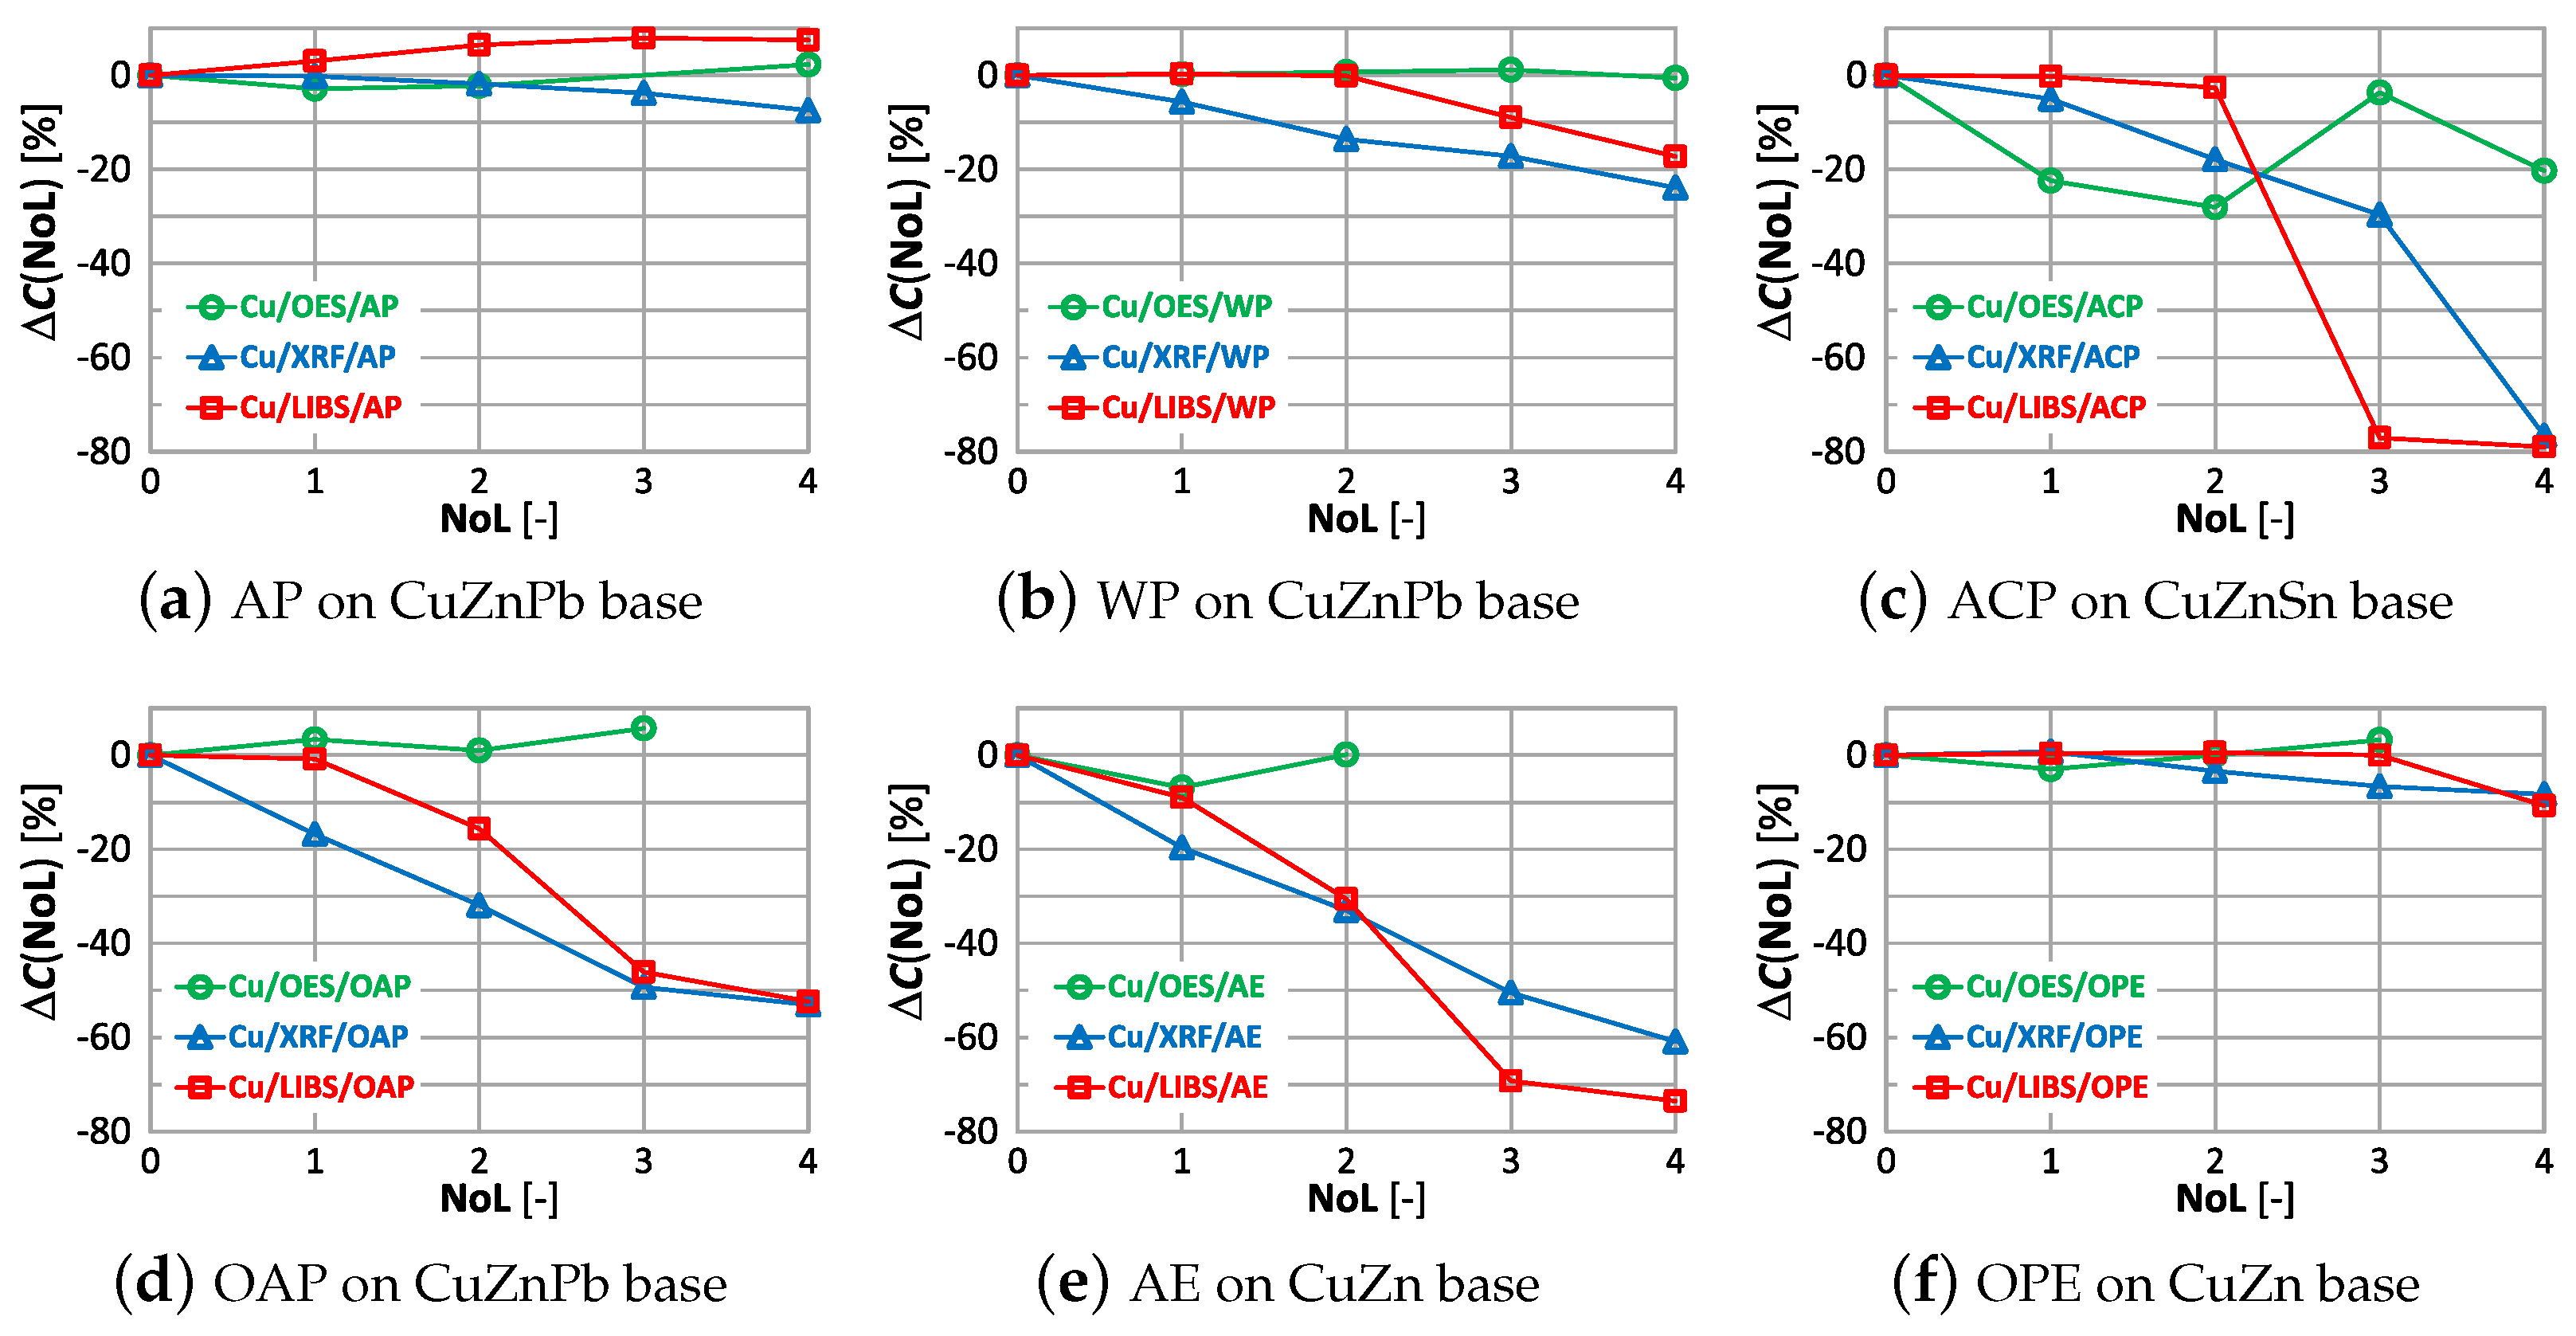
Equation (1) was used to present the effects of varnish coatings on the results of chemical composition measurements. However, the result of measuring the content of the selected element on the ground reference surface was used as the reference value , and the roughness was replaced by the number of layers (NoL). Figure 20 shows the effect of the number of paint layers on the results of copper content measured using OES, XRF and LIBS spectrometers.
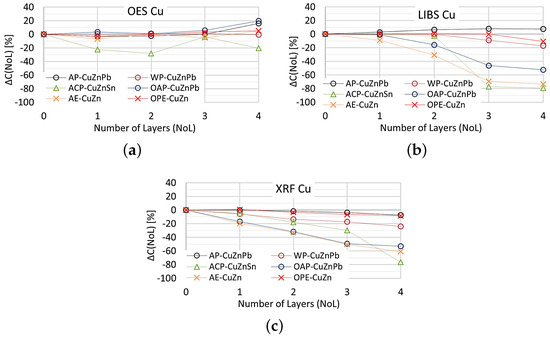
Figure 20.
for copper content measurements taken with: (a) OES, (b) LIBS, (c) XRFspectrometers.
The study shows that the smallest change in the measurement of copper content on samples with different numbers of applied paint coats was obtained using the OES spectrometer, where only the 4th paint coat causes a significant change in the value. Only the application of anti-corrosion paint (ACP) causes a significant deterioration in the OES spectrometer measurement to . When XRF and LIBS spectrometers are used, the very first layer of oil-alkyd and acrylic paint can cause erroneous scrap sorting. Increasing the number of coats of paint significantly affects the results of measuring the copper content of the sample and for 4 layers the difference ranges from about (oil-alkyd paint) to about when using acrylic and anti-corrosion paint. This means no detection or the detection of trace amounts of copper in scrap and the misclassification of scrap as non-copper-bearing material.
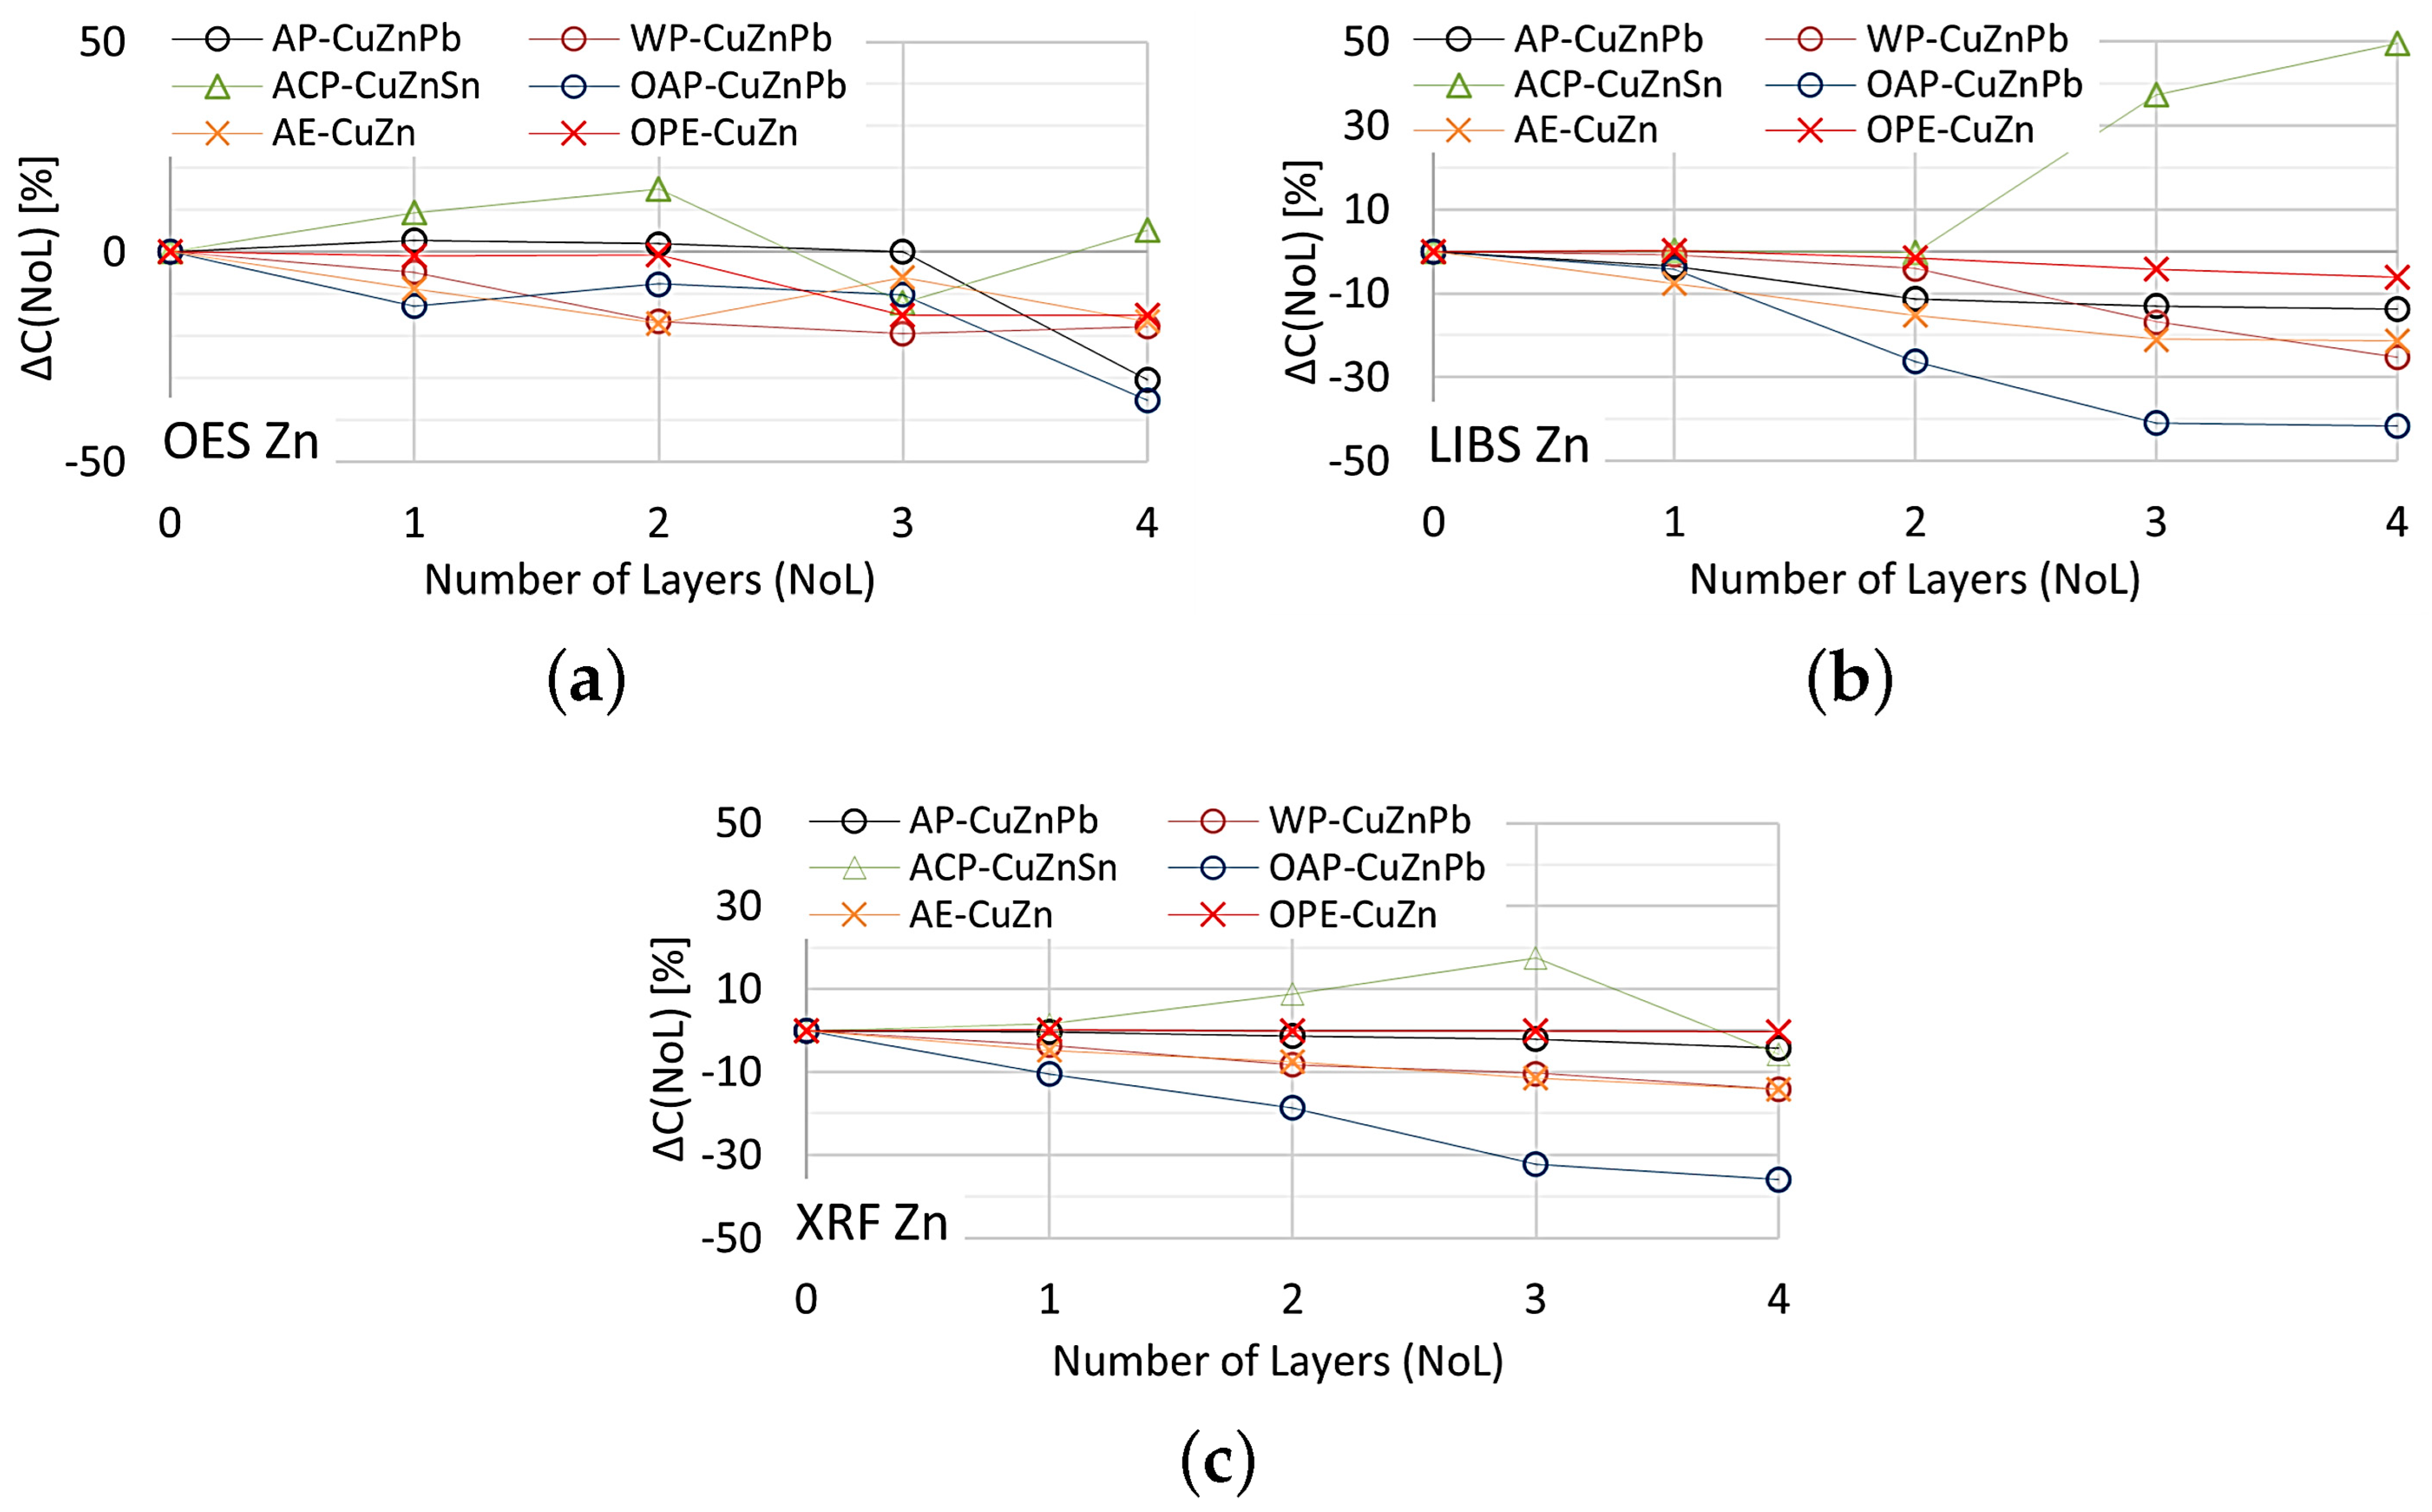
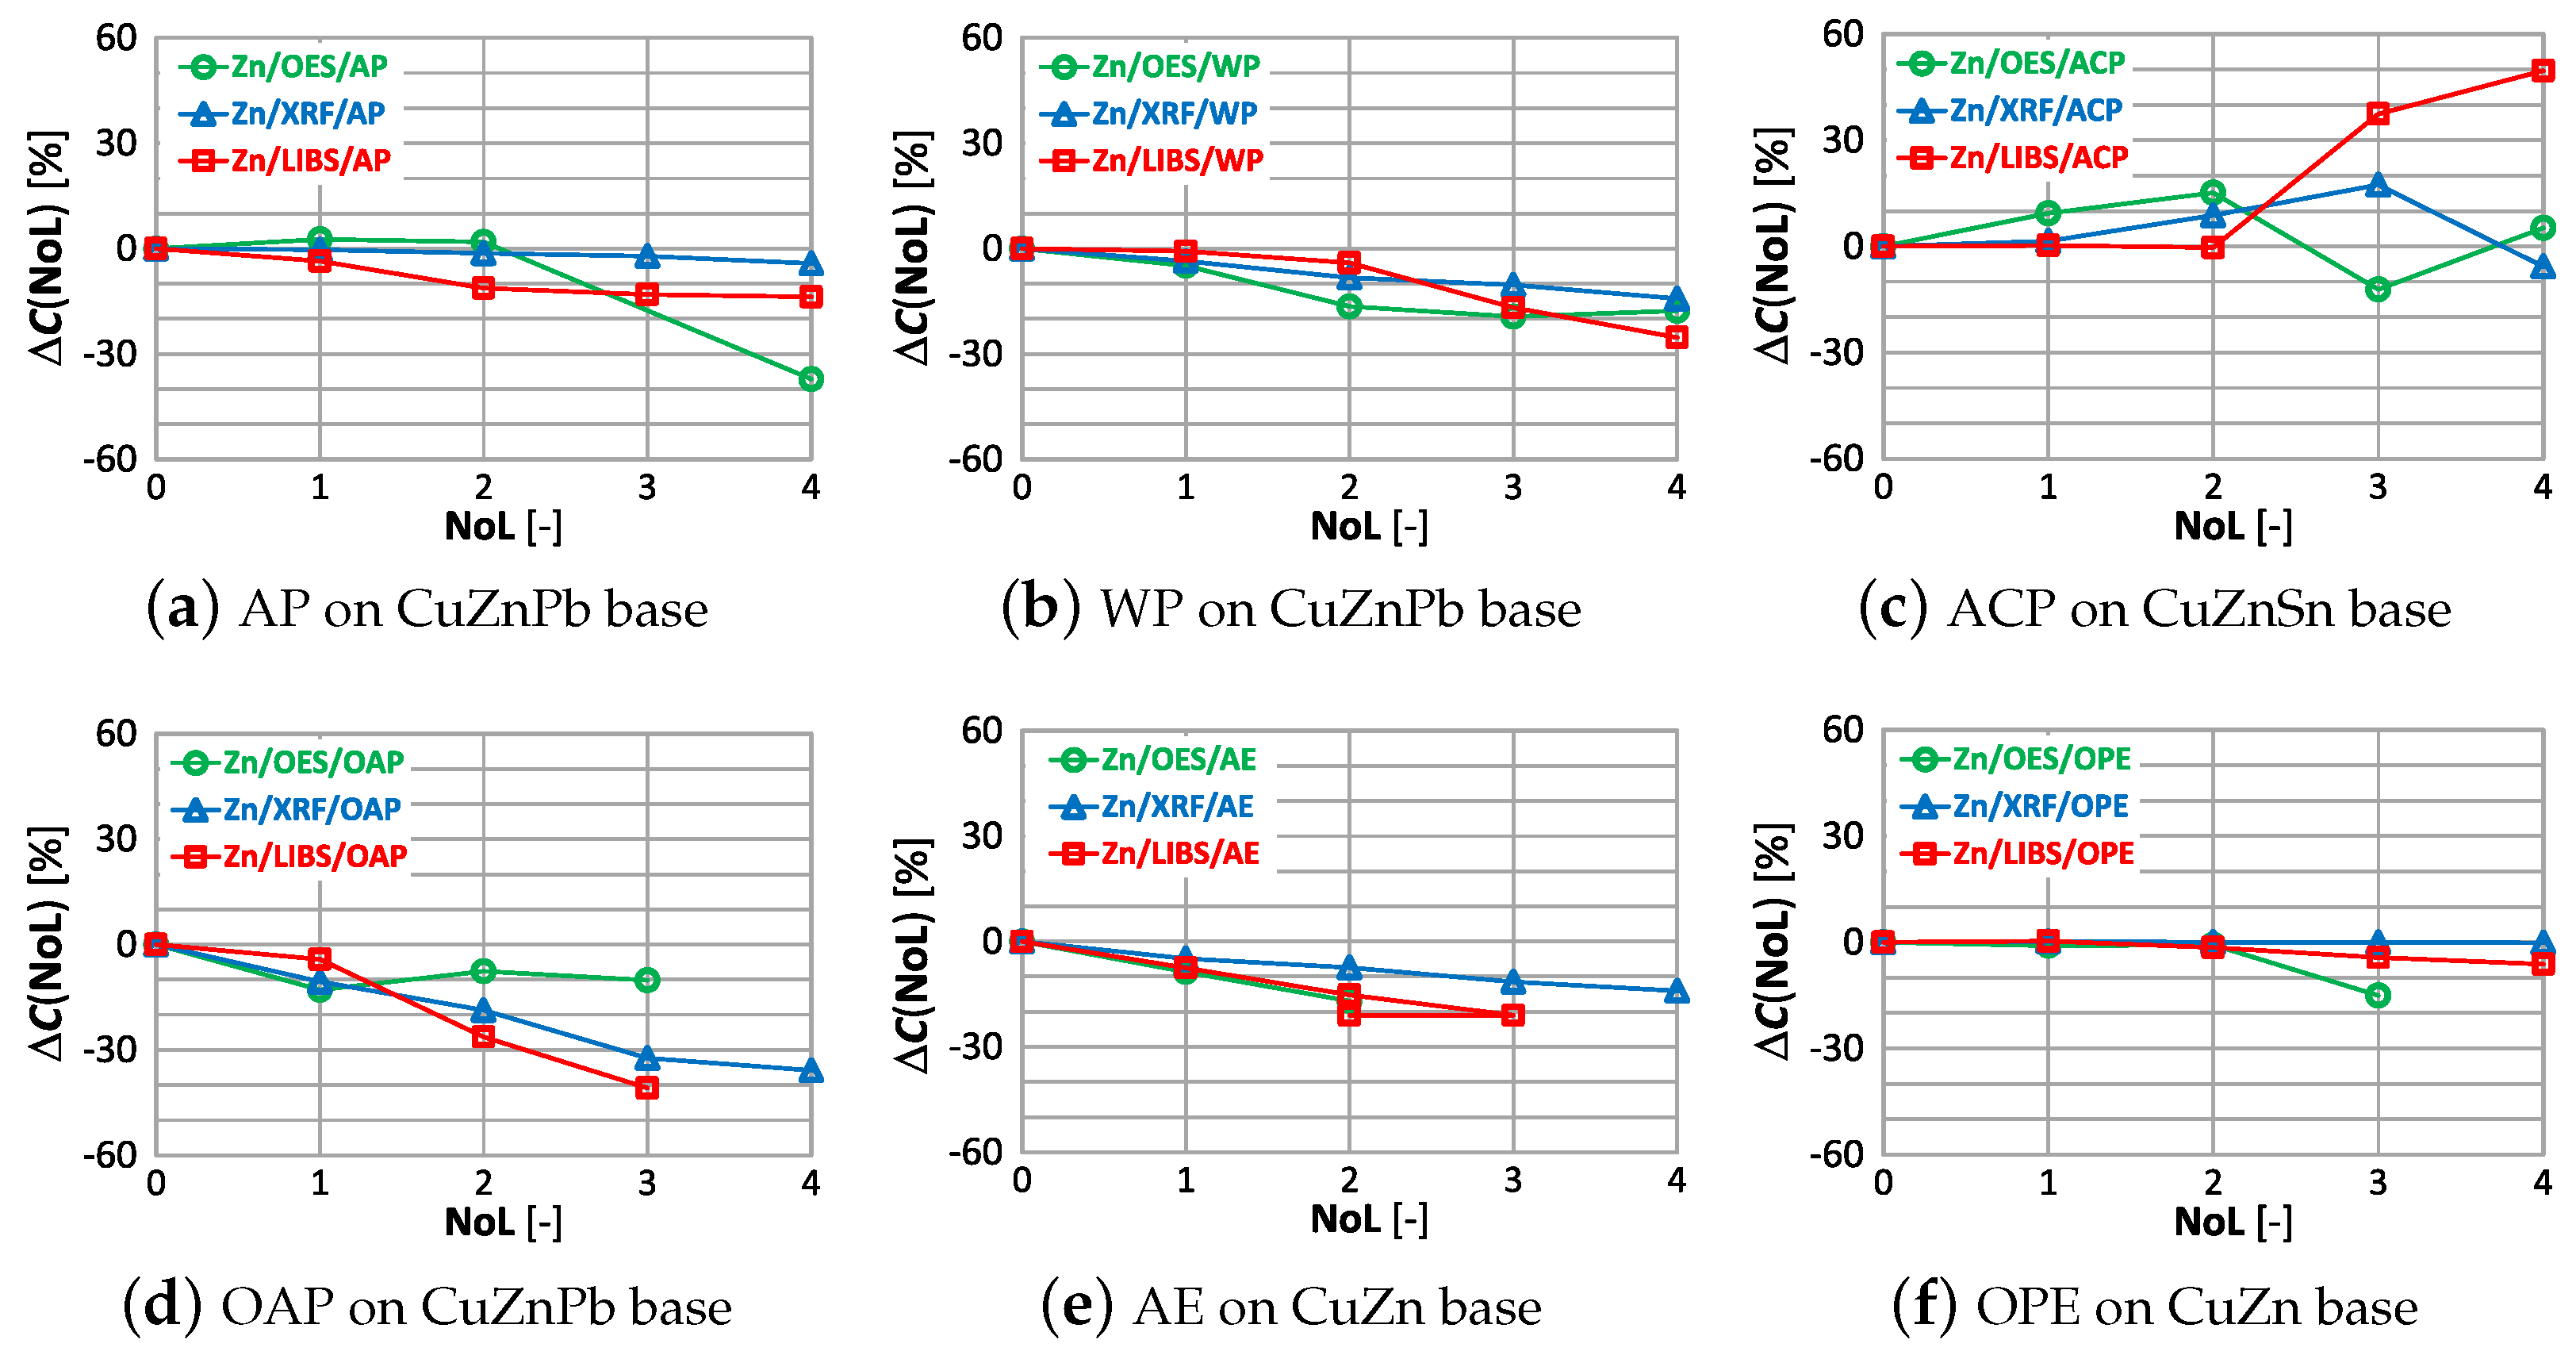
The effect of paint coatings on the result of zinc content measurements by OES, XRF and LIBS spectrometers is shown in Figure 21.
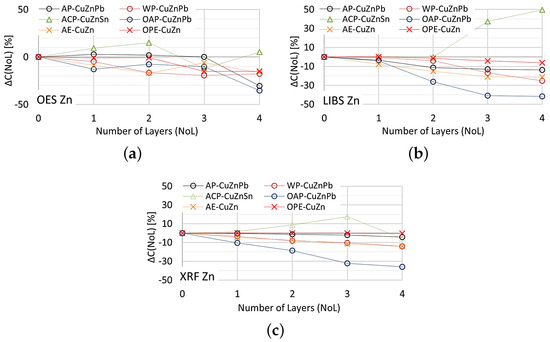
Figure 21.
for zinc content measurements taken with: (a) OES, (b) LIBS, (c) XRF spectrometers.
As in the case of assessing copper content, the weakest influence of paint coatings on zinc results occurs with the OES spectrometer. If the paint coating does not exceed three layers the impact is no greater than . Most scrap contains either a trace amount or a very large amount of zinc, so a value of enables effective industrial sorting of copper-bearing scrap for zinc content. The use of an XRF spectrometer and LIBS makes it possible to obtain the correct result of most zinc content measurements for a single layer of paint. The presence of more layers on the surface of the scrap will increase the difference up to , which makes it practically impossible to correctly sort copper-bearing scrap.
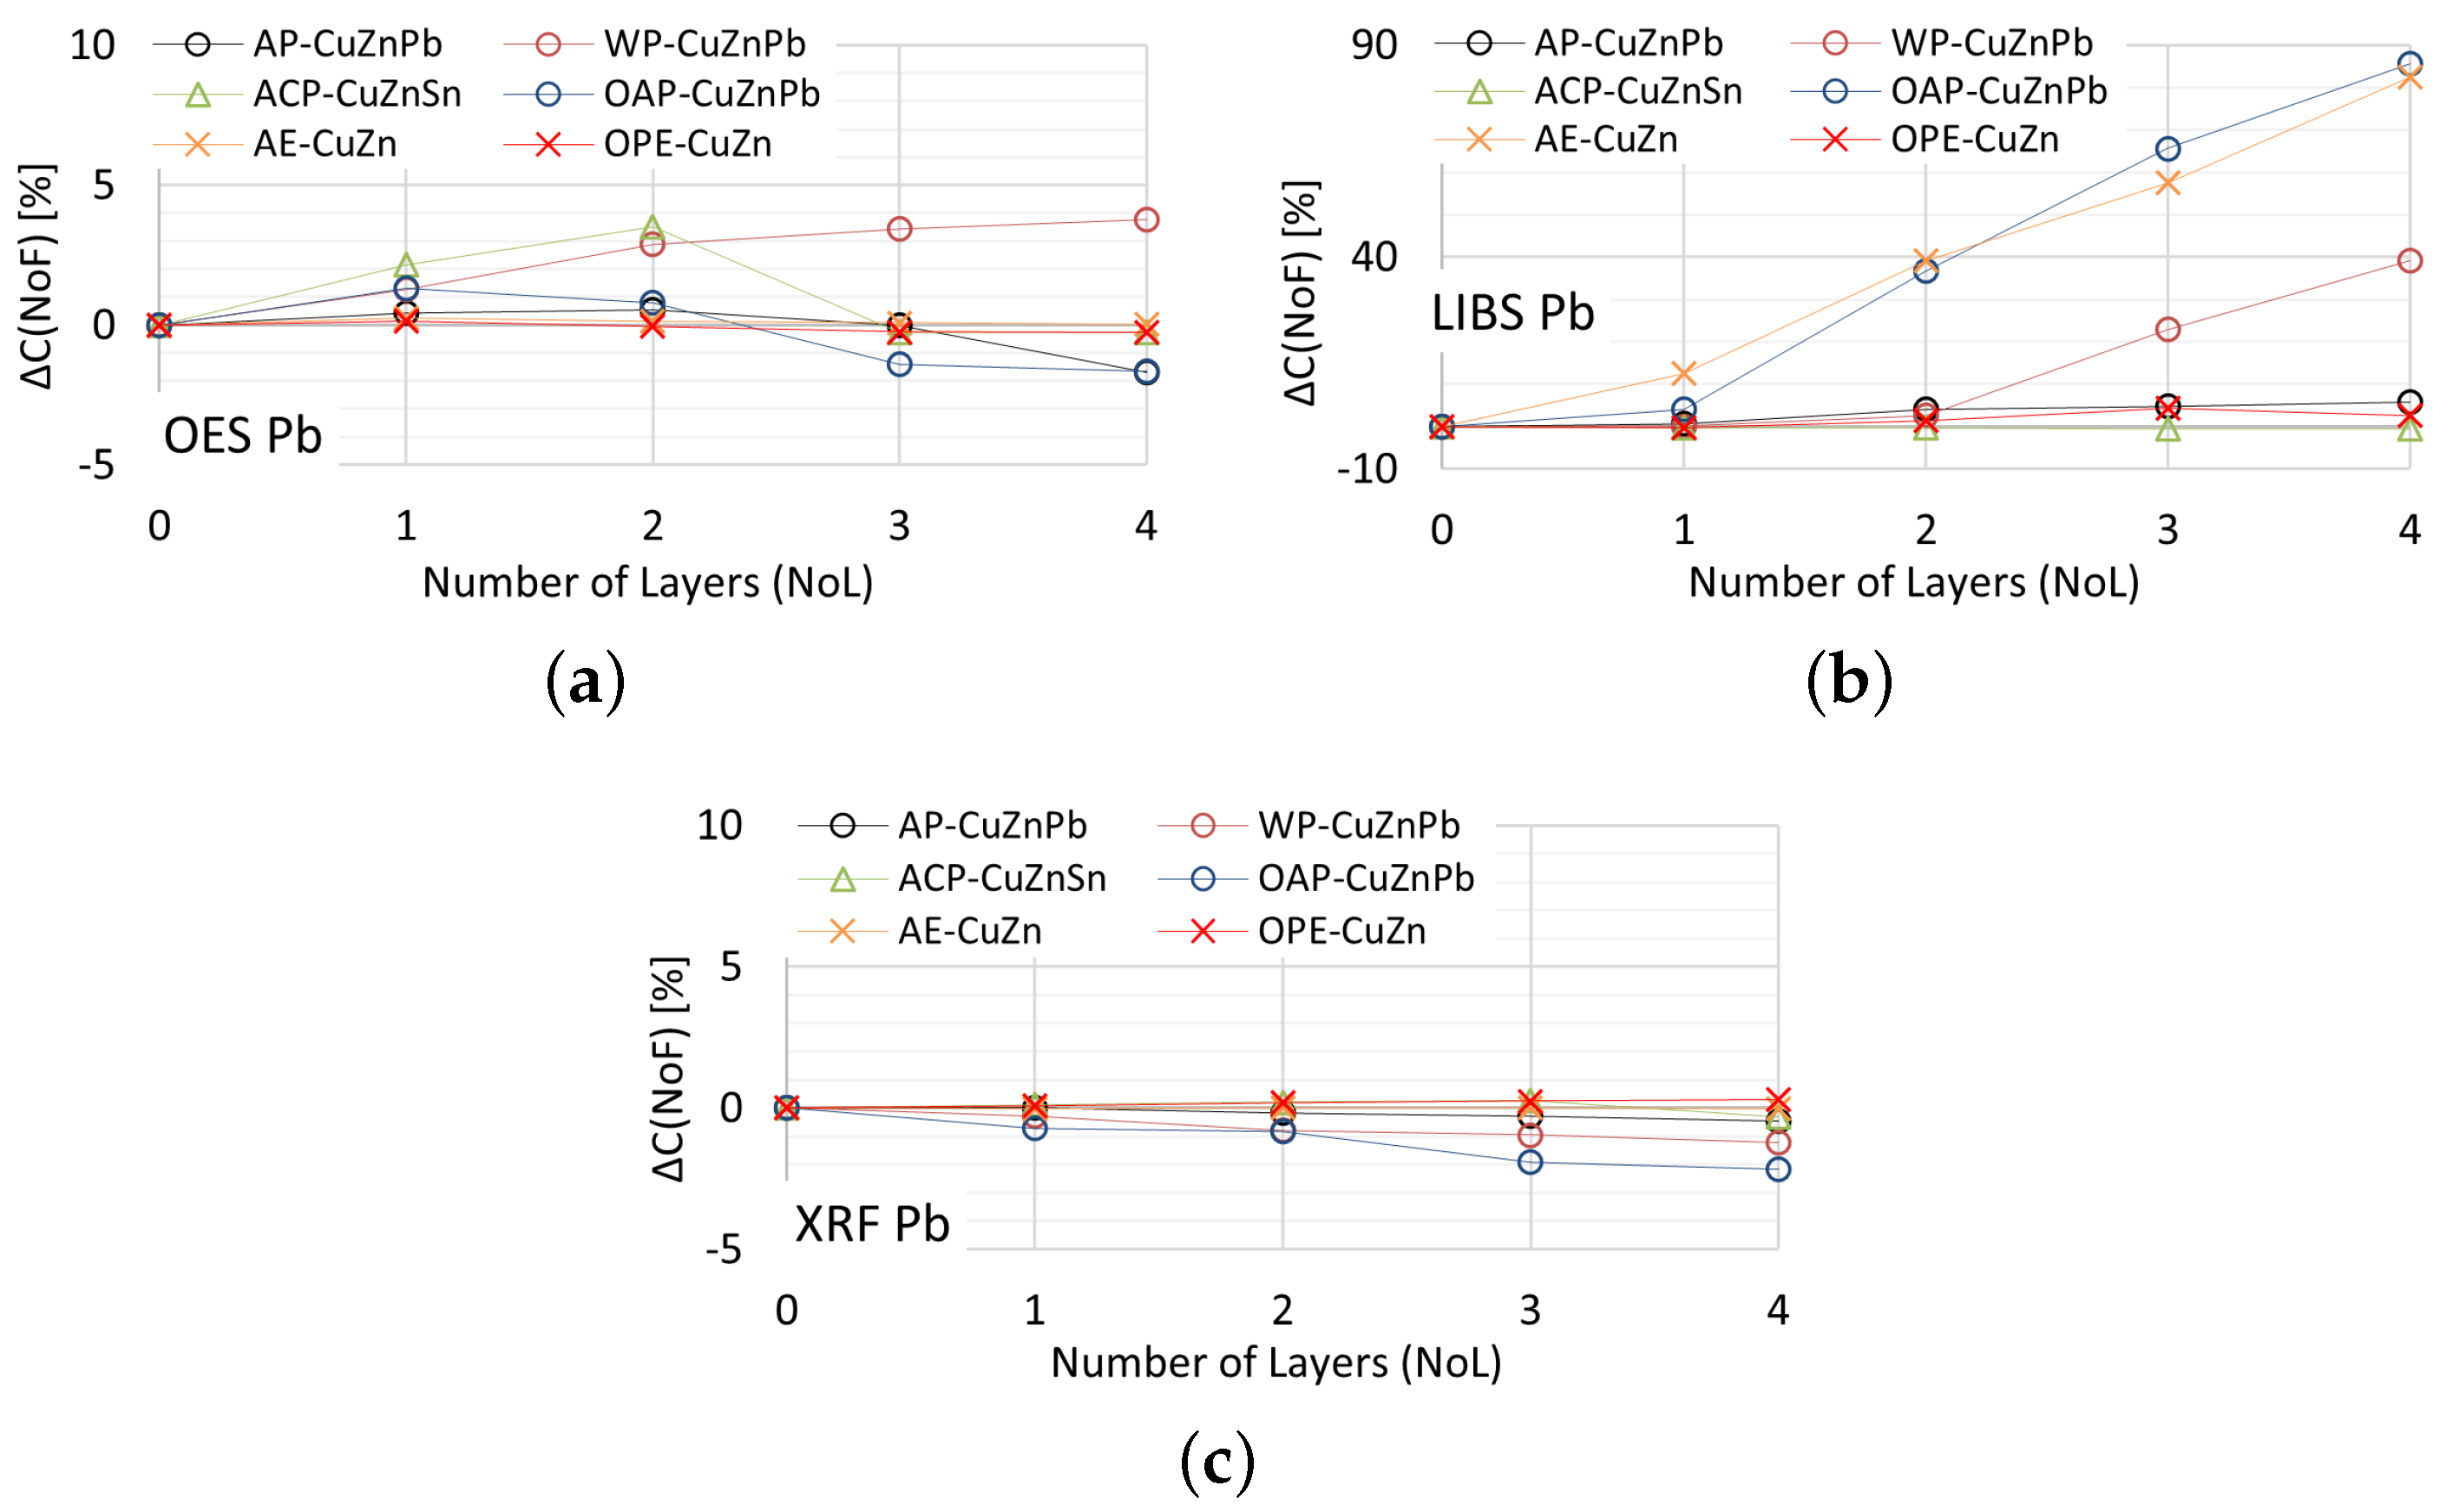
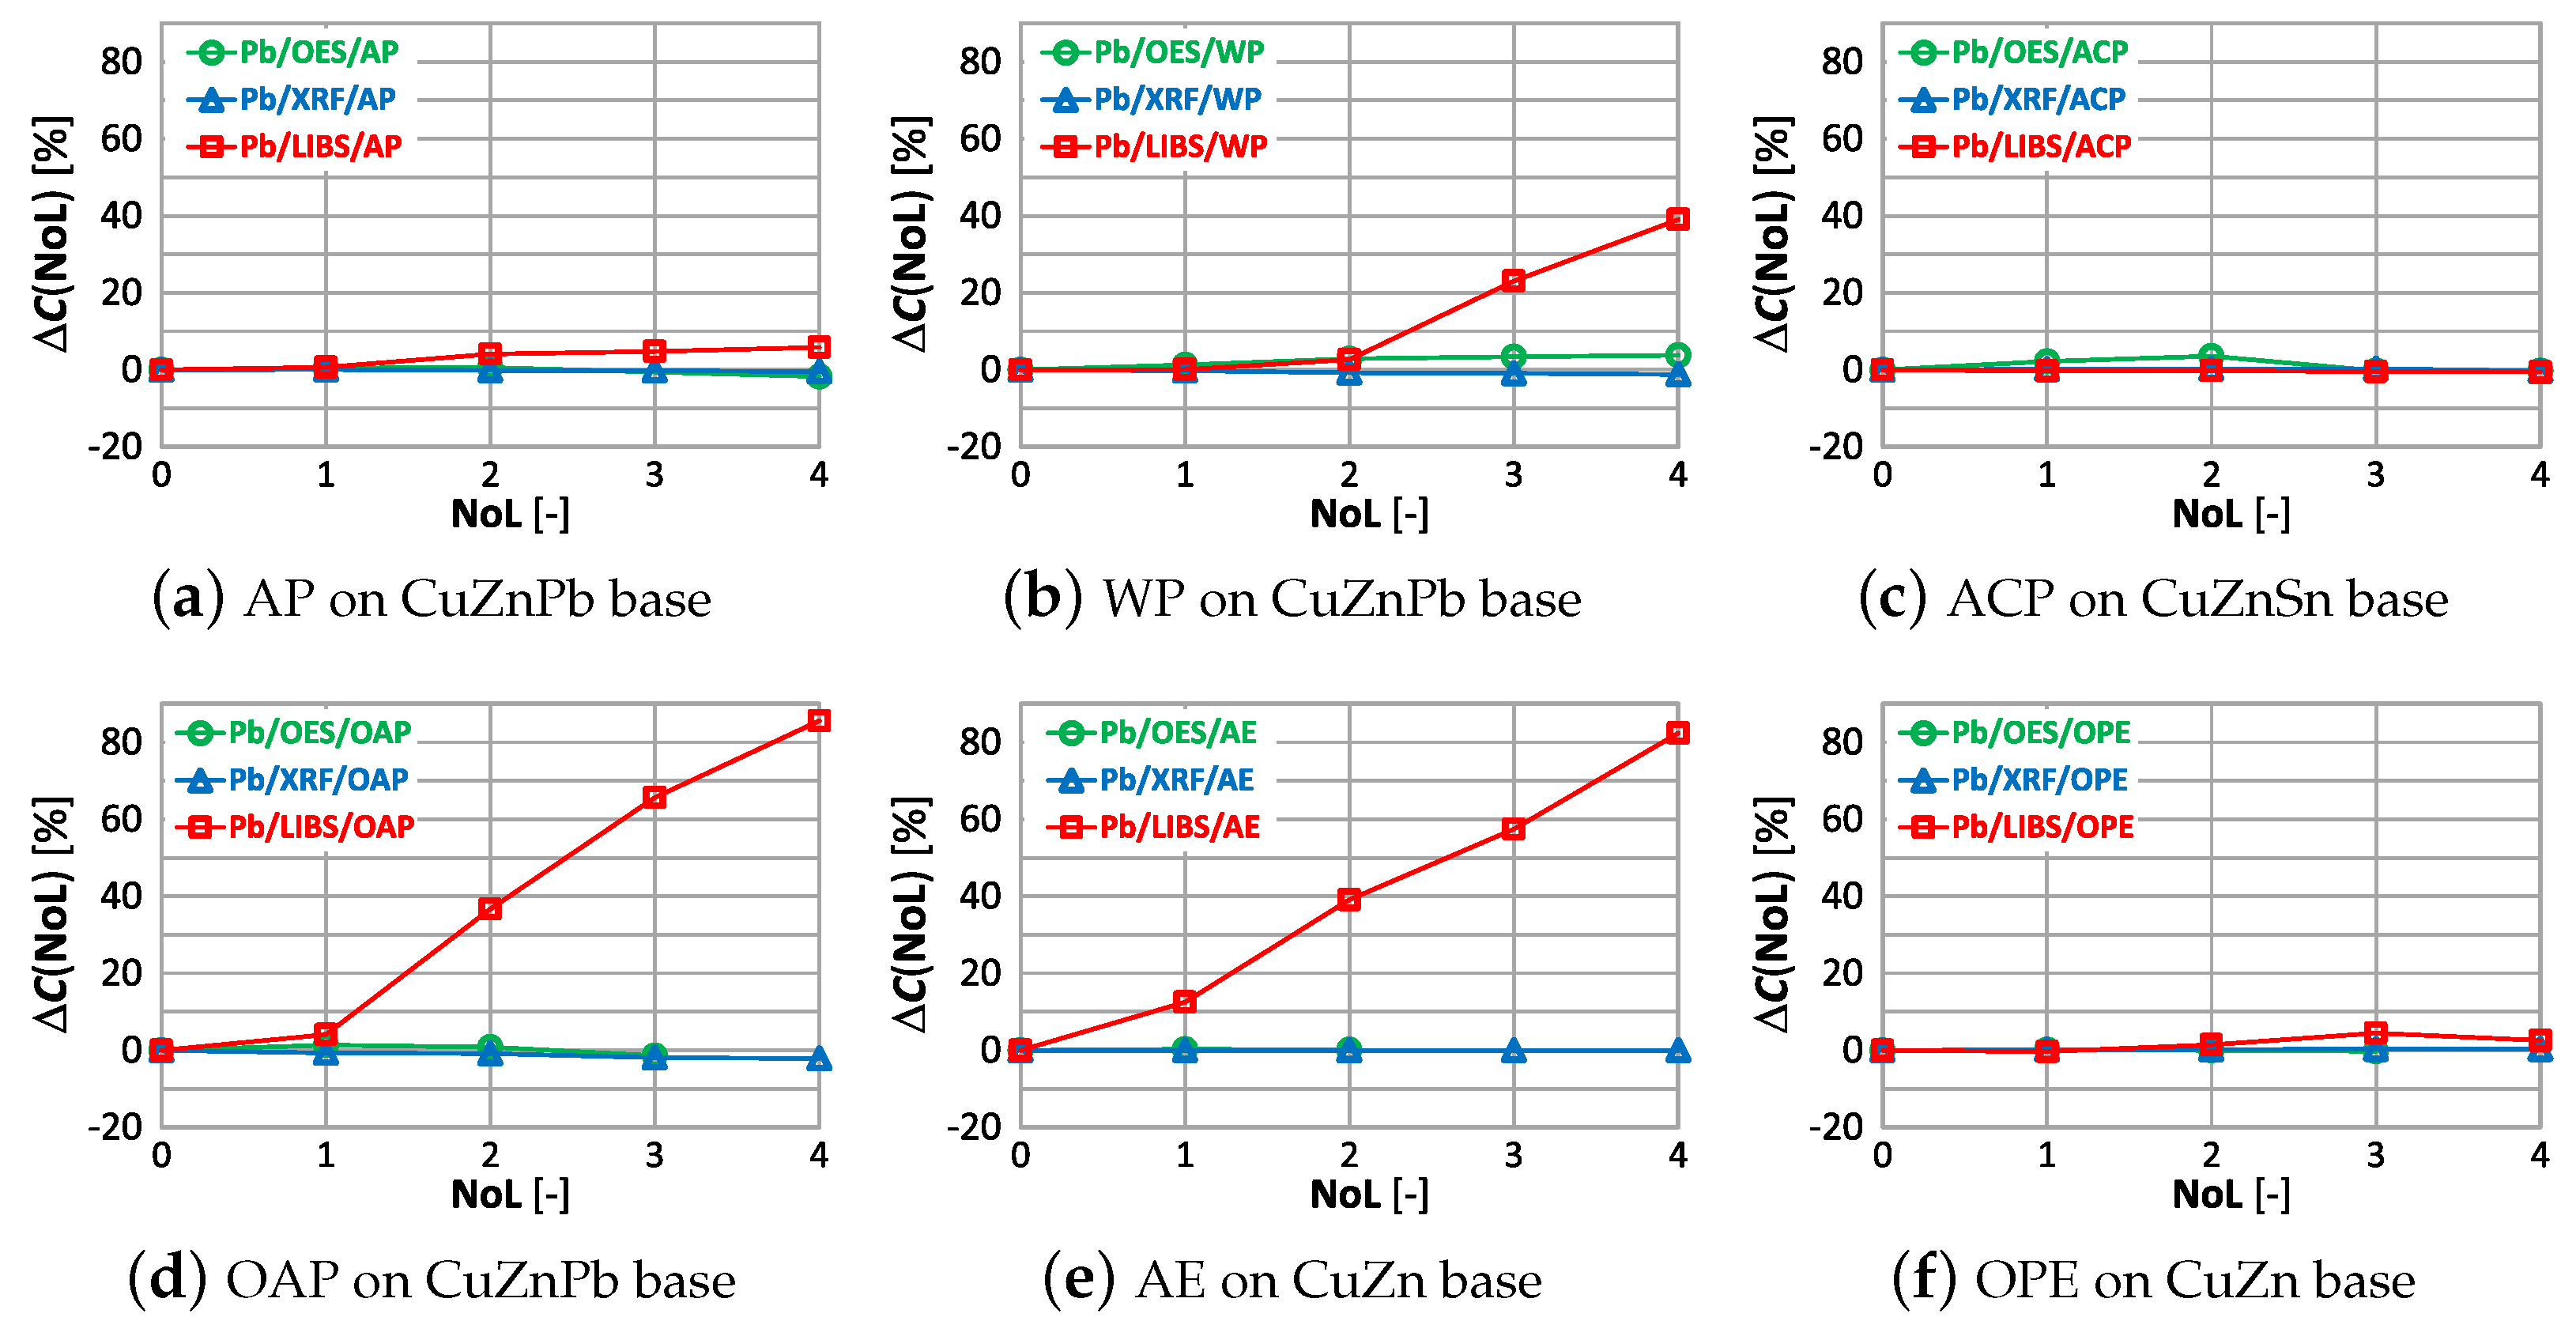
In Figure 22 is presented for the measurements of lead content taken by means of OES, XRF and LIBS spectrometers.
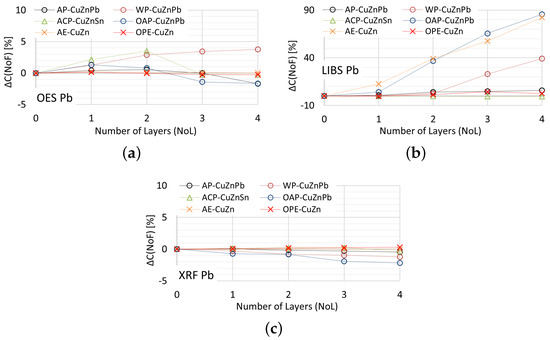
Figure 22.
for lead content measurements taken with: (a) OES, (b) LIBS, (c) XRF spectrometers.
Acceptable quality measurement of lead content is possible using the OES and XRF spectrometers (Figure 22a,c) for the number of layers of no more than one. In addition, the use of a coating in the form of anticorrosive paint causes the OES spectrometer to detect lead in samples where its content was at the level of 0.4% (ACP sample). The use of a paint coating in the form of acrylic, oil-alkyd and water-based paint makes it impossible to make a correct measurement of the lead content in the sample using the LIBS spectrometer. In such a case, already with two layers , which disqualifies such a measurement as a decision criterion during the segregation of copper-bearing scrap.
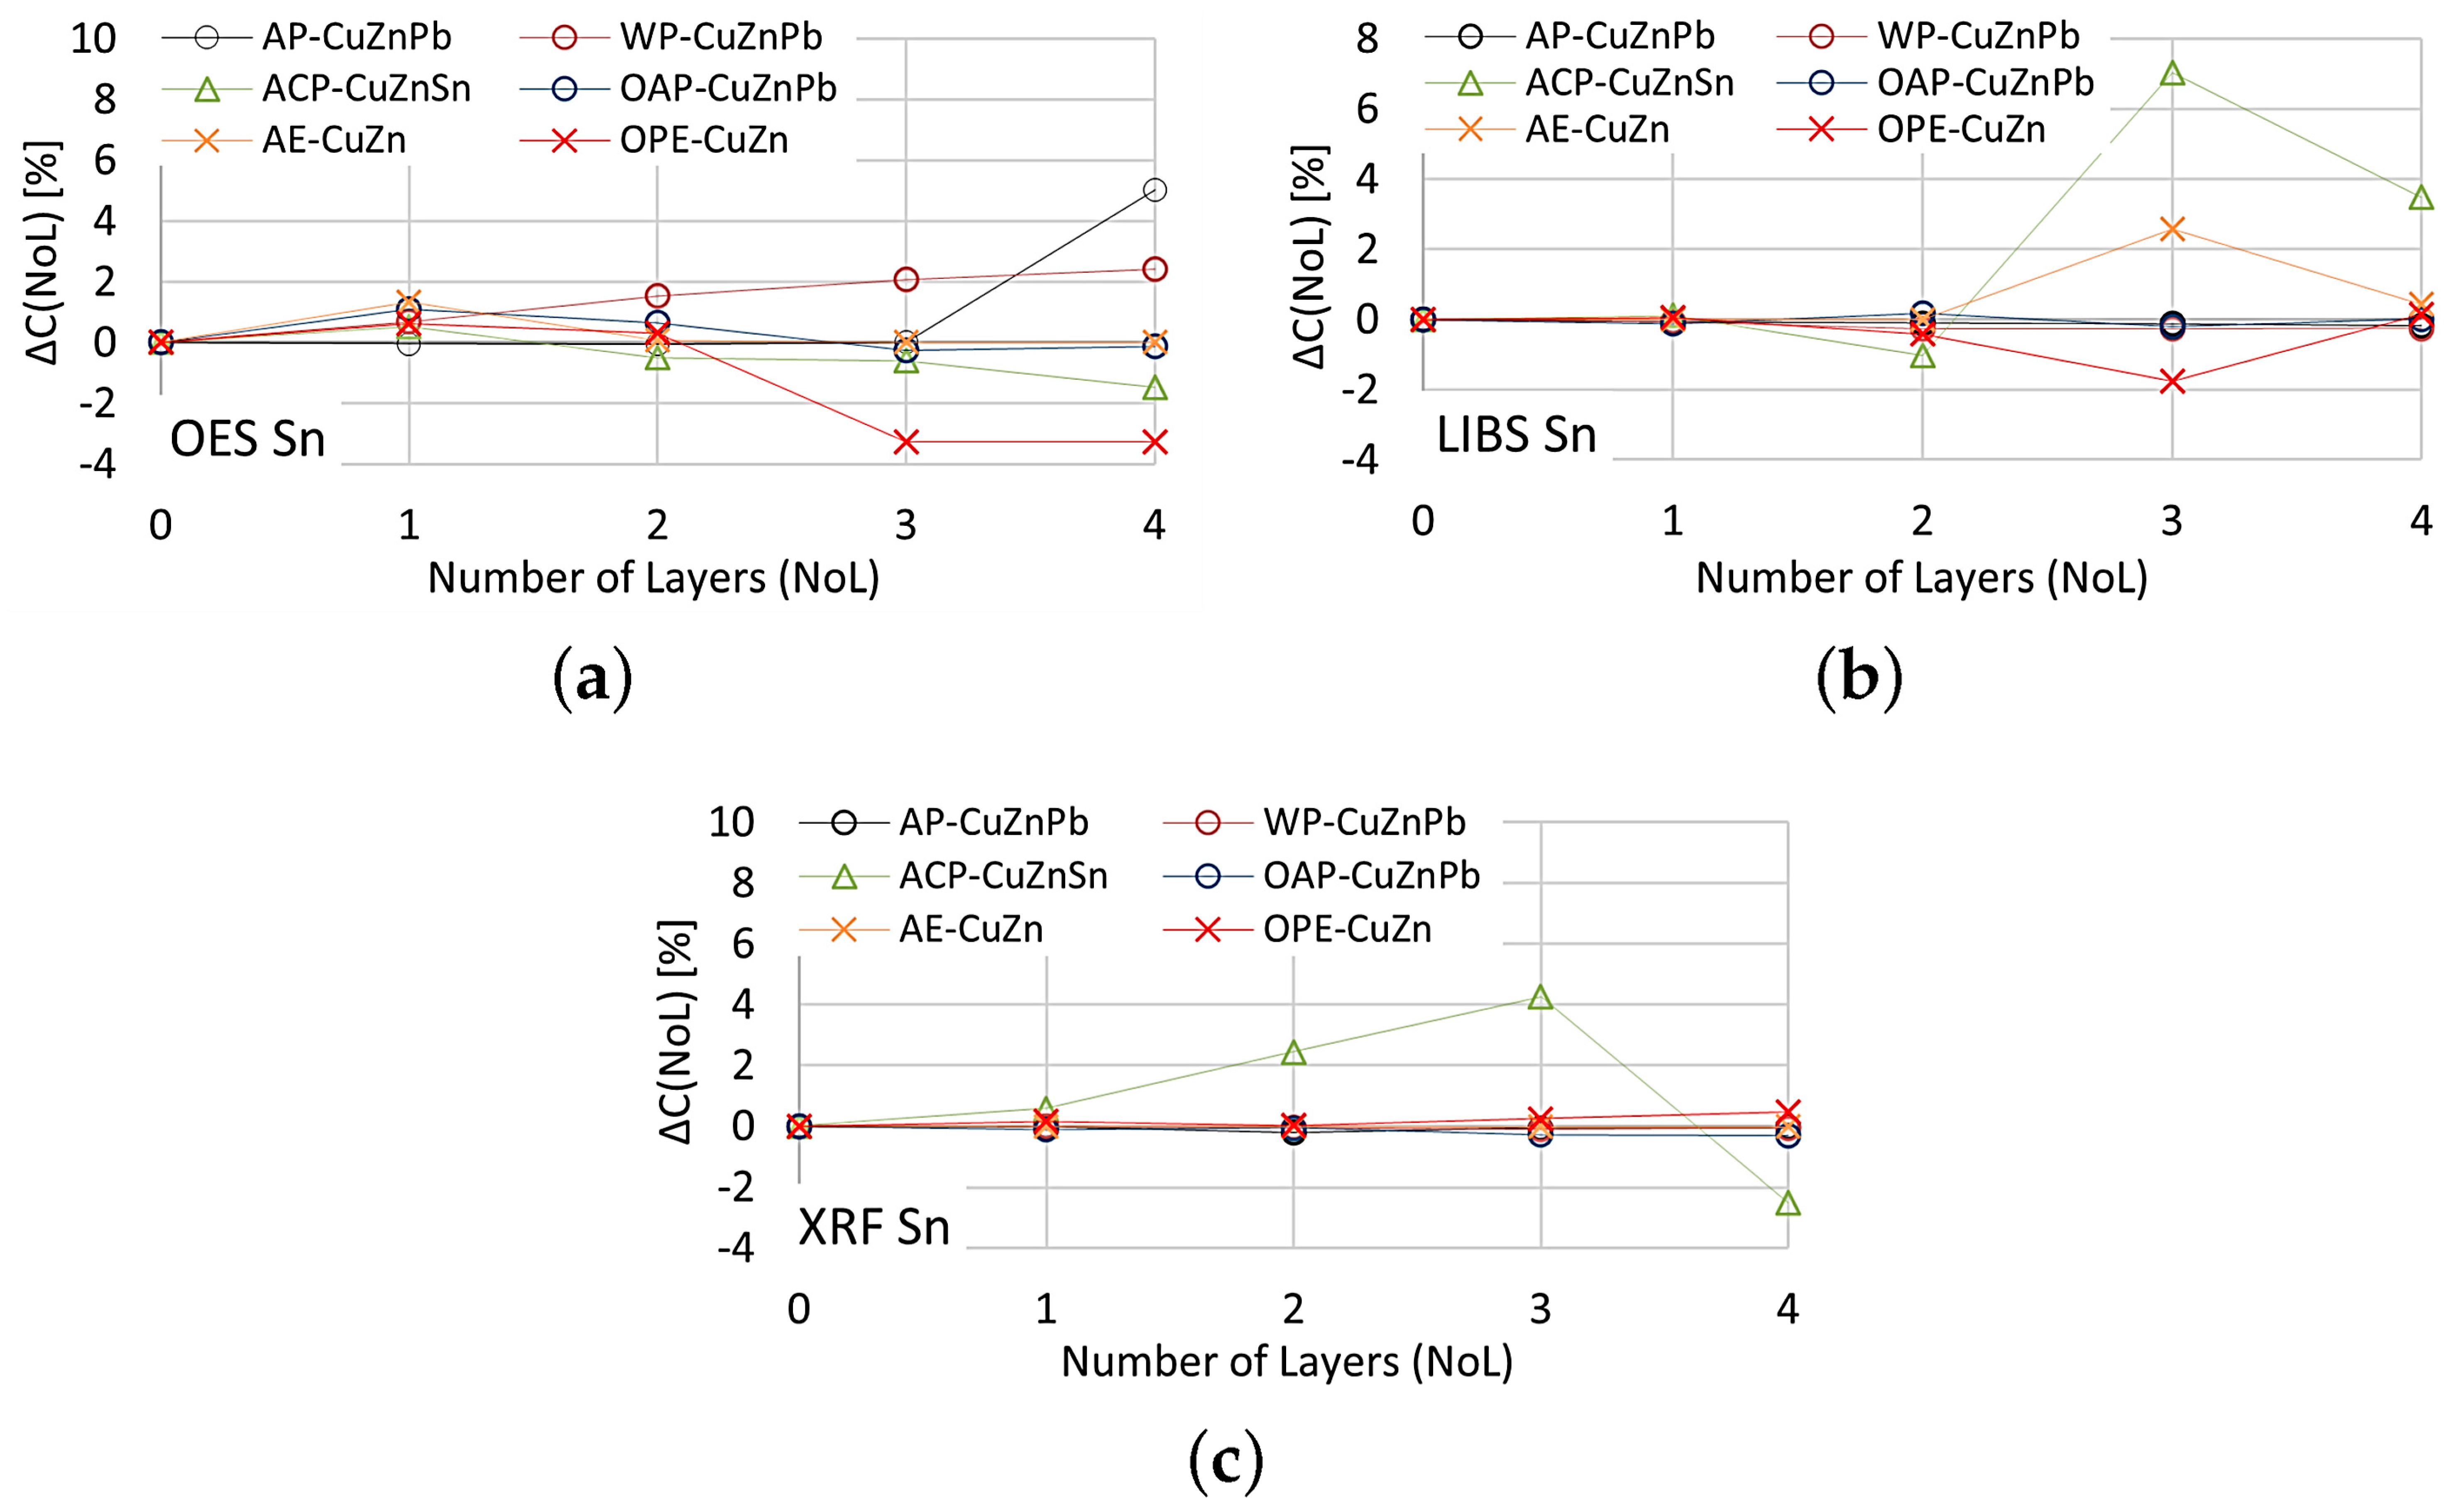
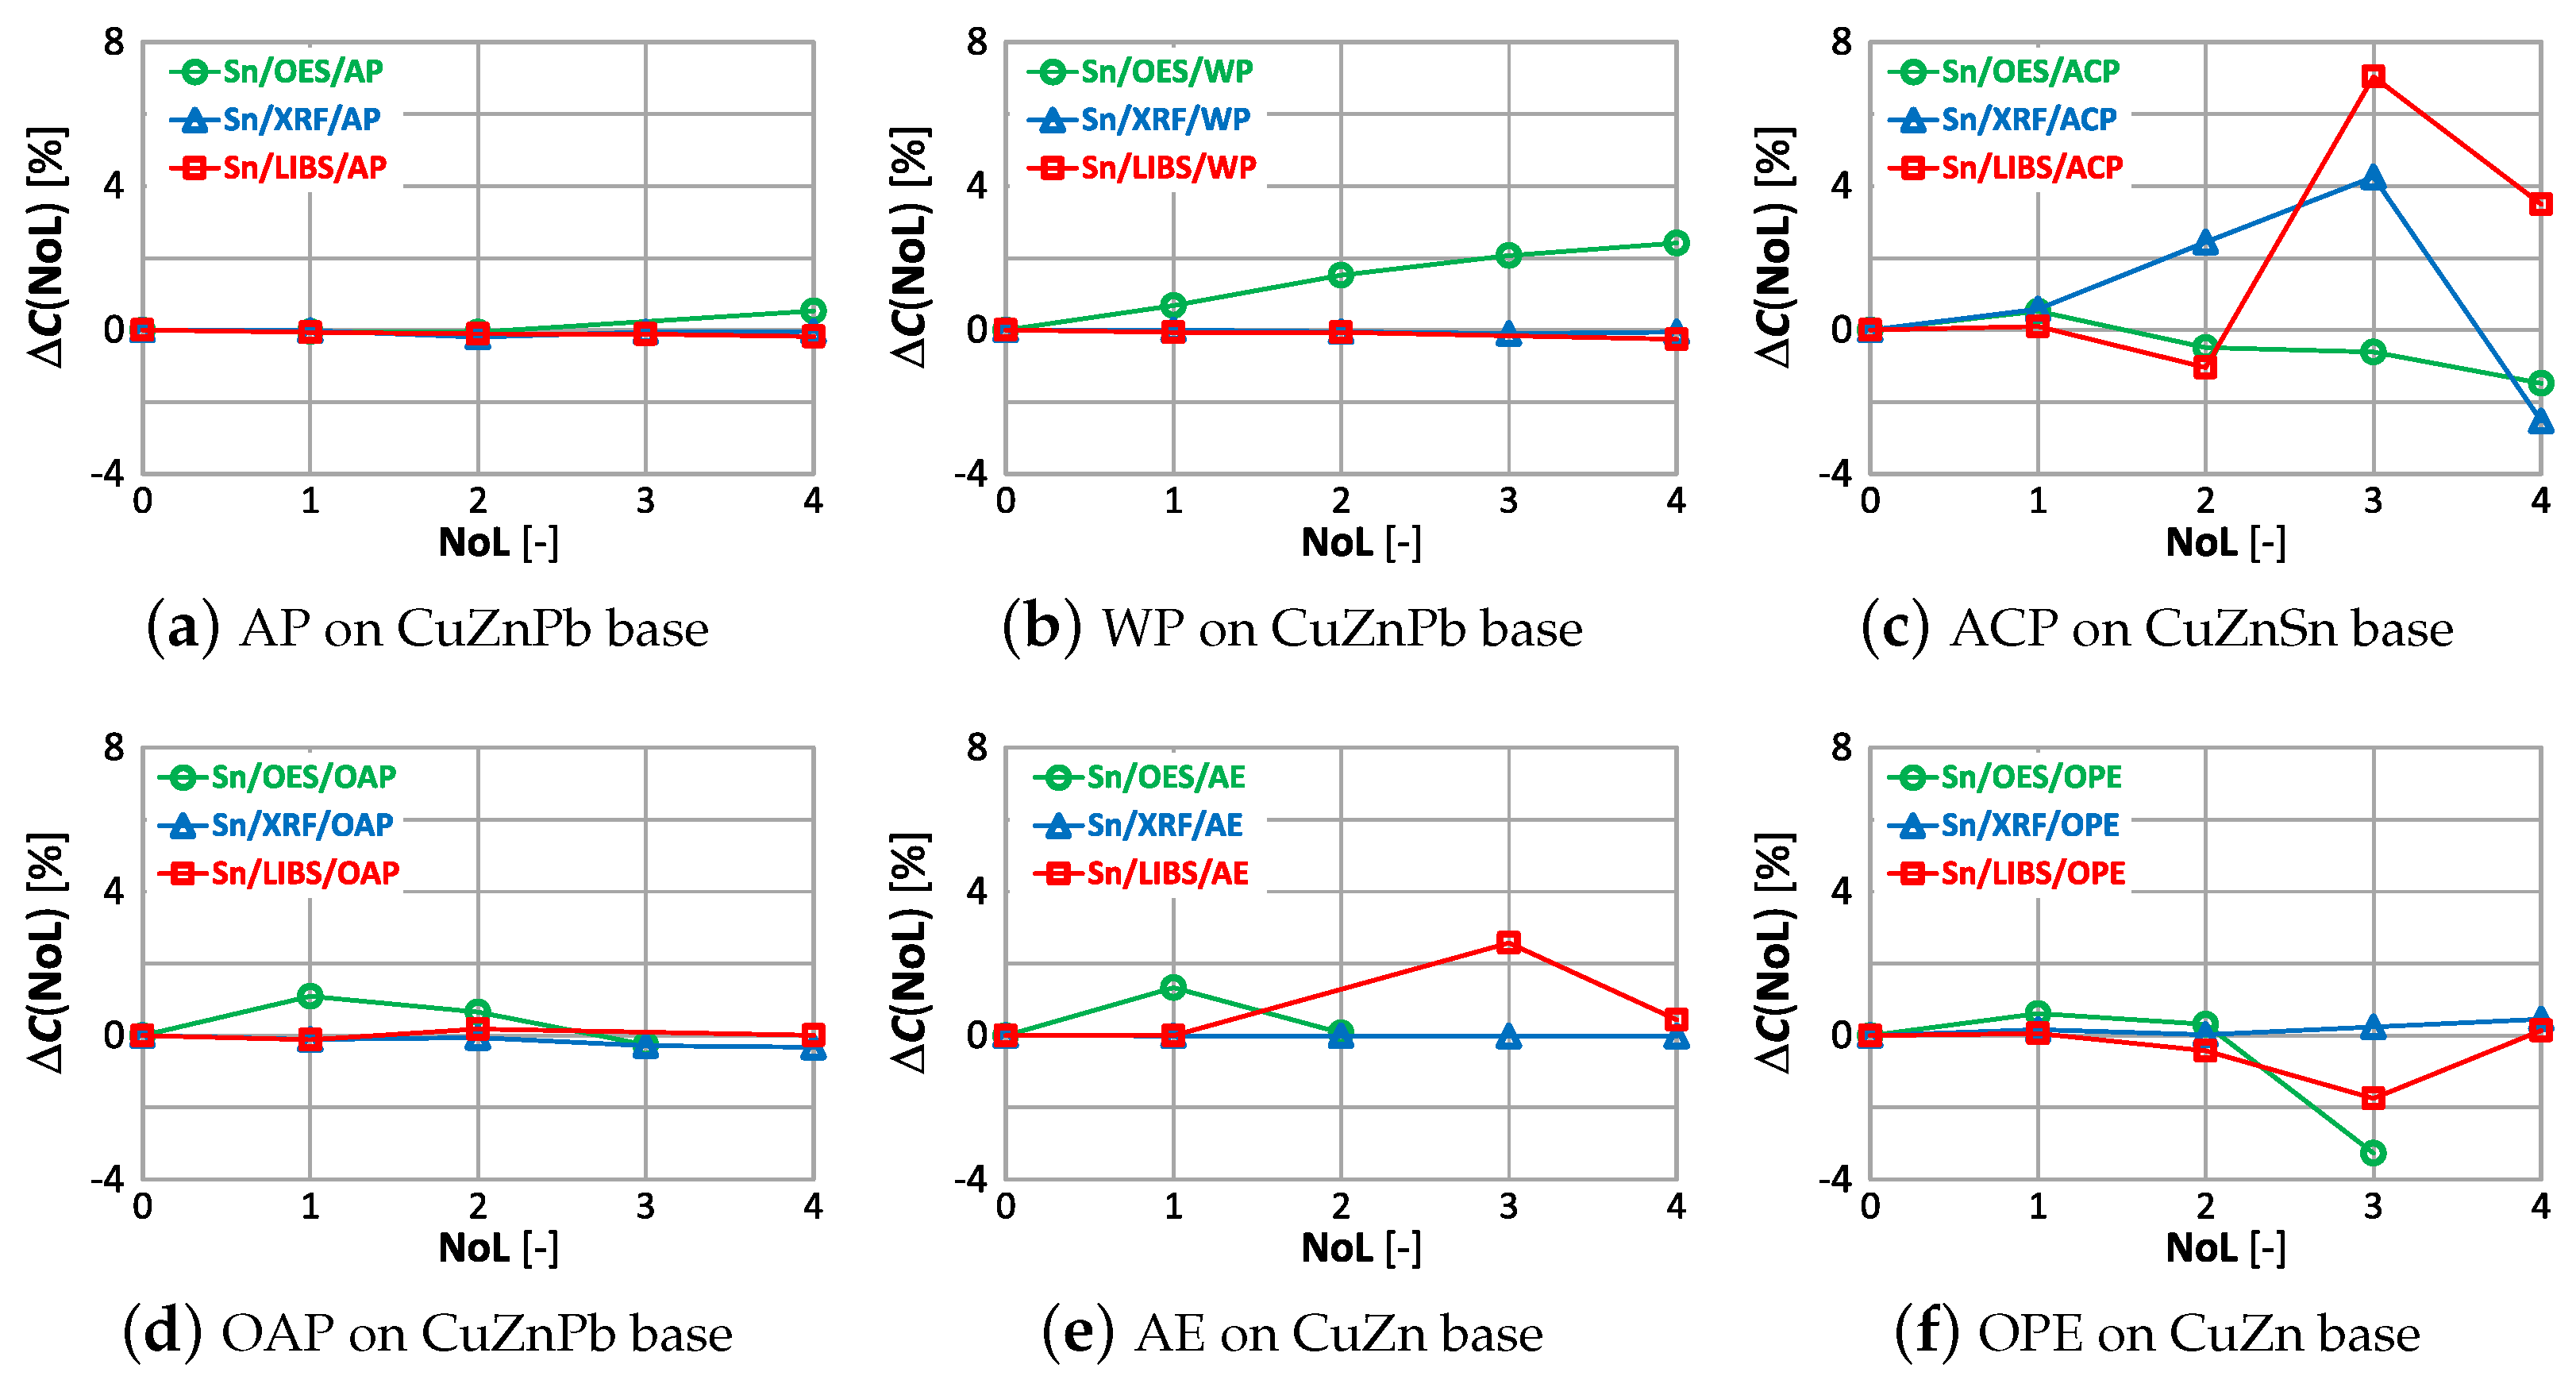
The effect of paint coatings on the result of measuring tin content is shown in Figure 23, with only samples labeled ACP and OPE having such an element in their chemical composition.
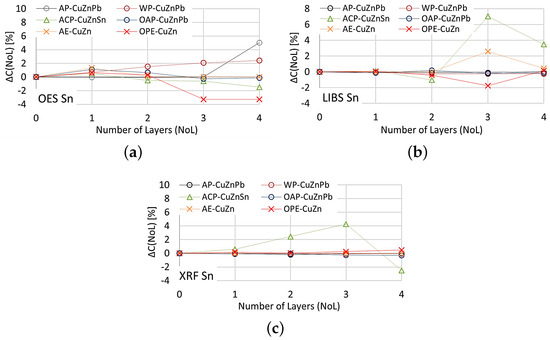
Figure 23.
for tin content measurements taken with: (a) OES, (b) LIBS, (c) XRF spectrometers.
The smallest effect of varnish coatings on the tin content result was obtained using the XRF spectrometer for a single layer of varnish coating, where . Increasing the number of paint layers results in an increase in . The effect of varnish coatings on the LIBS spectrometer measurement result increases for more than two layers, with noticeable differences values also occurring for samples where tin was absent. A pronounced effect on the OES spectrometer measurement results occurs for even one layer, and the effect of more layers varies particularly in samples where this element was absent.
The effect of coating type and number on the result for copper measurements by OES, LIBS and XRF spectrometers is shown in Figure 24.
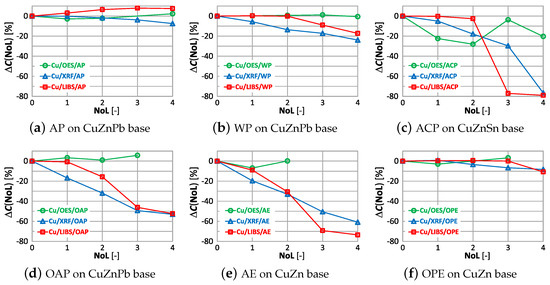
Figure 24.
characteristics of copper measurement for different types of paint.
The graphs show that by using the OES spectrometer it is possible to obtain similar measurements of copper content with two layers of applied paint coatings, except for anticorrosive paint (ACP). In this case, even single layer results in a reduction of by ≈30%. For oil-alkyd and acrylic coating, it is not possible to measure for three layers and more. Measurement with the XRF spectrometer and LIBS on surfaces with a minimum of one layer of anti-corrosion paint, oil-alkyd and acrylic enamel gives a very high value of up to –80%.
The dependence of on the number of layers and the type of coatings for zinc are shown in Figure 25.
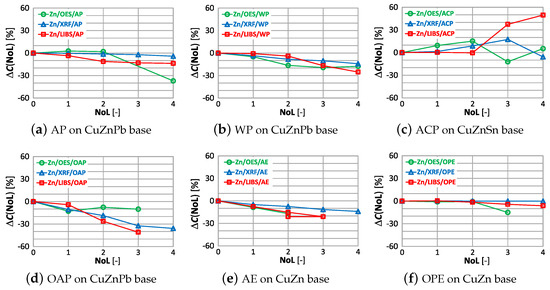
Figure 25.
characteristics of zinc measurement for different types of paint.
Using an OES spectrometer for measurement, as with copper content, yields similar correlations in the difference . The LIBS measurement is the most sensitive to the number and type of paint coating, where already the second coat of paint causes a significant change in the measurement of zinc content.
The correlations of with the number of layers and the type of paint coatings for tin are shown in Figure 26, and they were present only in the sample with an anti-corrosion coating (Figure 26c and an oil-phthalic coating (Figure 26f).
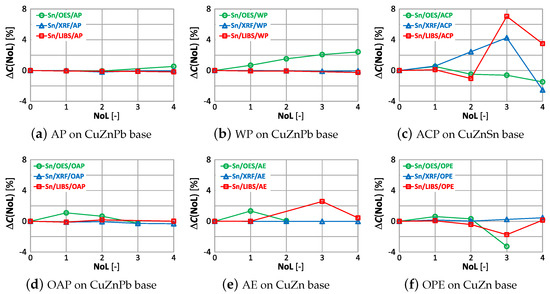
Figure 26.
characteristics of tin measurement for different types of paint.
In these samples up to the number of layers equal to 1 and 2, respectively, the value practically does not change. In the ACP-coated sample, applying the second and more layers of varnish, regardless of the type of spectrometer, will cause the tin content measurement results to be misinterpreted. The disturbing information from the study is that despite the absence of tin in the WP, AE, OAP samples, the OES spectrometer revealed it from the first layer of varnish. The XRF spectrometer is the least sensitive to the value for tin.
The correlations of with the number of layers and the type of paint coatings for lead are shown in Figure 27.
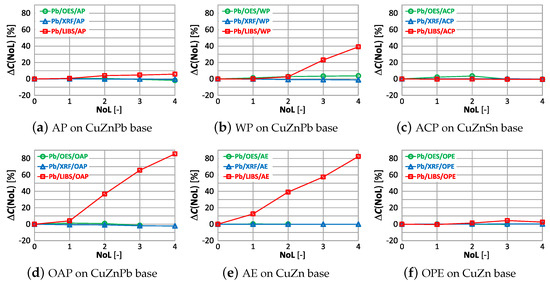
Figure 27.
characteristics of lead measurement for different types of paint.
The use of alkyd paint in a sample containing lead (Figure 27a), causes no significant change in the value regardless of the number of layers and the measurement method used. The oil-alkyd coating eliminates the use of the LIBS spectrometer from the second layer of paint, where the value is . In the case of the CuZn alloy sample with an acrylic coating, despite the absence of lead, the spectrometer showed its content already from the first layer of varnish, which will make it impossible to sort the scrap correctly.
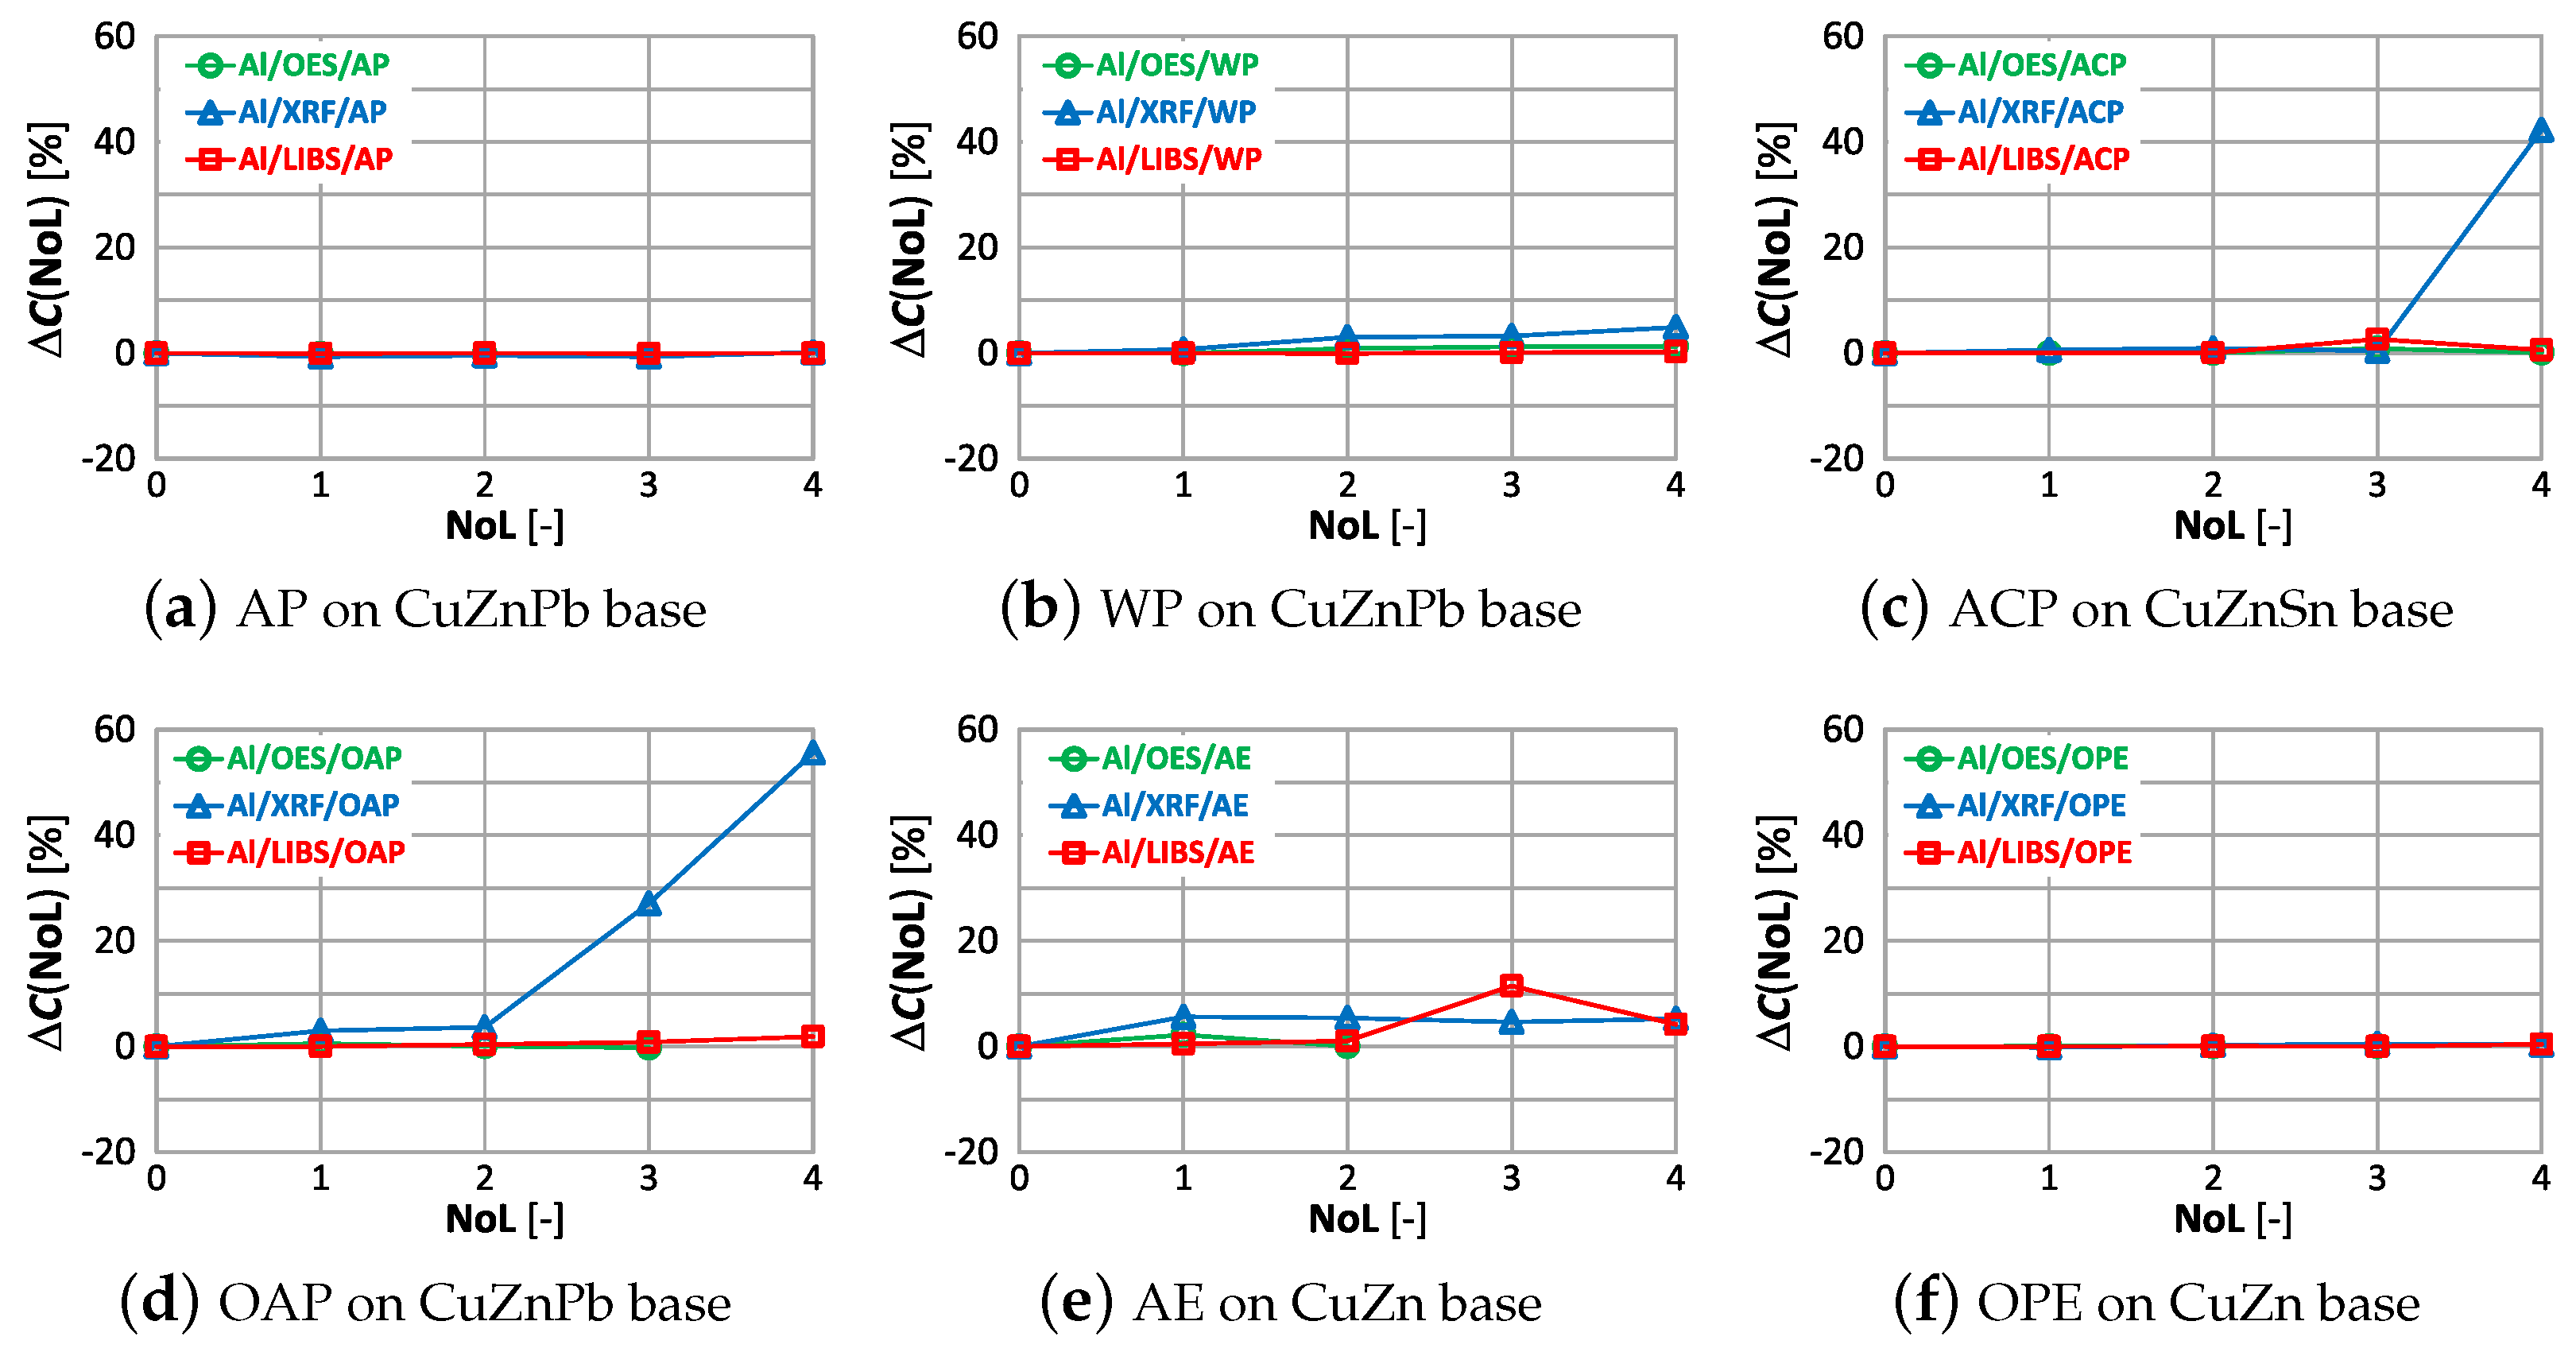
The correlations of with the number of layers and type of paint coatings for aluminum, silicon and iron are shown in Figure 28, Figure 29 and Figure 30.
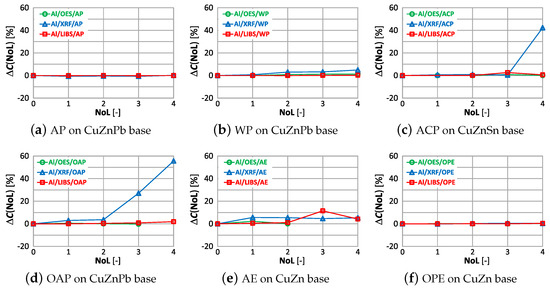
Figure 28.
characteristics of aluminium measurement for different types of paint.
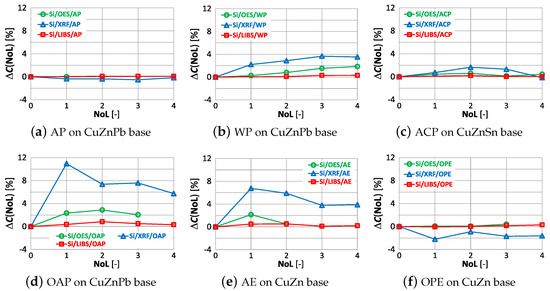
Figure 29.
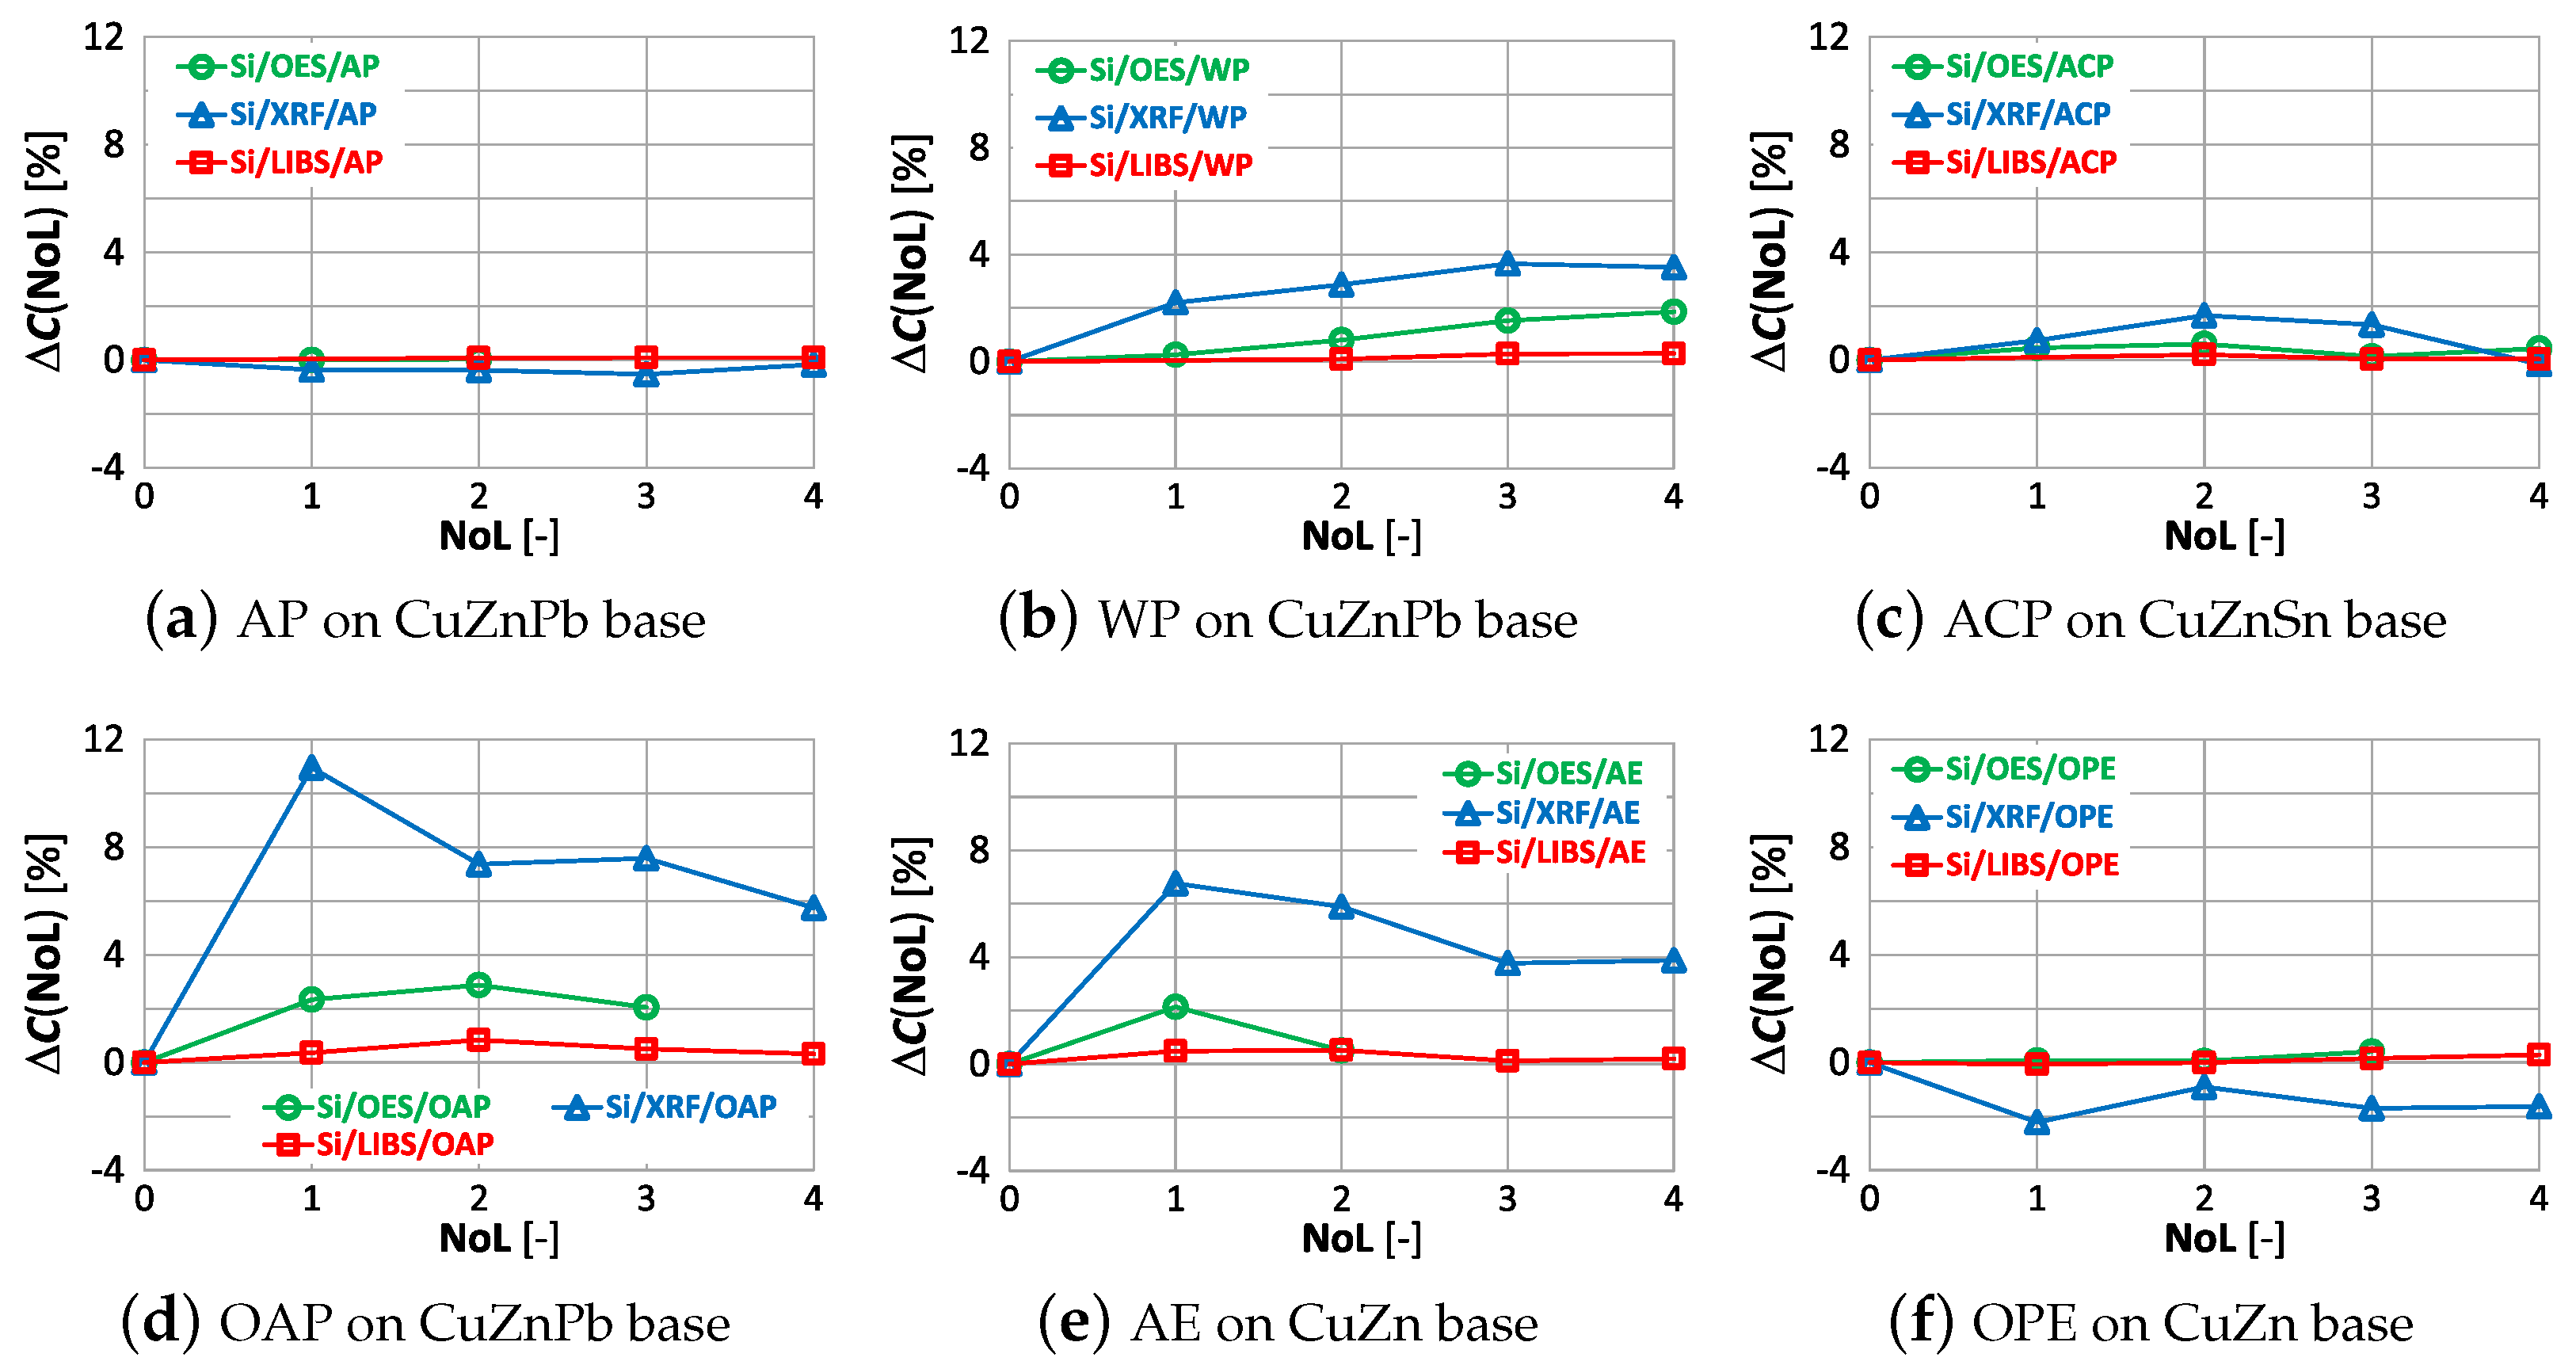
characteristics of silicon measurement for different types of paint.
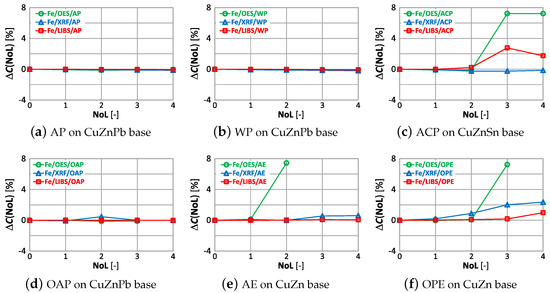
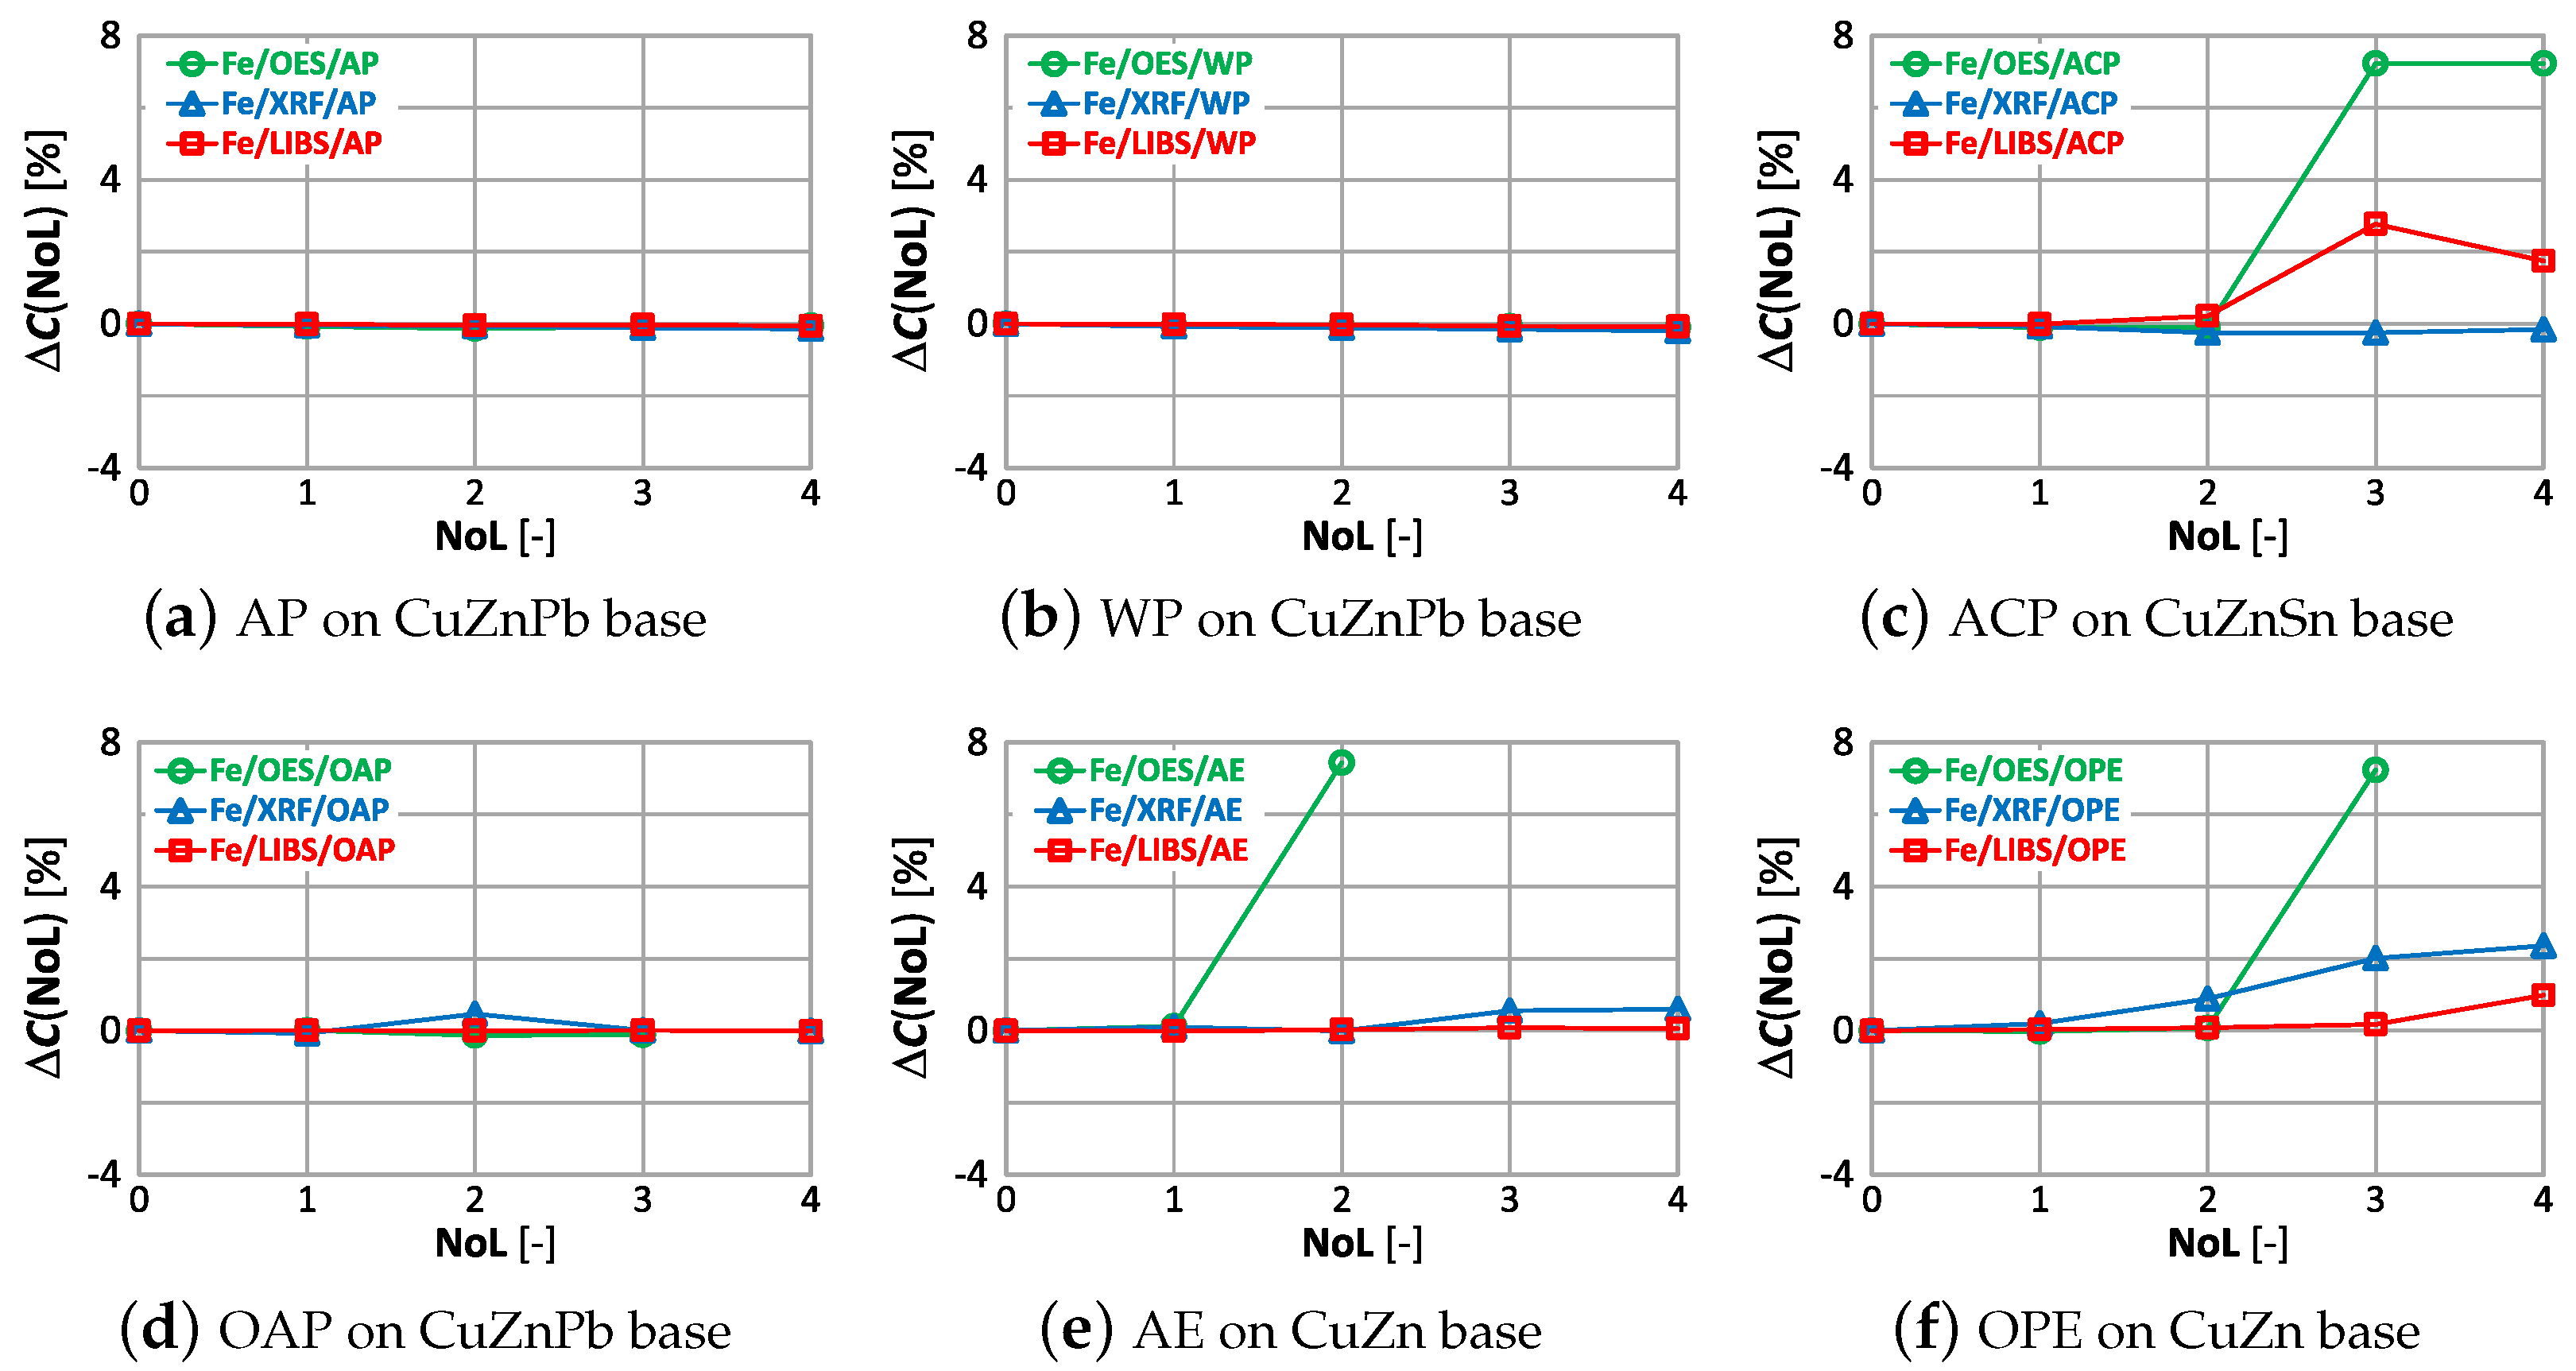
Figure 30.
characteristics of iron measurement for different types of paint.
The paint coatings used for the tests have virtually no effect on the value for all samples except ACP and OAP, where only layers 4 and 3 cause significant changes in aluminum content using the XRF spectrometer. Silicon, which is not present in any of the analyzed samples, is correctly determined only with the LIBS spectrometer. The highest values of occur when measured with the XRF spectrometer, where the very first layer of paint coating will cause an incorrect determination of this element by as much as ≈22% (Figure 29d). Iron, which was present at a maximum of 0.2% in the samples, is correctly determined ( value) for samples with AP, WP and OAP paint. The use of the OES spectrometer in samples with AE, ACO and OPE results in values of .
5. Summary
The paper reports the results of a study of the effect of roughness and paint coatings on the results of measuring the copper, zinc, lead, tin, aluminum, iron and silicon content of copper alloys. CuZn, CuZnPb, CuSnZnPb and CuSn alloy samples were tested. Measurements were performed under laboratory conditions with spectrometers using spark excitation emission spectroscopy (OES) and laser excitation spectroscopy (LIBS), as well as an X-ray fluorescence spectrometer (XRF). The OES spectrometer was of mobile design, while the XRF and LIBS were handheld. The spectrometers used in the study were those used by companies involved in the segregation of copper-bearing scrap. As a measure of the effect of roughness and paint coatings on the measurement results, and , respectively, were adopted, as defined in (1).
To study the effect of roughness on the results of measuring the content of selected elements, the samples were prepared (by encapsulating copper alloy components in resin) with ground (with wet sandpaper of different grits) or sandblasted surfaces. Their surface roughness was determined using the index. An effect of roughness on the measurement results was observed that intensifies for ( corresponds to grinding with P120 grit sandpaper). When evaluating the copper content, an increase in the roughness of the samples causes a decrease in the results for the OES spectrometer measurement, an increase for the LIBS spectrometer, and for XRF it is difficult to determine the trend of changes. When evaluating zinc, tin and lead content, an increase in roughness is accompanied by a decrease in the values of results for LIBS and XRF spectrometer measurements, and an increase for the OES spectrometer. In contrast, the evaluation of silicon, aluminum and iron content points to the conclusion that an increase in roughness is associated with an increase in the results achieved by OES and XRF spectrometers with no such association for LIBS spectrometer measurements. It should be noted that the results of XRF spectrometer measurements have the highest variability concerning (e.g., Figure 15, Figure 18 and Figure 19).
In the study of the effect of paint coatings on the results of measuring the content of selected elements, samples were prepared by applying (using a brush, spraying) various paints onto the cleaned and sanded surfaces. The study shows that the effect of paint coatings on the measurement results is much stronger than that of surface roughness. Even a single layer of paint in most cases results in , which will lead to errors in the sorting of copper-bearing material. When evaluating the measurement of copper content, the weakest influence of paint coatings was found for measurements made with the OES spectrometer, where practically only the paint coating made with anti-corrosion paint caused a significant difference compared to the sample with no paint coatings (). Using other spectrometers operating with XRF and LIBS technology, one should expect a significant error in the measurement of copper content in the sample from the second layer of varnish onward. Errors in the measurement of zinc content in prepared scrap samples using the OES spectrometer, despite the application of several layers, will allow to sort the scrap into copper alloys containing or not containing zinc. XRF and LIBS spectrometers already from the second paint layer applied cause too large differences in the obtained zinc content () compared to the sample without paint coating, which disqualifies such measurement methods. Lead, whose content in brass is mostly up to 3%, will be detectable by any of the measurement methods. However, it should be noted that in the case of the LIBS method, each successive coat of paint applied will cause a significant increase in the result of the lead content of the sample, even up to , which will make it impossible to recognize the grade of the copper alloy. In the case of measuring the tin content of a sample labeled ACP-CuZnSn, the use of an XRF spectrometer will cause it to indicate a higher value as the number of layers increases. From the results of the study, it does not appear that the variation in the detection of alloying elements in the samples is influenced by the method of application of paint coatings (spraying or application with a brush).
To sum up, to obtain reliable results of measuring the content of individual elements in copper alloys, it is necessary to prepare the surface of the sample to be tested. First, if such a surface is coated with paint, it should be removed. Next, it should be prepared by planing and wet cleaning with sandpaper.
Author Contributions
Conceptualization, Ł.B., J.M. and G.W.; methodology, G.W.; software, T.J.; investigation, Ł.B.; data curation, Ł.B. and G.M.; writing—original draft preparation, Ł.B. and G.W.; writing—review and editing, T.J., J.M. and G.M.; visualization, Ł.B. and G.W.; supervision, G.W. All authors have read and agreed to the published version of the manuscript.
Funding
This work, a result of industrial research and development, was funded by The Polish National Center for Research and Development (POIR.01.01.01-00-0283/21).
Data Availability Statement
The data presented in this paper are available on request from the corresponding author.
Conflicts of Interest
The authors declare no conflict of interest.
References
- Li, J.; Eheliyagoda, D.; Geng, Y.; Yang, Z.; Zeng, X. Examining the influence of copper recycling on prospective resource supply and carbon emission reduction. Fundam. Res. 2022; in press. [Google Scholar] [CrossRef]
- Osawa, J. Portfolio Analysis of Clean Energy Vehicles in Japan Considering Copper Recycling. Sustainability 2023, 15, 2113. [Google Scholar] [CrossRef]
- Loibl, A.; Tercero Espinoza, L.A. Current challenges in copper recycling: Aligning insights from material flow analysis with technological research developments and industry issues in Europe and North America. Resour. Conserv. Recycl. 2021, 169, 105462. [Google Scholar] [CrossRef]
- Available online: https://www.britannica.com/science/scrap-metal (accessed on 13 January 2024).
- Bennett, B.N.; Martin, M.Z.; Leonard, D.N.; Garlea, E. Calibration curves for commercial copper and aluminum alloys using handheld laser-induced breakdown spectroscopy. Appl. Phys. B 2018, 124, 42. [Google Scholar] [CrossRef]
- Akhmetzhanov, T.F.; Labutin, T.A.; Korshunov, D.M.; Samsonov, A.A.; Popov, A.M. Determination of Ce and La in REE-rich ores using handheld LIBS and PLS regression. J. Anal. At. Spectrom. 2023, 38, 2134–2143. [Google Scholar] [CrossRef]
- Lins, S.A.; Di Francia, E.; Grassini, S.; Gigante, G.; Ridolfi, S. MA-XRF measurement for corrosion assessment on bronze artefacts. In Proceedings of the 2019 IMEKO TC-4 International Conference on Metrology for Archaeology and Cultural Heritage, Florence, Italy, 4–6 December 2019. [Google Scholar]
- Situ Applications of X Ray Fluorescence Techniques; Number 1456 in TECDOC Series; International Atomic Energy Agency: Vienna, Austria, 2005.
- Musílek, L.; Čechák, T.; Trojek, T. X-ray fluorescence in investigations of cultural relics and archaeological finds. Appl. Radiat. Isot. 2012, 70, 1193–1202. [Google Scholar] [CrossRef] [PubMed]
- Nørgaard, H.W. Portable XRF on Prehistoric Bronze Artefacts: Limitations and Use for the Detection of Bronze Age Metal Workshops. Open Archaeol. 2017, 3, 101–122. [Google Scholar] [CrossRef]
- Alberghina, M.F.; Barraco, R.; Brai, M.; Schillaci, T.; Tranchina, L. Double laser LIBS and micro-XRF spectroscopy applied to characterize materials coming from the Greek-Roman theater of Taormina. In Proceedings of the O3A: Optics for Arts, Architecture, and Archaeology II, Munich, Germany, 14–18 June 2009; Pezzati, L., Salimbeni, R., Eds.; International Society for Optics and Photonics; SPIE: St Bellingham, WA, USA, 2009; Volume 7391, p. 739107. [Google Scholar] [CrossRef]
- Brinkmann, P.; Köllner, N.; Merk, S.; Beitz, T.; Altenberger, U.; Löhmannsröben, H.G. Comparison of Handheld and Echelle Spectrometer to Assess Copper in Ores by Means of Laser-Induced Breakdown Spectroscopy (LIBS). Minerals 2023, 13, 113. [Google Scholar] [CrossRef]
- Potts, P.J.; Sargent, M. In situ measurements using hand-held XRF spectrometers: A tutorial review. J. Anal. At. Spectrom. 2022, 37, 1928–1947. [Google Scholar] [CrossRef]
- Gupta, V.; Rai, A.K.; Kumar, T.; Tarai, A.; Gundawar, G.M.K.; Rai, A.K. Compositional analysis of copper and iron-based alloys using LIBS coupled with chemometric method. Anal. Sci. 2024, 40, 53–65. [Google Scholar] [CrossRef] [PubMed]
- Musazzi, S.; Perini, U. (Eds.) Laser-Induced Breakdown Spectroscopy; Springer Series in Optical Sciences; Springer: Berlin/Heidelberg, Germany, 2014. [Google Scholar] [CrossRef]
- Richardson, A. Comparison HH-LIBS versus HH-XRF. 2020. Available online: https://aruntechnology.co.uk/wp-content/uploads/2020/07/HH-XRAY-versus-HH-LIBS-1.pdf (accessed on 14 November 2023).
- Patterson, J.I. HH-XRF and HH-LIBS for Alloy Analysis Choosing the Right Tool for the Right Job. 2022. Available online: https://www.fortheengineers.com/userContent/3239/06_Dec_2022_19_11_59.pdf (accessed on 14 November 2023).
- Galbács, G. (Ed.) Laser-Induced Breakdown Spectroscopy. In Laser-Induced Breakdown Spectroscopy in Biological, Forensic and Materials Sciences; Springer International Publishing: Cham, Switzerland, 2022; pp. 3–23. [Google Scholar] [CrossRef]
- Noll, R.; Fricke-Begemann, C.; Connemann, S.; Meinhardt, C.; Sturm, V. LIBS analyses for industrial applications—An overview of developments from 2014 to 2018. J. Anal. At. Spectrom. 2018, 33, 945–956. [Google Scholar] [CrossRef]
- ISO 21920-2:2021; Geometrical Product Specifications (GPS), Surface Texture: Profile Part 2: Terms, Definitions and Surface Texture Parameters. ISO: Geneva, Switzerland, 2021.
- Available online: https://www.presi.com/en/product/mecatech-250-spc/ (accessed on 14 November 2023).
- Available online: https://metrology.mahr.com/en-int/products/article/6910230-mobiles-rauheitsmessgeraet-marsurf-ps-10/ (accessed on 14 November 2023).


Disclaimer/Publisher’s Note: The statements, opinions and data contained in all publications are solely those of the individual author(s) and contributor(s) and not of MDPI and/or the editor(s). MDPI and/or the editor(s) disclaim responsibility for any injury to people or property resulting from any ideas, methods, instructions or products referred to in the content. |
© 2024 by the authors. Licensee MDPI, Basel, Switzerland. This article is an open access article distributed under the terms and conditions of the Creative Commons Attribution (CC BY) license (https://creativecommons.org/licenses/by/4.0/).