Article

Geopolymerization of Recycled Glass Waste: A Sustainable Solution for a Lightweight and Fire-Resistant Material

by
Marios Valanides
1,*,
Konstantinos Aivaliotis
2,
Konstantina Oikonomopoulou
2,
Alexandros Fikardos
1,
Pericles Savva
1,
Konstantinos Sakkas
1 and
Demetris Nicolaides
3
1
RECS Civil Engineers & Partners LLC, 23 Themistokli Dervi Av., S.T.A.D.Y.L. Building, P.O. Box 23504, Nicosia 1066, Cyprus
2
Department of Civil and Environmental Engineering, University of Cyprus, 75 Kallipoleos Av., P.O. Box 20537, Nicosia 1678, Cyprus
3
Frederick University, P.O. Box 24729, Nicosia 1303, Cyprus
*
Author to whom correspondence should be addressed.
Recycling 2024, 9(1), 16; https://doi.org/10.3390/recycling9010016
Submission received: 10 December 2023 / Revised: 12 January 2024 / Accepted: 22 January 2024 / Published: 7 February 2024

Abstract

:
Glass is considered a sustainable material with achievable recovery rates within the EU. However, there are limited data available for construction glass waste management. Furthermore, glass is a heavy material, and considering the geographical limitations of Cyprus, the transportation trading cost within the EU is extremely high. Therefore, another method for utilizing this by-product should be developed. The aim of this research is to investigate the production of a low-cost, lightweight and fireproof material able to retain its structural integrity, using the geopolymerization method with the incorporation of randomly collected construction glass waste. The glass waste was initially processed in a Los Angeles abrasion machine and then through a Micro-Deval apparatus in order to be converted to a fine powder. Mechanical (compressive and flexural strength), physical (setting time and water absorption) and thermal properties (thermal conductivity) were investigated. The fire-resistant materials presented densities averaging 450 kg/m3 with a range of compressive strengths of 0.5 to 3 MPa. Additionally, a techno-economic analysis was conducted to evaluate the viability of the adopted material. Based on the results, the final geopolymer product has the potential to be utilized as a fire resistance material, preventing yielding or spalling.

1. Introduction

While large amounts of glass waste are annually derived worldwide, approximately 60% of the waste is disposed via landfill. Many cities are producing waste glass at an increasing rate, causing the available space for landfill to shrink. In the EU, waste glass packaging had a recovery rate of 73% in 2020, while in Cyprus, the recovery target was 27% lower than the targeted goal. Unlike many types of solid waste such as wood and plastic, glass is chemically stable and thus non-biodegradable [1,2]. This has led to an upsurge in glass recycling attempts within the engineering sector including, but not limited to, concrete [3], glass foam [4], asphalt [5,6,7], as well as many other uses and applications, extending past the scope of building material science. The implementation of recycled glass as a partial replacement of fine aggregates in cementitious mixtures was successfully investigated through extensive research. For non-structural applications, recycled glass was implemented into pre-cast specimens [8], asphalt mixtures mostly as a mineral powder filler [9,10,11,12], and insulation materials (glass foam) [4].
Within the aforementioned scope, numerous usage attempts have been achieved through geopolymerization. One of the very first researchers that introduced geopolymerization was Joseph Davidovits (1991) [13] who discovered that various calcined clays, predominately calcined kaolinite (metakaolin), could react with an alkaline solution to produce hardened ceramic-like products at a temperature lower than 100 °C [14]. The geopolymerization process is based on a heterogeneous chemical reaction that occurs between solid materials rich in aluminosilicate oxides and highly alkaline silicate solutions, which provide efficient thermal and fireproof properties.
A recent review of case studies on the valorization of glass waste for the development of geopolymer composites, focusing on their mechanical properties and rheological characteristics, has yielded positive results. Regarding their rheological characteristics, the increased slump and overall better workability are directly correlated to the increased proportion of glass and alkaline agent used [15,16]. With regard to their strength properties, porosity has been noted to increase through the use of hydrogen peroxide, and their curing conditions were more important than the molarity of NaOH used for the polymerization process [17]. The compressive strength is mostly governed by the Si/Al ratio, with a direct correlation between the two [18], with an optimal Si/Al ratio around 3.3 and 4.5 [19]. A decrease in apparent density is observed with age, attributed to water discharge during geopolymerization and curing [20]. Relative humidity was also found to inversely affect early compressive strength [21]. It is entirely possible to blend finely crushed glass, if supplemented with reactionary alumina through other means to facilitate the reaction as a substitute material, in construction and building materials to develop geopolymer building materials [22].
A further review on the valorization of glass waste with regard to its durability properties affirms its use as a substitute cementitious material for the fabrication of geopolymer composites, and its addition can serve as a systemic solution to waste glass management [23]. Recent research has shown that glass has a positive influence on geopolymer composite matrix densification [24]. Geopolymer composites using glass as a substitute also exhibit increased acid resistance [25].
Fire safety is also one of the prevailing issues in the engineering sector. Containment failure can lead to the loss of human lives while incurring significant repair costs. According to existing EU Directives, passive fire protection is required (among other uses) in commercial buildings, specific points of residential dwellings and various other buildings where human activity takes place. Fire safety is also prevalent in other sectors such as the petrochemical industry, the marine industry, the aerospace industry and the tunnel industry.
Of particular interest is the fact that geopolymer composites exhibit enhanced performance regarding their heat-resistive properties. Due to their internal structure, they are particularly suitable in high-temperature applications. The ceramic-like properties exhibited by geopolymer composites have exhibited solid phases reaching 1100 °C [26]. This high-temperature resistance is also correlated to a high degree of shrinkage and deformation [27]. In contrast to Ordinary Portland Cement (OPC), geopolymer composites do not spall under high heat [28]. A multitude of recent papers discuss the heat-resistive properties of geopolymer composites as well as their deformations, new mineral formations [29,30] and color change [31,32,33]. Although minor cracking can also be observed, it was attributed to the presence of iron oxide in relation to heating [31,34,35]. A recent review paper supports the theory that geopolymer composites can be used as an alternative fire-resistant construction material [32].
More recent state-of-the-art techniques include the use of waste glass in geopolymerization as a replacement for sodium silicate [36], its combination with chamotte as a precursor [37] and the production of mortars utilizing waste glass with ceramic tile waste achieving 9–12 MPa of compressive strength [38]. Furthermore, a carbonation treatment as an alternative to mechanical and/or chemical treatment method was successfully investigated in [39], while [40,41] evaluated alkali-activated materials derived from photovoltaic waste glass. Additionally, considering the requirements for establishing a global circular economy, further research emphasizes the environmental and life cycle assessment of products that valorize recyclable materials such as waste glass [42,43].
The aim of this research is to explore the novel use of waste glass (with supplementary aluminum powder) as a primary material for geopolymerization. This approach aims to produce a lightweight, economic, heat-resistant inorganic material suitable in fire security. Waste glass has demonstrated the ability to enhance workability and increase geopolymer matrix density and is free of crack-inducing oxides. The usage of glass would allow for a new purpose of this otherwise disposable material, valorizing it as fully recyclable and environmentally sparing.
Applications of the end product are envisioned for the construction sector, primarily as a core material for fireproof doors and secondarily as a façade in exterior building walls. Current market data trends have shown a growing focus on and investment in the passive fire protection of buildings, with the European market valued at EUR 1096.44 million in 2022 and a projected annual growth rate of 4% until 2030 [44]. Therefore, a comprehensive analysis was conducted, aiming to create a material that meets these criteria and fulfills the desired specifications. Twelve different geopolymer formulations were tested and evaluated for their physical, mechanical and durability properties, while the optimum formulation underwent fire exposure to analyze its thermal properties.

2. Materials and Methods

2.1. Characterization of Recycled Waste Glass

2.1.1. ED-XRF Results

To assess the reactivity potential of the treated recycled waste glass powder, Energy-Dispersive X-Ray Fluorescence (ED-XRF) analysis was conducted. Additionally, the ED-XRF analysis aimed to investigate, as illustrated in Figure 1, color fluctuations observed on the ground material from the Los Angeles apparatus (as described in Section 2.1.2). This may suggest a possible increase in the amount of iron oxide (Fe2O3), which could potentially react with the substances in the designed formulations and impact the physical characteristics of the end product. As presented in Table 1, all samples contained an average of 76.80% silicon oxide (SiO2), indicating the potential utilization of glass waste as a precursor in the geopolymerization process; however, an absence of aluminum oxides (Al2O3) was also observed. Aluminum and sodium oxides are important solid precursors that, combined with the liquid alkaline activators, create an inorganic polymer. An absence of the Al2O3 highlights the need to add Al2O3 in the mixture design to facilitate the geopolymerization. Quantities of Fe2O3 did not show significant differences between the samples; therefore, the yielded fluctuations would not affect the enhancement in the physical properties of the samples.

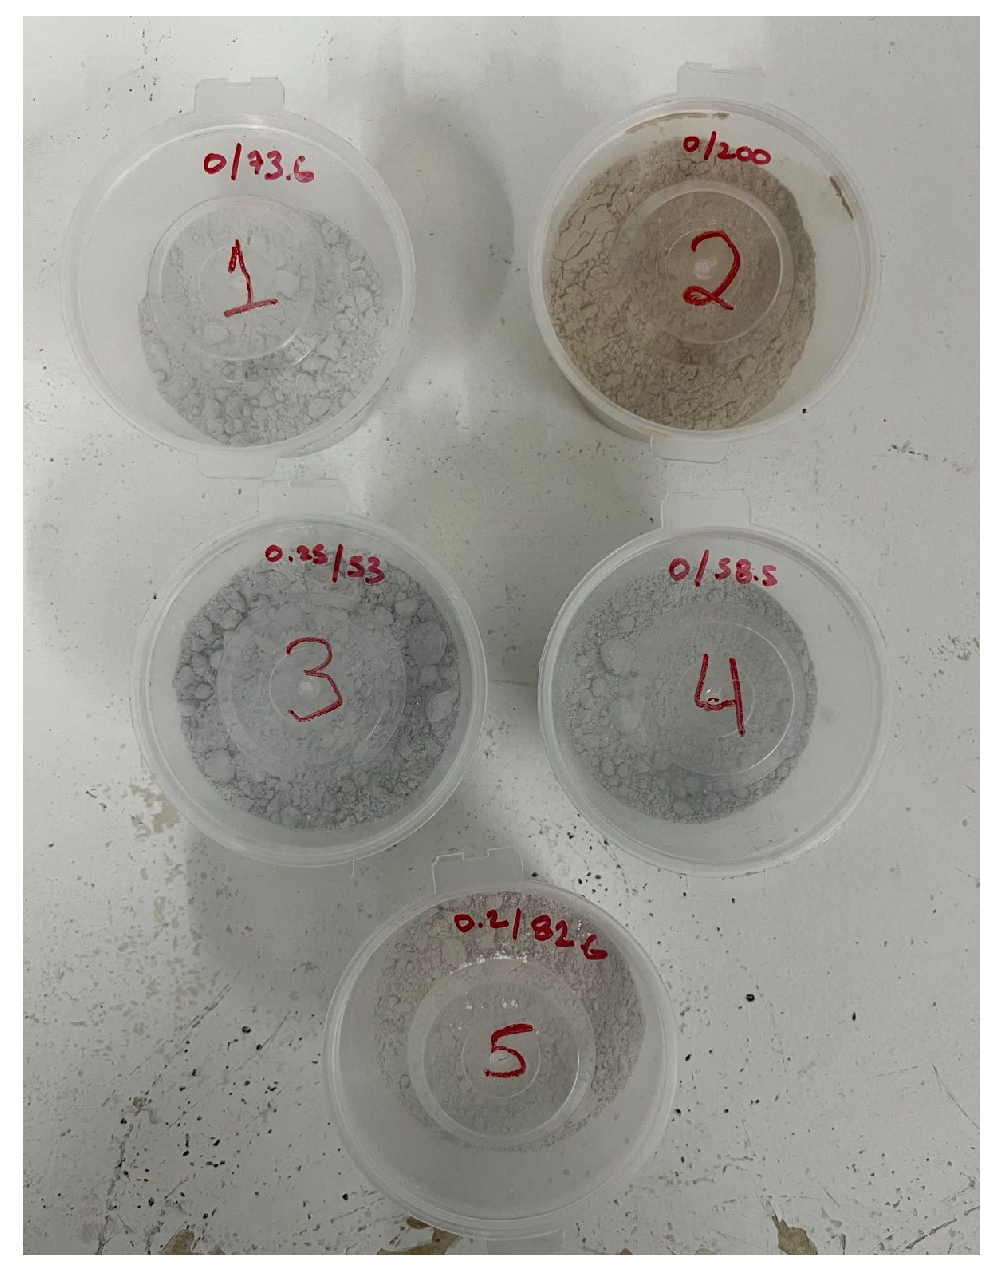
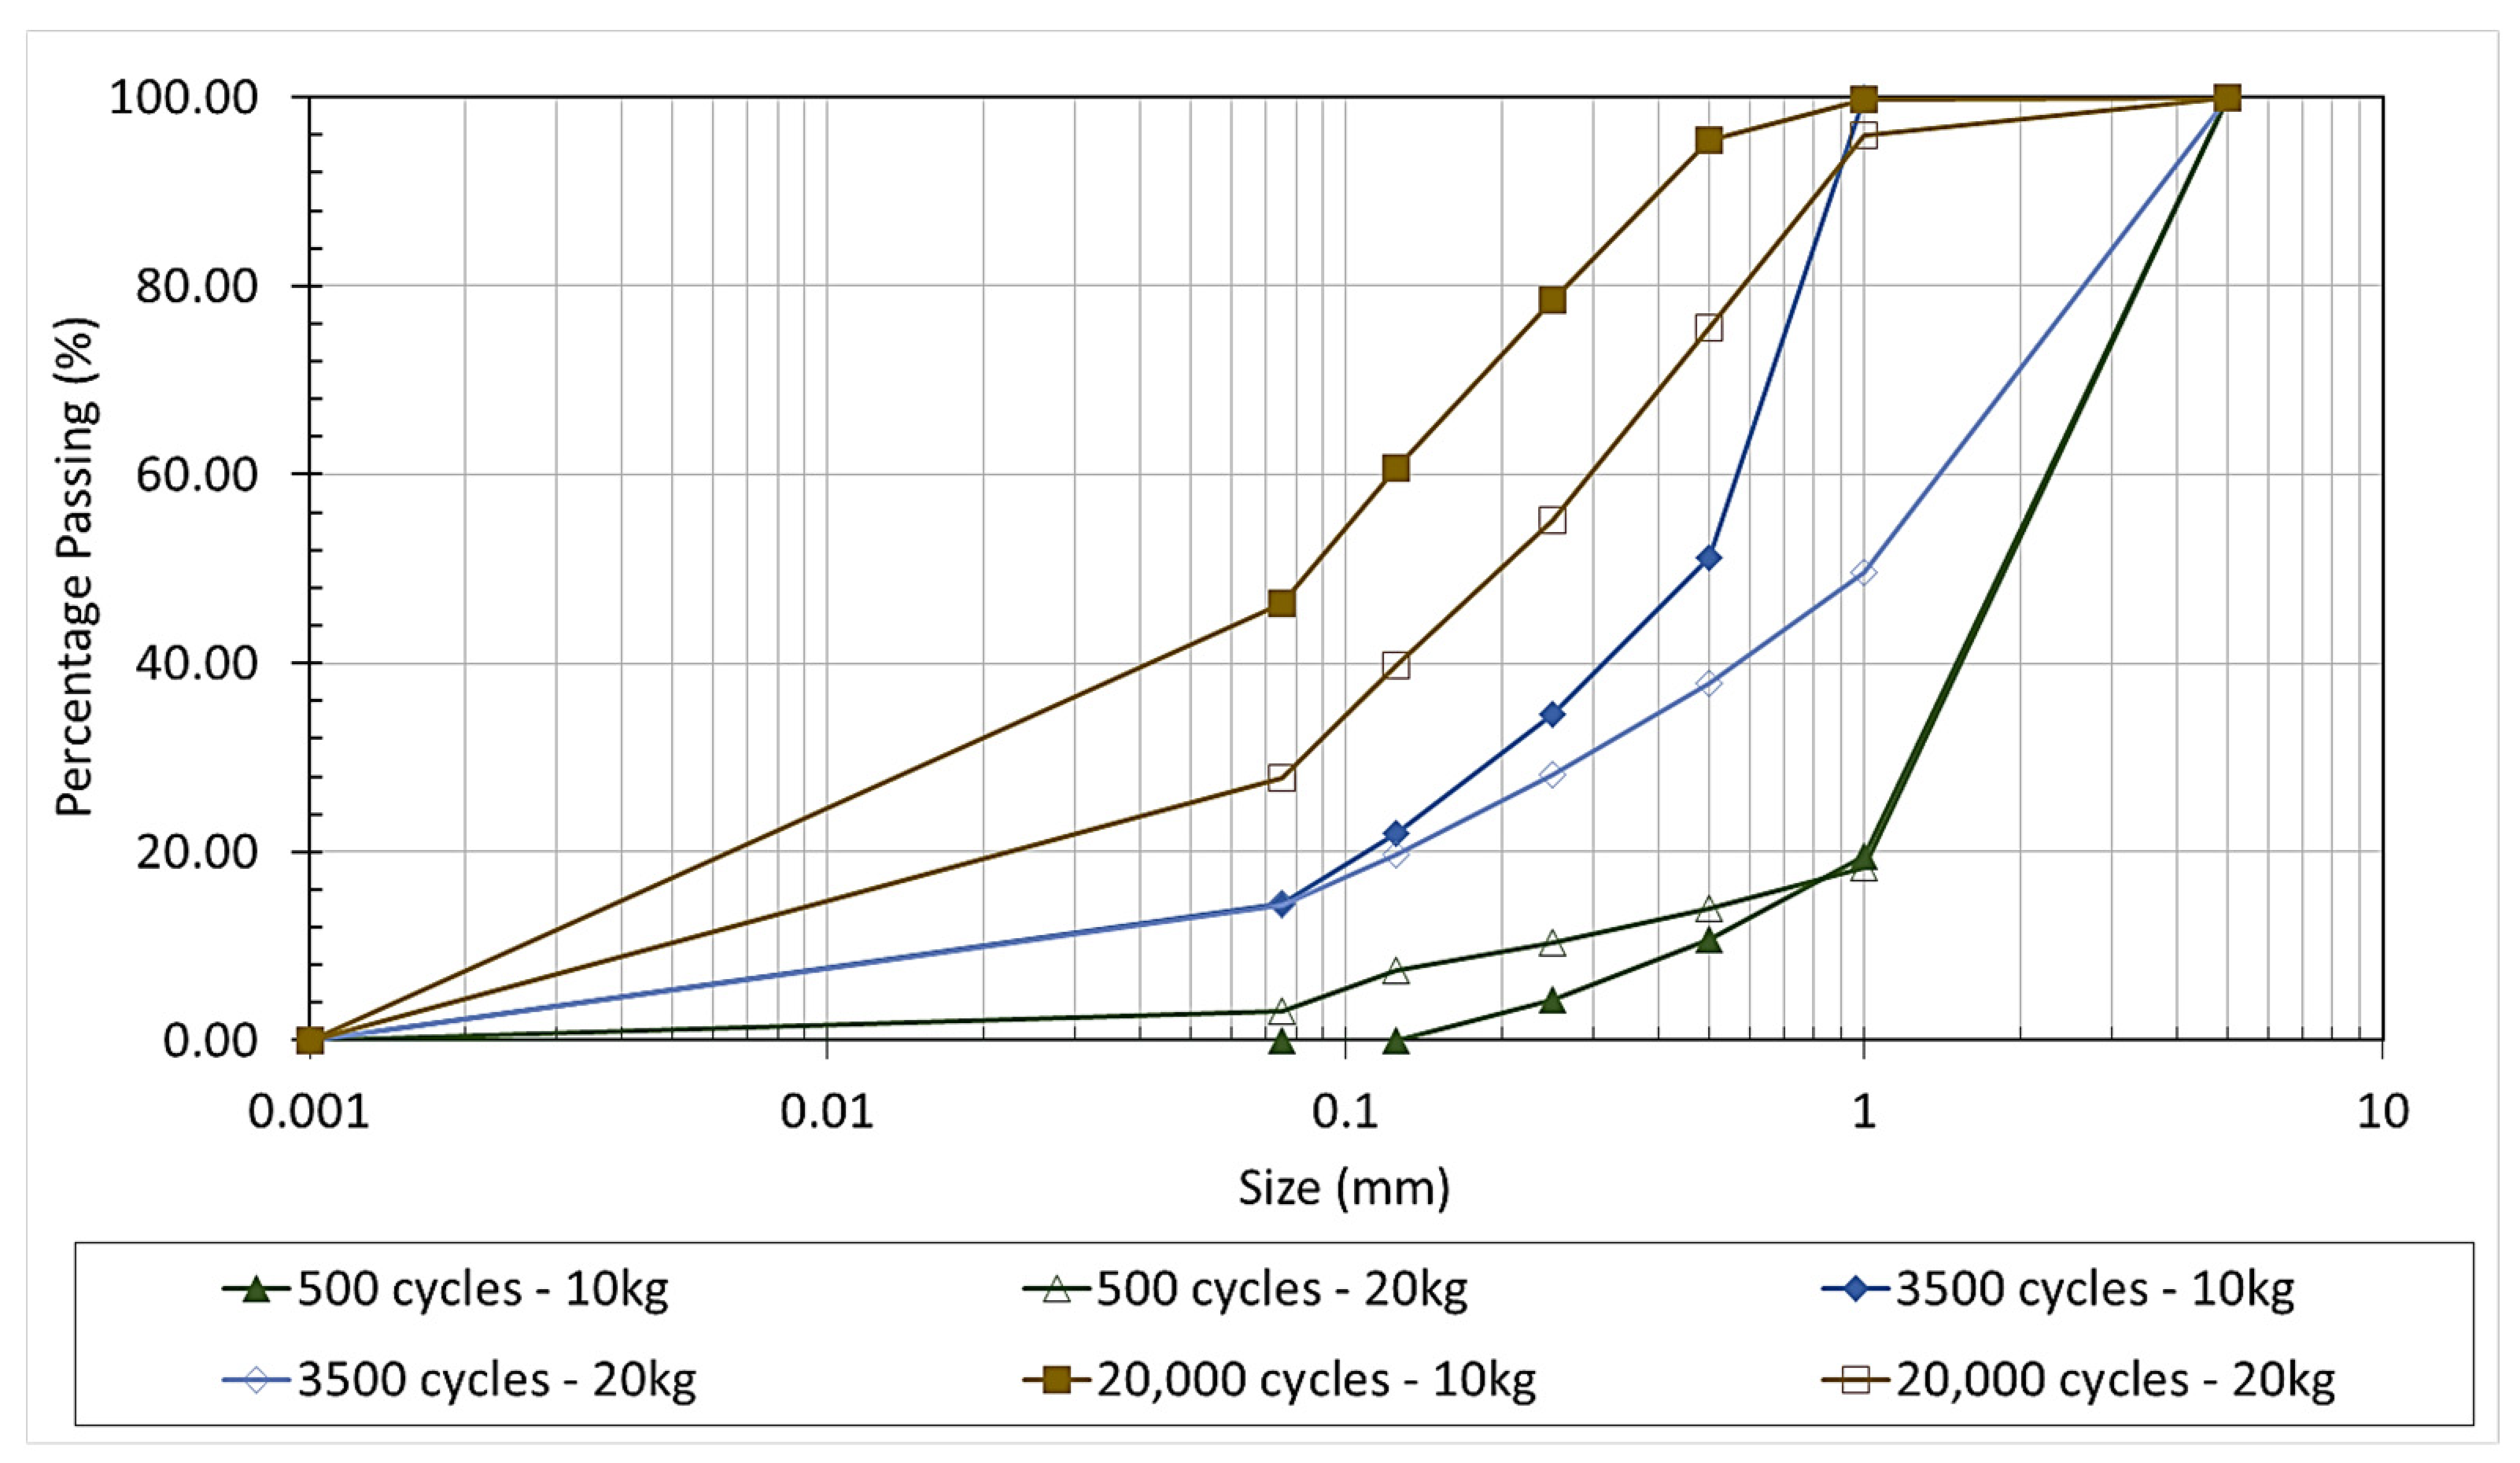
2.1.2. Los Angeles and Micro Deval Grinding

The requirement for obligatory processing before use has led to the acquisition of the primary raw material (waste glass) through numerous industrial glass processing facilities in Cyprus. Random sampling of the waste material, without specifically choosing a particular source with targeted characteristics, ensures the reliability of the results. Upon sourcing, the recycled product underwent mechanical treatment for crushing into finer particles. The Los Angeles abrasion apparatus (EN 1097-2:2020) [45] was initially employed for this treatment. Quantities of 10 kg and 20 kg of recycled glass were subjected to multiple cycles of abrasion (500, 3500 and 20,000 cycles) and impact by rotating the sample inside a drum with ten steel balls (438 g each) to determine the optimal quantity of glass per round and the optimum cycle duration. Subsequently, after the treatment, each batch was sieved through pre-defined sieves (5, 1, 0.5, 0.25, 0.125 and 0.075 mm) to evaluate the particle size distribution and the remaining mass in each sieve (Figure 2).
As shown in Figure 2, applying the abrasion method to waste glass, irrespective of the number of rotation cycles and glass quantity, resulted in the entire amount of treated material passing through the 5 mm sieve. This might indicate that a fairly fine-graded material can be achieved with a minimum number of treatment cycles for applications without requiring less fine material. At 500 cycles, the mass passing the remaining sieves was observed as significantly low, especially for 10 kg of recycled glass, where the passing mass below the 0.125 sieve was zero. This suggests that the number of rotation cycles was not high enough to sufficiently treat the examined material for producing fine-grade glass. Similar behavior can be observed for the same treatment duration at 20 kg of waste. At 3500 rotation cycles, the percentage passing through the 0.075 μm sieve increased to 14.54%, while for 20,000 cycles and 10 kg of glass of treatment, the passing mass on each sieve was increased, with 46.27% recycled glass passing through the 0.075 μm sieve. Nevertheless, applying 20,000 cycles for 20 kg of the examined material produced a less fine-graded glass, as noted in the declined tradeline in Figure 2. This indicates the presence of a local maximum, where beyond that point, increasing the rotation cycles and/or the amount of added material did not produce higher quantities of fine-graded waste glass. The tradeline for 10 kg of recycled glass implies that after 20,000 cycles, increasing the number of treatment cycles will increase the 75 μm passing mass, compared to 20 kg (27.87%). However, the numerical difference does not justify the corresponding increase in energy consumption and cost. Consequently, the optimal mechanical treatment for the Los Angeles abrasion treatment (considering fine material) was chosen, which included the introduction of 20 kg of recycled glass to the abrasion machine for 20,000 cycles.
However, due to the low fraction of sub-75 μm particles produced using the Los Angeles abrasion treatment, a secondary milling method was introduced by employing a Micro-Deval machine [46]. The apparatus was loaded with a determined optimal steel ball to a material ratio of 5.0/1.5 kg, where the glass had been previously treated by the Los Angeles machine; it was ground during a 16 h operation at 100,000 rpm; and the resulting percentage passing through the 0.075 μm and 0.063 μm sieve (to calculate the number of ultrafine particles) is summarized for six different samples in Table 2. Optimal results were achieved with a sub-75 μm fraction as each tested batch yielded almost 100% passing through this specific sieve, while the fraction of ultrafine particles ranged between 89.34% and 99.33%. It was determined that the existence of ultra-fines could not significantly affect the density of the material. Therefore, regarding the mixing procedure, the incorporated waste glass was milled using both mentioned treatment methods (Los Angeles and Micro-Deval) to achieve the required passing fractions.

2.1.3. Density, Water Absorption and Fineness

To account for the solubility of the waste glass during the mixing process, each batch of glass underwent testing for density, water absorption and fineness characteristics. EN 1097-6:2023 [47] was employed for the determination of particle density and water absorption of recycled waste glass powder. The pyknometer method was used, with each sample immersed in water at 22 ± 3 °C and then placed inside a water bath at a temperature of 22 ± 3 °C for 24 ± 0.5 h. Afterwards, the pyknometer was removed from the water bath, the cover was placed on top, overfilled with water and weighed (M2). The same procedure was repeated after the sample was removed from the pyknometer and was also weighed (M3). The drained test portion was saturated and surface-dried and the sample was weighed (M1). Afterwards, it was oven-dried at a temperature of 110 ± 5 °C until a constant mass and weighed (M4). Particle densities in saturated and surface-dried conditions and water absorption were calculated as presented from the following equations:
ρssd = [(ρw × M1)/(M1 − (M2 − M3))]
WA24 = [(M1 − M4)/(M4)] × 100
where ρssd is the saturated and surface-dried particle density (in megagrams per cubic meter), WA24 is the water absorption for 24 h (in %), ρw is the density of water at the test temperature (in megagrams per cubic meter), M1 is the mass of the saturated and surface-dried aggregates in the air (in grams), M2 is the mass of the pyknometer containing the sample of saturated aggregates and water (in grams), M3 is the mass of the pyknometer filled with water only (in grams) and M4 is the mass of the oven-dried test portion in air (in grams).
Particle fineness was assessed in accordance with EN 196-6:2018 standard [48], utilizing a Blaine apparatus. As defined in the guidelines, this principle involves measuring the specific surface area by observing the time needed for a fixed quantity of air to flow through a compact bed of specified dimensions and porosity. It is noteworthy that this experiment is primarily designed for cement; therefore, for glass testing, it was calibrated based on reference cement samples. The procedure was conducted by layering two beds of recycled glass powder in a permeability cell, with a perforated disc and paper filters. Each layer was compacted with a metallic plunger, where with the correct compaction yielded a porosity of e = 0.50. Following compaction, the cell was placed in a manometer device and a plug sealed the top. The time required for the manometer liquid to flow through predetermined points in the tube was recorded and the second sample followed the same procedure. Based on the following simplified equation, the specific surface was calculated:
S = [(ρο/ρ) × (t1/2/to1/2)] × So
where So is the specific surface of the reference material (in square centimeters per gram), t is the measured time under test (in seconds), to is the mean time measured on the reference material, ρ is the density under testing (in grams per cubic centimeter) and ρο is the density of the reference material (in grams per cubic centimeter). It is important to note that the simplified equation can be applied when e = 0.50 and the experiment was conducted in regulated conditions of temperature (20 ± 2 °C) and humidity (lower than 65%).
Resulting data revealed an average density of 2480 kg/m3, which yielded no significant deviation from the reference value of 2500 kg/m3 and was consistent thought the preliminary experimental work on the geopolymerization of recycled glass. Water absorption of the waste product averaged at 0.32%, while the specific surface was determined at 4081.90 cm2/g. These results were consistent through the experimental study of the recycled glass, confirming the waste material as adequate and not adversely affecting the properties of the final geopolymerized product.

2.1.4. Rest of Materials

Table 3 presents the remaining material properties incorporated into the mixture design. Sodium hydroxide (NaOH) with a molarity of 7 M served as the alkaline activator to facilitate geopolymerization. Sodium silicate (Na2SiO3) with a concentration of 30–40% was used as an activator to improve physical characteristics and it was incorporated at various Na2SiO3:NaOH ratios. Deionized water was used in creating the sodium silicate liquid. As mentioned in the ED-XRF analysis, the inclusion of aluminum powder (Al) is required to optimize the Si/Al ratio. Nevertheless, the quantities of Al powder should be optimized, since beyond a specific point, it can adversely affect the density of the geopolymerized material. Hostapur OSB is a material commonly used in soap detergents, well known for its properties related to surface activities. In the mixture design, it was employed for the stabilization and appropriate dispersion of bubbles in the matrix.

2.2. Mixture Design, Properties and Testing

2.2.1. Mixture Design

Table 4 demonstrates the investigation of twelve different formulations of geopolymerized mixtures. The nomenclature for these mixtures in this research paper is identified as MXX_YY:ZZ, where XX represents the quantity of Al powder in % by weight of solids, YY is the quantity of sodium silicate in % by weight of liquids and ZZ is the alkaline activator (NaOH) in % by weight of liquids. It is noteworthy that the quantity of Hostapur OBS is adjusted primarily based on the added amount of aluminum powder that will initiate the foaming process. The S/L ratio for all mixtures was approximately similar at 2.87 and the molarity of NaOH was maintained at 7.

2.2.2. Mixing Procedure

The mixing process initiated when an alkaline solution (NaOH and deionized water) was prepared at least 24 h before the actual mixing process which requires all the materials to be added in a specific sequence. The reaction of these materials is highly exothermic, resulting in an increased temperature. As elevated temperatures can accelerate the geopolymerization, it was necessary to cool the alkaline solution before incorporating into the mixture. Measurement of all substances was undertaken, with aluminum and recycled glass powder (solid materials) being initially mixed for 5 min to ensure cohesiveness. NaOH solution and sodium silicate were precisely combined and also added into a 5 L mixer. The critical mixing procedure ensued, with the prepared components blended at 408 rpm for 5–10 s to facilitate the geopolymerization process. It is important to note that the dissolution rate of NaOH was relatively rapid, typically fully dissolving within 20 s, and therefore quick and fast mixing is significantly important. Following mixing, the casting procedure was carried out, involving the dispensing of the mixture into silicon-lubricated plastic molds to prevent sticking. Following casting, the molds were transferred to an oven chamber at a temperature of 70 ± 2 °C for a duration of 24 h, allowing the newly formed structure to set, facilitate the solidification and develop its intended properties. Before demolding and after 3 h in the oven, specimens were taken out of the oven. This particular timing makes it easier to trim the excess material from the top of the mold without affecting the sample’s morphology. To prevent internal cracking and to retain the moisture within the sample, these were wrapped in cling film and returned to the oven for the remaining 21 h of curing. Finally, the specimens were removed from the oven, unwrapped from the cling film, demolded and placed in a storage room with regulated temperature and relative humidity (25 ± 2 °C and 60 ± 5%, respectively).

2.2.3. Hardened Properties

Table 5 outlines the experimental work conducted to assess the physical, mechanical, durability and thermal properties of the geopolymerized-glass-based formulations.
EN 196-1:2016 [49] was employed for evaluating the compressive strength in the geopolymerized mixtures. Cubic specimens (40.0 × 40.0 × 40.0 mm) underwent testing at 7 days of age in a MATEST Servo-Plus Progress 2000 kN load-capacity fully automatic compression machine, using a compression device designed for smaller cubes (3 cubes per test, with a load rate of 2400 ± 200 N/s). For determining flexural strength, EN 196-1:2016 [49] was also used where prismatic specimens (40.0 × 41.0 × 160.0 mm) were tested at 7 days of age, applying three-point loading with a center-point load and a constant stress rate of 50 ± 10 N/s. It is noteworthy that specimens were positioned to ensure the load was applied perpendicularly to the casting direction. Open porosity was conducted based on [50], where three cubic specimens (40.0 × 40.0 × 40.0 mm) were oven-dried at a temperature of 70 ± 5 °C until a constant mass. Afterwards, the specimens were placed in vacuum desiccator, where the pressure was gradually reduced to 2.0 ± 0.7 kPa and maintained for 2 ± 0.2 h. Demineralized water was slowly introduced at a temperature of 20 ± 5 °C and when all the specimens were fully immersed, the vessel was returned to atmospheric pressure and left under water for 24 ± 2 h. Each specimen was weighed underwater, and the saturated surface-dried mass was also recorded. The following calculations (4) were made:
po = [(ms − md)/(ms − mh)] × 100
where md is the oven-dried mass (in grams), mh is the mass immersed in water (in grams) and mssd is the saturated and surface-dried mass (in grams). The density of the final product can be determined through the porosity experiment and further validated by calculating the mass-to-volume ratio. It should be noted that all the aforementioned experimental tests were conducted at 7 days of age, determined as the optimum testing day following an extensive preliminary series of tests.
Following evaluation of mechanical and durability characteristics of the investigated geopolymerized combinations, the mixture exhibiting the optimal balance of density, strength and porosity was selected for a thorough examination of its thermal properties. A board with dimensions of 150.0 × 150.0 × 30.0 mm was cast and subjected to a 2 h fire exposure using a blowtorch with maximum temperature of 1850 °C as the heat source. On the back surface of the board, in predetermined locations (Figure 3), holes were drilled to insert thermocouples for temperature recordings. These points included the center of the fire (C7), above it (C8 at a distance of approximately 4 cm from the fire), distant points from the heat source (C2 though C6) and a point far away from the fire exposure (C1). Heat maps were generated at different time intervals during the experiment to visualize the thermal distribution within the geopolymerized formulation. It is noteworthy that the light-colored section in the middle of the board was a piece of paper placed during casting to prevent the leaking of the fresh mixture.

2.3. Techno-Economic Analysis

Following a comprehensive assessment, two strategic approaches, denoted as “Scenario A” and “Scenario B,” were considered for conducting a techno-economic analysis. “Scenario A” proposes securing investment to patent the final thermal proof product and its associated technology. This strategy is deemed the most advantageous, envisioning the sale of licenses to distributors, and involves granting a five-year exclusive license initially, followed by offering more affordable licenses to additional distributors.
“Scenario B” involves all fixed and variable costs contributing to the financial performance of the geopolymerized material, along with the financial parameters investigated (Table 6). A predetermined initial investment and a five-year timeline restriction for a payback period were considered. It should be noted that the financial model projection of the end product is considered confidential; therefore, specific cost amounts cannot be provided. Instead, for the examined parameters of the annual cost per square meter of material and the annual profit per year after deducting the initial investment, normalization is carried out based on the 1st year values. For example, in the first year, the XX cost per square meter of the material is defined as the reference value at 100%. For the second year with the YY cost, it is calculated by dividing it by the reference value, and the same methodology follows for the remaining timeline and the parameters. An assumption was also made that every two years, sales of the products will exponentially increase, allowing for turnover (total sales calculated as the sale price multiplied by the sold quantity).

3. Results and Discussion

3.1. Hardened Properties
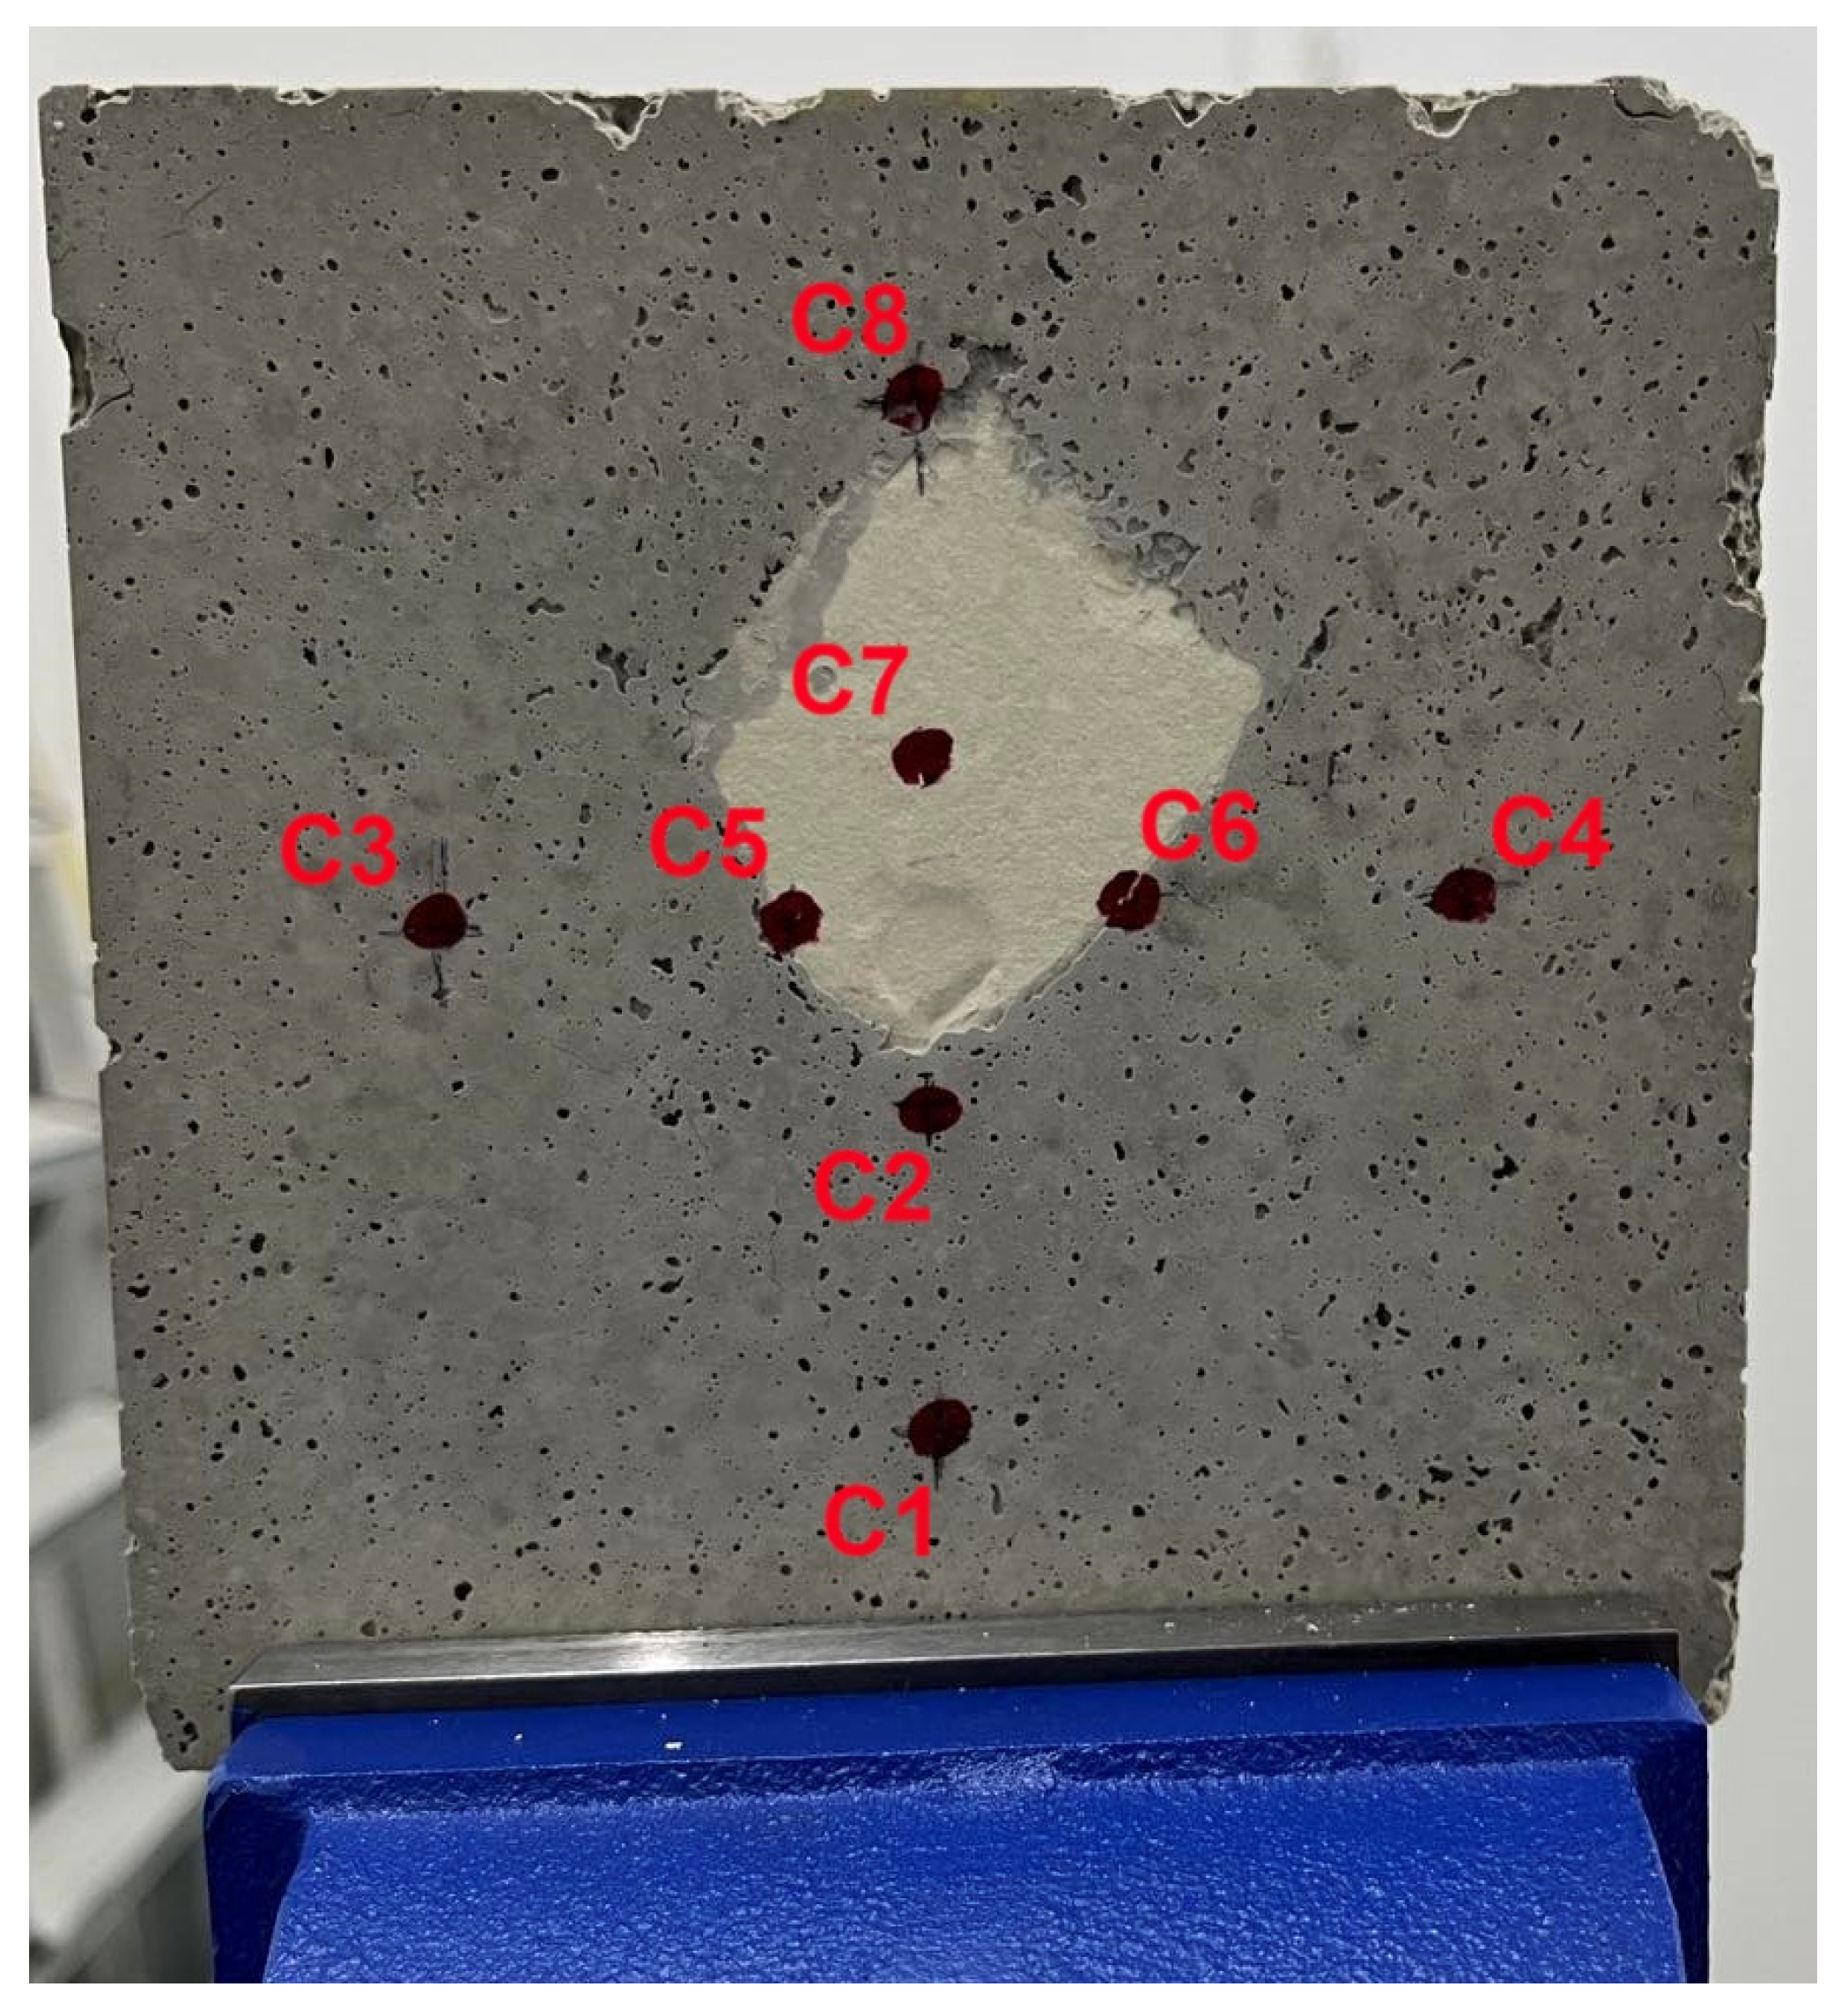
This section analyzes the mechanical and durability experimental outcomes on twelve geopolymerized formulations with various aluminum powder contents and Na2SiO3:NaOH ratios. As presented in Table 7, the documented temperature and humidity conditions were recorded to ensure controlled environmental conditions prior to mixing. Density, compressive strength, flexural strength and porosity underwent evaluation to determine the optimal mixture design, which would be fire-exposed to analyze its thermal properties. Regarding the choice of optimal mixture, careful consideration should be made based on the application of the final product. For the door core, the most cost-effective formulation was considered, meaning the mixture with the lowest aluminum quantities (costlier constituent out of all mixture materials) while also demonstrating satisfactory physical and mechanical properties. For application as a façade, porosity was the predominant factor in selecting the optimum geopolymerized combination.
The values provided represent the average of three specimens as stated in Table 5 and the standard deviation for each parameter yielded within the ranges of 14.0–37.0 kg/m3 for density, 0.11–0.20 MPa for compressive strength, 0.10–0.22 MPa for flexural strength and 0.63–1.75% for porosity results. It is noteworthy that mixture M0.6_80:20 did not yield results for the investigated parameters, due to demolding issues, mainly deformation presented during the curing process.
Figure 4 demonstrates the relationship between the compressive strength and density for all geopolymerized formulations, focusing on the effect of added Al powder and Na2SiO3:NaOH ratio. In general, compressive strength serves as an indicator of the matrix density and can be correlated with the measured density to evaluate the thermal properties of the end product. M0.9_60:40 achieved the highest compressive strength among all mixtures (3.0 MPa at 7 days of testing). The remaining mixtures with 0.9% of Al content exhibited lower compressive strengths; however, their densities remained approximately similar. This indicates that increasing the Na2SiO3:NaOH ratio to a specific value may influence the pore distribution. The recorded density range for all formulations was averaged at 450 kg/m3 and the compressive strength ranged from 0.5 to 3.0 MPa, which are promising results in terms of the geopolymerization process. Furthermore, we can observe that there is no linear relationship between compressive strength and density for 0.6% and 0.7% added Al content mixtures when increasing the Na2SiO3:NaOH. However, an increasing linear relationship yielded for the 0.8% Al content, indicating greater cohesiveness in the mixture and lesser effect by altering these parameters. Additionally, mixtures with a Na2SiO3:NaOH ratio of 70:30 for high Al quantities yielded similar strengths and densities, indicating that similar characteristics can be obtained with a more cost-effective mixture. It is noteworthy that mixtures with 0.6% Al content, as the Na2SiO3:NaOH ratio increased, demonstrated insufficient mixing, resulting in the inability to test M0.6_80:20, and for the remaining 0.6% mixtures, significant variability in the tested specimens was also observed.
The relationship of flexural strength and density on the geopolymerized specimens is presented in Figure 5. In terms of passive fire protection, the final product must exhibit efficient flexural performance to prevent cracking that might compromise the thermal properties. A minimum flexural strength of 0.2 MPa is required in fire-resistant specimens and we can observe that all the investigated formulations surpassed this specific limit. In contrast to the compressive strength results, M0.7_70:30 yielded the highest flexural strength (0.9 MPa at 7 days of testing), while mixtures with high Al content yielded lower results. This denotes that up to a specific Al content, there might be a compromise in flexural strength characteristics. A similar linear increase pattern for 0.7% and 0.8% aluminum powder content, as observed in the compressive strength results, signified the importance of finding the optimum balance between aluminum powder and solution ratio quantities.
Figure 6 illustrates the relationship between the mechanical properties of compressive strength and porosity of the investigated formulations. Porosity is considered a significant parameter for evaluating the suitability of utilizing the material as an external wall façade or if waterproof insulating layers are required with the application process. As visually observed, the number of pores, the pore distribution network, the physical and mechanical characteristics and the significantly high porosity values yielded for all the mixtures, reaching up to 51.0% (M0.6_60:40). Furthermore, increasing the aluminum powder content reduced the porosity value of specimens regardless of the Na2SiO3:NaOH ratio, which mostly affected the compressive strength in 0.9% Al content mixtures. For the remaining formulations, the Na2SiO3:NaOH ratio seemed to be the predominant parameter affecting the compressive strength, while porosity values were differentiated by approximately 5.0%.
The experimental results indicate that even though the required density and strengths can be achieved for use in fire protection, the application of the geopolymerized material, as mentioned before, should be carefully considered. For utilization as a door core, M0.7_70:30 might be a suitable choice since the mixture had lower quantities of aluminum powder and a higher density, strength requirements can be met and porosity performance is not a significantly defining parameter. However, considering application as a façade, M0.9_70:30 yields satisfactory porosity values and strength performance; nevertheless, waterproof insulation will still be required in the application process.

3.2. Fire Testing

For the evaluation of the thermal performance of the selected optimum mixture for application as a core in fireproof doors (M0.7_70:30), as described in Section 2.2.3., a 150.0 × 150.0 × 30.0 mm board was cast and underwent fire exposure using a blowtorch with a maximum temperature of 1850 °C for a duration of 2 h (Figure 7a). Visual inspection of the specimen on the front side of the specimen (Figure 7c) reveals minimum damage only on the location directly impacted by the fire, and also curved deformation on the surface was observed at that particular point. However, examination of the damage on the back side of the specimen (Figure 7b) shows intensive cracking where the fire occurred. It is important to note that the width of the specimen was intentionally designed to be less than the typical width of a door at 5 cm to simulate a worst-case scenario and that the black section in the middle of the specimen corresponds to the piece of paper placed during molding.
Figure 8 presents all the temperature fluctuations throughout the entire experimental process in the predetermined locations outlined in Figure 3 and described in Section 2.1.3., while Figure 9a–f ((a) (T = 0 min), (b) T = 10 min, (c) T = 20 min, (d) T = 60 min, (e) T = 90 min, (f) end of experiment (T = 120 min)) illustrate the thermal distribution through heat maps during fire exposure at various time intervals. The center of the specimen reached the highest temperatures at 308.7 °C and 299.5 °C (C8 and C7, respectively) after twenty minutes of the experiment’s initiation. An intense heat distribution in the specimen can be observed with warmer, darker orange colors at points C8 and C7 where the main fire exposure occurred. It is worth noticing that all examined points reached their pick temperature at twenty minutes, whereas afterwards, the temperature remained steady or slightly decreased. This is probably attributed to the cracking that occurred at the back surface, allowing heat to escape the specimen. Points that were distant from the heat source recorded values between 70 and 100 °C, while moving further away from the fire, C1 exhibited significantly cooler tone colors, remaining mostly unaffected by the fire, reaching a maximum temperature of 42.3 °C after a 2 h fire exposure. This indicates that in case of a fire incident, thermal spread can be slowed down to a point where fire services can interfere, ensuring the fire integrity of the building and the safety of the residents. Considering that the heat source was impacting the specimen at 1850 °C and that a worst-case scenario of lower thickness was being examined, the thermal performance can be considered satisfactory.

3.3. Technoeconomic Analysis

As described in Section 2.3, “Scenario B” includes all the cost variables related to the financial performance of the investigated product. Figure 8 demonstrates a financial analysis based on the predetermined normalization method, comparing the annual cost per square meter of material compared to the annual profit per year after deducting the initial investment.
Since the total cost includes fixed and variable costs that would not increase as much as the turnover, it allows for the annual cost per square meter to decrease each year. In the fifth year of production, the cost per square meter will be 37.9% of the initial cost. Regarding the profit parameter, in the first year, the initial investment required for equipment and other fundamental cost was deducted from the annual profit. Therefore, when normalizing the data, negative values of profit yield for the first 3.5 years of the projection timeline. This implies that until that point, direct sales of the product did not yield a profit. As marked with an “×” symbol in Figure 10, at approximately 3.5 years of operations, a break-event point was achieved. Beyond that point, positive values indicate that the market material is profitable, with a 35.5% profit projected in the 5th year.

4. Conclusions

The objective of this research was to investigate the potential exploitation of waste glass as a precursor material for geopolymerization to produce an innovative lightweight material with thermal proof characteristics. This paper investigated the utilization of the developed material as a door core and as a façade in an exterior wall. The characterization and mechanical treatment of recycled waste glass were conducted, and twelve different combinations with aluminum powder contents ranging from 0.6% to 0.9% and 60:40, 70:30 and 80:20 Na2SiO3:NaOH ratios were cast. A comprehensive assessment of the physical, mechanical and durability characteristics was conducted for all mixtures. The optimum formulation was evaluated for the fire-resistant properties and a techno-economic analysis was performed to examine the financial viability. The following conclusions were drawn:
  • ED-XRF characterization of the recycled waste glass showed a silicate-rich material with an average SiO2 quantity of 76.8%; nevertheless, the absence of Al2O3 in the oxide composition necessitated the obligatory incorporation of aluminum powder to initiate the geopolymerization.
  • An optimum mechanical treatment for the adequate grinding of waste glass to achieve the required surface reactivity involved the initial treatment with a Los Angeles apparatus for 20 kg of materials at 20,000 cycles, followed by grinding in a Micro Deval machine at 5 kg per round at 10,000 rpm.
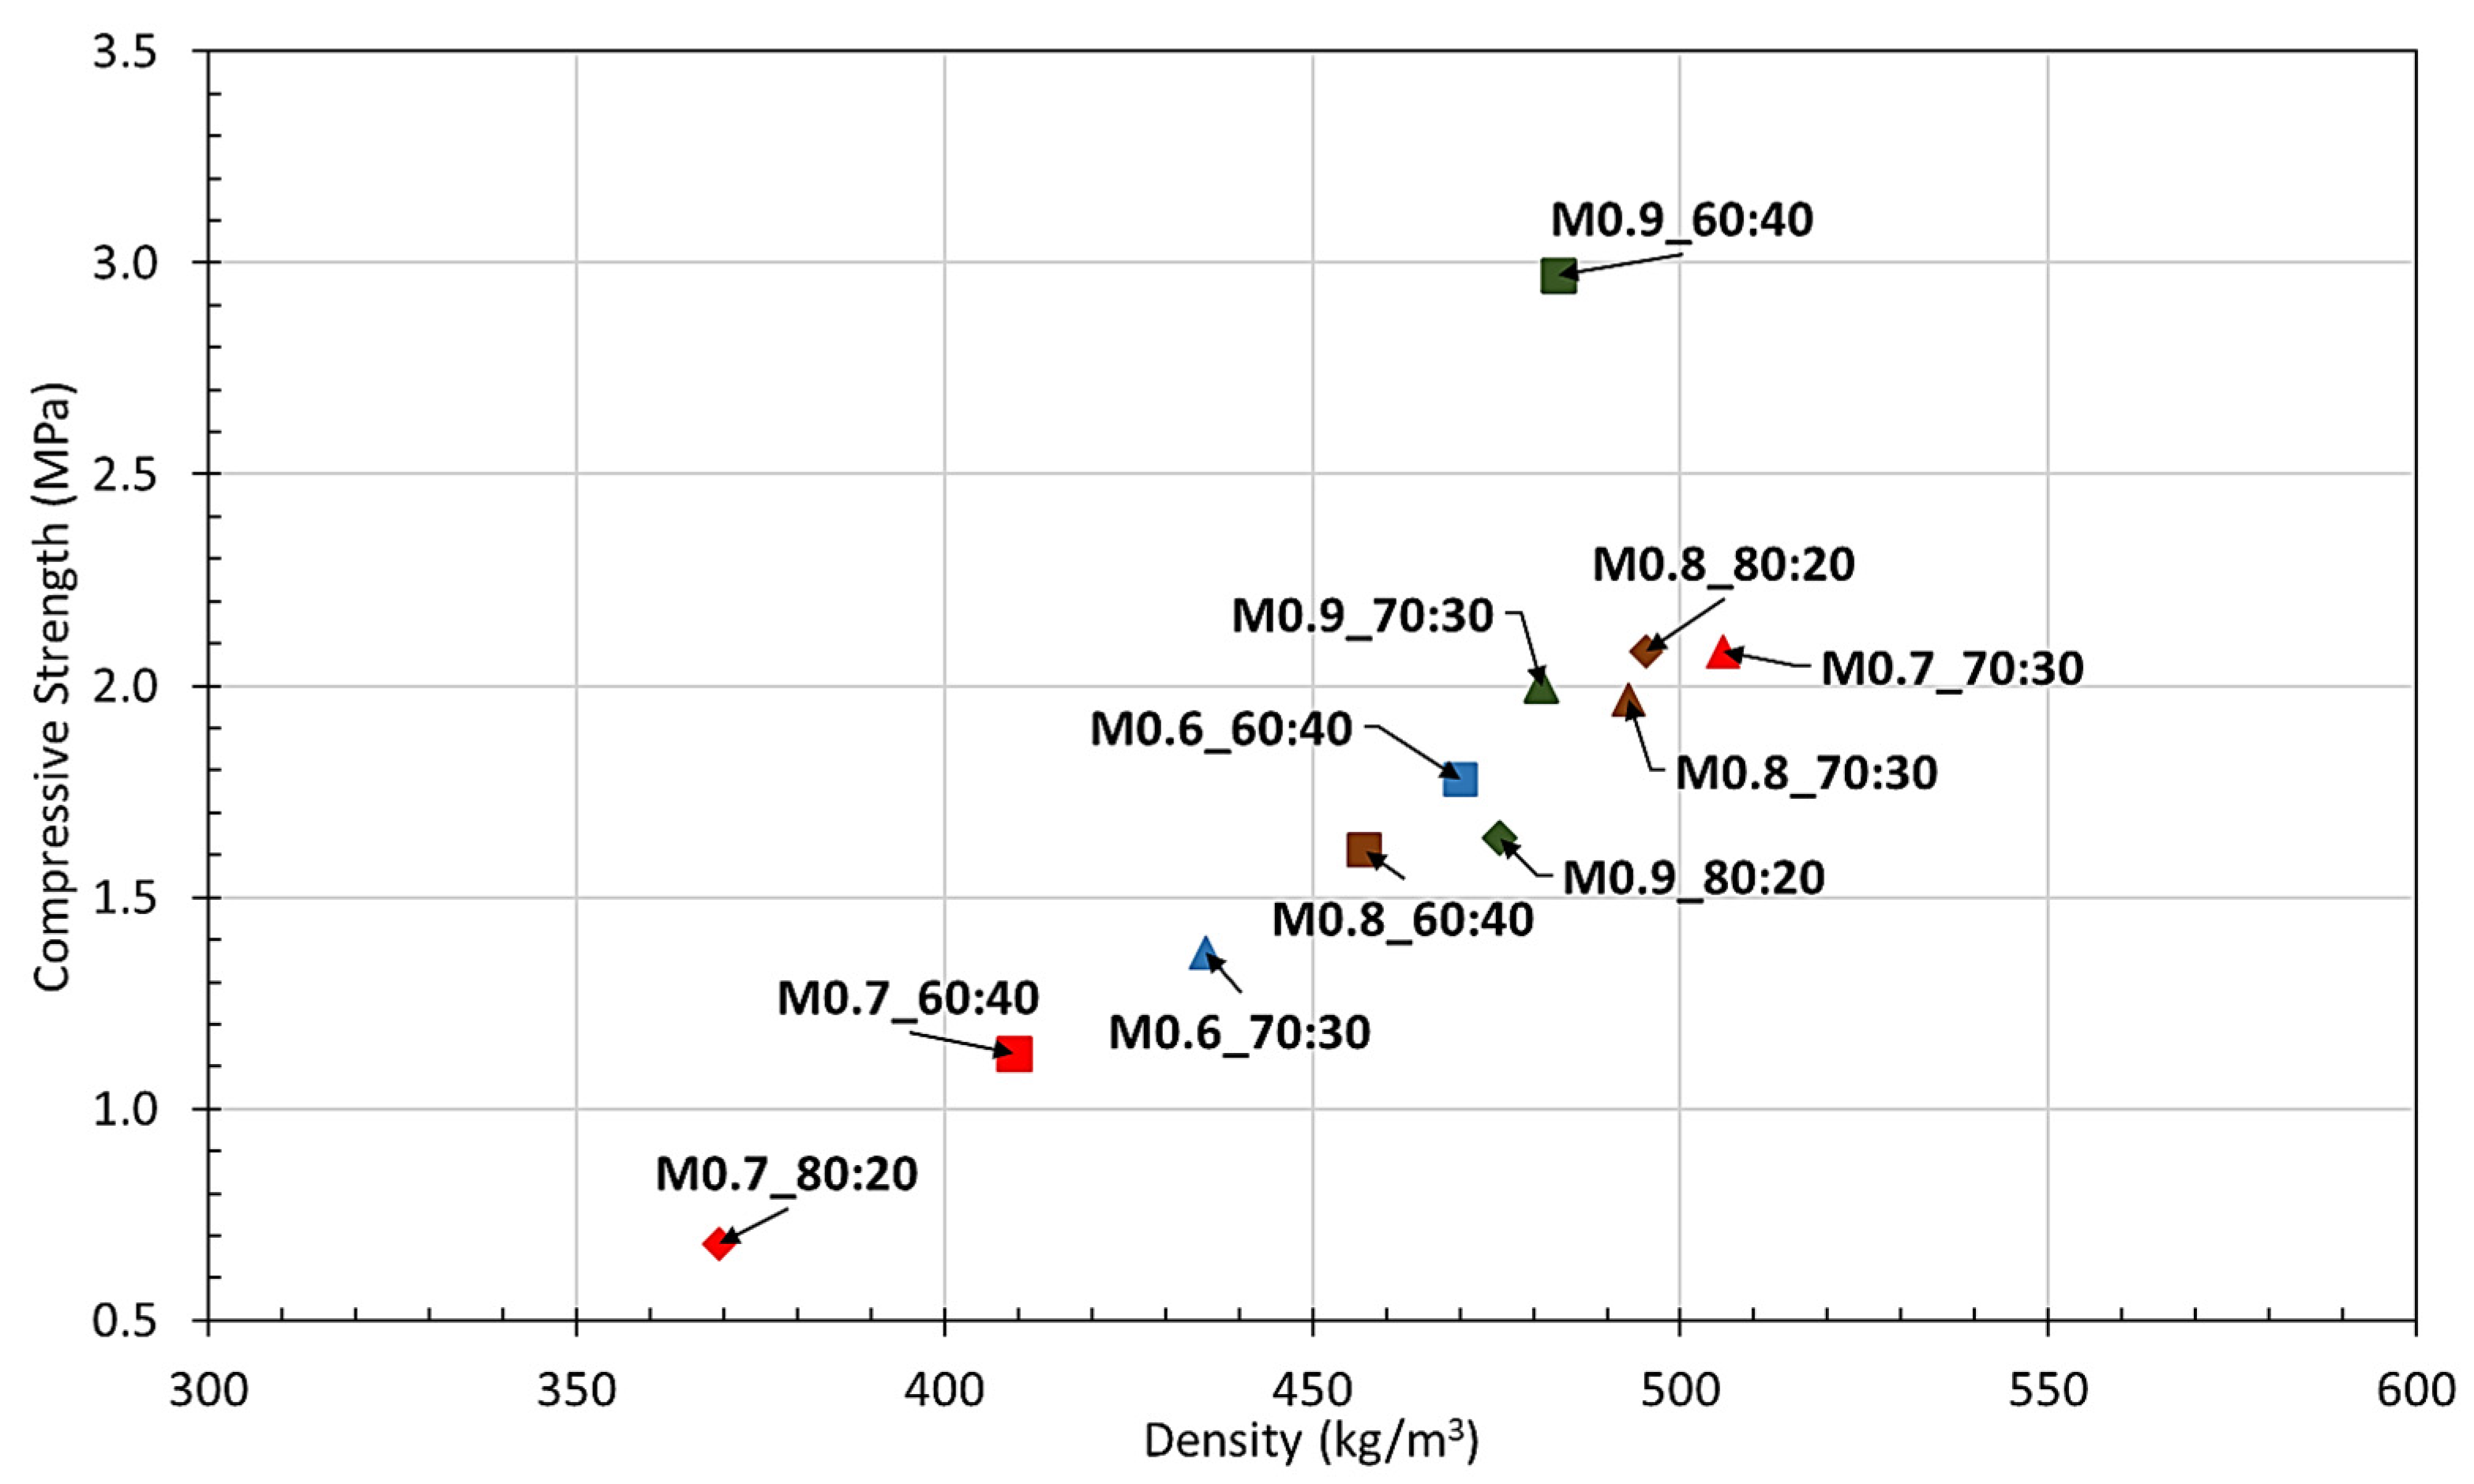
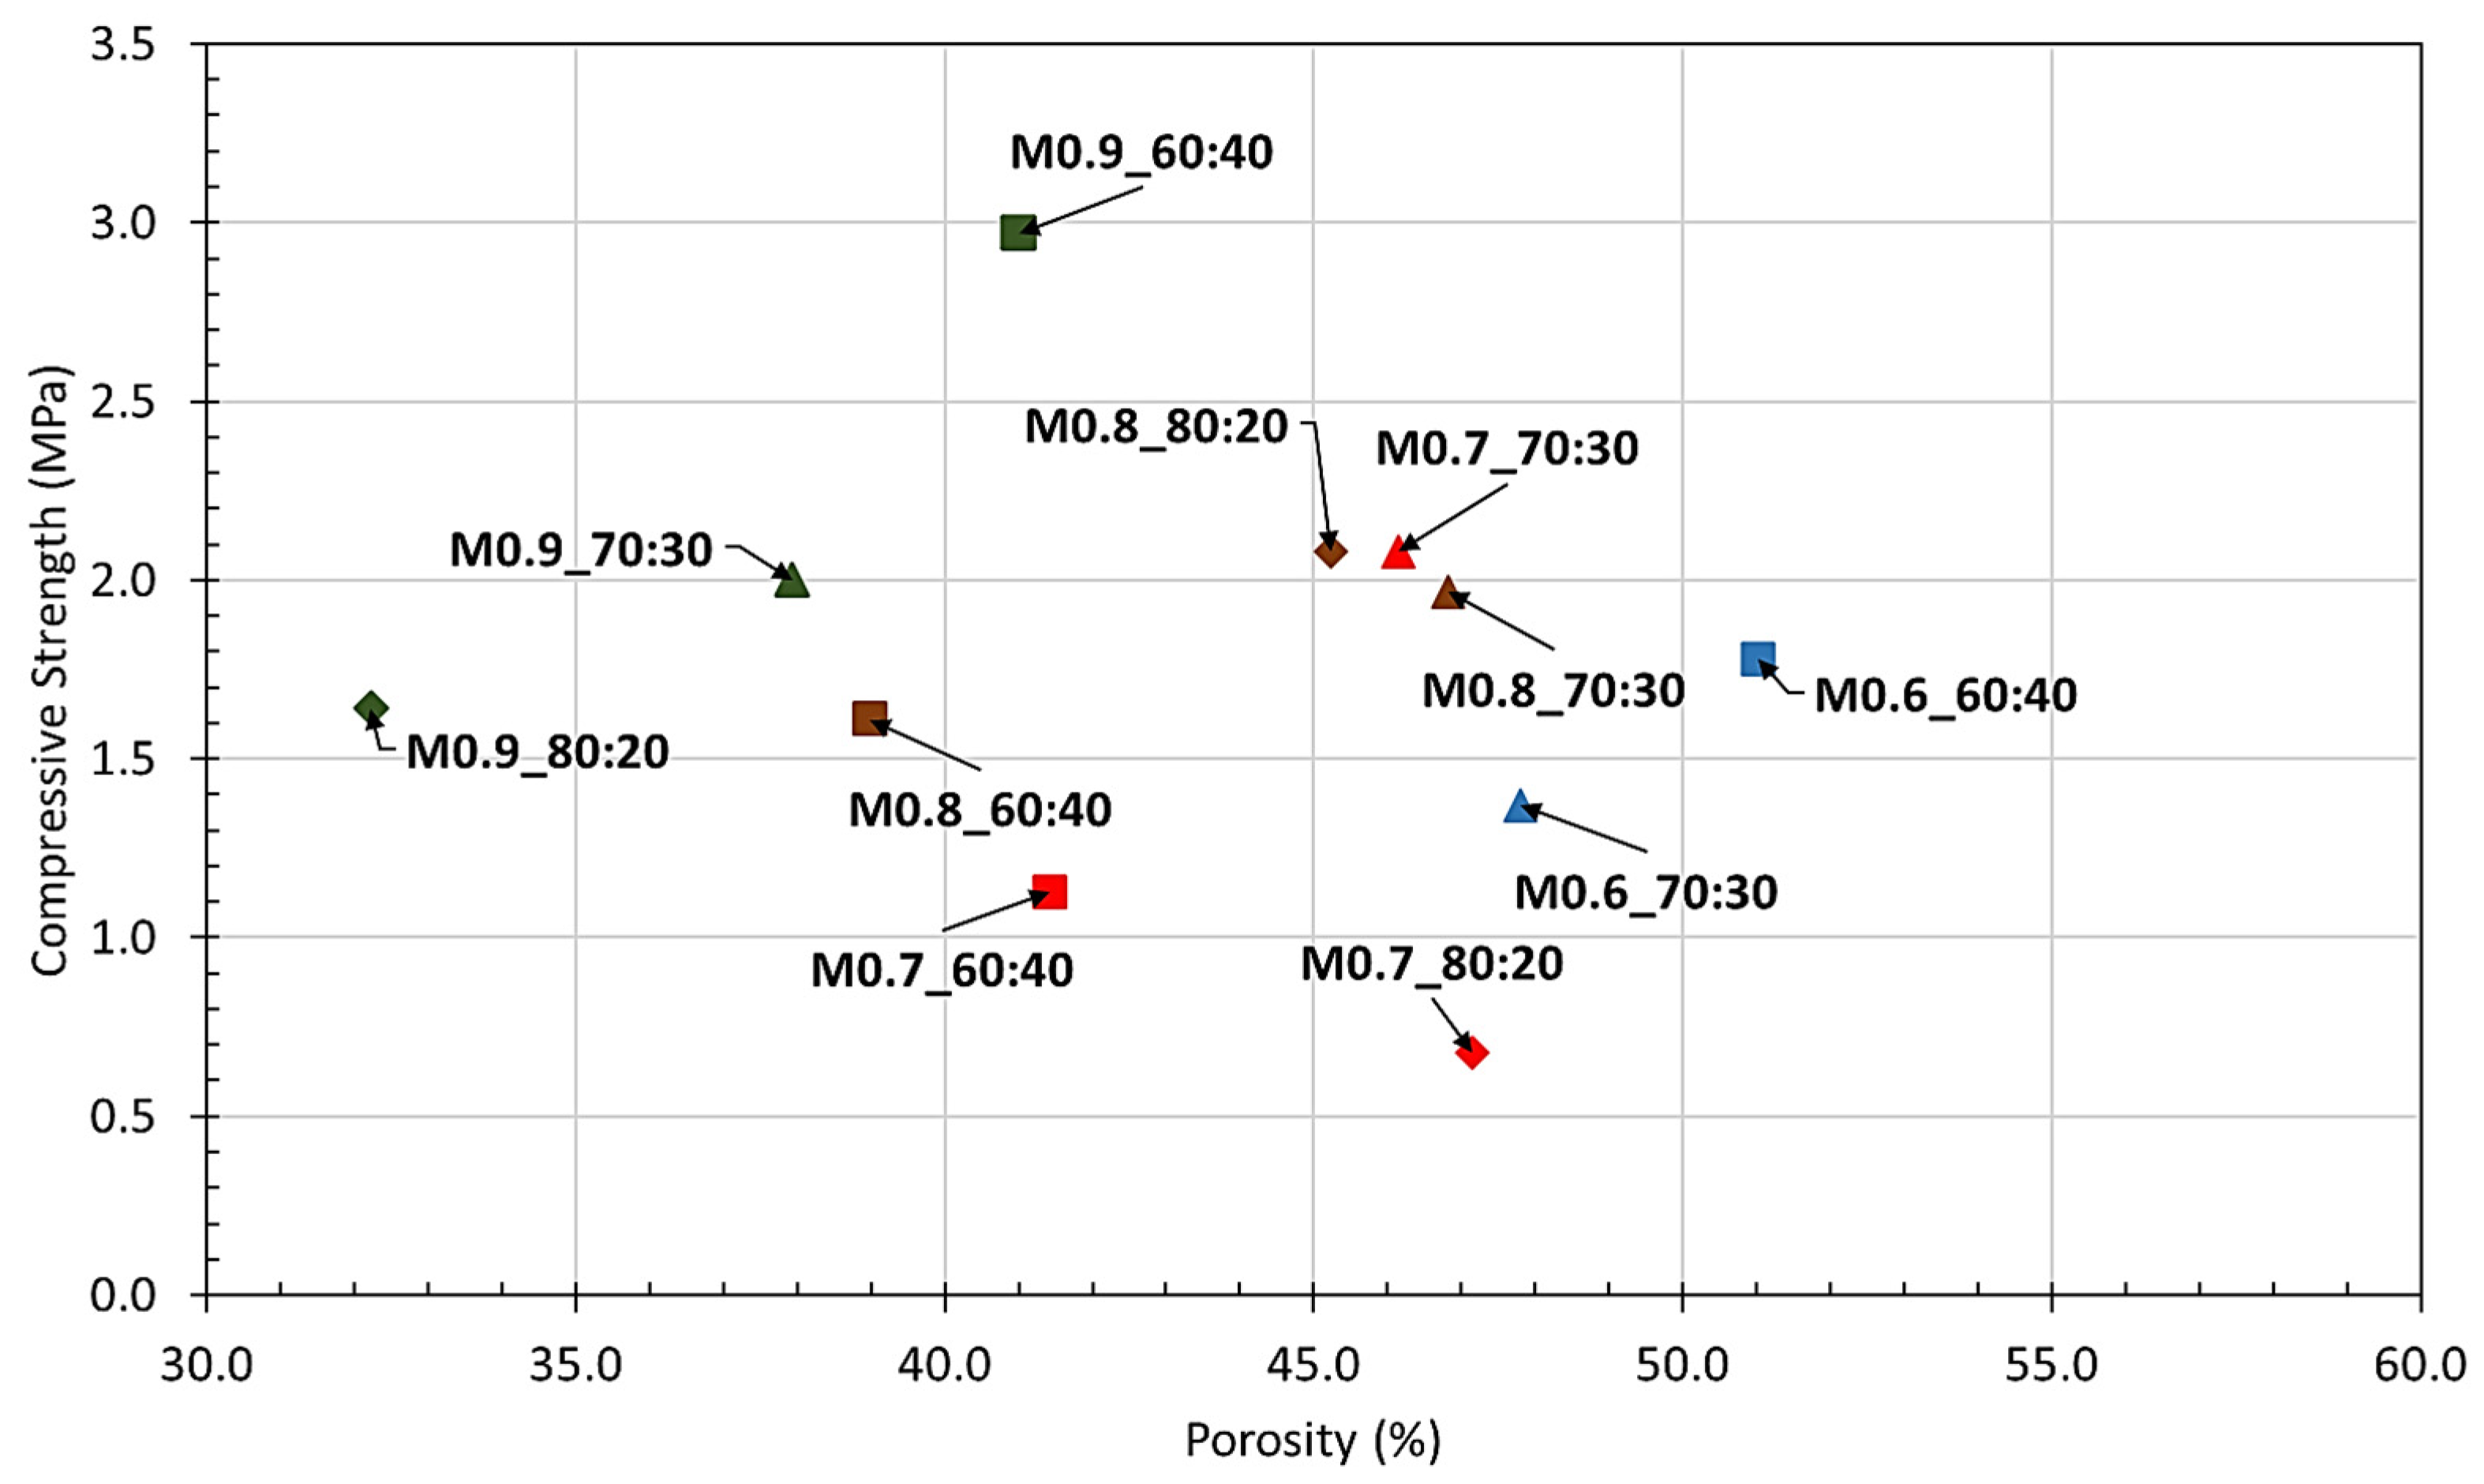
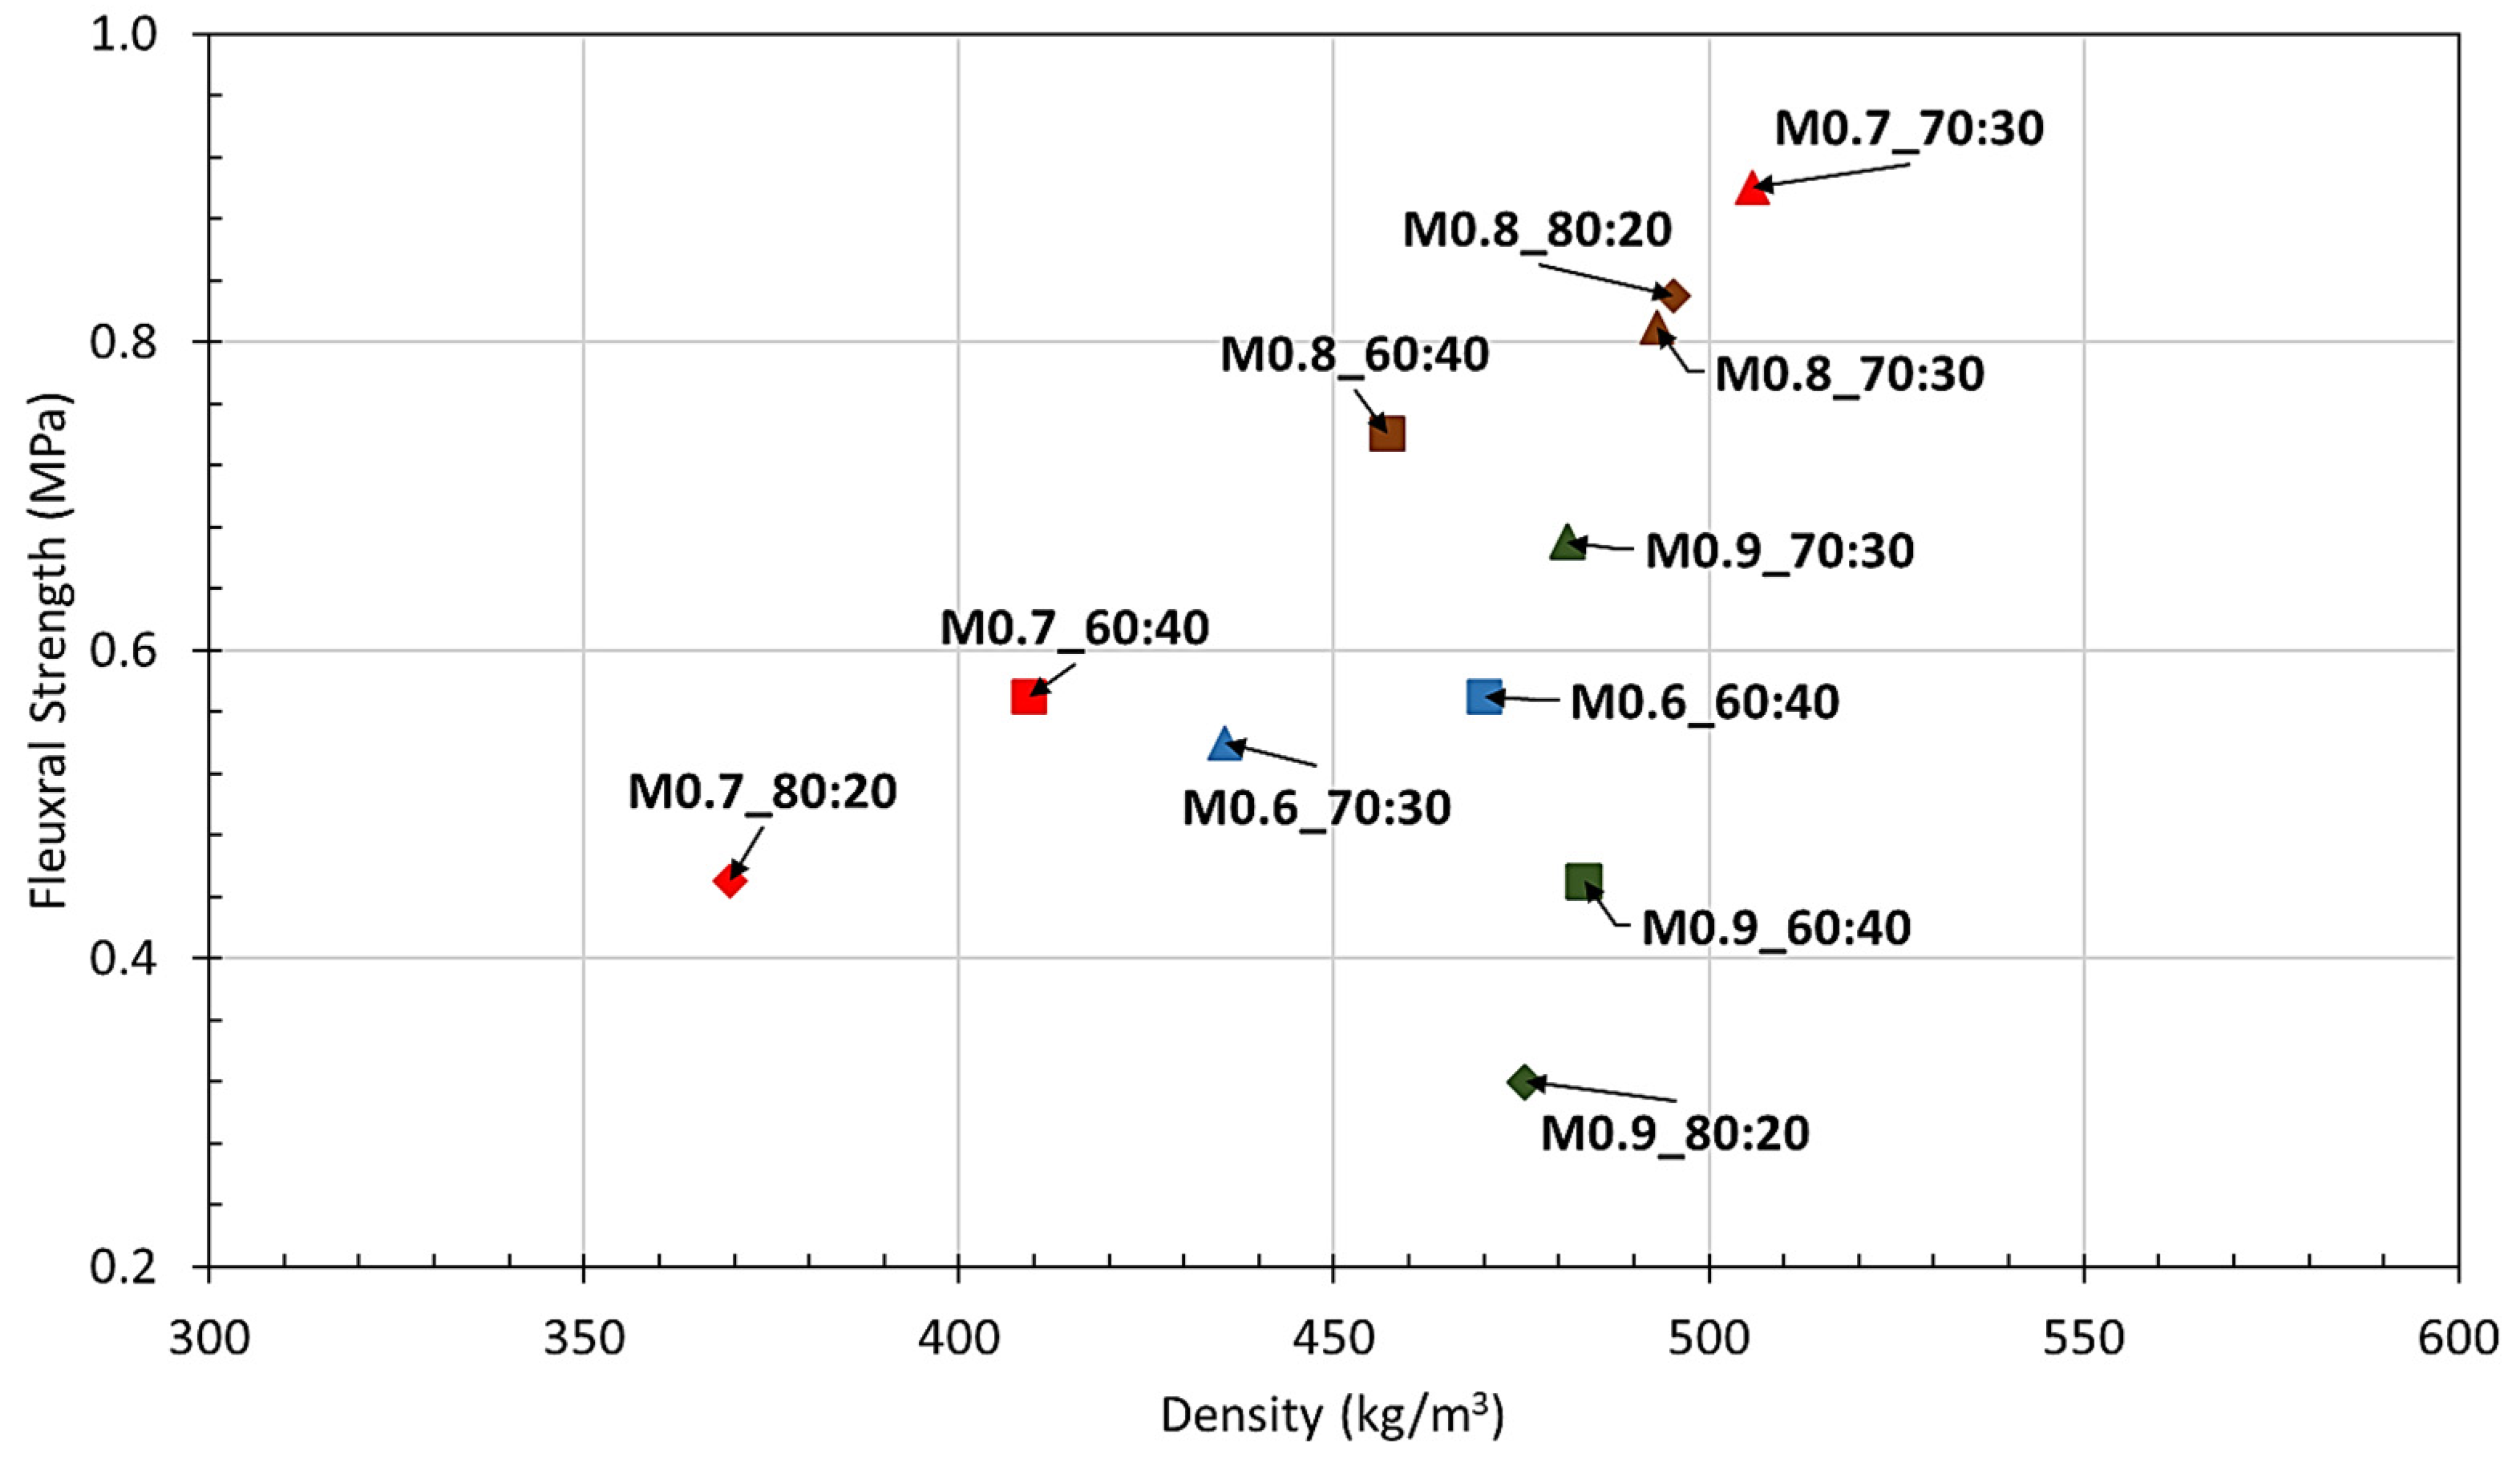
  • All formulations yielded a density range from 350 to 550 kg/m3, compressive strengths between 0.5 and 3.0 MPa and flexural strengths exceeding 0.2 MPa, defining the results as promising indicators in the geopolymerization of recycled glass powder.
  • The experimental results showed the significance of obtaining an optimum balance between the aluminum powder and solution ratio quantities in strength and physical characteristics. For application of the geopolymerized product as a door core, mixture M0.70_70:30 was defined as the suitable and cost-efficient formulation; however, for utilization as an exterior façade, the requirement for the minimum possible void matrix specimen was crucial. Therefore, porosity was the predominant parameter for selecting M0.9_70:30 as the optimum mixture.
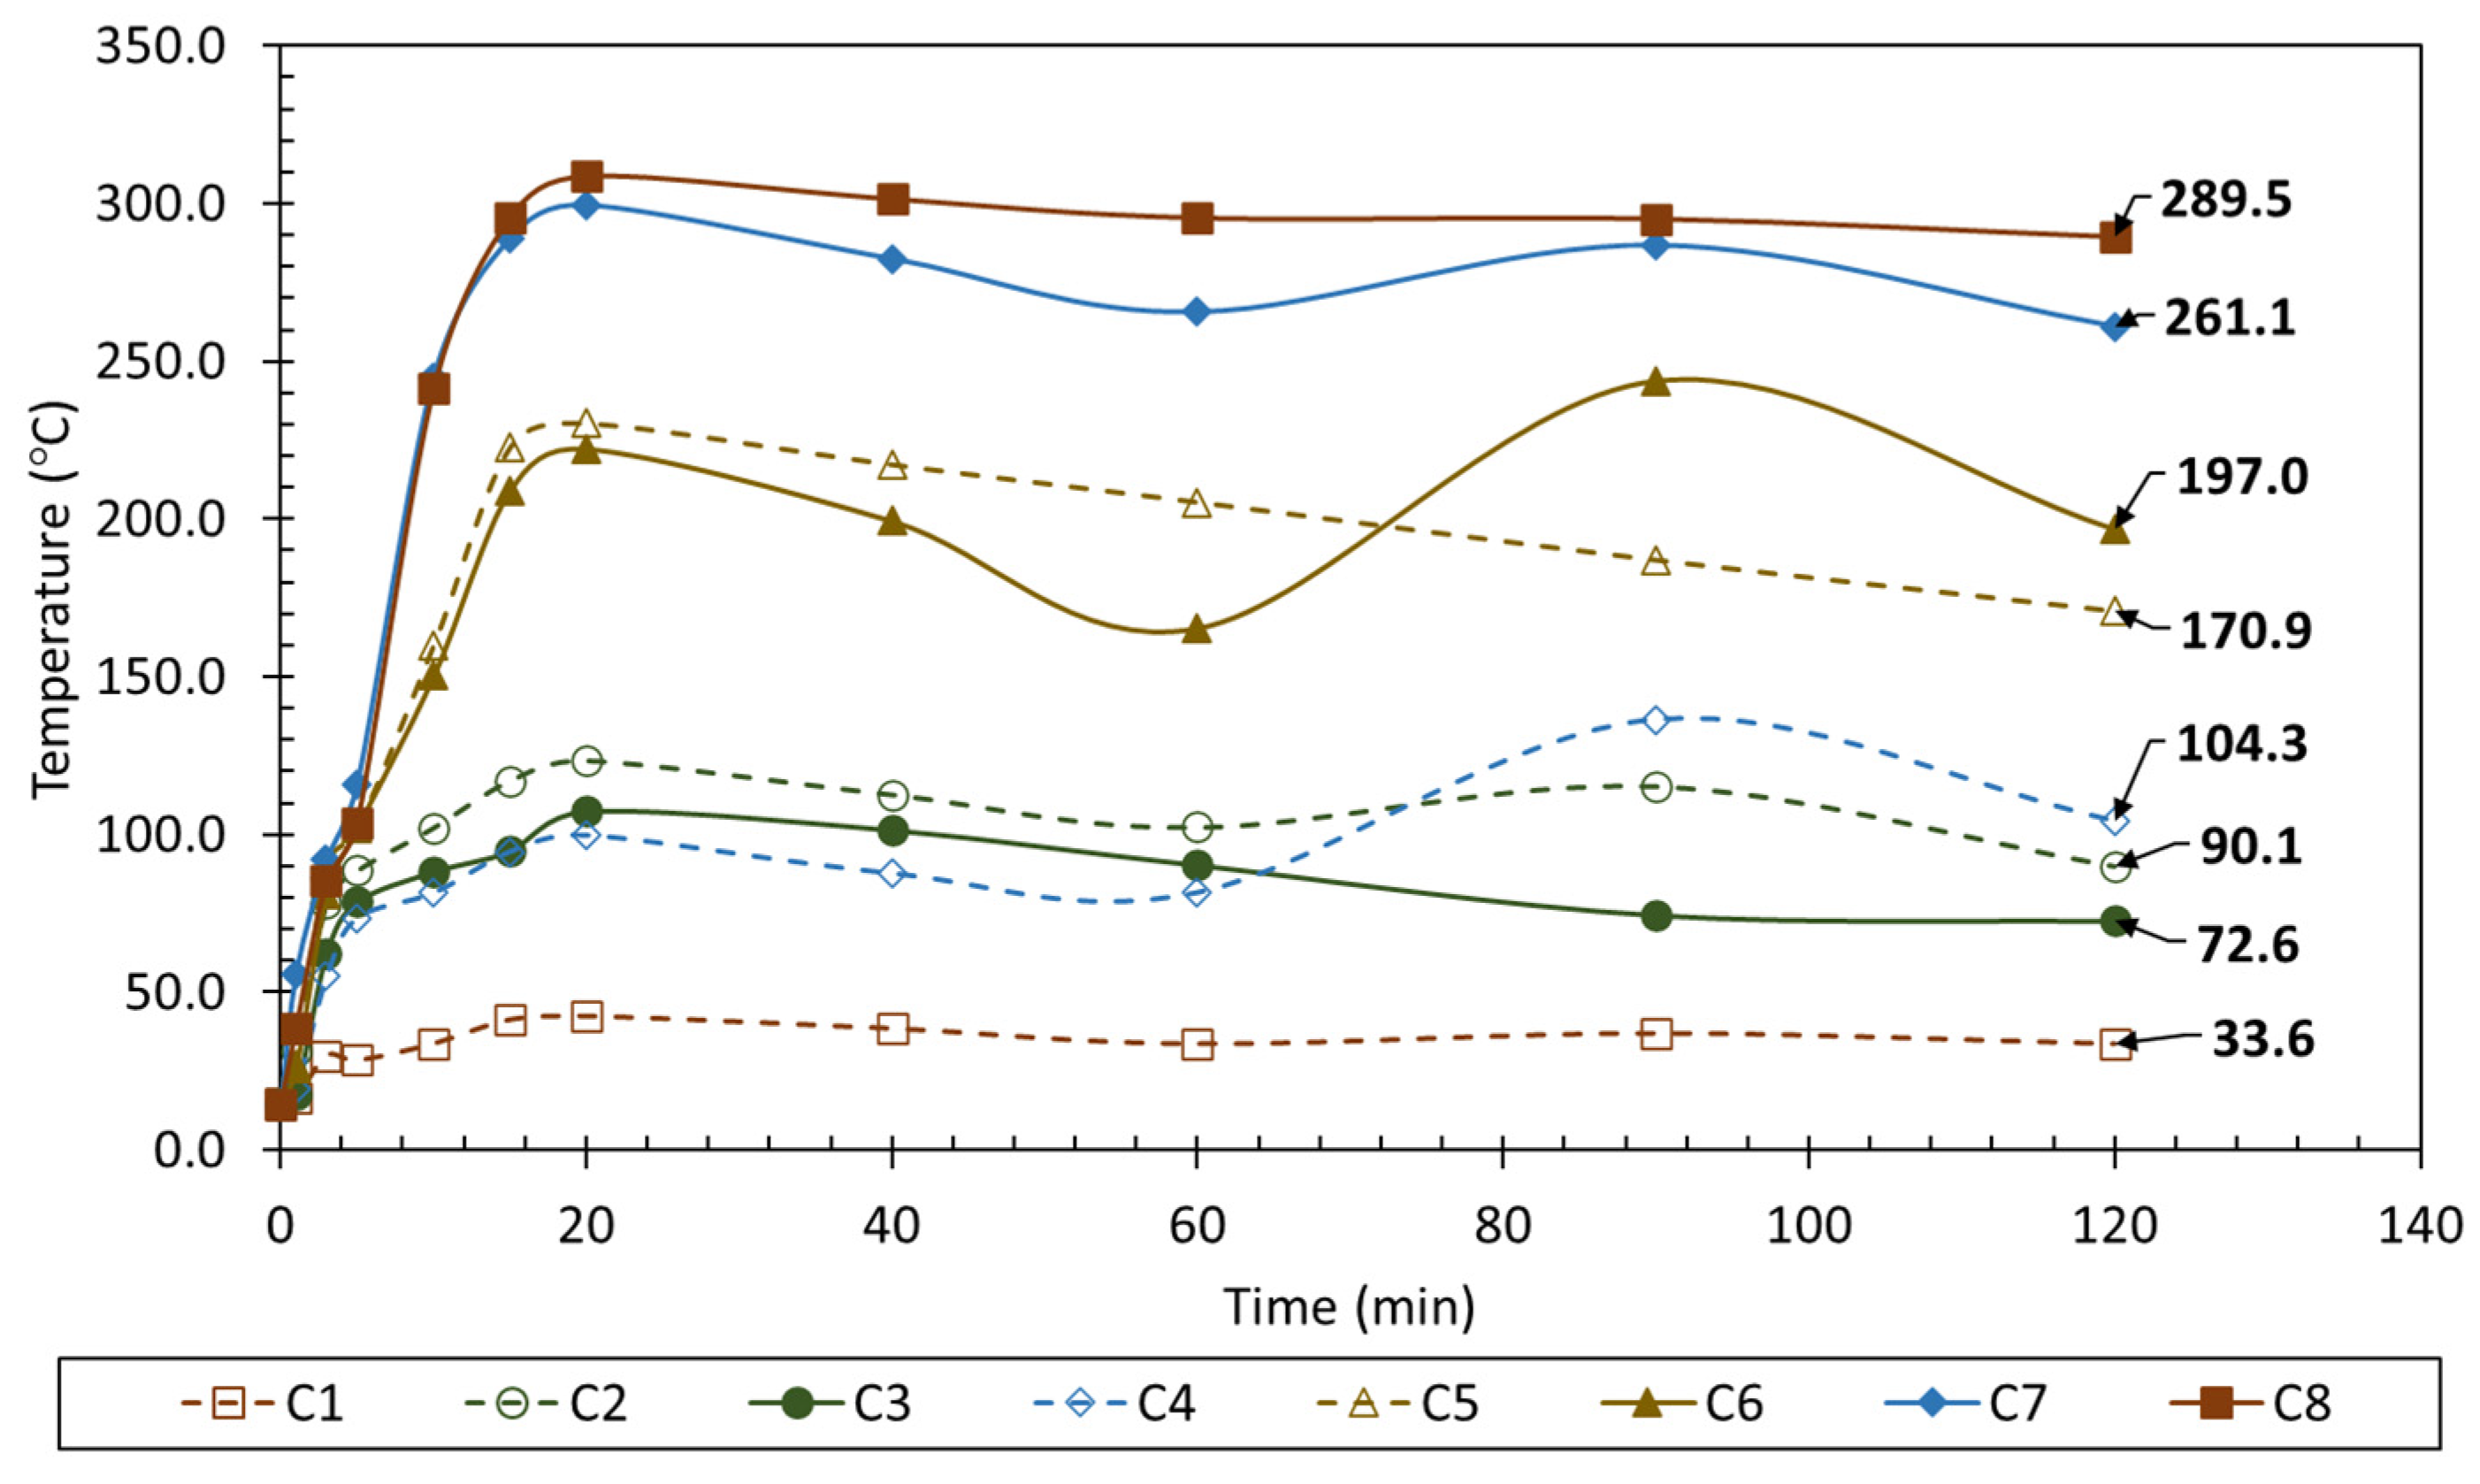
  • The thermal performance of M0.70_70:30 was evaluated as satisfactory during a 2 h fire exposure utilizing a blowtorch with a maximum temperature of 1850 °C since the highest temperatures were recorded at the center of the specimen at 308.7 °C and 299.5 °C twenty minutes after experiment initiation.
The authors of this research paper aim to further investigate the potentiality behind the fireproof geopolymerization of the recycled waste glass. Further research will be conducted on different alkaline activators, S/L ratios, aluminum contents and on microstructure characterization. Furthermore, comprehensive analysis will be conducted on the thermal performance of the optimum mixture as a door core and efforts will be made into upscaling to industrial production to further accommodate market penetration into passive fire protection in the construction sector.

Author Contributions

Conceptualization, K.S., D.N. and P.S.; methodology, K.S., D.N. and P.S.; validation, M.V., A.F., K.O. and K.A.; formal analysis, M.V., K.O. and A.F.; investigation, M.V.; resources, K.A. and A.F.; data curation, M.V. and K.O.; writing—original draft preparation, K.O. and K.A.; writing—review and editing, M.V. and P.S.; supervision, P.S.; project administration, M.V. and P.S.; funding acquisition, K.S., D.N. and P.S. All authors have read and agreed to the published version of the manuscript.

Funding

This research was funded by the Cyprus Research & Innovation Foundation (RIF) from the Republic of Cyprus and the European Regional Development Fund, RESTART Research, Technological Development and Innovation Programmes 2016–2020 (project budget: EUR 612,900.00, project contract number: SEED/0719(B)/0111).

Data Availability Statement

Data available on request due to restrictions (e.g., privacy, legal or ethical reasons).

Acknowledgments

The authors of this research paper would like to express their deep appreciation to the Cyprus Research & Innovation Foundation for funding this project, as well as to all authors who contributed to the successful completion of this research.

Conflicts of Interest

Marios Valanides, Alexandros Fikardos, Pericles Savva and Konstantinos Sakkas were employed by the company RECS Civil Engineers & Partners LLC; Demetris Nicolaides was employed by Frederick University. The remaining authors declare that the research was conducted in the absence of any commercial or financial relationships that could be construed as a potential conflict of interest.

References

  1. U.S. Environmental Protection Agency. Glass: Material-Specific Data. 2017. Available online: https://www.epa.gov/facts-and-figures-about-materials-waste-and-recycling/glass-material-specific-data (accessed on 28 March 2022).
  2. Meena, A.; Singh, R. Comparative Study of Waste Glass Powder as Pozzolanic Material in Concrete. Ph.D. Thesis, Department of Civil and Environmental Engineering, National Institute of Technology, Rourkela, India, 2012. [Google Scholar]
  3. Guo, P.; Meng, W.; Nassif, H.; Gou, H.; Bao, Y. New perspectives on recycling waste glass in manufacturing concrete for sustainable civil infrastructure. Constr. Build. Mater. 2020, 257, 119579. [Google Scholar] [CrossRef]
  4. Siddika, A.; Hajimohammadi, A.; Sahajwalla, V. Powder sintering and gel casting methods in making glass foam using waste glass: A review on parameters, performance, and challenges. Ceram. Int. 2022, 48, 1494–1511. [Google Scholar] [CrossRef]
  5. Cheng, M.; Chen, M.; Wu, S.; Yang, T.; Zhang, J.; Zhao, Y. Effect of waste glass aggregate on performance of asphalt micro-surfacing. Constr. Build. Mater. 2021, 307, 125133. [Google Scholar] [CrossRef]
  6. Paul, D.; Suresh, M.; Pal, M. Utilization of fly ash and glass powder as fillers in steel slag asphalt mixtures. Case Stud. Constr. Mater. 2021, 15, e00672. [Google Scholar] [CrossRef]
  7. You, L.; Jin, D.; Guo, S.; Wang, J.; Dai, Q.; You, Z. Leaching evaluation and performance assessments of asphalt mixtures with recycled cathode ray tube glass: A preliminary study. J. Clean. Prod. 2021, 279, 123716. [Google Scholar] [CrossRef]
  8. Lam, C.S.; Poon, C.S.; Chan, D. Enhancing the performance of pre-cast concrete blocks by incorporating waste glass—ASR consideration. Cem. Concr. Compos. 2007, 29, 616–625. [Google Scholar] [CrossRef]
  9. Su, N.; Chen, J. Engineering properties of asphalt concrete made with recycled glass. Resour. Conserv. Recycl. 2002, 35, 259–274. [Google Scholar] [CrossRef]
  10. Ming, N.C.; Putra Jaya, R.; Awang, H.; Siaw Ing, N.L.; Mohd Hasan, M.R.; Al-Saffar, Z.H. Performance of glass powder as bitumen modifier in hot mix asphalt. Phys. Chem. Earth Parts A/B/C 2022, 128, 103263. [Google Scholar] [CrossRef]
  11. Lin, J.; Guo, Z.; Hong, B.; Xu, J.; Fan, Z.; Lu, G.; Wang, D.; Oeser, M. Using recycled waste glass fiber reinforced polymer (GFRP) as filler to improve the performance of asphalt mastics. J. Clean. Prod. 2022, 336, 130357. [Google Scholar] [CrossRef]
  12. Kadhim, M.A.; Al-Busaltan, S.; Nemaa, Z.K.; Abo Almaali, Y.; Saghafi, B.; Al-Kafaji, M.; Al-Yasari, R. Evaluating the Cracking Performance Indices of Half-Warm Mix Asphalt Comprising Waste Glass. Int. J. Pavement Res. Technol. 2022, 15, 1262–1276. [Google Scholar] [CrossRef]
  13. Davidovits, J. Geopolymers. J. Therm. Anal. 1991, 37, 1633–1656. [Google Scholar] [CrossRef]
  14. Sata, V.; Chindaprasirt, P. 19—Use of construction and demolition waste (CDW) for alkali-activated or geopolymer concrete. In Advances in Construction and Demolition Waste Recycling; Pacheco-Torgal, F., Ding, Y., Colangelo, F., Tuladhar, R., Koutamanis, A., Eds.; Woodhead Publishing: Thorston, UK, 2020; pp. 385–403. [Google Scholar] [CrossRef]
  15. Wang, C.-C.; Wang, H.-Y.; Chen, B.-T.; Peng, Y.-C. Study on the engineering properties and prediction models of an alkali-activated mortar material containing recycled waste glass. Constr. Build. Mater. 2017, 132, 130–141. [Google Scholar] [CrossRef]
  16. Wang, W.-C.; Chen, B.-T.; Wang, H.-Y.; Chou, H.-C. A study of the engineering properties of alkali-activated waste glass material (AAWGM). Constr. Build. Mater. 2016, 112, 962–969. [Google Scholar] [CrossRef]
  17. Novais, R.M.; Ascensão, G.; Seabra, M.P.; Labrincha, J.A. Waste glass from end-of-life fluorescent lamps as raw material in geopolymers. Waste Manag. 2016, 52, 245–255. [Google Scholar] [CrossRef] [PubMed]
  18. Ozer, I.; Soyer-Uzun, S. Relations between the structural characteristics and compressive strength in metakaolin based geopolymers with different molar Si/Al ratios. Ceram. Int. 2015, 41, 10192–10198. [Google Scholar] [CrossRef]
  19. Khale, D.; Chaudhary, R. Mechanism of geopolymerization and factors influencing its development: A review. J. Mater. Sci. 2007, 42, 729–746. [Google Scholar] [CrossRef]
  20. Pimraksa, K.; Chindaprasirt, P.; Rungchet, A.; Sagoe-Crentsil, K.; Sato, T. Lightweight geopolymer made of highly porous siliceous materials with various Na2O/Al2O3 and SiO2/Al2O3 ratios. Mater. Sci. Eng. A 2011, 528, 6616–6623. [Google Scholar] [CrossRef]
  21. Puertas, F.; Torres-Carrasco, M. Use of glass waste as an activator in the preparation of alkali-activated slag. Mechanical strength and paste characterization. Cem. Concr. Res. 2014, 57, 95–104. [Google Scholar] [CrossRef]
  22. Luhar, S.; Cheng, T.-W.; Nicolaides, D.; Luhar, I.; Panias, D.; Sakkas, K. Valorisation of glass waste for development of Geopolymer composites—Mechanical properties and rheological characteristics: A review. Constr. Build. Mater. 2019, 220, 547–564. [Google Scholar] [CrossRef]
  23. Luhar, S.; Cheng, T.-W.; Nicolaides, D.; Luhar, I.; Panias, D.; Sakkas, K. Valorisation of glass wastes for the development of geopolymer composites—Durability, thermal and microstructural properties: A review. Constr. Build. Mater. 2019, 222, 673–687. [Google Scholar] [CrossRef]
  24. Tahwia, A.M.; Ellatief, M.A.; Heneigel, A.M.; Elrahman, M.A. Characteristics of eco-friendly ultra-high-performance geopolymer concrete incorporating waste materials. Ceram. Int. 2022, 48, 19662–19674. [Google Scholar] [CrossRef]
  25. Mahesh, Y.; Lalitha, G. Durablilty propeties of geopolymer concrete partial replacement of fine aggaregate with waste crushed glass. Mater. Today Proc. 2022, 51, 2466–2470. [Google Scholar] [CrossRef]
  26. Geopolymer Cement a Review 2013, ResearchGate. (n.d.). Available online: https://www.researchgate.net/publication/306946529_Geopolymer_Cement_a_review_2013 (accessed on 29 March 2022).
  27. Hlaváček, P.; Šmilauer, V.; Škvára, F.; Kopecký, L.; Šulc, R. Inorganic foams made from alkali-activated fly ash: Mechanical, chemical and physical properties. J. Eur. Ceram. Soc. 2015, 35, 703–709. [Google Scholar] [CrossRef]
  28. Hertz, K.D. Limits of spalling of fire-exposed concrete. Fire Saf. J. 2003, 38, 103–116. [Google Scholar] [CrossRef]
  29. Sidhu, P.S. Transformation of Trace Element-Substituted Maghemite to Hematite. Clays Clay Miner. 1988, 36, 31–38. [Google Scholar] [CrossRef]
  30. Przepiera, A.; Przepiera, K.; Wisniewski, M.; Dabrowski, W. Investigations of the thermal transformations of precipitated mixed transition metal hydroxides. J. Therm. Anal. 1993, 40, 1131–1138. [Google Scholar] [CrossRef]
  31. Rickard, W.D.A.; Kealley, C.S.; van Riessen, A. Thermally Induced Microstructural Changes in Fly Ash Geopolymers: Experimental Results and Proposed Model. J. Am. Ceram. Soc. 2015, 98, 929–939. [Google Scholar] [CrossRef]
  32. Sarker, P.K.; Kelly, S.; Yao, Z. Effect of fire exposure on cracking, spalling and residual strength of fly ash geopolymer concrete. Mater. Design. 2014, 63, 584–592. [Google Scholar] [CrossRef]
  33. Zhao, R.; Sanjayan, J.G. Geopolymer and Portland cement concretes in simulated fire. Mag. Concr. Res. 2011, 63, 163–173. [Google Scholar] [CrossRef]
  34. Ye, J.; Zhang, W.; Shi, D. Effect of elevated temperature on the properties of geopolymer synthesized from calcined ore-dressing tailing of bauxite and ground-granulated blast furnace slag. Constr. Build. Mater. 2014, 69, 41–48. [Google Scholar] [CrossRef]
  35. Zulkifly, K.; Yong, H.C.; Abdullah, M.M.A.B.; Ming, L.Y.; Panias, D.; Sakkas, K. Review of Geopolymer Behaviour in Thermal Environment; IOP Conference Series: Materials Science and Engineering; IOP Publishing: Bristol, UK, 2017; Volume 209, p. 012085. [Google Scholar] [CrossRef]
  36. Gok, S.G.; Sengul, O. Mechanical properties of alkali-activated slag based SIFCON incorporating waste steel fibers and waste glass. Constr. Build. Mater. 2023, 408, 133697. [Google Scholar] [CrossRef]
  37. Mendes, B.C.; Pedroti, L.G.; Vieira, C.M.F.; de Carvalho, J.M.F.; Ribeiro, J.C.L.; de Souza, C.M.M. Application of mixture design of experiments to the development of alkali-activated composites based on chamotte and waste glass. Constr. Build. Mater. 2023, 379, 131139. [Google Scholar] [CrossRef]
  38. Rios, L.M.H.; Triviño, A.F.H.; Villaquirán-Caicedo, M.A.; de Gutiérrez, R.M. Effect of the use of waste glass (as precursor, and alkali activator) in the manufacture of geopolymer rendering mortars and architectural tiles. Constr. Build. Mater. 2023, 363, 129760. [Google Scholar] [CrossRef]
  39. Liu, Z.; Shi, C.; Shi, Q.; Tan, X.; Meng, W. Recycling waste glass aggregate in concrete: Mitigation of alkali-silica reaction (ASR) by carbonation curing. J. Clean. Prod. 2022, 370, 133545. [Google Scholar] [CrossRef]
  40. Zhao, J.; Li, S. Performance study and environmental evaluation of alkali-activated materials based on waste photovoltaic glass. J. Clean. Prod. 2022, 379 Pt 1, 134576. [Google Scholar] [CrossRef]
  41. Zhao, J.; Li, S. Alkali-activated binder with waste photovoltaic glass powder and blast furnace slag as precursors: Performance study, shrinkage—reducing technology and mechanism analysis. J. Non-Cryst. Solids 2023, 609, 122263. [Google Scholar] [CrossRef]
  42. Bianco, I.; Tomos, B.A.D.; Vinai, R. Analysis of the environmental impacts of alkali-activated concrete produced with waste glass-derived silicate activator—A LCA study. J. Clean. Prod. 2021, 316, 128383. [Google Scholar] [CrossRef]
  43. Mazzi, A.; Sciarrone, M.; Bernardo, E. Environmental performance of glass foam as insulation material from waste glass with the alkali activation process. Heliyon 2023, 8, e19001. [Google Scholar] [CrossRef] [PubMed]
  44. Europe Passive Fire Protection Coating Market Scope, Revenue, Value, & Industry Trends. Europe Passive Fire Protection Coating Market Scope, Revenue, Value, & Industry Trends. Available online: https://www.databridgemarketresearch.com/reports/europe-passive-fire-protection-coating-market (accessed on 5 October 2023).
  45. CYS EN 1097-2:2020; Tests for Mechanical and Physical Properties of Aggregates—Part 2. Methods for the Determination of Resistance to Fragmentation. CEN (European Committee for Standardization): Brussels, Belgium, 2020.
  46. CYS EN 1097-1:2021; Tests for Mechanical and Physical Properties of Aggregates Part 1. Determination of the Resistance to Wear (Micro-Deval). CEN (European Committee for Standardization): Brussels, Belgium, 2021.
  47. CYS EN 1097-6:2022; Tests for Mechanical and Physical Properties of Aggregates—Part 6: Determination of Particle Density and Water Absorption. CEN (European Committee for Standardization): Brussels, Belgium, 2022.
  48. CYS EN 196-6:2018; Methods of Testing Cement—Part 6: Determination of Fineness. CEN (European Committee for Standardization): Brussels, Belgium, 2018.
  49. CYS EN 196-1:2016; Methods of Testing Cement—Part 1: Determination of Strength. CEN (European Committee for Standardization): Brussels, Belgium, 2016.
  50. Kanellopoulos, A.; Petrou, M.F.; Ioannou, I. Durability performance of self-compacting concrete. Constr. Build. Mater. 2012, 37, 320–325. [Google Scholar] [CrossRef]
Figure 1. Color fluctuations in the recycled powder glass were demonstrated after undergoing Los Angeles abrasion grinding.
Recycling 09 00016 g001
Figure 2. Particle size distribution of recycled waste glass ground through a Los Angeles abrasion machine at different numbers of cycles intervals.
Recycling 09 00016 g002
Figure 3. Points C1 to C8 to assess the fire-resistance performance of the optimal chosen combination.
Recycling 09 00016 g003
Figure 4. Effect of aluminum powder (Al) content and Na2SiO3:NaOH ratio on the compressive strength (7 days) and density of geopolymerized specimens (blue color = 0.6% Al content; red color = 0.7% Al content; brown color = 0.8% Al content; green color = 0.9% Al content; ■ = 60:40 Na2SiO3:NaOH ratio; ▲ = 70:30 Na2SiO3:NaOH ratio; ◆ = 80:20 Na2SiO3:NaOH ratio).
Recycling 09 00016 g004
Figure 5. Effect of aluminum powder (Al) content and Na2SiO3:NaOH ratio on the flexural strength (7 days) and density of geopolymerized specimens (blue color = 0.6% Al content; red color = 0.7% Al content; brown color = 0.8% Al content; green color = 0.9% Al content; ■ = 60:40 Na2SiO3:NaOH ratio; ▲ = 70:30 Na2SiO3:NaOH ratio; ◆ = 80:20 Na2SiO3:NaOH ratio).
Recycling 09 00016 g005
Figure 6. Effect of aluminum powder (Al) content and Na2SiO3:NaOH ratio on the compressive strength (7 days) and porosity of geopolymerized specimens (blue color = 0.6% Al content; red color = 0.7% Al content; brown color = 0.8% Al content; green color = 0.9% Al content; ■ = 60:40 Na2SiO3:NaOH ratio; ▲ = 70:30 Na2SiO3:NaOH ratio; ◆ = 80:20 Na2SiO3:NaOH ratio).
Recycling 09 00016 g006
Figure 7. Experimental procedure for fire-resistant evaluation of geopolymerized mixture (a) specimen during the fire exposure at 1850 °C; damage on specimen after the end of the experiment (b) on the back surface and (c) on the front surface.
Recycling 09 00016 g007
Figure 8. Temperature fluctuations over time due to fire exposure at 1850 °C at predetermined points.
Recycling 09 00016 g008
Figure 9. Thermal transfer within the specimen due to fire exposure at 1850 °C at (a) beginning of experiment (T = 0 min); (b) T = 10 min; (c) T = 20 min; (d) T = 60 min; (e) T = 90 min; (f) end of experiment (T = 120 min).
Recycling 09 00016 g009
Figure 10. Financial analysis of the geopolymerized product for a 5-year projection timeline.
Recycling 09 00016 g010
Table 1. Recycled waste glass oxide composition from ED-XRF analysis.
SampleWG1WG2WG3WG4WG5
Oxide
SiO2 (%)77.4676.2077.4677.0475.99
CaO (%)10.2610.1910.249.929.93
Na2O (%)8.718.217.589.239.16
Al2O3 (%)-----
MgO (%)4.154.522.164.394.48
K2O (%)0.160.250.170.180.22
Fe2O3 (%)0.270.640.400.250.23
Total100.00100.00100.00100.00100.00
Table 2. Micro Deval recycled glass passing the 0.075 μm and 0.063 μm sieve.
Sample No.Passing
Percentage 0.075 μm (%)
Passing
Percentage 0.063 μm (%)
Sample 197.9689.34
Sample 299.2293.20
Sample 399.5394.60
Sample 4100.0089.76
Sample 5100.0099.33
Sample 6100.0092.00
Table 3. Characteristics of the remaining materials.
ConstituentNomenclatureParticle Size (μm)pH
at 20 °C
Specific Gravity (g/cm3)
Aluminum PowderAl<44-2.70
Hostapur OSBAlpha olefin sulfate, sodium salt<6310.0–11.00.30
Sodium SilicateNa2SiO3-11.41.26–1.46
Sodium HydroxideNaOH-14.02.04
Table 4. Constituent composition for the geopolymerized mixtures.
NomenclatureGlass
(% by wt.
Solids)
Aluminum
Powder
(% by wt.
Solids)
Hostapur OBS
(% by wt. Solids)
Sodium Silicate/Sodium
Hydroxide (Na2SiO3:NaOH)
Ratio (% by wt. Liquids)
S/L
Ratio
M NaOH
M0.6_60:4099.320.600.0860:402.867
M0.6_70:3099.320.600.0870:302.867
M0.6_80:2099.320.600.0880:202.867
M0.7_60:4099.100.700.1060:402.877
M0.7_70:3099.100.700.1070:302.877
M0.7_80:2099.100.700.1080:202.877
M0.8_60:4099.090.800.1160:402.877
M0.8_70:3099.090.800.1170:302.877
M0.8_80:2099.090.800.1180:202.877
M0.9_60:4098.970.900.1360:202.887
M0.9_70:3098.970.900.1370:302.887
M0.9_80:2098.970.900.1380:202.887
Table 5. Hardened properties testing, standards and type of specimens.
Hardened Properties TestStandardAge of Testing (Days)SpecimensDimensions
(mm × mm × mm)
Compressive StrengthEN 196-1:2016 [49]73 cubes40.0 × 40.0 × 40.0
Flexural StrengthEN 196-1:2016 [49]73 prisms40.0 × 41.0 × 160.0
Open PorosityReference [50]73 cubes40.0 × 40.0 × 40.0
Fire Testing-71 board150.0 × 150.0 × 30.0
Table 6. Fixed costs, variable costs and parameters considered for the technoeconomic analysis.
Fixed CostsVariable CostsStudied Parameters
Web Host FeesCost of Goods SoldTurnover
Accounting and Legal FeesOverheadTotal Costs
DepreciationMaintenanceInitial Investment
Insurance Cost per m2
Manufacturing EBIT (Earnings before
interest and taxes)
Payroll TAX
Rent NIAT
(Net income after tax)
Supplies Break-event point
Taxes (Real Estate, etc.) Payback Period
Utilities
Labor
Other Startup Costs
Table 7. Characteristics of all investigated geopolymer formulations.
NomenclatureTemperature (°C)Humidity (%)Density (kg/m3)Compressive Strength (MPa)Flexural Strength (MPa)Porosity (%)
M0.6_60:4023.3574701.80.651.0
M0.6_70:3023.6564351.40.547.8
M0.6_80:2023.857N/A 1N/A 1N/A 1N/A 1
M0.7_60:4023.8604091.10.641.4
M0.7_70:3023.8605062.10.946.1
M0.7_80:2023.5583690.70.547.2
M0.8_60:4023.8574571.60.739.0
M0.8_70:3023.3564932.00.846.8
M0.8_80:2023.8574952.10.845.2
M0.9_60:4023.2574833.00.541.0
M0.9_70:3023.5564812.00.737.9
M0.9_80:2023.5564761.60.332.2
1 N/A due to demolding issues.
Disclaimer/Publisher’s Note: The statements, opinions and data contained in all publications are solely those of the individual author(s) and contributor(s) and not of MDPI and/or the editor(s). MDPI and/or the editor(s) disclaim responsibility for any injury to people or property resulting from any ideas, methods, instructions or products referred to in the content.

