
Performance of the Food Waste Recycling Law in Japan with Reference to SDG 12.3
1
Faculty of Regional Development, Taisho University, Tokyo 170-0001, Japan
2
Faculty of Liberal Arts, Teikyo University, Tokyo 192-0395, Japan
*
Author to whom correspondence should be addressed.
Recycling 2024, 9(1), 18; https://doi.org/10.3390/recycling9010018
Submission received: 3 December 2023
/
Revised: 10 January 2024
/
Accepted: 1 February 2024
/
Published: 8 February 2024
Abstract
:SDG target 12.3 calls for halving food waste in retail, food service, and households by 2030. The food waste index developed for this purpose includes parts attached to food that are usually removed intentionally (“unavoidable food waste”) and counts conversion into animal feed and utilisation as biomaterial as a means of reduction. In Japan, the “Food Waste Recycling Law”, which has been in effect since 2001, promotes the recycling of food waste generated from businesses, designating feed conversion as a top priority. On the other hand, based on the more recent “Food Loss Reduction Promotion Act” of 2019, the government is currently promoting reduction in avoidable food waste to meet the SDG target. Based on statistical sources and interviews with ministry officers, this paper explains the history and achievements of Japan’s 23-year policy based on the Food Recycling Law, as well as the tension between the two legislations.
1. Introduction
1.1. Background: Targets and Policies for Food Waste Reduction in Japan
Adopted by the United Nations in 2015, the Sustainable Development Goals (“SDGs”) identify food loss and waste as key challenges in terms of achieving sustainable consumption, and Target 3 of Goal 12 (“SDG 12.3”) states that all countries should achieve “By 2030, halve global food waste per capita at the retailer and consumer level, and reduce food losses along the production and supply chain, including post-harvest losses” [1].
In Japan, it is understood that this applies to edible or avoidable food waste, which is defined as “food that could have been eaten (but is discarded)”, or “food or portions of food that are (physically) edible” [2]. The UK Waste and Resources Action Plan (WRAP) named this “avoidable food waste” [3]. The Japanese term for this is “Shokuhin Rosu”, which can be literally translated as “food loss”. To avoid terminological confusion, in this paper, “avoidable food waste” will be used in place of the Japanese “Shokuhin Rosu”, except in the name of the law, “Food Loss Reduction Promotion Act” (Shokuhin Rosu Sakugen Suishin Hoh), that actually promotes reductions in avoidable food waste [2].
We prefer to use “avoidable” rather than “edible” in a general context. The term “edible food waste” has a strong connotation of being physically edible (including parts that are physically edible but intentionally removed, or parts that are considered generally inedible, although they can be eaten depending on the person, condition, or on the way they are prepared), while “avoidable” does not ask for a change in food customs or a special effort to make the part ingestible. The detailed definition and classification of “edible” and “avoidable” are not discussed in this paper. Please refer to Okayama et al. [4], where the authors conducted another study on the classification of “avoidable food waste” to be reduced under SDG 12.3.
The Food Loss Reduction Promotion Act was enacted as act no. 19 of 2019 [2]. Since Japan imports a large amount of food and is dependent on imports for much of its food, the act states that reducing avoidable food waste is an issue that should be taken seriously, and that it is important to create and establish an awareness of not wasting food. The act also states that it is important to establish an awareness of the importance of not wasting food. It also encourages the public to direct “wasted food that can still be eaten” to human consumption as much as possible, including measures to provide it to those who do not have sufficient access to necessary food due to poverty, disasters, etc. In other words, the Food Loss Reduction Promotion Act aims to reduce or reuse avoidable food waste at the consumption level, rather than to recycle.
On the other hand, in December 2019, when the SDG 12.3 indicators were upgraded to Tier II (indicators with clear concepts, methods and criteria, but not yet with regularly published data) [5], it was stated that “food waste” to be reduced in the target includes inedible as well as edible parts, but a separate reporting of edible and inedible parts is encouraged and recommended. In addition, conversion into feed and material recycling, excluding composting, was considered as a reduction in food waste [6].
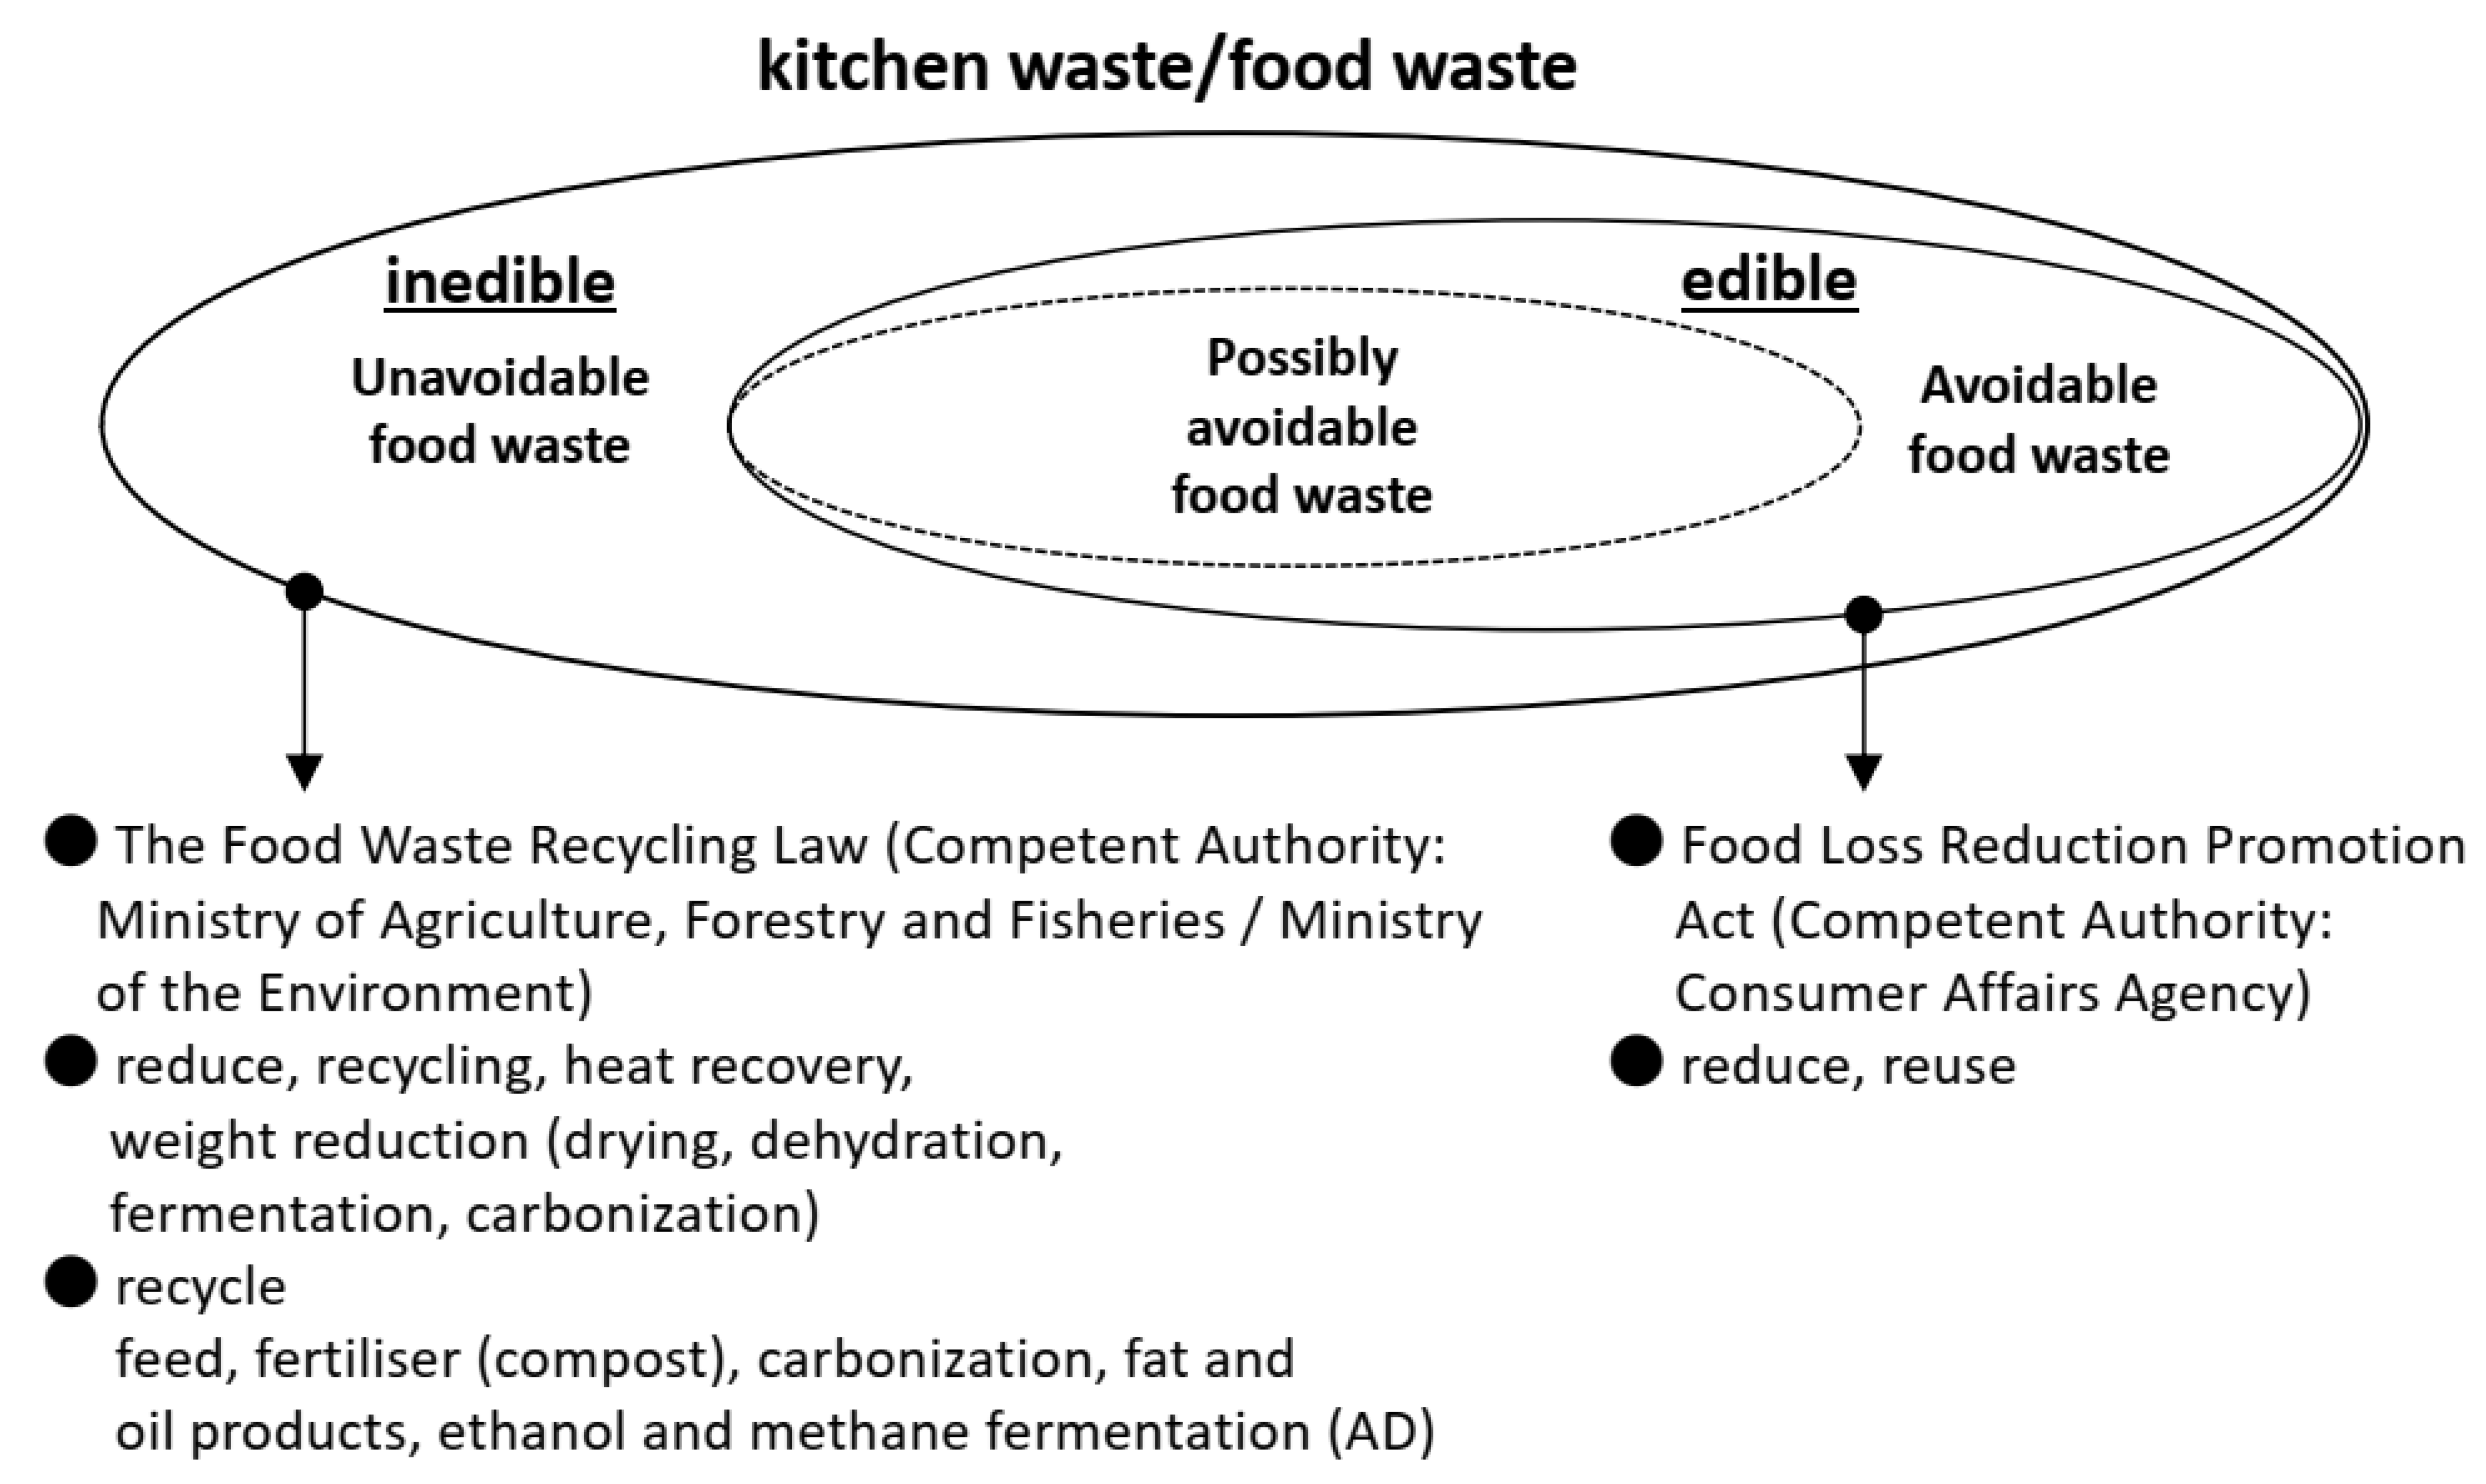
This approach is similar to the scheme of Japan’s Food Waste Recycling Law, which will be described later. Nevertheless, according to the Voluntary National Review (VNR) report of 2021 [7], which is a report on the progress in achieving the SDGs by each country, Japan focuses only on the evaluation of reductions in the waste of edible parts (reduction in generation) for SDG 12.3 [8]. Figure 1 shows the targets and measures for reduction in food waste and related laws and regulations in Japan.
Back in 2000, “The Law for Promotion of Recycling and Related Activities for the Treatment of Cyclical Food Resources” (i.e., “Food Waste Recycling Law”) was enacted (Act No. 116 of 2000) [9]. Here, “cyclical food resources” or “food waste” includes inedible as well as edible parts of food. The objective of this law is to promote the recycling of the large quantity of food waste generated by unsold or leftover food or as residues from the food-related businesses (manufacturing, distribution, food service, etc.), and to reduce the amount of food waste ultimately disposed of by controlling its generation and reducing its volume. The guidelines state that when recycling, priority should be given to feed conversion. This is because feed conversion is considered as the most effective way to utilize the components and calories of recyclable food resources, and also contributes to improving Japan’s self-sufficiency rate in terms of livestock feed.
In Japan, food self-sufficiency on a calorie supply basis is 37% (2018), which is by far the lowest among the seven industrialised countries [10], mainly due to the low self-sufficiency of livestock feed in particular. Therefore, in the Food Waste Recycling Law, while it recognises the waste hierarchy or the “3Rs”, prioritising source reduction and reuse, in moments where the first two options cannot be applied, food waste that is still generated (whether edible or inedible) is to be recycled, and conversion into feed is considered the highest priority.
As mentioned above, in SDGs’ food waste index (12.3.1b), it is stated that if food waste is converted into feed, the amount converted is considered to have been reduced and does not count as food waste. The Food Waste Recycling Law has already served a role in reaching this objective and can further contribute to achieving the target. However, the Food Loss Reduction Act, which took effect in October 2019 in response to SDG target 12.3, only promotes the 2Rs, i.e., reduce and reuse, and recycling is not considered as a means of reduction, even if the food is converted into animal feed. In other words, Japan has decided on a basic principle of 2Rs for all edible (avoidable and possibly avoidable) food waste at any stage of the food supply chain, including household, distribution, food service, and manufacturing.
1.2. Purpose of the Study
The content of the Food Waste Recycling Law has been reported in a small number of existing literature aimed at international readers [11,12,13]. In particular, Parry et al.’s [12] case study on Japan covers the amendments to the law up to 2014 and also notes the apparent discontinuity of outcome figures in 2007–2008. Liu et al. [13] conducted a crude analysis aggregating all business sectors using data between 2008 and 2013, pointed out eight unaddressed issues and challenges, such as the fact that waste from farms is not included, and posed questions on the food waste hierarchy. They also made policy suggestions on the broad issue, including food waste from households. There have been further changes in the situation since these studies were conducted, and the enactment of Food Waste Reduction Act in 2019 added new dimensions to be discussed.
This paper first clarifies the current status of Japan’s food supply and the amount of supply used for feed, explaining the current status of and government policy on Japan’s food self-sufficiency ratio. Following that, the history of Japan’s food recycling policy based on the Food Waste Recycling Law and its achievements by sectors and recycling methods will be explained, with a particular focus on “Ecofeed”, the feed conversion of food waste, which should be an important measure for improving Japan’s feed self-sufficiency rate.
In addition, we will clarify the discrepancy between the Food Loss Reduction Act and the Food Waste Recycling Law in terms of achieving SDG target 12.3 and suggest a role for the feed conversion of food waste in Japan, contributing to the achievement of SDG 12.3. The former legislation dealt with reduction in avoidable food waste at households and the final stages of the food supply chain, while the latter focused on recycling unavoidable food waste from food processing industries as well as large-scale retail and food services. As the remit of both legislations expanded, the authors identified potential overlap and conflict between the two.
2. Material and Method
2.1. Analysis of Secondary Data
Statistical data from the Ministry of Agriculture, Forestry and Fisheries (MAFF) were analysed. Based on Japan’s food balance sheet, which is put together and published each year [14], we will review the trends and actual conditions of domestic production, imports, and feedstuffs. The status and trends of food waste recycling based on the Food Waste Recycling Law will be analysed by collating annually published data from MAFF [15], which aggregates the periodic reports from food-related businesses as mandated by the law [16].
2.2. Interview with MAFF
We asked MAFF officers at a face-to-face meeting which took place on 21 August 2023 for details on the statistical data in Section 2.1, such as questions about definitions and methodologies for use on the indices and the aggregate results. This meeting was attended by three MAFF officers and lasted about 1.5 h. This was followed up by four round trips of correspondences via e-mail in the month of September, and another brief face-to-face meeting on 2 October, additionally at an occasion for another business.
3. Results and Discussion
3.1. Japan’s Food Self-Sufficiency Rate, Feed Self-Sufficiency Rate, Food Supply and Demand, and Supply for Feed
According to MAFF [17], food self-sufficiency rate is calculated on a calorie supply basis by dividing the caloric value of domestic food production (caloric value supplied by domestic food) by the caloric value of total domestic food supply (caloric value supplied by all food, including imported food). On the other hand, the self-sufficiency rate for livestock feed is based on TDN (total digestible nutrients) weight. The calorie-based self-sufficiency rate for livestock products is obtained by multiplying the domestic production rate by the self-sufficiency rate for the feed.
For example, in 2022, the feed self-sufficiency rate is 26% (6561 thousand TDN tons/25,003 thousand TDN tons); hence, food self-sufficiency on a calorie supply basis for beef is 13%, although 47% of beef is produced in Japan. The domestic caloric supply per capita per day is 850 kcal, and the total domestic caloric supply is 2260 kcal, and so Japan’s food self-sufficiency on a calorie supply basis is 38% (2022). The food self-sufficiency on a calorie supply basis allows for a strict evaluation of the portion that can be produced solely from domestically production (including feed), and thus enables an assessment of the state of food security in Japan.
Next, the current status of Japan’s food self-sufficiency ratio and the Japanese government’s goals regarding food self-sufficiency are explained. Based on the Basic Law on Food, Agriculture and Rural Areas (1999) [18], the Ministry of Agriculture, Forestry and Fisheries (MAFF) is mandated to formulate the Basic Plan for Food, Agriculture and Rural Areas, which sets targets for food self-sufficiency. The most recent basic plan was formulated in 2020. The overall food self-sufficiency on a calorie supply basis in 2018, the base year, was 37%; this is to be increased to 45% by the target year, 2030. In addition, the target self-sufficiency rate for feed is set to increase from 25% to 34%. In the previous plan, the self-sufficiency rate for feed was 26% in the base year of 2012, and the target set for 2020 was 38%. In reality, from 2012 to 2021, the self-sufficiency rate for feed stagnated at an average of 26%, with little change.
Feed is composed of roughage (coarse feed) such as grass, silage, and rice straw, as well as concentrated feed made from grains such as corn, barley, and rice. Concentrated feed includes “Ecofeed”, a term coined by MAFF, referring to feed converted from by-products of food production (e.g., residuals of soy from soy sauce or tofu production, residuals of distilled alcoholic drinks production), unsold food (bread, boxed lunch (bento), etc. that ended up not being eaten), and preparation residues (vegetable scraps and removed parts). The utilisation of farm leftovers (off-spec agricultural products, etc.) is also included in ecofeed [19].
The basic plan calls for 100% self-sufficiency in roughage by 2030, compared to 76% in 2020, and for 15% in concentrated feed by 2030, compared to 12% domestically produced in 2020. Under the previous plan, the goal was to increase the self-sufficiency rate for roughage from 76% in 2012 to 100% in 2020, and to increase that for domestic concentrated feed from 12% in 2012 to 19% in 2020. In addition to failing to meet the 2020 target, the 2030 target is set lower than the previous plan’s target.
Regarding ecofeed, in calculating the self-sufficiency rate of feed, MAFF takes into account the origin of its sources, meaning whether the residues, etc., used for ecofeed came from food that were produced domestically or imported. According to MAFF, the total production of ecofeed in 2020 was 1.08 million tons, of which 780,000 tons was made from food of imported origin, such as by-products of tofu (bean curd) made from imported soybeans and removed bread crusts produced when bread made from imported wheat is processed into sandwiches. The remaining 300,000 tons are estimated to have originated from domestically produced food, such as residues from fruit juice production using domestically grown fruits. Only the estimated domestic component of ecofeed is included in the self-sufficiency rate for feed.
In 2020, the supply of concentrated feed was 20.5 million tons, of which 12% or 2.46 million tons was considered domestic. The domestic component of ecofeed accounted for 300,000 tons, or 12% of domestic concentrated feed. The share of the domestic component of ecofeed in the supply of domestic concentrated feed was 12.9% on average from 2012 to 2021. This percentage has also remained flat and unchanged.
Figure 2 shows the trends of domestic production, imports, and supply for feed from Japan’s food balance sheet. The total length of the bar graph shows the total food supply, while the lower part shows domestic production. The upper part indicates the net import (difference between imports and exports). The line graph shows the amount of food supply that was destined as feed.
In 2020, food supply consisted of 53,553,000 tons of domestic production and 50,577,000 tons of net import. Of the total food supply, approximately 1/5 or 2,200,000 tons was destined for feed.
As can be seen from the graph, Japan’s food supply has been on a slight downward trend since FY 2008. After World War II, the total population of Japan continued to increase and exceeded 100 million for the first time in 1967, but began to decline after 2006/2007, when it reached 127.77 million [20]. Thus, as Japan’s population has been declining since 2008, it is only natural that the supply and demand for food have also declined. Food supply has continued to decline slightly from 110 million tons, and the supply for feed for livestock production has remained flat at about 20 million tons.
In Japan, the target for food self-sufficiency on a calorie supply basis has been set at a little less than 50%, but since 2000 it has remained flat at about 40% or less and has not risen at all. In order to achieve the food self-sufficiency target, it is essential to increase the production of domestically produced feed. If they were to achieve this goal, it is necessary to increase the production of domestically produced wheat and soybeans and reduce the relative share of imported food. It has been often said simply that the promotion of ecofeed will improve the self-sufficiency rate, but even with ecofeed, there will be no increase in the domestic component of feed without an increase in originally domestic sources in the overall food supply. It is understandable that ecofeed cannot be regarded as domestically sourced, as the majority of the origin of utilised food waste is imported food. The conversion of food waste into animal feed certainly contributes to food security. Hence, the development of an indicator that reflects both the efforts of increasing domestic food production as well as recovering food waste back into the food supply system may be useful in promoting utilisation of food waste as feed from the perspective of food security.
3.2. Trends in Food Waste Recycling under the Food Waste Recycling Law
The Food Waste Recycling Law was enacted in 2000 and became effective in 2001. Its purpose is to promote food waste reduction and recycling, as mentioned in Section 1. When the Food Waste Recycling Law was first enacted, it was mandatory for only large generators of food waste to recycle food waste. The recycling mandate was imposed on the food manufacturing, food wholesale, food retail, and food service sectors. Food waste generated from households is not subject to this requirement. In Japan, food waste from food manufacturers is classified as industrial waste, while food waste from wholesalers, retailers, distributors, and restaurants is classified as municipal solid waste (commercial waste). The generator of industrial waste must arrange for recycling or disposal by itself, while the municipality handles the treatment and disposal of commercial waste. Generators of commercial waste bear the fees set by the municipality, but these fees are often subsidised (not covering the full cost of disposal) and lower than what food waste recyclers would charge. In other words, there is little financial incentive for commercial waste generators to recycle food waste.
The Food Waste Recycling Law has been amended four times to date, with the first amendment in 2007 including small- and medium-sized food businesses as subject to the promotion of food waste recycling. At the same time, the method for estimating the amount of food waste was improved. Until 2007, the survey sample for food wholesalers and food retailers was stratified by employee size. In fact, the relationship between the amount of food waste generated and the number of employees is low, and because of the skewed sample there was an overestimation of food waste generation in these sectors.
The 2007 revision mandated periodic reporting from food-related businesses that generate 100 tons or more of food waste per year [16]. As a result, the estimated amount of food waste generated in the wholesale and retail sectors have decreased significantly since 2008, while in the manufacturing industry it has doubled. Because there are relatively few large businesses in the food service sector, the estimates on the amount of food waste remained the same before and after the law was revised. Although the Food Waste Recycling Law is in its 23rd year now in 2023, only data from after 2008 can be regarded reliable. Therefore, this paper also examines mainly the data from 2008 onwards.
The next revision was in 2010, when the scope of waste to be recycled was again expanded to include food waste from hotels and other food waste generated at event venues. The 2015 amendment set target rates for avoidance of final disposal, which includes measures such as de-watering, drying, energy recovery, as well as recycling. The target figures were 60% for large food waste generators and 50% for small- and medium-sized food businesses. In the 2020 revision, the target rates were raised, being set at 70% for large food waste generators and a 60% target for small- and medium-sized businesses. By industry sector, the targets were set at 95% for food manufacturers (same as 2015), 75% for food wholesalers (+5%), 60% for food retailers (+5%), and 50% for food service (same as 2015), these are to be achieved by 2024.
The 2020 revision also placed particular emphasis on reducing the edible portion of food waste, setting a target of halving the amount of edible waste by 2030 compared to the 2000 level. However, since it is difficult for businesses to separately measure edible and inedible parts of food waste, the amount of food waste generated and recycled is reported as a whole, as it has been in the past. The development of legislation is summarised as a timeline in Table 1.
Some of the parts that are considered as avoidable (edible) food waste are not easy to avoid. For example, in tofu production, “tofu pulp” is generated. Tofu is made by adding coagulation minerals (bittern) to soymilk, which is the liquid made by grinding soybeans into small pieces and squeezing them after boiling. The residue left after squeezing the soymilk is the tofu pulp. Traditionally, this tofu pulp is destined for human consumption as “okara” (also known as “unohana”). It is made into a dish by cooking it with vegetables in broth or soy sauce. Since tofu pulp can be processed for human consumption, it is categorised as avoidable (edible) food waste and is subject to reduction. As tofu pulp is a by-product of tofu production, it is not possible to reduce its generation other than by reducing the production of tofu itself. Given the current quantity of tofu production, the supply of tofu pulp by far exceeds the demand for it to be used as an okara dish. In theory, tofu producers should try as much as possible to have the tofu pulp consumed by humans, and only when that is not possible should they utilise it as animal feed. However, due to a lack of demand, it is not practical for many producers to pursue the human consumption route. It is worthwhile putting in efforts to develop new technologies and systems to process such by-products into food and utilise them for human consumption, for example, converting tofu pulp into ingredients for soy-based meat, while at this moment it appears that recycling into feed is the most practicable option we can promote.
In the guidelines, it is also suggested that producers should redirect returned items (rejected or unsold) to human consumption as food. For some items with a longer shelf life, this may be possible, but in many cases, such as the case of tofu, by the time the product is returned to the producer it will be deemed unfit for human consumption, and thus this is also prohibitively difficult to implement.
Figure 3 shows the amount of food waste generated by sector [15]. It shows clearly that the amount of food waste generated by the food manufacturing industry is by far the largest. The amount of food waste has been decreasing since 2008. This partly reflects the fact that food supply itself has been in decline in the same period. Although not shown in Figure 3, households generate the second largest amount of food waste after the manufacturing sector.
Figure 4 shows the situation, including household food waste in 2020. It shows that there is a sizeable amount of household food waste generated. However, since the Food Recycling Law only targets businesses, almost all of the food waste generated by households is incinerated. Some cities, such as Nagaoka, Toyohashi, and Machida, generate electricity by anaerobically digesting municipal food waste and using the resulting biogas. There are also several towns that conduct the separate collection of food waste and utilise it as compost. These are all small municipalities with 1000 to 30,000 residents. As a result, household food waste recycling has made little progress on a national scale.
How do these figures from Japan compare with other countries in the world? International comparison of food waste generation is very difficult as definitions of food waste differ from country to country. Figures vary drastically even within Europe, even though a good effort on harmonisation is made by the leadership of the EU. For example, the percentage of food waste from the industry sector spans from 3% (Norway and Croatia) to 64% (Belgium) [22]. It appears that, in countries that indicate a low percentage from the industry, food residues that are converted into feed are regarded as by-products and not waste. Food processing industries in Sweden produce only 5% of total food waste in the country [23], and the figure for feed conversion of food waste is negligibly small [24], while in Belgium utilisation as animal feed (43%) tops the list of valorisation options [25].
In Japan, there was a debate as to whether the abovementioned “okara” (tofu pulp) should be regarded as food waste and be subject to waste management regulations or not. In the end, the debate was brought to the Supreme Court, and the decision was that, given the manner in which okara is currently handled in society, okara should be counted as waste [26]. This verdict is regarded as establishing the prevalent criteria for the definition of “waste” in Japan [27]. The conditions for food residues to be qualified as by-products in Japan are rather strict, and it could be assumed that Japan’s current definition of food waste must be similar to that of Belgium in this aspect.
Figure 5 shows the amount of food waste by type of recycling as well as that was not utilised. The most common recycling method is conversion into feed, followed by composting. However, even though the amount of non-utilised food waste is also decreasing, it still accounts for 28.9% of the total amount generated in 2021, and the recycling rate for all businesses is 71.9%.
Figure 6 and the following illustlations show the breakdown of recycling by business type. The food manufacturing industry has the dominant share in total food waste generation, and following the general trend, it has also been gradually decreasing since 2008. The total of all recycling methods reached 80% in 2009 and the implementation rate of reduction, recycling, and energy recovery, etc., in the manufacturing industry has constantly achieved the target value of 95% since 2011 [15]. In 2021, 62.3% of manufacturers’ food waste generation was converted into feed. Of the total amount recycled, 78.8% was recycled as feed. As food waste from the food manufacturing industry is discharged in a sizeable batch, has almost no impurities, and has a consistent composition, it could be said that it is suitable for feed conversion.
From Figure 7, it can be observed that the manufacturing sector is the dominant source of food waste converted into feed. The amount of feed recycling has been decreasing along with the amount of food waste generated. The food retail sector also conducts feed recycling, although in terms of volume it is much smaller than the manufacturing sector. The manufacturing sector has already achieved food waste recovery into feed to a fair extent, and it is worth pursuing the potential of sources other than those in the manufacturing sector for recycling as feed, although it may appear negligible at the moment. This will be investigated further in the sections below.
Figure 8 shows the performance of the food retail sector by recycling method. Looking at the period since 2008, the amount of food waste from retailer has remained almost flat, although there was a slight downward trend from about 1.3 million tons in 2008 to 1.1 million tons in 2021. In 2021, the recycling rate was 39.2%. The ministry estimates that the retail sector has directed 56% of food waste to reduction, recycling, and energy recovery [15]. Although the top priority is to reduce the amount of waste generated, further recycling efforts are needed as well to achieve the goal of 60% by 2024. Of the total volume of recycling, feed and compost account for 38.7% and 29.1%, respectively.
In addition, the 2020 amendment to the law set a target for reduction in avoidable food waste. Based on the 2000 estimate of food waste generation, they estimated the amount of avoidable food waste, which was to be reduced by half by 2030. As mentioned earlier, the figures for the retail sector prior to 2007 are overestimated, and using those as a baseline figure is not appropriate. Because of this, at least on the basis of figures, the retail sector has by now already halved the amount of avoidable food waste nominally. However, this cannot be regarded as the result of the efforts by the retail industry. The baseline year for SDG targets is in principle 2015, aiming for achievement by 2030. The baseline year regarding food waste for the statutory reduction plans and policy making in Japan should reflect this, or at least be based on figures from after 2008.
Figure 9 shows the situation in the food service (catering and restaurant) sector. In the catering and restaurant sector, the progress in recycling has been relatively slow: it decreased from 2008 until the year of the big earthquake in 2011, and increased from then until the sector was hit by COVID-19. Note that the Tokyo Olympics were held in 2021, and that the excessively ordered lunch boxes (bento) and other avoidable food waste generated in relation to the Olympics were recycled as feed. Although the overall recycling rate was low, 52.6% of the food waste recycled was converted into feed in 2021.
From the above, it can be summarised that the food manufacturing industry is by far the largest recycler of feed in Japan. However, as feed recycling is designated the highest priority among the recycling methods, it is also the most widely implemented recycling method in both retail and food service sectors, although the amount is relatively small. The conversion of food waste into feed by the retail and food service sectors qualifies as a means of reducing avoidable food waste under SDG 12.3. Japan does not recognise feed recycling as a means of reduction, but since the current target of the Food Waste Recycling Law is to achieve 50% by reduction, recycling, or energy recovery by 2024, further recycling efforts, especially feed recycling, are desired.
As for recycling other than feed recycling, the status of composting is shown in Figure 10, anaerobic digestion (AD) is shown in Figure 11, and oil and fat recovery are shown in Figure 12.
Composting has been steadily implemented since 2008 as it is a relatively simple recycling method from a technical point of view. However, it has shown a decreasing trend since 2017. One issue with composting is that food waste is produced mostly in urban areas where the population is concentrated, while demand for compost is found largely in rural agricultural areas. The geographical supply and demand are not in balance, and the requirement of transport makes the operation costly. Furthermore, agricultural cooperatives (JA) sell synthetic fertilizers, but are reluctant to sell compost as a soil conditioner at a cheaper price. On the other hand, the consumption of agricultural products grown with compost made from local organic waste is a good example of circular material use in society that is easy to visualise and can be understood by the general public, raising their awareness, and there are some noteworthy initiatives that could be spread widely [28].
Biogas recovery by methane fermentation (anaerobic digestion) is often combined with power generation in Japan. This is because biogas from food waste is a renewable energy source, and the resulting electricity can be sold at a higher price under the feed-in tariff (FIT) system. Methane fermentation in the retail sector is on the rise.
Compared to other recycling methods, there is a higher share of oil and fat recovery by retailer and food service sectors. For example, butchers can sell residuals from meat production to reprocessors. Also, retailers and food service that provide deep-fried dishes such as tempura can sell their waste cooking oil, and these oils and fats are recycled into raw materials for a variety of products, from cosmetics to soap to fuel [29]. However, because they are traded as valuable resources (by-products), they may not be fully accounted for in the statistics on food waste generation.
3.3. Food Loss Reduction Promotion Act
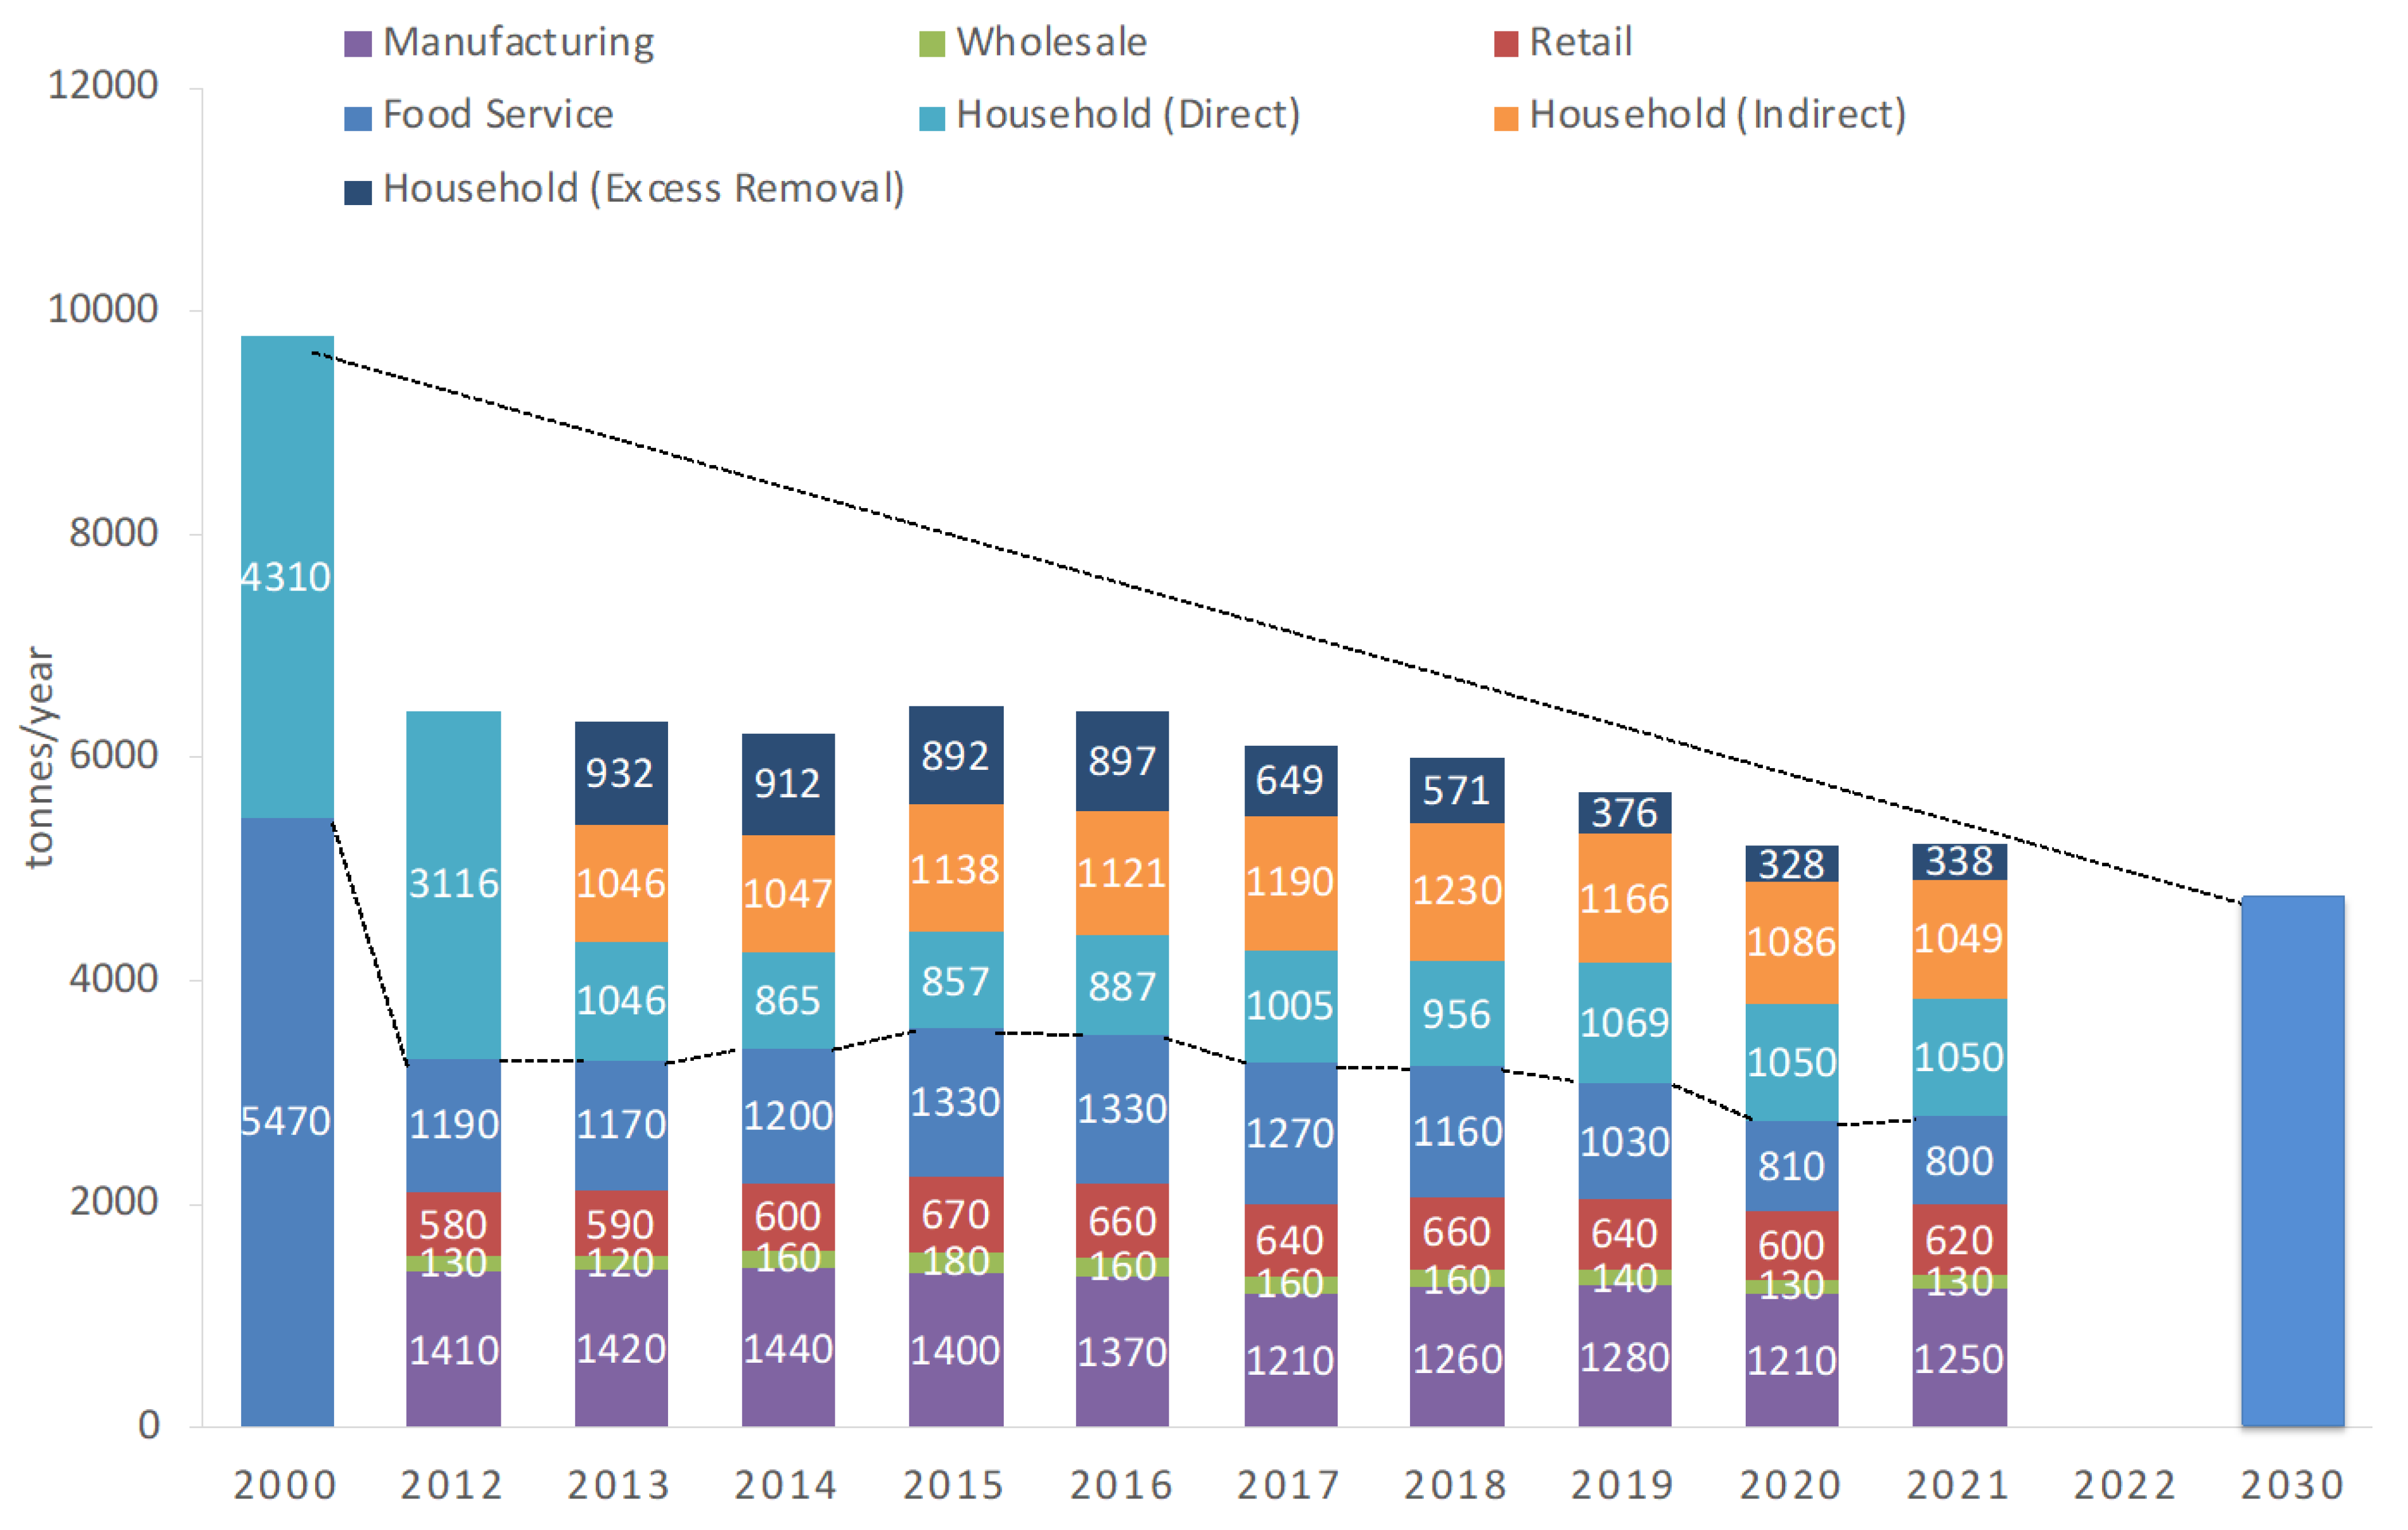
The upper part of the bar graph in Figure 13 shows the amount of avoidable food waste from households by category, and that from commercial sources is shown by sector in the lower part. Also, the estimated amount in 2000, the base year, as well as the target value for 2030 are shown. The Japanese authorities define avoidable food waste from households as comprising “direct disposal”, “excessive removal”, and “leftovers”. However, what is regarded as excessive removal may be edible, but they are parts that had been intentionally removed, and the authors do not consider this a priority component for the reduction target [30].
The objective of the Food Loss Reduction Act is to reduce by half the amount of avoidable food waste by 2030, not only in the household, retail, and food service sectors, but also at the manufacturing stage, based on the estimated figure for 2000. This reiterates that the waste hierarchy also applies under the Food Waste Recycling Act.
It is estimated that in the base year (2000), 5.47 million tons of avoidable food waste from commercial sources was generated [31], and 4.33 million tons was produced by households, adding up to a total of 9.8 million tons [32]. The goal is to halve this to 4.89 million tons (2.73 million tons from businesses and 2.16 million tons from households) by 2030. It should be noted that the amount of avoidable food waste in the base year for both commercial and household sectors is estimated on a pro rata basis from a questionnaire survey applied to a rather questionable estimation of total food waste generation, as mentioned earlier [15]. If we accept this baseline value, due to the subsequent trends in the amount of food waste generated (based on a revised method for estimation), as well as the projected decline of Japanese population, it is highly likely that the reduction target for the year 2030 can be met just by continuing “business as usual” (BAU).
We argue that there is potential to further reduce avoidable food waste, for example, by the possibility of extending the best before duration [33] or via an evolution of an accurate forecasting of consumers’ purchasing behaviour for efficient shelf stocking in retail. In the food service sector, avoidable food waste can be further reduced by providing clients with a choice of portion size and options to exclude unwanted ingredients, as well as encouraging them to take home leftovers of dishes that they cannot finish.
4. Conclusions
Japan’s policy is to halve the total amount of avoidable food waste by 2030, and in this sense, the Food Loss Reduction Act is considered to have primacy over the Food Recycling Law. However, SDG 12.3 does not call for a halving of food waste from the manufacturing or production sector, as it is categorised under food losses that are subject to reduction without a target percentage. Food waste (losses) from the manufacturing sector differ greatly from those from retail and food service sectors in terms of the amount and characteristics; therefore, a uniform 50% reduction across sectors may not be feasible.
Certainly, the government is proposing measures to reduce food waste in the manufacturing sector, which is always generated as quasi by-products, by improving the efficiency of the manufacturing process. However, for example, at the current stage it may be putting undue pressure on tofu manufacturers to process all tofu pulp for human consumption, as described in the previous section.
From the perspective of enhancing the security of food supply in Japan, it is important to increase the domestic supply of feed, along with food production for direct human consumption. The promotion of ecofeed is such a measure, although it does not contribute much to the calculated self-sufficiency rate (as the original food sources are imported).
Currently, the feed recycling rate in the manufacturing sector is already very high. In addition, the majority of raw materials for ecofeed come from the manufacturing industry. The manufacturing sector should continue to make efforts so that food waste that cannot be reduced is recycled into feed. This also contributes to the mandate for the food loss part in SDG 12.3, although it may not be apparent in the food loss index.
On the other hand, food waste from the wholesaler, retailer, and food service sectors are currently being collected and incinerated as municipal solid waste. Based on the Food Loss Reduction Act, these sectors should make efforts to reduce the generation of food waste. It is also worthwhile trying to reuse it by donating it to food banks, etc., as the government suggests [34]; however, such potential is limited, and the next step is to promote feed recycling. Given the current situation, where food waste is incinerated because it is cheaper for businesses to do so, the municipality should reduce subsidies and increase the fees for commercial waste to be nearer to the actual cost. This will remove the financial disincentive for businesses to recycle.
Finally, we would like to point out that another important problem is that no effective measures are being taken to promote the 3Rs with regard to household food waste. There is a need to improve the methodology in adequately grasping the actual situation of food wastage at households. The government has not clarified to what extent food waste is “avoidable” or “edible”, and it has not clearly indicated its priorities or concrete measures for reduction to the public. In order to halve the amount of avoidable food waste in Japan by 2030, it is essential to reduce avoidable food waste in households as well as from retail and food service. Not all avoidable food waste could be easily avoided, and there is also a large amount of unavoidable food waste. The second-best option is to collect food waste separately and promote some form of recycling, with priority given to feed recycling. We suggest that incineration of food waste, currently the most common method of disposing of municipal solid waste in Japan, should ultimately be minimised. The understanding of the current situation of food waste recycling in Japan, as analysed in this paper, would help to achieve this in all sectors, including the food processing, retail, and food service industries, as well as households.
Author Contributions
Conceptualization, T.O.; data curation and analyses, K.W.; writing—original draft preparation, T.O.; writing—review and editing, K.W.; visualization, K.W. All authors have read and agreed to the published version of the manuscript.
Funding
This research does not involve any specific external funding.
Data Availability Statement
Conflicts of Interest
The authors declare no conflicts of interest.
References
- United Nations. Sustainable Development Goals. Available online: https://www.un.org/sustainabledevelopment/sustainable-consumption-production/ (accessed on 1 December 2023).
- Consumer Affairs Agency. Shokuhin Rosu no Sakugen no Suishin ni Kansuru Houritsu (Food Loss Reduction Promotion Act) Article 2(2). Available online: https://www.caa.go.jp/policies/policy/consumer_policy/information/food_loss/promote/ (accessed on 1 December 2023).
- WRAP. Households Food and Drink Waste in the United Kingdom 2012; WRAP: Oxford, UK, 2013; ISBN 978-1-84405-458-9. [Google Scholar]
- Okayama, T.; Watanabe, K.; Yamakawa, H. Sorting Analysis of Household Food Waste-Development of a Methodology Compatible with the Aims of SDG 12.3. Sustainability 2021, 13, 8576. [Google Scholar] [CrossRef]
- United Nations Statistics Division. SDG Indicator Changes. Available online: https://unstats.un.org/sdgs/files/List%20of%20changes%20since%2015%20Oct%202018.pdf (accessed on 1 December 2023).
- United Nations Statistics Division. SDG Indicator Metadata. Available online: https://unstats.un.org/sdgs/metadata/files/Metadata-12-03-01B.pdf (accessed on 1 December 2023).
- Japan: Voluntary National Review 2021 Report on the Implementation of 2030 Agenda~Toward Achieving the SDGs in the Post-COVID19 Era. 2021. Available online: https://sustainabledevelopment.un.org/content/documents/28957210714_VNR_2021_Japan.pdf (accessed on 1 December 2023).
- Watanabe, K.; Okayama, T.; Yamakawa, H. SDG Shokuhin Haiki Shihyo (12.3.1(b)) no Kakkoku ni okeru Seibi Jokyo (The current status of SDG food waste index (12.3.1(b)) in various countries). In Proceedings of the Annual Conference of Japan Society of Material Cycles and Waste Management, Okayama, Japan, 25–27 October 2021; Volume 32, pp. 45–46. [Google Scholar]
- Ministry of the Environment. Law for Promotion of Recycling and Related Activities for the Treatment of Cyclical Food Resources (Food Waste Recycling Law). Available online: https://www.env.go.jp/content/900452890.pdf (accessed on 1 December 2023).
- Shimada, S.; Fujimori, H. Changes in Food Self-Sufficiency Rate in Japan from the Perspective of Food Mileage. In Proceedings of the 8th International Symposium on Affective Science and Engineering, Online, 27 March 2022. [Google Scholar] [CrossRef]
- Takata, M.; Fukushima, K.; Kino-Kimata, N.; Nagao, N.; Niwa, C.; Toda, T. The effects of recycling loops in food waste management in Japan: Based on the environmental and economic evaluation of food recycling. Sci. Total Environ. 2012, 432, 309–317. [Google Scholar] [CrossRef] [PubMed]
- Parry, A.; Bleazard, P.; Okawa, K. Preventing Food Waste: Case Studies of Japan and the United Kingdom. In OECD Food, Agriculture and Fisheries Papers; No. 76; OECD Publishing: Paris, France, 2015. [Google Scholar]
- Liu, C.; Hotta, Y.; Santo, A.; Hengesbaugh, M.; Watabe, A.; Totoki, Y.; Allen, D.; Bengtsson, M. Food waste in Japan: Trends, current practices and key challenges. J. Clean. Prod. 2016, 133, 557–564. [Google Scholar] [CrossRef]
- Ministry of Agriculture, Forestry and Fisheries (MAFF). Shokuryo Jyukyuhyo (Food Balance Sheets). 2023. Available online: https://www.maff.go.jp/j/zyukyu/fbs/ (accessed on 1 December 2023).
- MAFF. Shokuhin Haikibutsu nado no Nenkan Hasseiryo oyobi Shokuhin Junkan Shigen no Saisei Riyou nado Jisshiritsu ni tsuite (On the Generation of Food Waste and Recycling of Cyclical Food Resource). 2023. Available online: https://www.maff.go.jp/j/shokusan/recycle/syokuhin/kouhyou.html (accessed on 1 December 2023).
- Ministry of Agriculture, Forestry and Fisheries (MAFF). Guidelines for Measuring the Amount of Food Waste Generated and Food Waste Recycling Rate. 2023. Available online: https://www.maff.go.jp/e/policies/env/attach/pdf/frecycle-1.pdf (accessed on 1 December 2023).
- Ministry of Agriculture, Forestry and Fisheries (MAFF). Food Self-Sufficiency Rate and Food Self-Sufficiency Index for FY2022. 2023. Available online: https://www.maff.go.jp/j/press/kanbo/anpo/230807.html (accessed on 1 December 2023).
- MAFF. Basic Law for Food, Agriculture and Rural Areas. Available online: https://www.maff.go.jp/e/policies/law_plan/attach/pdf/basiclaw_agri-2.pdf (accessed on 1 December 2023).
- MAFF. The Situation Concerning Ecofeed. 2023. Available online: https://www.maff.go.jp/j/chikusan/sinko/lin/l_siryo/attach/pdf/ecofeed-152.pdf (accessed on 1 December 2023).
- Suzuki, T. The Latest Development in Population of Japan. Jpn. J. Popul. 2009, 8, 95–98. [Google Scholar]
- Ministry of the Environment. Reiwa 3 nendo Shokuhin Haikibutsu nado no Hassei Yokusei oyobi Saisei Riyou no Sokushin no Torikumi ni Kakawaru Jittai Chosa Houkokusho (Report on the Survey on Efforts to Reduce the Generation of Food Waste and Promote Its Recycling in FY2021). 2023. Available online: https://www.env.go.jp/content/000138640.pdf (accessed on 1 December 2023).
- Eurostat. Food Waste and Food Waste Prevention by NACE Rev. 2 Activity-Tonnes of Fresh Mass. 2023. Available online: https://ec.europa.eu/eurostat/databrowser/view/env_wasfw/default/table (accessed on 6 January 2024).
- Naturvårdsverket. Livsmedelsavfall i Sverige 2020. 2022. Available online: https://www.avfallsverige.se/media/1xaatarp/livsmedelsavfall-i-sverige-2020.pdf (accessed on 6 January 2024).
- Johansson, N. Why is biogas production and not food donation the Swedish political priority for food waste management? Environ. Sci. Policy 2021, 126, 60–64. [Google Scholar] [CrossRef]
- European Commission. EU Food Loss and Waste Prevention Hub-Member States Initiatives: Belgium. Available online: https://ec.europa.eu/food/safety/food_waste/eu-food-loss-waste-prevention-hub/eu-member-state-page/show/BE (accessed on 6 January 2024).
- Supreme Court of Japan. Compendium of Court Cases-Case 平成9(あ)105. 1999. Available online: https://www.courts.go.jp/app/hanrei_jp/detail2?id=50185 (accessed on 6 January 2024).
- Shibata Sougou Houritsu Jimusho (Shibata Integrated Law Office). Okara Jiken wo Shitteimasuka (Do You Know the “Okara Case”). 2023. Available online: https://shibatalaw-ginza.jp/shibatalaw.sakura.ne.jp/okara/ (accessed on 6 January 2024).
- Okayama, T. Shokuhin Haikibutsu no Chiiki Junkan Sisutemu Kouchiku wo Mezashita Torikumi (Case studies of establishing a local circular system for food waste). JATAFF Jpn. Assoc. Techno-Innov. Agric. For. Fish. J. 2020, 8, 38–44. [Google Scholar]
- MAFF. Yushi·Yushi Seihinka no Genjo (Current Status of Commercialisation of Fats, Oils and Grease). 2012. Available online: https://www.maff.go.jp/j/council/seisaku/syokusan/recycle/h24_01/pdf/doc2_2_rev.pdf (accessed on 1 December 2023).
- Okayama, T.; Yamakawa, H.; Watanabe, K. “Kajo Jokyo” wo Kateikei Shokuhin Rosu to Minasu Datousei no Kento (Examining the validity of considering “excessive removal” as household food waste. In Proceedings of the Annual Conference of Japan Society of Material Cycles and Waste Management, Okayama, Japan, 25–27 October 2021; Volume 32, pp. 41–42. [Google Scholar]
- MAFF. Shokuhin Rosuryo no Suii (Time Series of Avoidable Food Waste Quantity). 2023. Available online: https://www.maff.go.jp/j/press/shokuhin/recycle/attach/pdf/230609-1.pdf (accessed on 1 December 2023).
- Ministry of the Environment. Waga Kuni no Shokuhin Rosu Hasseiryo no Suii (Time Series of Avoidable Food Waste Generation in Japan). 2023. Available online: https://www.env.go.jp/content/000138776.pdf (accessed on 1 December 2023).
- Okayama, T.; Yamakawa, H.; Watanabe, K. Why do householders throw away edible food?-Results of a Questionnaire Survey in Tokyo. In Proceedings of the 18th International Waste Management and Landfill Symposium; CISA Publisher: Padova, Italy, 2021. [Google Scholar]
- Consumer Affairs Agency; MAFF; Ministry of the Environment; Children and Home Affairs Agency; Ministry of Justice; Ministry of Education; Culture, Sports, Science and Technology; Ministry of Health; Labour and Welfare; Ministry of Economy; et al. Shokuhin Rosu Sakugen Mokuhyo Tassei ni Muketa Sesaku Pakkeji (An) (Policy Package towards Reduction of Food Waste (Draft)). 2023. Available online: https://www.caa.go.jp/policies/policy/consumer_education/meeting_materials/assets/consumer_education_cms201_231222_004.pdf (accessed on 6 January 2024).
Figure 1.
Reduction targets and measures according to laws and regulations related to food waste in Japan.
Figure 1.
Reduction targets and measures according to laws and regulations related to food waste in Japan.

Figure 2.
Domestic production, imports, and supply for feed in Japan (source: food balance sheets [14]).
Figure 2.
Domestic production, imports, and supply for feed in Japan (source: food balance sheets [14]).

Figure 3.
Food waste generation by sector [15].
Figure 3.
Food waste generation by sector [15].

Figure 4.
Amount of food waste by industry, by recycling, and by avoidable food waste (2020) [21].
Figure 4.
Amount of food waste by industry, by recycling, and by avoidable food waste (2020) [21].

Figure 5.
Amount of food waste by type of recycling (source: [15]).
Figure 5.
Amount of food waste by type of recycling (source: [15]).

Figure 6.
Amount of food waste in food manufacturing by type of recycling (source: [15]).
Figure 6.
Amount of food waste in food manufacturing by type of recycling (source: [15]).

Figure 7.
Amount of feed recycling by sector (source: [15]).
Figure 7.
Amount of feed recycling by sector (source: [15]).

Figure 8.
Amount of food waste from the retail sector by type of recycling (source: [15]).
Figure 8.
Amount of food waste from the retail sector by type of recycling (source: [15]).

Figure 9.
Amount of food waste in food service by type of recycling (source: [15]).
Figure 9.
Amount of food waste in food service by type of recycling (source: [15]).

Figure 10.
Amount composted by sector (source: [15]).
Figure 10.
Amount composted by sector (source: [15]).

Figure 11.
Amount directed to methane recovery by sector (source: [15]).
Figure 11.
Amount directed to methane recovery by sector (source: [15]).

Figure 12.
Fat & oil recovery by sector (source: [15]).
Figure 12.
Fat & oil recovery by sector (source: [15]).


Table 1.
Timeline of events.
| Year | Statutory Instruments | Brief Content |
|---|---|---|
| 1999 | Basic Act on Food, Agriculture and Rural Areas | Mandates that ministry is to set plans on food security and revise them regularly. |
| 2001 | Food Waste Recycling Law | Enacted. Set targets on recycling rate for large businesses |
| 2007 | Food Waste Recycling Law, first revision | Inclusion of small- and medium-sized businesses in the revised target recycling rates. Mandates that large businesses report amounts of food waste generation and recycling. |
| 2010 | Food Waste Recycling Law, second revision | |
| 2015 | Basic Plan for Food, Agriculture and Rural Areas, revision | Targets including food self-sufficiency rate. |
| 2015 | Food Waste Recycling Law, third revision | Indication of adhering to food waste hierarchy. Targets for reduction introduced. Recycling rate targets raised. |
| 2015 | (UN) SDGs established | |
| 2019 | Food Loss Reduction Promotion Act | Encourages households to reduce edible food waste. |
| 2019 | (UN) Target 12.3.1a food waste index | Draft definitions/methodology finalised. |
| 2020 | Food Waste Recycling Law fourth revision | Reduction and Recycling targets raised 50% reduction in edible food waste reiterated. |
| 2020 | Basic Plan for Food, Agriculture and Rural Areas, revision | Target figures revised. |
Disclaimer/Publisher’s Note: The statements, opinions and data contained in all publications are solely those of the individual author(s) and contributor(s) and not of MDPI and/or the editor(s). MDPI and/or the editor(s) disclaim responsibility for any injury to people or property resulting from any ideas, methods, instructions or products referred to in the content. |
© 2024 by the authors. Licensee MDPI, Basel, Switzerland. This article is an open access article distributed under the terms and conditions of the Creative Commons Attribution (CC BY) license (https://creativecommons.org/licenses/by/4.0/).
Share and Cite
MDPI and ACS Style
Okayama, T.; Watanabe, K. Performance of the Food Waste Recycling Law in Japan with Reference to SDG 12.3. Recycling 2024, 9, 18. https://doi.org/10.3390/recycling9010018
AMA Style
Okayama T, Watanabe K. Performance of the Food Waste Recycling Law in Japan with Reference to SDG 12.3. Recycling. 2024; 9(1):18. https://doi.org/10.3390/recycling9010018
Chicago/Turabian StyleOkayama, Tomoko, and Kohei Watanabe. 2024. "Performance of the Food Waste Recycling Law in Japan with Reference to SDG 12.3" Recycling 9, no. 1: 18. https://doi.org/10.3390/recycling9010018