Abstract
Over the last several decades, the European Union (EU) has championed recycling and sustainable waste management through Directives 2008/98/EC and 2018/851, shaping practices across its member states. Currently, 30% of the EU’s municipal waste is recycled, 19% composted, 23% incinerated, and 23% landfilled. However, regional variations exist within the EU, with Greece and other Mediterranean/Balkan nations favoring landfilling, while Germany and other Western/Central EU nations prioritize recycling and composting, and Nordic countries lean toward incineration. To address these differences, a new sustainability point system was created in order to evaluate and compare all different municipal waste management strategies of EU members. Notably, countries like Germany, the Netherlands, and Sweden score the highest due to low municipal waste generation, high recycling rates (>35%), minimal landfilling (<1%), and significant incineration. In contrast, Cyprus, Malta, and Greece score lower due to landfill reliance and lower recycling rates. Therefore, this study introduces a novel sustainability point system to mitigate disparities, highlighting the need for targeted interventions and policy initiatives at the national and EU levels. By leveraging these insights, policymakers can allocate resources effectively, foster collaboration, and motivate citizens to achieve common environmental goals as well as the Sustainable Development Goals (SDGs).
1. Introduction—The EU Regulatory Recycling Framework
Over the last three decades, an extensive legislative and regulatory concept has been established for the recycling of important and valuable materials and sustainable solid waste management within the member states of the European Union (EU). This legislative concept dates from Directive 2008/98/EC, which establishes and requires a suitable waste hierarchy within the EU member states. This hierarchy contains five stages, which are presented in the following order of priority [1]:
- ⬤
- Prevention;
- ⬤
- Reuse;
- ⬤
- Recycling;
- ⬤
- Recovery for other purposes, such as energy production;
- ⬤
- Final disposal, landfilling.
Furthermore, the same directive sets specific quantitative recycling and recovery targets for the EU member states to achieve. Thus, they must be able to recycle and recover at least 50% of their municipal solid waste (MSW) and at least 70% of their Excavation, Construction, and Demolition Waste (ECDW) by 2020. Additionally, the directive clearly describes the distinction between various waste streams, along with their byproducts. Finally, it is worth mentioning that Directive 2008/98/EC had to be implemented within all EU countries by 12 December 2010 [1].
Subsequently, within the framework of the measures package for a circular economy, Directive 2018/851 was enacted, which is an amendment to Directive 2008/98/EC. Notably, it lays the groundwork for the EU territory to achieve the United Nations Sustainable Development Goal of a 50% global per capita food waste reduction at the retail and consumer levels and reducing food losses throughout the production and supply chain by 2030. At the same time, Directive 2018/851 defines new recycling targets for MSW in the EU member states. Specifically, the following recycling targets are applied within all EU member states [2]:
- ⬤
- By 2025, at least 55% of each EU country’s MSW by weight should be recycled;
- ⬤
- By 2030, at least 60% of each EU country’s MSW by weight should be recycled;
- ⬤
- By 2035, at least 65% of each EU country’s MSW by weight should be recycled.
The same directive stipulates that EU member states should establish the separate collection of textile waste and hazardous products from households no later than 1 January 2025. In addition, this directive obliges households to ensure that their produced organic waste is collected separately or recycled at the source (e.g., by composting) no later than 31 December 2023. Finally, this directive presents incentive examples for EU members in order to achieve the key goal of their waste hierarchy. Some typical incentive examples are the introduction of landfill and incineration charges as well as the implementation of programs based on “the polluter pays” and “pay as you throw” principles. Directive 2018/851 should have been implemented by all EU countries no later than 5 July 2020 [2].
The following studies have addressed the main sustainability viewpoints of waste management, including GHG emissions, monetary costs and benefits, the number of jobs created, control of the increasing amount of fiber-reinforced polymer (FRP) waste, and end-of-life (EoL) products or manufacturing rejects, all of which are jointly conveyed in alignment with the issues of current legislation, recycling techniques, and end-use applications for recyclates [3,4]. Other waste matters related to recycling are recycled glass waste [5], municipal waste recycling practices in European countries [6,7,8], and the pivotal role of the Internet of Things (IoT) in regional energy transition [9], especially in countries that are urgently seeking to transform their energy systems and overcome their technological lock-ins, paving the way for a net-zero emission economy in the short and medium run in the future.
It is noteworthy that the EU’s regulatory challenges and strategies regarding recycling underscore an increasing trend toward replacing conventional fossil-based plastics with bio-based alternatives. The production of plastics partly or fully made from biomass is rapidly expanding [10]. While bio-based and biodegradable plastics currently hold a very small market share, accounting for approximately only 1% of all plastics produced, forecasts for global bioplastics production capacities predict an increase from approximately 2.417 million tonnes in 2021 to approximately 7.593 million tonnes in 2026, more than three times the current capacity. This necessitates an assessment of the challenges and barriers for bio-based and biodegradable plastics for waste management and an evaluation of the effectiveness of current plastic waste management strategies for the efficient handling of bio-based and biodegradable plastics. Macroeconomic, regulatory, technological, and social factors are among the prevailing barriers and determinants of the biodegradable and biodegradable plastics market. In this context, bio-based and biodegradable plastics must be separately collected and treated under mostly controlled, regulated conditions. However, there are no legal provisions or waste management strategies in place to implement such separate collection of bio-based plastics, leading to their disposal with hazardous waste, conventional plastics, or municipal waste. Therefore, the effective waste management of bio-based and biodegradable plastics requires good performance at each step of the waste management process, including the realistic coordination between a harmonized waste collection infrastructure and the effective sorting of bio-based plastic waste [10].
Another challenging aspect of recycling is the management of batteries. With the growing interest in clean energy production and the adoption of zero-carbon-emission procedures and technologies, it becomes crucial to explore environmentally sustainable options for end-of-life batteries, especially within Europe. From a macroeconomic perspective, forecasts indicate a significant increase in battery waste, with a focus on recycling black mass (BM)—a complex and hazardous byproduct of the battery recycling process. Studies highlight the urgent need for a definitive legislative classification of BM’s hazardous properties (HPs) to align with European regulations. A comprehensive examination of BM’s HPs is essential for industry stakeholders and guiding future developments in this field. In addition to introducing innovative technologies and strategies to improve recycling efficiency and reduce associated risks, it is vital to identify and classify the inherently hazardous nature of BM according to preset classifications of hazardous materials, such as the “HP3—Flammable” category. Therefore, the regulatory framework for waste management in Europe must comply with the stringent management protocols and robust regulatory frameworks necessary to address the growing challenge of various types of waste in Europe [11].
Another emerging concern in waste management legislation is the development of an analytical operational framework for new products, alongside remanufactured products. This includes characterizing existing and proposed forms of e-waste legislation and comparing their environmental and economic performance. This integrated approach highlights policymakers’ intentions to provide additional incentives for product reuse, but it also reveals that these incentives lead to improved environmental outcomes only for a limited range of products. From an environmental perspective, it has been demonstrated that the Recast versions of policies are consistently dominated either by the original policy or by one advocating a separate target for product reuse. Furthermore, it has been shown that the benefits of a separate reuse target scheme can be fully replicated with the assistance of fiscal levers. In conclusion, it can be inferred that there cannot be a single best environmental policy suitable for all products. Instead, each product requires the identification of the most appropriate policy tool, which can be achieved through the implementation of different policies for each product category or through product-based target levels [12,13].
In the relevant literature, another challenging issue in investigating waste management in Europe involves promoting European cultural policies in line with the Sustainable Development Goals (SDGs). According to this principle, waste management can be considered a core contributor to sustainable development in Europe, playing a guiding role in achieving cultural sustainability. Therefore, it is important to determine how institutional communication can contribute to introducing sustainable development and, specifically, the SDGs into the definition of European Union cultural policies [14]. Several experts in EU cultural policies surveyed in this study argued that the SDGs need to be explicitly included in cultural policies, adding a more practical perspective through specific projects and action plans. Institutional communication can also be considered a strategic factor for the success of sustainable development, particularly in promoting cultural policies and achieving cultural sustainability in the European Union [14]. It is evident that, while EU directives are important, they are not sufficient without their connection to broader sustainability goals, such as those of the UN SDGs. Therefore, linking EU waste management directives to specific SDGs can better demonstrate synergies with global sustainability efforts, a challenging area that has been scarcely investigated in the relevant scientific literature. All of the studies above promoted realistic current and impending EU frameworks on waste management, in which clear targets are set with concrete measures to ensure effective implementation; landfill and incineration will be progressively unavailable as traditional end-points for this kind of waste. For this, contemporary research is targeting high volumes of recycling, in line with EU targets, followed by a gradual phase-out of waste incineration as an environmentally detrimental waste management option globally [15]. The adoption and development of technological synergies can also support the protection of the environment [16], the creation of new jobs, and energy poverty management and alleviation [17]. The ultimate goal of all legislative and regulatory frameworks and programs of waste management is the path to sustainability [18,19].
The scope of this study is the presentation of the current municipal waste treatment and management situation within the European Union, coupled with an experimental approach to comparing and evaluating the overall municipal waste management strategies of each EU member state through the use of a newly created common sustainability point system that is based on Directive 2008/98/EC.
2. Literature Review
Municipal solid waste management (SWM) is an essential component of public health and sanitation mandated for urban local bodies (ULBs) across all districts [20]. Research in the relevant literature has sought to assess the current challenges in solid waste management. These studies have scrutinized adopted strategies using both primary and secondary data sources, revealing significant challenges, such as financial constraints, inadequate infrastructure, and inefficient waste management policies. Recommendations from this research focus on measures to address these challenges and develop sustainable SWM plans [20].
In the context of international case studies, an overview of municipal solid waste management (MSWM) by local authorities in Kenya provides insight into challenges faced by low-income developing countries. Approaches to improving municipal solid waste (MSW) services are discussed in light of poor economic growth and a high poverty level, which currently stands at 56%. Factors such as rural-to-urban migration and political interference have led to unplanned settlements in suburban areas, accommodating approximately 60% of the urban population on only 5% of the urban land area. This has resulted in environmental vulnerabilities, including the pollution of surface and groundwater due to inadequate consideration of environmental impacts in siting MSW disposal sites. Illegal dumping of MSW on river banks or roadsides is also prevalent. Therefore, reliable and credible funding is essential for optimizing MSW disposal services and improving the rural economy by managing rural–urban migration. The involvement of stakeholders, including private-owned non-governmental organizations (NGOs) and the private sector, can support meaningful and sustainable MSWM improvements [21].
In Lobatse, Botswana, a case study highlighted residents’ lack of confidence in available waste management facilities and their reluctance to pay for waste collection or participate in domestic waste management activities without compensation. To address this, socio-economic recommendations suggest the development of public education campaigns to promote sustainable domestic waste management behavior [22].
Similarly, in Indian cities, efficient waste management is crucial for maintaining a clean and sustainable environment. However, challenges arise in implementing Information and Communication Technologies (ICTs) and the Internet of Things (IoT) in waste management. The identification of optimal municipal waste management (MWM) alternatives relies on economic, technical, environmental, and social criteria. A proposed system offers enhanced operational efficiency for municipalities and significant environmental and social benefits, including waste reduction, improved public health, and increased community engagement. Notably, the IoT-based system demonstrates higher sensitivity to cost changes, highlighting its adaptability to economic considerations. This insight supports decision-makers in prioritizing cost-efficient waste management solutions [23].
In many developing and fast-emerging economies, solid waste management practices are implemented reluctantly by stakeholders, with low rates and efficiency. A substantial gap in the solid waste management system lies in confusion surrounding waste collection activities, evidenced by overloaded street bins and financial losses for the management system due to stakeholder non-compliance with collection regulations. Other challenges include waste mixing by collection crews after separation has occurred at the sources and inappropriate collection times and methods, hindering stakeholder cooperation and impeding the improvement of solid waste management systems in both urban and tourism destinations toward sustainability [24].
Gaps in illegal dumping and economic restrictions are particularly evident in the management of hospital waste. In a case study of Tabriz in northwest Iran, although almost all hospitals have a waste management officer, there is a lack of effective training programs for staff. Infectious/hazardous medical waste is often mixed with general waste and disposed of in municipal landfills, posing sanitary concerns. Additionally, the illegal segregation and recycling of medical waste may occur at final disposal sites, raising worries about environmental pollution and the transmission of infectious diseases. Increasing budgets, implementing integrated segregation, minimizing waste, and establishing training programs in hospitals could reduce medical waste by approximately 70.11%. On-site incineration in Tabriz and other large cities in Iran has been unsuccessful, highlighting the need to amend Iran’s hazardous waste regulations to send infectious/hazardous waste to a central off-site autoclave or incinerator for treatment while also reducing air pollution [25].
In Asian case studies, there is a growing awareness of the need for stricter controls on the handling and disposal of waste generated by healthcare facilities [26]. Healthcare waste management in hospitals requires a comprehensive framework to address handling practices, occupational safety, waste management policy implementation, and other pertinent issues. In developing economies, the existing healthcare waste management systems need immediate attention and improvement, particularly in medical waste management practices, national regulatory frameworks, internal management systems, personnel training programs, waste quantity estimation, appropriate disposal techniques, and inspection programs to identify problems and new issues [26].
Waste management is considered an environmental public service, and applying appropriate technology can enhance its performance, especially in developing economies experiencing challenges with ineffective waste management services [27]. Success factors to overcome technological gaps along the management chain should be identified, and the implications of these challenges should be addressed with feasible solutions [27].
Another critical aspect of waste management in developing economies is e-waste management, which is further explored in the analysis. A novel automatic e-waste management system has been proposed, designed, and implemented using machine learning algorithms. Traditional waste management systems (WMSs) are manual and have been enhanced with an IoT sensor-based alert system. This system notifies relevant personnel of waste overflow for immediate action. However, WMSs still face limitations in efficiency in terms of time and cost and lack specific provisions for disposing of or recycling e-wastes. The rise in electronic device usage, including laptops, monitors, mobiles, headphones, and tablets, has led to increased e-waste generation due to the depreciation in their value and use. Various e-waste management systems have historically been developed to optimize e-waste utilization and handling. By leveraging deep learning algorithms, such as CNNs, better classification and prediction accuracy for e-waste management systems can be achieved. A deep learning model utilizing CNN algorithms for feature extraction was proposed, and the extracted features were modeled to enhance accuracy. Additionally, an open-source dataset was used to validate the proposed system, demonstrating its ability to achieve a high prediction accuracy of e-waste (up to 96%) [28].
2.1. EU’s Recent Recorded Recycling Rates and Amounts
Currently, the MSW recycling rate is constantly increasing in all 27 EU member states. This reality reveals continuous progress in the reuse and recovery of generated waste—as valuable resources and raw materials—and, consequently, the growing interest of all EU countries in adopting the sustainable circular economy model. According to the official websites of the European Commission and the European Environment Agency, the overall recycling rate in the EU territory ranges between 46 and 49% of the total annual generated amount of EU MSW (including composting). In addition, each of these municipal waste streams presents specific and differentiated recycling rates. In the EU, packaging waste is recycled at a rate of 64%, Waste Electrical and Electronic Equipment (WEEE) at a rate of 39%, and municipal waste at a rate of almost 49%. Figure 1 below shows the recycling rates of some basic waste streams as they evolved over time [18,19].
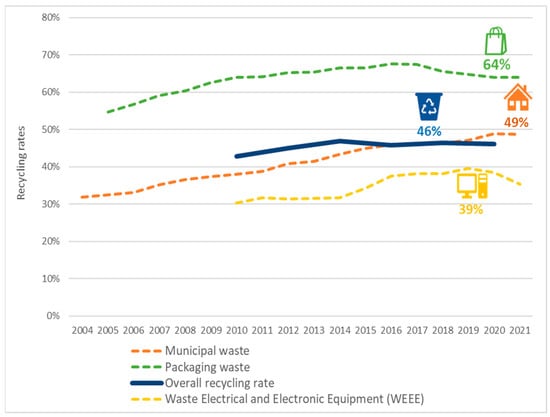
Figure 1.
Recycling rates in EU by waste stream [19].
Figure 1 shows that EU countries have significantly increased their packaging and municipal waste recycling rates from 2005 and 2004, respectively, to date. This reality presents their willingness to improve their environmental performance in terms of waste management. Table 1 shows the overall ranking of all 27 EU member states based on their municipal waste recycling rates by weight. Its double lines express the recycling target of 50% for the year 2020, 55% for 2025, and 60% for 2030 (from bottom to top). Notably, there are large recycling rate deviations from one EU member state to another. For example, Germany recycled 69.1% of all its annually produced MSW in 2022, while Romania recycled only 12.1% of all its annually produced MSW in the same year (Table 1). Furthermore, out of all EU members, only eight countries managed to fulfill the recycling target of at least 50% of their annually generated MSW by weight by the year 2020. These countries are Germany, Slovenia, Austria, the Netherlands, Luxembourg, Belgium, Denmark, and Italy, in a descending recycling rate order (Table 1). On the contrary, the recycling rates of Greece, Cyprus, Malta, and Romania do not exceed 20% of all their generated MSW (Table 1). All other EU countries have recycling rates between 20% and 50%. Therefore, they did not meet the original goal described by Directive 2008/98/EC of at least 50% of their annually generated municipal waste by weight by the year 2020 (Table 1) [19,29].

Table 1.
Most recent recorded municipal waste recycling rates in each EU member state [29].
Furthermore, Table 2 and Table 3 rank EU countries according to their per capita municipal waste production (in kilograms) and their total generated municipal waste amounts (in thousands of tonnes), respectively. Additionally, Table 4 ranks EU members by their total recycled municipal waste amount (in thousands of tonnes), listing each member state’s contribution to the overall EU municipal waste recycling percentage in its last column. In all of the aforementioned tables, EU countries are colored in a color range from deep dark green to red according to their recycling performance, as shown in Table 1. Lastly, Figure 2 presents a separate graph with the member states’ contributions to the total amount of recycled municipal waste in the EU [29,30].
Table 2.
Most recent recorded municipal waste production amount per capita (in kilograms) in each EU member state [30].
Table 3.
Most recent recorded (2022–2023) total generated municipal waste amount (in thousands of tonnes) in each EU member state [30,31].
Table 4.
Most recent recorded (2022–2023) total recycled municipal waste amounts (in thousands of tonnes) in each EU member state and each member state’s contribution to overall EU municipal waste recycling percentage [29,30,31].
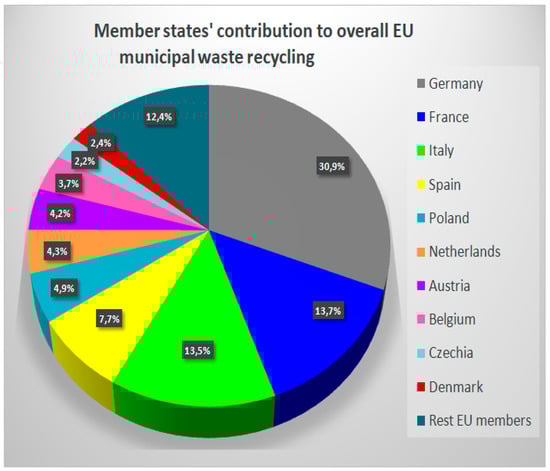
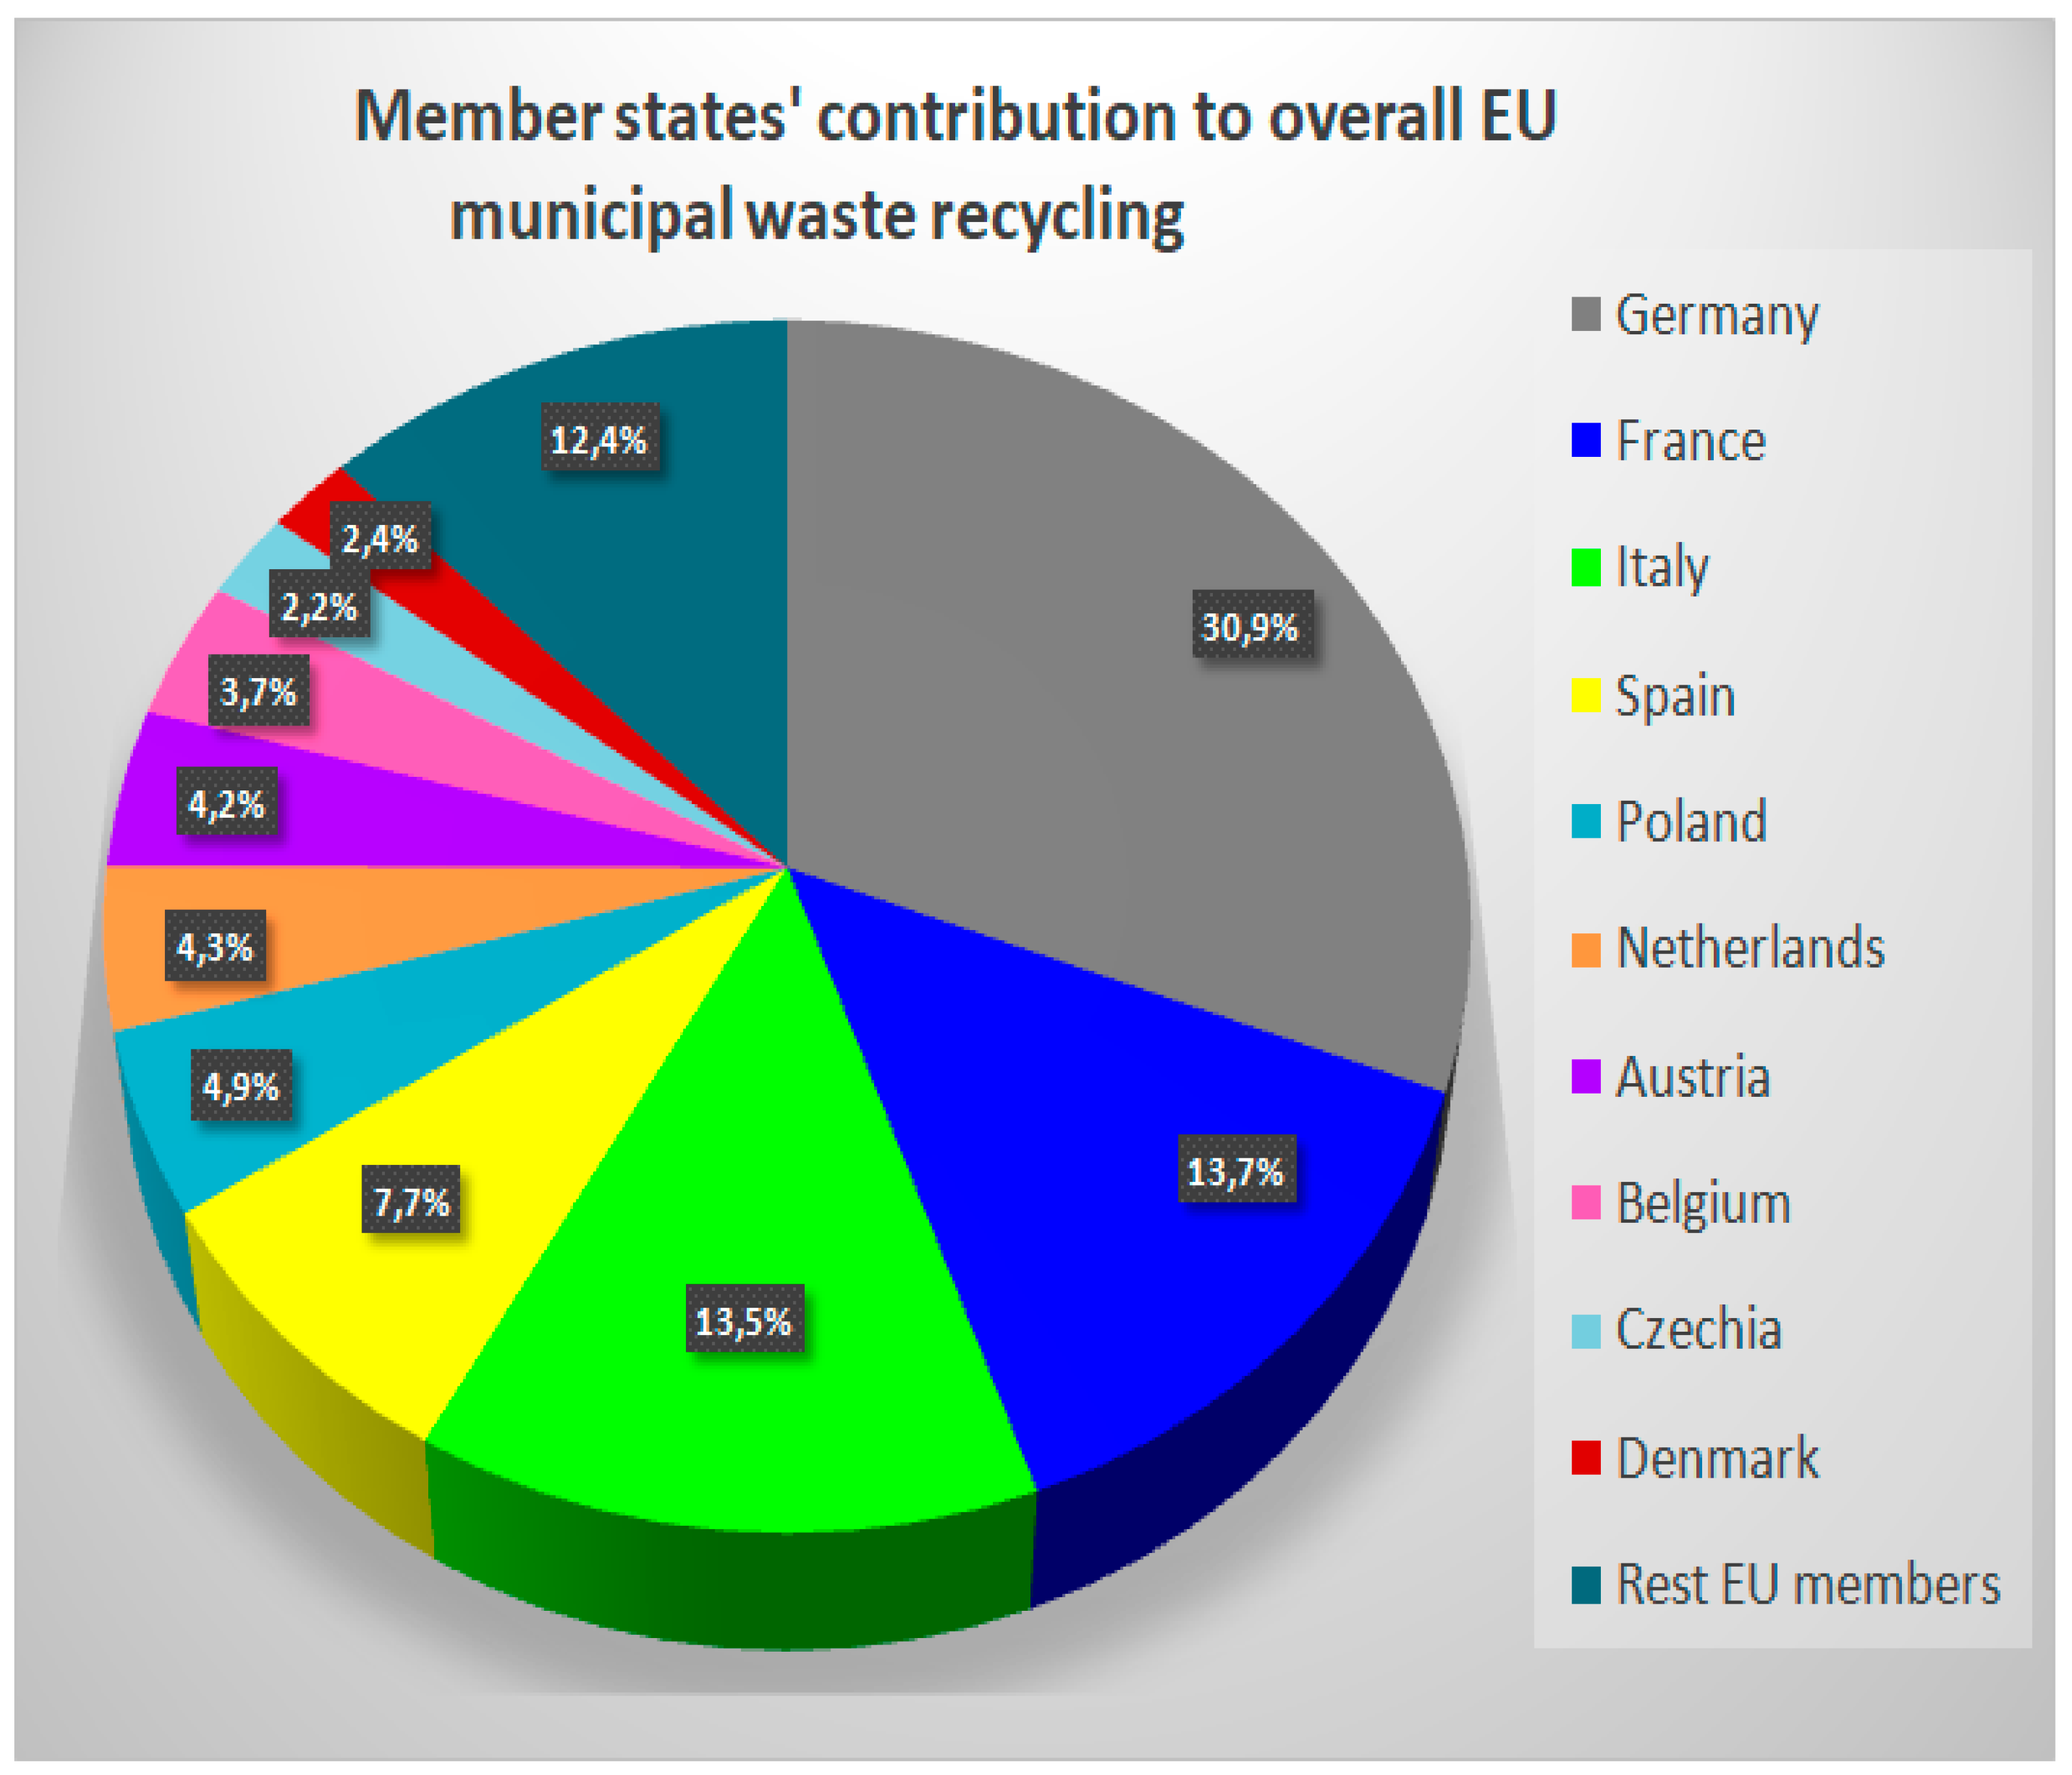
Figure 2.
Member states’ contributions to the total amount of recycled municipal waste in the EU [29,30,31].
Actually, Table 2 reveals that different European cultures and standards of living can lead to great inequalities in terms of domestic consumption and, thus, in terms of municipal waste production between EU member states. For example, Austria generates almost three times more municipal waste in kg per capita than Romania, and Denmark produces almost two times more municipal waste in kg per capita than Poland [29].
Table 3 is generated from the result of multiplying Table 2 values by the latest total population data (2022–2023 year) of each EU member state. In particular, Table 2 shows that the top five EU countries that generate the largest quantities of municipal waste annually in thousands of tonnes are the top five most populous EU countries at the same time: Germany, France, Italy, Spain, and Poland. Romania, with the sixth largest total population in the EU, seems to be an exception, as it annually generates the lowest municipal waste quantities per capita among all 27 EU countries. On the other hand, Austria, with a total population of only 9.1 million people, is ranked eighth, as it has the highest annually produced municipal waste quantities per capita among all 27 EU countries [30,31].
At the same time, Table 4 and Figure 2 show that three EU members are responsible for more than half the quantity of the total annually recycled municipal waste within the EU. In fact, from 2022 to 2023, Germany, France, and Italy cumulatively recycled almost 65,000 thousand tonnes out of the overall annually recycled 111,929.54 thousand tonnes in all 27 EU member states [29,30,31]. This significant amount represents more than 58% of the overall EU municipal waste recycling. So, Germany, France, and Italy contribute more to the annual EU municipal waste recycling than the rest of the 24 EU member states, which contribute less than 42% to the overall annually recycled amount of municipal waste [29,30,31].
Additionally, Figure 3 shows the municipal waste recycling and composting rates of all 27 EU member states for the years 2004 and 2021 [19]. This figure reveals that some EU countries, like Germany, Austria, the Netherlands, Belgium, and Sweden, had already recorded high recycling and composting rates in the early 2000s. However, some other EU member states like Slovenia, Italy, Slovakia, Lithuania, Latvia, Czechia, Poland, Hungary, and Croatia have achieved great progress and therefore dynamically boosted their own recycling and composting rates from 2004 to 2021. In summary, the majority of Western EU countries have achieved great recycling and composting rates since 2004, while the majority of Eastern EU countries achieved significant recycling and composting rates after almost two decades.
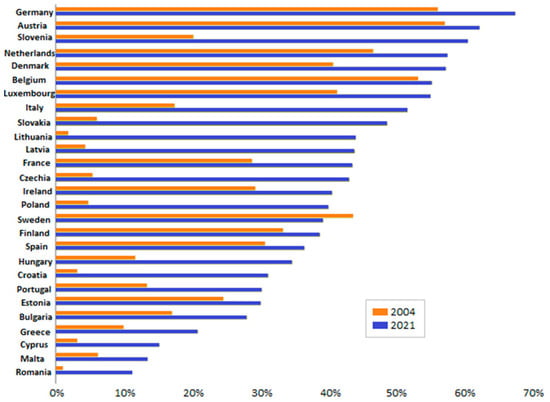
Figure 3.
Municipal waste recycling and composting rate diagram of all 27 EU member states for the years 2004 and 2021 [19].
2.2. Overall Municipal Waste Management within the EU
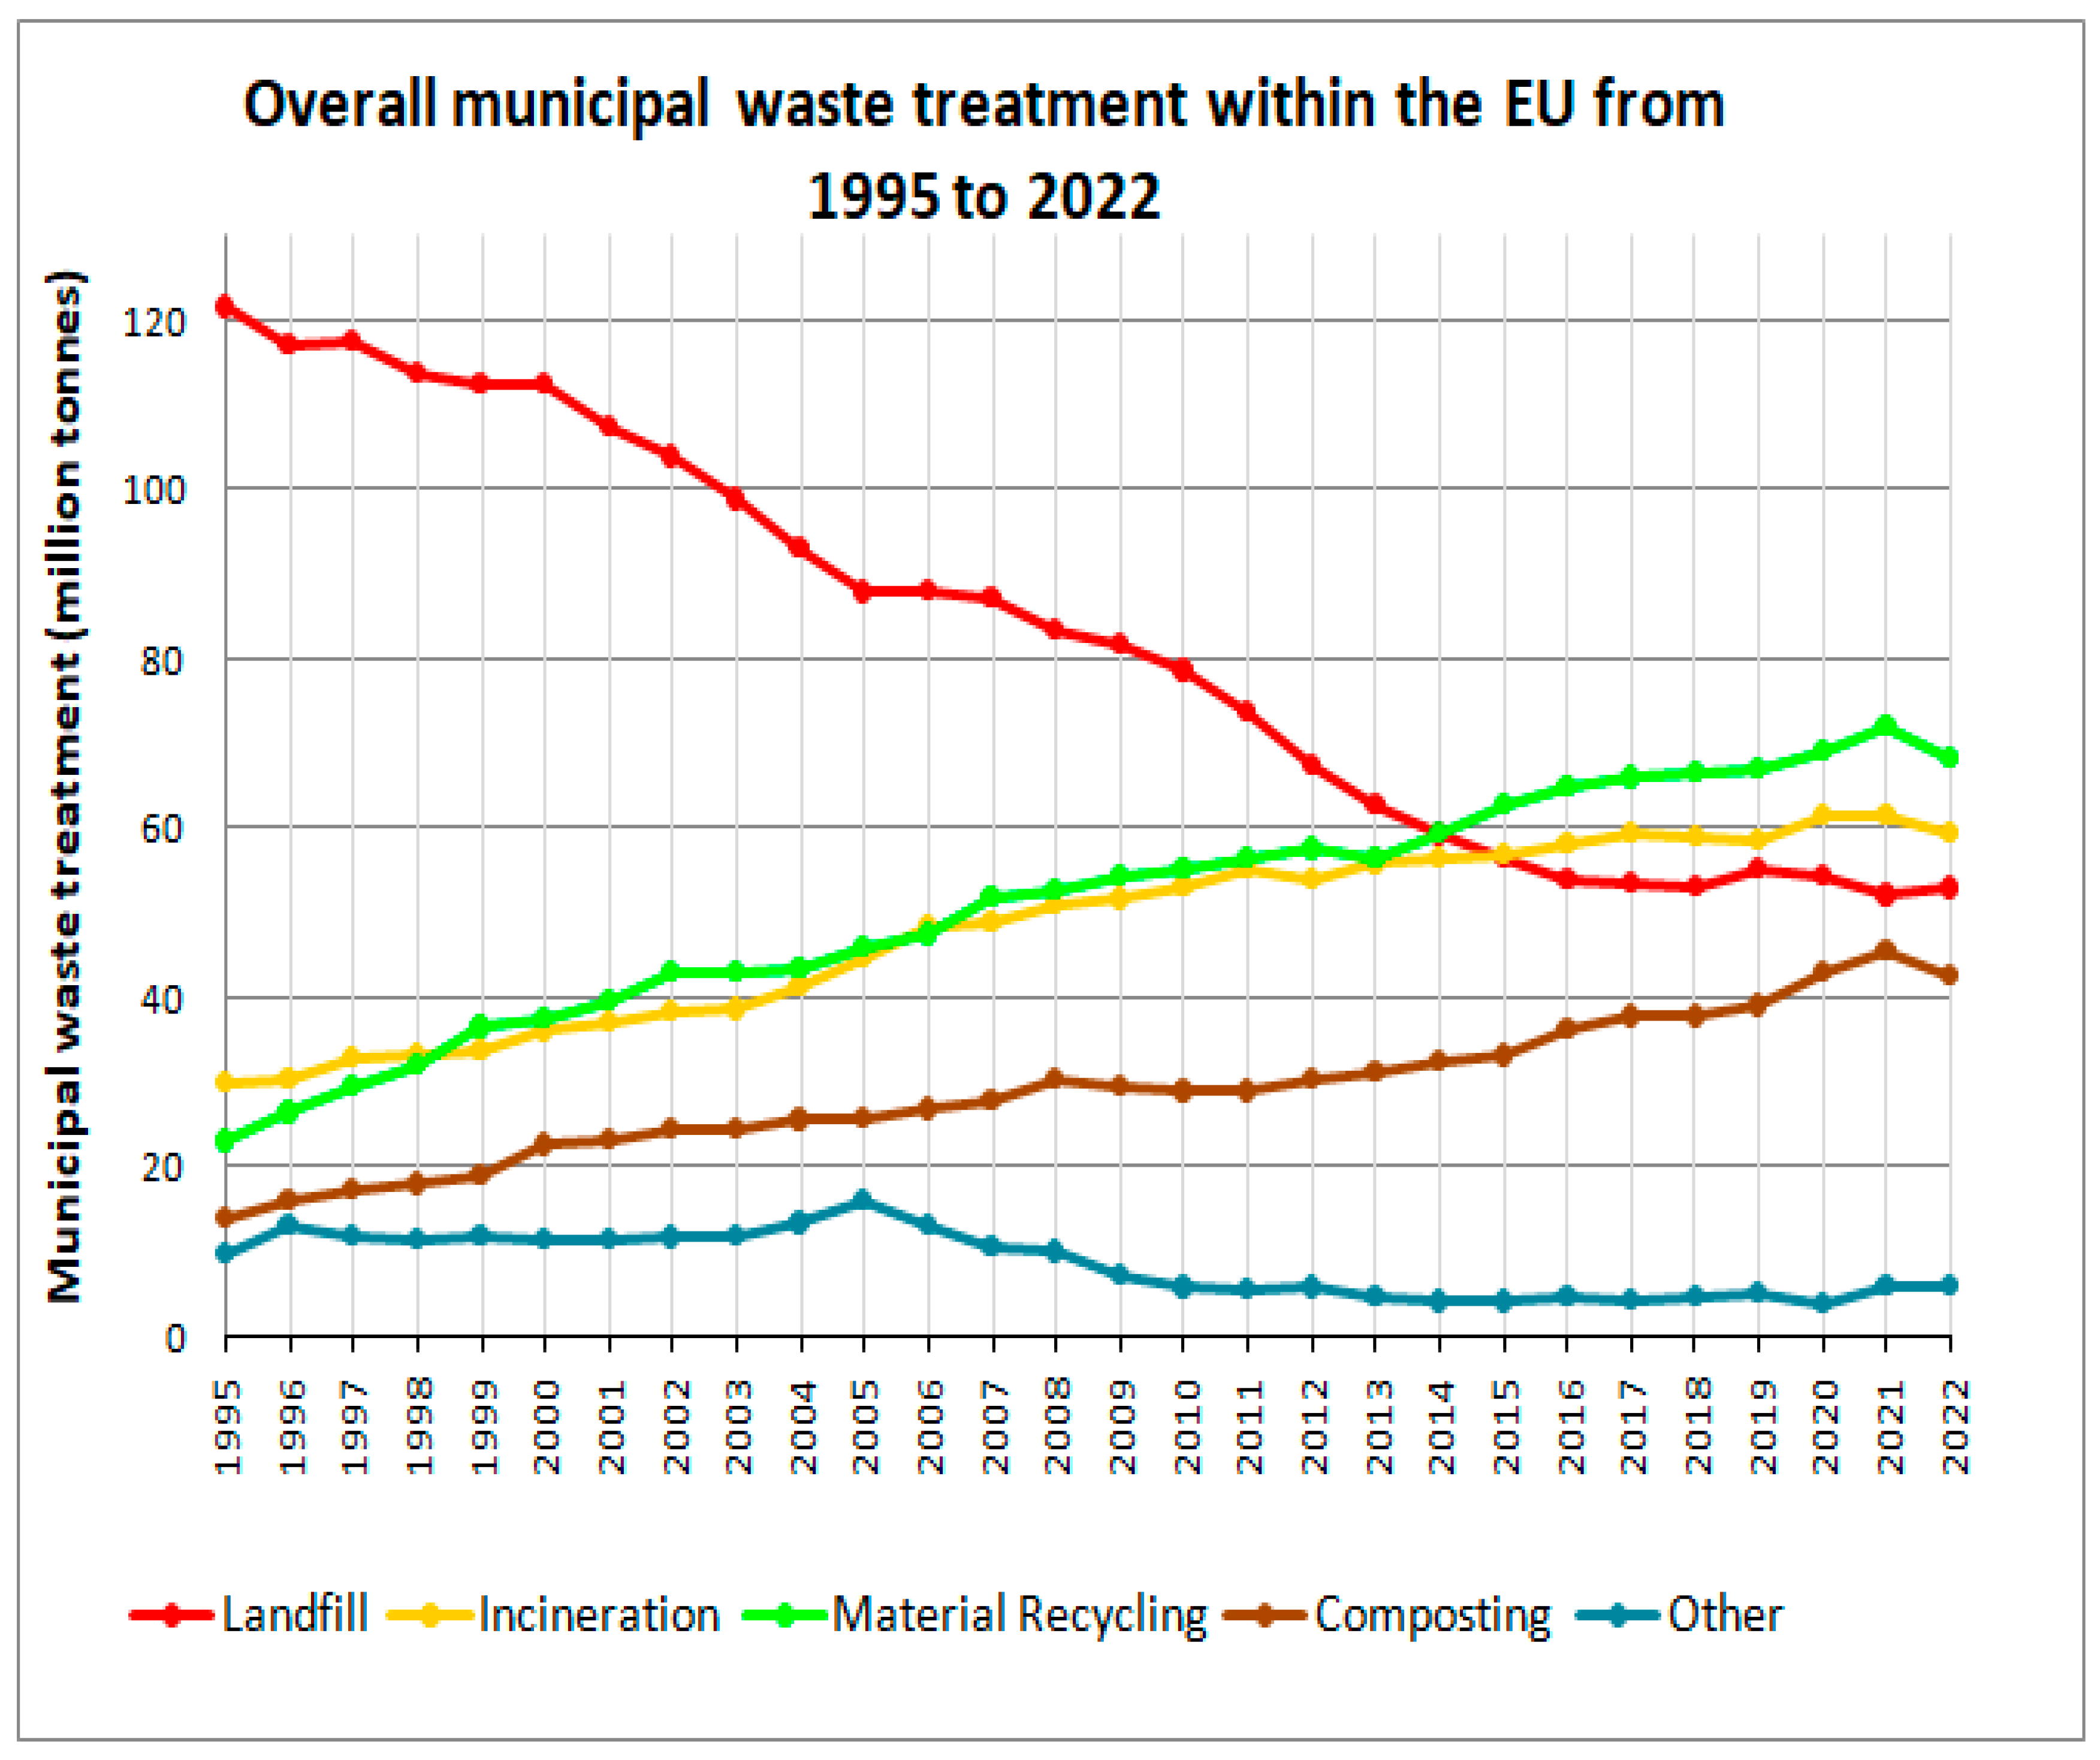
According to Eurostat, from 1995 to 2022, the overall general municipal waste management framework within all 27 EU member states has significantly changed [30]. The EU’s overall municipal waste management has gradually moved to more sustainable pathways through a major reduction in its annually landfilled quantities, from 121 million tonnes in 1995 to almost 53 million tonnes in 2022, a reduction of almost 56% [30]. At the same time, its annually incinerated municipal waste quantities were almost doubled, from 30 million tonnes in 1995 to 59 million tonnes in 2022, while its annually recycled municipal waste quantities were almost tripled, from 23 million tonnes in 1995 to 69 million tonnes in 2022 [30]. Finally, composting has skyrocketed by almost 207% in the EU, from 14 million tonnes in 1995 to 43 million tonnes in 2022, while all other municipal waste treatment or management practices, formal and informal, were quantitatively reduced by 40%, from 10 million tonnes in 1995 to 6 million tonnes in 2022 [30]. Table 5 presents all annual general municipal waste treatment and management data within the EU in million tonnes from 1995 to 2022, while Figure 4 shows their line chart for the same time period.
Table 5.
Overall annual municipal waste treatment and management data in the EU from 1995 until 2022 (28 years) in million tonnes [30].
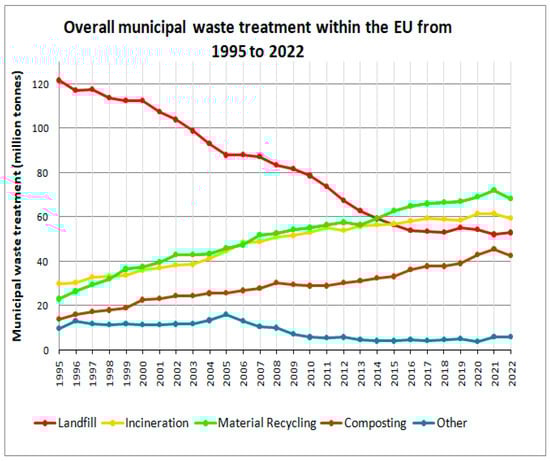
Figure 4.
A line chart of overall municipal waste treatment and management in the EU from 1995 until 2022 (28 years) in million tonnes [30].
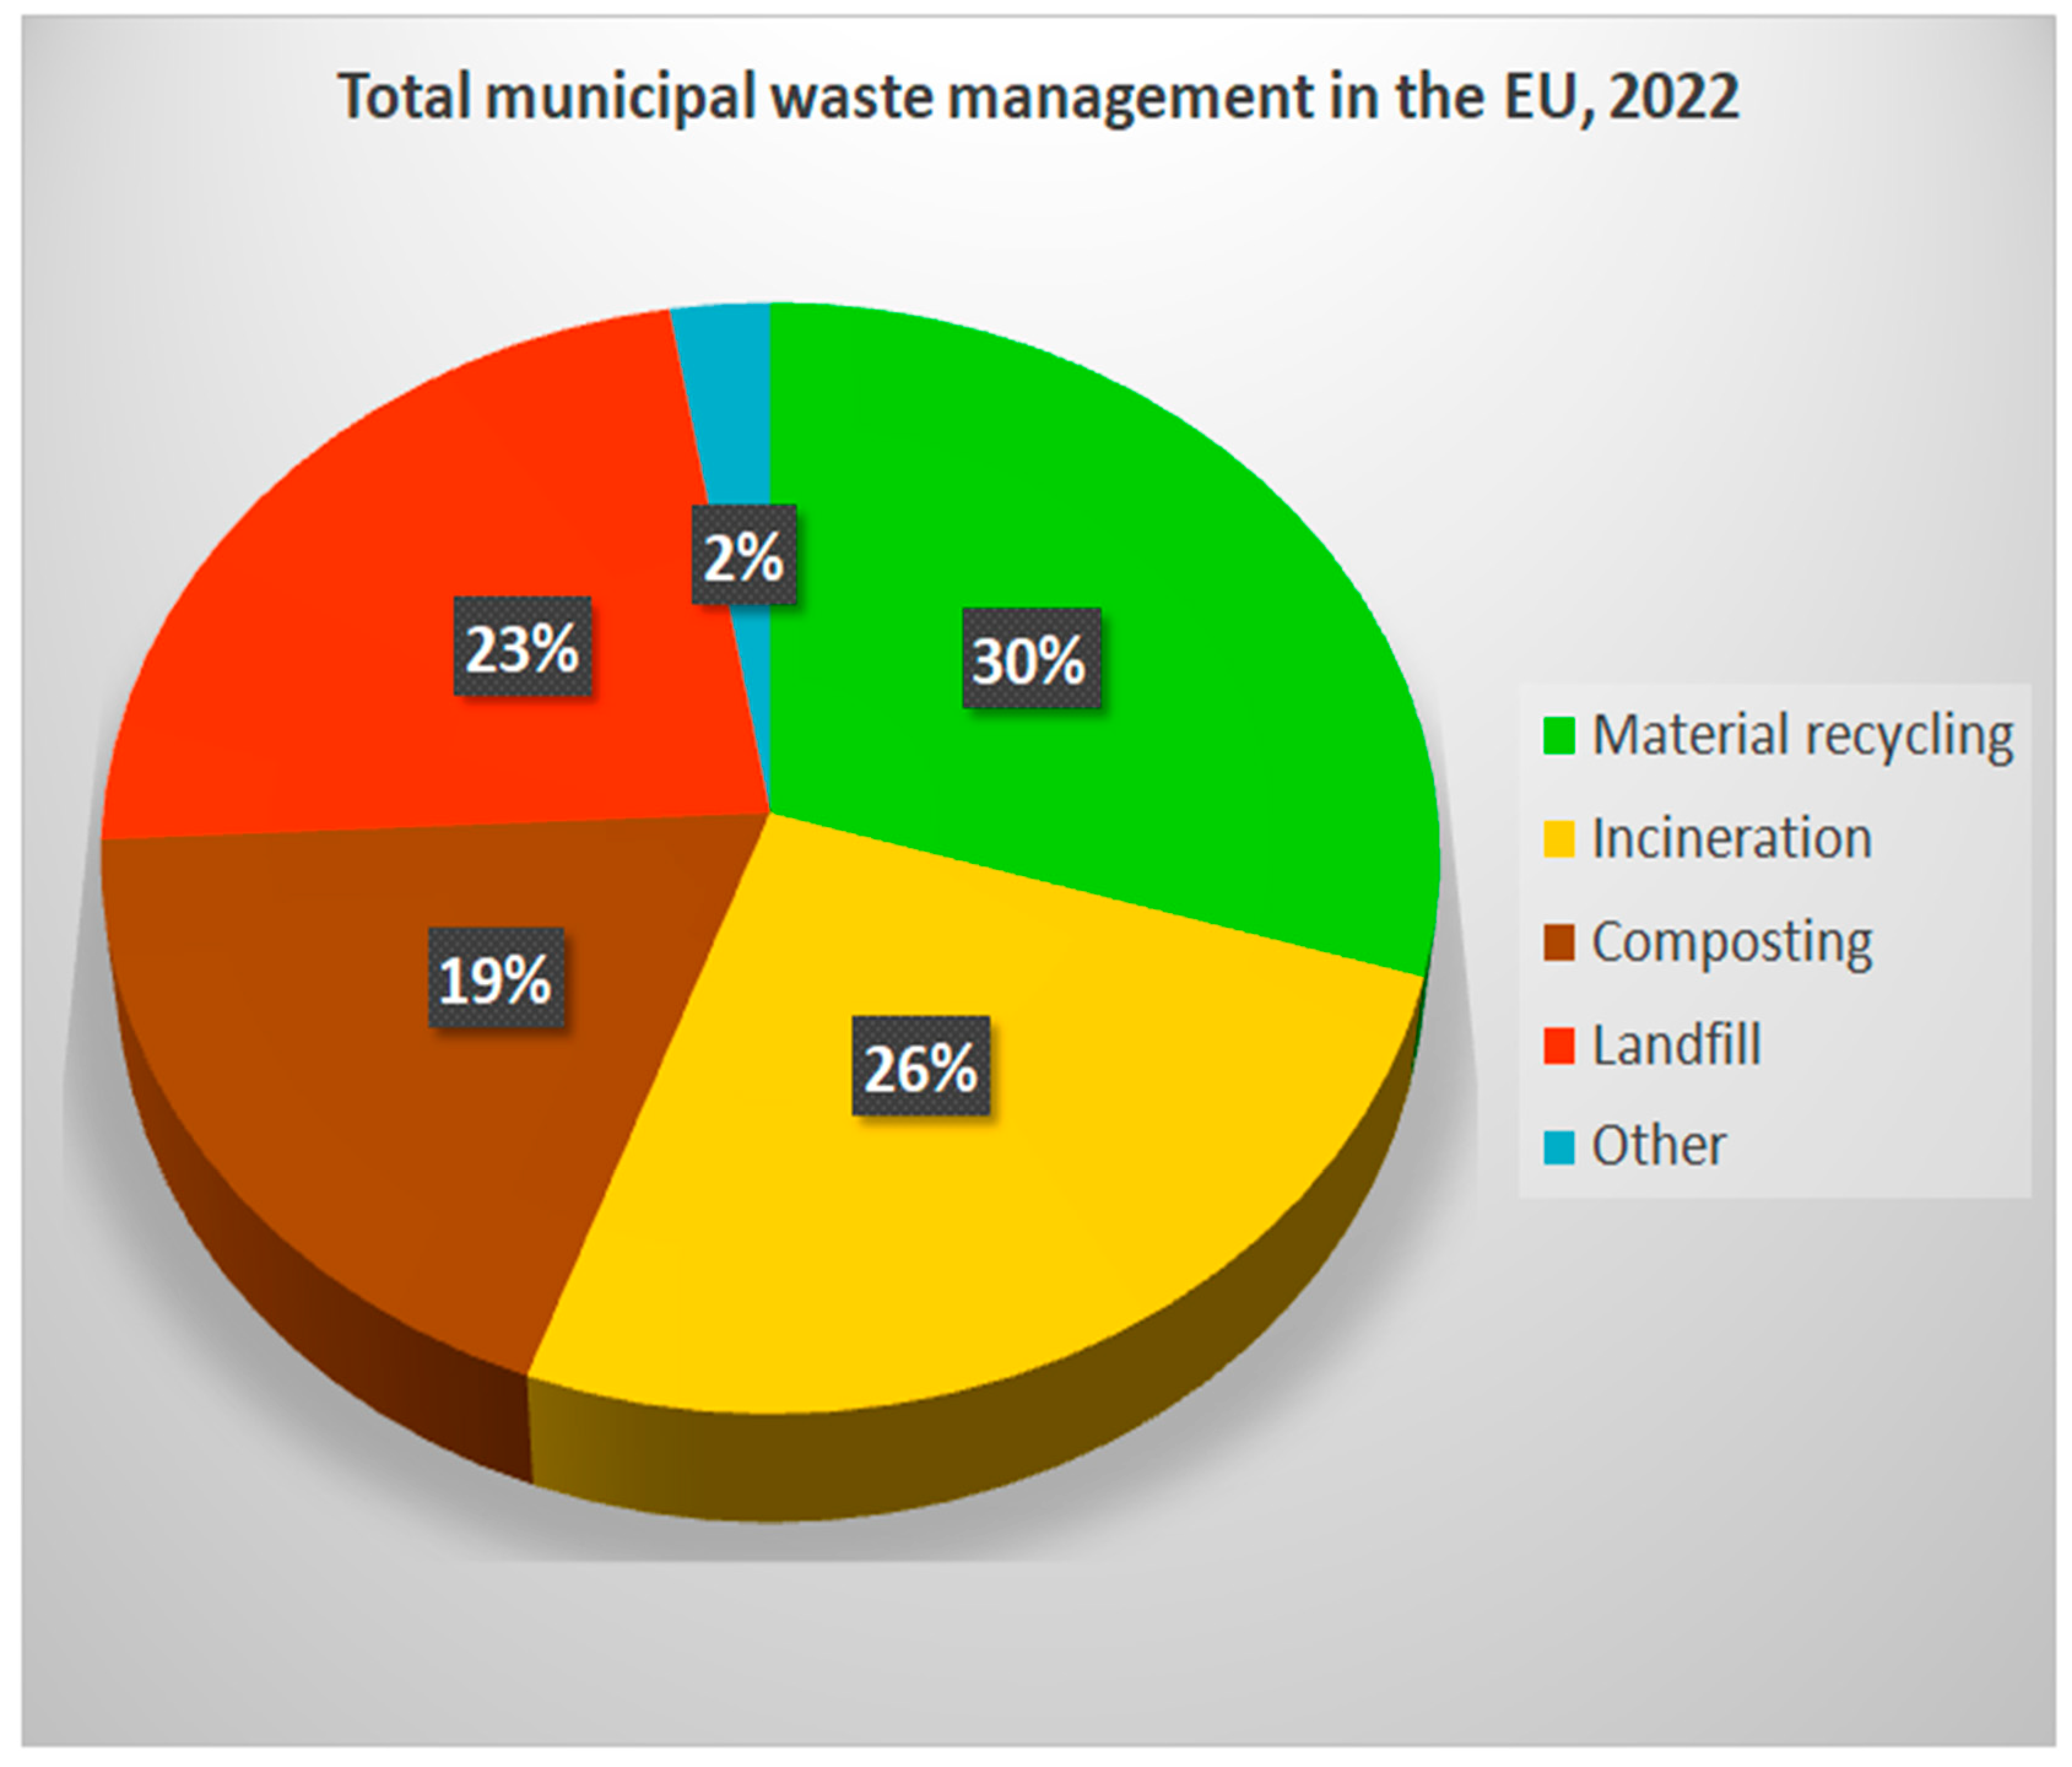
In 2022, the latest recorded municipal waste treatment and management data for the EU were formally published. Specifically, during this year, 68 million tonnes, or 30% of the total annually generated municipal waste, was recycled, while 43 million tonnes, or 19% of the total annually generated municipal waste, was composted. Additionally, during the same year, 53 million tonnes, or 23% of the total annually generated municipal waste, was landfilled, and 59 million tonnes, or 26%, was incinerated, either for energy production purposes or for other reasons. Lastly, 6 million tonnes, or 2% of the total generated municipal waste in 2022, was recorded as missing data or treated by other formal or informal means [30]. Figure 5 reveals the overall picture of these percentages regarding municipal waste treatment and management within the EU in 2022.

Figure 5.
A pie chart of total municipal waste treatment and management within the EU in 2022 [30].
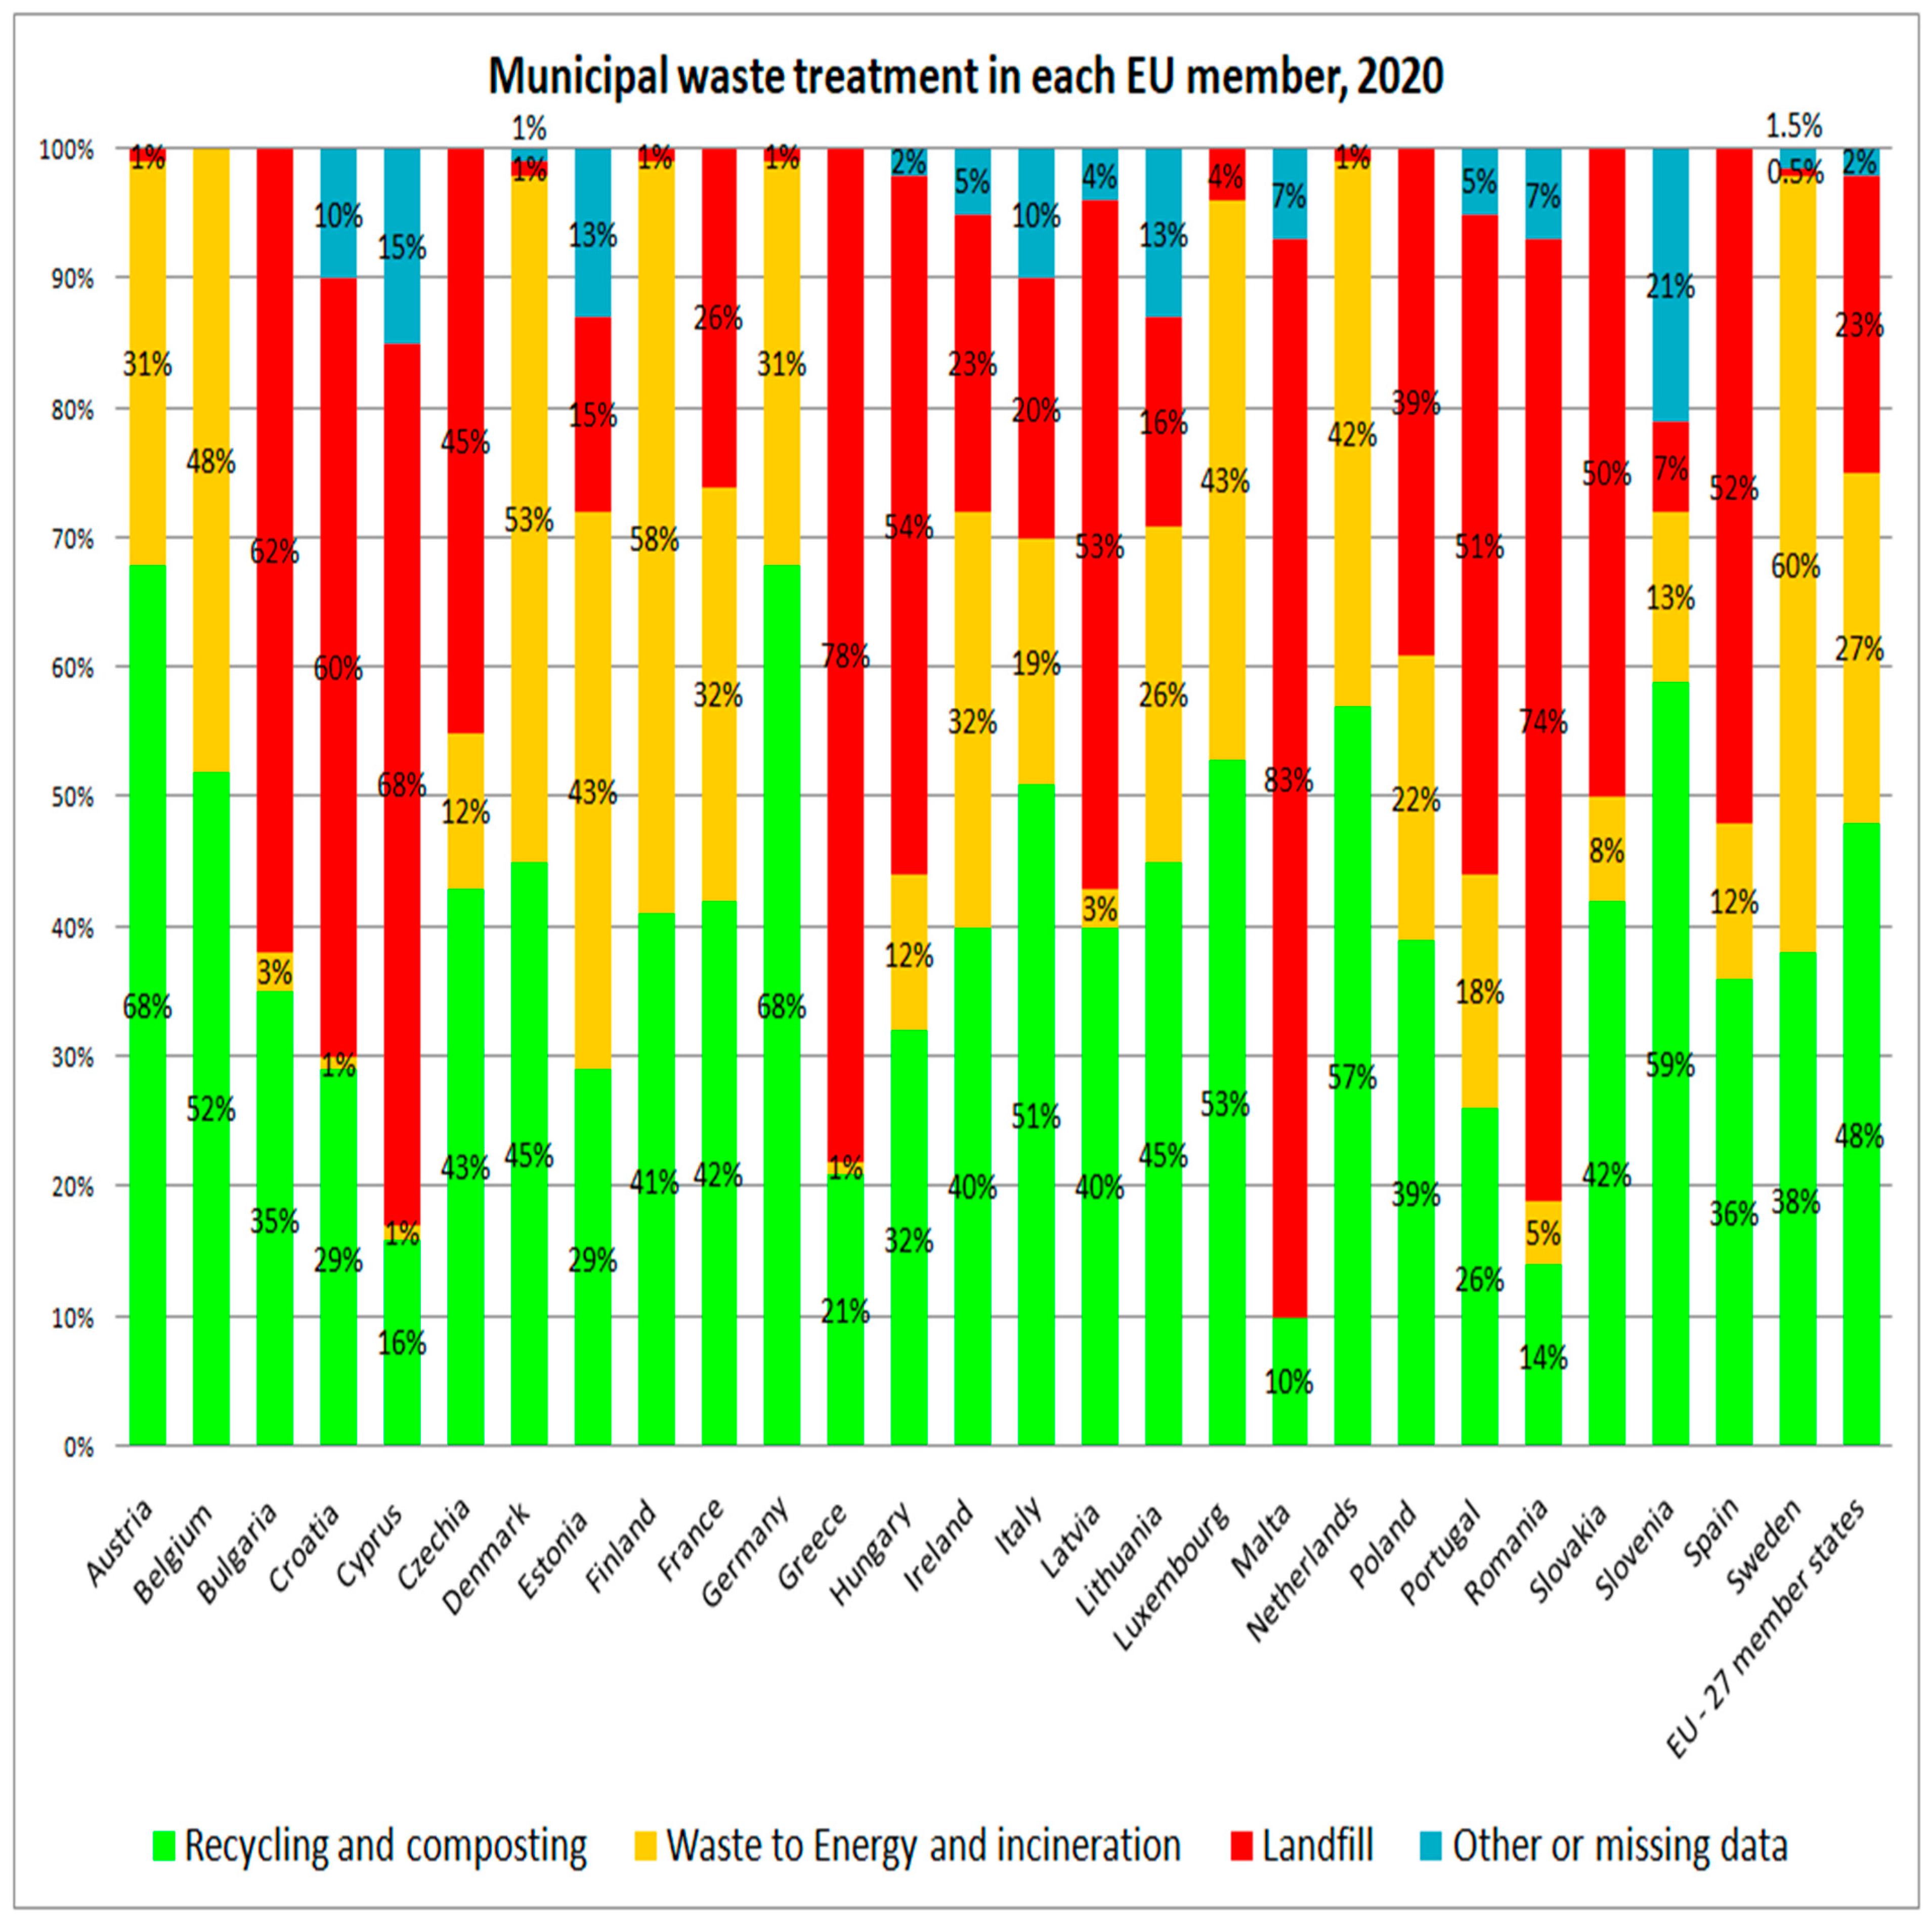
Table 6 and Figure 6 present all municipal waste treatment and management practices in percentages within the territorial domain of each EU member state according to the most recent public records in the year 2020. These data are used because 2020 is the latest most complete recorded year by Eurostat, without any information gaps or missing data regarding all municipal waste treatment and management practices within all 27 EU member states, in contrast to more recent recorded years, like 2021 and 2022. Actually, Table 6 and Figure 6 confirm that Germany, Austria, Slovenia, the Netherlands, Belgium, Luxembourg, Italy, and Denmark are the top eight EU countries in terms of their municipal waste recycling and composting rates [32]. At the same time, Sweden, Finland, Denmark, Belgium, Estonia, the Netherlands, and Luxembourg are the top seven EU countries in terms of waste-to-energy and incineration rates of their own generated municipal waste. Meanwhile, Malta, Greece, Romania, Cyprus, Bulgaria, Croatia, Hungary, Latvia, Spain, Portugal, and Slovakia are the top EU countries that extensively landfill their own generated municipal waste [32].
Table 6.
Municipal waste treatment and management practices within each EU member state in percentages in the year 2020 [32].
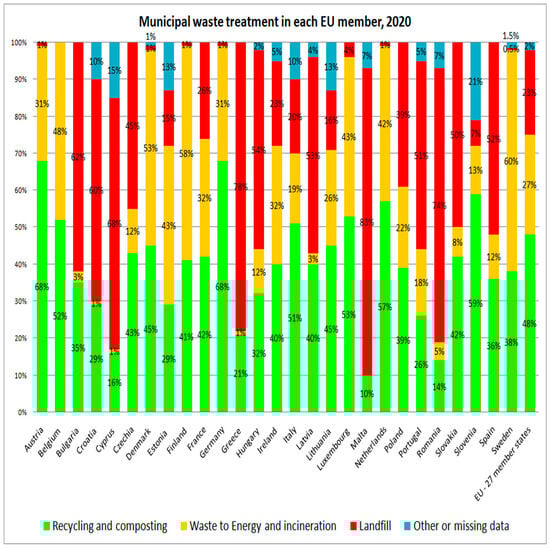
Figure 6.
All municipal waste treatment and management practices in percentages within the territorial domain of each EU member state according to the most recent public records in the year 2020 [32].
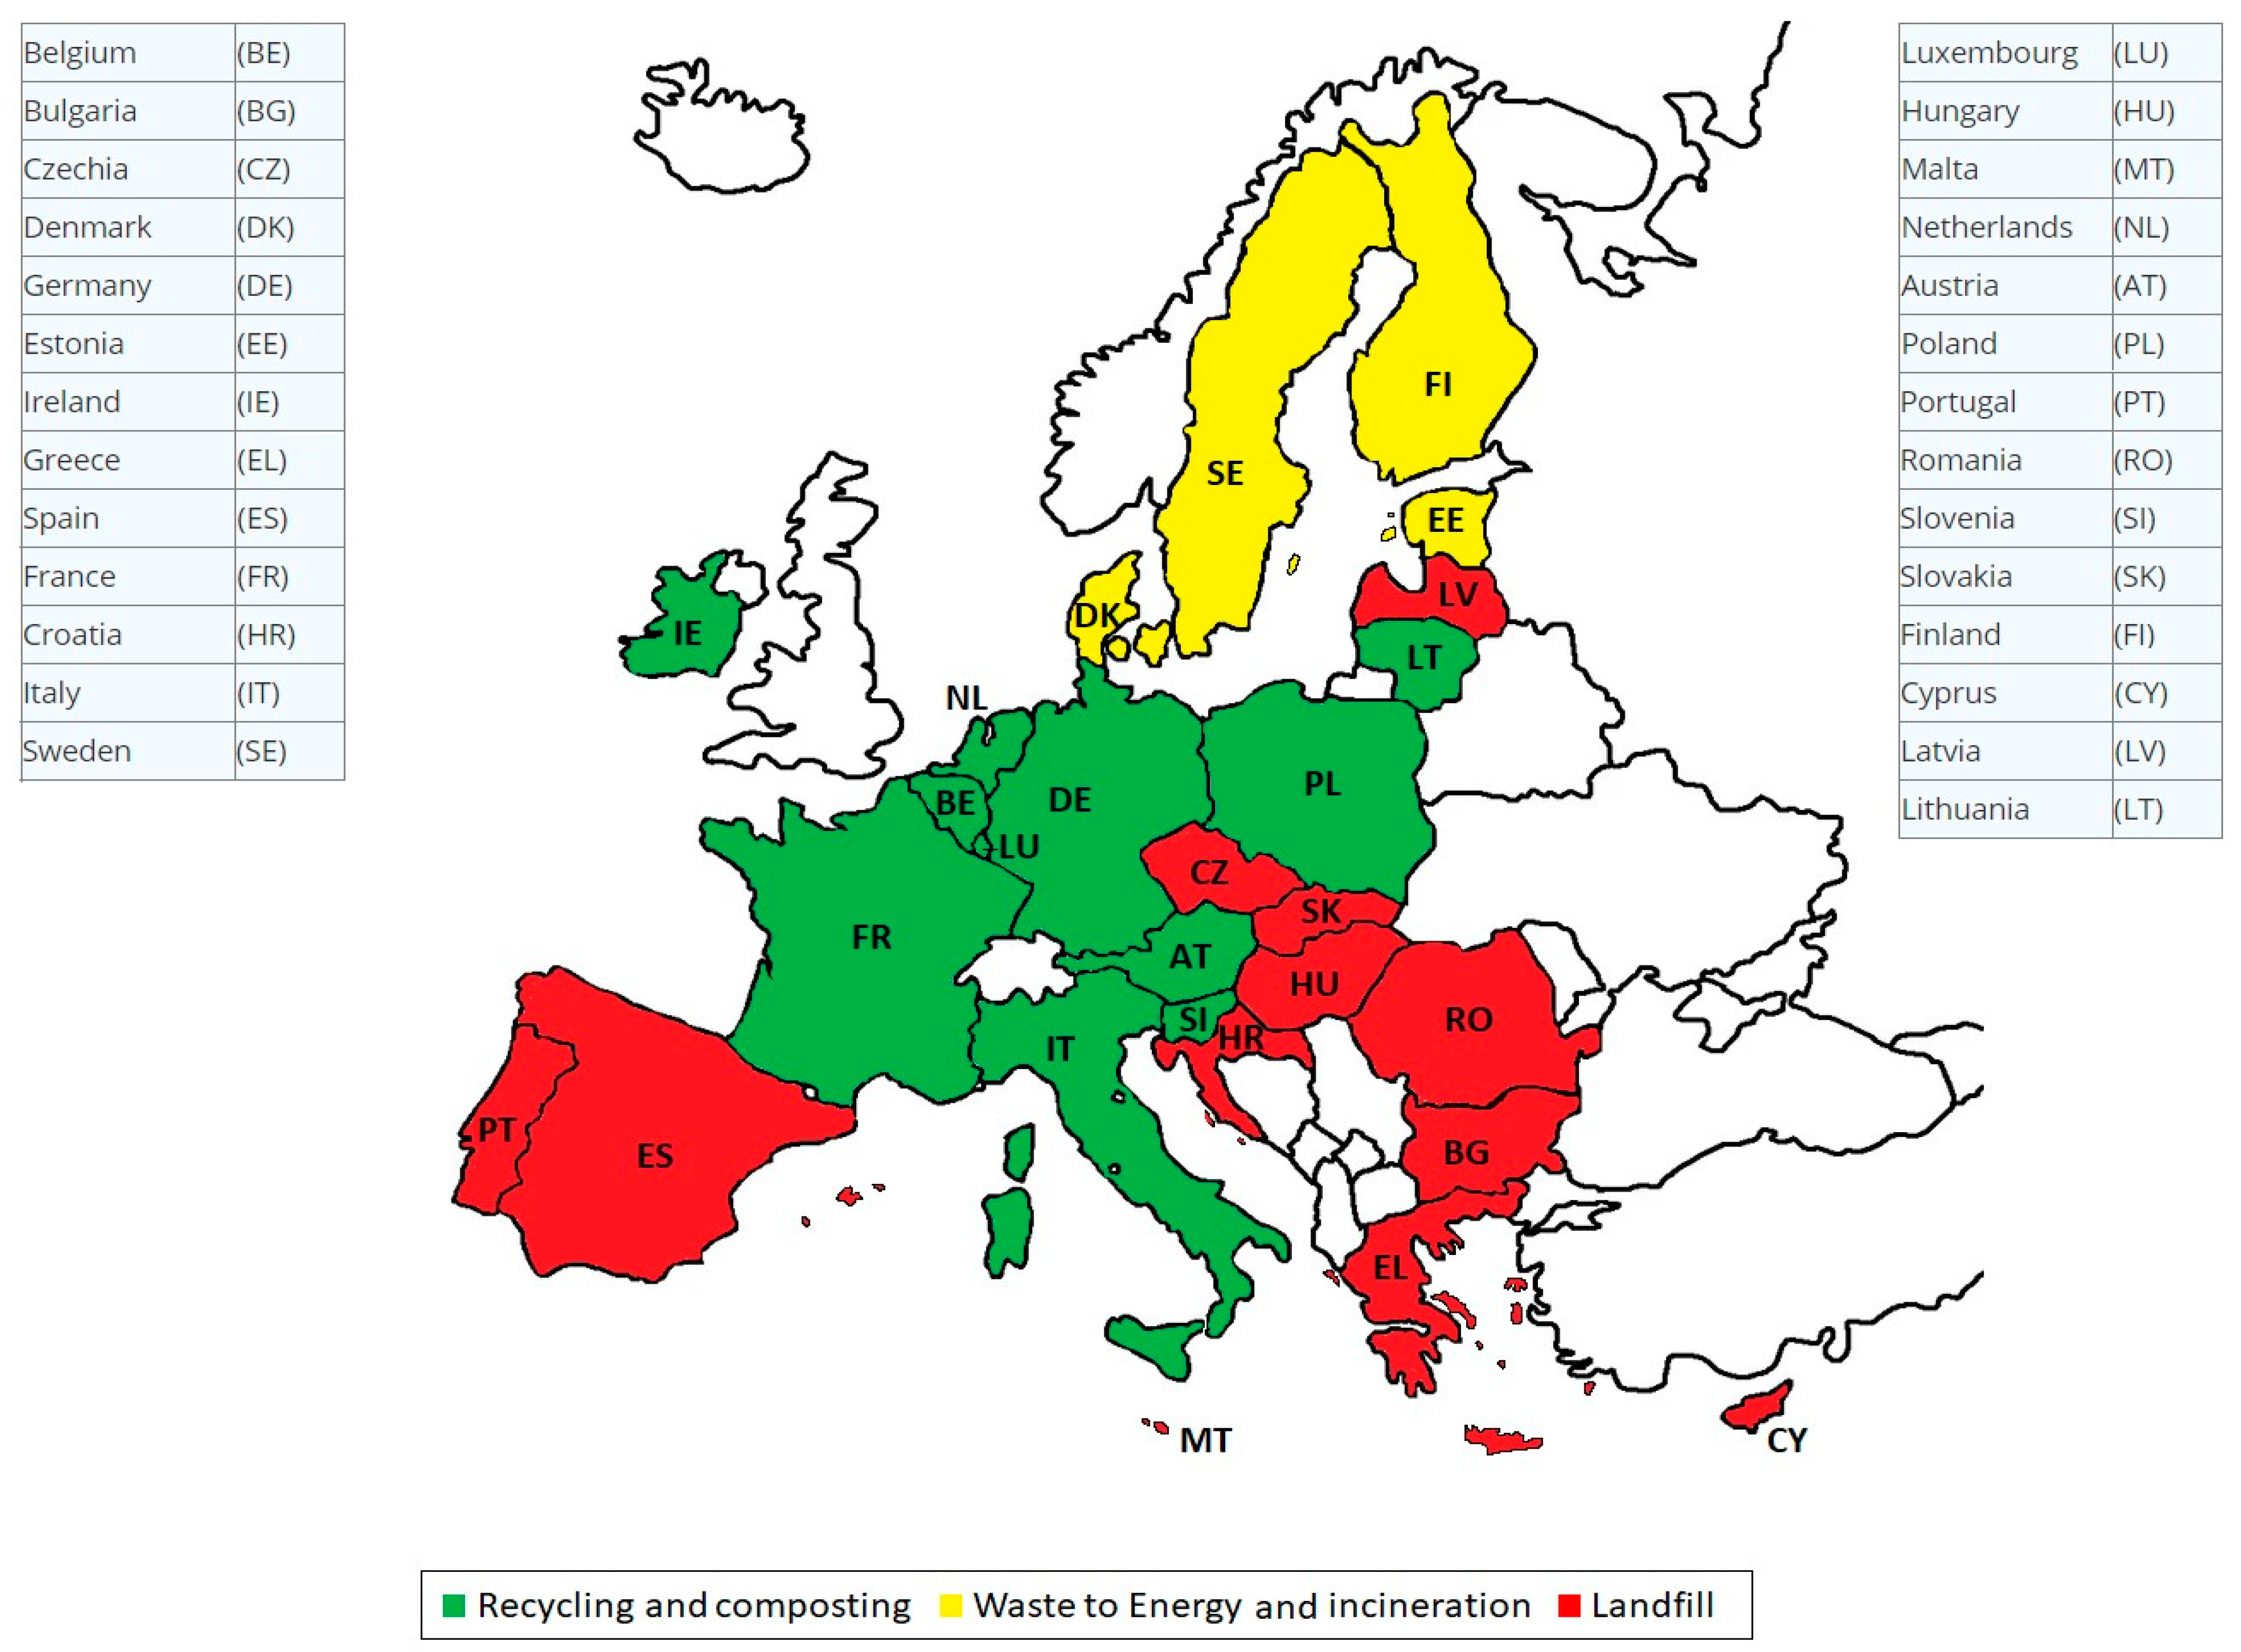
Finally, the map in Figure 7 shows all 27 EU members colored in green (recycling and composting), yellow (waste to energy and incineration), or red (landfill) based on each member’s most widely implemented municipal waste treatment and management strategy. Generally, this map reveals that each EU member’s geography and top waste treatment and management strategy are somehow related. For example, almost all Mediterranean and Balkan EU countries choose landfilling for their municipal waste. In addition, almost all Western and Central EU countries are mainly recycling and composting their municipal waste, with only some exceptions. Simultaneously, all EU Nordic countries are incinerating their municipal waste either for energy production or for other purposes.
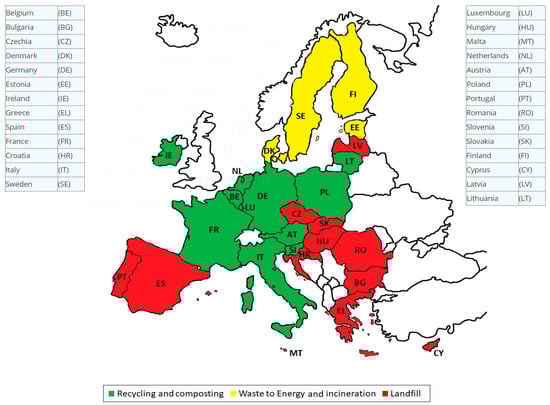
Figure 7.
European map with each EU member colored regarding its most widely implemented municipal waste treatment and management strategy. Source: Modified and created by data of [32].
3. Materials and Methods
This study focused on an overall evaluation of all EU member states in terms of their solid waste management strategies and how sustainable these strategies actually are regarding the EU regulatory recycling framework and especially the five-stage waste hierarchy of Directive 2008/98/EC. As previously mentioned in Section 1 of this study, this five-stage municipal waste hierarchy contains five relevant stages, which are presented in the following order of priority: prevention, reuse, recycling, recovery for other purposes (such as energy production), and final disposal (such as landfilling). In particular, the aforementioned overall evaluation has been based on a newly created point system, in which every EU member will gain a range of sustainability points according to their municipal waste treatment and management strategies and their proximity to the previous five stages. For this purpose, it was decided that these five stages would become the corresponding main point categories in this newly created point system. The first category is defined as the “A” category, and it takes into account each EU member’s annually generated municipal waste quantities in kilograms per capita, as presented in Table 2. This “A” category is related to the first of the aforementioned stages, the “prevention stage”, of the Directive 2008/98/EC waste hierarchy. The gained points in this category are calculated and awarded to each EU member state by dividing their annually generated municipal waste kilograms per capita by “100” and then multiplying the result by the newly defined “A” constant (A’), which is equivalent to minus one half, “−0.5”. The “A” constant was estimated to have a negative value because the annually generated municipal waste quantities should be represented as more of an obstacle to the sustainability of all solid waste management strategies than a rewarding factor. At the same time, its negative value is relatively small in order to avoid giving negative overall evaluations to many EU members. Consequently, the more negative points a member state gains in this category, the less sustainable model it follows in terms of municipal waste’s initial reduction and prevention. So, “A” category points are awarded to each EU member according to the following equation:
- ⬤
- Asp = (MWG/100) × A’, where
- Asp: “A” category points;
- MWG: municipal waste generated annually in kilograms per capita;
- A’ = (−0.5): the “A” constant related to the first stage, the “prevention stage”.
For example, the calculated points for Denmark in this “A” category are as follows:
- ⬤
- Asp of Denmark = (MWG of Denmark/100) × A’ = (787 kg per capita/100) × (−0.5) = −3.94 A points;
- MWG of Denmark: from Table 2 data.
In Supplementary Materials, Table S1 shows all “A” category points, which are calculated in accordance with the previous equation example for each EU member state.
The second category is defined as the “B” category, and it takes into account each EU member’s annual municipal waste recycling and composting rates, as presented in the first column of Table 6. This “B” category is related to both the second and third of the aforementioned stages, the “reuse and recycling stages”, of the Directive 2008/98/EC waste hierarchy. Actually, the acquired points in this category are calculated and awarded to each EU member state by directly multiplying their recycling rates by the newly defined “B” constant (B’), which is equivalent to the number five (“5”). The “B” constant was estimated to have this significant positive value because recycling and composting practices are the most sustainable and environmentally friendly practices of managing and treating municipal waste within the EU standards, and thus, they should be rewarded with the most sustainability points. Consequently, the more points a member state gains in this category, the more sustainable its municipal waste management model is. So, “B” category points are awarded to each EU member state according to the following equation:
- ⬤
- Bsp = ReR × B’, where
- Bsp: “B” category points;
- ReR: recycling rate in percent (%);
- B’ = 5: the “B” constant related to the second and third stages, the “reuse and recycling stages”.
For example, the calculated points for Germany in this “B” category are as follows:
- ⬤
- Bsp of Germany = ReR of Germany × B’ = 68% × 5 = 3.40 B points;
- ReR of Germany: from Table 6 data.
In Supplementary Materials, Table S2 presents all “B” category points, which are calculated in accordance with the equation example just above for each EU member state.
In addition, the third category is defined as the “C” category, and it takes into account each EU member’s annual municipal waste incineration rate, either for energy production or for other purposes, as presented in the second column of Table 6. This “C” category is related to the fourth of the aforementioned stages, the “recovery stage”, of the Directive 2008/98/EC waste hierarchy. The acquired points in this category are calculated and awarded to each EU member state by directly multiplying their waste-to-energy and incineration rates by the newly defined “C” constant (C’), which is equivalent to the number three (“3”). The “C” constant was estimated to have this specific positive value because waste-to-energy and incineration practices are less sustainable and environmentally friendly than recycling and composting practices according to EU standards and legislation; therefore, they are awarded fewer sustainability points. Consequently, a member state can gather a few points in this category but not as much as it can gather from the “B” category. So, “C” category points are awarded to each EU member state according to the following equation:
- ⬤
- Csp = InR × C’, where
- Csp: “C” category points;
- InR: incineration rate in percent (%);
- C’ = 3: “C” constant related to the fourth stage, the “recovery stage”.
For example, the calculated points for Sweden in this “C” category are as follows:
- ⬤
- Csp of Sweden = InR of Sweden × C’ = 60% × 3 = 1.20 C points;
- InR of Sweden: from Table 6 data.
In Supplementary Materials, Table S3 presents all “C” category points, which are calculated in accordance with the equation example above for each EU member state.
The fourth and last category is defined as the “D” category, and it takes into account each EU member’s annual municipal waste landfill rates, as presented in the third column of Table 6. This “D” category is related to the fifth stage, i.e., the “final disposal and landfill stage”, at the bottom of the Directive 2008/98/EC waste hierarchy. The gained points in this category are calculated and awarded to each EU member state by directly multiplying their landfill rates by the newly defined “D” constant (D’), which is equivalent to the number one (“1”). The “D” constant was estimated to have a positive value because EU legislation sets strict operational requirements for landfill practices for all landfill sites within EU members. At the same time, its positive value is significantly smaller than the value of the “Β” constant or the “C” constant because landfill practices are the least sustainable solutions for managing municipal waste and are defined as final and necessary solutions by the EU legislation framework. Consequently, a member state gains minimum points in this category while potentially gaining more points in the “B” or “C” category if it has achieved, of course, a higher recycling or incineration rate than the landfill rate. So, “D” category points are awarded to each EU member state according to the following equation:
- ⬤
- Dsp = LaR × D’, where
- Dsp: “D” category points;
- LaR: landfill rate in percent (%);
- D’ = 1: the “D” constant related to the fifth stage, the “final disposal and landfill stage”.
For example, the calculated points for Greece in this “D” category are as follows:
- ⬤
- Dsp of Greece = LaR of Greece × D’ = 78% × 1 = 0.78 D points;
- LaR of Greece: from Table 6 data.
In Supplementary Materials, Table S4 shows all “D” category points, which are calculated in accordance with the previous equation example for each EU member state.
All other formal or informal municipal waste treatment and management practices are not taken into account and therefore do not contribute any sustainability points to any EU member state in this newly created point system. Finally, the total sum of A, B, C, and D sustainability points, as presented in the last columns of Tables S1–S4, respectively, represents the overall municipal waste management sustainability points for each EU member. Of course, it is plausible that some European countries may present negative numerical results. Notably, these negative results indicate that these countries need to dedicate more effort and time than the others in order to adopt more sustainable municipal waste treatment and management strategies. The following equation mathematically describes the way that the overall municipal waste management sustainability points are actually calculated for each EU member state:
- ⬤
- Osp = Asp + Bsp + Csp + Dsp, where
- Osp: Overall sustainability points;
- Asp: A sustainability points;
- Bsp: B sustainability points;
- Csp: C sustainability points;
- Dsp: D sustainability points.
For example, the overall calculated municipal waste management sustainability points for Romania are as follows:
- ⬤
- Osp of Romania = Asp of Romania + Bsp of Romania + Csp of Romania + Dsp of Romania = −1.51 + 0.70 + 0.15 + 0.74 = 0.09 municipal waste management sustainability points.
Subsequently, it is worth mentioning that this newly created waste management sustainability point system is based on the latest and most complete formal recorded data of Eurostat. According to these standards, 2022 is proven to be the most suitable reference year regarding all municipal waste production amounts per capita (in kilograms) in each EU member state. However, 2020 is used as a reference year for all recorded recycling, incineration, and landfill rates in EU member states due to the thoroughness of data in that year. For example, 2021 and 2022 records present significant information gaps and missing data in terms of the recorded recycling, incineration, and landfill rates in each EU member and, by extension, in terms of all the recorded municipal waste treatment and management practices for all 27 EU member states.
In summary, the logic of this newly created point system is to rank and compare all EU members according to their different implemented municipal waste treatment and management strategies and in full agreement with the five-stage waste hierarchy of Directive 2008/98/EC. In particular, this point system was carefully devised in order to reward EU countries that record the highest recycling rates and the smaller per capita annual generation of municipal waste with as many sustainability points as possible. At the same time, it avoids, to some extent, giving negative sustainability points to many EU members that implement less sustainable municipal waste management strategies. The following flow chart in Figure 8 briefly explains the mathematical logic of this new sustainability evaluation system. Ideally, the maximum/ideal number of sustainability points that an EU member state can potentially gain, based on this new sustainability point system, is Ospmax = Asp + Bsp + Csp + Dsp = −1.50 + 5 + 0 + 0 = 3.50 municipal waste management sustainability points.
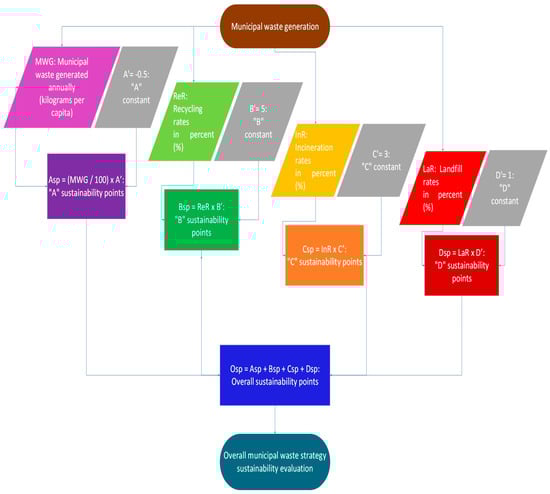
Figure 8.
Flow chart explaining the logic of the new sustainability evaluation system for overall municipal waste management strategies in EU members.
Finally, it is worth mentioning that the main challenges and limitations that emerged during the creation of this new point system were (a) the lack of important information or data regarding all municipal waste treatment and management practices within all 27 EU member states for the years 2024, 2023, 2022, and 2021, (b) the mismatches among different formal European and national sources of information regarding their recorded recycling, incineration, and landfill rates in each EU member, (c) the absence of a formal centralized online information source and, therefore, the challenge of finding and extracting different related aspects of the same information from various online websites, and lastly, (d) the deficient documentation and the complex presentation, in many cases, of key raw data that were used for the evaluation of all EU member states in terms of their solid waste management strategies.
4. Results and Discussion
4.1. Results and Discussion of Proposed Methodology and Outcomes
According to the latest recorded and formally published municipal waste treatment and management information for the year 2022 for the EU, 68 million tonnes, or 30% of the total annually generated municipal waste within the EU, was recycled, while 43 million tonnes, or 19% of the total annually generated municipal waste, was composted. Additionally, during the same year, 53 million tonnes, or 23% of the total annually generated municipal waste, was landfilled, and 59 million tonnes, or 26%, was incinerated either for energy production purposes or for other reasons. Lastly, 6 million tonnes, or 2% of the total generated municipal waste in 2022, was recorded as missing data or treated by other formal or informal means. Actually, these numbers and percentages show that, from 1995 to 2022, the overall municipal waste treatment general framework within all 27 EU member states significantly changed and moved to more sustainable pathways. Specifically, annual municipal waste landfilling was reduced by almost 56% from 1995 to 2022, while annual municipal waste recycling almost tripled from 1995 to 2022. In the same time period, annual municipal waste incineration almost doubled, while municipal waste composting processes skyrocketed by almost 207% within the EU.
To show the results of evaluating the aforementioned generated waste—as valuable resources and raw materials—with this newly created sustainability evaluation point system, detailed in Section 4, Table 7 has been developed. Specifically, Table 7 shows each EU member state’s overall sustainability points, which are calculated in accordance with the previous overall sustainability points equation Osp = Asp + Bsp + Csp + Dsp, as already described and analyzed in detail at the end of Section 4.
Table 7.
Calculated overall municipal waste management sustainability points in each EU member state.
Table 7 reveals that the Netherlands is currently implementing the most sustainable municipal waste treatment and management strategy, as it gains the most waste management sustainability points. Specifically, this overall strategy included 57% recycling and composting practices, 42% waste-to-energy and incineration practices, and only 1% landfill in the year 2020. On the other hand, seven EU members, namely, Ireland, Denmark, Portugal, Croatia, Greece, Malta, and Cyprus, gain negative points, as they implement the least sustainable municipal waste treatment and management strategies. Actually, most of these countries possess the last ranking positions in Table 7 because they landfill the majority of their annually generated municipal waste. Additionally, Ireland and Denmark are at the bottom of this ranking, and they are both rewarded with negative points due to their high per capita annual generation of municipal waste, which cannot be balanced by the positive points that they gain from either their recycling rates or their incineration rates.
According to Table 7, the overall evaluation results of this newly created sustainability point system, as presented in Section 4, reveal that the most sustainable municipal waste management strategy profile for a country entails recycling and composting rates of at least 35% of its total annually generated municipal waste and, at the same time, a landfill rate equal to or smaller than 1% of its total annually generated municipal waste, while the remaining percentage should be covered by incineration practices, either for energy production or for other purposes (waste-to-energy and incineration rates). Meanwhile, this profile must be combined with a moderate municipal waste generation quantity, which must not exceed the limit of 600 kg per capita annually. Germany, the Netherlands, and Sweden have gained by far the most waste management sustainability points among all EU member states in this newly created sustainability evaluation point system. Therefore, they have the highest ranking positions in Table 7 because they follow the aforementioned total municipal waste treatment and management strategy profile and also keep their annual municipal waste generation quantities lower than 600 kg per capita.
On the contrary, EU members like Cyprus, Malta, and Greece barely manage to gain any sustainability points, and thus, their overall calculated sustainability points have negative numerical values. Actually, these countries have the lowest ranking positions in Table 7 due to their landfill rates, which are higher than 60%, combined with their annually generated municipal waste quantities in kilograms per capita, which are close to 600 kg per capita or higher. Therefore, these countries need to dedicate more effort and time in order to drastically improve their overall waste treatment and management sustainability profiles [33].
4.2. Miscellaneous Issues, Implications, and Wider Concerns
The results and discussion on methodology and outcomes hold significant meaning when conducting a comparative analysis between EU countries and non-EU countries, offering valuable insights into global waste management strategies. Additionally, comparative studies can be conducted to compare EU waste management practices with those of other leading countries or regions, with particular interest in Japan and the United States. Such comparisons can illuminate different approaches and their effectiveness.
A key aspect of examining the transition of EU and non-EU countries in waste management is identifying macroeconomic indicators that can serve as predictors of waste management in Europe. This research approach considers factors such as urbanization intensification; increases in the standard of living, driving consumerism and purchasing behavior; and challenges posed in waste management. In a similar study, a spatial grouping of the 2010–2020 time interval among 37 European countries was implemented based on EU15/EU28/non-EU and EU/non-EU members. The main macroeconomic indicators included the human development index (HDI), GDP per capita, GNI per capita, general government expenditure on environmental protection, population at risk of poverty or social exclusion, population by educational attainment level, and levels of education. After implementing a multilinear regression model with collinearity diagnosis, the researchers were able to determine the direction and intensity of the contribution of independent variables and the hierarchy of predictors of waste management, aided by statistical tools and multiple comparisons between and within each grouping of countries.
That study revealed that EU15 countries exhibited the highest average values for most waste management indicators compared to EU28 and non-EU countries, followed by the group of EU28 countries. However, for indicators such as the recycling rate of packaging waste by type of packaging (metallic) and the recycling rate of e-waste, non-EU countries sustained higher mean values compared to the EU15 and EU28 groups of countries. This finding is explained by the high level of development in some non-Euro area countries (Iceland, Norway, Switzerland, Liechtenstein) that harbor profound reservations and intense concerns about waste recycling while simultaneously possessing the necessary financial strength to carry out complex environmental protection programs [34].
The policy instruments employed by the US and Japan concerning waste recycling patents and environmental innovations reveal credible strategies to sustain efficient waste recycling processes, which are essential worldwide. These policy mechanisms influence the behaviors of solid waste researchers and practitioners, emphasizing the importance of knowledge diffusion between the origin and destination of environmental innovations. Policymakers can develop timely strategies to enhance the efficiency of innovation activities. Through an analysis of 240 large international firms from the USA, Japan, and Europe, authors investigated how innovation inputs, such as research and development, and technological spillovers affect environmental innovation, measured by the number of waste recycling and land fertilizer patents [35]. Using a knowledge production function approach, the effect of technological knowledge spillovers on waste recycling and land fertilizer efficiency at the firm level was defined. The technological relatedness between firms was computed through technological proximity, revealing a significant positive impact of external spillovers on firms’ environmental innovation levels. Policy implications concerning industrial strategies can be aimed at improving environmental innovation by offering incentives that promote industrial relatedness and establishing integration between firms [35]. This methodological approach highlights noticeable differences in experiences, attitudes, and compliance regarding waste management regulation in multinational corporations’ parallel manufacturing operations in the United States and Japan. In this context, the American regulatory “style”, characterized by detailed and prescriptive rules and legalistic and adversarial enforcement processes, may engender more antagonism toward regulation. Conversely, the Japanese system, with its more general “performance standards” and informal enforcement methods, is prone to facilitate the acceptance of regulatory norms and improvements in environmental practices [36]. Unlike the American focus on marginal profitability and reliance on domestic markets, Japanese planning emphasizes profitability and substantial exports, making its managers more sensitive and responsive to environmental concerns [36].
It is also rationally estimated that this newly created sustainability evaluation point system is still in a preliminary form, and thus, it can be further improved and supplemented with additional environmental, financial, or social parameters, factors, and variables. All of these potential and carefully studied changes can lead to further research and can make the aforementioned overall sustainability points equation more complex, more accurate, and more reliable in evaluating each country’s sustainability (within or outside the EU) regarding its implemented municipal waste treatment and management strategies. It is anticipated that the European Commission’s waste legislation proposals and Action Plan will be able to address key challenges through a strong and consistent implementation of their requirements across EU member states. Ultimately, it is crucial for EU legislators to establish suitable level playing field conditions for European waste recyclers [6,7,8].
In this concluding stage of the study, it is important to note that the current literature background, as identified in Section 1 and Section 2, is critically discussed in Section 4, highlighting the main research gaps that can largely be addressed. However, aside from the proposed methodology and analysis, which have centered on the EU member states, there are also gaps, challenges, and policies of social and economic significance in waste management and recycling reported in the literature. Nevertheless, these social and economic aspects of the literature fall outside the research scope of this study. Therefore, no further empirical data or studies on socio-economic waste management policies have been investigated.
5. Conclusions
Based on the analysis and outcomes of this study, it was concluded that Germany, Austria, and Slovenia are the only EU countries that have already fulfilled the recycling target of at least 60% of their annually generated MSW by weight by the year 2030, while 19 out of all 27 member states of the European Union have not even reached the expired recycling target of at least 50% of their annually generated MSW by weight by the year 2020. Specifically, this initial recycling target of 2020 was only fulfilled by the following eight EU member states: Germany, Slovenia, Austria, the Netherlands, Luxembourg, Belgium, Denmark, and Italy.
Additionally, it is revealed that different European cultures and standards of living across the EU have created great inequalities in terms of domestic consumption and thus in terms of municipal waste production between EU member states. It is noted that Austria, as the biggest producer of annual municipal waste in kg per capita, generates almost three times more municipal waste than Romania, which is the smallest producer of annual municipal waste in kg per capita across the EU. Furthermore, it is noted that the top five EU countries that generate the largest quantities of municipal waste annually in thousands of tonnes are the top five most populous EU countries at the same time, namely, Germany, France, Italy, Spain, and Poland. Romania, with the sixth largest total population in the EU, is the only exception, as it annually generates the lowest municipal waste quantities per capita among all 27 EU countries. On the other hand, Austria, with a total population of only 9.1 million people, is ranked eighth, as it has the highest annually produced municipal waste quantities per capita among all 27 EU countries.
At this point, it is worth mentioning that three EU members, Germany, France, and Italy, cumulatively recycle more than half the quantity (58%) of the total annually recycled municipal waste within the EU. Specifically, they recycled almost 65,000 thousand tonnes out of the overall annually recycled 111,929.54 thousand tonnes in all 27 EU member states. In general, the majority of Western EU countries have achieved great recycling and composting rates since 2004, while the majority of Eastern EU countries managed to achieve significant recycling and composting rates after almost two decades.
The general national framework in the EU reveals that Germany, Austria, Slovenia, the Netherlands, Belgium, Luxembourg, Italy, and Denmark are the top eight EU countries in terms of their municipal waste recycling and composting rates. At the same time, Sweden, Finland, Denmark, Belgium, Estonia, the Netherlands, and Luxembourg are the top seven EU countries in terms of waste-to-energy and incineration rates of their own generated municipal waste. Meanwhile, Malta, Greece, Romania, Cyprus, Bulgaria, Croatia, Hungary, Latvia, Spain, Portugal, and Slovakia are the top EU countries that extensively landfill their own generated municipal waste. Regionally, this framework shows that almost all Mediterranean and Balkan EU countries choose landfilling for their municipal wastes, while almost all Western and Central EU countries are mainly recycling and composting their municipal waste, with only some exceptions. Simultaneously, all EU Nordic countries are incinerating their municipal waste, either for energy production or for other purposes.
It is determined that further research is needed by scientists from different academic and scientific fields in order to expand, to evolve, and to improve correspondingly the aspects, efficiency, and accuracy of this newly created and preliminary sustainability evaluation point system.
Finally, it is worth mentioning that the introduction of this novel sustainability point system and its updated results, which are presented in this paper, will mitigate disparities, highlighting the need for targeted interventions and policy initiatives at national and EU levels. In reality, this new sustainability point system can summarize, evaluate, compare, and easily concentrate key information and data from different sources in just a table regarding different national municipal waste management strategies and profiles. Hence, this table can provide policymakers, practitioners, and stakeholders with valuable information about municipal waste management strategies and practices, for example, within the EU. This knowledge will help them to initiate more targeted interventions and policy initiatives that steadily follow the principles of sustainability and sustainable development.
For example, they can effectively allocate waste and use materials as raw resources for multiple cycles of use, as well as foster collaboration between public and private sectors or different national entities to achieve common environmental goals, particularly focusing on compliance with the Sustainable Development Goals (SDGs). Additionally, they can promote policy changes that instill an environmentally sustainable mindset among citizens and increase, at the same time, their environmental awareness, especially in densely populated cities and municipalities. So, this novel sustainability point system can provide fast and complete information and knowledge about a country’s municipal waste management strategies and, by extension, about its consumption and production standards. It can also partially reflect a country’s ethics and behaviors toward our shared and fragile environment, serving as a tool to place pressure on the least environmentally friendly governments globally to adopt more sustainable development models.
Supplementary Materials
The following supporting information can be downloaded at https://www.mdpi.com/article/10.3390/recycling9030042/s1. Table S1. Calculated A points in each EU member state. Table S2. Calculated B points in each EU member state. Table S3. Calculated C points in each EU member state. Table S4. Calculated D points in each EU member state.
Author Contributions
Both authors have equally contributed to this study. All authors have read and agreed to the published version of the manuscript.
Funding
This research received no external funding.
Data Availability Statement
No data availability.
Conflicts of Interest
The authors declare no conflicts of interest.
References
- European Parliament and the Council of the European Union. Directive 2008/98/EC of the European Parliament and of the Council of 19 November 2008 on Waste and Repealing Certain Directives; European Parliament and the Council of the European Union: Strasbourg, France, 2018; Available online: https://eur-lex.europa.eu/legal-content/EN/TXT/PDF/?uri=CELEX:32008L0098&from=EL (accessed on 20 January 2024).
- European Parliament and the Council of the European Union. Directive (EU) 2018/851 of the European Parliament and of the Council of 30 May 2018 Amending Directive 2008/98/EC on Waste; European Parliament and the Council of the European Union: Strasbourg, France, 2018; Available online: https://eur-lex.europa.eu/legal-content/EN/TXT/PDF/?uri=CELEX:32018L0851&from=EL (accessed on 20 January 2024).
- Darko, C.; Yung, P.W.S.; Chen, A.; Acquaye, A. Review and recommendations for sustainable pathways of recycling commodity plastic waste across different economic regions. Resour. Environ. Sustain. 2023, 14, 100134. [Google Scholar] [CrossRef]
- Ribeiro, M.C.S.; Fiúza, A.; Ferreira, A.; Dinis, M.D.L.; Meira Castro, A.C.; Meixedo, J.P.; Alvim, M.R. Recycling Approach towards Sustainability Advance of Composite Materials’ Industry. Recycling 2016, 1, 178–193. [Google Scholar] [CrossRef]
- Valanides, M.; Aivaliotis, K.; Oikonomopoulou, K.; Fikardos, A.; Savva, P.; Sakkas, K.; Nicolaides, D. Geopolymerization of Recycled Glass Waste: A Sustainable Solution for a Lightweight and Fire-Resistant Material. Recycling 2024, 9, 16. [Google Scholar] [CrossRef]
- Albizzati, P.F.; Foster, G.; Gaudillat, P.; Manfredi, S.; Tonini, D. A model to assess the environmental and economic impacts of municipal waste management in Europe. Waste Manag. 2024, 174, 605–617. [Google Scholar] [CrossRef] [PubMed]
- Bruno, M.; Abis, M.; Kuchta, K.; Simon, F.-G.; Grönholm, R.; Hoppe, M.; Fiore, S. Material flow, economic and environmental assessment of municipal solid waste incineration bottom ash recycling potential in Europe. J. Clean. Prod. 2021, 317, 128511. [Google Scholar] [CrossRef]
- Mazzanti, M. Is waste generation de-linking from economic growth? Empirical evidence for Europe. Appl. Econ. Lett. 2008, 15, 287–291. [Google Scholar] [CrossRef]
- Ziouzios, D.; Dasygenis, M. Effectiveness of the IoT in Regional Energy Transition: The Smart Bin Case Study. Recycling 2023, 8, 28. [Google Scholar] [CrossRef]
- Stasiškienė, Ž.; Barbir, J.; Draudvilienė, L.; Chong, Z.K.; Kuchta, K.; Voronova, V.; Leal Filho, W. Challenges and Strategies for Bio-Based and Biodegradable Plastic Waste Management in Europe. Sustainability 2022, 14, 16476. [Google Scholar] [CrossRef]
- Gianvincenzi, M.; Mosconi, E.M.; Marconi, M.; Tola, F. Battery Waste Management in Europe: Black Mass Hazardousness and Recycling Strategies in the Light of an Evolving Competitive Regulation. Recycling 2024, 9, 13. [Google Scholar] [CrossRef]
- Mazahir, S.; Verter, V.; Boyaci, T.; Van Wassenhove, L.N. Did Europe Move in the Right Direction on E-waste Legislation? Prod. Oper. Manag. 2019, 28, 121–139. [Google Scholar] [CrossRef]
- Kyriakopoulos, G.L. Environmental Legislation in European and International Contexts: Legal Practices and Social Planning toward the Circular Economy. Laws 2021, 10, 3. [Google Scholar] [CrossRef]
- Vila, S.F.; Miotto, G.; Rodríguez, J.R. The SDGs in the EU Cultural Policies: An institutional communication perspective. Commun. Soc. 2022, 35, 117–131. [Google Scholar] [CrossRef]
- He, J.; Lin, B. Assessment of waste incineration power with considerations of subsidies and emissions in China. Energy Policy 2019, 126, 190–199. [Google Scholar] [CrossRef]
- Tsimnadis, K.; Kyriakopoulos, G.L.; Leontopoulos, S. Practical Improvement Scenarios for an Innovative Waste-Collection Recycling Program Operating with Mobile Green Points (MGPs). Inventions 2023, 8, 80. [Google Scholar] [CrossRef]
- Streimikiene, D.; Kyriakopoulos, G.L. Energy Poverty and Low Carbon Energy Transition. Energies 2023, 16, 610. [Google Scholar] [CrossRef]
- European Commission. Waste and Recycling, Overview. 2022. Available online: https://ec.europa.eu/environment/topics/waste-and-recycling_en (accessed on 17 March 2024).
- European Environmental Agency. Waste Recycling in Europe. 2023. Available online: https://www.eea.europa.eu/en/analysis/indicators/waste-recycling-in-europe (accessed on 19 March 2024).
- Swarup, S.; Verma, U.; Kumar, R. Challenges in sustainable solid waste management in Patna: A case study of Patna Municipal Corporation. Int. J. Environ. Waste Manag. 2024, 33, 133–145. [Google Scholar]
- Henry, R.K.; Zhao, Y.; Dong, J. Municipal solid waste management challenges in developing countries—Kenyan case study. Waste Manag. 2006, 26, 92–100. [Google Scholar] [CrossRef] [PubMed]
- Kwailane, T.T.; Gwebu, T.D.; Hambira, W.L. Challenges of domestic solid waste management: A case study of Lobatse Botswana. Afr. Geogr. Rev. 2016, 35, 117–133. [Google Scholar] [CrossRef]
- Rafiquee, A.; Shabbiruddin. Optimal selection and challenges of municipal waste management system using an integrated approach: A case study. Energy Sources Part A Recovery Util. Environ. Eff. 2024, 46, 1996–2023. [Google Scholar] [CrossRef]
- Pham Phu, S.T.; Fujiwara, T.; Hoang Minh, G.; Pham Van, D. Solid waste management practice in a tourism destination—The status and challenges: A case study in Hoi An City, Vietnam. Waste Manag. Res. 2019, 37, 1077–1088. [Google Scholar] [CrossRef]
- Taghipour, H.; Mosaferi, M. The challenge of medical waste management: A case study in northwest Iran-Tabriz. Waste Manag. Res. 2009, 27, 328–335. [Google Scholar] [CrossRef] [PubMed]
- Ali, M.; Kuroiwa, C. Status and challenges of hospital solid waste management: Case studies from Thailand, Pakistan, and Mongolia. J. Mater. Cycles Waste Manag. 2009, 11, 251–257. [Google Scholar] [CrossRef]
- Sukholthaman, P.; Shirahada, K. Technological challenges for effective development towards sustainable waste management in developing countries: Case study of Bangkok, Thailand. Technol. Soc. 2015, 43, 231–239. [Google Scholar] [CrossRef]
- Khatiwada, B.; Jariyaboon, R.; Techato, K. E-waste management in Nepal: A case study overcoming challenges and opportunities. e-Prime-Adv. Electr. Eng. Electron. Energy 2023, 4, 100155. [Google Scholar] [CrossRef]
- Eurostat. Recycling Rate of Municipal Waste. 2022. Available online: https://ec.europa.eu/eurostat/databrowser/view/cei_wm011/default/table?lang=en (accessed on 23 March 2024).
- Eurostat. Municipal Waste Statistics. 2022. Available online: https://ec.europa.eu/eurostat/statistics-explained/index.php?title=Municipal_waste_statistics#Municipal_waste_generation (accessed on 24 March 2024).
- Eurostat. Population Change—Demographic Balance and Crude Rates at National Level. 2023. Available online: https://ec.europa.eu/eurostat/databrowser/view/DEMO_GIND__custom_7127262/default/table (accessed on 30 March 2024).
- Eurostat. Treatment of Waste by Waste Category, Hazardousness and Waste Management Operations. 2020. Available online: https://ec.europa.eu/eurostat/databrowser/view/env_wastrt/default/table?lang=en (accessed on 2 April 2024).
- Streimikiene, D.; Kyriakopoulos, G.L.; Lekavicius, V.; Siksnelyte-Butkiene, I. Energy Poverty and Low Carbon Just Energy Transition: Comparative Study in Lithuania and Greece. Soc. Indic. Res. 2021, 158, 319–371. [Google Scholar] [CrossRef] [PubMed]
- Gabor, M.R.; López–Malest, A.; Panait, M.C. The transition journey of EU vs. NON-EU countries for waste management. Environ. Sci. Pollut. Res. 2023, 30, 60326–60342. [Google Scholar] [CrossRef]
- Aldieri, L.; Ioppolo, G.; Vinci, C.P.; Yigitcanlar, T. Waste recycling patents and environmental innovations: An economic analysis of policy instruments in the USA, Japan and Europe. Waste Manag. 2019, 95, 612–619. [Google Scholar] [CrossRef]
- Aoki, K.; Cioffi, J. Poles apart: Industrial waste management regulation and enforcement in the United States and Japan. Law Policy 1999, 21, 213–245. [Google Scholar] [CrossRef]


Disclaimer/Publisher’s Note: The statements, opinions and data contained in all publications are solely those of the individual author(s) and contributor(s) and not of MDPI and/or the editor(s). MDPI and/or the editor(s) disclaim responsibility for any injury to people or property resulting from any ideas, methods, instructions or products referred to in the content. |
© 2024 by the authors. Licensee MDPI, Basel, Switzerland. This article is an open access article distributed under the terms and conditions of the Creative Commons Attribution (CC BY) license (https://creativecommons.org/licenses/by/4.0/).