Article

Investigation of the Effectiveness of Barrier Layers to Inhibit Mutagenic Effects of Recycled LDPE Films, Using a Miniaturized Ames Test and GC-MS Analysis

by
Lukas Prielinger
1,*,†,
Smarak Bandyopadhyay
2,*,†,
Eva Ortner
1,
Martin Novak
1,
Tanja Radusin
3,
Steffen Annfinsen
3,
Nusrat Sharmin
2,
Bernhard Rainer
1 and
Marit Kvalvåg Pettersen
2
1
FH Campus Wien, Section for Packaging and Resource Management, Favoritenstraße 222, 1100 Vienna, Austria
2
Nofima—Norwegian Institute of Food, Fisheries and Aquaculture Research, NO-1430 Ås, Norway
3
Norner Research AS, Dokkvegen 20, NO-3920 Porsgrunn, Norway
*
Authors to whom correspondence should be addressed.
These authors contributed equally to this work.
Recycling 2024, 9(4), 57; https://doi.org/10.3390/recycling9040057
Submission received: 3 June 2024 / Revised: 9 July 2024 / Accepted: 11 July 2024 / Published: 15 July 2024

Abstract

:
To fulfil the European Green Deal targets and implement a circular economy, there is an urgent need to increase recycling rates of packaging materials. However, before recycled materials can be used in food contact applications, they must meet high safety standards. According to the European Food Safety Authority (EFSA), a worst-case scenario must be applied and unknown substances must be evaluated as being potentially genotoxic. The Ames test, which detects direct DNA-reactive effects, together with chromatographic analysis is very promising to complement risk assessment. This study aims to evaluate the effectiveness of functional barriers in ten different samples, including virgin and recycled LDPE foils. FT-IR analysis did not show major differences between virgin and recycled films. Light microscopy revealed differences in quality and an increased number of particles. GC-MS analysis detected and quantified 35 substances, including eight unknowns. Using a miniaturized version of the Ames test, four of ten samples tested positive in two individual migrates up to a dilution of 12.5%. All virgin LDPE materials tested negative; however, recycled material F showed an increased mutagenic activity, with an n-fold induction up to 28. Samples with functional barriers lowered migration and reduced mutagenicity. Nonetheless, further investigations are needed to identify possible sources of contamination.

1. Introduction

In recent times, there has been a shift from using complex multilayer materials for food packaging to using monolayer recyclable materials. The use of multilayer structures has provided good barrier properties and food preservation and has thus potentially prevented food waste but has hindered the recyclability of materials. Also, the reduction in recyclability has raised several questions for carbon neutrality and sustainability. Thus, the recent research trend is focused on the improvement of monomaterials for enhanced food shelf life. Even with the use of monomaterials, difficulties remain in recycling them back to food packaging grade. The main reasons behind the difficulties are due to the presence of significant amounts of mixed plastics and foreign substances in the recycling stream that hampers the quality of thermo-mechanically recycled plastics [1]. The new ‘proposal for a regulation of the European parliament and of the council on packaging and packaging waste, amending Regulation (EU) 2019/1020 and Directive (EU) 2019/904, and repealing Directive 94/62/EC’ (PPWR) [2] also demands a 10% recycled content of polyolefins (PO) in all PO-based food packaging materials by 2030. The European Union (EU) regulation 2022/1616 [3] prohibits direct contact between food and recycled materials unless the recycling technology has been approved, thus bringing in the option of applying functional barriers, i.e., ABA structures for the use of recycled materials for food packaging. At the same time, the EU regulation 2022/1616 also mentioned that the ABA structure might fail to prevent the contaminant transfer from the recycled layer. Thus, an appropriate challenge test or migration analysis must be conducted for the specific ABA structure to prove the efficiency of the functional barrier, in accordance with EU Regulation No 10/2011 [4].
A particular challenge in this context is the detection of directly DNA-reactive genotoxic substances. For recycled plastics to be used in high-value applications such as food or near-food applications, they must comply with EU regulations 1935/2004 [5] and 10/2011 [4] in terms of safety. Currently, the threshold for these substances is set at 0.15 µg per adult person per day. This limit is derived from the Threshold of Toxicological Concern (TTC) concept of Kroes et al. [6], and its application is also recommended by the EFSA [7]. While the investigation of food contact material (FCM) migrates generally relies on the use of analytical-chemical methods, primarily gas chromatography–mass spectrometry (GC-MS) analyses, it has been previously demonstrated by Mayrhofer et al. that these methods alone are not sufficient to detect low concentrations of unknown DNA-damaging substances [8]. According to Severin et al. [9], in vitro bioassays can be used to test complex mixtures such as FCM migrates very specifically for hazardous toxicological effects such as mutagenicity, cytotoxicity or hormone activity. As the investigation is primarily focused on direct DNA-reactive substances, as clastogenic and aneugenic effects do not fall under the 0.15 µg/person/day TTC limit [7], the Ames test has proven to be the most suitable in vitro bioassay to complement chemical analysis, according to Koster et al. [10] and Rainer et al. [11,12]. The advantages of this assay lie in its combined capabilities of effect-based detection, low detection limits and the ability to capture cumulative effects of multiple low-dose contaminants. Although the standard plate Ames test according to the Organisation for Economic Co-operation and Development (OECD) guideline 471 [13] is so far the only regulatory accepted format, the majority of miniaturized Ames test formats have proven their suitability (see Rainer et al. [11]) and can detect lower limits of biological detection (LOBD) (see Schilter et al. [14]) for a wide range of genotoxic substances (see Flückiger-Isler et al. [15,16] and Rainer et al. [17]). A miniaturized version of the Ames test has previously been employed by Rainer and Mayrhofer et al. in the detection of genotoxins from migrates or extracts of food contact materials [8,12,14]. To the best of the authors’ knowledge, there are no reports using the Ames test to highlight the effectiveness of functional barriers for recycled polyolefins. This work is also of particular relevance for packaging foils, since in previous research, a high percentage of LDPE samples, which is the most commonly used material for these foils, showed positive results for mutagenicity in the Ames test (see Mayrhofer et al. [8]).
The aim of the present study was to evaluate the effectiveness of functional barriers for different film structures including virgin and recycled low-density polyethylene (LDPE) materials, in terms of their material and safety properties. FT-IR and light microscopy were carried out to assess whether differences in the material quality of the tested film structures can be observed. GC-MS was carried out to screen for substances which exceed their respective specific migration limit (SML) and to evaluate if functional barriers can reduce the migration of identified substances. To screen for mutagenic effects in the tested film structures, an optimized sample preparation according to Rainer et al. [12] and a miniaturized Ames test protocol using only two Salmonella Typhimurium test strains, namely TA98 and TA100 (see Mayrhofer et al. [8] and Williams et al. [18]), were performed to assess if functional barriers can prevent the migration of potentially mutagenic substances.

2. Results

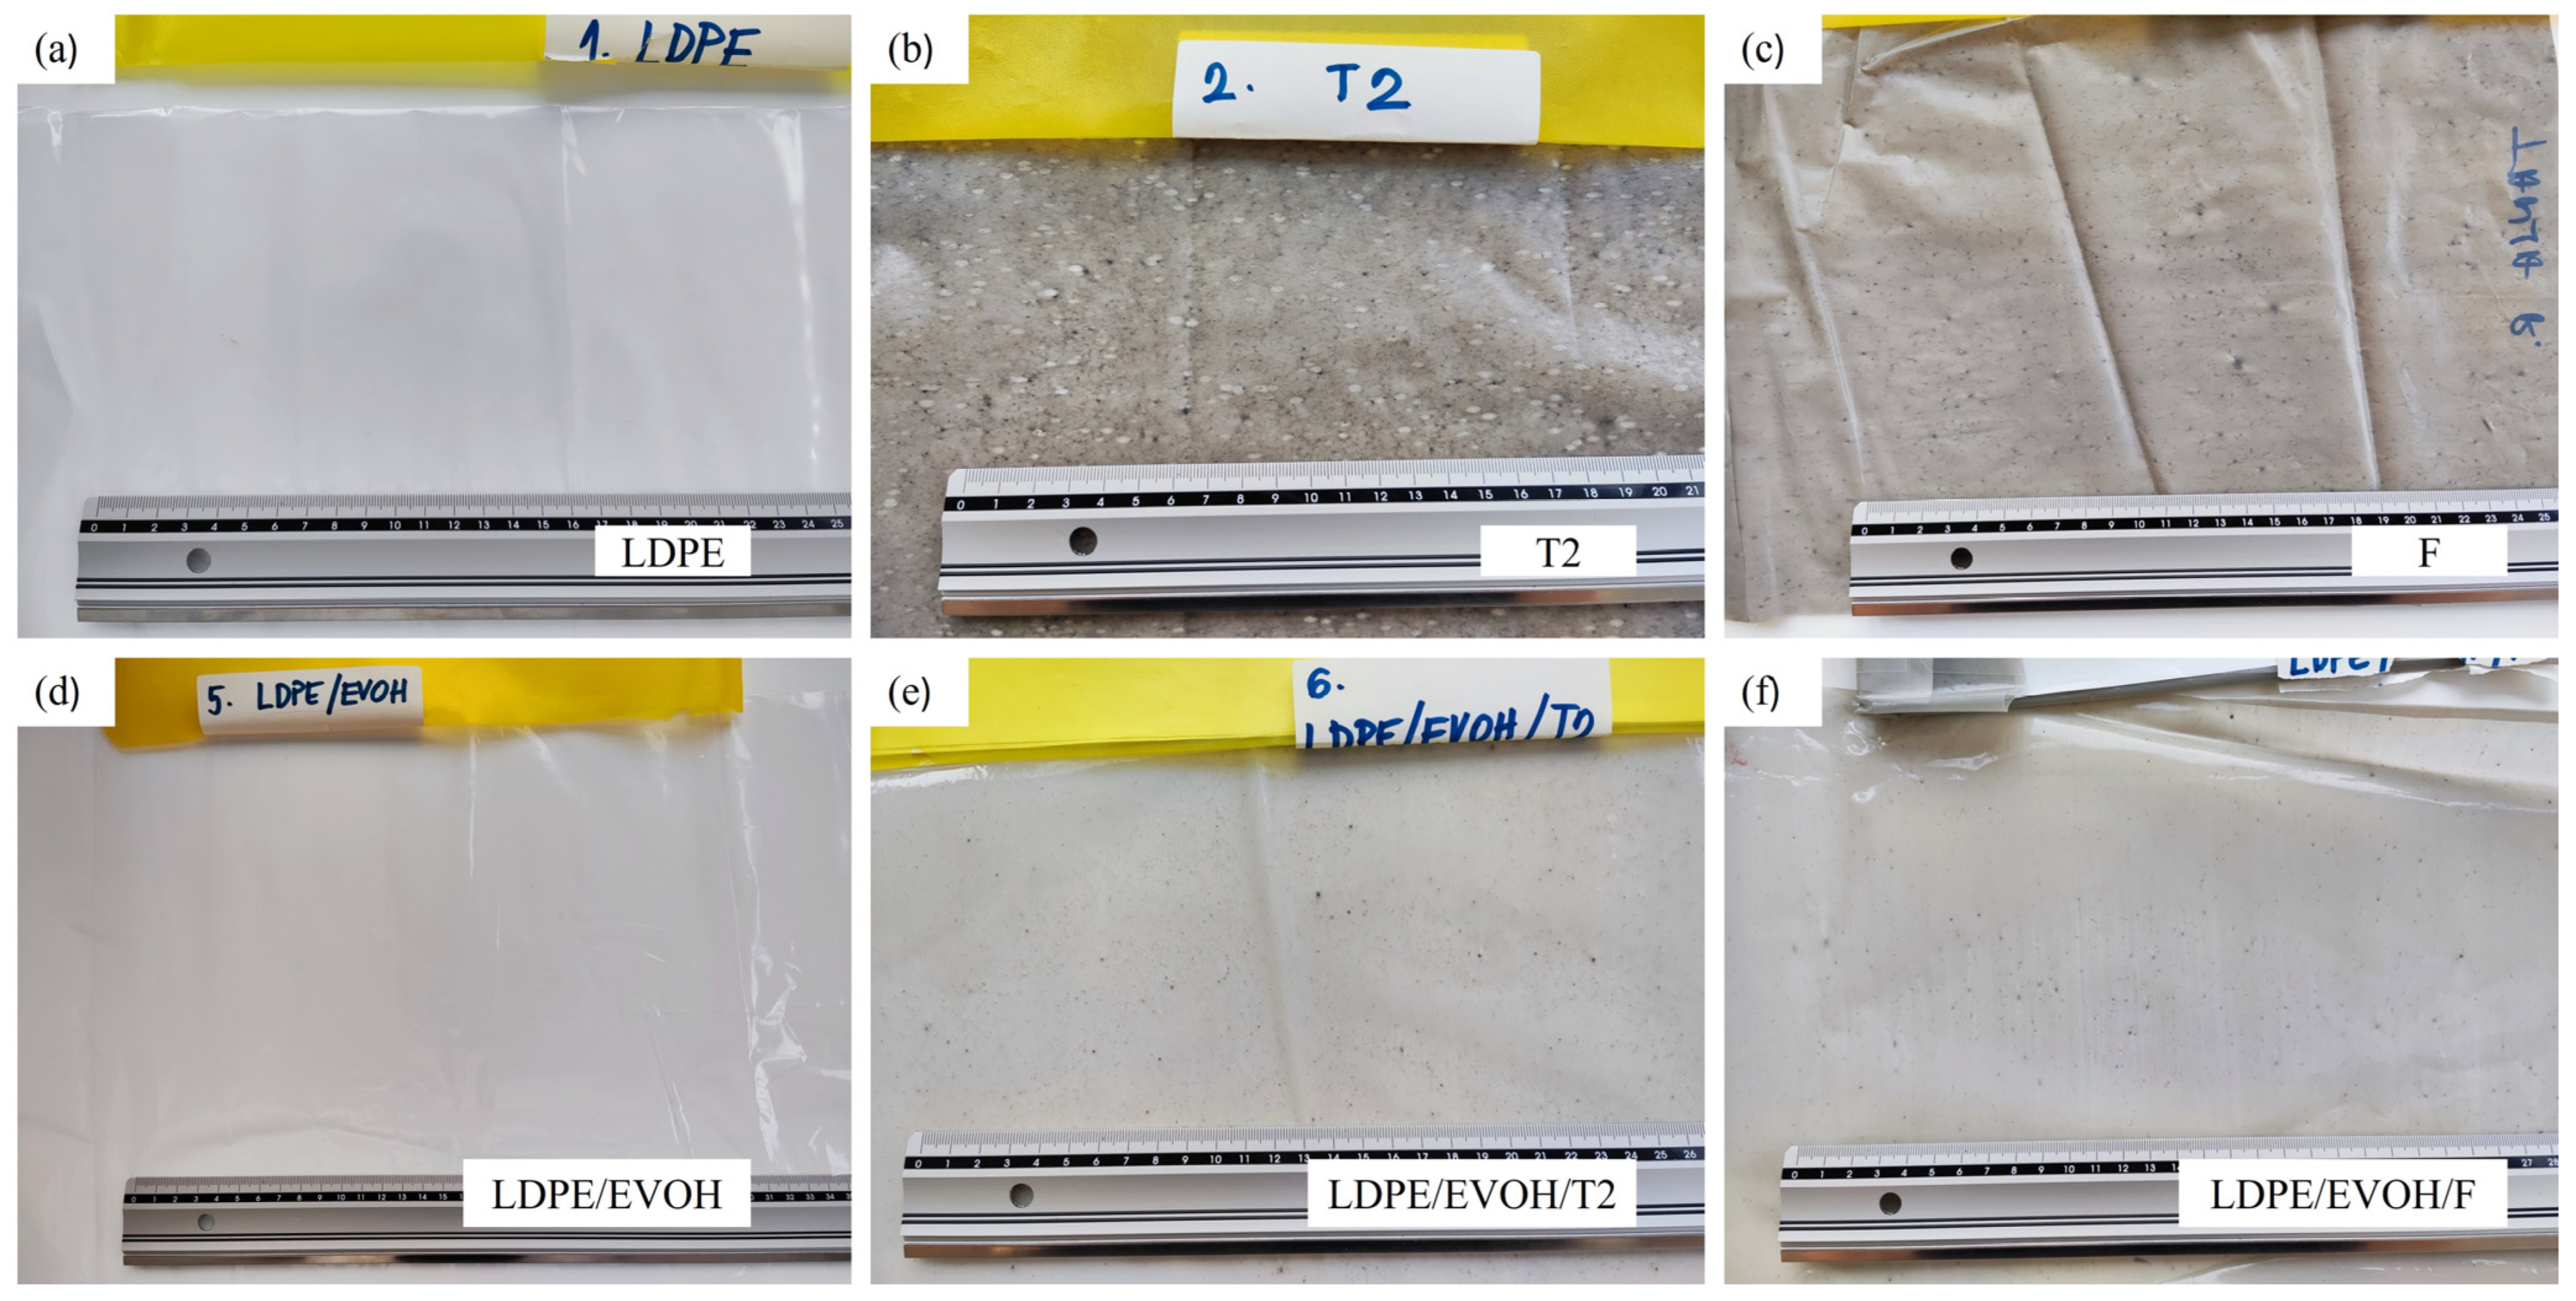
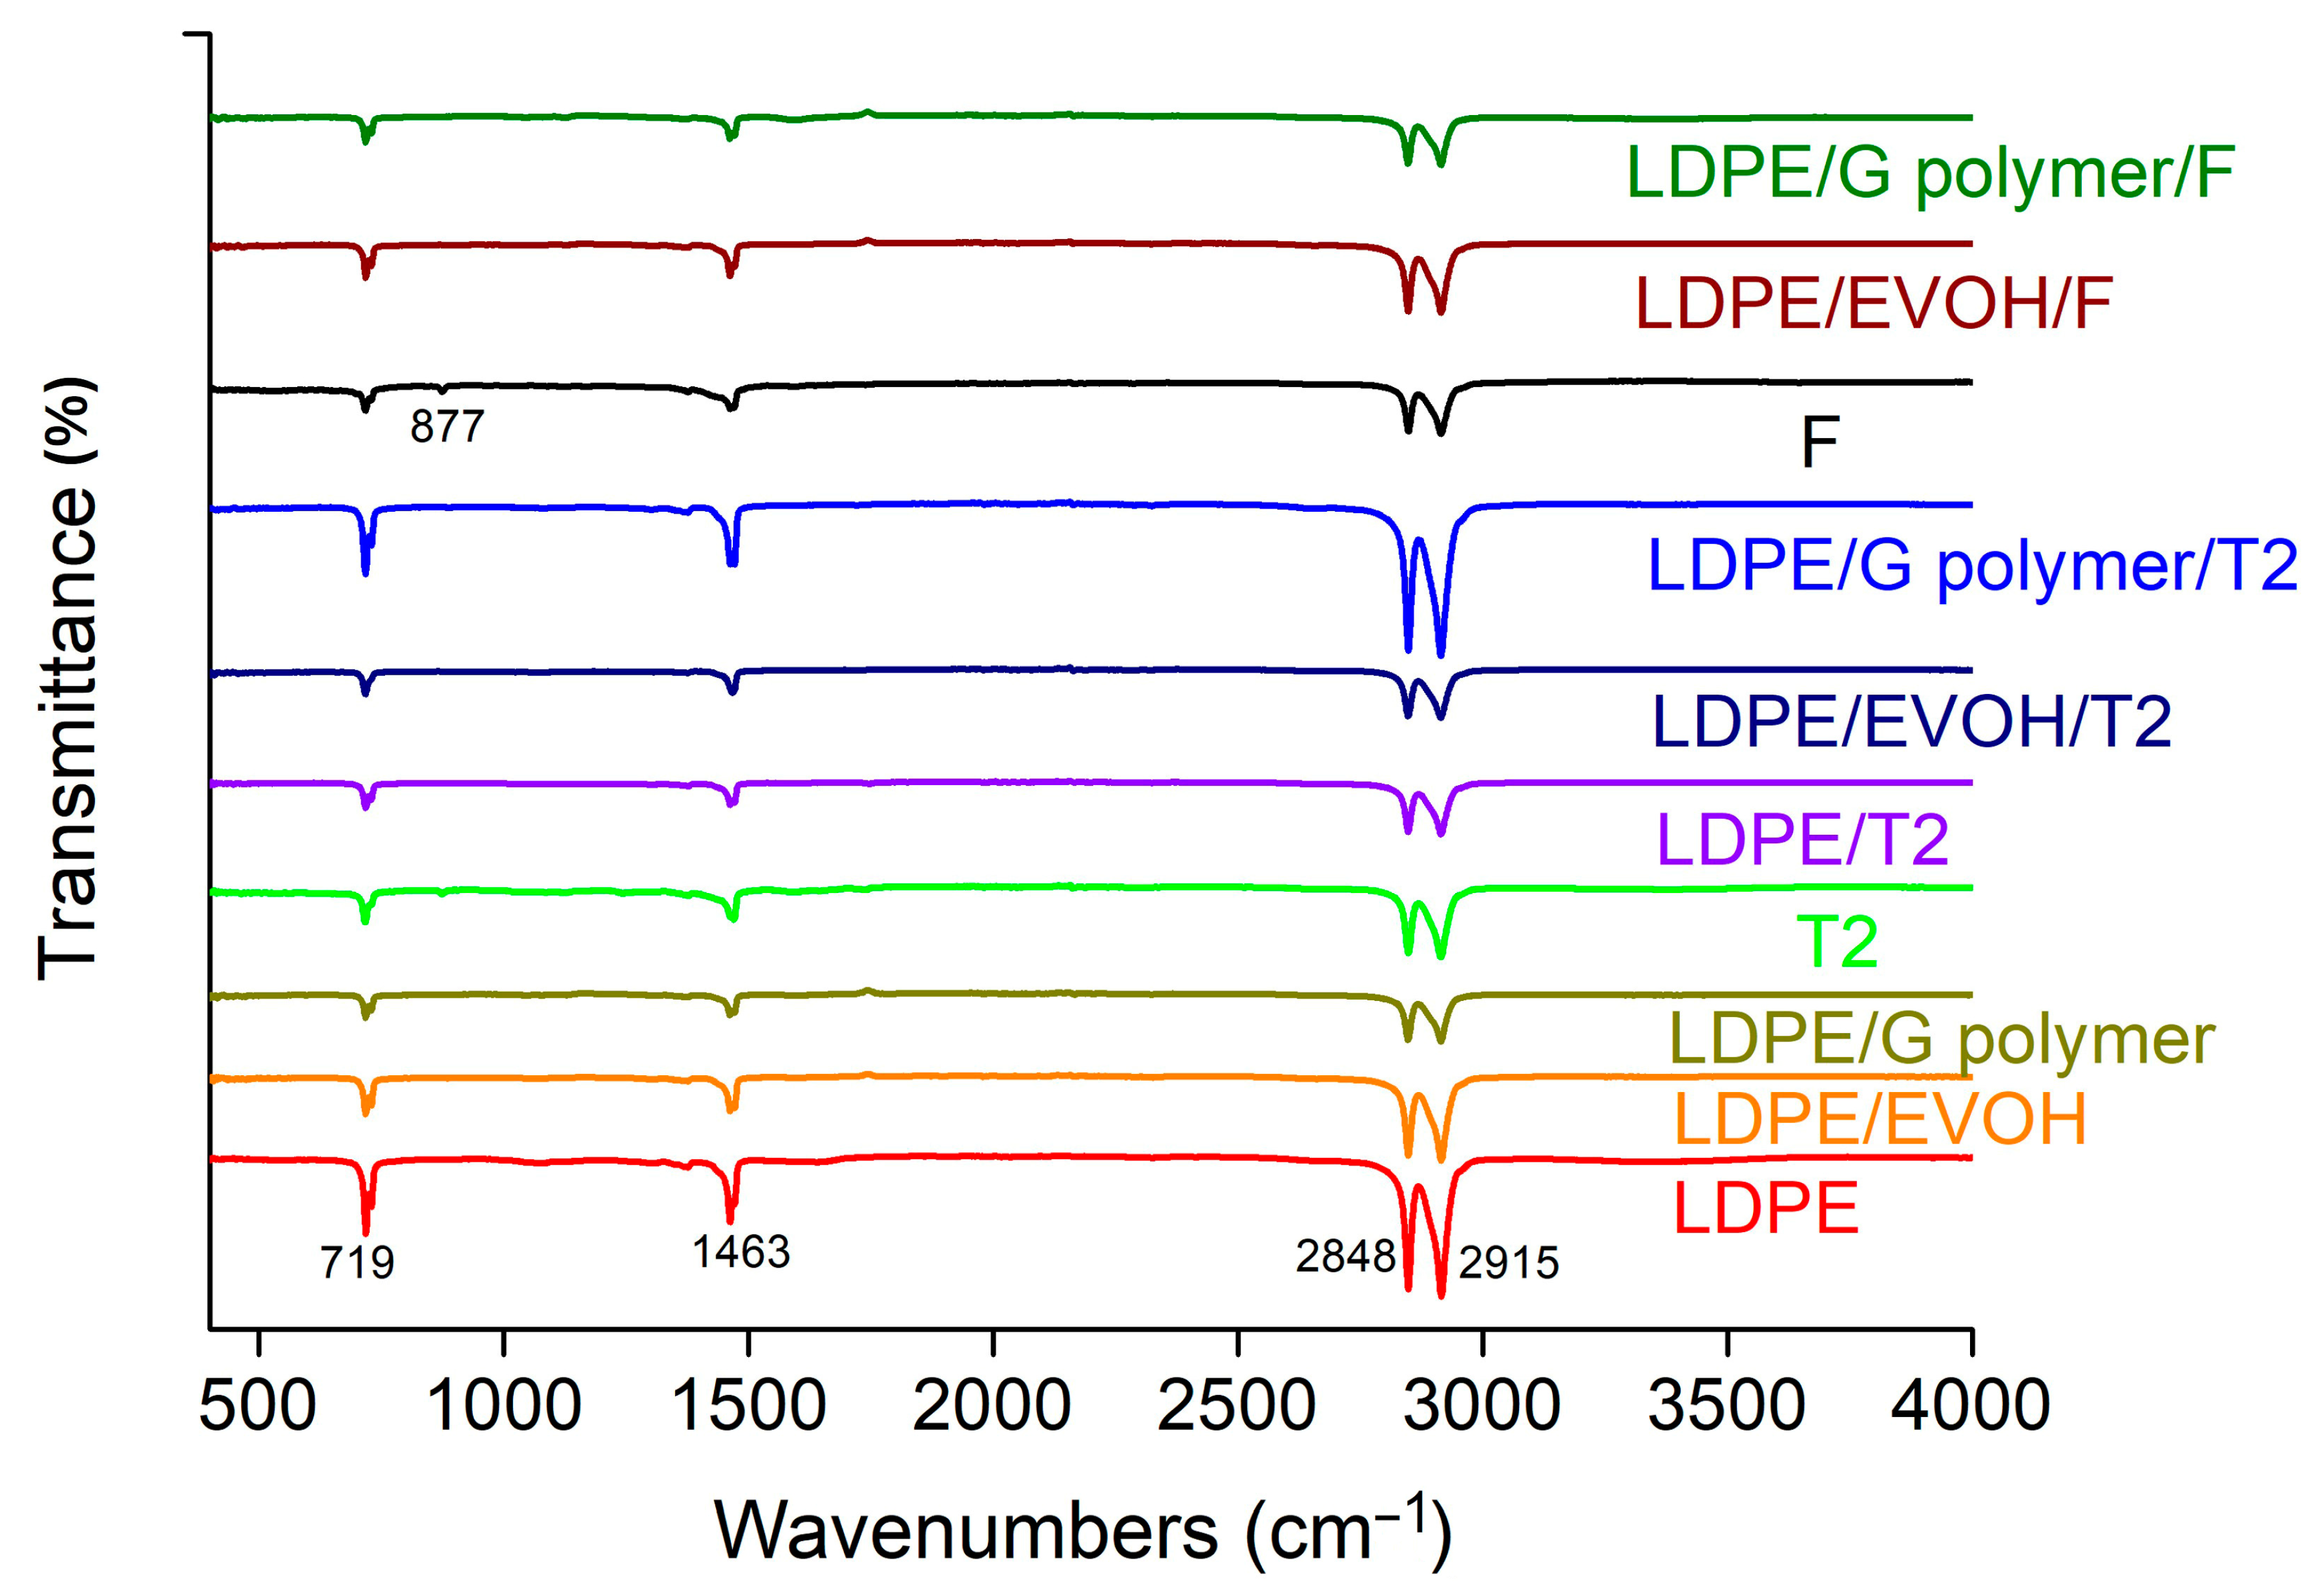
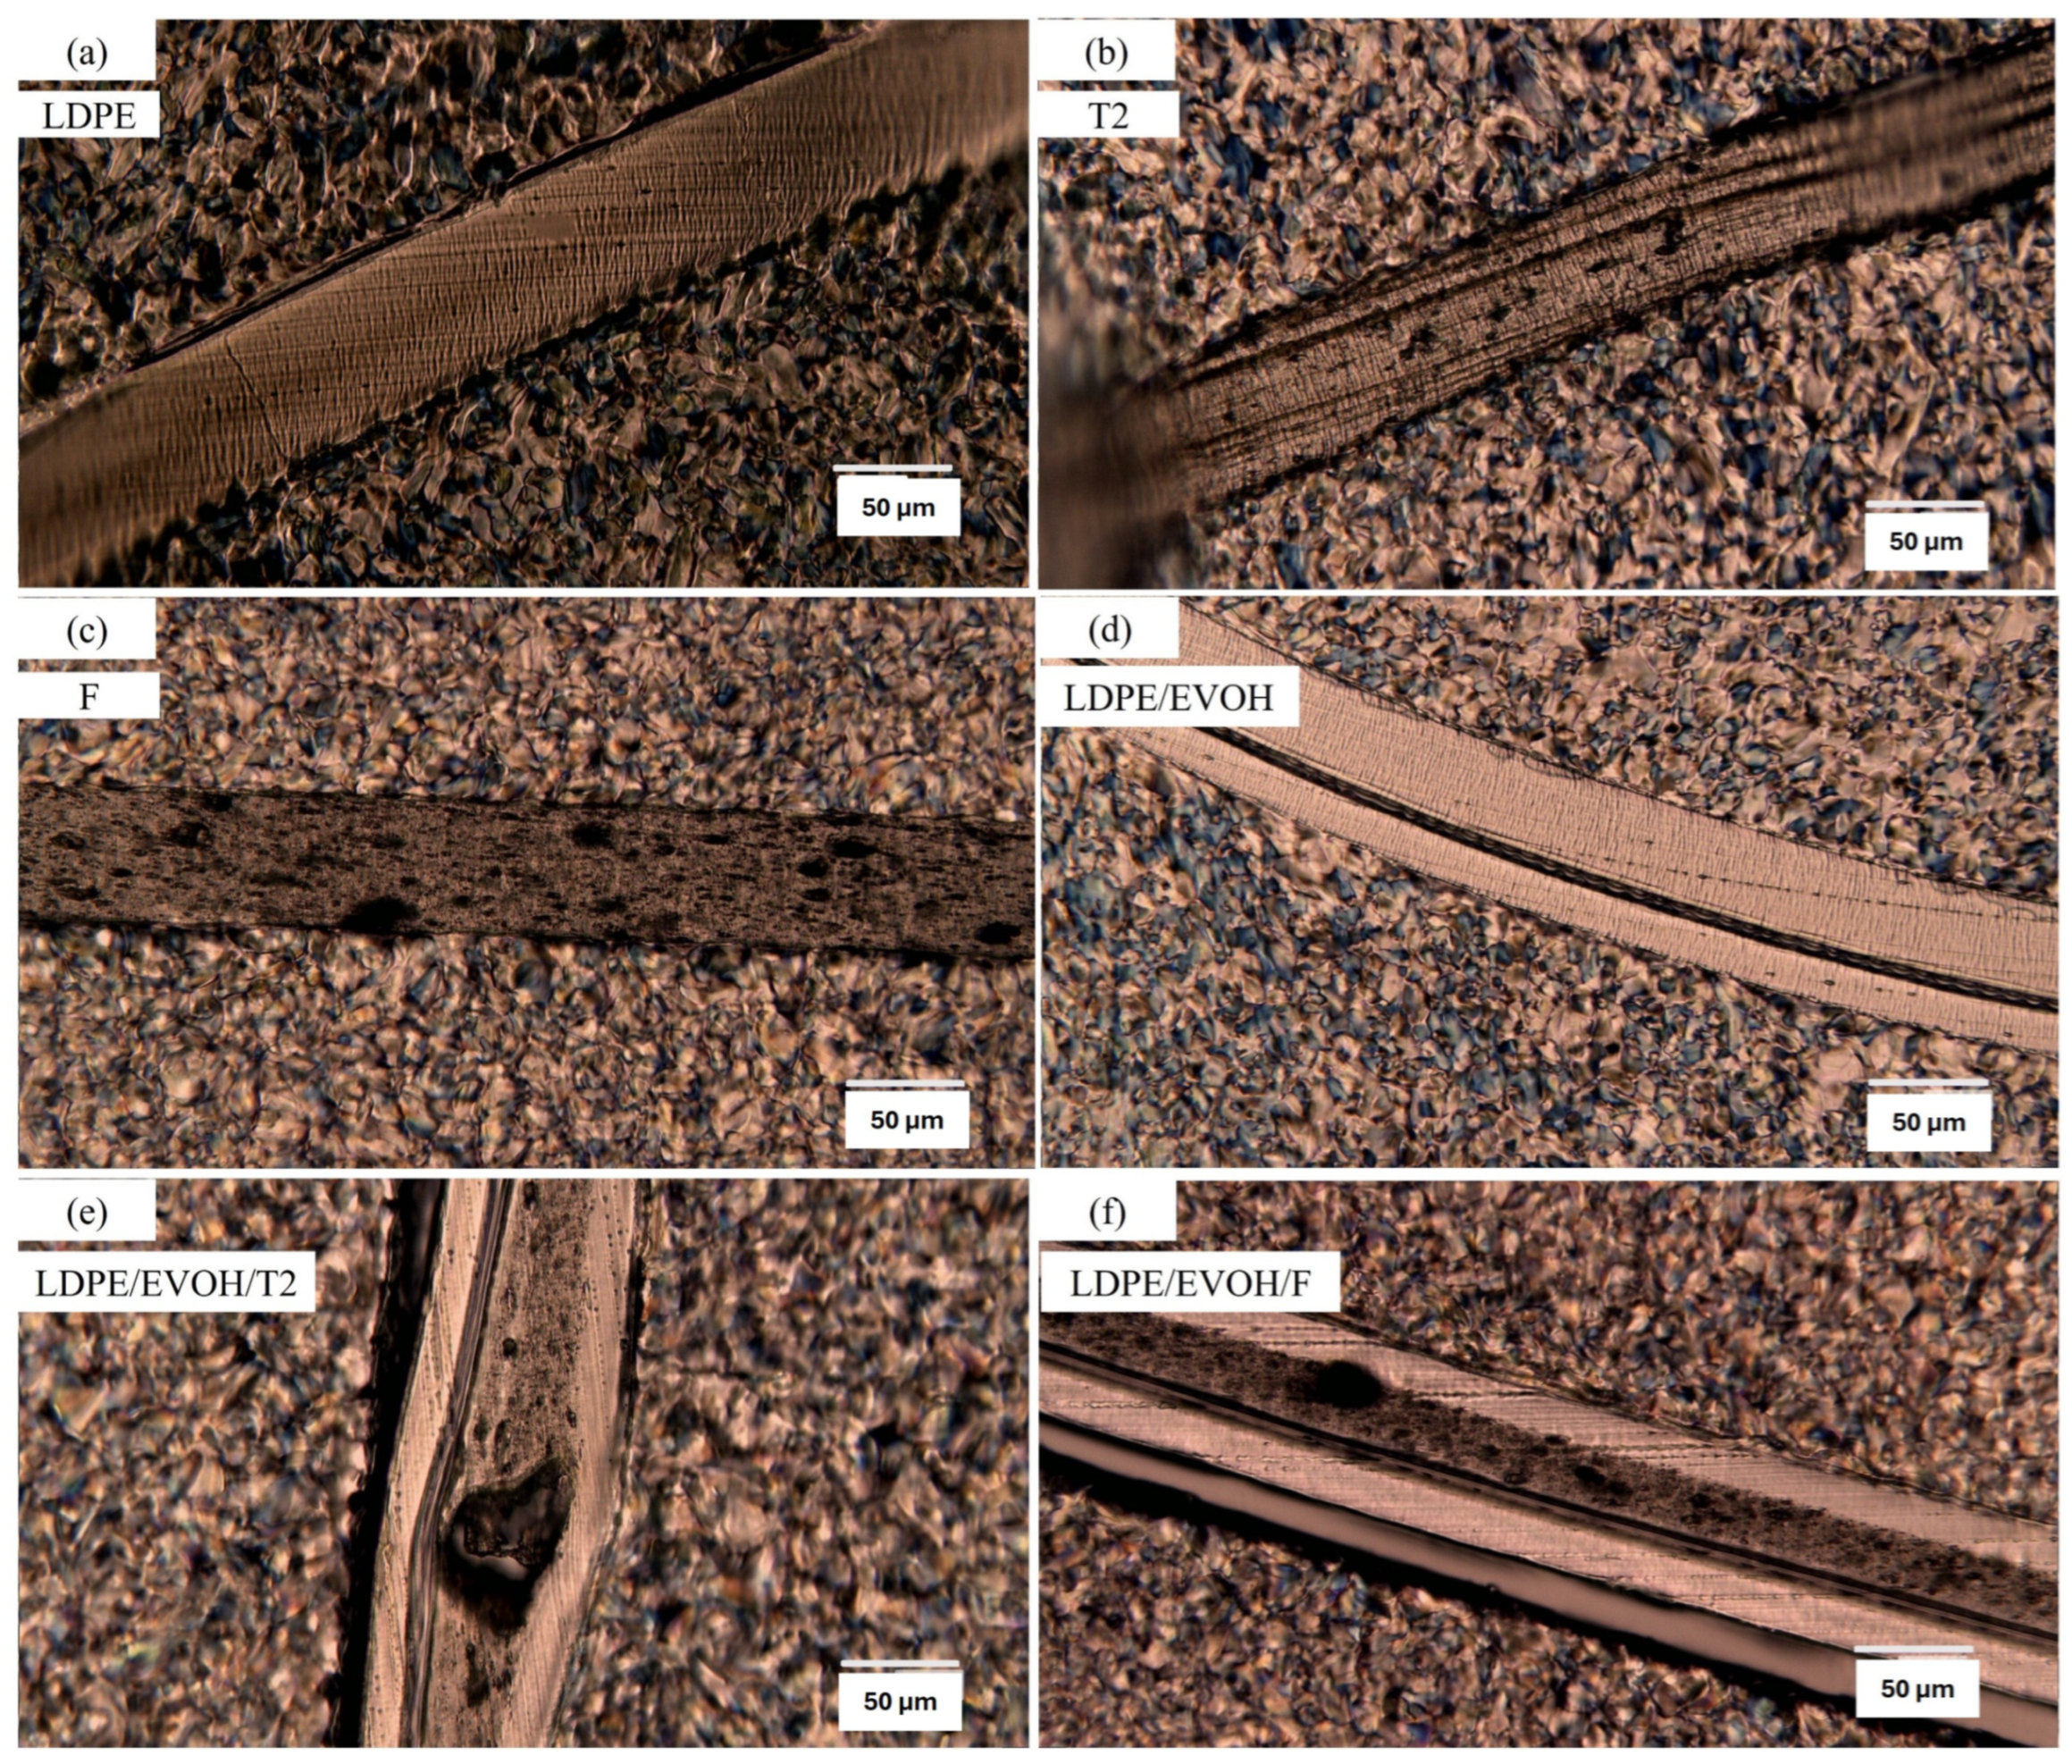
2.1. FT-IR Spectroscopy and Light Microscopy
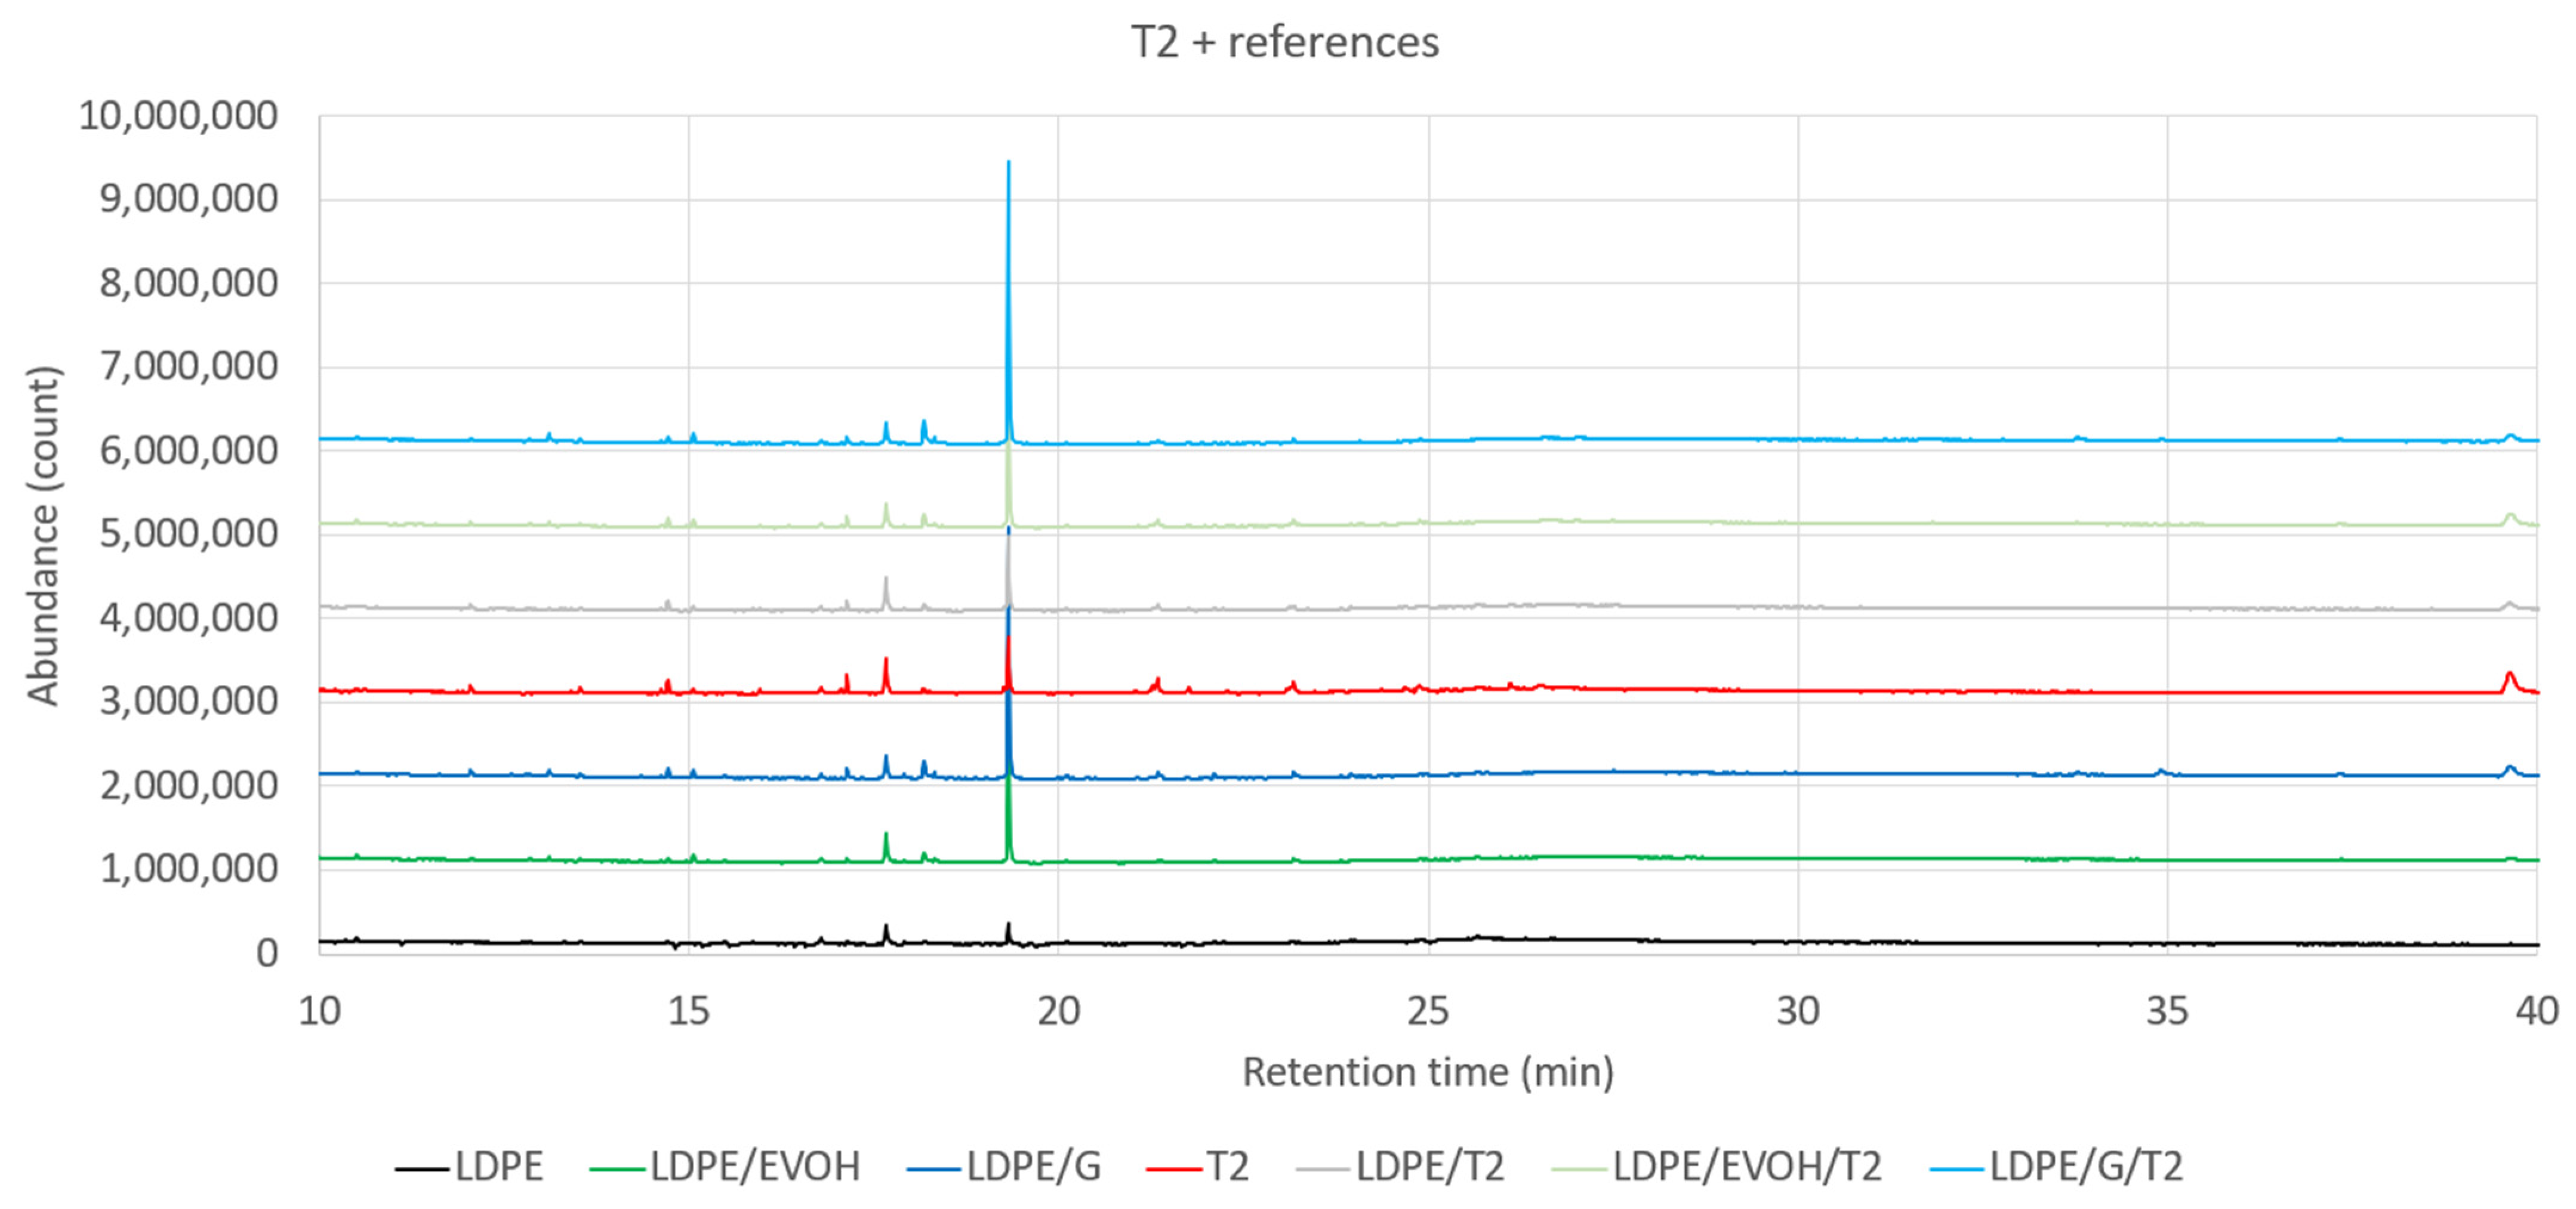
The surface FT-IR measurements of all samples, including virgin and recycled materials, are shown in Figure 1. All samples show significant peaks (2915 cm−1, 2848 cm−1, 1463 cm−1 and 720 cm−1) that can be attributed to LDPE (also see Katsara et al. [19] and Lin et al. [20]). However, when comparing the individual measurements, no difference was found between virgin and recycled material (T2 and F), and EVOH and G-polymer could not be detected in these analyses. Among all the measurements, only one sample (F) showed an unidentifiable peak at 877 cm−1. The peak of sample F, which consisted of a recycled monomaterial based film, indicates possible contamination. Due to the very low intensity of the peak, the degree of contamination is also considered to be low.
Figure 2 shows the cross-section of selected samples using a polarized light microscope. Layer structures and interfering particles can be seen clearly in the form of dark dots and lines in the foil, which appears in a bright color. It also concludes that FT-IR alone could not detect all impurities present in the recycled content. In addition to the cross-section images, the thickness of the different layers and particles size was measured using the software of the microscope. All layer thicknesses, from the LDPE layers to the adhesive layers, are in accordance with the specification values from Table 1.
Film T2 has a colloidal particle [21] or inorganic foreign particle distribution of 1.3 ± 0.03 per unit area of the film and film F has similar distribution of particle to T2 (1.6 ± 0.06 per unit area of the film). Like the particle distribution per unit area of the recycled films (also see Figure A1), the particle size in T2 (L:20 µm × W:10 µm) and F (L:17 µm × W:9 µm) also did not vary significantly. In the case of LDPE/EVOH with recycled materials (see Figure 2, LDPE/EVOH/T2 and LDPE/EVOH/F), the average particle size is smaller than the layer of the recycled material (21 µm to 30 µm), but large particles (53 µm × 39 µm) can impair the barrier properties or even cause them to fail completely, depending on the position of the particle in the layer structure.

2.2. GC-MS

A total of 35 chemical compounds have been detected and quantified (see Table A2, Table A3 and Table A4). Among these chemical compounds, 8 unknown components were identified and quantified in accordance with the EU regulation 10/2011 with an SML of 10 ppb. The focus is on the relative reduction of migrated substances behind functional barrier systems from recycled materials T2 (see Table 1 and Figure 3) and F (see Table 2 and Figure 4). It can be observed that LDPE virgin also acted as a functional barrier for T2 (see Table 2), with reductions from 46% (for 1-octadecane) to 100% (for butyl citrate, cyclohexane, 1,3,5-triphenyl and erucamide). For some of the samples, the addition of EVOH did not have any additional influence on the relative reduction, while with G-polymer all samples had a higher reduction (from 64 to 100%). G-polymer had better barrier properties than EVOH, for 6 out of 11 chemicals migrated from T2. Similar trends were observed between the samples containing recycled F materials (see Table 3), as G-polymer performed better than EVOH for 13 out of 16 chemicals.
The number of unknowns increases particularly in the recycled material F, which can be seen in the semi-quantitative GC-MS results (see Table A4). In the other recycled material T2 (see Table A3), the number of unknowns is lower but still much higher compared to the virgin LDPE material (see Table A2). Four unknowns in virgin LDPE, six unknowns in recycled sample T2 and eight unknowns in recycled sample F exceeded the threshold of 0.01 mg/kg.

2.3. Miniaturized Ames Test

Detailed results of the ten tested samples can be seen in Table 4 and Figure 5. None of the tested samples showed mutagenicity for the bacteria strain TA100 with and without metabolic activation (+/−S9). In addition, no inhibiting effects were observed, which is why the spike recovery is not shown in Table 3 or Figure 5. For the procedural blanks, no mutagenic or inhibitory effects were detected. The comparison of the n-fold inductions of migrate A and B with TA98 +S9 of all the tested samples can be seen in Figure 5.
The three samples LDPE, LDPE/EVOH and LDPE/G-polymer (see Table 4), which only contain the virgin LDPE material, showed no mutagenic effects in the miniaturized Ames test in all the tested strain conditions. In contrast, the recycled material T2 showed a positive result up to 25% for migrate A and up to 50% for migrate B with a maximum n-fold induction of around 7 (see Figure 5) in the strain TA98 +S9. The sample LDPE/T2 showed a weak positive result up to 50% for migrate A with a maximum n-fold induction of 2.6. Migrate B showed no mutagenic effects, which means that the sample LDPE/T2 gave ambiguous results in both migrates. Migrate A of the sample LDPE/EVOH/T2 showed no mutagenic effects, but migrate B showed a positive result up to 50% of the sample migrate with a maximum n-fold induction of 5.0. Thus, sample LDPE/EVOH/T2 also gave inconclusive results. The fourth sample containing T2 (LDPE/G-polymer/T2) showed a negative result for migrate A, but for migrate B, a weak positive result with a n-fold induction of 2.3 at 100%. Therefore, sample LDPE/G-polymer/T2 also gave equivocal results. The recycled sample material F showed strong mutagenic effects in both migrates (A and B) with a maximum n-fold induction of 28 (see Figure 5). Migrate A scored a positive result up to 6.25% and migrate B up to 12.5% in the bacteria strain TA98 +S9. Without metabolic activation (TA98 −S9), migrate A scored a positive result at 100% and migrate B scored a negative result. The sample LDPE/EVOH/F was also strongly positive but with a lower n-fold induction of approximately 20. Both migrates (A and B) showed mutagenic effects up to 12.5%. With the bacteria strain TA98 −S9, migrate A had a negative result and migrate B a positive result at 100% of the sample migrate. The sample LDPE/G- polymer/F also scored a positive result with TA98 +S9, but with a much lower n-fold induction compared to the reference sample F (maximum n-fold induction of 11.0). Migrate A scored a positive result up to 12.5% and migrate B up to 50%.
The miniaturized Ames test results of samples containing the recycled LDPE materials T2 or F showed very similar results reported by Mayrhofer et al. [8]. Most of the positive results were only positive in the strain condition TA98 +S9, except for two samples which were also positive in the strain condition TA98 −S9 (see Table 4, sample F and LDPE/EVOH/F). Four out of ten samples were clearly positive in the test strain condition TA98 +S9 and three gave equivocal results, which means only one of the two migrates (A or B) was positive. A possible explanation could be that different parts of the film were migrated (in total 3 dm2 for 300 mL 95% ethanol per migration) where the functional barriers were ineffective due to large particles in the recycled material T2 (also see Figure 2, e.g., sample LDPE/EVOH/T2). In some areas that were used for migration, the particles may have damaged the barrier properties, while in other areas the barriers remained intact. In this case, a higher amount of toxicologically relevant substances of the recycled material T2 could have migrated out of the material. This could also be a reason why the samples containing T2 with additional layers gave ambiguous results for both migrates. The large particles in the recycled films, which may have damaged the barrier properties, can be seen in some of the microscopy images in Figure 2 and Figure A1. The samples containing the recycled material F also scored Ames positive results but the reduction of n-fold induction with additional layers was still visible. For example, the G-polymer barrier in sample LDPE/G-polymer/F (see Figure 5) showed a clear reduction of n-fold induction, and therefore, mutagenicity in the Ames test. Nevertheless, all samples containing the recycled material F showed a clear dose–response and a positive result in all the tested samples. This might be the case because the recycled material F itself showed strong mutagenic activity in the Ames test and the additional film layers could not completely prevent the migration of all toxicologically relevant substances.

3. Materials and Methods

3.1. Materials

Low-density polyethylene (LDPE) (LDPE Borealis grade FT5230, sourced from Nexeo Plastic Europe in Barcelona, Spain), specifically designed for packaging film applications was utilized as a reference sample and as the virgin outer layer in direct contact with food in the ABA structures. Ethylene vinyl alcohol (EVOH EvalTM E171B) intended for food contact as the barrier layer was obtained from Kuraray (EVAL Europe N.V. Melsele, Belgium). Amorphous vinyl alcohol resin (G-Polymer™) was provided by Mitsubishi Chemical Europe GmbH, Düsseldorf, Germany. Recycled materials T2 and F were supplied by a European supplier (specific supplier information is available from the authors). The ten investigated samples with various film structure and thickness can be seen in Table 4.

3.2. Methods

3.2.1. Polymer Processing

Among the set of samples in Table 1, three samples were monomaterial films, labeled as LDPE, T2 and F. These were produced using a Collin monolayer lab-scale extruder equipped with a 25 mm screw, a die gap ranging from 0.8 to 2 mm and a winder capable of handling widths up to 350 mm. The maximum output capacity of this setup was 8 kg/h, with a length-to-diameter ratio (L/D) of 25.
An additional seven samples, characterized as ABA structures, were manufactured using a 7-layer Collin coextrusion blown film pilot line. This extruder featured five 25 mm screws and two 30 mm barrier screws, with die gap settings ranging from 1.5 to 2.0 mm. The winder for these samples could accommodate widths up to 550 mm (lay flat) and had a maximum output capacity of 75 kg/h, with a length-to-diameter ratio (L/D) of 30.

3.2.2. FT-IR and Light Microscopy

The characterization of the surface of each recycled film sample was analyzed with a Fourier Transform Infrared spectroscopy (FT-IR) for the respective material composition. The device used was a Spectrum Two (PerkinElmer Co., Ltd., Waltham, MA, USA) equipped with a universal attenuated total reflectance accessory (U-ATR), a LiTaO3-MIR-detector and the Software Spectrum 10 (Version: 10.6.2). The spectral range for this experiment was defined from 4000–400 cm−1 with a resolution of 4 cm−1 [22]. For this experiment, 4 scans per analysis were sufficient according to Simoneau et al. [23]. To compare the measurements with each other, LDPE was used as a reference sample, as LDPE is present on the surfaces of most of the samples, except for samples T2 and F of this test series.
The structure of the samples was further analyzed with a transmitted light microscope with polarized light (Motic® Panthera L Microscope, Hong Kong, China) and an integrated digital smart cam. Four microtome sections with a thickness of 10–20 µm of the cross-section of each sample were obtained with a Microm HM 450 (Thermo Scientific, Waltham, MA, USA). In contrast to Simoneau et al. [23], the samples were embedded in 60 °C warm paraffin with the modular tissue embedding centre EC 350 (Especialidades Médicas MYR, S.L.; Spain) on an embedding cassette as in the case of histological examinations. Before the sections were placed on a microscope slide, they were put in a water bath at 40 °C to prevent errors due to wrinkling of the cooled paraffin. Those sections were then analyzed under a light microscope. The thicknesses of the foils and their layers were analyzed with the Software Panthera App (Version: 1.0.2.38-build-180710) of the microscope. In addition, the size of ten particles per sample, bigger than 5 µm, was measured with the same software of the transmitted light microscope. These measurements were only carried out on samples T2, LDPE/EVOH/T2, F and LDPE/EVOH/F, the average length and width of the particles were calculated as well. The distribution of interfering particles in film T2 and F was determined by manually counting the number of particles in five 66 cm2 pieces of the film samples, using a colony counting and zone measuring instrument by Synoptics (ProtoCOL 3, Cambridge, UK). The average value per unit area was analyzed and calculated for comparative differences.

3.2.3. Migration and Pre-Concentration

The ten samples from Table 1 were migrated based on the EU regulation 10/2011 [4] and Rainer et al. [12] with slight adaptations. For each sample, two individual migrations were prepared and tested. Glass bottle-based migration (Schott bottles with Polytetrafluoroethylene (PTFE) caps) with a surface/volume ratio of 1 cm2/mL and 300 mL 95% ethanol diluted from ≥ 99.9% ethanol (LiChrosolv® gradient grade for liquid chromatography, Merck, Darmstadt, Germany) was carried out for films (without EVOH or G-polymer) where total immersion was possible. The other films (with EVOH or G-polymer) were migrated only on the inner surface in migration chambers. The migration process was carried out at 60 °C for 10 days in a thermal oven (Lab Oven Thermo Scientific Heratherm OGS180) to cover long-term storage above six months at room temperature according to EU regulation 10/2011 [4]. After migration, 3 mL of the unconcentrated migrates was collected for the GC-MS analysis. To attain higher concentrations of the target substances, samples were concentrated by a Rotavapor® R-300 (BÜCHI Labortechnik AG, Flawil, Switzerland) at 40 °C on 70 mbar pressure and 150 rpm. The samples were concentrated approximately 300-fold to 1 mL and 1 mL dimethyl sulfoxide (DMSO, ≥99%, Merck, Darmstadt, Germany) was added to the migrates. The remaining ethanol was removed by a Visiprep™ SPE vacuum manifold DL (Supelco®, Bellefonte, PA, USA) between 200 and 700 mbar under a constant air stream. Procedural blanks consisting of only 95% ethanol were run in parallel to the process under the same conditions. The samples were stored at 4 °C until the analysis.

3.2.4. GC-MS

Chromatographic analysis was performed to identify the migrants from the films for the specific migration. For the GC-MS analysis, 3 mL of the unconcentrated migrates was collected and tested. An Agilent 6890N coupled to an Agilent 5973 Network Mass Selective Detector and a Gerstel MPS2 Autosampler was used for the GC-MS analysis. For separation, a Zebron ZB-5MSPlus column (30 m × 0.25 mm × 0.25 mm, Phenomenex) was used as split injection (2:1 ratio) with a temperature range from 60 °C to 300 °C at a heating rate of 10 °C/min and a total run time of 45 min. The chromatograms obtained from the migration samples of all 10 samples were compared to determine the efficiency of functional barrier systems on migration from a recycled mid layer and safety assessment of all sample systems. Quantification was performed using alkane standards and according to calibration curves and response factors for closest retention time match. Identification or classification was carried out with obtained mass spectra and available databases. Specific migration was expressed in mg/kg of food.

3.2.5. Criteria for Evaluating the GC-MS Analysis

The interpretation and substance identification of the chromatogram and the mass spectrum is based on the WR11e/NIST17 GC-MS library available with >1 million substances together with a high number of own references and previous analyses of recycled materials. The substances can be identified are either IAS (intentionally added substances) or NIAS (non-intentionally added substances). The risk of identified substances is assessed according to their registration in the list of substances in EU 10/2011 [4], Swiss ordinance for printing inks [24], their Cramer Class evaluation [7] or in the Registration, Evaluation, Authorisation and Restriction of Chemicals (REACH) list of Substances of Very High Concern (SVHC) [25].
When identifying peaks, not only the match of the search is important, but also the specificity. A match above 950 of 999 for a high concentration peak is generally a safe identification, while a match closer to 800 for a high concentration peak is likely not that exact compound, but a compound of similar structure, and therefore, in many cases it is of similar toxicity. Identified compounds with a low match were confirmed based on previously analyzed standards due to specific fragmentation ions and retention times. Retention index (RI) is based on retention time compared to an analyzed alkane standard. A substance that elutes at the exact same time as a C14 alkane will show an RI equal to 1400. A substance that elutes halfway between a C14 alkane and a C15 alkane will show an RI of 1450, regardless of what the actual retention time is. This allows for the comparison of substances analyzed on similar columns, even if they were analyzed on different temperature gradient programs.
Identified compounds that are not listed in EU regulation 10/2011 have been given an SML value according to the Threshold of Toxicological Concern (TTC) approach. Substances are then classified according to their structure using the ToxTree software [26,27] and assigned to a Cramer Class. The values for the Cramer Classes I, II and III are 1.8, 0.54 and 0.09 mg/kg. As SML values of EU regulation 10/2011 have values from 60 mg/kg to 0.05 mg/kg, the Cramer Classes are not the upper or lower limits, as compounds can be classified as >1.8 mg/kg and <0.09 mg/kg. Unknown peaks are peaks with a very poor search result that cannot be positively identified by spectrum or retention time, and that cannot be tentatively identified as unknown saturated hydrocarbon. These compounds are given an SML of 0.010 mg/kg, equal to 10 parts per billion (ppb).

3.2.6. Miniaturized Ames Test

The concentrated migrates were tested with a miniaturized Ames test based on the Ames MPFTM manual from Xenometrix [28], except for minor modifications. The used miniaturized Ames test, which is a fluctuation assay carried out in liquid media, was already applied in previous publications from Rainer et al., 2019 [12] and Mayrhofer et al. 2023 [8]. The specific chemicals which were used for the miniaturized Ames test are listed in Table A1 in Appendix A. The Salmonella Typhimurium test strains TA98 (PSS-0110) and TA100 (PSS-0111) were provided by Xenometrix (Allschwil, Switzerland). The bacteria were grown as overnight cultures in 10 mL Nutrient Broth No. 2 with the addition of 10 µL ampicillin. The bacteria were used after reaching an OD at 600 nm ≥ 2 which is equivalent to approximately 109 cfu/mL. As the negative control, DMSO was used. Positive controls were used according to the Ames MPFTM manual by Xenometrix [28]. For TA98, 2-AA (end concentration 0.5 µg/mL) and 2-NF (end concentration 2 µg/mL) were used. For TA100, 2-AA (end concentration 1.25 µg/mL) and 4-NQO (end concentration 0.1 µg/mL) were used. For the samples, a serial dilution (1:2) with DMSO was prepared; 10 µL of each control and sample concentration was pipetted in triplicate into 24-well plates (VWR International, Radnor, PA, USA) and mixed with 240 µL exposure mix. The exposure mix consisted of TA98 of 10% bacteria for TA100 of 5% bacteria and exposure medium. For the tests with metabolic activation (+S9), 15% of the exposure mix consisted of S9 mix (2.25% S9 and 12.75% cofactors). Phenobarbital/ß-Naphtoflavone induced lyophilized rat liver S9 (Lot FB1564) provided by Xenometrix (Allschwil, Switzerland) was used.
The exposure medium was prepared according to ISO NORM 11350 [29]. It contained 0.02% MgSO4∙7 H2O, 0.2% citric acid, 1% K2HPO4, 0.35% NaNH4HPO4∙4 H2O, 0.44% glucose, 0.6% biotin and 0.1% histidine. The cofactors were prepared according to Hamel et al. [30]. They contained 55.6% phosphate buffer (0.2 M, pH 7.4), 4.4% NADP, 0.6% G-6-P and 2.2% KMg. To test for inhibiting or toxic effects, every sample was additionally pre-incubated with a spiked exposure medium with the positive controls of the respective test/strain condition in the same end concentration. The plates were then pre-incubated at 37 °C and 250 rpm for 90 min in an orbital shaker. After pre-incubation, 2.6 mL of indicator medium was added to each well and the content of one 24-well plate was distributed to three 384-well plates (VWR International, Radnor, PA, USA). The indicator medium was prepared according to ISO NORM 11350 [29]. It contained 0.04% MgSO4∙7H2O, 0.4% citric acid, 2% K2HPO4, 0.7% NaNH4HPO4∙4H2O, 0.49% glucose, 2.06% biotin and 2.82% bromocresol purple indicator. The 384-well plates were incubated for 48 to 72 h at 37 °C (Cooling incubator KT 115, Binder GmbH, Tuttlingen, Germany). After incubation, all the yellow wells of the 384 plates which indicated a positive well were scored. Bromocresol purple in the indicator medium is responsible for the color change from purple to yellow. Bacterial growth produces acidic metabolites which cause the change to a lower pH and color change.

3.2.7. Evaluation Criteria for the Miniaturized Ames Test

After scoring the 384-well plates, evaluation criteria according to the test protocol by Xenometrix [28] were used with minor adjustments. For each experiment, the mean number of revertants of the negative and positive controls was documented and compared to the historical data provided by Xenometrix [31]. Experiments that did not meet the validation criteria were excluded from further evaluation and were repeated. First, the baseline was determined for each individual experiment. It was calculated by the mean number of revertants of the negative controls plus one standard deviation. If the mean number of revertants of the negative controls was <1, the baseline was set to 1. The positive threshold value was determined by multiplying the baseline by two. Afterwards, the n-fold induction of each dilution of the sample migrate was determined. The n-fold induction was calculated by the mean number of revertants of the sample concentration divided by the baseline. Samples with an n-fold induction < 2 were classified as non-mutagenic. If the mean number of revertants of a sample concentration surpassed the positive threshold (n-fold induction ≥ 2), the sample was classified as mutagenic. In addition, the lowest dilution which still exceeded the positive threshold was given in % as the lowest effective concentration (LEC) of the sample migrate and can be seen in Table 3. Two individual migrates (A and B) of each sample were tested and evaluated. If one of the two migrates was positive and the other negative, the sample was classified as equivocal. Furthermore, the spike recovery of each sample concentration was determined by dividing the mean number of revertants of the spiked sample concentration by the mean number of revertants of the negative controls, which was defined as 100% spike recovery. If the spike recovery of a sample concentration was <60%, the sample was classified as inhibitory, as these levels of cytotoxicity could mask positive effects.

4. Discussion

The microtome cuts revealed the presence of particles in the multilayer structure of the films under observation. Similar evidence was also observed by Spalding et al. [32], where black specs in the pellets from recycled PE were found. In the same study, the authors found a birefringent particle embedded in a gel in a multilayer PE structure. Although FT-IR investigations revealed the particle to be composed of polyester and cellulosic fiber, no difference was observed in the peaks from the virgin PE in our study. Thus, the precise origin and nature of the particles remain uncertain. The uniform distribution of the particles across the polymer matrix could be attributed to the oxidation or crosslinking of the PE chains, which may have been initiated by the presence of trace contamination from the recycling stream.
However, the Ames test results of the recycled materials in this study showed an effect-based hazard that has not yet been identified. According to the miniaturized Ames test results from Mayrhofer et al. [8], a significant amount of high-diffusive recycled materials such as polyolefins showed an increased mutagenic activity in the Ames test. This also correlates with the miniaturized Ames test results from this study, as four out of ten tested samples showed a clear Ames positive result in two individual migrates. Although the substance or group of substances that caused the increased mutagenic activity has not yet been identified, the mutagenic activity is increased after high-thermal mechanical recycling processes. Degradation products or reaction by-products of certain residues might increase the number of unidentified NIAS and potentially genotoxic substances.
According to Adahchour et al., genotoxins have a very wide variety of physical-chemical properties [33], thus high-performance liquid chromatography (HPLC)–MS methods are additionally recommended to cover a broader spectrum of genotoxins, including semi-volatile and involatile substances. As many unknowns already exceeded the SML threshold of 0.01 mg/kg, genotoxic substances with a threshold of 0.00015 mg/kg cannot be excluded at these levels by solely using GC-MS. Therefore, in vitro bioassays, which screen for specific toxicological endpoints such as the Ames test for direct DNA-reactive substances, are recommended by the International Life Sciences Institute (ILSI) [10,14] to support the risk assessment of unidentified NIAS. Additional in vitro or in silico methods such as quantitative structure–activity relationship (QSAR) models (see Ma et al. [34] and Djelassi et al. [35]) can further support the toxicological evaluation of unidentified substances in the forest of peaks obtained from chromatographic analysis.

5. Conclusions

The results of this study confirmed that GC-MS alone is not sufficient to detect all unidentified NIAS, as many unknowns already exceeded the SML threshold of 0.01 mg/kg. The study also showed the following points regarding functional barriers:
  • The recycled sample material F exhibited stronger mutagenic effects than the other recycled material T2 in both migrates (A and B) with a maximum n-fold induction of 28.
  • The additional film layers can effectively reduce migration, but the migration of all toxicologically relevant substances could not be fully prevented. A combination of virgin LDPE and EVOH reduced the n-fold induction by about one third compared to material F, and virgin LDPE combined with G-polymer reduced the n-fold induction by about two thirds.
  • In some of the samples, the addition of EVOH did not decrease the relative reduction of migrated substances, whereas with G-polymer, all samples showed a higher reduction (ranging from 64% to 100%).
  • G-polymer demonstrated superior barrier properties compared to EVOH for 6 out of 11 chemicals that migrated from T2. Similar trends were observed in samples containing recycled material F, where G-polymer also outperformed EVOH for 13 out of 16 chemicals.
Nevertheless, light microscopy images revealed differences in quality and an increased number of particles in both recycled materials T2 and F. Depending on the size and position of these particles, the functional barriers of the films can be damaged, which could increase the migration of potentially hazardous substances and pose an increased toxicological risk. Therefore, barrier properties still need to be improved and higher quality recycled materials should be used and re-evaluated. Optimal recycled content should be determined from both perspectives in order to be considered as safe for use in food packaging applications in line with new requirements such as the proposed PPWR [36].

Author Contributions

Conceptualization, L.P., S.B. and T.R.; methodology, L.P., S.B., E.O., M.N., T.R., S.A. and N.S.; investigation, S.B., E.O., M.N., L.P., T.R. and S.A.; writing—original draft preparation, L.P. and S.B.; writing—review and editing, L.P., S.B., T.R., S.A., B.R. and M.K.P.; visualization, L.P. and S.B.; supervision, B.R. and M.K.P. All authors have read and agreed to the published version of the manuscript.

Funding

This research was funded by the Research Council of Norway, grant number 320461, (RecyFoodPack Project). Also, this publication is based upon the work carried out during the Short-Term Scientific Mission of the network project COST Action 19124, Rethinking Packaging for Circular and Sustainable Food Supply Chains of the Future (CIRCUL-A-BILITY) supported by COST (European Cooperation in Science and Technology).

Data Availability Statement

The data presented in this study are available on request from the corresponding author.

Acknowledgments

We would like to thank Silvia Apprich, head of the sector Packaging and Resource Management, for providing us with the necessary resources, including laboratories and facilities at FH Campus Wien. We would also like to thank Karin Gstinig from the Department of Health Sciences at FH Campus Wien for providing materials and equipment for carrying out microscopy images. We would also like to thank Ole Jan Myhre from Norner AS for his valuable feedback and Mary Grace Wallis from FH Campus Wien for proofreading the manuscript.

Conflicts of Interest

Authors Smarak Bandyopadhyay, Nusrat Sharmin and Marit Kvalvåg Pettersen were employed by the company Nofima. Authors Tanja Radusin, Steffen Annfinsen were employed by the company Norner Research AS. The remaining authors declare that the research was conducted in the absence of any commercial or financial relationships that could be construed as a potential conflict of interest.

Appendix A

Table A1. List of all chemicals used for the miniaturized Ames test. Chemicals were provided by Carl Roth (Karlsruhe, Germany), Oxid (Wesel, Germany) and Sigma Aldrich (Steinheim, Germany).
ChemicalAbbreviationCAS No.Supplier
Dimethyl sulfoxideDMSO67-68-5Carl Roth
Nutrient Broth No. 2 (CM0067)--Oxid
Ampicillin sodium salt-69-52-3Carl Roth
Citric acid monohydrate ≥ 99.5%-5949-29-1Carl Roth
Magnesium sulfate heptahydrate ≥ 99%MgSO4 ∙ 7 H2O100034-99-8Carl Roth
Dipotassium hydrogen phosphate ≥ 98%K2HPO47758-11-4Carl Roth
Sodium ammonium hydrogen phosphate tetrahydrate ≥ 99%NaNH4HPO4 ∙ 4 H2O7783-13-3Carl Roth
D-glucose monohydrate-77938-63-7Carl Roth
D-biotin ≥ 98.5%-58-85-5Carl Roth
Bromocresol purple-115-40-2Sigma Aldrich
L-histidine ≥ 99%-71-00-1Sigma Aldrich
D-glucose-6-phosphat monosodium salt ≥ 98%G-6-P54010-71-8Carl Roth
NADP disodium salt ≥ 85%NADP24292-60-2Carl Roth
Magnesium chloride ≥ 98.5%MgCl27786-30-3Carl Roth
Potassium chloride ≥ 98.5%KCl7783-13-3Carl Roth
Sodium dihydrogen phosphate monohydrate ≥ 98%NaH2PO4 ∙ H2O10049-21-5Carl Roth
Disodium hydrogen phophate ≥ 98%Na2HPO47558-79-4Carl Roth
4-nitroquinoline-N-oxide ≥ 98%4-NQO56-57-5Sigma Aldrich
2-aminoanthracene 96%2-AA613-13-8Sigma Aldrich
2-nitrofluorene 98%2-NF153-78-6Sigma Aldrich
Table A2. Semi-quantitative GC-MS results for virgin LDPE samples *.
Nr.NameLDPELDPE/EVOHLDPE/G
1Unknownnd0.2340.269
2Arvin 40.0660.0580.066
3Ethyl dodecanoatendndnd
4Unknown0.1000.2520.276
5Diethyl terephthalatendndnd
6Unknownnd0.0100.006
7Arvin 60.1150.0980.082
81-octadecenendndnd
9Arvin 70.0260.0270.022
10Isopropyl myristatendndnd
11Unknown1.5141.7521.480
12Unknown0.0800.4180.754
13Unknown0.0070.1300.177
14Methyl hexadecanoatendndnd
15Dibutyl phthalatendndnd
16Ethyl hexadecanoate0.0250.0200.014
17Benzenepropanoic acid, 3,5-bis(1,1-dimethylethyl)-4-hydroxy-, ethyl ester0.4453.3264.845
18Tributyl aconitatendndnd
19Ethyl cis-9-octadecenoatendndnd
20Butyl citratendndnd
21Ethyl octadecanoatend0.0130.010
22Unknown0.0220.0490.056
23Tributyl acetylcitratendndnd
24Bis(2-ethylhexyl) adipatendndnd
251-tetracosene0.0430.0470.067
26Cyclohexane, 1,3,5-triphenyl-ndndnd
27Di(2-ethylhexyl) phthalatendnd<0.005
28Unknownndndnd
29Bumetrizolendndnd
30Di-(2-ethylhexyl) terephthalatendndnd
31Erucamidendndnd
32P168ndnd0.093
33P168-oxnd0.1100.346
34AO1076nd0.0080.018
35POSH1.81.92.5
36Total non POSH2.46.68.6
37Total amount4.38.511.1
* Red formatting on numbers indicates that the substance is above the respective specific migration limit in mg/kg.
Table A3. Semi-quantitative GC-MS results for T2 samples *.
Nr.NameT2LDPE/T2LDPE/EVOH/T2LDPE/G/T2
1Unknown0.0570.0470.2910.385
2Arvin 40.1250.0600.0620.069
3Ethyl dodecanoate0.0200.0090.0120.007
4Unknown0.1200.1500.2540.309
5Diethyl terephthalatendndndnd
6Unknown0.0100.0130.0150.013
7Arvin 60.1260.1100.0950.083
81-octadecene0.0890.0480.0400.032
9Arvin 70.0290.0270.0280.024
10Isopropyl myristatendndndnd
11Unknown2.0241.9691.4701.354
12Unknown0.1300.1640.5550.980
13Unknown0.0320.0490.0880.192
14Methyl hexadecanoatendndndnd
15Dibutyl phthalate0.0210.0080.007nd
16Ethyl hexadecanoate0.0670.0420.0360.030
17Benzenepropanoic acid, 3,5-bis(1,1-dimethylethyl)-4-hydroxy-, ethyl ester0.8621.3773.7765.655
18Tributyl aconitate0.0170.007ndnd
19Ethyl cis-9-octadecenoatendndndnd
20Butyl citrate0.018ndndnd
21Ethyl octadecanoate0.0440.0210.0230.020
22Unknown0.0300.0320.0520.062
23Tributyl acetylcitrate0.1330.0440.0160.010
24Bis(2-ethylhexyl) adipate0.0470.012ndnd
251-tetracosene0.2170.1020.1250.088
26Cyclohexane, 1,3,5-triphenyl-0.012<0.005ndnd
27Di(2-ethylhexyl) phthalate0.0680.0230.0220.016
28Unknownndndndnd
29Bumetrizole0.0470.0140.0130.008
30Di-(2-ethylhexyl) terephthalate0.1120.0310.0300.017
31Erucamide0.047ndndnd
32P168ndnd<0.0050.046
33P168-ox0.7140.2200.4990.323
34AO10760.0850.0270.0480.040
35POSH4.23.13.11.9
36Total non POSH5.34.67.69.8
37Total amount9.57.610.711.7
* Red formatting on numbers indicates that the substance is above the respective specific migration limit in mg/kg.
Table A4. Semi-quantitative GC-MS results for F samples *.
Nr.NameFLDPE/EVOH/FLDPE/G/F
1Unknown0.2000.2680.350
2Arvin 40.0930.0800.065
3Ethyl dodecanoate0.0610.0150.011
4Unknown0.2890.3360.389
5Diethyl terephthalate2.5340.0190.260
6Unknown0.0440.0290.020
7Arvin 60.1020.0790.070
81-octadecene0.1110.0630.045
9Arvin 70.0260.0240.019
10Isopropyl myristate0.1200.0600.047
11Unknown0.7590.9960.980
12Unknown0.8761.3611.892
13Unknown0.1590.1740.171
14Methyl hexadecanoate0.0520.020nd
15Dibutyl phthalate0.0510.0200.013
16Ethyl hexadecanoate0.7990.2170.153
17Benzenepropanoic acid, 3,5-bis(1,1-dimethylethyl)-4-hydroxy-, ethyl ester4.2925.7447.267
18Tributyl aconitate0.1120.0460.029
19Ethyl cis-9-octadecenoate1.2460.2970.266
20Butyl citrate0.012ndnd
21Ethyl octadecanoate0.3340.0950.081
22Unknown0.0770.0820.083
23Tributyl acetylcitrate0.2750.0730.040
24Bis(2-ethylhexyl) adipate0.2800.0910.043
251-tetracosene0.8300.4930.259
26Cyclohexane, 1,3,5-triphenyl-0.1340.0500.033
27Di(2-ethylhexyl) phthalate1.5170.4930.303
28Unknown0.2700.1110.072
29Bumetrizole0.0130.005<0.005
30Di-(2-ethylhexyl) terephthalate1.0720.4250.239
31Erucamide0.028ndnd
32P168nd0.0140.044
33P168-ox0.9930.6910.331
34AO10760.0630.0460.026
35POSH15.510.85.7
36Total non POSH17.812.513.5
37Total amount33.323.319.2
* Red formatting on numbers indicates that the substance is above the respective specific migration limit in mg/kg.
Figure A1. Surface images of the mono- and multilayer/functional barrier samples. These images are intended to reflect the distribution of particles in recycled films. There are no particles in image (a) LDPE virgin and image (d) LDPE/EVOH. In comparison, the distribution of particles can be seen in images (b) T2, (c) F, (e) LDPE/EVOH/T2 and (f) LDPE/EVOH/F.
Recycling 09 00057 g0a1

References

  1. Jung, H.; Shin, G.; Kwak, H.; Hao, L.T.; Jegal, J.; Kim, H.J.; Jeon, H.; Park, J.; Oh, D.X. Review of polymer technologies for improving the recycling and upcycling efficiency of plastic waste. Chemosphere 2023, 320, 138089. [Google Scholar] [CrossRef] [PubMed]
  2. Directorate-General for Environment, The European Commission. Proposal Packaging and Packaging Waste; The European Commission: Brussels, Belgium, 2022. [Google Scholar]
  3. The European Commission. Commission Regulation (EU) 2022/1616 of 15 September 2022 on Recycled Plastic Materials and Articles Intended to Come into Contact with Foods, and Repealing Regulation (EC) No 282/2008; The European Commission: Brussels, Belgium, 2022. [Google Scholar]
  4. The European Commission. Commission Regulation (EU) No 10/2011 of 14 January 2011 on Plastic Materials and Articles Intended to Come into Contact with Food Text with EEA Relevance; The European Commission: Brussels, Belgium, 2011; Volume 012. [Google Scholar]
  5. The European Commission. Regulation (EC) No 1935/2004 of the European Parliament and of the Council of 27 October 2004 on Materials and Articles Intended to Come into Contact with Food and Repealing Directives 80/590/EEC and 89/109/EEC; The European Commission: Brussels, Belgium, 2004; Volume 338. [Google Scholar]
  6. Kroes, R.; Renwick, A.G.; Cheeseman, M.; Kleiner, J.; Mangelsdorf, I.; Piersma, A.; Schilter, B.; Schlatter, J.; van Schothorst, F.; Vos, J.G.; et al. Structure-based thresholds of toxicological concern (TTC): Guidance for application to substances present at low levels in the diet. Food Chem. Toxicol. 2004, 42, 65–83. [Google Scholar] [CrossRef] [PubMed]
  7. EFSA Scientific Committe; More, S.J.; Bampidis, V.; Benford, D.; Bragard, C.; Halldorsson, T.I.; Hernández-Jerez, A.F.; Bennekou, S.H.; Koutsoumanis, K.P.; Machera, K.; et al. Guidance on the use of the Threshold of Toxicological Concern approach in food safety assessment. EFSA J. 2019, 17, e05708. [Google Scholar] [CrossRef]
  8. Mayrhofer, E.; Prielinger, L.; Sharp, V.; Rainer, B.; Kirchnawy, C.; Rung, C.; Gruner, A.; Juric, M.; Springer, A. Safety Assessment of Recycled Plastics from Post-Consumer Waste with a Combination of a Miniaturized Ames Test and Chromatographic Analysis. Recycling 2023, 8, 87. [Google Scholar] [CrossRef]
  9. Severin, I.; Souton, E.; Dahbi, L.; Chagnon, M.C. Use of bioassays to assess hazard of food contact material extracts: State of the art. Food Chem. Toxicol. 2017, 105, 429–447. [Google Scholar] [CrossRef] [PubMed]
  10. Koster, S.; Bani-Estivals, M.H.; Bonuomo, M.; Bradley, E.; Chagnon, M.C.; Garcia, M.L.; Godts, F.; Gude, T.; Helling, R.; Paseiro-Losada, P.; et al. Guidance on Best Practices on the Risk Assessment of Non Intentionally Added Substances (NIAS) in Food Contact Materials and Articles; ILSI Europe: Brussels, Belgium, 2015. [Google Scholar]
  11. Rainer, B.; Pinter, E.; Czerny, T.; Riegel, E.; Kirchnawy, C.; Marin-Kuan, M.; Schilter, B.; Tacker, M. Suitability of the Ames test to characterise genotoxicity of food contact material migrates. Food Addit. Contam. Part A 2018, 35, 2230–2243. [Google Scholar] [CrossRef] [PubMed]
  12. Rainer, B.; Mayrhofer, E.; Redl, M.; Dolak, I.; Mislivececk, D.; Czerny, T.; Kirchnawy, C.; Marin-Kuan, M.; Schilter, B.; Tacker, M. Mutagenicity assessment of food contact material migrates with the Ames MPF assay. Food Addit. Contam. Part A 2019, 36, 1419–1432. [Google Scholar] [CrossRef]
  13. OECD. Test No. 471: Bacterial Reverse Mutation Test; Organisation for Economic Co-Operation and Development: Paris, France, 2020. [Google Scholar]
  14. Schilter, B.; Burnett, K.; Eskes, C.; Geurts, L.; Jacquet, M.; Kirchnawy, C.; Oldring, P.; Pieper, G.; Pinter, E.; Tacker, M.; et al. Value and limitation of in vitro bioassays to support the application of the threshold of toxicological concern to prioritise unidentified chemicals in food contact materials. Food Addit. Contam. Part A 2019, 36, 1903–1936. [Google Scholar] [CrossRef] [PubMed]
  15. Flückiger-Isler, S.; Baumeister, M.; Braun, K.; Gervais, V.; Hasler-Nguyen, N.; Reimann, R.; Van Gompel, J.; Wunderlich, H.-G.; Engelhardt, G. Assessment of the performance of the Ames IITM assay: A collaborative study with 19 coded compounds. Mutat. Res. Toxicol. Environ. Mutagen. 2004, 558, 181–197. [Google Scholar] [CrossRef]
  16. Flückiger-Isler, S.; Kamber, M. Direct comparison of the Ames microplate format (MPF) test in liquid medium with the standard Ames pre-incubation assay on agar plates by use of equivocal to weakly positive test compounds. Mutat. Res. Toxicol. Environ. Mutagen. 2012, 747, 36–45. [Google Scholar] [CrossRef]
  17. Rainer, B.; Pinter, E.; Prielinger, L.; Coppola, C.; Marin-Kuan, M.; Schilter, B.; Apprich, S.; Tacker, M. Direct Comparison of the Lowest Effect Concentrations of Mutagenic Reference Substances in Two Ames Test Formats. Toxics 2021, 9, 152. [Google Scholar] [CrossRef] [PubMed]
  18. Williams, R.V.; DeMarini, D.M.; Stankowski, L.F.; Escobar, P.A.; Zeiger, E.; Howe, J.; Elespuru, R.; Cross, K.P. Are all bacterial strains required by OECD mutagenicity test guideline TG471 needed? Mutat. Res. Toxicol. Environ. Mutagen. 2019, 848, 503081. [Google Scholar] [CrossRef] [PubMed]
  19. Katsara, K.; Kenanakis, G.; Viskadourakis, Z.; Papadakis, V.M. Polyethylene Migration from Food Packaging on Cheese Detected by Raman and Infrared (ATR/FT-IR) Spectroscopy. Materials 2021, 14, 3872. [Google Scholar] [CrossRef] [PubMed]
  20. Lin, J.-H.; Pan, Y.-J.; Liu, C.-F.; Huang, C.-L.; Hsieh, C.-T.; Chen, C.-K.; Lin, Z.-I.; Lou, C.-W. Preparation and Compatibility Evaluation of Polypropylene/High Density Polyethylene Polyblends. Materials 2015, 8, 8850–8859. [Google Scholar] [CrossRef] [PubMed]
  21. Aguirre, M.; Ballard, N.; Gonzalez, E.; Hamzehlou, S.; Sardon, H.; Calderon, M.; Paulis, M.; Tomovska, R.; Dupin, D.; Bean, R.H.; et al. Polymer Colloids: Current Challenges, Emerging Applications, and New Developments. Macromolecules 2023, 56, 2579–2607. [Google Scholar] [CrossRef] [PubMed]
  22. Roosen, M.; Mys, N.; Kusenberg, M.; Billen, P.; Dumoulin, A.; Dewulf, J.; Van Geem, K.M.; Ragaert, K.; De Meester, S. Detailed Analysis of the Composition of Selected Plastic Packaging Waste Products and Its Implications for Mechanical and Thermochemical Recycling. Environ. Sci. Technol. 2020, 54, 13282–13293. [Google Scholar] [CrossRef] [PubMed]
  23. European Commission (Joint Research Centre). Guidance for the Identification of Polymers in Multilayer Films Used in Food Contact Materials: User Guide of Selected Practices to Determine the Nature of Layers; Publications Office: Luxembourg, 2016. [Google Scholar]
  24. The Switzerland Federal Department of Home Affairs. Verordnung des EDI über Materialien und Gegenstände, die dazu Bestimmt sind, mit Lebensmitteln in Berührung zu Kommen; The Switzerland Federal Department of Home Affairs: Bern, Switzerland, 2016; Volume 817.023.21. [Google Scholar]
  25. European Chemical Agency REACH. Candidate List of Substances of Very High Concern for Authorisation Grows; ECHA: Helsinki, Finland, 2010.
  26. Jeliazkova, N.; Martinov, M.; Tcheremenskaia, O.J.K.; Networks, M.; Rydberg, P.; Avramova, S.; Kochev, N.; Jeliazkov, V.; Iliev, L. Toxtree–Toxtree-Toxic Hazard Estimation by Decision Tree Approach. Available online: https://toxtree.sourceforge.net/ (accessed on 13 May 2024).
  27. Patlewicz, G.; Jeliazkova, N.; Safford, R.J.; Worth, A.P.; Aleksiev, B. An evaluation of the implementation of the Cramer classification scheme in the Toxtree software. SAR QSAR Environ. Res. 2008, 19, 495–524. [Google Scholar] [CrossRef] [PubMed]
  28. Xenometrix. Ames MPFTM Penta 2. Microplate Format Mutagenicity Assay. S.typhimuriumTA98, TA100, TA1535, TA1537 and E. coli WP2 uvrA[pKM101]. Instructions for Use. 2.0; Xenometrix: Allschwil, Switzerland, 2018. [Google Scholar]
  29. ISO 11350:2012; Water Quality—Determination of the Genotoxicity of Water and Waste Water—Salmonella/Microsome Fluctuation Test (Ames Fluctuation Test). ISO: Geneva, Switzerland, 2012.
  30. Hamel, A.; Roy, M.; Proudlock, R. The Bacterial Reverse Mutation Test. In Genetic Toxicology Testing; Proudlock, R., Ed.; Academic Press: Boston, MA, USA, 2016; pp. 79–138. ISBN 978-0-12-800764-8. [Google Scholar]
  31. Spiliotopoulos, D.; Koelbert, C.; Audebert, M.; Barisch, I.; Bellet, D.; Constans, M.; Czich, A.; Finot, F.; Gervais, V.; Khoury, L.; et al. Assessment of the performance of the Ames MPFTM assay: A multicenter collaborative study with six coded chemicals. Mutat. Res. Toxicol. Environ. Mutagen. 2024, 893, 503718. [Google Scholar] [CrossRef]
  32. Spalding, M.A.; Garcia-Meitin, E.I.; Kodjie, S.L.; Campbell, G.A.; Womer, T.W. Troubleshooting and mitigating gels in polyethylene film products. J. Plast. Film Sheeting 2018, 34, 300–323. [Google Scholar] [CrossRef]
  33. Adahchour, M.; Vreuls, J.J.; van Hattum, A.G.M. Concentration Techniques for Genotoxicity Testing of Effluents; IVM Report; Institute for Environmental Studies: Amsterdam, The Netherlands, 2001. [Google Scholar]
  34. Ma, X.; Sui, H.; Sun, X.; Ali, M.M.; Debrah, A.A.; Du, Z. A risk classification strategy for migrants of food contact material combined with three (Q)SAR tools in silico. J. Hazard. Mater. 2021, 419, 126422. [Google Scholar] [CrossRef]
  35. Djelassi, I.; Lancia, P.; Thuillier, I.; Ginestar, J.; Fioravanzo, E.; Baleydier, A. Strategy proposal using QSAR models to approach mutagenicity assessment of non intentionally added substances in recycled plastic resins. Food Chem. Toxicol. 2024, 187, 114597. [Google Scholar] [CrossRef] [PubMed]
  36. The European Commission. Proposal for a Regulation of the European Parliament and of the Council on Packaging and Packaging Waste, Amending Regulation (EU) 2019/1020 and Directive (EU) 2019/904, and Repealing Directive 94/62/EC; The European Commission: Brussels, Belgium, 2022. [Google Scholar]
Figure 1. This graph shows the transmittance in % of the material composition cross-section of the ten samples from Table 1. All the samples, virgin (LDPE), recycled (T2, F) and multilayer materials, show the typical peaks for LDPE, at Wavenumber 719 cm−1, 1463 cm−1, 2848 cm−1 und 2915 cm−1.
Recycling 09 00057 g001
Figure 2. Microscopy images of the mono- and multilayer functional barrier samples, illustrating the distribution of colloidal particles or inorganic foreign particles in the film structure. The upper row shows the images (a) virgin LDPE and (b) the recycled film T2 (from left to right). The middle row shows the images (c) recycled foil F and (d) LDPE/EVOH. The bottom row shows the images (e) LDPE/EVOH/T2 and (f) LDPE/EVOH/F.
Recycling 09 00057 g002
Figure 3. GC-MS chromatograms for samples containing the recycled material T2.
Recycling 09 00057 g003
Figure 4. GC-MS chromatograms for samples containing the recycled material F.
Recycling 09 00057 g004
Figure 5. Comparison of the n-fold induction of the ten tested samples from Table 4. The diagrams show the results with bacterial strain TA98 +S9 for migrate A and B. Diagram (a) shows a virgin LDPE reference film, (b) consisted of virgin LDPE with an EVOH layer and (c) consisted of virgin LDPE with a G-polymer layer. Diagram (d) shows a recycled LDPE reference film called T2, (e) consisted of T2 and LDPE layers, (f) consisted of T2, LDPE layers and an EVOH layer and (g) consisted of T2, LDPE layers and a G-polymer layer. Diagram (h) shows a recycled LDPE reference film called F, (i) consisted of F, LDPE layers and an EVOH layer and (j) consisted of F, LDPE layers and a G-polymer layer. The x-axis label ‘% of sample migrate’ refers to the sample concentration (dilution) of the migrate. Bars marked with a star (*) indicate a positive result for mutagenicity. The error indicators show the standard deviation of each sample in a triplicate determination. A positive result is achieved if the n-fold induction exceeds two, denoted by the horizontal lines.
Recycling 09 00057 g005
Table 1. Relative reduction of migrated substances for samples containing the recycled material T2. Below are the substances that had a quantified amount in T2, that were not present in the virgin reference materials LDPE, LDPE/EVOH and LDPE/G.
Relative Reduction (%) from T2
Nr.NameLDPE/T2LDPE/EVOH/T2LDPE/G/T2
3Ethyl dodecanoate−54%−41%−64%
81-octadecene−46%−55%−64%
15Dibutyl phthalate−61%−66%−100%
18Tributyl aconitate−58%−100%−100%
20Butyl citrate−100%−100%−100%
23Tributyl acetylcitrate−67%−88%−93%
24Bis(2-ethylhexyl) adipate−74%−100%−100%
26Cyclohexane, 1,3,5-triphenyl-−100%−100%−100%
29Bumetrizole−71%−73%−83%
30Di-(2-ethylhexyl) terephthalate−73%−73%−85%
31Erucamide−100%−100%−100%
Table 2. Relative reduction of migrated substances for samples containing the recycled material F. Below are the substances that had a quantified amount in F, that were not present in the virgin reference materials LDPE, LDPE/EVOH and LDPE/G.
Relative Reduction (%) from F
Nr.NameLDPE/EVOH/FLDPE/G/F
3Ethyl dodecanoate−76%−82%
5Diethyl terephthalate−99%−90%
81-octadecene−43%−60%
10Isopropyl myristate−50%−61%
14Methyl hexadecanoate−61%−100%
15Dibutyl phthalate−61%−74%
18Tributyl aconitate−59%−74%
19Ethyl cis-9-octadecenoate−76%−79%
20Butyl citrate−100%−100%
23Tributyl acetylcitrate−73%−85%
24Bis(2-ethylhexyl) adipate−68%−85%
26Cyclohexane, 1,3,5-triphenyl-−63%−75%
28Unknown−59%−73%
29Bumetrizole−61%−100%
30Di-(2-ethylhexyl) terephthalate−60%−78%
31Erucamide−100%−100%
Table 3. Results of the miniaturized Ames tests with bacteria strains TA98 and TA100 with and without metabolic activation (+/−S9). The ten samples from Table 1 were tested in duplicates (migrate A and B). All samples were tested for inhibitory effects, but no inhibiting effects of the sample migrates were detected. Percentages in brackets indicate lowest dilution (given as % of sample migrate) at which a mutagenic effect was detected. +: mutagenic; -: non-mutagenic.
SampleFilm StructureMigrateTA98TA100
−S9+S9−S9+S9
1LDPEA----
B----
2LDPE/EVOHA----
B----
3LDPE/G-polymerA----
B----
4T2A-+ (25%)--
B-+ (50%)--
5LDPE/T2A-+ (50%)--
B----
6LDPE/EVOH/T2A----
B-+ (50%)--
7LDPE/G-Polymer/T2A----
B-+ (100%)--
8FA+ (100%)+ (6.25%)--
B-+ (12.5%)--
9LDPE/EVOH/FA-+ (12.5%)--
B+ (100%)+ (12.5%)--
10LDPE/G-polymer/FA-+ (12.5%)--
B + (50%)--
Table 4. List of the ten investigated samples, film structure and thickness.
No. Code Assigned Film Structure Thickness Distribution (µm)
1 LDPE 100% LDPE virgin mono reference 60
2 LDPE/EVOH LDPE/tie/EVOH/tie/LDPE/LDPE/LDPE 15/3/3/3/6/15/15
3 LDPE/G-polymer LDPE/tie/G/tie/LDPE/LDPE/LDPE 15/3/3/3/6/15/15
4 T2100% recycled mono LDPE (Type 2) 60
5 LDPE/T2LDPE/LDPE/T2/T2/T2/LDPE/LDPE 7.5/7.5/10/10/10/7.5/7.5
6 LDPE/EVOH/T2 LDPE/tie/EVOH/tie/T2/T2/LDPE 15/3/3/3/6/15/15
7 LDPE/G-Polymer/T2LDPE/tie/G/tie/T2/T2/LDPE 15/3/3/3/6/15/15
8 F100% recycled mono LDPE (Type F) 60
9 LDPE/EVOH/F LDPE/tie/EVOH/tie/F/F/LDPE 15/3/3/3/6/15/15
10 LDPE/G-polymer/F LDPE/tie/G/tie/F/F/LDPE 15/3/3/3/6/15/15
Disclaimer/Publisher’s Note: The statements, opinions and data contained in all publications are solely those of the individual author(s) and contributor(s) and not of MDPI and/or the editor(s). MDPI and/or the editor(s) disclaim responsibility for any injury to people or property resulting from any ideas, methods, instructions or products referred to in the content.

