Abstract
In this study, we examined the correlation between the collected municipal waste (MW) and the tourism intensity (TI) in five of Croatia’s most popular tourist towns—Zagreb, Poreč, Rovinj, Split, and Dubrovnik—from 2015 to 2021. Furthermore, we conducted a comparative analysis of target scenarios for municipal waste reduction in these tourist towns based on population changes and the amount of separately collected and residual MW collected to achieve EU targets for processing MW for reuse and recycling. The TI indicator quantifies the population’s theoretical multiplication during tourist influx, providing a clear picture of the pressure exerted by tourism. Rovinj and Poreč have the highest TIs, while larger cities like Dubrovnik, Split, and Zagreb have lower average TI values. The correlation between the collected MW and the tourism intensity in Dubrovnik is very high and positive, in Zagreb and Rovinj it is high and negative, while Split has a higher positive correlation than Poreč. The results for the MW preparation rates for reuse and recycling from 2015 to 2021 and future projections for 2021–2035 suggest that, in five of Croatia’s leading tourist towns, the imperative must be to decrease residual MW, promote separation at the source, and separate MW collection to meet EU targets. Given the challenges of meeting all three—or even two or one—of the EU’s targets of 50% by 2025, 60% by 2030, and 65% by 2035, the current waste separation system must be improved. This study contributes to the scientific community by addressing the gap in the current knowledge on the effects of population changes caused by tourism on MW in tourist destinations. The findings could be relevant for practitioners and policymakers planning MW collection, processing, and recovery in tourism-oriented economies, particularly in Croatia’s top tourist destinations.
1. Introduction
Waste is mostly a byproduct of the consumer-based lifestyles that drive much of the world’s economies. Municipal waste (MW) is one of the most difficult types to manage, owing to its extremely complex and heterogeneous composition, proximity to citizens, high public visibility, and environmental and human health implications. MW is roughly composed of organic and inorganic waste. Many factors may influence the composition or amount of MW, such as economic development, existing municipal waste management, geographical location, residential structure, public habits, seasonal variation, and energy resources [1].
Tourism, particularly in countries with a strong seasonal variation in tourism such as the Republic of Croatia, has a considerable impact on MW generation [2]. The Republic of Croatia, as an Adriatic, Central European country, is a globally recognized tourist destination and one of the most popular tourist destinations in the Mediterranean [3,4,5]. Tourism is a significant part of the Republic of Croatia’s economy, representing almost 20% of its global gross domestic product and providing employment for thousands of people [6]. Although tourism has economic and financial benefits, it is also often accompanied by many negative effects that result in environmental and social impacts. The negative environmental impacts of tourism can be substantial. They include the depletion of local natural resources; air, water, and ground pollution; and waste management issues. According to the European Environment Agency (EEA), increasing tourism density, infrastructure, and activities, particularly in the Mediterranean, influence waste generation and energy consumption [7]. In comparison with other cities, tourist cities face additional challenges related to the tourism industry and tourists as waste producers. For example, tourism represents an extra source of MW in tourist destinations; both the mass and volume of MW increase during the tourism season, and tourists may display improper and inefficient behavior regarding separating different fractions of MW, contributing to an increase in mixed waste and leading to overcapacity in the MW system [1,8,9,10,11,12,13,14,15].
According to Eurostat [16], municipal waste generation in Croatia increased from 387 kg per capita in 2014 to 447 kg per capita in 2021. This waste generation trend continued to grow from 2014 to 2019, with a drop in 2020. During the COVID-19 pandemic in 2020, there was a significant reduction in services due to reduced working hours, the closure of catering facilities, and restrictions imposed on cultural activities and events and, as a result, a reduction in overnight stays in tourism; thus, municipal waste quantities decreased and remained consistent with those recorded in 2017. The easing of pandemic restrictions and the recovery of services following the pandemic in 2021 led to an increase in municipal waste to 447 kg per capita. However, the MW generation throughout the period remained below the European average.
The annual amount of municipal waste generated per capita in 2021 at the county level ranged between 253 kg and 672 kg, with a deviation from the average amount at the national level (447 kg) observed mostly in coastal counties, which can be attributed to the impact of tourism [17].
In the Republic of Croatia, waste management is one of the most crucial environmental protection challenges and one of the most demanding sectors to harmonize with EU standards. The main legislation for waste management in Croatia is the Waste Management Act [18], which stipulates measures to protect the environment and human health by preventing or reducing waste generation and its negative effects and promotes waste management, including recycling, reuse, and a gradual reduction in waste disposal. Within the waste management system, objectives and measures arising from the European Commission’s Waste Framework Directive [19] are very important, particularly the objectives of preparing for the reuse and recycling of at least 55%, 60%, and 65% of MW by weight by 2025, 2030, and 2035, respectively. In addition, the amount of MW landfilling should be reduced to 10% by weight by 2035.
Since 2016, all municipalities/towns have been covered by public waste management services. Separate collection for specific municipal waste (primarily paper, glass, plastics, metal, and biowaste) is performed through the so-called ”doorstep” collection process, using different public-space litter bins and trash cans at civic amenity sites and in retail stores, as well as through established national systems for special waste categories. In 2021, 74% of the total volume of separately collected waste was recovered, with the remaining waste predominantly disposed of at landfill sites or temporarily stored in smaller quantities. Thus, the recycling rate was 32%, the disposal rate was 58%, and 10% of waste was used in other waste treatment operations, predominantly mechanical–biological treatment plants. Given these data, the Republic of Croatia is at risk of failing to meet the 2025 target of preparing a minimum of 55% MW by weight for reuse and recycling [19].
Starting with the abovementioned points, tourism, as a constantly growing industry with millions traveling to different parts of Croatia each year, contributes to the increasing pressures on the area’s overall MW management infrastructure [2,3,4]. European waste statistics distinguish between the waste produced by business activities and households, but there are no specific statistics on waste in tourism [16]. In Croatia, waste from tourist accommodations is mostly collected with commercial or household waste. Therefore, determining the correlation between MW and tourism is important for planning the collection, processing, and recovery of MW in local waste management systems.
Several studies have used top-down and bottom-up methodologies to analyze the impact of tourism on MW generation. The top-down approach uses tourist flows to assess their effect on the total MW in a tourist region [8,10,11]. In contrast, the bottom-up approach measures the waste generated in tourist accommodations over a certain period [15,20]. In this study, we used the top-down approach to determine the correlation between tourism and the collected MW by focusing on five of Croatia’s tourist towns with the greatest number of overnight stays for 2015–2021. According to the criteria, Zagreb in central Croatia, Poreč and Rovinj in Istria, and Split and Dubrovnik in Dalmatia were chosen.
To assess the relevance of tourism in MW and to examine the impact of population changes caused by tourism on MW in tourist destinations, tourism intensity (TI) [21] was used. TI quantifies a population’s theoretical multiplication during tourist influx periods by comparing the number of tourist nights to the resident population of a territory. Firstly, we examine the relationship between collected MW and TI in five of Croatia’s top tourist towns for 2015–2021. As a reference for the collected MW quantities of selected towns, the total equivalent population (TEP), representing the sum of residents plus the equivalent tourist population (ETP), was employed rather than just the resident population. The ETP measures the number of overnight stays against the number of people living in a location all year round and represents tourists as an additional population, providing a clear picture of the pressure exerted by the tourism sector [22]. Secondly, we estimate the future quantities of collected MW, the total separately collected MW recyclables, and the amount of collected residual MW (RMW) in Croatia’s top tourist destinations up to 2035 concerning the EU MW targets for 2025, 2030, and 2035, given their existing MW systems. The long-term MW projections for these tourist destinations are based on estimation and probabilistic forecasts of the total population of Croatia [23] and the number of tourist overnight stays is based on a conservative growth rate of 1% or 3% per year for 2021 to 2035 [24].
The tourism intensity has been used in numerous studies as an indicator of tourism development and the economic significance of tourism and its sustainability [25,26,27,28,29]; however, to the best of our knowledge, no study has investigated the correlation between tourism intensity and collected MW in Croatia’s tourist towns. Furthermore, this is the first comparative analysis of target scenarios for municipal waste reduction in Croatia’s leading tourist towns based on population changes and the separate and residual amounts of MW collected to achieve EU targets for MW reuse and recycling. This study indicates the importance of the active and sustained participation of individual residents and non-residents in properly separating and collecting recyclable waste as an integral component of sustainable MW management in tourism-oriented economies. We aim to contribute to the scientific community by addressing the current knowledge gap on the effects of the population changes caused by tourism on MW in tourist destinations. Our findings could be useful in planning an MW separation system to support Croatia’s top tourist destinations’ efforts to improve their MW management performance to achieve the EU’s targets.
This paper is organized as follows. Section 2 presents and discusses the results. The data are presented in Section 3. Section 3 also provides a more detailed description of the concepts used in our research, with an outline of the methodology employed for data analysis. The methodological approach is divided into two sections: an overview of our study of Croatia’s top tourist destinations from 2015 to 2021 (Section 3.1) and an assessment of municipal waste flow development with an explanation of scenarios (Section 3.2). The conclusions are stated in Section 4.
2. Results and Discussion
This research intends to determine the relationship between collected MW and tourism intensity and long-term projections for collected MW quantities, the total amount of separately collected MW recyclables, and the amount of collected residual MW in Croatia’s top tourist destinations up to 2035, with EU MW targets for 2025, 2030, and 2035 taken into account. We started by examining Croatian tourist towns with the greatest number of overnight stays for 2015–2021.
The sample includes five towns selected according to the criteria mentioned earlier: Zagreb, Poreč, Rovinj, Split, and Dubrovnik. The MW quantities in the selected towns were compared based on the waste per capita of the TEP. TEP is an annual estimate of individual town populations that includes residents and the ETP. Because the ETP measures the number of overnight stays against the number of people living in a location all year round, it provides a clear picture of the pressure exerted by the tourism sector. Each day a person spends in a municipality equals 1/365 of the time spent by a full-time equivalent resident per year. Thus, a person who spends a week on vacation in a town is comparable to 0.02 full-time equivalents every year. Viewing the five tourist towns over the entire period reveals changes in the number of overnight stays and, hence, the ETP and TEP. The calculated ETP (Equation (1)) and TEP data for the towns with the highest number of overnight stays over the 2015–2021 period (presented in Table 1) show that the ETP peaked in 2019 before dropping in 2020, followed by rising again in 2021, as did the TEP. Rovinj, the town with the most overnight stays, had an ETP of nearly 60,000 from 2015 to 2021. In 2019, the year with the highest number of overnight stays, the Rovinj resident population grew by 80%. Additionally, the population in Poreč rose by 52%, Dubrovnik by 28%, Split by 5%, and Zagreb by 1%. The increased ETP amplified pressures on the area’s overall infrastructure, increasing the area’s vulnerability to anthropogenic impacts.

Table 1.
Calculated ETP, TEP, and MW amounts per capita of the TEP, plus TI.
Owing to the increased total population as a sum of residents and ETP, the total MW collected per capita of the TEP was lower than if only the resident population was used. Between 2015 and 2021, the towns with the most overnight stays in Istria, Rovinj and Poreč (Table 2), had the greatest changes in total MW collected.
The calculated TIs (Equation (2)), presented in Table 1, show that towns located in Istria, Rovinj and Poreč, had the highest TIs among Croatia’s top tourist destinations for 2015–2021, with an average of 245.94 for Rovinj and 161.42 for Poreč. Compared with these towns, Croatia’s larger towns had lower average TI values: Dubrovnik at TI = 71.82, Split at TI = 11.17, and Zagreb (with its much larger population) at TI = 2.46, ranking fifth. According to the literature, Zagreb’s TI is significantly lower than Central European metropolises such as Vienna (TI = 8.7) and Prague (TI = 13.9). Poreč, Split, and Dubrovnik have greater TIs than other UNESCO heritage sites, like Rome (TI = 9.9) [30].
We used Pearson’s correlation coefficient (r) to determine the relationship between the amount of collected MW in Croatia’s tourist towns and tourism intensity. For Zagreb and Rovinj, there was a high, negative correlation between collected MW and tourism intensity (r = −0.64 and r = −0.57, respectively). The correlation between collected MW and tourism intensity was low and positive for Poreč (r = 0.26). The correlation coefficient for Split (r = 0.63) indicated a high, positive correlation between the variables. For Dubrovnik, there was a very high, positive correlation between collected MW and tourism intensity (r = 0.87). Based on this analysis, it is impossible to determine causality in the relationship between collected MW and tourism intensity in towns with the highest overnight stays.
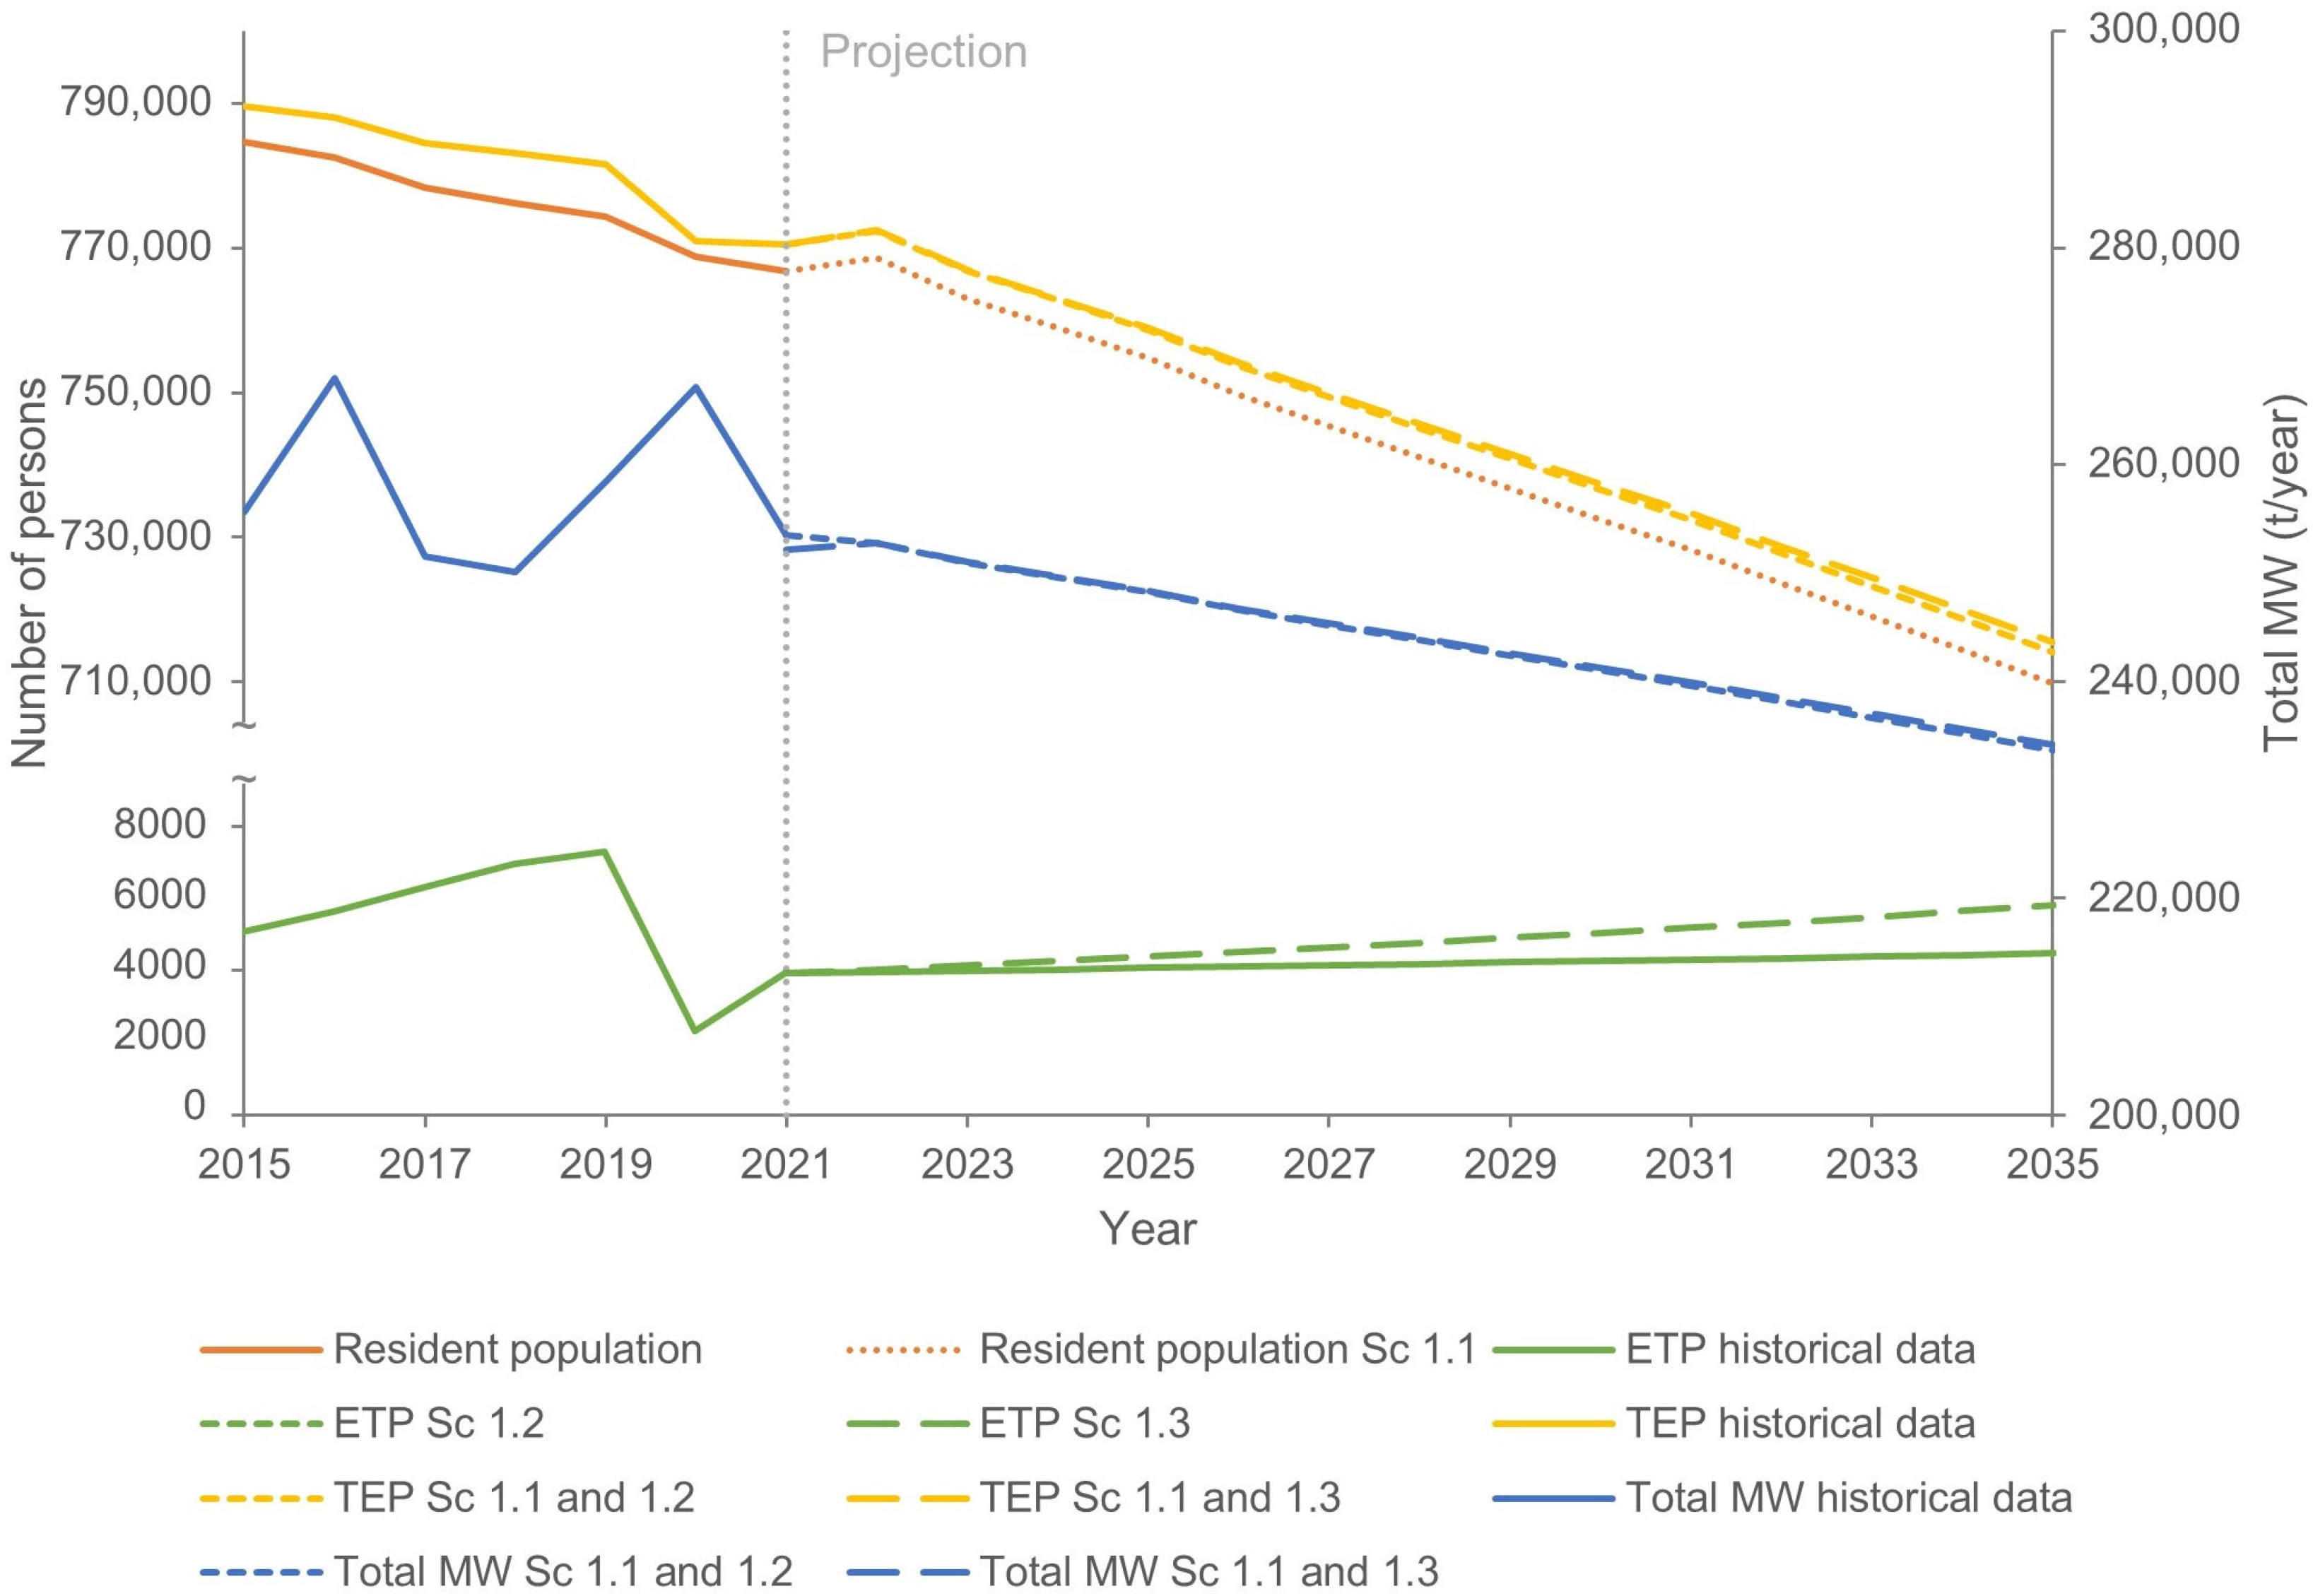
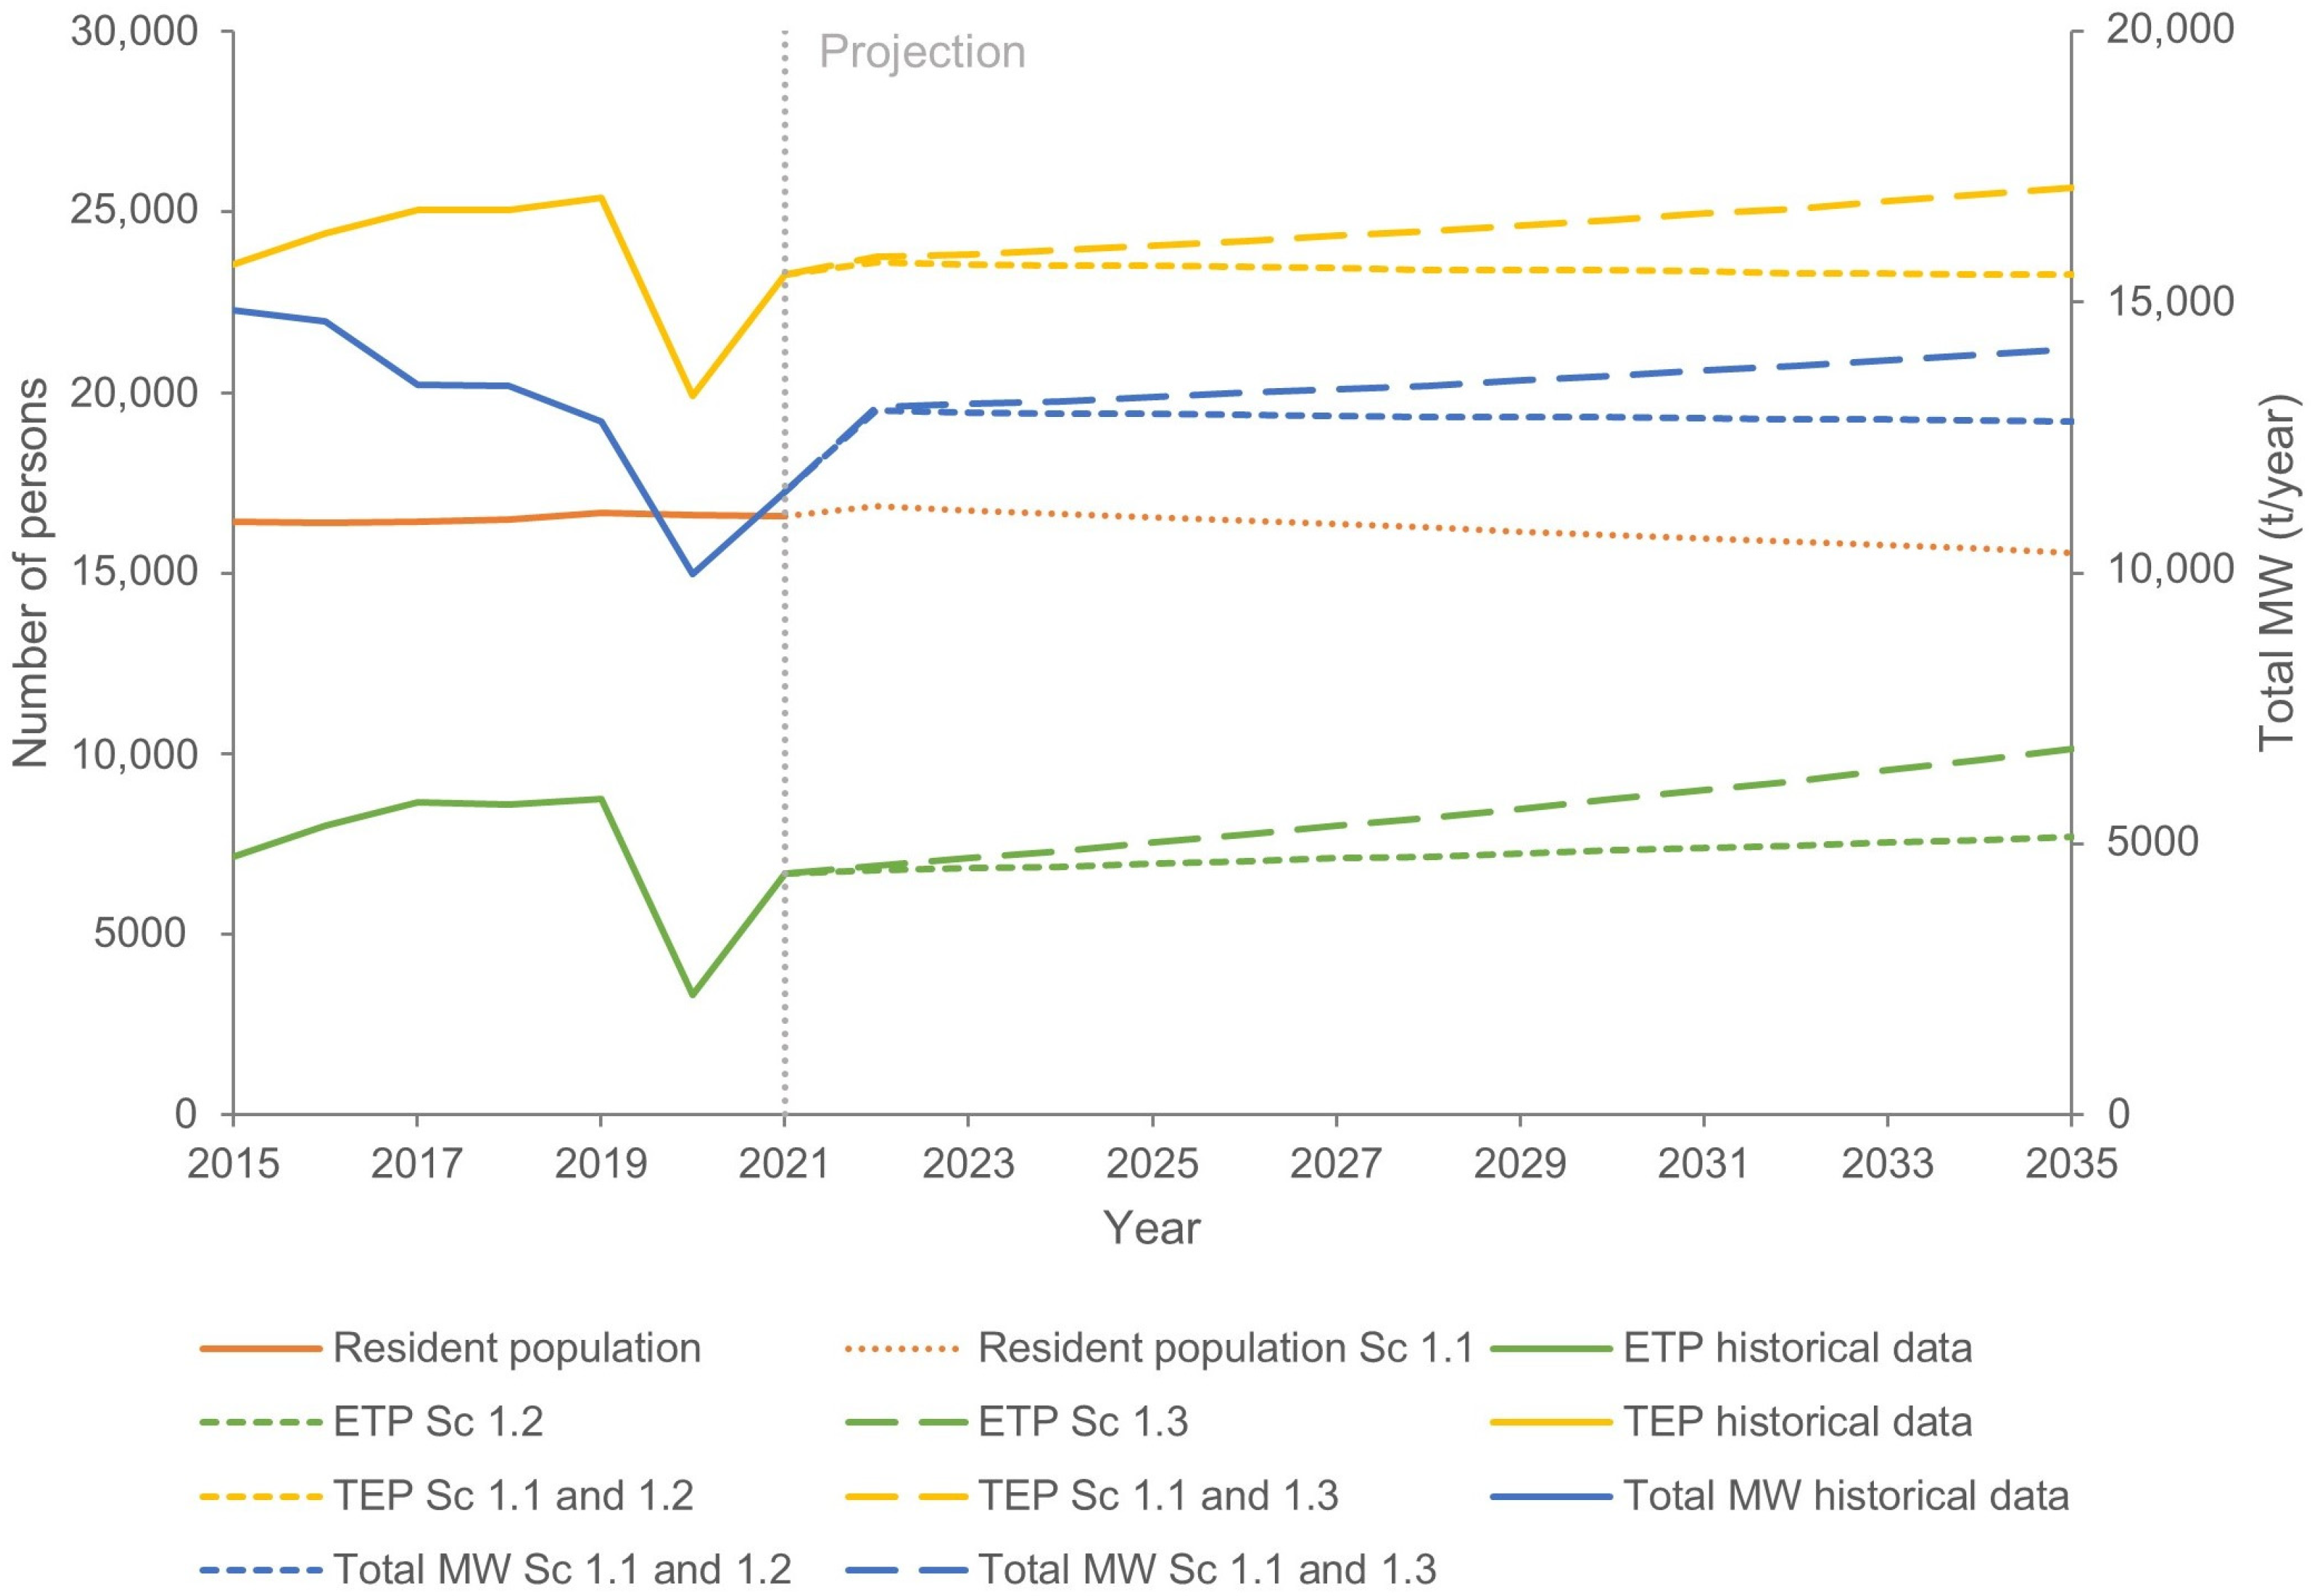
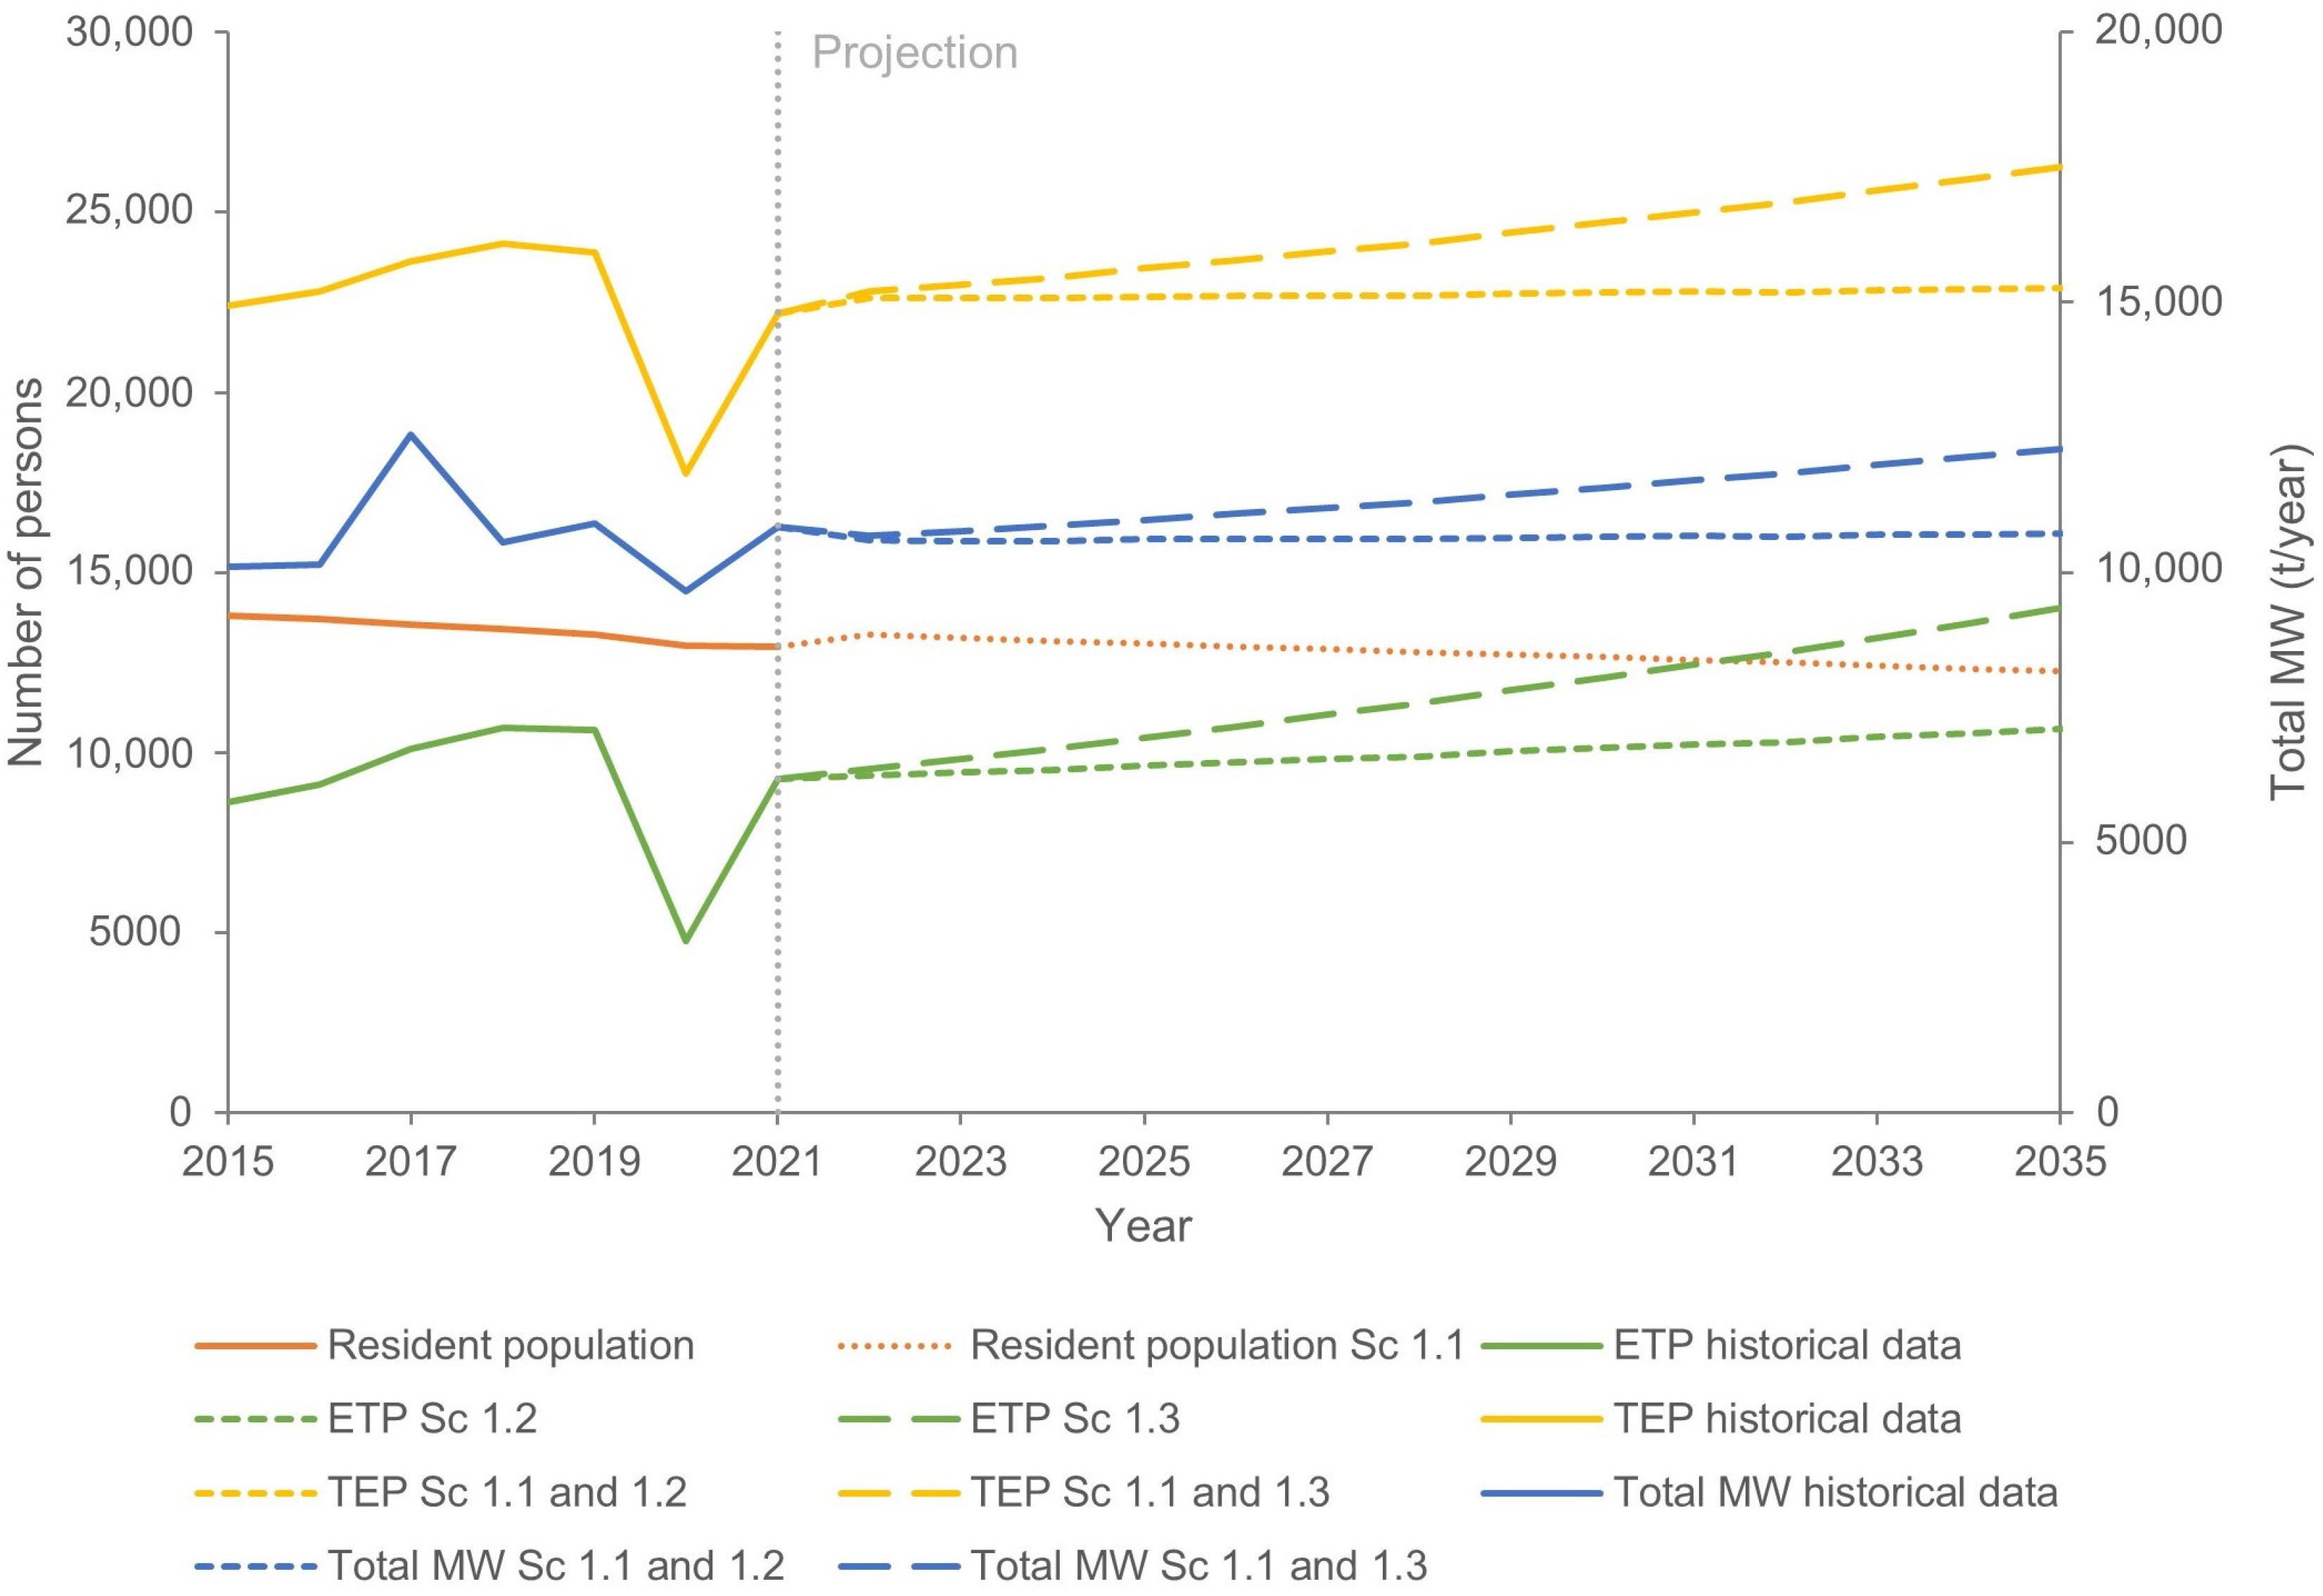
Figure 1, Figure 2, Figure 3, Figure 4 and Figure 5 compare historical (2015–2021) and projected (2021–2035) amounts of annual total collected MW based on TEP (resident and ETP) changes for these towns regarding their current MW systems under Scenario 1 (Sc 1) (Table 3). The total collected MW comprises waste collected separately from households, such as paper and cardboard, glass, metal, plastics, and bio-waste for recycling, and residual MW that was neither recycled nor reused but landfilled. Tables 4 and 5 show the linear equations of the relationship between the TEP and MW quantities. The number in the equation, i.e., the slope, indicates the rate at which the MW value changes with respect to the TEP value. Figure 1, Figure 2, Figure 3, Figure 4 and Figure 5 show that although the resident population is experiencing a continuous decline, with annual percentage changes of −0.58% between 2021 and 2030 and −0.64% between 2030 and 2035, the tourist population grows, placing a real burden on the populations of tourist towns. According to Scenario 1.2 (Sc 1.2), collected MW will increase by 11% in Poreč and more than 2% in Dubrovnik in 2035 compared with 2021. However, the collected MW will decrease by more than 10% in Split, 8% in Zagreb, and 1% in Rovinj by 2035 compared with 2021. Scenario 1.3 (Sc 1.3) predicts an increase in collected MW in Poreč of 23%, over 13% in Rovinj, and over 6% in Dubrovnik—all high-TI towns. However, in larger towns like Split and Zagreb, the collected MW will decrease by more than 9% and approximately 7%, respectively.
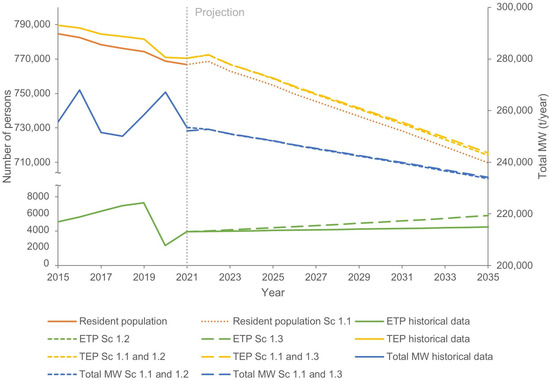
Figure 1.
Evolution, 2015–2021, and projection, 2021–2035, of population, ETP, TEP, and total MW in Zagreb.
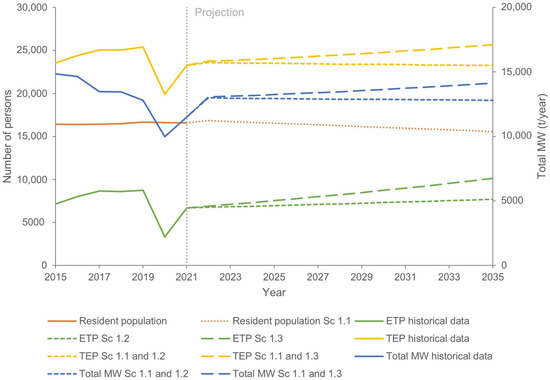
Figure 2.
Evolution, 2015–2021, and projection, 2021–2035, of population, ETP, TEP, and total MW in Poreč.
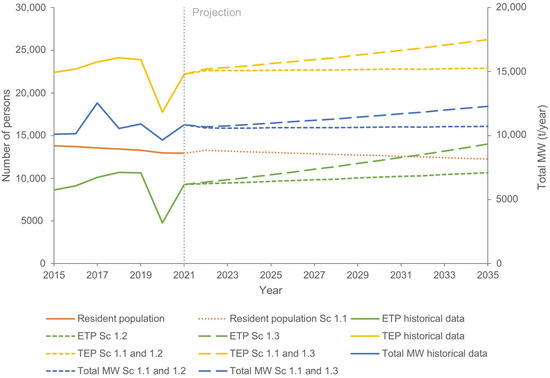
Figure 3.
Evolution, 2015–2021, and projection, 2021–2035, of population, ETP, TEP, and total MW in Rovinj.
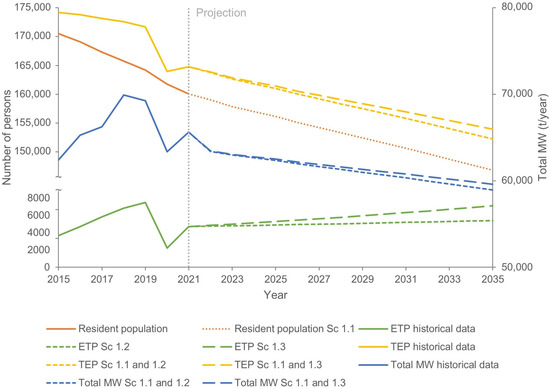
Figure 4.
Evolution, 2015–2021, and projection, 2021–2035, of population, ETP, TEP, and total MW in Split.
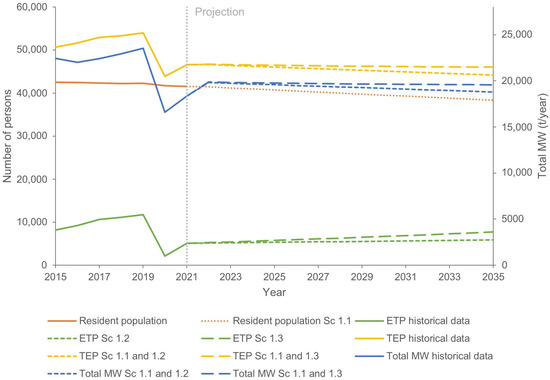
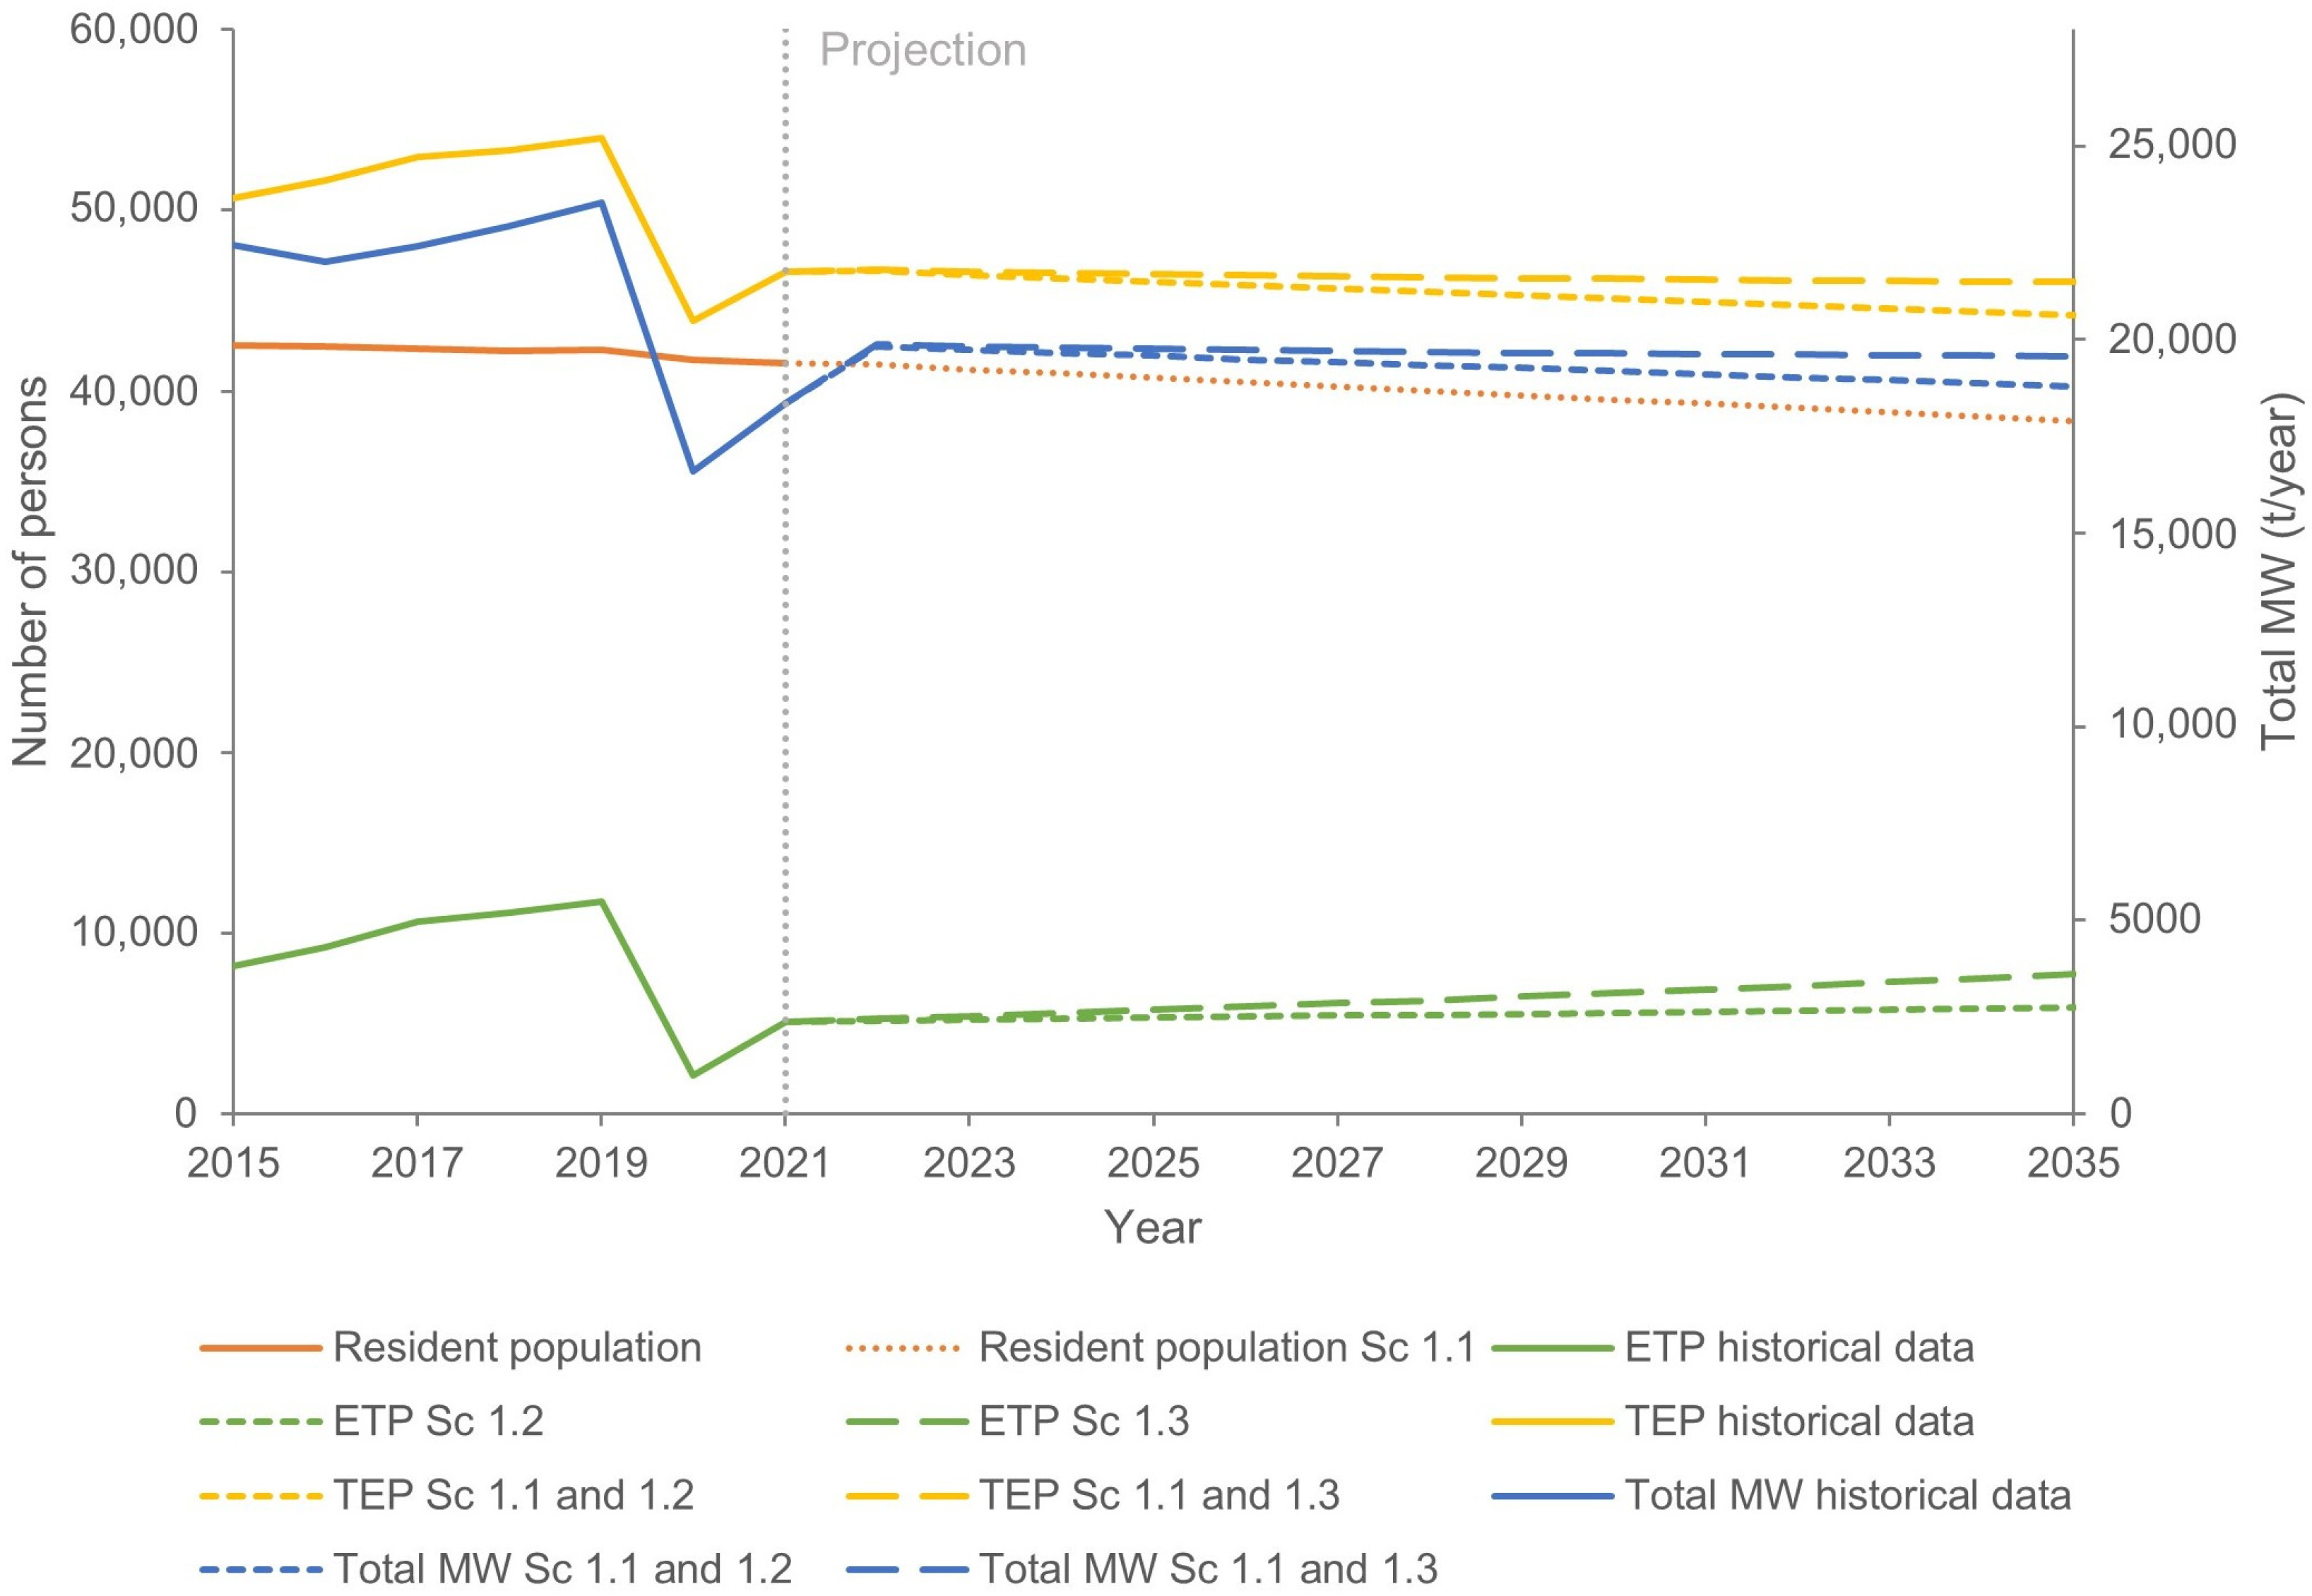
Figure 5.
Evolution, 2015–2021, and projection, 2021–2035, of population, ETP, TEP, and total MW in Dubrovnik.
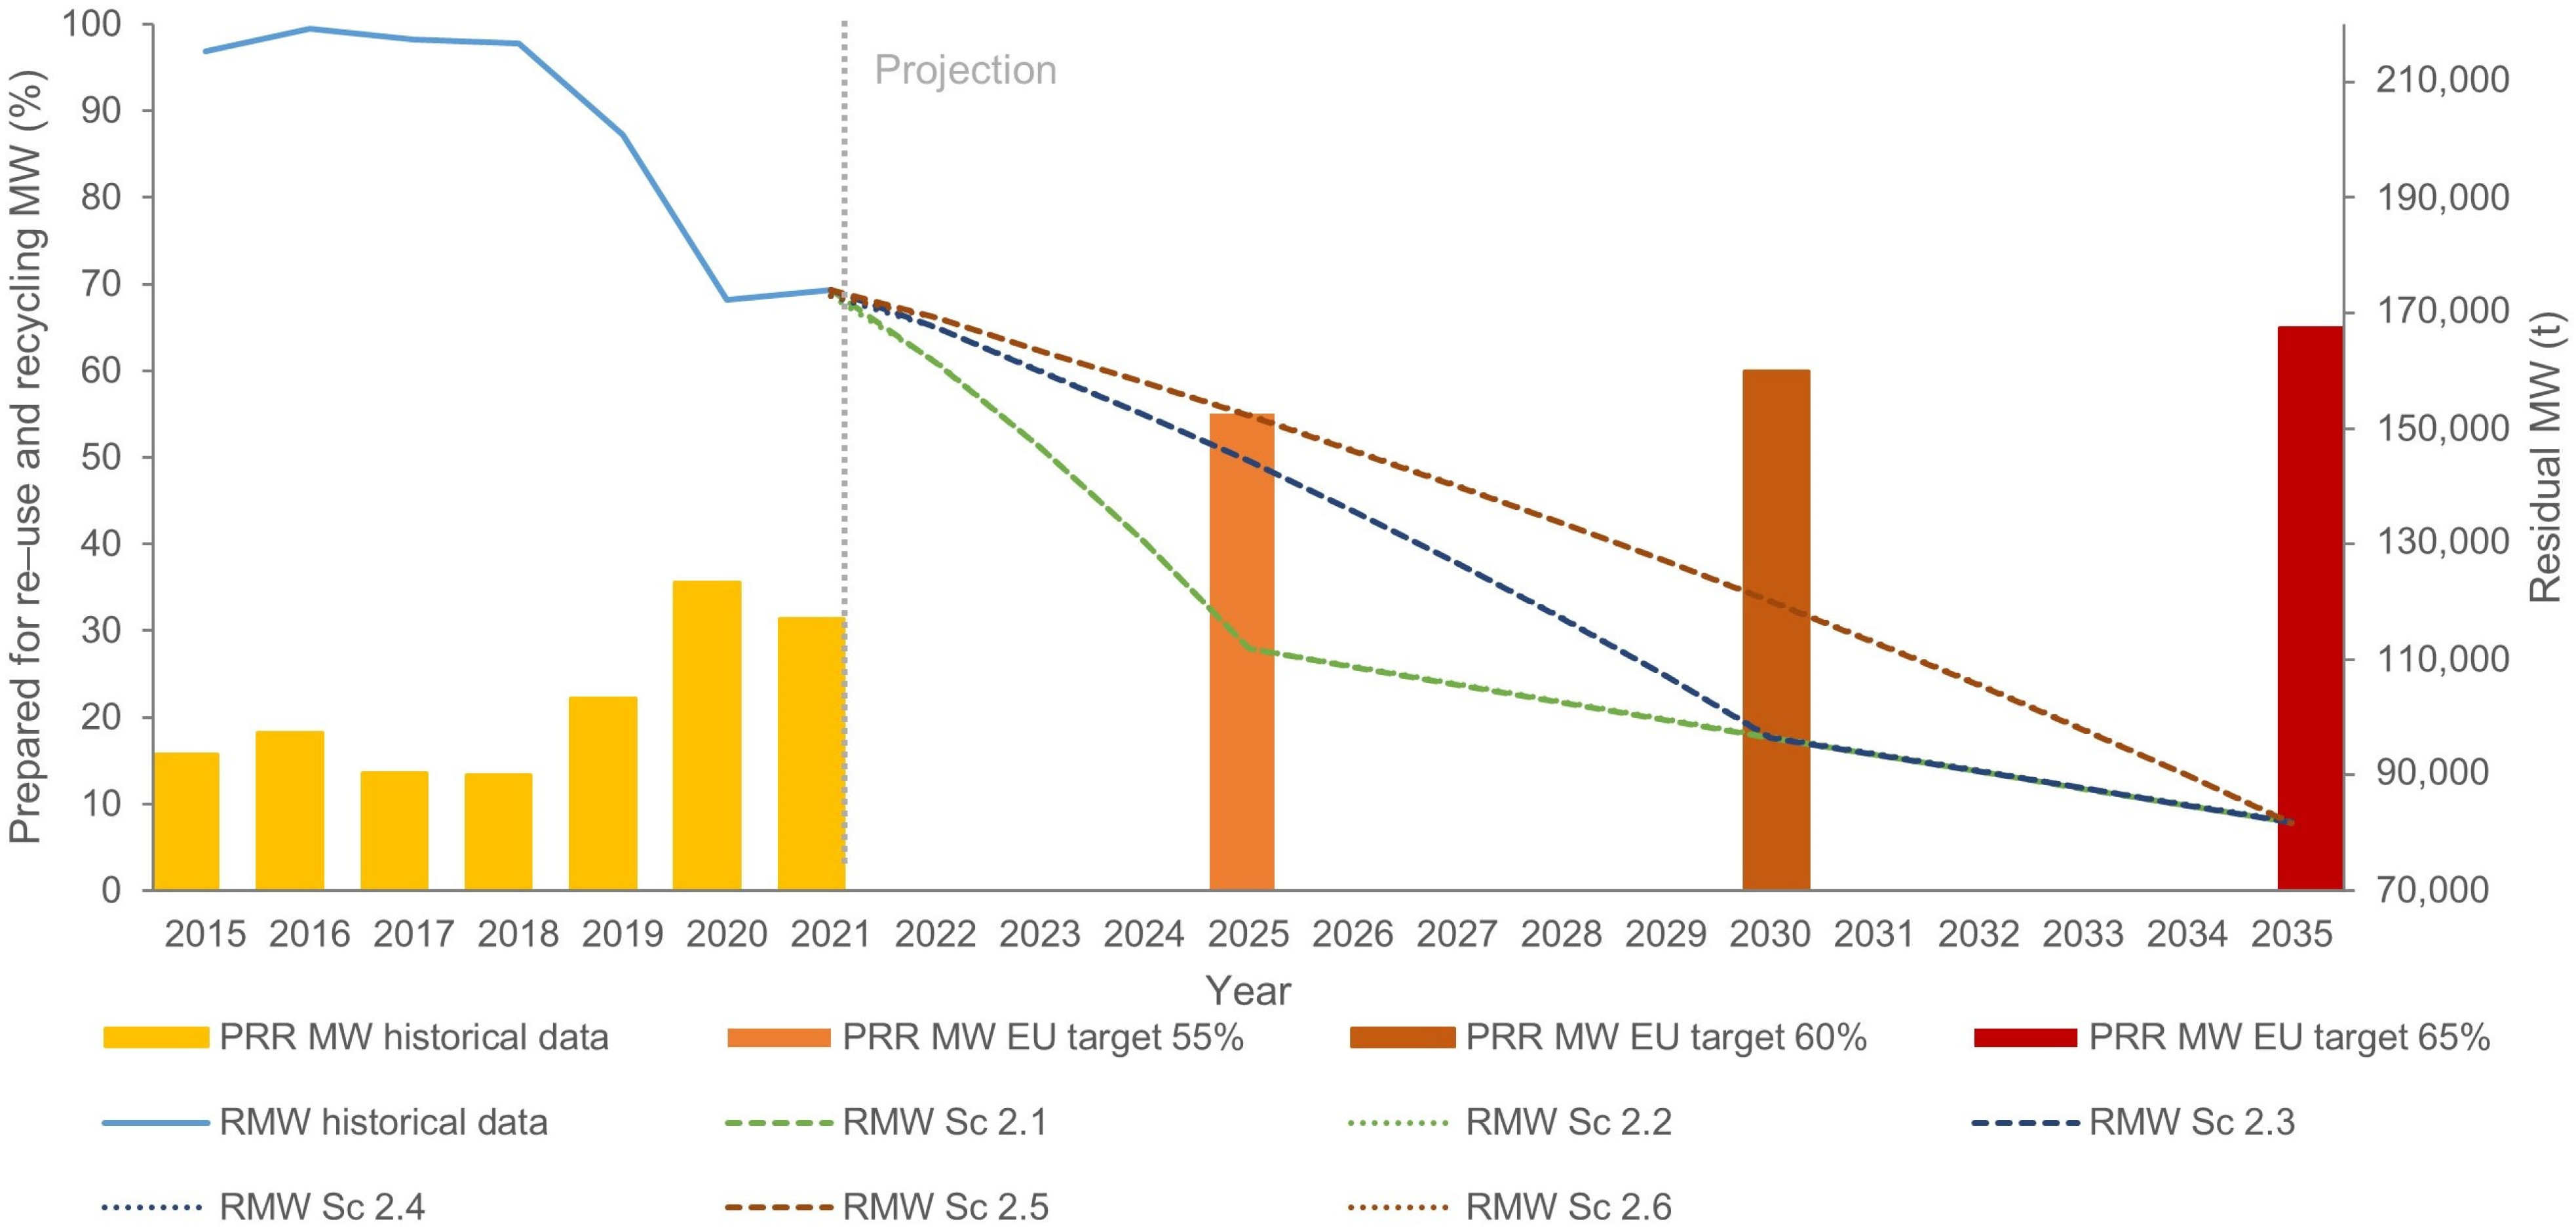
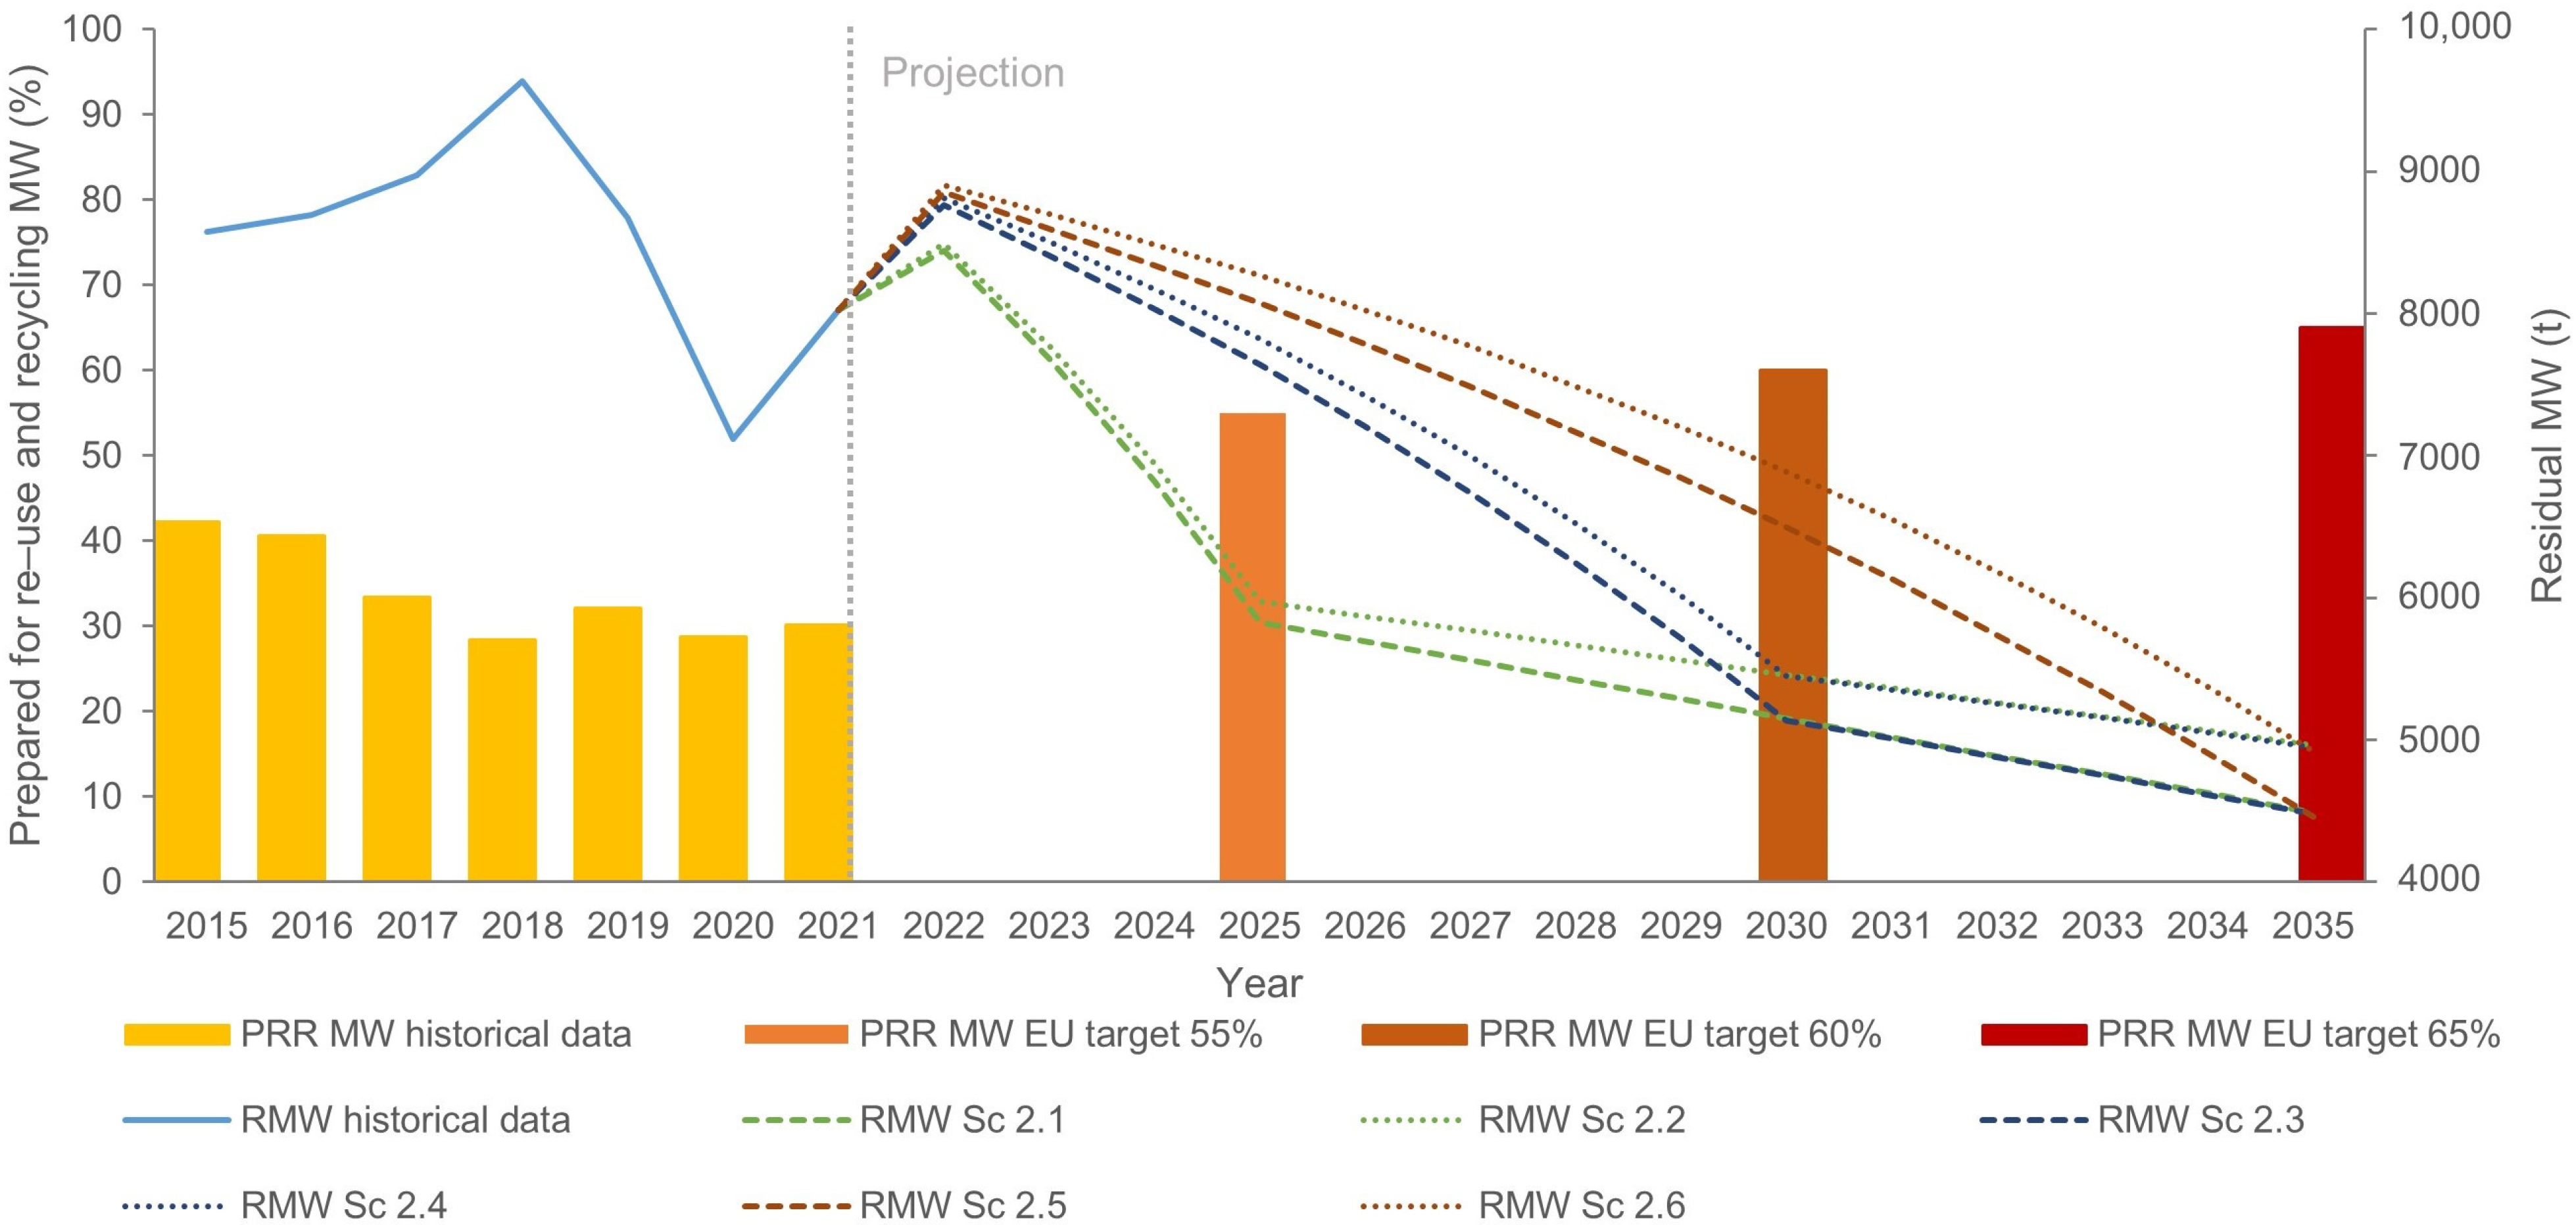
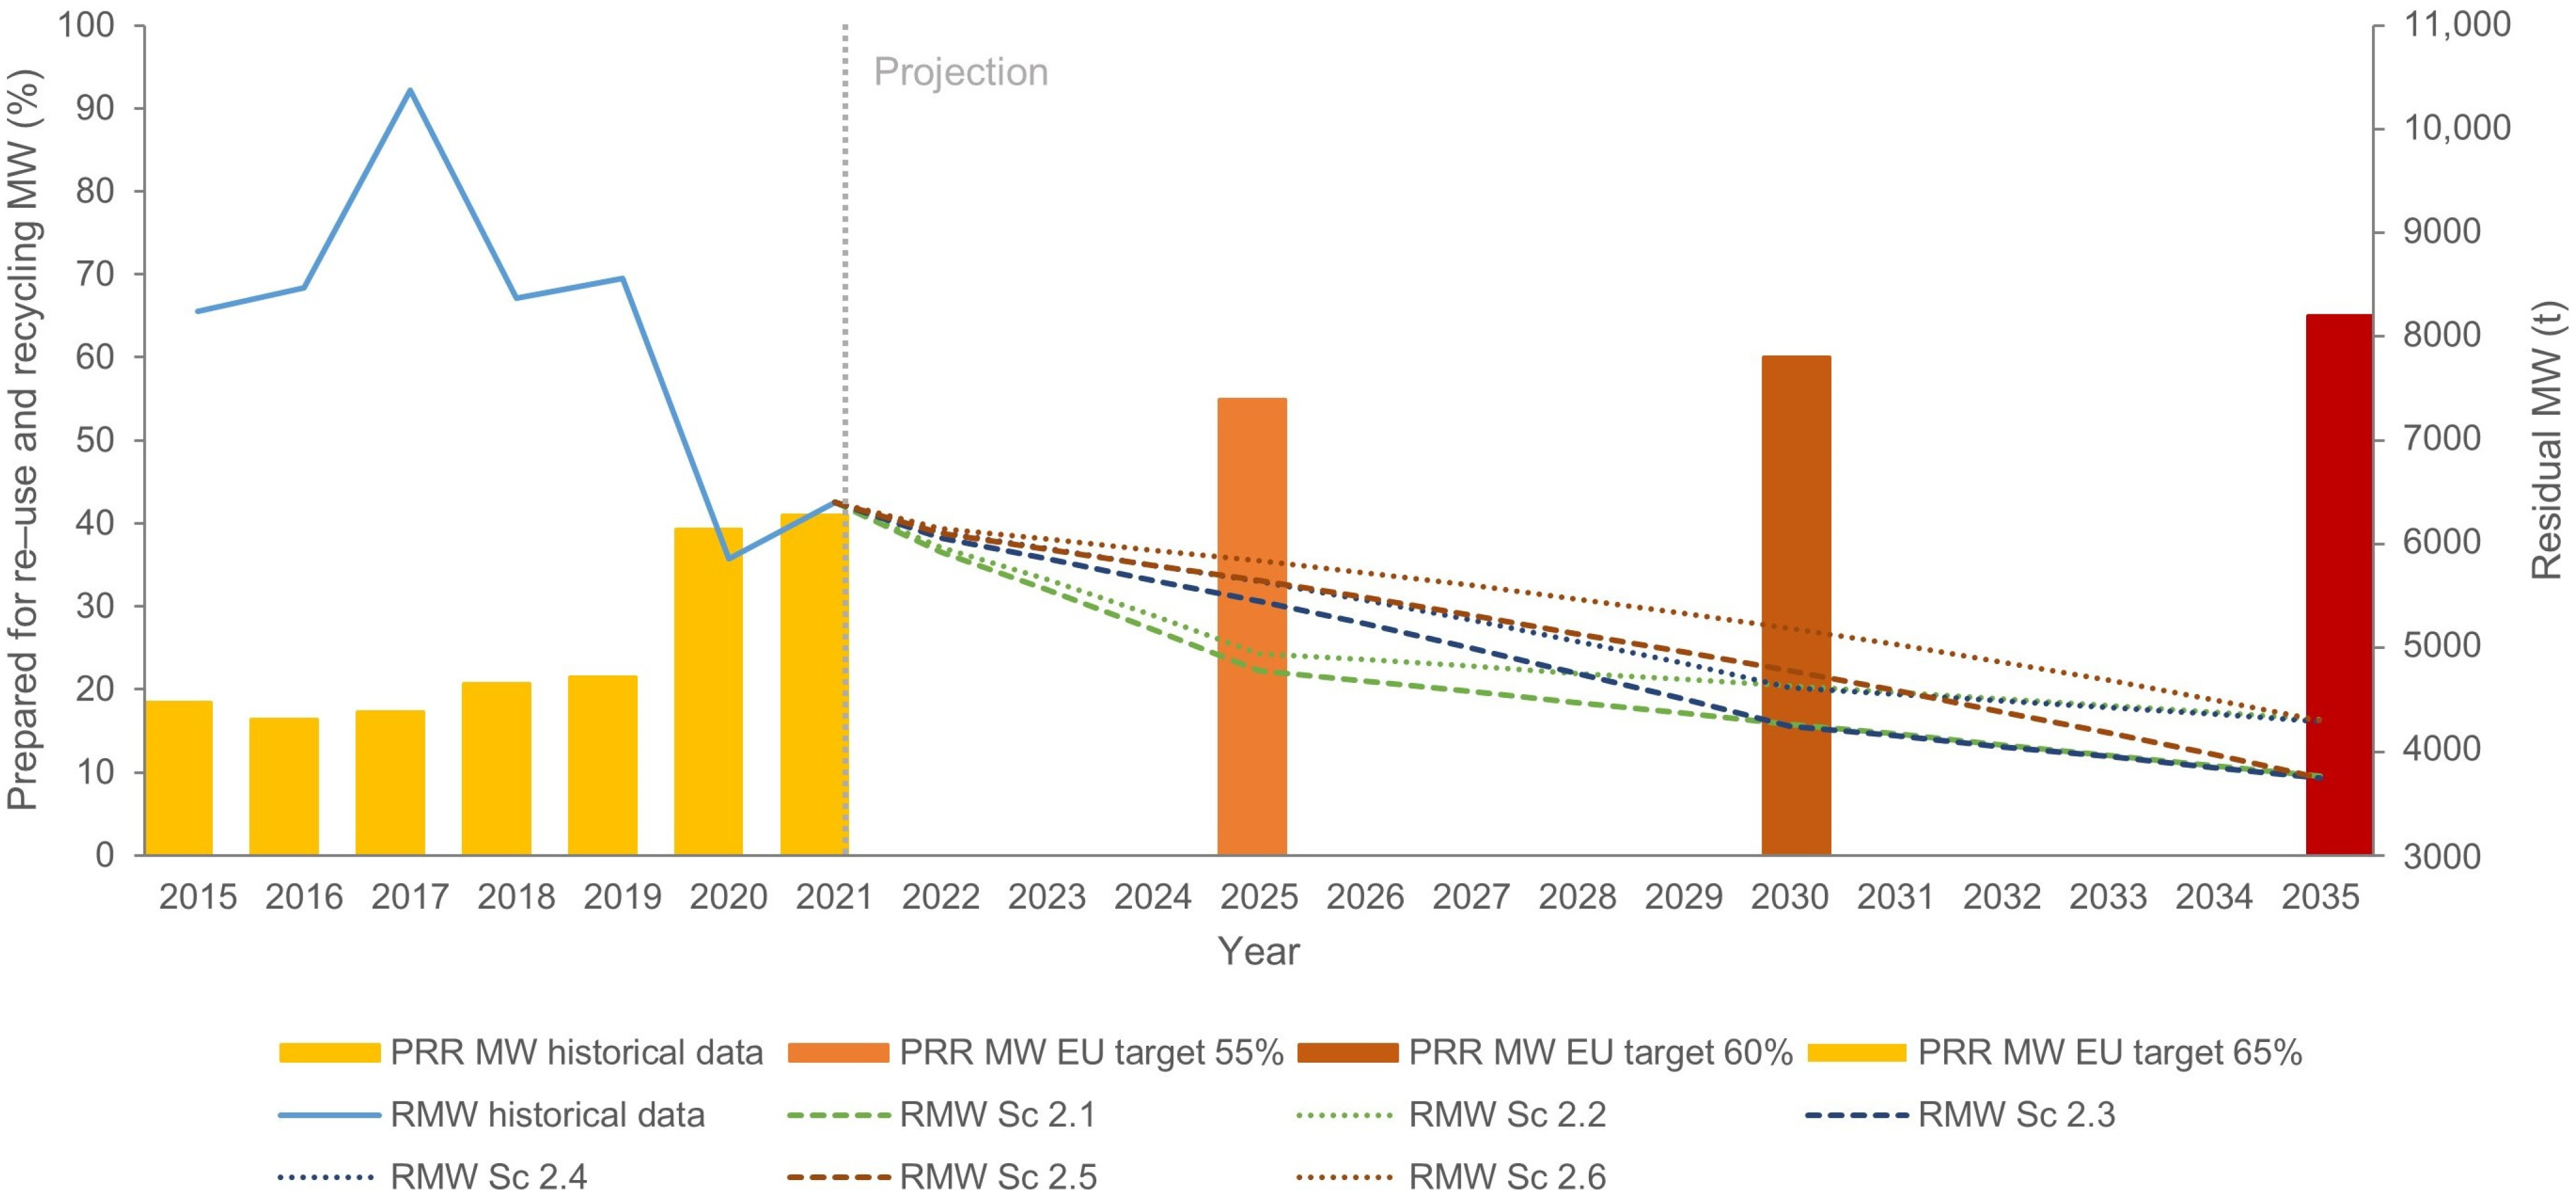
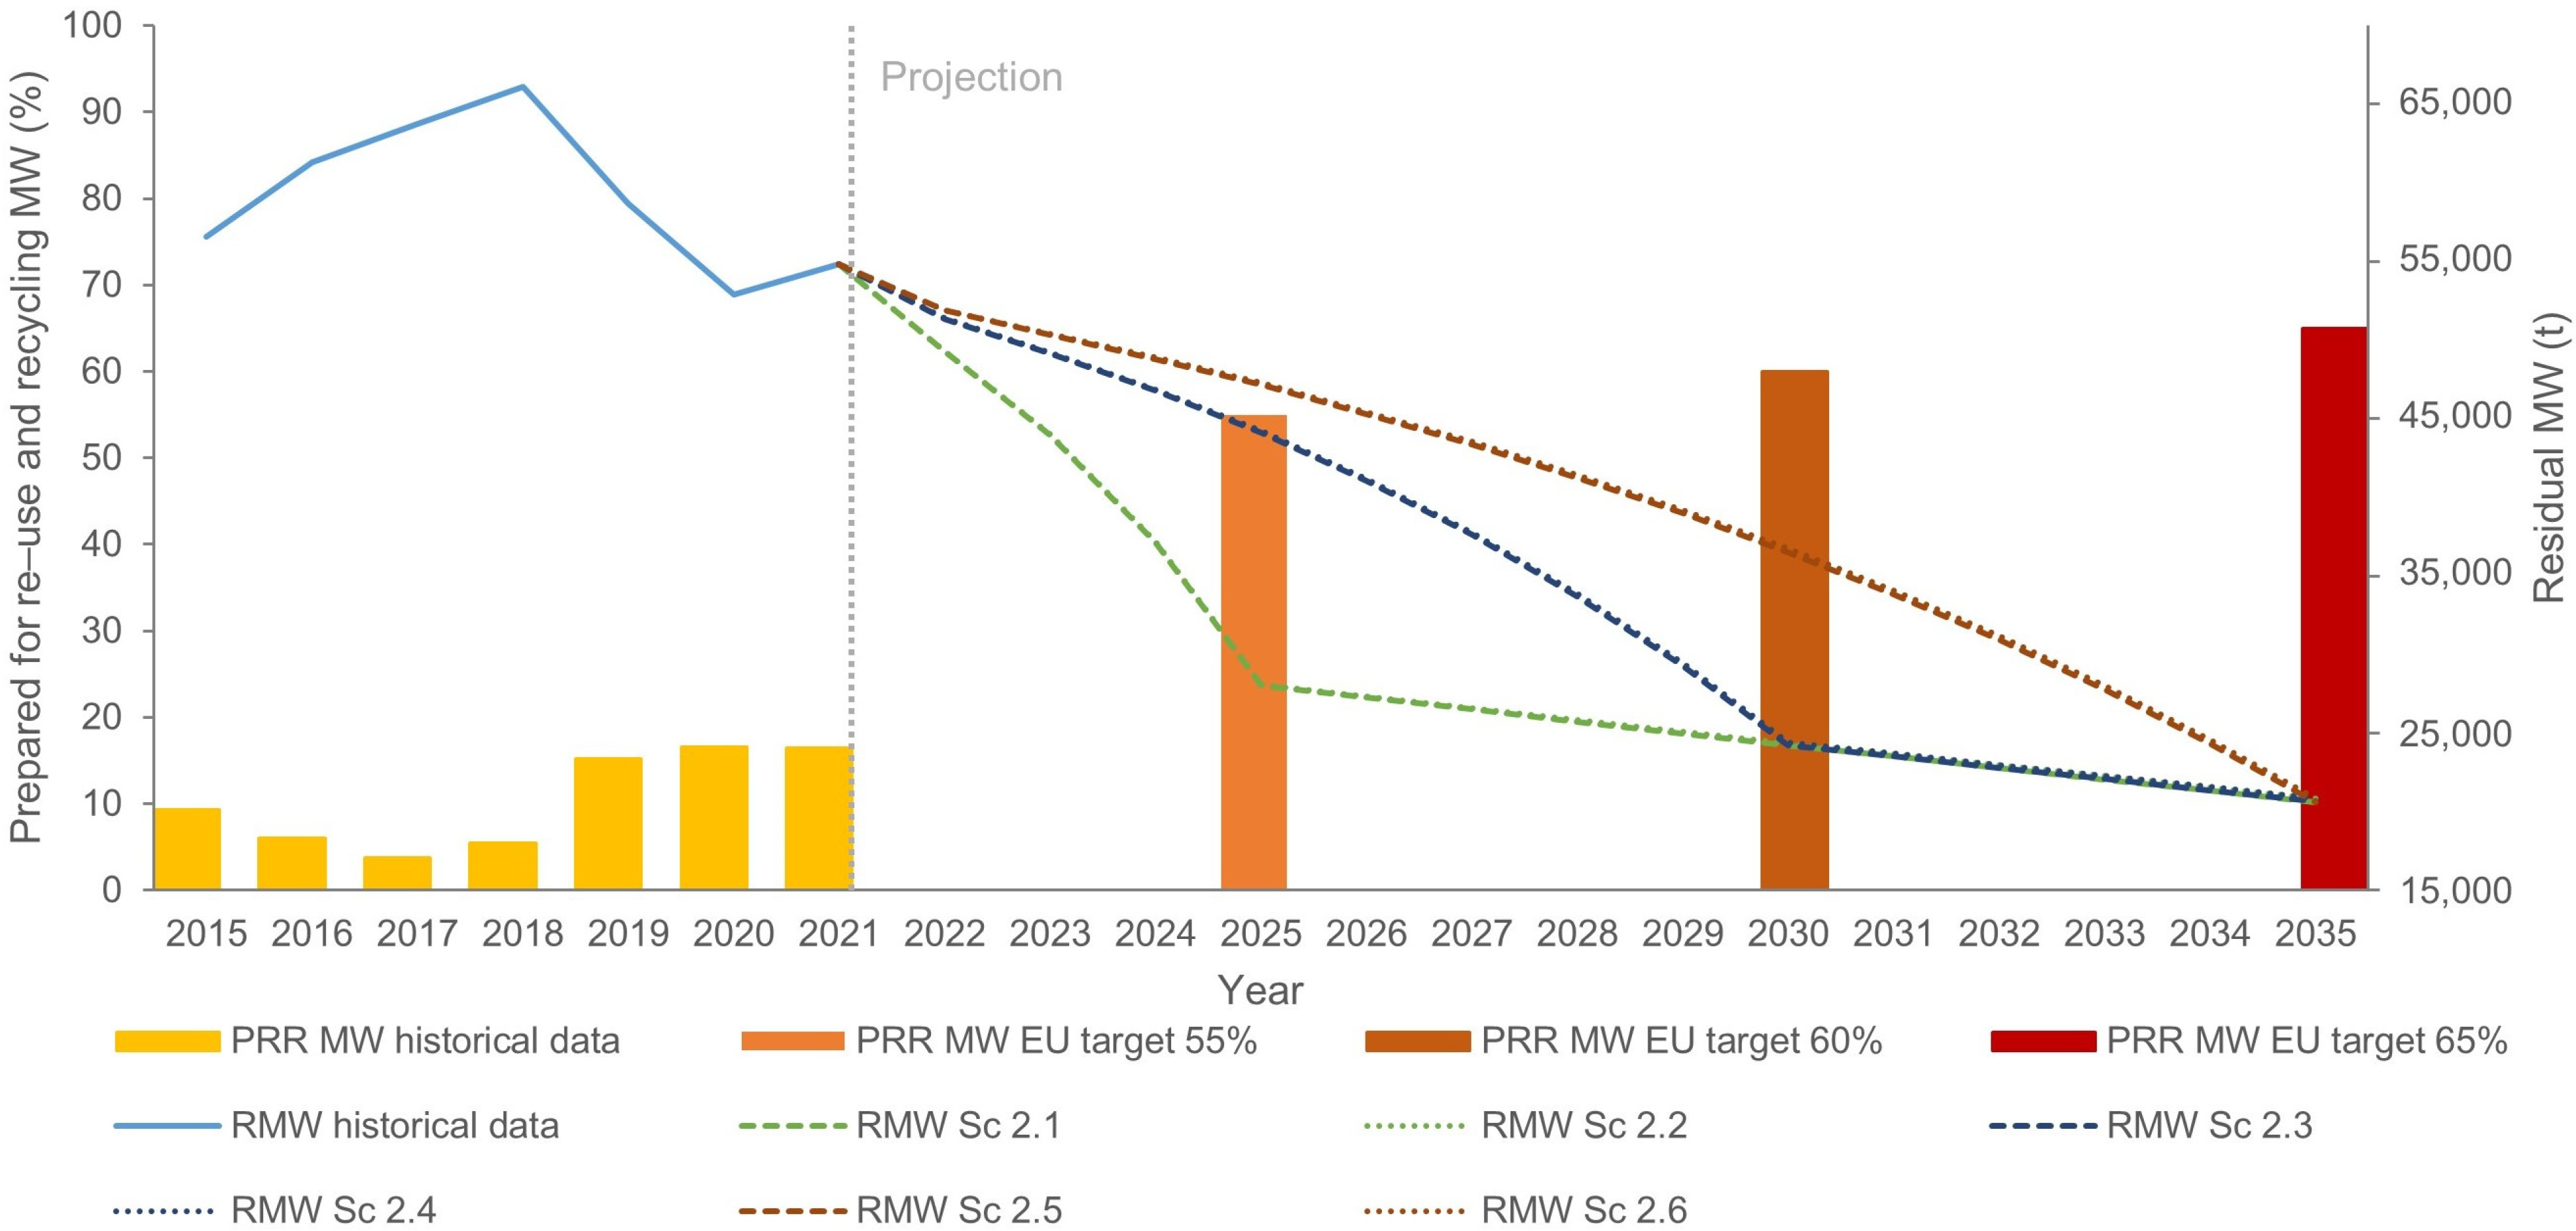
Figure 6, Figure 7, Figure 8, Figure 9 and Figure 10 compare the historical data (2015–2021) with the evolution of the annual amounts of collected RMW and the rates of separately collected MW (recyclables: paper/cardboard, glass, plastics, metal, and biowaste) for reuse or recycling for Zagreb, Poreč, Rovinj, Split, and Dubrovnik from 2021 to 2035 required to meet the EU targets under Scenario 2 (Sc 2) (Table 3). The historical data prove that MW management has improved in recent years in Zagreb, Rovinj, and Split, while in Poreč and Dubrovnik, negative trends in the examined period can be observed. The existing rates of reuse and recycling in the analyzed towns remain low, owing to externalities such as inefficient MW recyclable sorting at the source, resulting in it being deposited in landfills rather than recycled. Under the European Commission’s Waste Framework Directive, at least 55%, 60%, and 65% of MW by weight should be recycled or prepared for reuse by 2025, 2030, and 2035, respectively. However, the Republic of Croatia and its top tourist towns are currently not on track to meet these targets unless residual MW is reduced and separately collected MW is increased (Figure 6, Figure 7, Figure 8, Figure 9 and Figure 10). Equations for a suitable second-degree polynomial describing a set of numerical data on two variables (TEP and collected MW quantities) are shown for Zagreb, Poreč, and Rovinj in Table 4 and Split and Dubrovnik in Table 5.

Figure 6.
Evolution, 2015–2021, and projection, 2021–2035, of MW prepared for reuse and recycling (PRR MW) and residual MW (RMW) in Zagreb with EU goals.
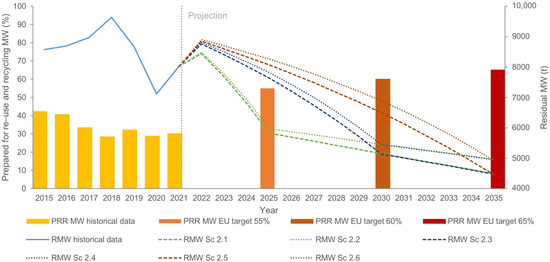
Figure 7.
Evolution, 2015–2021, and projection, 2021–2035, of MW prepared for reuse and recycling (PRR MW) and residual MW (RMW) in Poreč with EU goals.
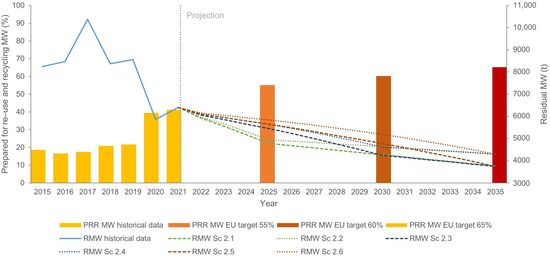
Figure 8.
Evolution, 2015–2021, and projection, 2021–2035, of MW prepared for reuse and recycling (PRR MW) and residual MW (RMW) in Rovinj with EU goals.
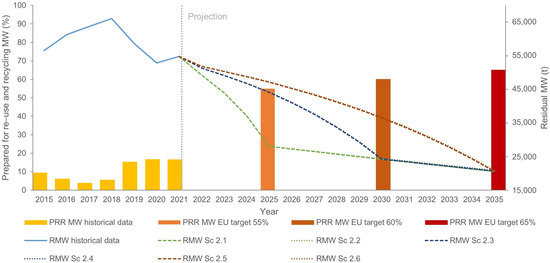
Figure 9.
Evolution, 2015–2021, and projection, 2021–2035, of MW prepared for reuse and recycling (PRR MW) and residual MW (RMW) in Split with EU goals.
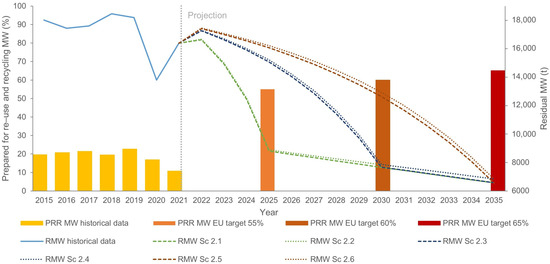
Figure 10.
Evolution, 2015–2021, and projection, 2021–2035, of MW prepared for reuse and recycling (PRRMW) and residual MW (RMW) in Dubrovnik with EU goals. Dubrovnik.
Figure 6 shows that in 2021, the capital city of Zagreb prepared over 30% of its MW for reuse or recycling, leaving approximately 215,380 t of RMW. Figure 6 shows future projections of the annual amounts of collected RMW and waste rates prepared for reuse and the recycling required to meet EU targets. To meet all three targets, Sc 2 reveals that the RMW in Zagreb needs to decrease by 36%, 44%, and 53% by 2025, 2030, and 2035, respectively, from 2021 levels.
In 2021, Poreč prepared approximately 30% of its MW for reuse or recycling, whereas Rovinj prepared 41%. In 2021, 8000 t of RMW in Poreč and 6500 t in Rovinj were landfilled. The coastal towns of Poreč and Rovinj show more pronounced changes in yearly RMW collection and waste rates prepared for reuse and recycling with respect to fulfilling EU targets when all sub-scenarios are compared (Figure 7 and Figure 8). In Sc 2.1, even if all three targets are met for Poreč, residual MW should be reduced by 27%, 36%, and 44% by 2025, 2030, and 2035 compared with 2021. In Sc 2.2, RMW should be reduced by 25%, 32%, and 38% compared with 2021. In Sc 2.5 and Sc 2.6, the 65% target could be met if RMW is reduced by 38% or 39% by 2035, respectively. Rovinj prepared 41% of its MW for reuse or recycling in 2021 and is closer to meeting targets than the other towns (Figure 8). Specifically, RMW should be decreased by 25% by 2025, 33% by 2030, and 41% by 2035 compared with 2021 (Sc 2.1). Sc 2.2 illustrates that for Rovinj to meet all three targets, RMW needs to be decreased by 22%, 26%, and 32% by 2025, 2030, and 2035, respectively, compared with 2021. For Rovinj to meet targets for 2030 (60%) and for 2035 (65%) (Sc 2.3 and Sc 2.4), RMW must decrease by 33% and 42% by 2030 and 28% and 33% by 2035, respectively, compared with 2021. In Sc 2.5 and Sc 2.6, the 65% target could be met by reducing RMW by 41% and 32% by 2035, respectively, compared with 2021.
Split, Croatia’s second-largest city, prepared 16% of its MW for reuse or recycling in 2021, with about 55,000 t of RMW being landfilled. In Sc 2, targets might be accomplished, but Split would have to achieve ambitious RMW reductions of 49%, 56%, and 62% by 2025, 2030, and 2035, respectively, compared with 2021 (Figure 9).
Dubrovnik, Dalmatia’s most popular tourist town, prepared only 11% of its MW for reuse or recycling in 2021 and more than 16,000 t of RMW was landfilled. In Dubrovnik, a problem similar to Split exists: to fulfill all three targets, RMW must be decreased by 46%, 53%, and 59% in 2025, 2030, and 2035, respectively, compared with 2021 (Figure 10).
The results suggest that—in all five of Croatia’s leading tourist towns—the imperative must be to (1) decrease residual MW and (2) promote separation at the source and separate MW collection to meet EU targets. Given the challenges of meeting all three—or even two or one—of the EU’s targets (50% by 2025, 60% by 2030, and 65% by 2035), the current waste separation system must be improved. Progress in MW management could be made by increasing separate waste collection and recovery measures and activities; investing in new infrastructure and equipment acquisition; raising awareness through education; and encouraging the preparation, implementation, and development of waste prevention and reuse programs and projects that encourage the active and sustained participation of individual residents and non-residents in MW reduction (recycling, composting, and reuse initiatives) and properly separating and collecting recyclable waste.
3. Materials and Methods
Several scientific methods and procedures were used to obtain the research results. First, to determine the relationship between MW and tourist intensity, we used a sample of the five Croatian tourist towns with the highest number of overnight stays for 2015–2021, as reported by the Croatian Bureau of Statistics [5]. Data for all the analyzed parameters in MW management systems were collected for 2015–2021. The following parameters were included in the analysis: the total area of the towns in km2 according to the Register of Cities and Municipalities According to Area Size (2017) [31]; the population of the selected towns at the end of the examined years (2015 to 2021) according to the Population Estimate and Natural Change document, the situation as on 31 December published by the Croatian Bureau of Statistics (2024) [32], data on the total tourist nights in commercial accommodation establishments from 2015 to 2021 according to Tourism published by the Croatian Bureau of Statistics (2024) [5]; and TEP, ETP, and TI values and quantity data on the total MW, separately collected MW, and residual MW collected, as per the Municipal Waste Statistics (Eurostat) [16] and Reports on Municipal Waste for 2015 to 2021 published by the Ministry of Economy and Sustainable Development Republic of Croatia [17,33].
In the Republic of Croatia, waste from tourist accommodations (hotels, resort hotels, apartments, motels, private accommodations, cottages and cabins, youth hostels, camps, etc.) is collected with commercial or municipal waste. In both cases, the waste data cannot be directly attributed to tourist activities because they are always a mixture (for example, household and similar household waste (hotel waste) or hotel waste and other commercial waste). Therefore, we calculated the quantities of total MW, separately collected MW, and residual MW collected for the examined towns based on the TEP, representing the sum of residents plus the ETP. The term “resident population” refers to the officially registered population throughout the investigation period, whereas ETP represents tourists as an additional population, that is, the number of overnight stays converted into the equivalent number of persons living in that location all year. The ETP indicator is calculated by dividing the number of overnight stays by days in the year (365 or 366 in leap years) according to the following formula:
ETP = Number of overnight stays/Days in the year.
According to Eurostat, TI [21] accounts for the ratio between the number of overnight stays at tourist accommodation establishments and the total permanent resident population of the area, and it is calculated according to the following formula:
TI = Nights spent at tourist accommodation establishments/Total permanent resident population of the area.
The connection between the numerical variables in this study (collected MW and tourism intensity) was tested using Pearson’s correlation coefficient. Correlation explores the strength and direction of the relationship between two variables. A positive relationship or correlation exists when both variables grow or decline together, whereas a negative direction shows that the other variable declines when one variable grows, and vice versa. If the direction is not considered, i.e., the signs of a plus or a minus, it is possible to notice the strength of the link between the variables [34,35].
The amounts of separate and residual MW collected to achieve EU targets for Croatia’s top tourist destinations were estimated for 2021 to 2035. This was based on the population decline in Croatia between 2021 and 2035 (source: United Nations, Department of Economic and Social Affairs, Population Division, World Population Prospects (2022) [23]); projections of the number of overnight tourist stays in Croatia for 2021–2035 based on a conservative annual growth rate of 1% or 3% (source: The Strategy for Sustainable Tourism Development until 2030 in the Republic of Croatia [24]); the average total separate and residual MW collected per capita in 2015–2021; and the EU MW targets for 2025, 2030, and 2035 (source: Directive 2008/98/EC of the European Parliament and Council of 19 November 2008 on waste and repealing certain directives [19] and the decision on adopting the Waste Management Plan of the Republic of Croatia for the period 2023–2028 [36]). The datasets for all 5 towns for 2015–2021 are presented and compared in Table 2.
Table 2.
The data used in this research.
3.1. Overview of Croatia’s Top Tourist Destinations for 2015–2021
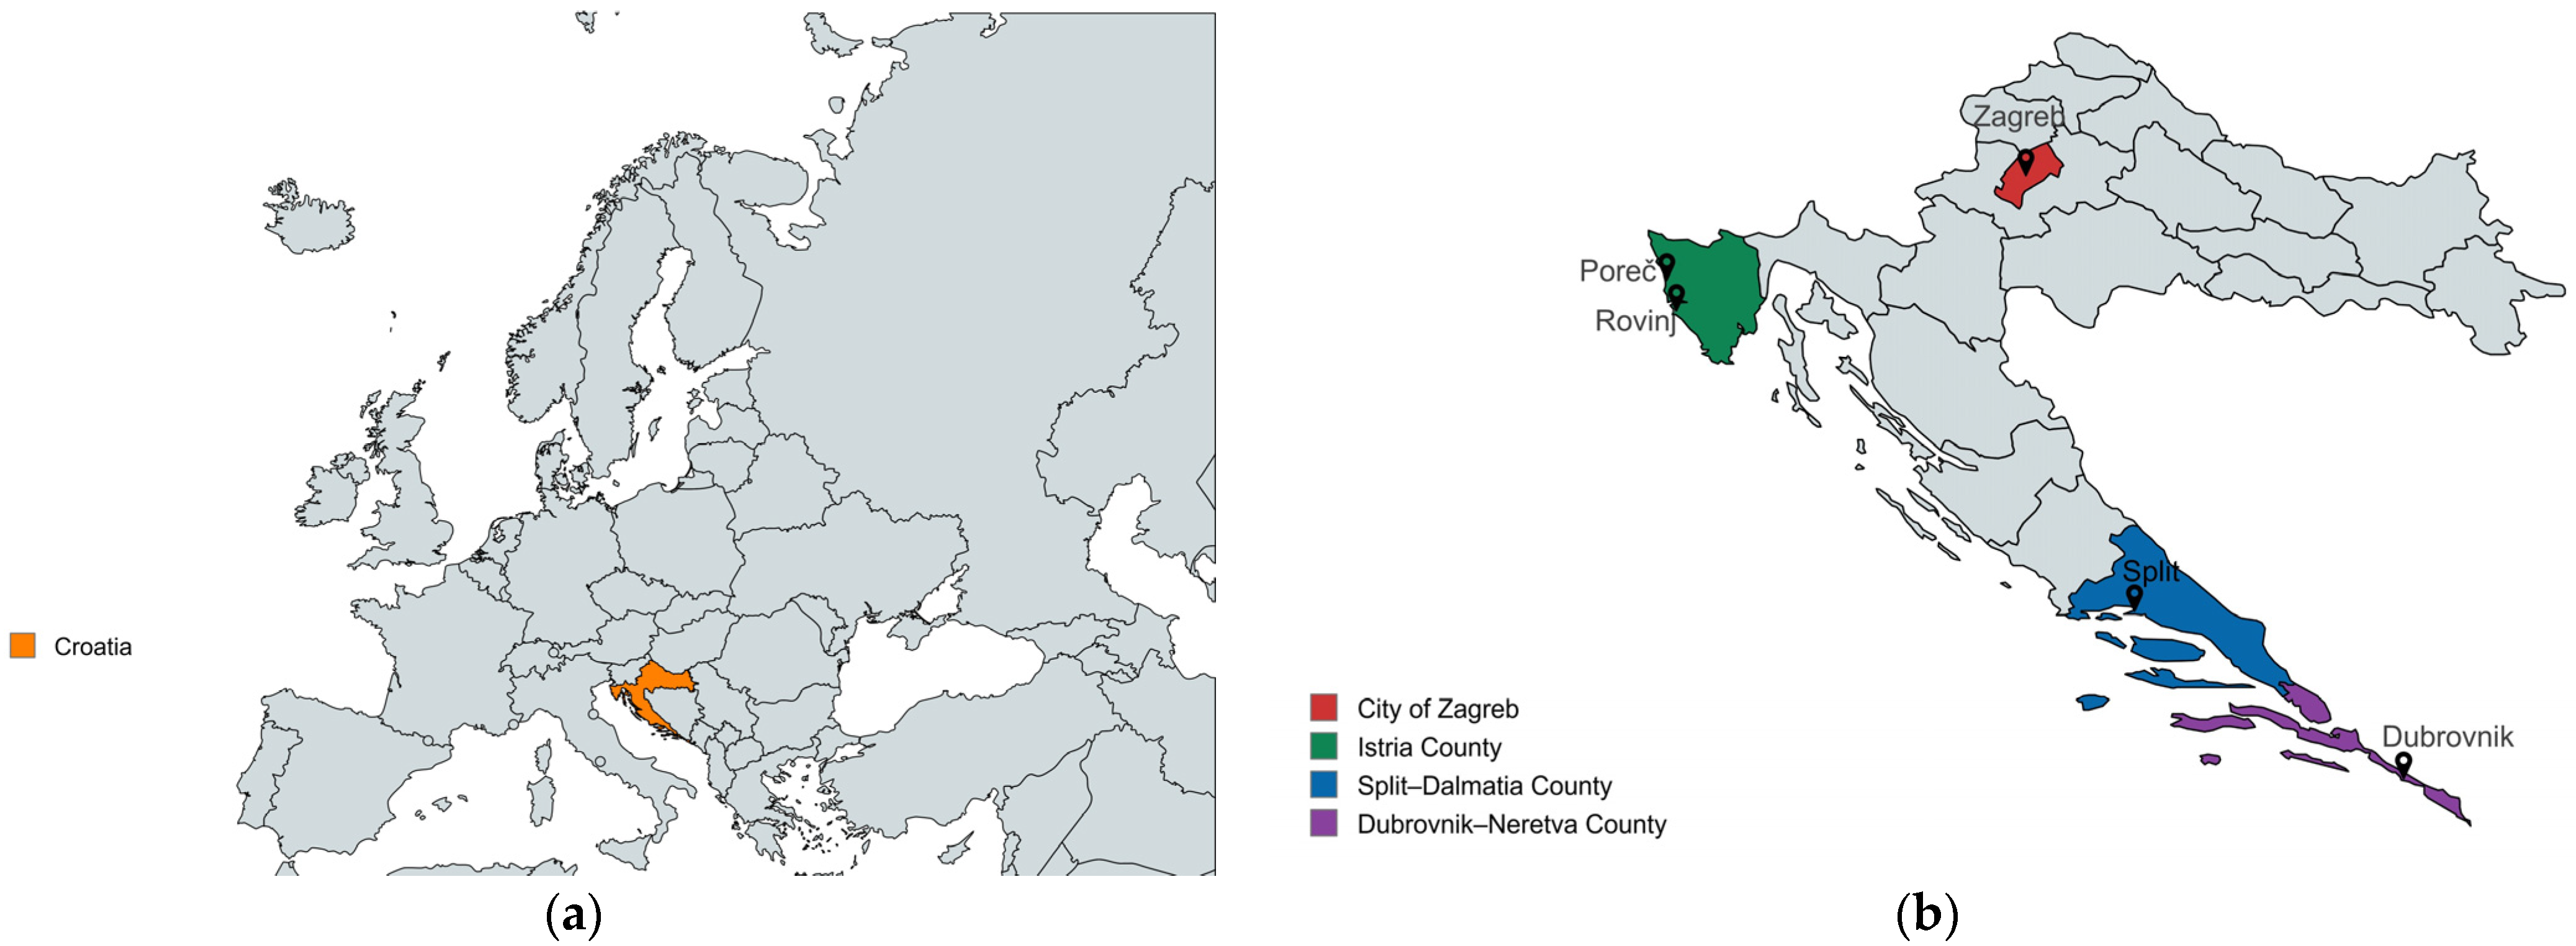
Croatia is situated on the Adriatic Sea at the crossroads of Central and Southeast Europe and covers 56,594 km2. It shares land borders with Slovenia, Hungary, Serbia, Bosnia and Herzegovina, and Montenegro, as well as a marine border with Italy (Figure 11a). The population is approximately 4 million. Croatia is administratively divided into the City of Zagreb and 20 counties, which are further subdivided into towns/cities and municipalities. Eight regions are designated for tourism development and marketing. Central Croatia and Slavonia are commonly referred to as Continental Croatia, in contrast to Coastal Croatia, which includes seaside districts [37].
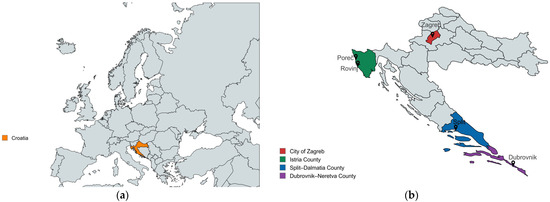
Figure 11.
(a) Map of Europe with Croatia highlighted; (b) Croatian county map featuring the popular tourist destinations studied in this research, i.e., Zagreb, Poreč, Rovinj, Split, and Dubrovnik.
A tourist destination is a geographical region with specific attractiveness for tourists, encompassing natural, infrastructural, and recreational capacities used to host tourism activities [38]. Urban/city destinations offer a broad and heterogeneous range of cultural, architectural, technological, social, and natural experiences and products for leisure and business [39]. Croatia is a popular tourist destination owing to its rich cultural and historical legacy. The main tourist area of the Republic of Croatia is Coastal Croatia. It is characterized by considerable tourist activity along the coast and significantly higher visitor demand than the continental region. In this study, five Croatian tourist towns were selected based on the criterion that these areas individually achieved the largest number of overnight tourist stays from 2015 to 2021. The sample comprises one town in Continental Croatia (the City of Zagreb), two towns in Istria County (Poreč and Rovinj), and two towns in Dalmatia (Split in Split–Dalmatia County and Dubrovnik in Dubrovnik–Neretva County) (Figure 11b).
Zagreb is Croatia’s capital and the most popular tourist destination in Central Croatia. Istria’s most popular tourist towns are Rovinj and Poreč. Dubrovnik is Dalmatia’s most popular tourist town, followed by the centuries-old town of Split. Poreč, Split, and Dubrovnik are included in the UNESCO World Cultural Heritage List [40].
The selected towns range in area from 77.48 km2 for Rovinj to 641,25 km2 for Zagreb, the largest town, followed by 142.64 km2 for Dubrovnik, 111.67 km2 for Poreč, and 79.30 km2 for Split.
An analysis of the number of residents (Table 2) in all the examined towns showed a decline in the total population from 2015 to 2021. At the same time, Zagreb and the coastal area towns have faced population growth due to tourism. Table 2 shows that, in 2019, Croatia’s top tourist destinations recorded the most overnight tourist stays. There was a continuous increase since 2015 that was only interrupted by the pandemic in 2020, after which, it soon recovered. By the end of 2021, tourism realized an average of 66% tourist nights from the pre-pandemic record in 2019 [3,4,5].
Waste collection refers to any waste collection, including pre-sorting and storage for transport to a waste treatment facility. The total collected MW comprises waste collected separately from households, such as paper and cardboard, glass, metal, plastics, bio-waste, and residual MW. In the analyzed years, the tourist towns in Istria, Rovinj and Poreč, had the highest total MW collected per capita, with 2.19 kg/day and 2.15 kg/day, respectively. Dubrovnik was third in terms of the total MW collected per capita, with 1.17 kg/day, followed by Split with 1.09 kg/day and Zagreb with 0.91 kg/day in the analyzed years (Table 2). The MW fraction separately collected at the source of generation was approximately 34% in Poreč, 25% in Rovinj, 22% in Zagreb, 19% in Dubrovnik, and 10% in Split. The amounts of separately collected MW and changes between 2015 and 2021 (Table 2) indicate positive trends in Rovinj, Zagreb, and Split. In Poreč and Dubrovnik, negative trends in separate waste collection in the examined period can be observed.
The collected MW increased from 2015 to 2019 alongside the rising number of overnight stays. In 2020, owing to a significant decline in overnight stays due to the COVID-19 pandemic, there was a significant drop in the amount of MW collected. In 2021, with the rise in overnight stays, the amount of MW increased as well.
3.2. Assessment of Municipal Waste Flow Development
The quantities of collected MW, the total amount of separately collected MW recyclables, and the amount of collected residual MW in Croatia’s top tourist destinations were calculated for 2021 to 2035, assuming the fulfilment of the EU MW objectives for 2025, 2030, and 2035. This calculation was based on estimation and probabilistic forecasts of the total population of Croatia [23], the number of overnight tourist stays based on a conservative growth rate of 1% or 3% per year from 2021 to 2035 [24], and the average total separate and residual MW collected per capita of the TEP in the 2015–2021 period. Table 3 summarizes the examined scenarios.
Table 3.
Scenario explanations and assumptions and targets.
Sc 1 evaluates the effect of a change in the total equivalent population (resident and tourist equivalent population) on MW. Regarding resident population projections for the selected Croatia towns, the annual percentage changes between 2021 and 2030 amounted to −0.58% and −0.64% annually between 2030 and 2035 (Sc 1.1). In the overnight stay estimates, a conservative growth rate for 2021–2035 was used, 1% (Sc 1.2) or 3% per year (Sc 1.3). Accounting for the population decline in Croatia, the population changes caused by tourism, and the average quantity of total MW collected per capita of the TEP from 2015 to 2021, the collected MW quantities in selected towns were calculated with reference to the TEP for 2021–2035. With a dataset consisting of independent data values, xi, i.e., TEP, and dependent data values, yi, i.e., collected MW quantities, where i = 1, …, 15, we used applied mathematics, particularly the linear interpolation method, to find a single line that goes through all the data points. Equations representing a set of numerical data on a pair of variables (TEP and collected MW quantities) using a suitable first-degree polynomial are given below in Table 4 for Zagreb, Poreč, and Rovinj and Table 5 for Split and Dubrovnik.
Sc 2 focuses on estimating the quantities of collected residual MW and the amounts of separately collected MW from 2021 to 2035 required to meet the EU targets for preparing MW for reuse and recycling: at least 55% of MW by weight by 2025, 60% by 2030, and 65% by 2035 (Sc 2.1 and Sc 2.2), at least 60% by 2030 and 65% by 2035 (Sc 2.3 and 2.4), and at least 65% of MW weight by 2035 (Sc 2.5 and 2.6) regarding TEP trends in Croatia’s top tourist towns. In Sc 2, the values for the total separate and residual MW collected per capita of the TEP for 2021–2035 were calculated based on the following: the population changes explained in Sc 1, average total separate and residual MW collected per capita of the TEP from 2015 to 2021, and EU targets for processing MW for reuse and recycling. With a dataset consisting of independent data values, xi, i.e., TEP, and dependent data values, yi, i.e., collected MW quantities, where i = 1, …, 15, we used polynomial interpolation methods to find a single polynomial that goes through all the data points. The following tables provide equations for a suitable second-degree polynomial that describes a set of numerical data based on two variables (TEP and collected MW quantities). The results for Zagreb, Poreč, and Rovinj are in Table 4 and for Split and Dubrovnik are in Table 5.
Table 4.
Linear and quadratic equations for Zagreb, Poreč, and Rovinj in the examined scenarios.
Table 4.
Linear and quadratic equations for Zagreb, Poreč, and Rovinj in the examined scenarios.
| Scenarios | Zagreb | Poreč | Rovinj |
|---|---|---|---|
| Sc 1.1 and Sc 1.2 | y = 0.3272x | y = 0.5506x | y = 0.4682x |
| Sc 1.1 and Sc 1.3 | y = 0.3274x | y = 0.5508x | y = 0.4684x |
| Sc 2.1 | y = 3 × 10−5x2 − 37.87x + 1 × 10⁷ | y = 0.0327x2 − 1522.5x + 2 × 10⁷ | y = 0.0229x2 − 1046.1x + 1 × 10⁷ |
| Sc 2.2 | y = 3 × 10−5x2 − 39.561x + 1 × 10⁷ | y = 0.0014x2 − 68.786x + 871,506 | y = 0.0002x2 − 8.437x + 112,685 |
| Sc 2.3 | y = 2 × 10−5x2 − 21.433x + 7 × 10⁶ | y = 0.009x2 − 409.18x + 5 × 10⁶ | y = 0.0218x2 − 1001.1x + 1 × 10⁷ |
| Sc 2.4 | y = 2 × 10−5x2 − 22.172x + 8 × 10⁶ | y = 0.0011x2 − 57.864x + 746,399 | y = 0.0001x2 − 7.1955x + 99,753 |
| Sc 2.5 | y = −6 × 10−6x2 + 10.513x − 4 × 10⁶ | y = −0.0205x2 + 973.95x − 1 × 10⁷ | y = 0.0015x2 − 78.183x + 983,084 |
| Sc 2.6 | y = −7 × 10−6x2 + 11.25x − 5 × 10⁶ | y = −0.0001x2 + 4.4921x – 23,455 | y = −2 × 10−5x2 + 0.531x + 5305.5 |
Table 5.
Linear and quadratic equations for Split and Dubrovnik in the examined scenarios.
Table 5.
Linear and quadratic equations for Split and Dubrovnik in the examined scenarios.
| Scenarios | Split | Dubrovnik |
|---|---|---|
| Sc 1.1 and Sc 1.2 | y = 0.3872x | y = 0.4251x |
| Sc 1.1 and Sc 1.3 | y = 0.3874x | y = 0.4252x |
| Sc 2.1 | y = 0.0003x2 − 99.811x + 8 × 10⁶ | y = 0.0027x2 − 238.88x + 5 × 10⁶ |
| Sc 2.2 | y = 0.0004x2 − 134.41x + 1 × 10⁷ | y = 0.0222x2 − 2050.2x + 5 × 10⁷ |
| Sc 2.3 | y = 0.0001x2 − 43.888x + 3 × 10⁶ | y = 0.001x2 − 81.827x + 2 × 10⁶ |
| Sc 2.4 | y = 0.0002x2 − 53.809x + 4 × 10⁶ | y = −0.0128x2 + 1200.6x − 3 × 10⁷ |
| Sc 2.5 | y = −0.0001x2 + 40.722x − 3 × 10⁶ | y = −0.0013x2 + 122.35x − 3 × 10⁶ |
| Sc 2.6 | y = −0.0002x2 + 59.965x − 5 × 10⁶ | y = −0.0285x2 + 2656.1x − 6 × 10⁷ |
4. Conclusions
By providing evidence of the correlation between the collected MW and tourism intensity, this study contributes to the literature on the effects of population changes caused by tourism on MW in tourist destinations. Additionally, it offers a comparative analysis of target scenarios for MW reduction in Croatia’s leading tourist towns based on population changes and amounts of separate and residual MW collected to achieve EU targets for MW reuse and recycling.
The TI indicator quantifies a population’s theoretical multiplication during tourist influx and provides a clear picture of the pressure exerted by tourism. The results show that, for 2015–2021, Rovinj and Poreč have the highest TIs among towns with the most overnight stays. Larger cities like Zagreb, Split, and Dubrovnik have lower average TI values. The correlation between collected MW and tourism intensity in Zagreb and Rovinj is high and negative. Split has a higher positive correlation than Poreč. Dubrovnik has a very high positive correlation between MW and tourism intensity. These findings are relevant for practitioners and policymakers when planning MW collection, processing, and recovery in their local waste management systems. However, causality in the relationship between MW and tourism intensity in towns with the most overnight stays has yet to be determined.
Historical (2015–2021) and projected annual amounts of MW collected from 2021 to 2035 are shown. These results indicate that despite a continuous decline in resident populations, the tourist population is growing, putting a significant burden on the populations of tourist towns. Waste management practices vary from town to town, but despite implementing local zero-waste strategies, all five of Croatia’s most popular tourist destinations—Zagreb, Poreč, Rovinj, Split, and Dubrovnik—fall far short of EU goals regarding separate MW collection. The results show that if the strategies outlined in the projected scenarios are implemented in all five towns, the EU goals might be met; nonetheless, these towns would still need to achieve ambitious residual MW reductions. Some of the main challenges facing waste management in tourist towns in meeting the EU’s targets include a potential underestimation of the amount of MW collected due to underreporting all recyclables on the market, weak enforcement mechanisms in implementing waste management according to the principles of waste hierarchy, and significant landfilling.
Croatia relies on tourism. As such, our analysis of the effects of the population changes caused by tourism on MW in this country’s tourist destinations is particularly valuable for assessing sustainable MW management strategies. Furthermore, the methodology we proposed provides a foundation for decision making and can be applied to other tourist destinations that aspire to benefit more from developing the tourism industry while simultaneously implementing MW prevention and minimization strategies, as in the case of Croatia. The methods and procedures used in this study are easily implementable as long as the appropriate variables are selected and context-specific data are collected. Further research on the impact of population changes caused by tourism on MW should include an assessment of the environmental implications of waste management processes, goods, and services throughout their cycles in Croatia’s tourist destinations.
Author Contributions
Conceptualization, I.S.; methodology, I.S.; software, I.S.; validation, I.S.; formal analysis, I.S. and J.S.; investigation, I.S.; resources, I.S. and J.S.; data curation, I.S. and J.S.; writing—original draft preparation, I.S.; writing—review and editing, I.S.; visualization, I.S.; supervision, I.S. All authors have read and agreed to the published version of the manuscript.
Funding
This research received no external funding.
Data Availability Statement
The data are contained in the study.
Conflicts of Interest
The authors declare no conflicts of interest.
References
- Goorhuis, M. Developments in Collection of Municipal Solid Waste. In Handbook of Recycling: State-of-the-Art for Practitioners, Analysts, and Scientists; Worrell, E., Reuter, M.A., Eds.; Elsevier Inc.: Amsterdam, The Netherlands, 2014; pp. 405–420. [Google Scholar]
- Munoz, E.; Navia, R. Waste management in touristic regions. Waste Manag. Res. 2015, 33, 593–594. [Google Scholar]
- Arrivals at Tourist Accommodation Establishments by NUTS 2 Regions. Available online: https://ec.europa.eu/eurostat/databrowser/view/tour_occ_arn2/default/map?lang=en&category=reg.reg_tour.reg_tour_occ (accessed on 24 April 2024).
- Nights Spent at Tourist Accommodation Establishments by NUTS 2 Regions. Available online: https://ec.europa.eu/eurostat/databrowser/view/TOUR_OCC_NIN2/default/table?lang=en&category=tour.tour_inda.tour_occ.tour_occ_n (accessed on 24 April 2024).
- Croatian Bureau of Statistics. Tourist Arrivals and Nights in Commercial Accommodation Establishments. Available online: https://web.dzs.hr/PXWeb/Menu.aspx?px_language=en&px_type=PX&px_db=Turizam (accessed on 24 April 2024).
- Republic of Croatia, Ministry of Tourism and Sports Republic of Croatia, Tourism in Figures Edition 2023. Available online: https://www.htz.hr/en-GB/tourism-information/tourism-analysis/tourism-figures (accessed on 22 April 2024).
- European Environment Agency, The European Environment—State and Outlook 2020 Knowledge for Transition to a Sustainable Europe. Available online: https://www.eea.europa.eu/soer/publications/soer-2020 (accessed on 22 April 2024).
- Mateu-Sbert, J.; Ricci-Cabello, I.; Villalonga-Olives, E.; Cabeza-Irigoyen, E. The impact of tourism on municipal solid waste generation: The case of Menorca Island (Spain). Waste Manag. 2013, 33, 2589–2593. [Google Scholar] [CrossRef] [PubMed]
- Arbulú, I.; Lozano, J.; Rey-Maquieira, J. The challenges of municipal solid waste management systems provided by public-private partnerships in mature tourist destinations: The case of Mallorca. Waste Manag. 2016, 51, 252–258. [Google Scholar] [CrossRef] [PubMed]
- Obersteiner, G.; Gruber, I.; Romein, A.; Eriksson, M.; Fertner, C.; Grosse, J.; Olsen, T.B. Urban Strategies for Waste Management in Tourist Cities D2.5: Status Quo (Baseline) Assessment Report; Urban-Waste: Gouda, The Netherlands, 2017; Available online: http://www.urban-waste.eu/wp-content/uploads/2018/10/D2.5-Status-quo-assessment.pdf (accessed on 22 April 2024).
- Estay-Ossandon, C.; Mena-Nieto, A. Modelling the driving forces of the municipal solid waste generation in touristic islands. A case study of the Balearic Islands (2000–2030). Waste Manag. 2018, 75, 70–81. [Google Scholar] [CrossRef] [PubMed]
- Diaz-Farina, E.; Díaz-Hernández, J.J.; Padrón-Fumero, N. The contribution of tourism to municipal solid waste generation: A mixed demand-supply approach on the island of Tenerife. Waste Manag. 2020, 102, 587–597. [Google Scholar] [CrossRef] [PubMed]
- Martins, A.M.; Cró, S. The Impact of Tourism on Solid Waste Generation and Management Cost in Madeira Island for the Period 1996–2018. Sustainability 2021, 13, 5238. [Google Scholar] [CrossRef]
- Caramiello, C.; Fabbri, L.; Marzi, M.; Tatàno, F. Tourism impact on municipal solid waste: Elaborations for the case study “Adriatic Riviera” (Province of Rimini, Italy). WIT Trans. Ecol. Environ. 2009, 122, 471–482. [Google Scholar] [CrossRef]
- Saito, O. Resource use and waste generation by the tourism industry on the big island of Hawaii. J. Ind. Ecol. 2013, 17, 578–589. [Google Scholar] [CrossRef]
- Municipal Waste Statistics. Available online: https://ec.europa.eu/eurostat/statistics-explained/index.php?title=Municipal_waste_statistics#Municipal_waste_generation (accessed on 24 April 2024).
- Report on Municipal Waste for 2021 in Croatia. Available online: https://www.haop.hr/hr/tematska-podrucja/otpad-registri-oneciscavanja-i-ostali-sektorski-pritisci/gospodarenje-otpadom (accessed on 25 April 2024).
- Waste Management Act of the Republic of Croatia Official Gazette, No. 84/2021, 23.7.2021. Available online: https://narodne-novine.nn.hr/clanci/sluzbeni/2021_07_84_1554.html (accessed on 25 April 2024).
- Directive 2008/98/EC of the European Parliament and of the Council of 19 November 2008 on Waste and Repealing Certain Directives (Text with EEA Relevance). Available online: https://eur-lex.europa.eu/legal-content/EN/TXT/?uri=CELEX%3A02008L0098-20240218 (accessed on 24 April 2024).
- Pirani, S.I.; Arafat, H.A. Solid waste management in the hospitality industry: A review. J. Environ. Manag. 2014, 146, 320–336. [Google Scholar] [CrossRef] [PubMed]
- Eurostat. Glossary: Tourism Intesity. Available online: https://ec.europa.eu/eurostat/statistics-explained/index.php?title=Glossary:Tourism_intensity (accessed on 10 May 2024).
- Fernandez, M.; Lazovski, O. Estimation of the equivalent tourist population through indirect methods. J. Tour. Anal. Rev. Anál. Tur. 2020, 27, 81–95. [Google Scholar] [CrossRef]
- The United Nations, Department of Economic and Social Affairs, Population Division. World Population Prospects: The 2022 Revision. Available online: https://population.un.org/wpp/ (accessed on 24 April 2024).
- The Strategy for Sustainable Tourism Development until 2030, Official Gazette 2/2023. Available online: https://www.zakon.hr/cms.htm?id=55636 (accessed on 24 April 2024).
- Dumbrovská, V.; Fialová, D. Tourist Intensity in Capital Cities in Central Europe: Comparative Analysis of Tourism in Prague, Vienna and Budapest. Czech. J. Tour. 2014, 3, 5–26. [Google Scholar] [CrossRef]
- Mikulić, J.; Miličevič, K.; Krešić, D. The relationship between brand strength and tourism intensity: Empirical evidence from the EU capital cities. Int. J. Cult. Tour. Hosp. Res. 2016, 10, 14–23. [Google Scholar] [CrossRef]
- Vojnović, N. Tourist intensity in Croatia’s leading tourist towns and municipalities. Geoadria 2018, 23, 29–50. [Google Scholar] [CrossRef]
- Manera, C.; Valle, E. Tourist Intensity in the World, 1995–2015: Two Measurement Proposals. Sustainability 2018, 10, 4546. [Google Scholar] [CrossRef]
- Neuts, B. Tourism and urban economic growth: A panel analysis of German cities. Tour. Econ. 2020, 26, 519–527. [Google Scholar] [CrossRef]
- Pavković, V.; Karabašević, D.; Jević, J.; Jević, G. The Relationship between Cities’ Cultural Strength, Reputation, and Tourism Intensity: Empirical Evidence on a Sample of the Best-Reputable European Cities. Sustainability 2021, 13, 8806. [Google Scholar] [CrossRef]
- Register of Cities and Municipalities According to Area Size, State Geodetic Administration. 2017. Available online: https://dgu.gov.hr/ (accessed on 22 April 2024).
- Croatian Bureau of Statistics. Population Estimate and Natural Change. Available online: https://podaci.dzs.hr/en/statistics/population/population-estimate/ (accessed on 2 June 2024).
- Reports on Municipal Waste for 2015, 2016, 2017, 2018, 2019, and 2020 in Croatia. Available online: https://www.haop.hr/hr/tematska-podrucja/otpad-registri-oneciscavanja-i-ostali-sektorski-pritisci/gospodarenje-otpadom-0 (accessed on 25 April 2024).
- Kreyszig, E. Advanced Engineering Mathematics, 3rd ed.; John Wiley & Sons, Inc.: New York, NY, USA, 1999; pp. 1103–1113. [Google Scholar]
- Kuckartz, U.; Rädiker, S.; Ebert, T.; Schehl, J. Statistik: Eine Verständliche Einführung, 2nd ed.; Springer: Berlin/Heidelberg, Germany, 2013; p. 213. [Google Scholar]
- Decision on Adopting the Waste Management Plan of the Republic of Croatia for the Period 2023–2028 (Official Gazette, No. 84/2023, 22.7.2023). Available online: https://narodne-novine.nn.hr/clanci/sluzbeni/2023_07_84_1334.html (accessed on 25 April 2024).
- Croatia.eu Land and People. Available online: https://www.croatia.eu/index.php/en/home-en/political-organisation/counties (accessed on 10 May 2024).
- Grauslund, D.; Justenlund, A. Tourism Destinations—From Geographical Areas to Dynamic Movements. 2015. Available online: https://www.researchgate.net/publication/312057129_Tourism_Destinations_-_From_Geographical_Areas_to_Dynamic_Movements (accessed on 10 May 2024).
- UN Standards for Measuring Tourism; Glossary of Tourism Terms. Available online: https://www.unwto.org/glossary-tourism-terms (accessed on 10 May 2024).
- UNESCO World Cultural Heritage List. Available online: https://www.croatia.eu/index.php/en/home-en/geography-and-population/historical-regions (accessed on 10 May 2024).


Disclaimer/Publisher’s Note: The statements, opinions and data contained in all publications are solely those of the individual author(s) and contributor(s) and not of MDPI and/or the editor(s). MDPI and/or the editor(s) disclaim responsibility for any injury to people or property resulting from any ideas, methods, instructions or products referred to in the content. |
© 2024 by the authors. Licensee MDPI, Basel, Switzerland. This article is an open access article distributed under the terms and conditions of the Creative Commons Attribution (CC BY) license (https://creativecommons.org/licenses/by/4.0/).