Abstract
The pollution of the environment by plastics is a global problem that is real and needs to be resolved urgently. The authors argue that banning the use of plastic is not a reasonable and rational solution for the problem because plastics have many useful applications. Solutions to the problem must involve developing scientific approaches as well as global efforts and strategies. The world’s approach needs to be guided by an economic model that eliminates or minimizes the amount of plastics in the waste stream. As long as most plastic materials are not made from a single polymer, then the idea of “recycling 100% of plastics” is so far an unrealistic solution. The development of biodegradable plastics is still far from being an effective solution because besides being expensive and having limitations in engineering applications when compared to petroleum-based ones, biodegradable plastics still require specific conditions for their biodegradation. Comprehensive studies on microplastic particles are needed, focusing mainly on the source of the particles, their distribution, transport, fate in different environments, and toxicological effects and mechanisms. Since plastic pollution is a global problem, its minimization will require an increased international cooperation platform and partnerships at a global level. While current technologies and strategies are not solving the environmental problem caused by waste plastic, the most effective solution would be to adopt the first two levels of the waste management hierarchy, which are “reduce” and “reuse”.
1. Introduction
Since the discovery, mass production, and commercialization of the first fully synthetic plastic in 1907 [1], plastic materials have brought numerous benefits to modern societies worldwide in more ways than one can imagine, having also provided innovative sustainable solutions for the various industrial segments. Plastics are regarded as one of the world’s greatest industrial innovations of the 21st century and they are an integral part of the daily life of human beings. They are gradually replacing traditional materials such as metals, ceramics, wood, concrete, glass, natural fibers, and paper in many applications. Plastics are present in various forms in means of transportation (e.g., planes, cars, ships, motorbikes, bicycles, etc.), in hospitals, homes, household utensils, furniture, computers, cellphones, clothes, electrical and electronic goods, as well as in the food supply chain (e.g., packaging) [2].
Given their important role in human life’s daily activities, plastic materials are the most widely produced and used when compared to other barrier materials. The global production of plastics has increased twenty-fold since the 1960s [3]. In 2022, for instance, the world registered a global plastic production of about 400.3 million t [4,5], and if this production trend continues, it is expected to double by 2035, and almost quadruple by 2050 [6,7]. The global explosion of plastic production and its massive use is driven by its remarkable combination of properties and characteristics. Its ease of processing (can be easily shaped into a wide variety of forms) and production, high strength-to-weight ratio, durability, light weight, chemical resistance, low permeability to liquids, high resistance to physical and chemical degradation, relatively low manufacturing cost, and odor free, are just some examples of such properties and characteristics [8].
Despite the recognized social benefits indicated above and its contribution to the growth of the world economy, the massive production of plastic and inappropriate disposal practices after its end of life are resulting in growing adverse effects on human health and the environment, including climate change, marine pollution, biodiversity, and chemical contamination [2], propelling these materials to the top of the international waste management agenda. Plastic pollution is one of the most pressing environmental and social challenges of the twenty-first century. In the last two decades, for example, it has become nearly impossible to go a single day without seeing or hearing negative news or a story about plastic materials, whether on television, radio, in print or electronic newspapers, or even on social media platforms that are available all over the world. Images of plastic materials floating in seas, oceans, lakes, and urban rivers; polluting beaches; flooding parks and gardens; blocking drainage ditches, gutters, and waterways; flooding landfills; polluting the land; frozen in polar ice; and harming wildlife are just some examples of more resounding pollution scenarios in the aforementioned media around the world [9,10].
The marine environment, therefore, appears to be the biggest destination for plastic waste. The United Nations Environment Programme (UNEP) has now recognized plastic materials as one of the most problematic pollutants affecting the oceans worldwide [11]. Some studies suggest that between 7 and 13 million metric t of plastic waste, which corresponds to about 3% of global plastic production, may be entering the oceans per year [12,13,14,15]. This amount, which accounts for over 80% of marine litter [13], is undoubtedly very large and is pointed out as being responsible for the death of 20–30% of marine life. If the global plastic production trend continues to grow in the current rhythm, the sea would have more plastics than fish and over 97% of the seabirds would have consumed them [4,16,17]. According to UNEP [18], at a global level, the damage and negative impacts to marine environments caused by plastic pollution are enormous, and this accounts for around USD 13 billion per year, which essentially includes losses incurred by fisheries and tourism due to plastic littering, as well as beach clean-up costs.
One of the major emerging concerns for the World Health Organization (WHO) regarding the plastic pollution issue is related to the possible negative effects on human health deriving from multiple exposures to plastic materials. Since most plastics are resistant to degradation, mainly the conventional petroleum-based ones, these materials can take half a century or a millennium to decompose, leaving behind adverse effects on ecosystems [12]. Thus, in the marine or other environments, plastic materials will break down into microplastics and occasionally nanoplastic particles [19]. Although still limited and somewhat inconclusive, preliminary findings of some studies have already pointed out microplastics and their associated contaminants, such as persistent organic pollutants, as potential sources of soil and freshwater contamination, including in tap and bottled water [6]. In the face of this stark reality, cries for help coming from environmental activists, the general public, politicians, governments, and civil society organizations to end plastic pollution have been heard all over the world. There is a global consensus that plastic pollution is a global problem and challenge, and thus, action must be taken urgently to protect the environment from further contamination.
To minimize the problem, some countries at a global level have been carrying out a series of actions, which include the banning of single-use plastics or changing petroleum-based plastics to alternative, safer, and more sustainable and environmentally friendly products such as biodegradable plastics. Improving waste collection systems to ensure that, at the end of their life, plastics are appropriately collected and safely reprocessed or disposed of is also part of these actions. However, due to uncertainties about the effectiveness of the solutions mentioned here, most of them have often been received with some skepticism by businessmen, governments, or civil society, leaving many questions regarding the suitable solutions to be taken globally to successfully deal with the growing problem of plastic pollution. The skepticism is even greater for developing countries where policies/strategies, legal instruments, and infrastructure for waste management such as recycling are scarce or non-existent. Therefore, this review aims to provide an overview of the plastic material lifecycle, highlighting the benefits brought by plastics to humanity as well as the associated negative impacts on human health, the environment, and the economy if their wastes are not properly managed. Several successful and unsuccessful stories and interventions that are currently being employed for plastic waste management in several countries are shared in the paper. Similarly, a critical discussion is provided on current advances in technologies to produce plastic materials that are more sustainable and environmentally friendly than petroleum-based ones, including current challenges for the collection, sorting, and reprocessing of plastic waste. The emphasis, therefore, is given to plastic recycling processes and bio- and bio-degradable plastic production, as these have by far been seen as the most promising approaches to the plastic pollution problem that society is currently grappling with. Finally, possible solutions for sustainable plastic waste management are proposed.
Challenges and opportunities for plastic waste management have been reviewed in several papers [1,7,8,12,13,20,21,22,23,24,25,26,27,28]. However, most of them have focused on implementing the circular economy concept instead of the linear one. Other actions include reduction in material use through downgauging, product reuse, design for end-of-life recyclability, and revised risk assessment approaches; energy recovery as fuel; formulation of systems for the collection, sorting, and reprocessing of recyclable plastics; formulation of laws, policies, and regulations for plastic products; consumer information and education regarding the proper use of plastics; the role of international co-operation and trade; effective and innovative investments and incentive schemes; innovative solutions such as the introduction of biodegradable polymers and other alternatives, especially for packaging. The present review, in addition to reinforcing with new ideas a large part of the solutions highlighted by the articles mentioned above, has the merit of proposing concrete technological solutions that aim, for example, to increase current levels of recycling through advanced polymer processes such as co-injection molding and nanotechnology; improve the properties of biodegradable plastics using nanotechnology; convert recycled plastic into new products such as nanofoam, carbon nanotubes, synthetic fuels, and chemicals that can serve as raw material for other industries.
2. Methods
For the compilation and discussion of the relevant ideas that embody this article, several source materials and databases related to the topic were consulted. This included policy documents, government documents, reports, web pages, electronic books, electronic articles, and other related relevant documents. All materials related to the production of plastic materials, their consumption, challenges associated with plastic waste, health issues connected to plastic waste, plastic recycling, benefits of proper plastic waste management (socioeconomic and environmental), and mitigation measures were explored. The relevant documents considered in the present review were from 1947 to 2024, showing a rich balance between the fundamentals and the actuality on the topic. From this, a total of 415 documents were consulted and meticulously analyzed, of which only 219 were selected as support material to compose this review. From this analysis, discussion around the main challenges facing the world in terms of plastic waste management was provided. The emerging solutions and current practices for plastic waste management, including advances in technologies to produce alternative materials that are more sustainable and environmentally friendly than petroleum-based ones, are also discussed. Finally, possible solutions for sustainable plastic waste management are proposed.
3. Generalities about Plastics
3.1. Plastics and Polymers: What Is the Primary Difference?
Plastics are “polymeric materials that may contain other substances to improve performance and/or reduce costs”, according to the International Union of Pure and Applied Chemistry (IUPAC) [29]. Polymers are defined as long-chain chemical compounds with high molecular weights composed of a large number of smaller repeating units (monomers), which can be identical or of different types, and are joined together in a long chain by consecutive covalent bonds formed by various addition or condensation reactions [30]. Polymers are substances made from organic, synthetic, or natural macromolecules based on carbon, hydrogen, and other non-metallic elements like oxygen, nitrogen, and silicon. Synthetic polymers include adhesives, lubricants, paints, films, fibers, plastics, and rubber, whereas natural polymers include leather, silk, hemp, horn, cotton, wool, cellulose, wood, and natural rubber [31]. The term “polymer” is derived from the Greek prefix “poly”, which means “many”, and the suffix “-mer”, which means “parts”. Young and Lovell [32] define a polymer as a substance composed of molecules which have long sequences of one or more species of atoms or groups of atoms linked to each other by primary, usually covalent, bonds. The emphasis upon “substance” in this definition is to highlight that although the words polymer and macromolecule are used interchangeably, the latter strictly defines the molecules of which the former is composed. In addition to containing polymers, plastics may include additives such as colorants, antioxidants, stabilizers, and so forth. Plastics, often known as polymers due to their long-chained nature, are completely manmade materials that do not occur naturally. Some of the most well-known forms of plastic are polyethylene terephthalate (PET), vinyl, polyvinyl chloride (PVC), polypropylene (PP), and polycarbonates such as bisphenol A (BPA). This implies that all plastics are polymers; however, not all polymers are plastics. A plastic is thus a distinct sort of polymer.
3.2. Classification of Plastics According to Their Properties and Sources
The two primary types of plastic materials are thermoplastics and thermosetting plastics. Thermoplastics consist of tangled thread-like chain molecules. When heated to their melting point, thermoplastics soften into a liquid state, allowing them to be molded or reshaped repeatedly to fit a desired mold before hardening again as they cool. This process is reversible, which means that they may be warmed, remolded, and recycled repeatedly [8,33]. Polyethylene (PE), polyamide (PA), polypropylene (PP), polycarbonate (PC), acrylonitrile butadiene styrene (ABS), ethylene vinyl alcohol (EVOH), styrene-acrylonitrile resin (SAN), polyether ether ketone (PEEK), polyoxymethylene (POM), expanded polystyrene (EPS), polyarylsulfone (PSU), polystyrene (PS), thermoplastic elastomers (TPE), polyethylene terephthalate (PET), polymethylmethacrylate (PMMA), polyvinylchloride (PVC), fluoropolymers, and polybutylene terephthalate (PBT) are just a few examples of plastics that fall into this category [3]. Thermosetting polymers, on the other hand, are a type of plastic that changes chemically when heated, forming a three-dimensional network with a high degree of crosslinking structure that severely limits chain mobility. They are stiff materials with all chains connected by covalent connections in a network; hence, thermosets cannot be reprocessed [30,31,32,33,34,35]. When molten, thermosetting polymers can be molded into the forms into which they were deposited before cooling, but they then harden permanently. If heated again, thermosets become brittle or disintegrate [8]. Polyurethane (PU), epoxy resins, vinyl esters, silicone, melamine resin, unsaturated polyesters, phenolic resins, urea-formaldehyde resins, acrylic resin, and phenol-formaldehyde resins are the most prevalent examples of this type of plastic [3].
Plastic materials may be divided into two categories based on their raw material origin: fossil-derived plastics and bio-derived plastics. Fossil-derived polymers are made from fossil fuels such as crude oil or petroleum hydrocarbons, gas, and, on occasion, coal. However, the majority of plastics in this category are manufactured from petroleum hydrocarbons, and this includes PE, PP, polyester, PVC, PS, nylon, acrylic, polytetrafluoroethylene (PTFE), and epoxy [36]. Bioplastics, on the other hand, are a type of plastic made from renewable resources such as sugar cane, maize starch, vegetable fats and oils, cellulose, straw, woodchips, recycled food waste, and so on, rather than petroleum [37,38,39,40,41,42,43,44,45,46]. Important examples of polymers in this family include polyamide-11, polyamide-12, dimer fatty acid polyamide, polylactic acid, and polyaniline. It is vital to highlight that bioplastics and biodegradable plastics are not interchangeable. Biodegradable plastics, also known as compostable or edible plastics, are materials whose physical and chemical properties deteriorate and completely degrade when exposed to microorganisms through carbon dioxide (aerobic) processes, methane (anaerobic processes), or water (aerobic and anaerobic processes). The word “biodegradability” of a plastic refers to the ability of bacteria and fungi to metabolize its chemical structure and convert it into shorter polymer segments. Bioplastics, on the other hand, can be biodegradable (e.g., polylactic acid) or non-degradable (e.g., biopolyethylene); however, not all biodegradable plastics are bio-based. Polycaprolactone (PCL) and poly (butylene succinate-PBS) are two excellent examples of biodegradable polymers that are petroleum-based [46,47].
4. World Plastic Production
Plastic materials have been transforming modern societies and the global economy since Bakelite, the first synthetic plastic, that was commercially produced in 1907. Plastics are an integral and important part of the daily life of human beings. Today, it is almost impossible to live without plastic. Owing to the combination of good characteristics and properties such as low production cost, versatility, light weight, affordability, corrosion resistance, durability, and high strength-to-weight ratio, plastic materials are increasingly being demanded in numerous uses and industrial applications such as the packaging, construction, transportation, healthcare, and electronics sectors [7,28,48]. As a result of this demand, in recent decades, the global production and consumption of plastic materials have witnessed an exponential increase never seen before.
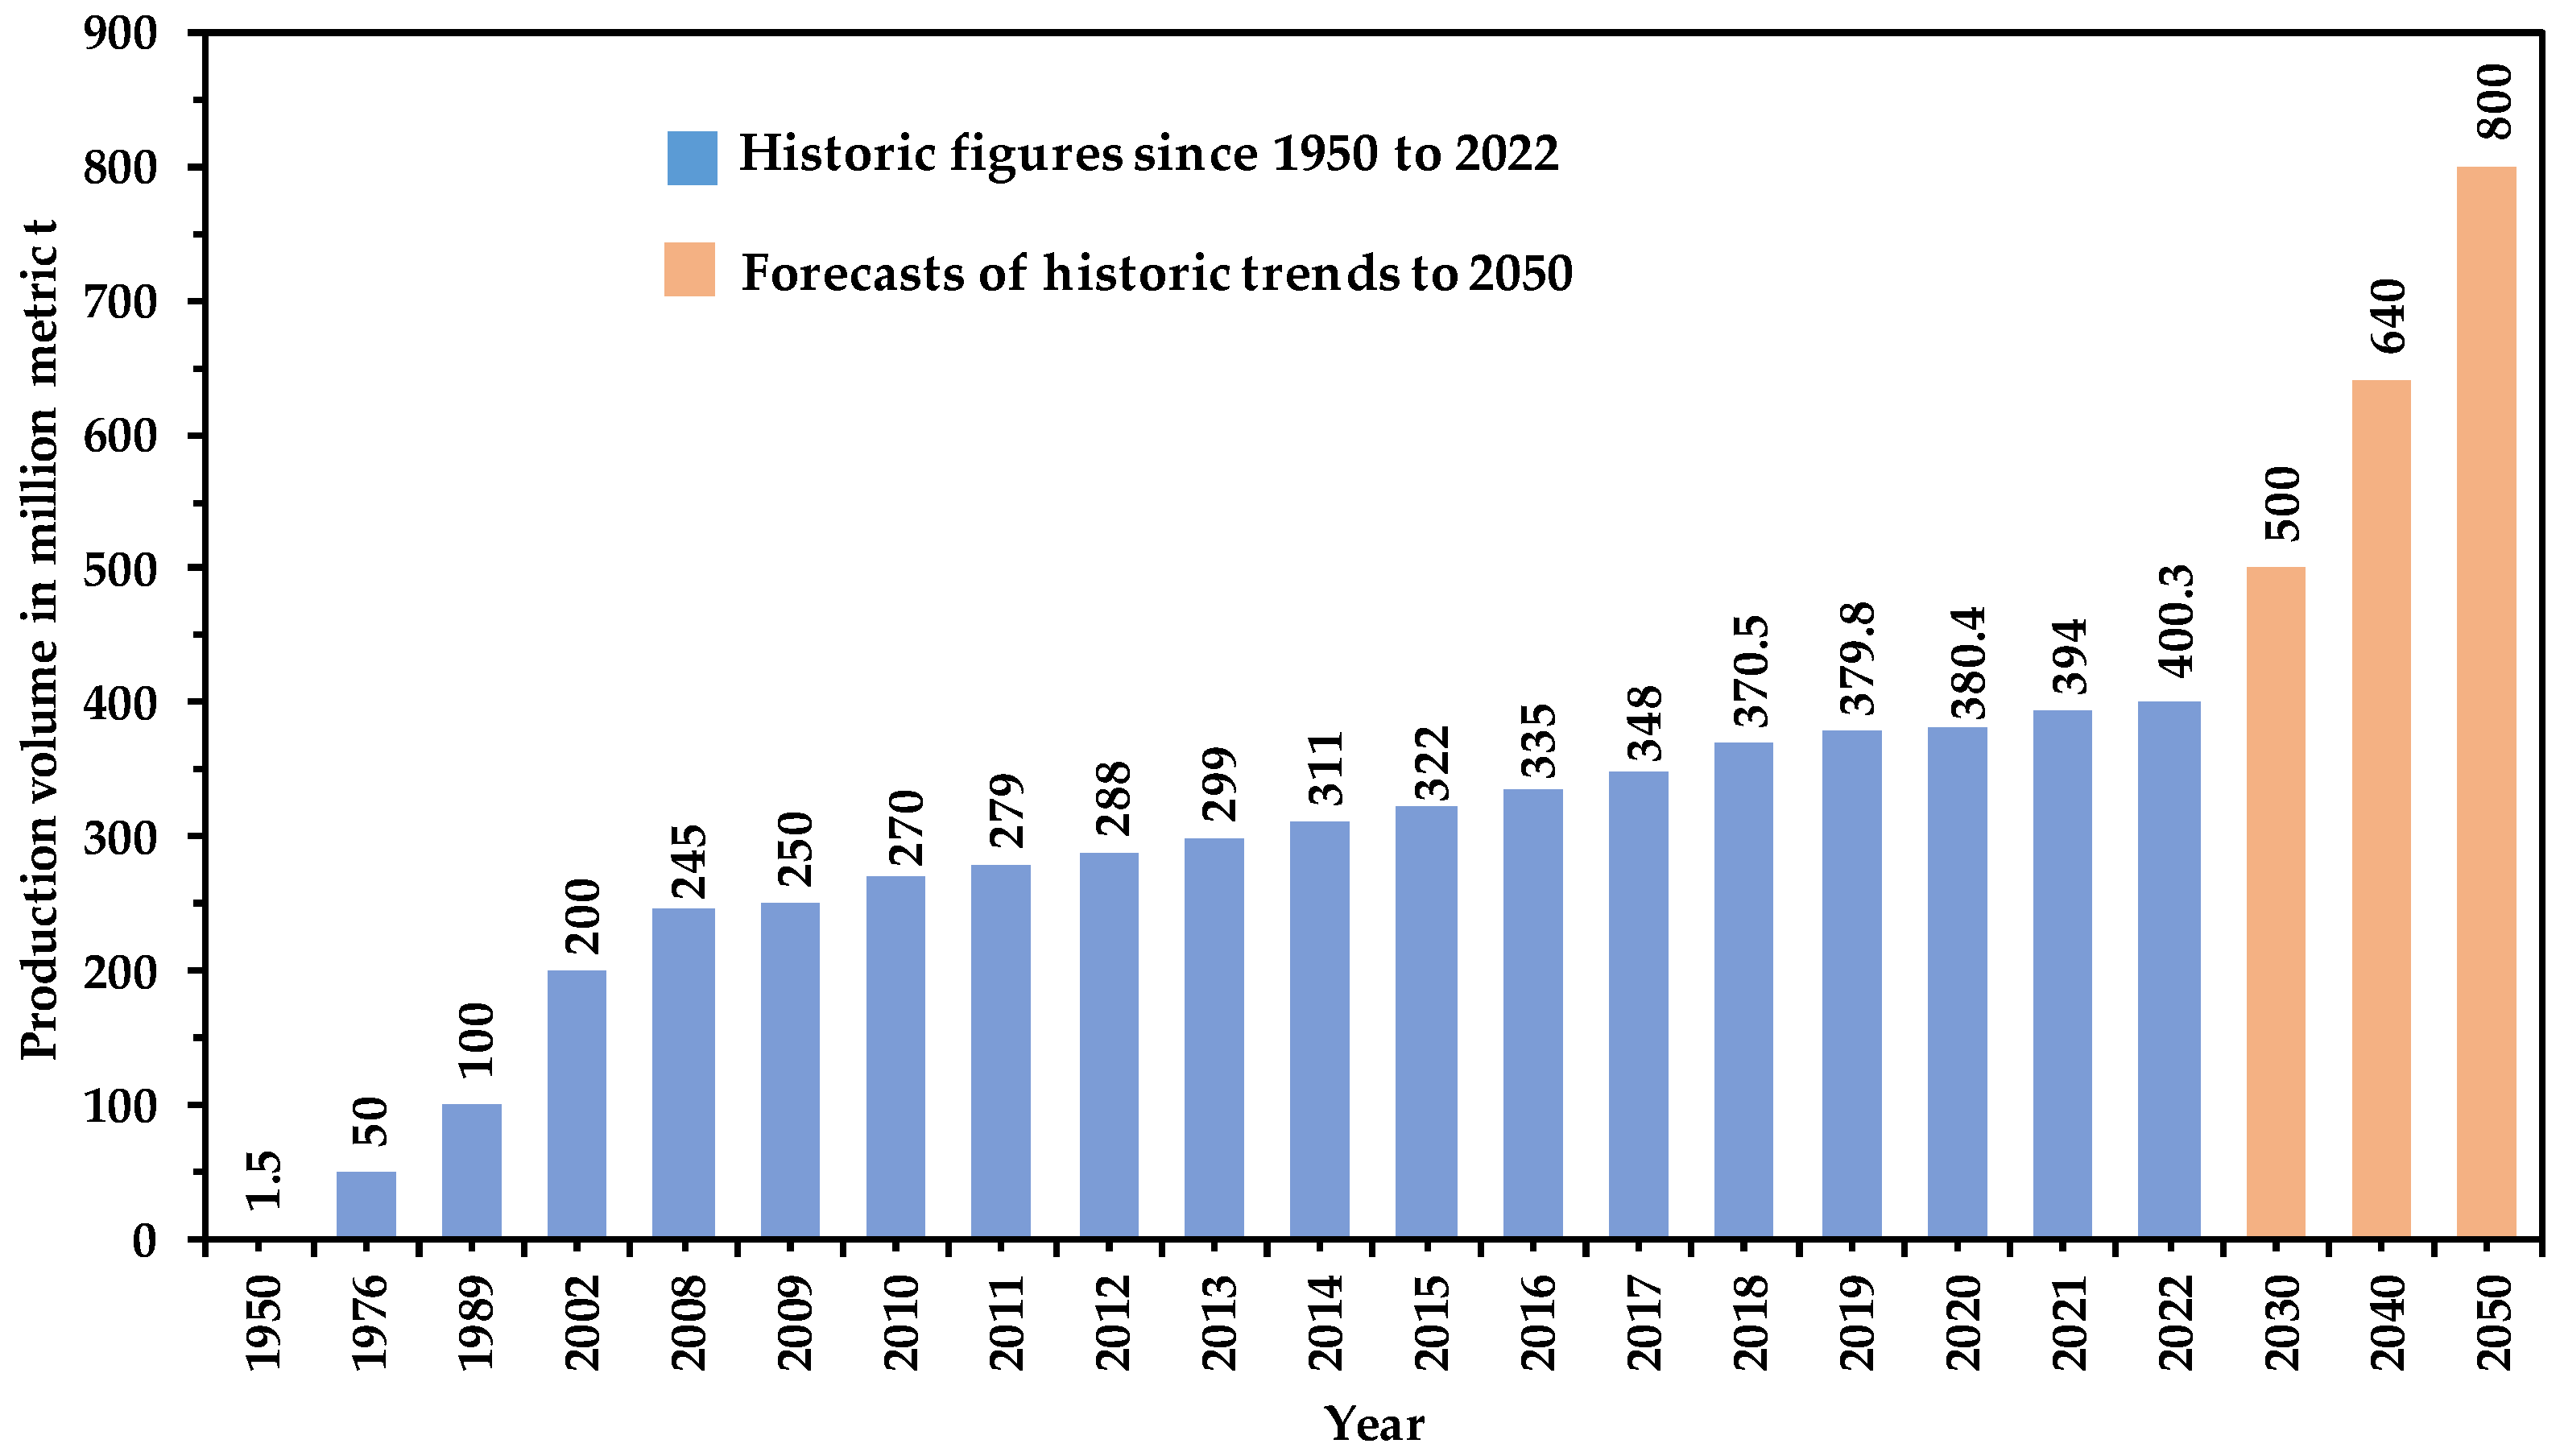
Figure 1 shows the cumulative plastic production (in million metric t) from 1950 to 2022. The global production of plastics has increased twentyfold since the 1960s. In 2022, for instance, the amount of plastics produced worldwide reached 400.3 million metric t [3,49]. It should be noted that about 40% of the amount of plastic materials produced and used globally are single-use plastics [2]. The drop in oil price, especially after World War II, may justify the significant increase in global production when compared to the other materials [1].
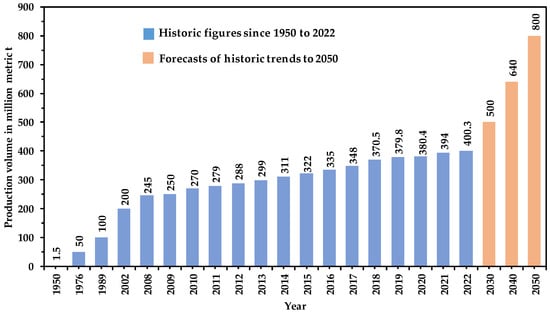
Figure 1.
Cumulative plastic production in million metric t. Source: authors’ own elaboration based on data obtained from references [4,7,50].
Experts indicate that plastic production will continue to increase and if the actual trend continues, the cumulative production worldwide could reach 500, 640, and 800 million metric t, respectively, in 2030, 2040, and 2050, as show in Figure 1 [6,7]. For the first time in the plastic industry’s history, the production in 2020 recorded a minimum growth of around 0.6 million metric t, a resounding growth in the order of 0.16% compared to the production volumes recorded in 2019. The rising energy costs and restrictions imposed by the COVID-19 pandemic that plagued the world since December 2019 are pointed out by experts as being the main factors behind this situation. Despite the timing of the COVID-19 pandemic, in 2021, the production registered an increase, having reached 394 million metric t, the equivalent of almost 3.6% when compared to the year 2020. This increase may be related to the huge demand for plastic-based products and devices during the COVID-19 pandemic outbreak, such as life-saving medical devices, face masks, plastic screens, food and product packaging in supermarkets and restaurants, etc. With the reduction in the adverse effects of the COVID-19 pandemic, an increase in production rates was expected in 2022. However, it was all an illusion, as production dropped by almost half when compared to 2021 production, as shown in Figure 1. The supply chain issues, as a result of the ongoing war in Ukraine, which started in February 2022, appear to have had a direct impact on the production of plastics.
4.1. Plastic Production by Regions of the World
In the past, plastics were mostly produced in Europe and the United States (North American Free Trade Agreement—NAFTA). However, the scenario has now shifted to the Asian continent. In 2018, for instance, Asia produced the equivalent of 51%, i.e., more than half of global production, with China leading the production with 30%, while the rest of Asia, including Japan, produced 21%. In the same year, Europe and NAFTA were on a similar level, each with a production of around 17% and 18%, respectively. The remaining portion belonged to the Commonwealth of Independent States (CIS), Latin America, the Middle East, and Africa, with 3%, 4%, and 7%, respectively [3].
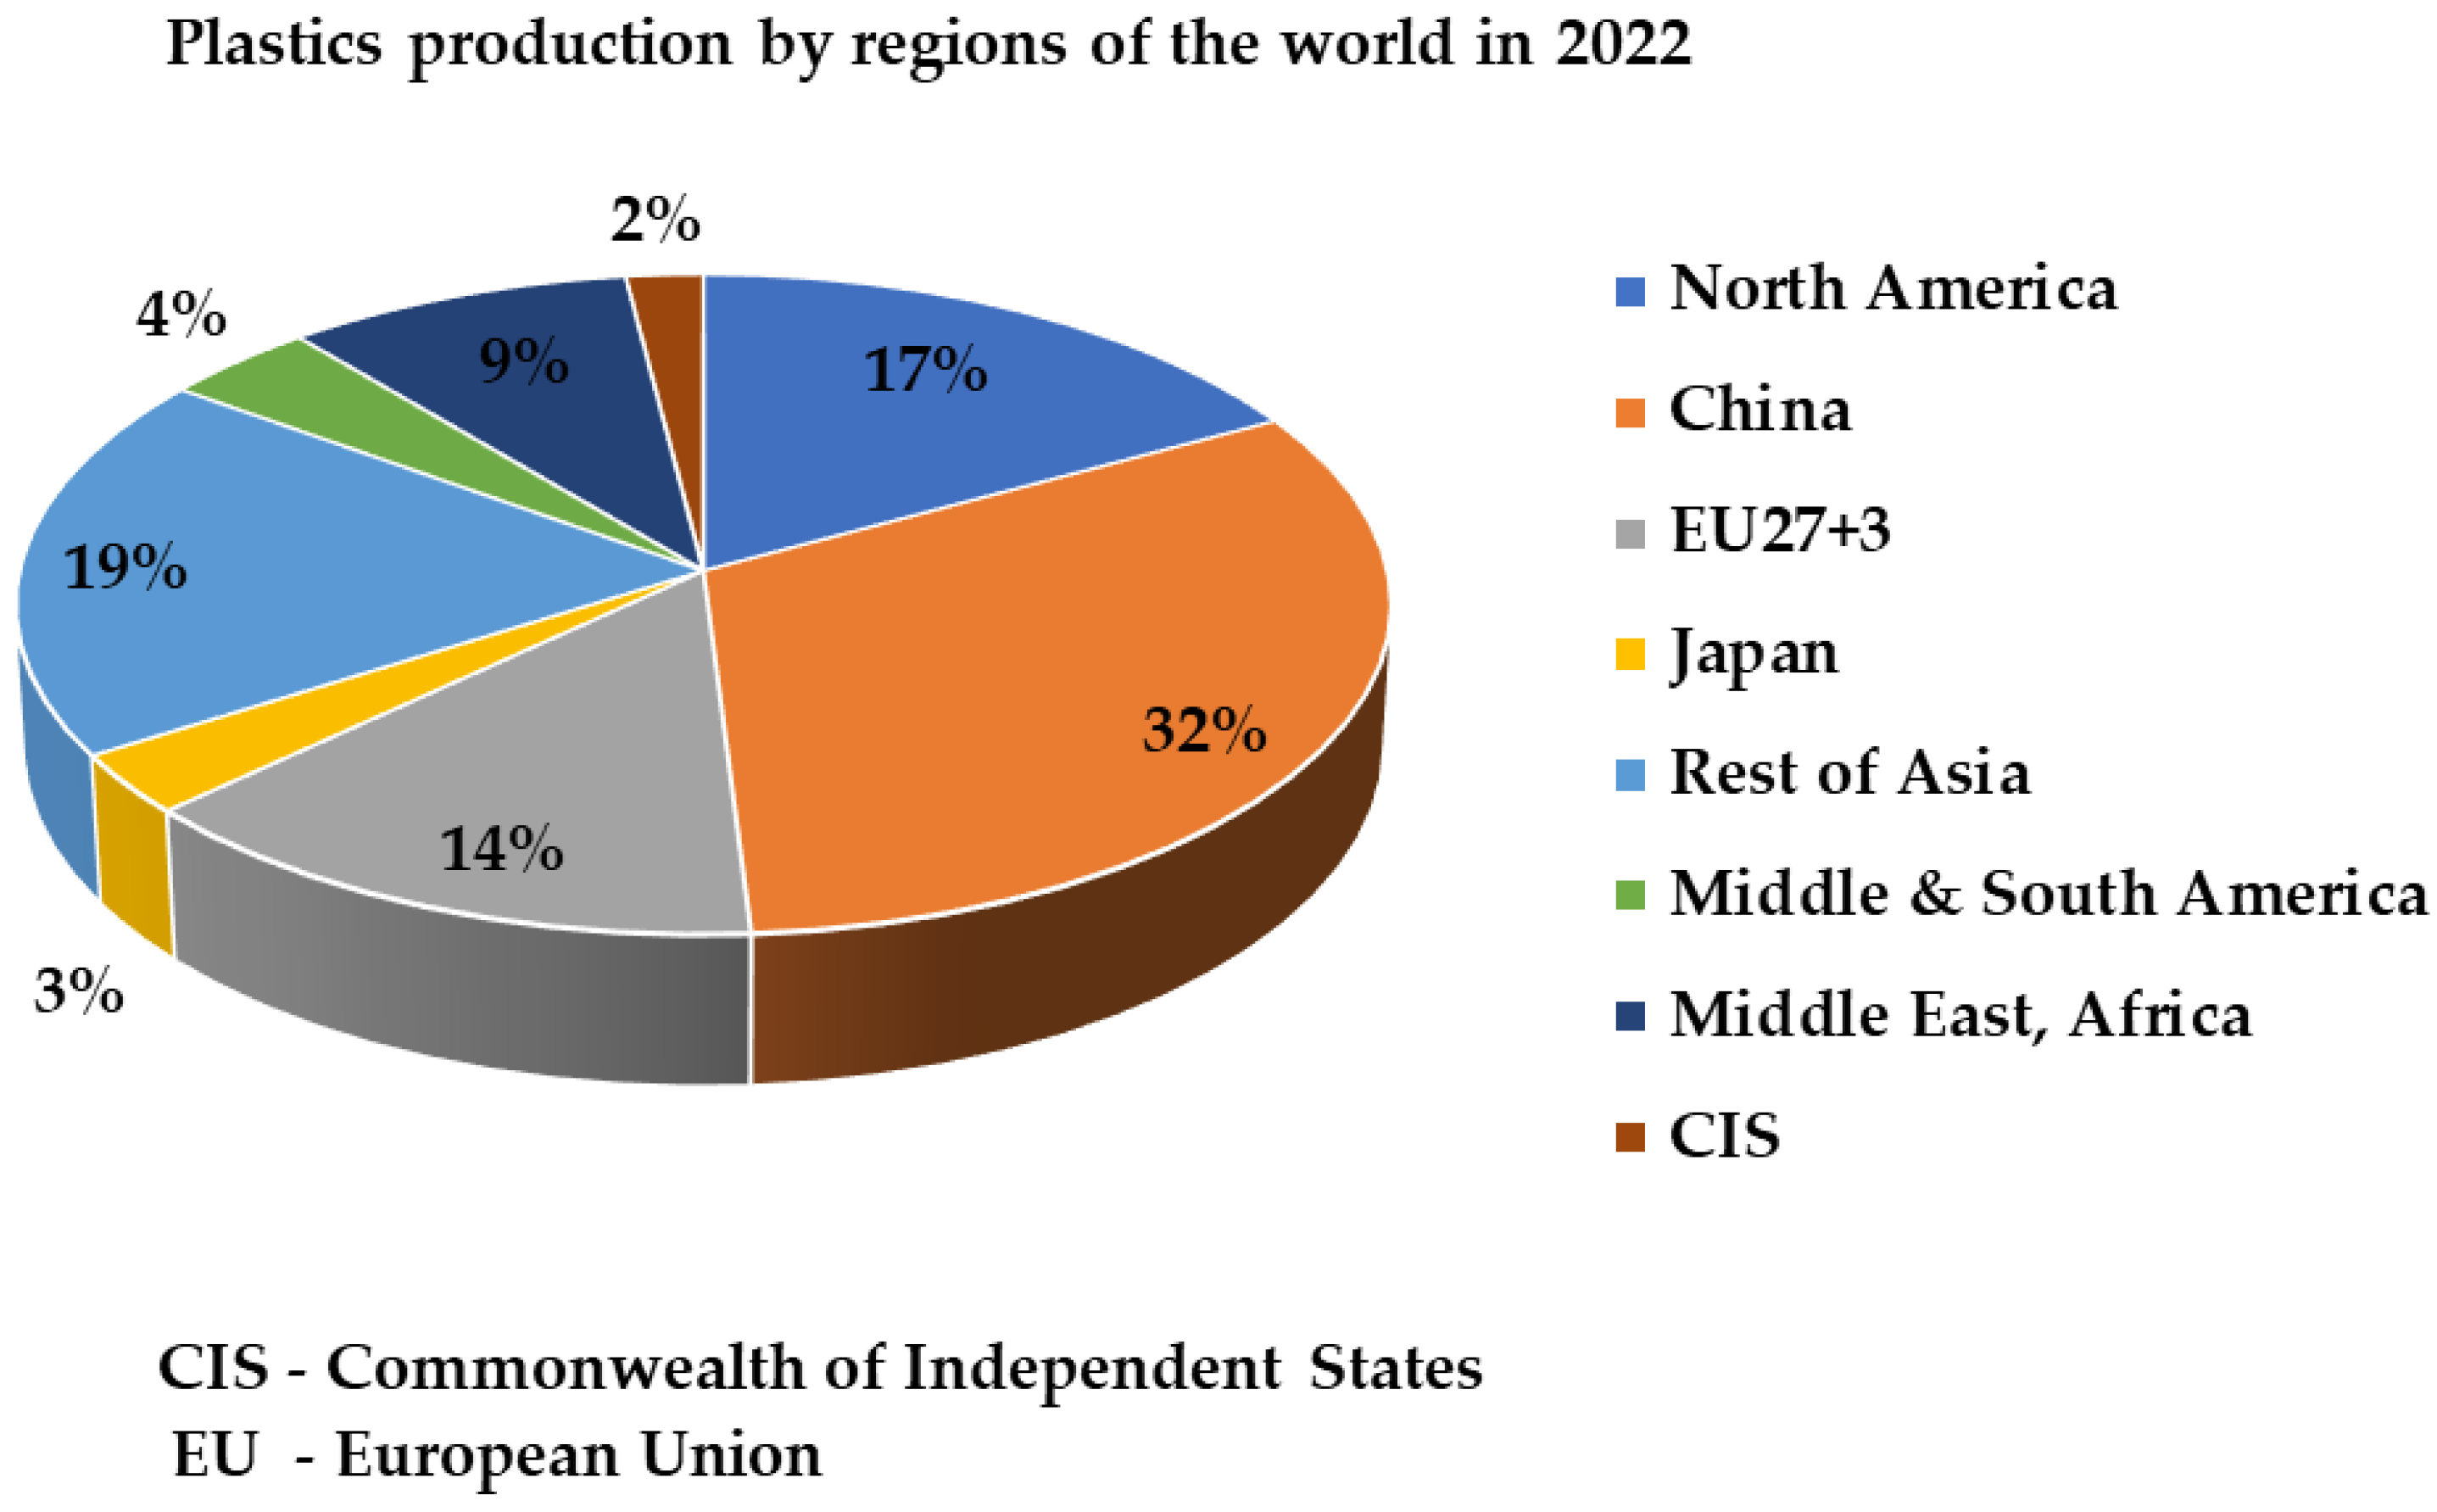
Figure 2 shows the global plastic production by regions of the world in 2022. As can be seen, the trend continued. The Asian continent produced the equivalent of 54%, an increase in the order of 3% compared to 2018. China once again led production, having alone reached 32%, 2% more than in 2018, while the rest of Asia, including Japan, produced 22%. EU and North America recorded reductions in production, each with 14% and 17%, reductions of around 3% and 1%, respectively, compared to 2018. The remaining production belonged to the Commonwealth of Independent States (CIS), Middle and South America, the Middle East, and Africa, with 2%, 4%, and 9%, respectively [50].
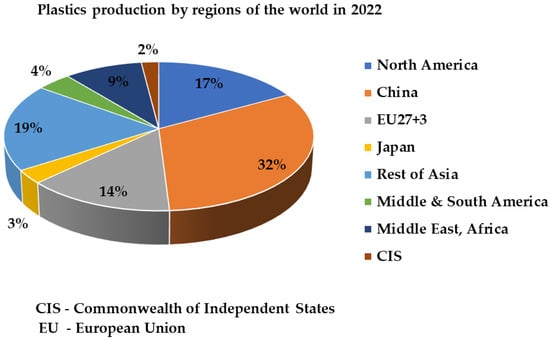
Figure 2.
Global plastic production by regions of the world in 2022. The data reported here includes fossil-based, recycled (mechanically and chemically), bio-based, and bio-attributed plastics. Source: authors’ own elaboration based on data obtained from references [50].
The key plastic companies that collectively hold the largest market share include [51] BASF SE, Ludwigshafen (Germany), SABIC, Riyadh (Saudi Arabia), Dow, Inc., Midland, MI (USA), DuPont, Wilmington, DE (USA), Evonik Industries AG, Essen, North Rhine-Westphalia (Germany), Sumitomo Chemical Co., Ltd., Tokyo (Japan), Arkema, Colombes (France), Celanese Corporation, Irving, TX (USA), Eastman Chemical Company, Kingsport, TN (USA), Chevron Phillips Chemical Co., LLC, The Woodlands, TX (USA), Lotte Chemical Corporation, Seoul (Republic of Korea), Exxon Mobil Corporation, Spring, TX (USA), Formosa Plastics Corporation, Livingston, NJ (USA), Covestro AG, Leverkusen (Germany), Toray Industries, Inc., Tokyo (Japan), Mitsui & Co. Plastics Ltd., Tokyo (Japan), Teijin Limited, Tokyo (Japan), INEOS Group, London (UK), Eni S.p.A., Rome (Italy), LG Chem, Seoul (Republic of Korea), LANXESS, Cologne (Germany), CHIMEI, Tainan (Taiwan), Huntsman International LLC, The Woodlands, TX (USA), Chevron Phillips Chemical Co., LLC, The Woodlands, TX (USA), LyondellBasell Industries Holdings B.V., Houston, TX (USA) and London (UK) and RTP Company, Winona, MN (USA). As can be seen, USA companies dominate the list.
4.2. Global Plastic Market Size
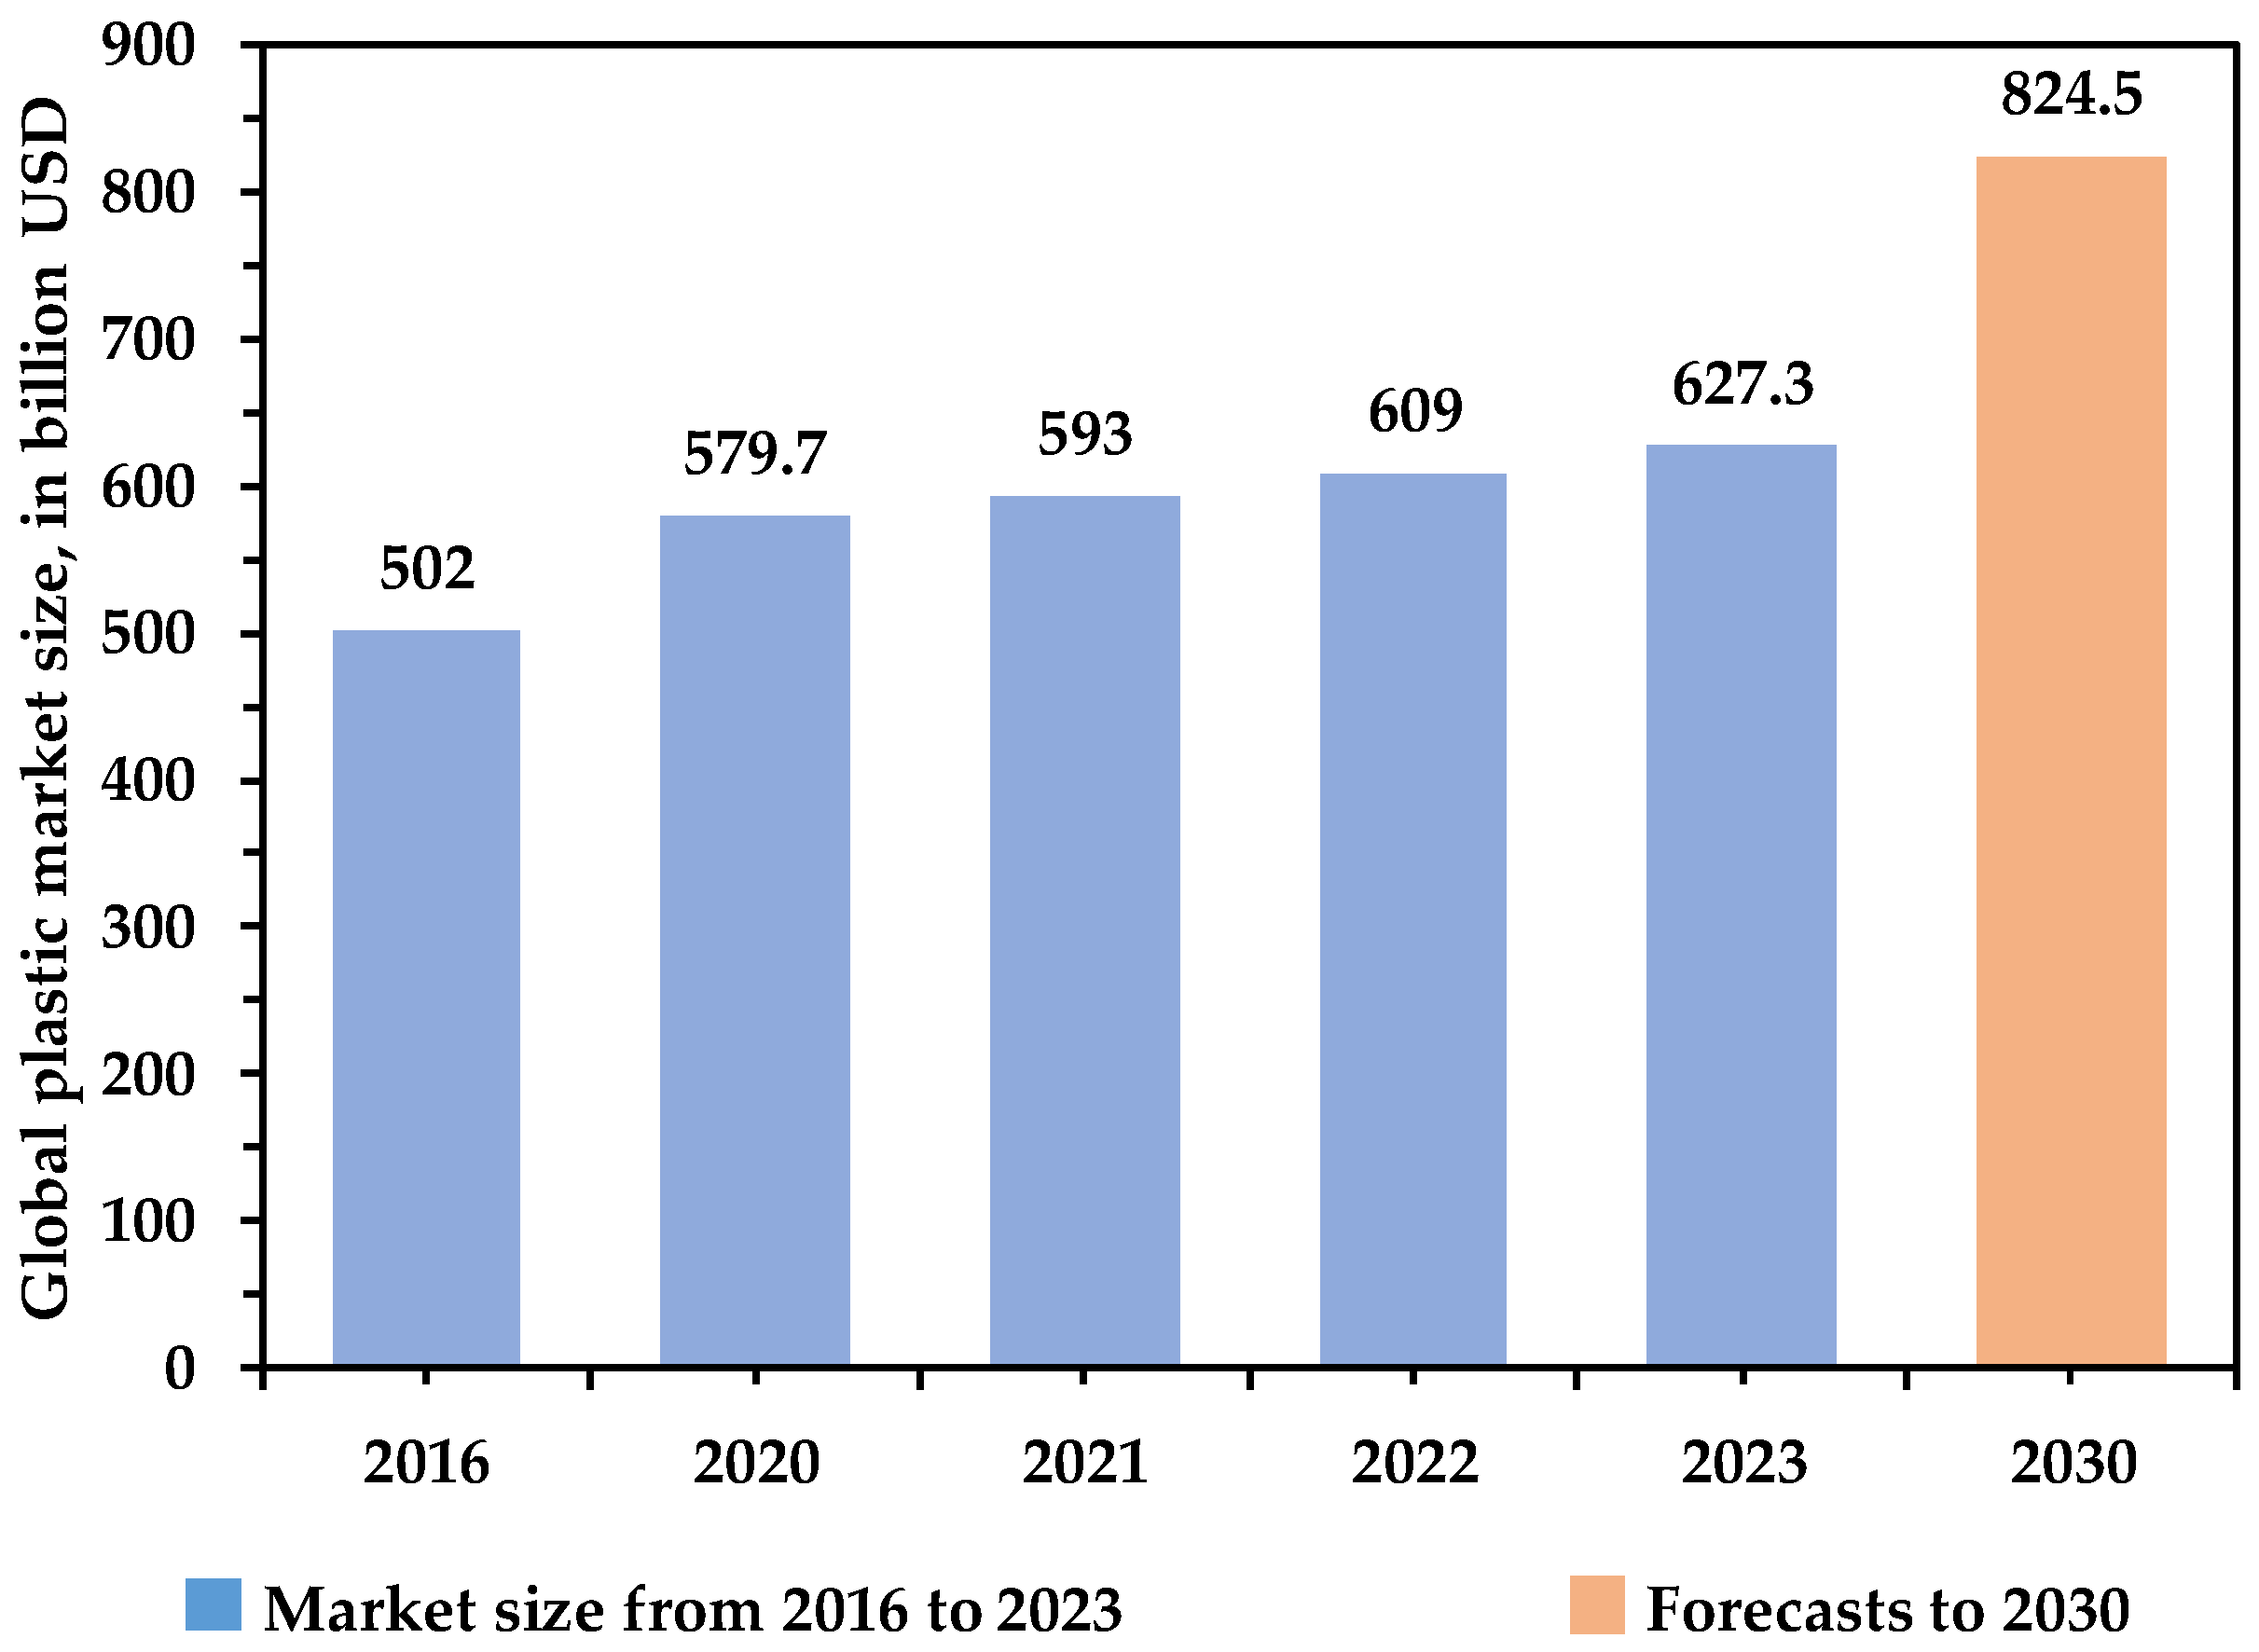
Figure 3 shows the global plastic market size in the period between 2016 and 2023.
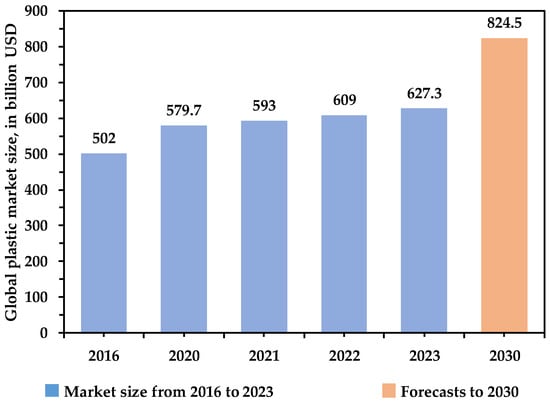
Figure 3.
Global plastic market size (in billion USD), taking into account a regional context, covering regions such as North America, Europe, East Asia (China), Asia Pacific excluding China, Caribbean, Central and South America, Middle East and Africa (blue bars indicate the historic figures in 2016 and 2023; orange bars indicate the forecasts of historic trends to 2030). Source: authors’ own elaboration based on data obtained from reference [4,51].
The global plastic market size increased from approximately USD 502 billion in 2016 to USD 579.7 billion in 2020, representing a growth of about 15%. From 2020 to 2022, the market registered a slowdown, as growth was no more than 2%. The impact of COVID-19 and the ongoing war in Ukraine may also have negatively affected the market. In the post-COVID-19 period, the market increased sharply, having recorded a growth of around 3% in 2023 when compared to 2022. The figure is expected to increase to a value more than USD 824 billion by 2030, at a compound annual growth rate (CAGR) of 4.0% from 2023. In the regional context, similar to global plastic production, the Asian continent dominated the plastic market, having accounted for over 45.2% share of the global revenue in 2022, leaving behind regions such as North America, Europe, Caribbean, Central and South America, Middle East and Africa [4,51].
In terms of end-use segment, packaging, construction, consumer goods, automotive, electrical and electronics, utility, agriculture, medical devices, and furniture and bedding are the segments with the most market demand in 2022 compared to other segments. Meanwhile, the packaging end-use segment held the largest market share, having accounted for more than 36.3% in terms of revenue, while polyethylene (high-density polyethylene (HDPE), low-density polyethylene (LDPE), and linear low-density polyethylene (LLDPE)) was the most sought-after polymer, having recorded a market share of more than 25.3%. The large proportion of the packaging sector in the global plastics market may explain the greater demand for polyethylene. Polyethylene is the most used polymer in the sector for the production, for example, of containers and bottles, plastic bags, plastic films, geomembranes, etc. [51].
5. Plastic Waste Generation Profile
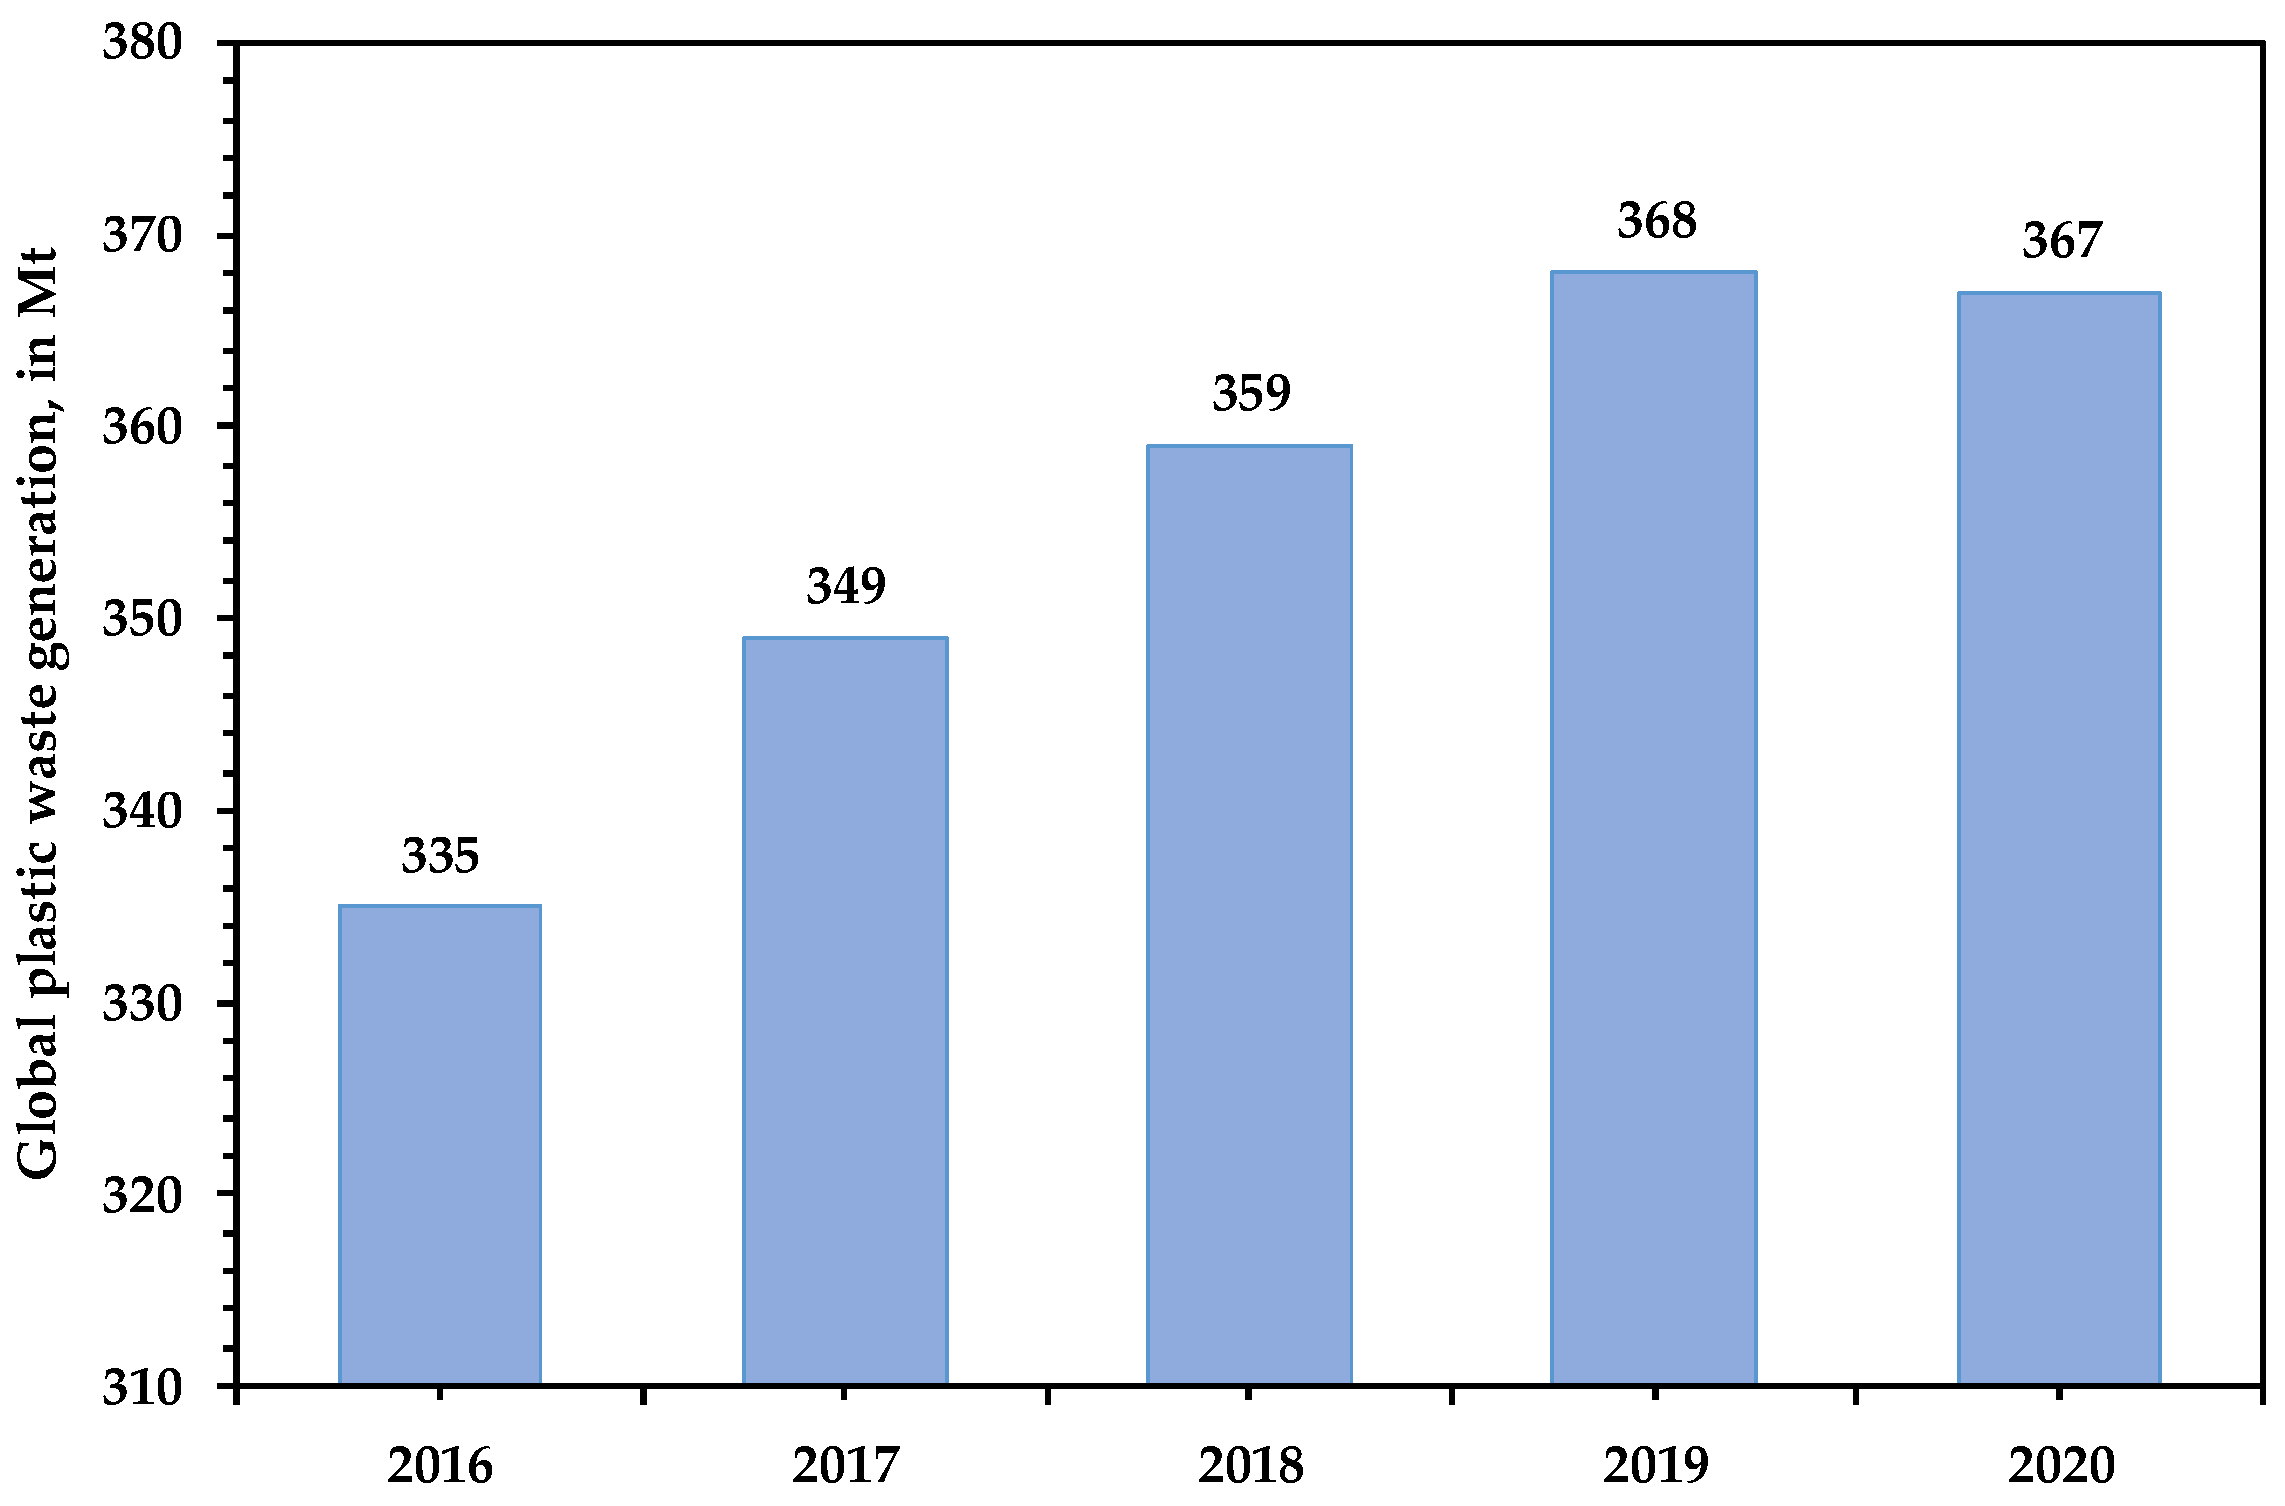
With the growth of the global population and that of urban settlements following the same trend and aiming for high living standards, the amount of plastic waste generated also increases correspondingly. In 2016, for instance, the world generated around 335 million metric t of plastic waste. In 2019, the generation of plastic waste registered an increase of around 10%, reaching 368 million metric to, as shown in Figure 4 [52,53]. Experts indicate that if the current trend continues, by 2050, the generation of plastic waste will double when compared to 2016 [6]. By comparison, the amount of plastic waste generated is practically the same as global production.
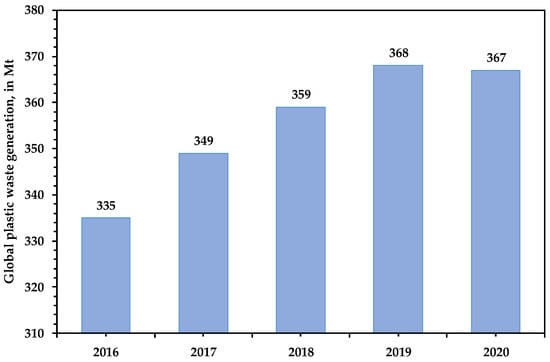
Figure 4.
Global plastic waste generation (in million metric t). Source: authors’ own elaboration based on data obtained from reference [52].
The slowdown in economic activity due to the outbreak of the COVID-19 pandemic caused the demand for plastic materials to drop, a situation that also contributed to the slight reduction in global plastic waste generation, reaching 367 million metric tons in 2020. However, food takeaway packaging and plastic medical equipment such as disposable syringes, gloves, protective gowns, facemasks, plastic sampling swaps for wide-scale COVID-19 testing, plastic screens, etc., have increased littering [52,53].
In the regional context, previous research points to the Asian continent as being the one that contributes the most to plastic waste worldwide. However, coastal countries are the most problematic, with China, India, Japan, Philippines, Indonesia, and Vietnam being the critical countries [54].
5.1. Top 20 Countries That Produced the Most Plastic Waste and with the Most Plastic Waste per Capita
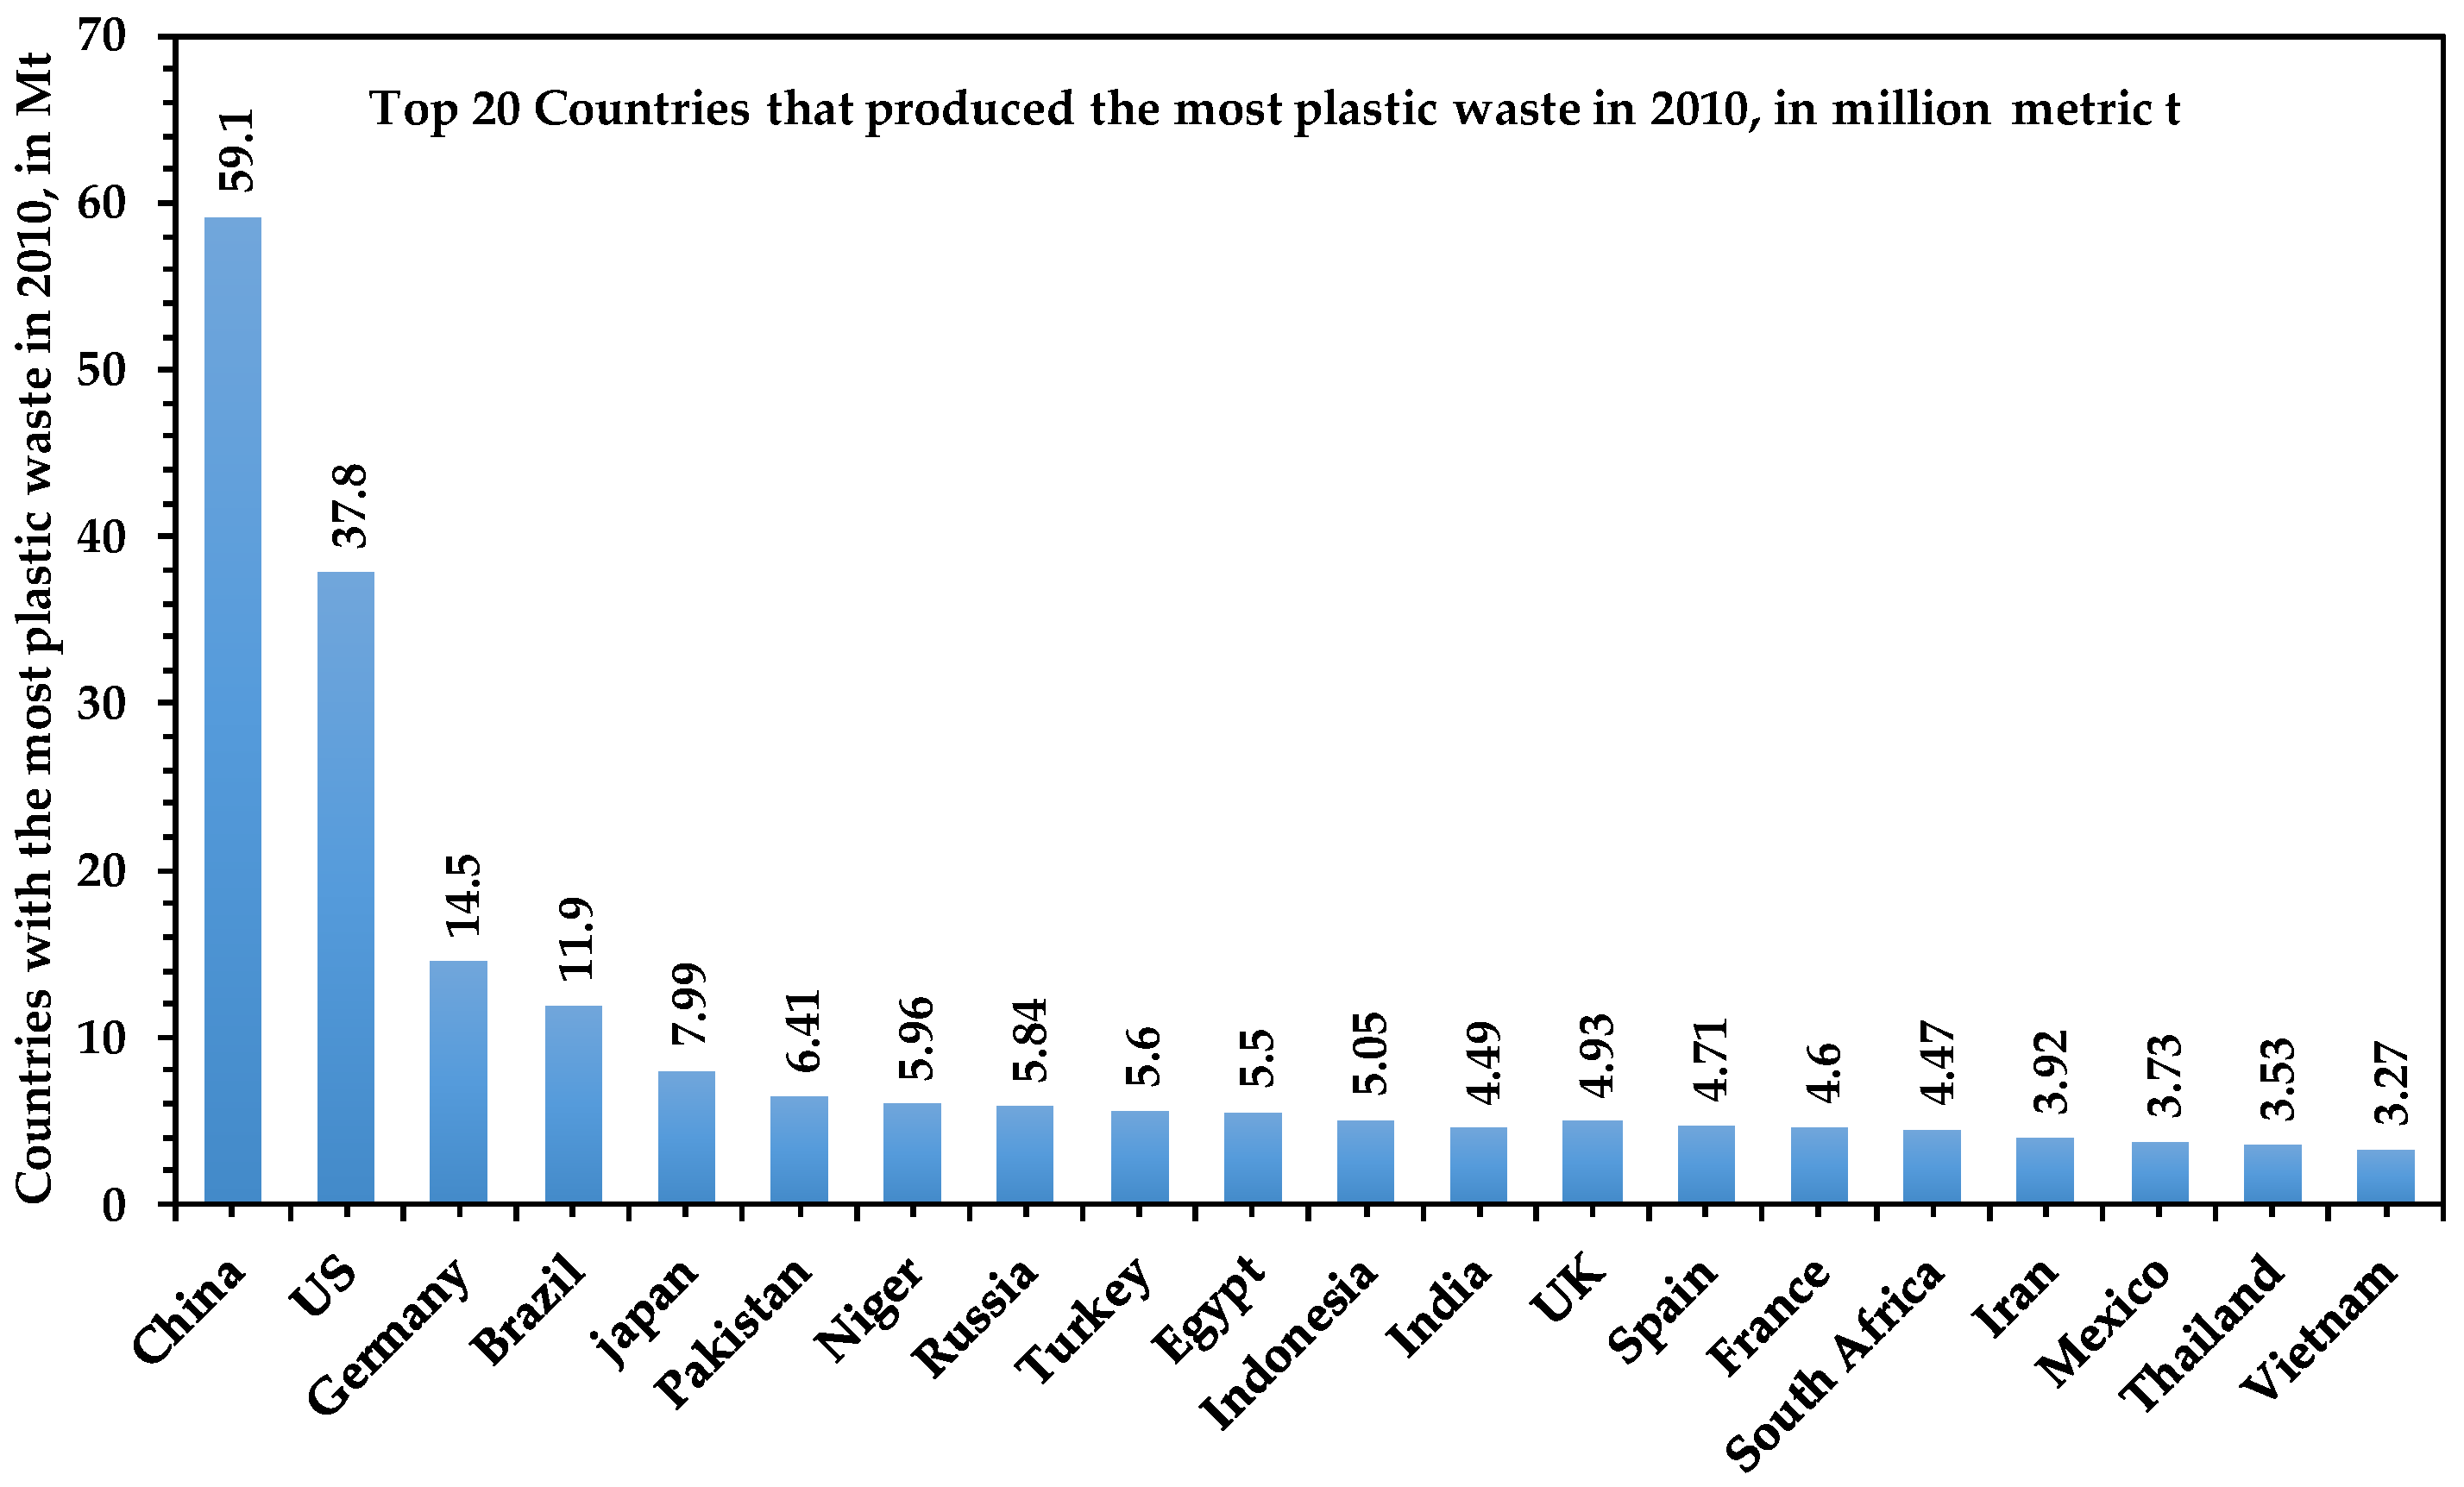
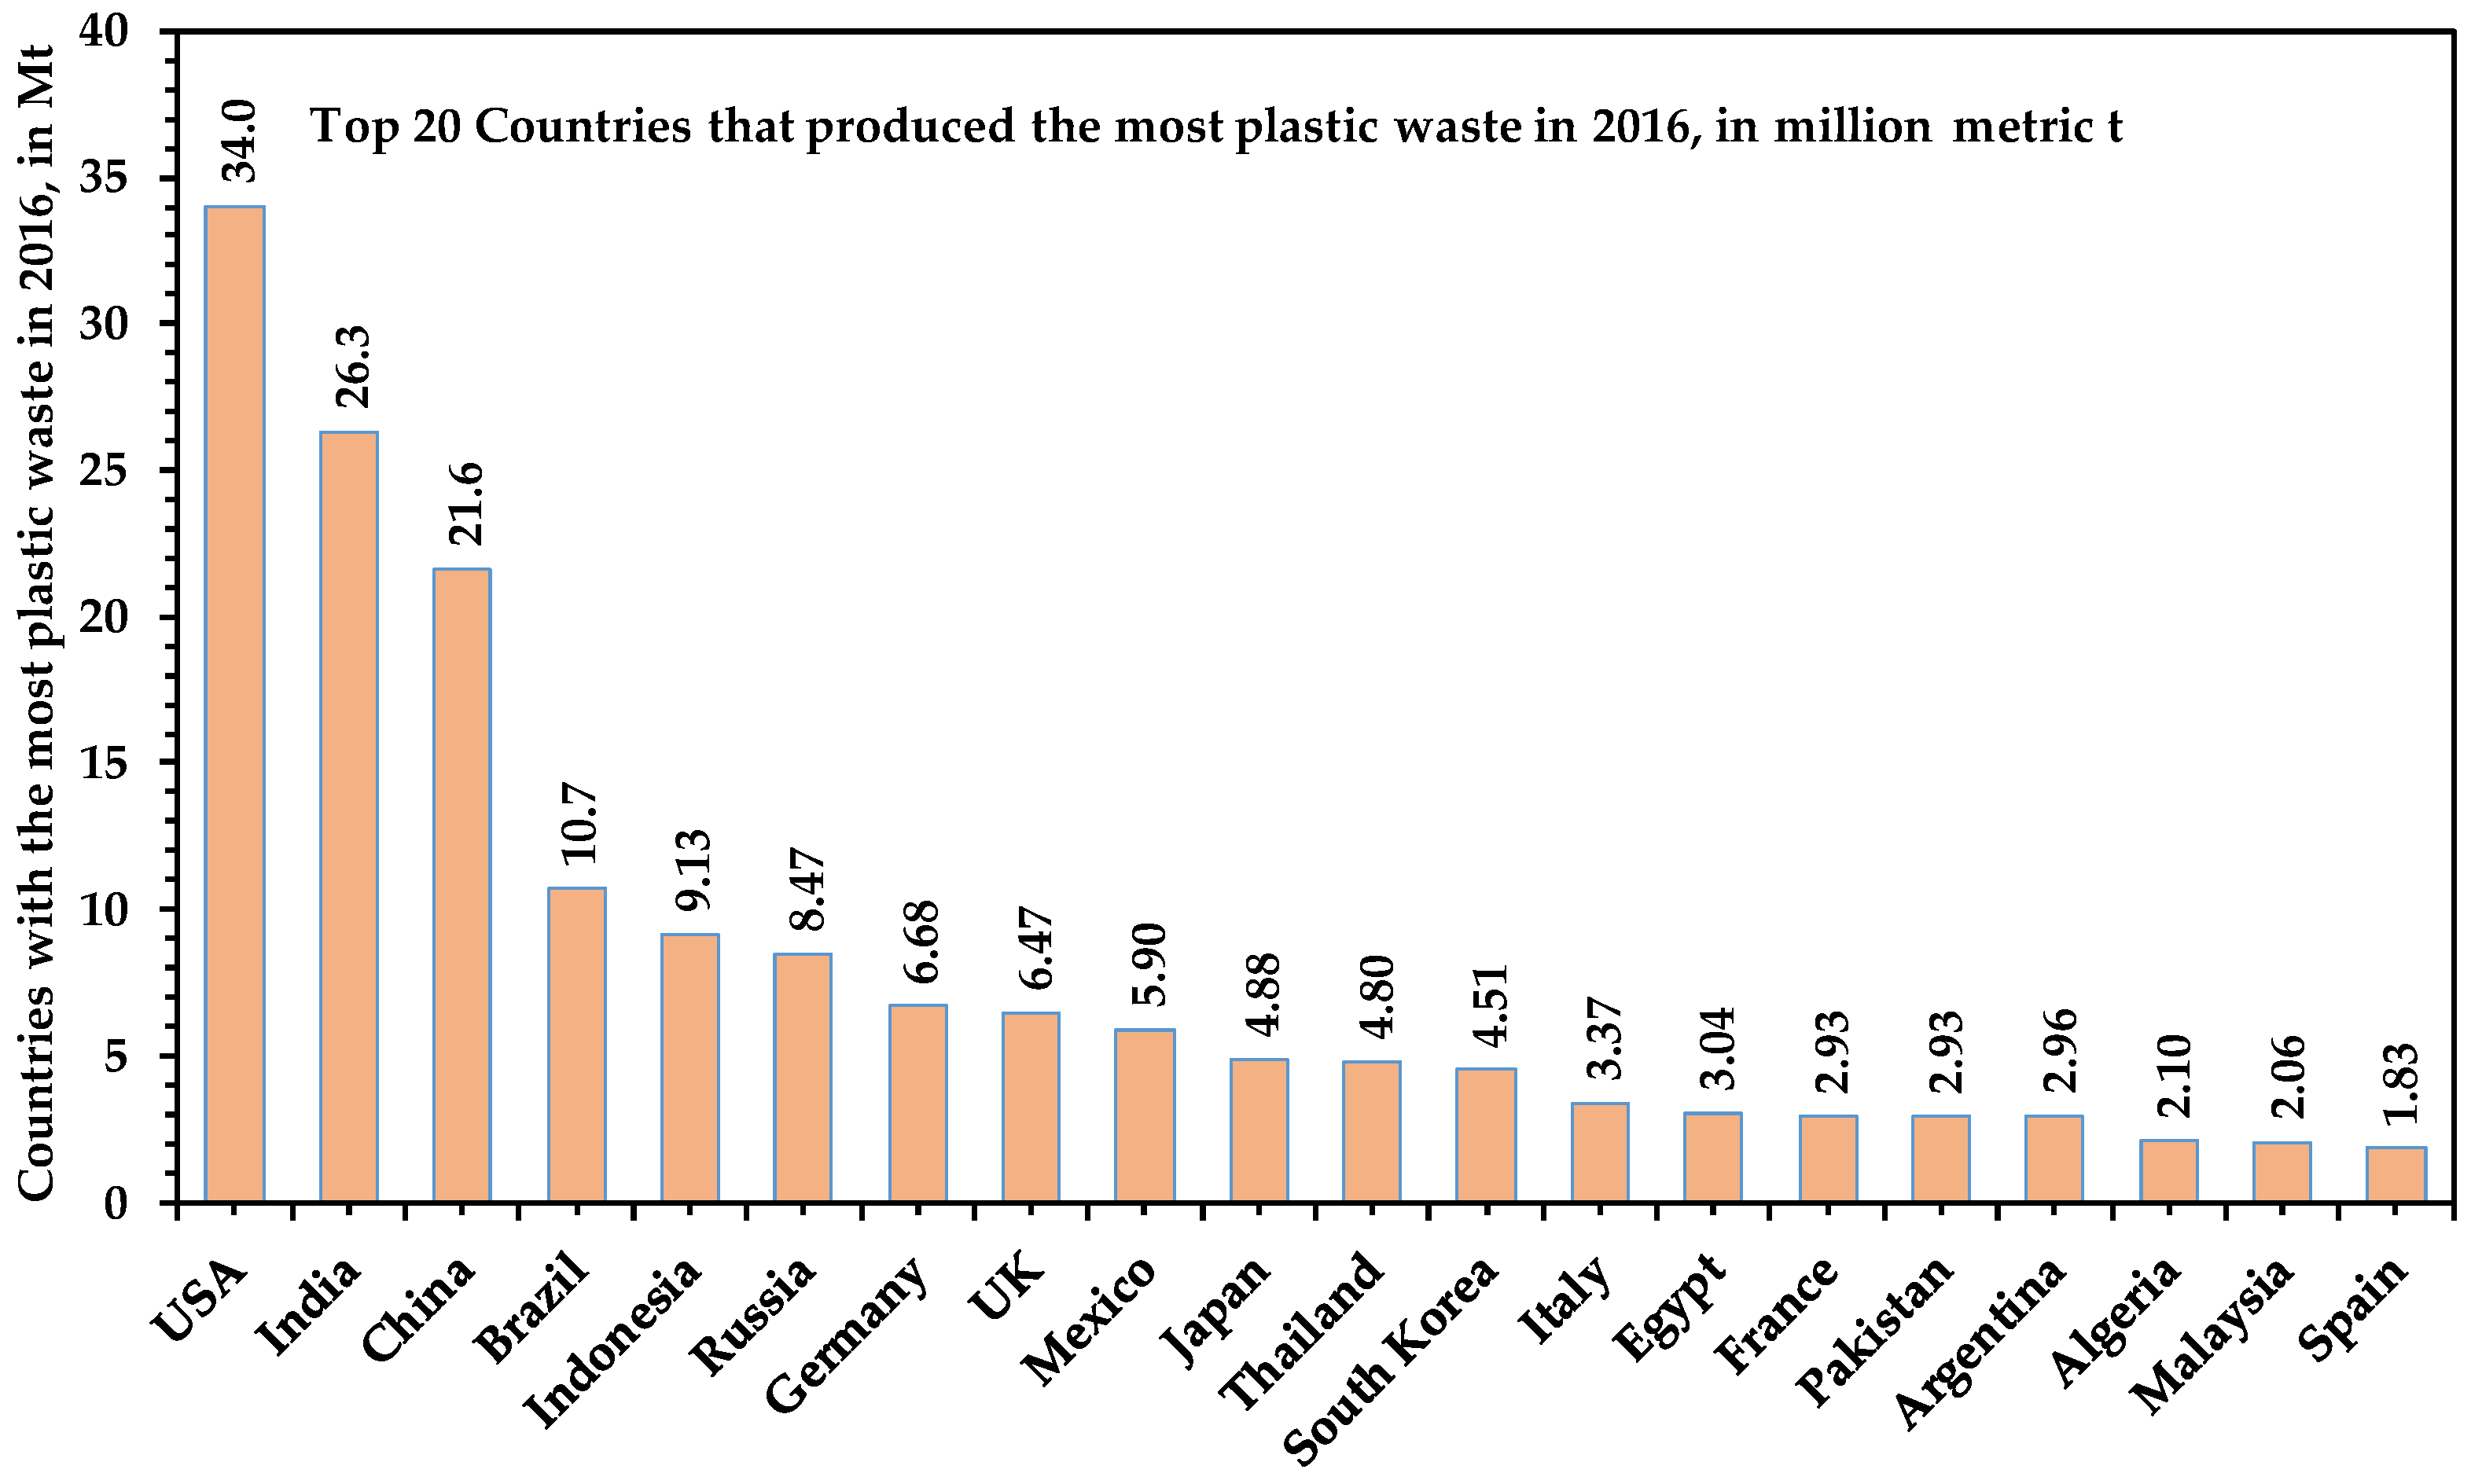
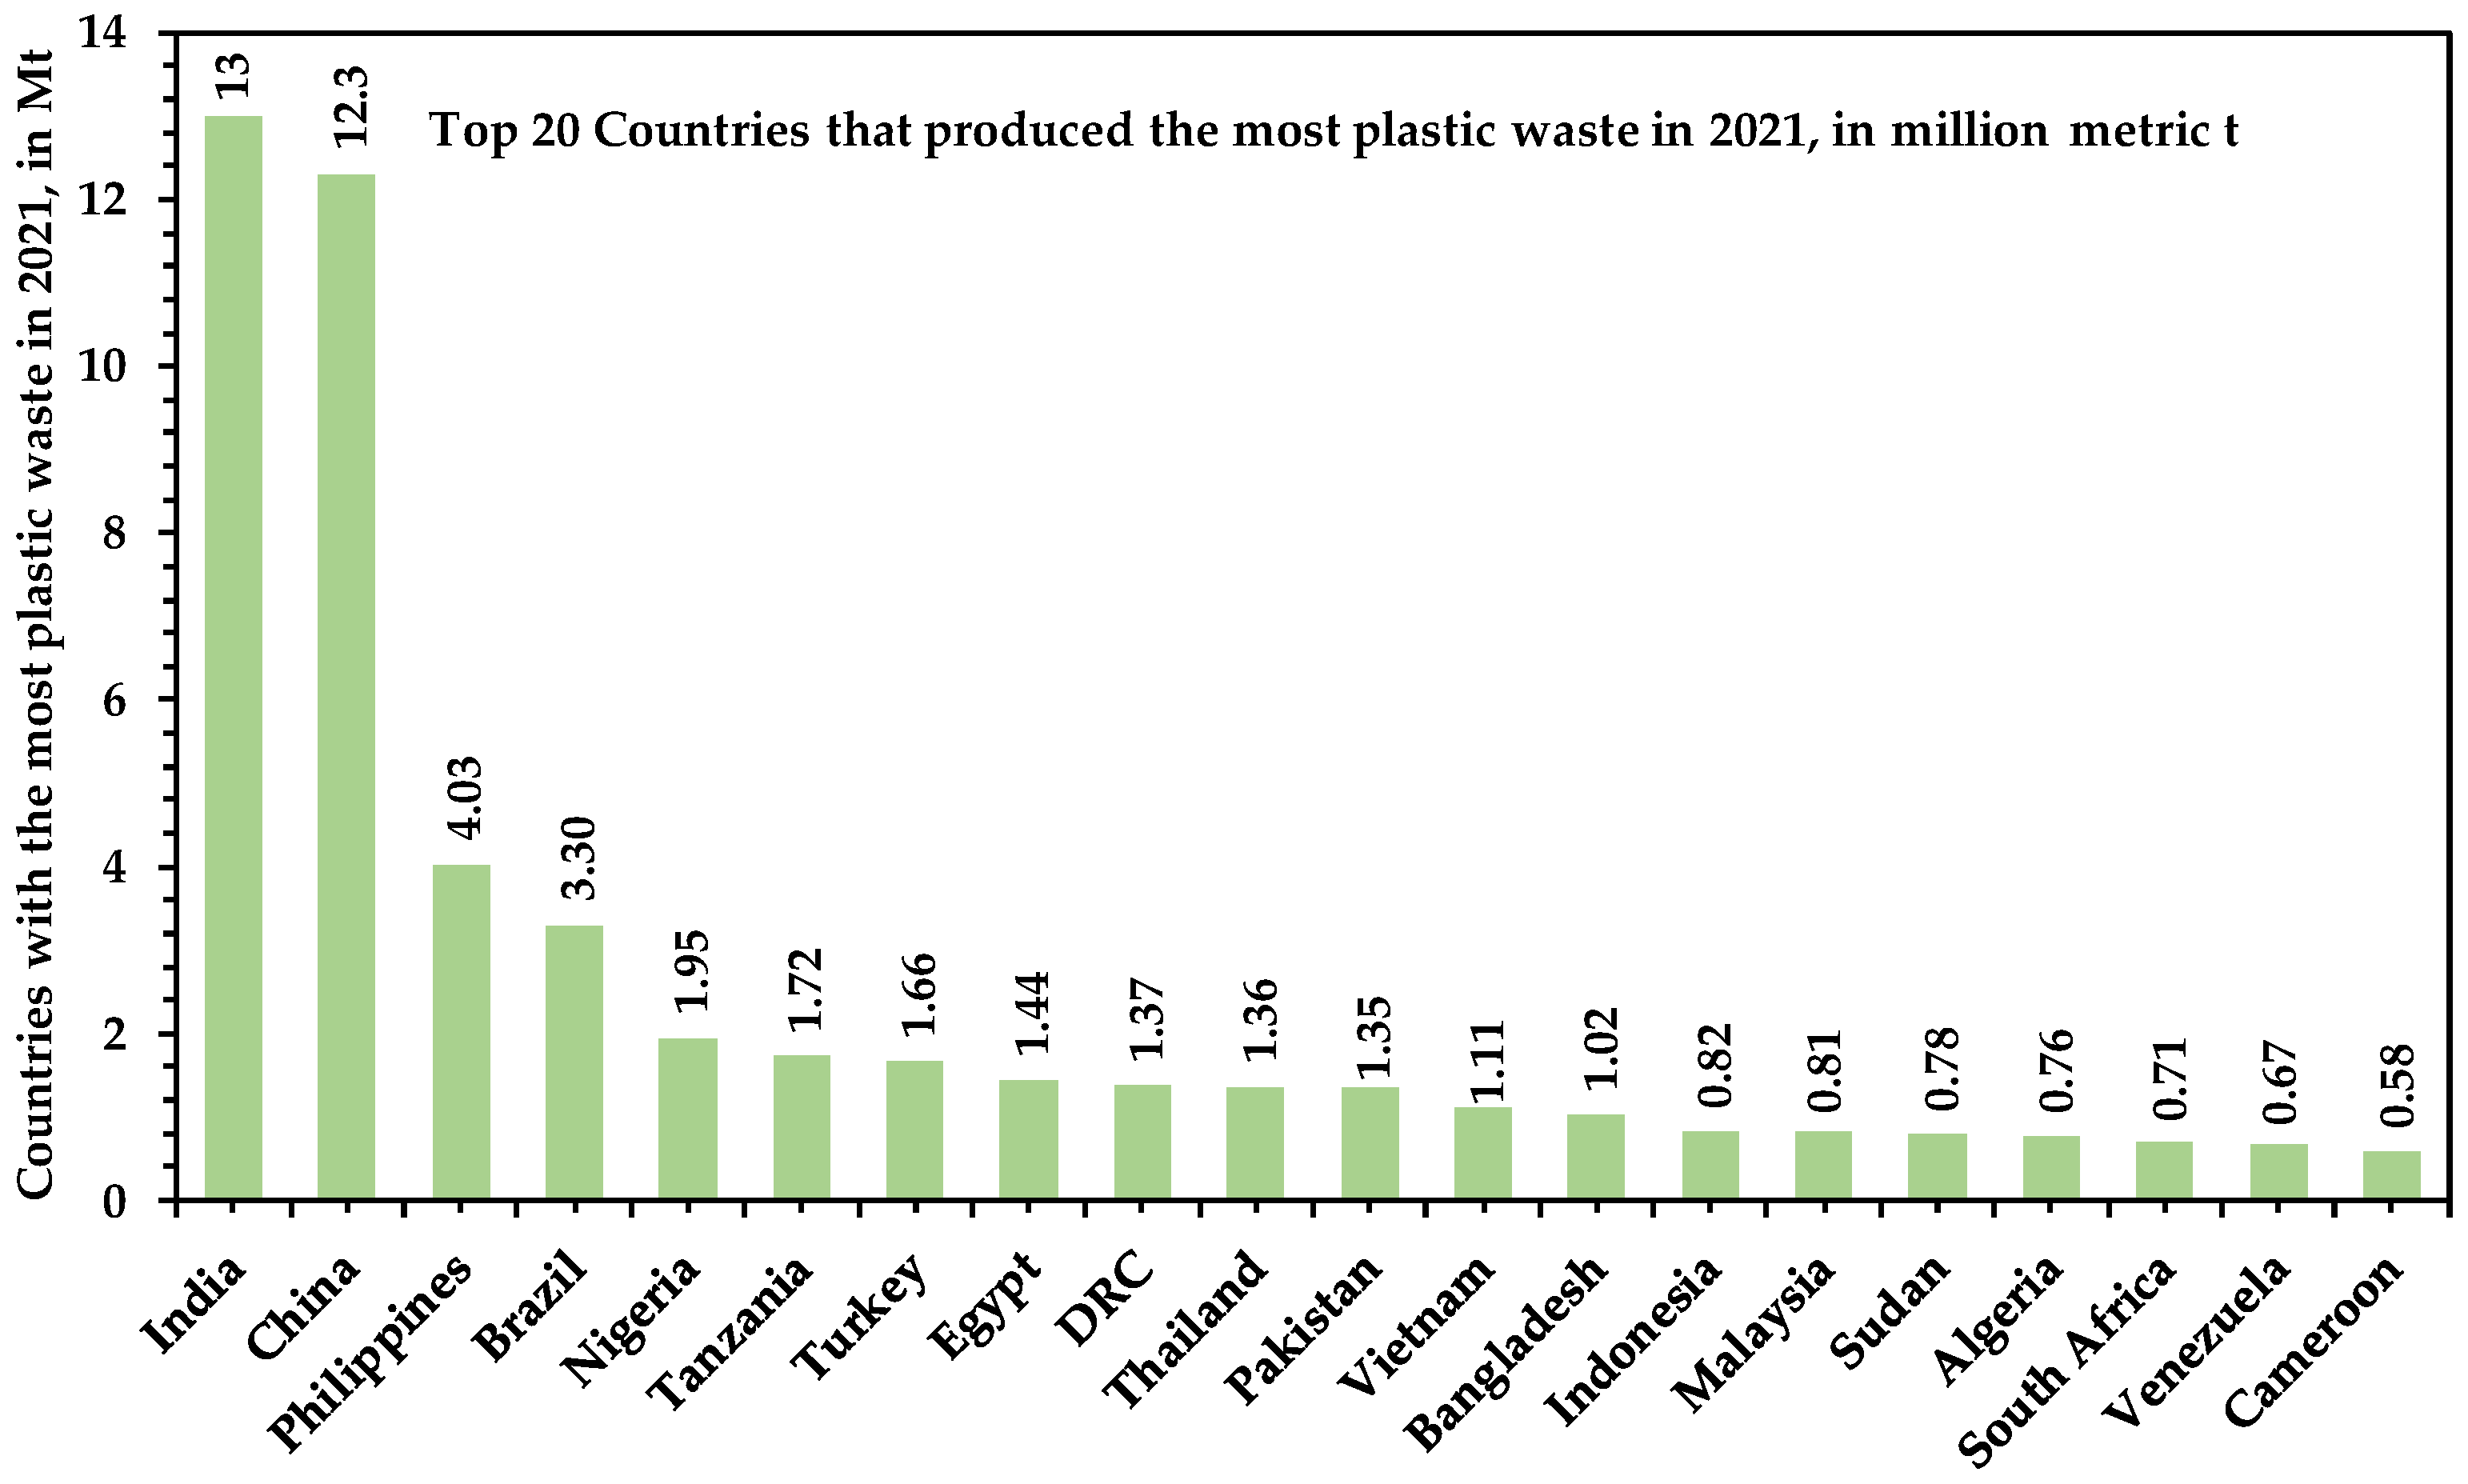
Figure 5, Figure 6 and Figure 7 show the top 20 countries that produced the most plastic waste in 2010, 2016, and 2021 (in million metric t), respectively. In 2010, China was responsible for the highest quantities of plastic waste production, having reached 59.08 million t of plastic waste, nearly double that produced by the USA (37.83 million t), four times that produced by Germany (14.5 million t), and almost five times the amount produced by Brazil (11.9 million t).
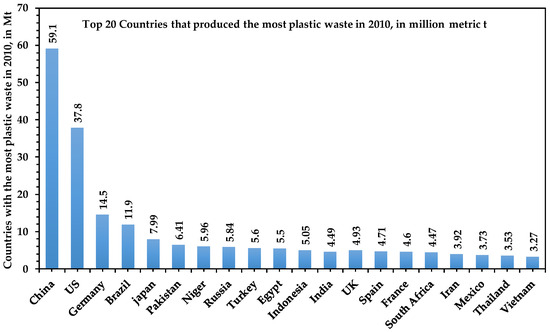
Figure 5.
Top 20 countries that produced the most plastic waste in 2010, in million metric t (Mt). Source: authors’ own elaboration based on data obtained from reference [49].
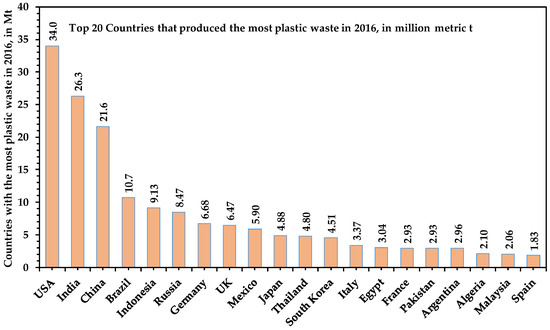
Figure 6.
Top 20 countries that produced the most plastic waste in 2016, in million metric t (Mt). Source: authors’ own elaboration based on data obtained from reference [49].
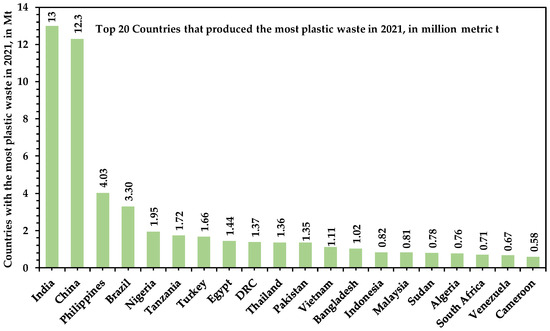
Figure 7.
Top 20 countries that produced the most plastic waste in 2021, in million metric t (Mt). Source: authors’ own elaboration based on data obtained from reference [49].
In 2016, the positions of the largest producers of plastic waste changed. China’s global generation had fallen from 59.1 million t to 21.6 million t, as shown in Figure 6, a reduction of around 37.5 million t.
In turn, the USA went from 37.8 million t in 2010 to 34 million t in 2016, a reduction of almost 4 million t. With 34 million t in 2016, the USA became the largest generator of plastic waste in the world, followed by India, with 26.3 million t. The various actions taken by China to reduce the generation of plastic waste, such as the ban on single-use plastic straws and the ban on non-degradable bags in all cities and towns in 2020 and later in 2022, can justify the drastic reduction in waste generated by the country in 2016 when compared to 2010. The USA is one of the largest exporters of plastic waste collected by other countries, with an emphasis on Asian countries. This situation distorts the view of the real quantities of waste generated in that country and the real reasons behind the reduction in the quantities of waste generated.
If, for some reason, some countries reduced their amounts of waste in 2016 and others did not, the production of plastic waste registered increases instead of decreasing. For example, for countries like India, Indonesia, Russia, the UK, and Mexico, their production rose from about 4.49, 5.05, 5.84, 4.93, and 3.73 million t of plastic waste, respectively, in 2010 to nearly 26.3, 9.13, 8.47, 6.47, and 5.9 million t in 2016. In the specific case of India, the country went from thirteenth place in 2010 to second in 2016.
In 2021, the volume of plastic waste generated fell drastically, as shown in Figure 7, a clear demonstration of the countries’ commitment to the fight against the harm caused by plastic waste. Countries like the USA, UK, Russia, Mexico, and France, for example, have even disappeared from the ranking. Asian countries continued to be at the top of the ranking, with India leading the list with around 13 million t of plastic waste, followed by China and the Philippines with around 12 and 4 million t, respectively. When compared to 2016, India and China reduced their plastic waste volumes by almost half.
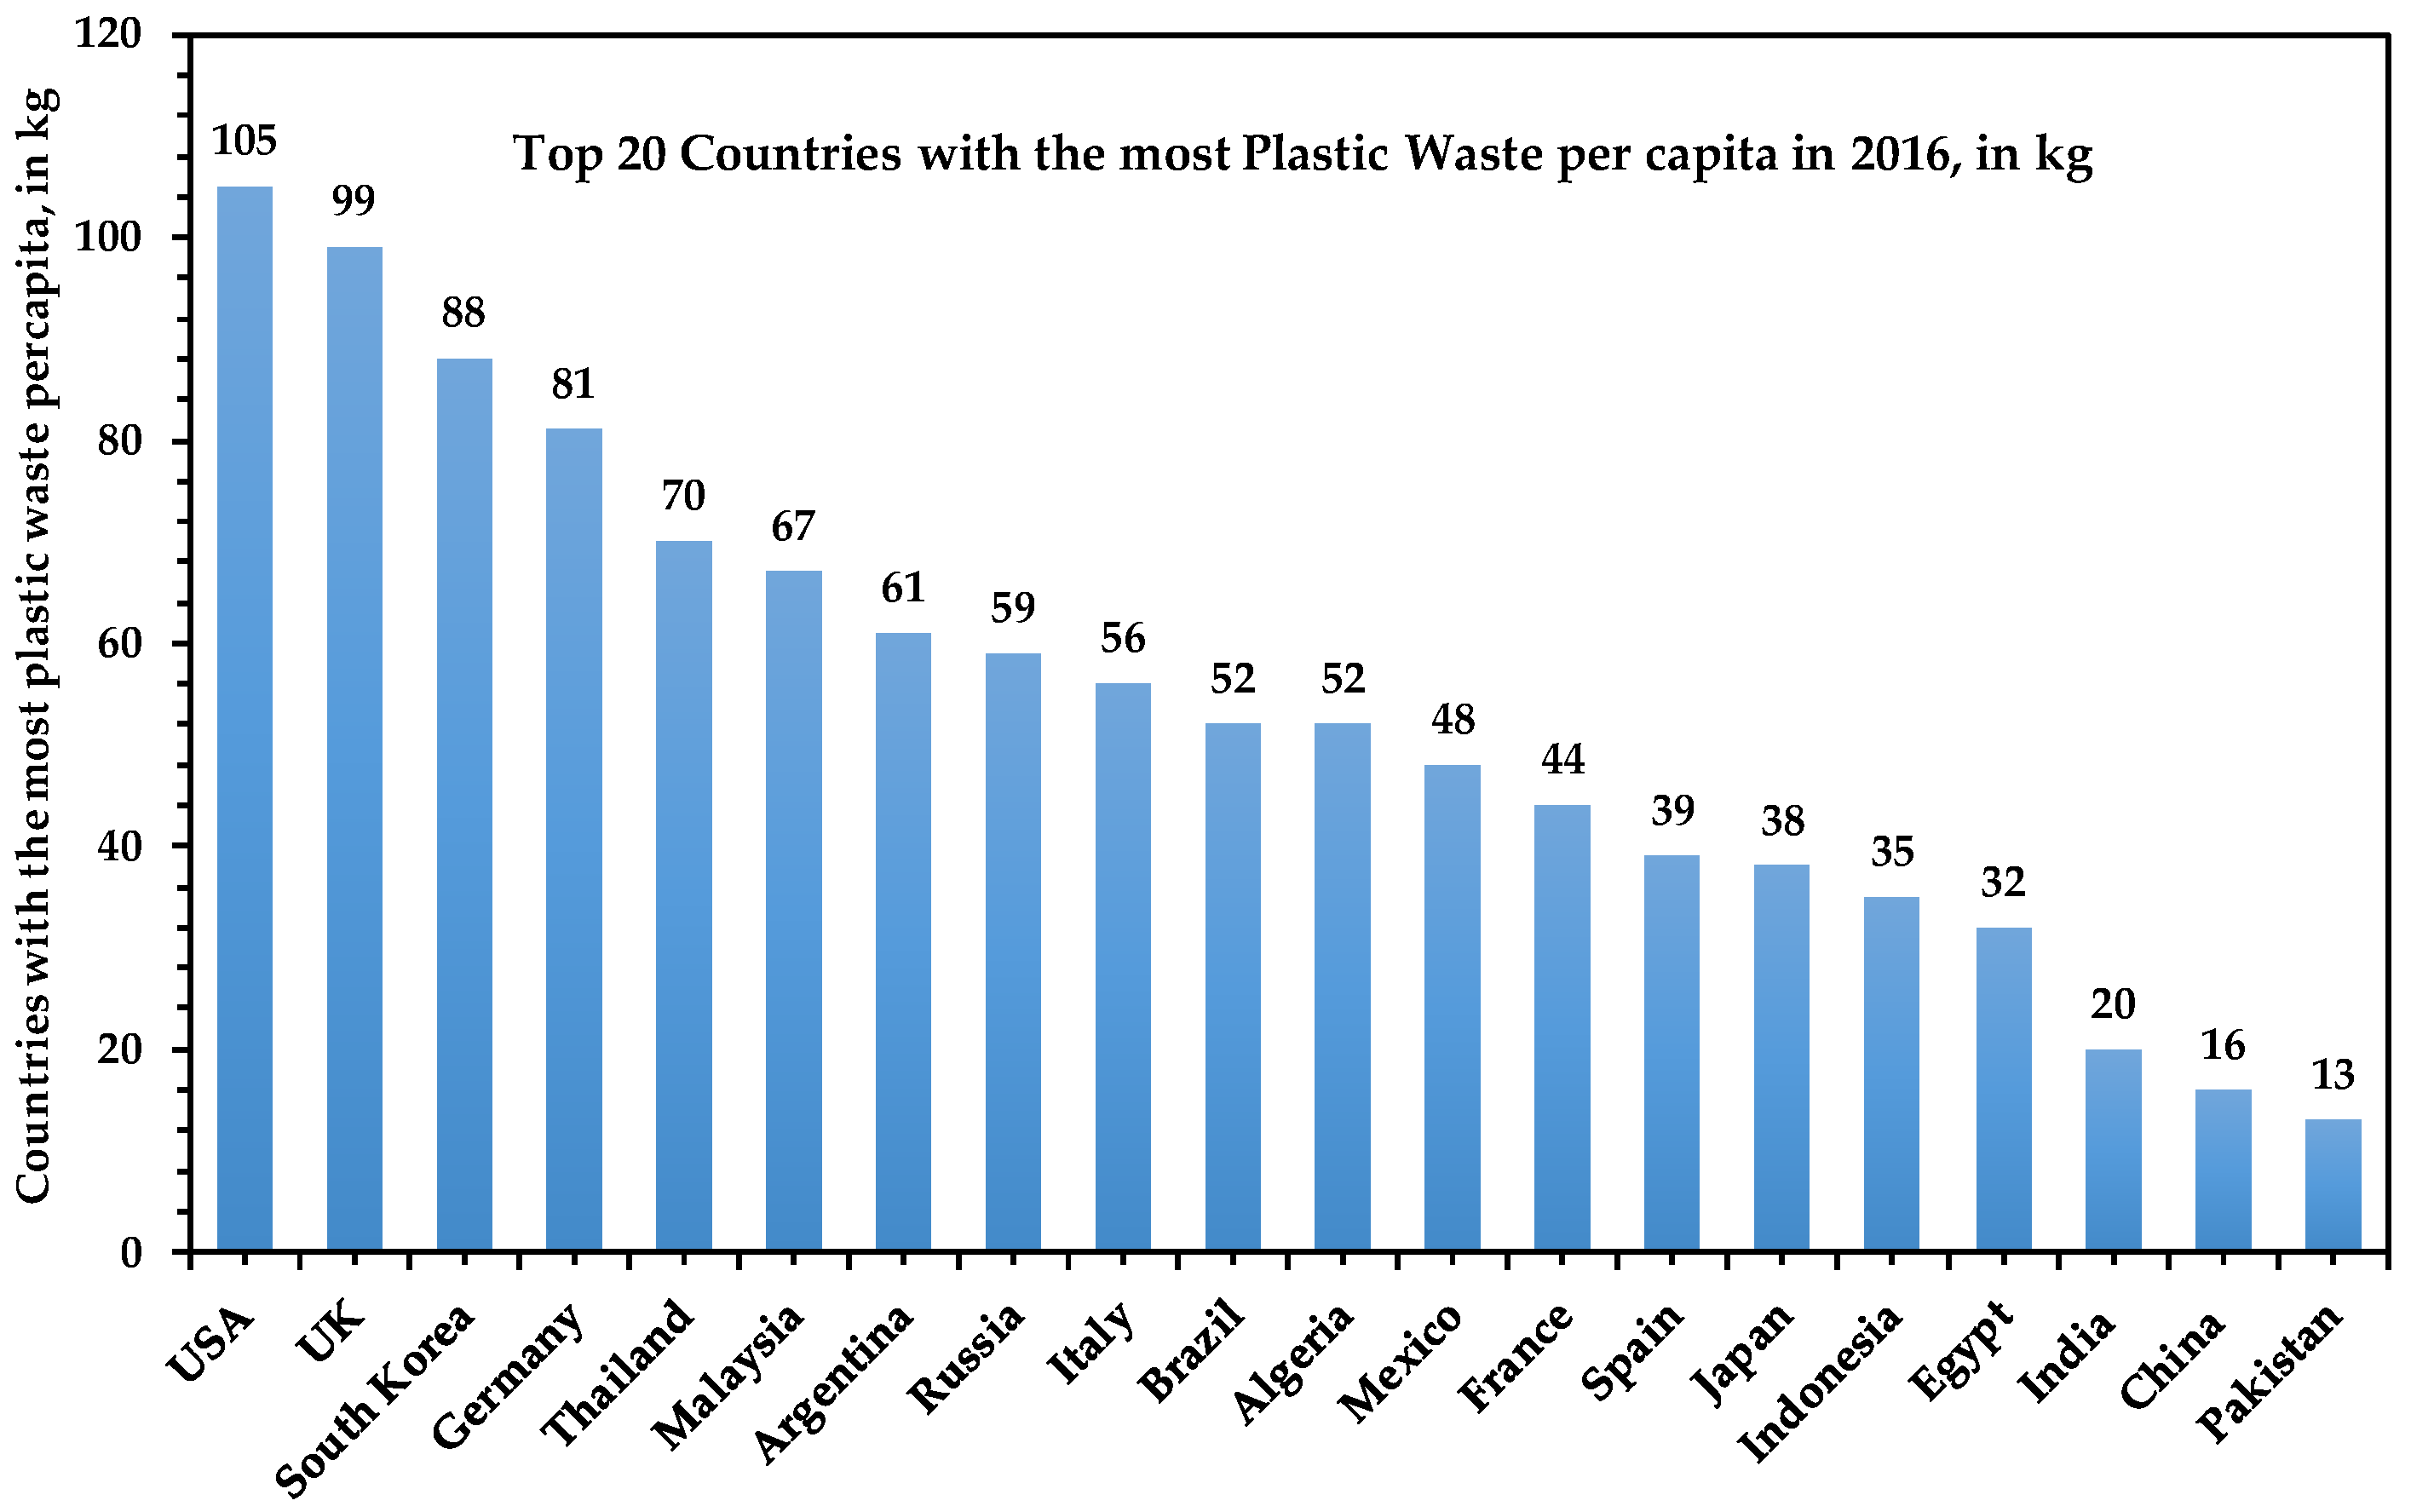
Figure 8 shows the top 20 countries with the most plastic waste per capita in 2016, in kg. As can be seen, the USA, UK, Republic of Korea, and Germany produced more plastic waste per person than any other major country in the world, reaching 105, 99, 88, and 81 kg a year, respectively. Even though India and China are the countries with the largest populations in the world, accounting for 18% of the world’s population each, and with China presumably being the world’s largest manufacturer of plastic, both countries are far behind the USA (with 4% of the world’s population) in terms of plastic waste generation per capita. The two countries are ranked 18th and 19th, with 20 and 16, respectively.
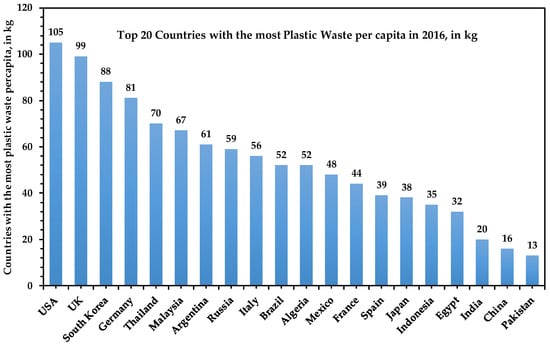
Figure 8.
Top 20 countries with the most plastic waste per capita in 2016, in million metric t (Mt). Source: authors’ own elaboration based on data obtained from reference [49].
5.2. Plastic Waste Generation by Company Product Brand
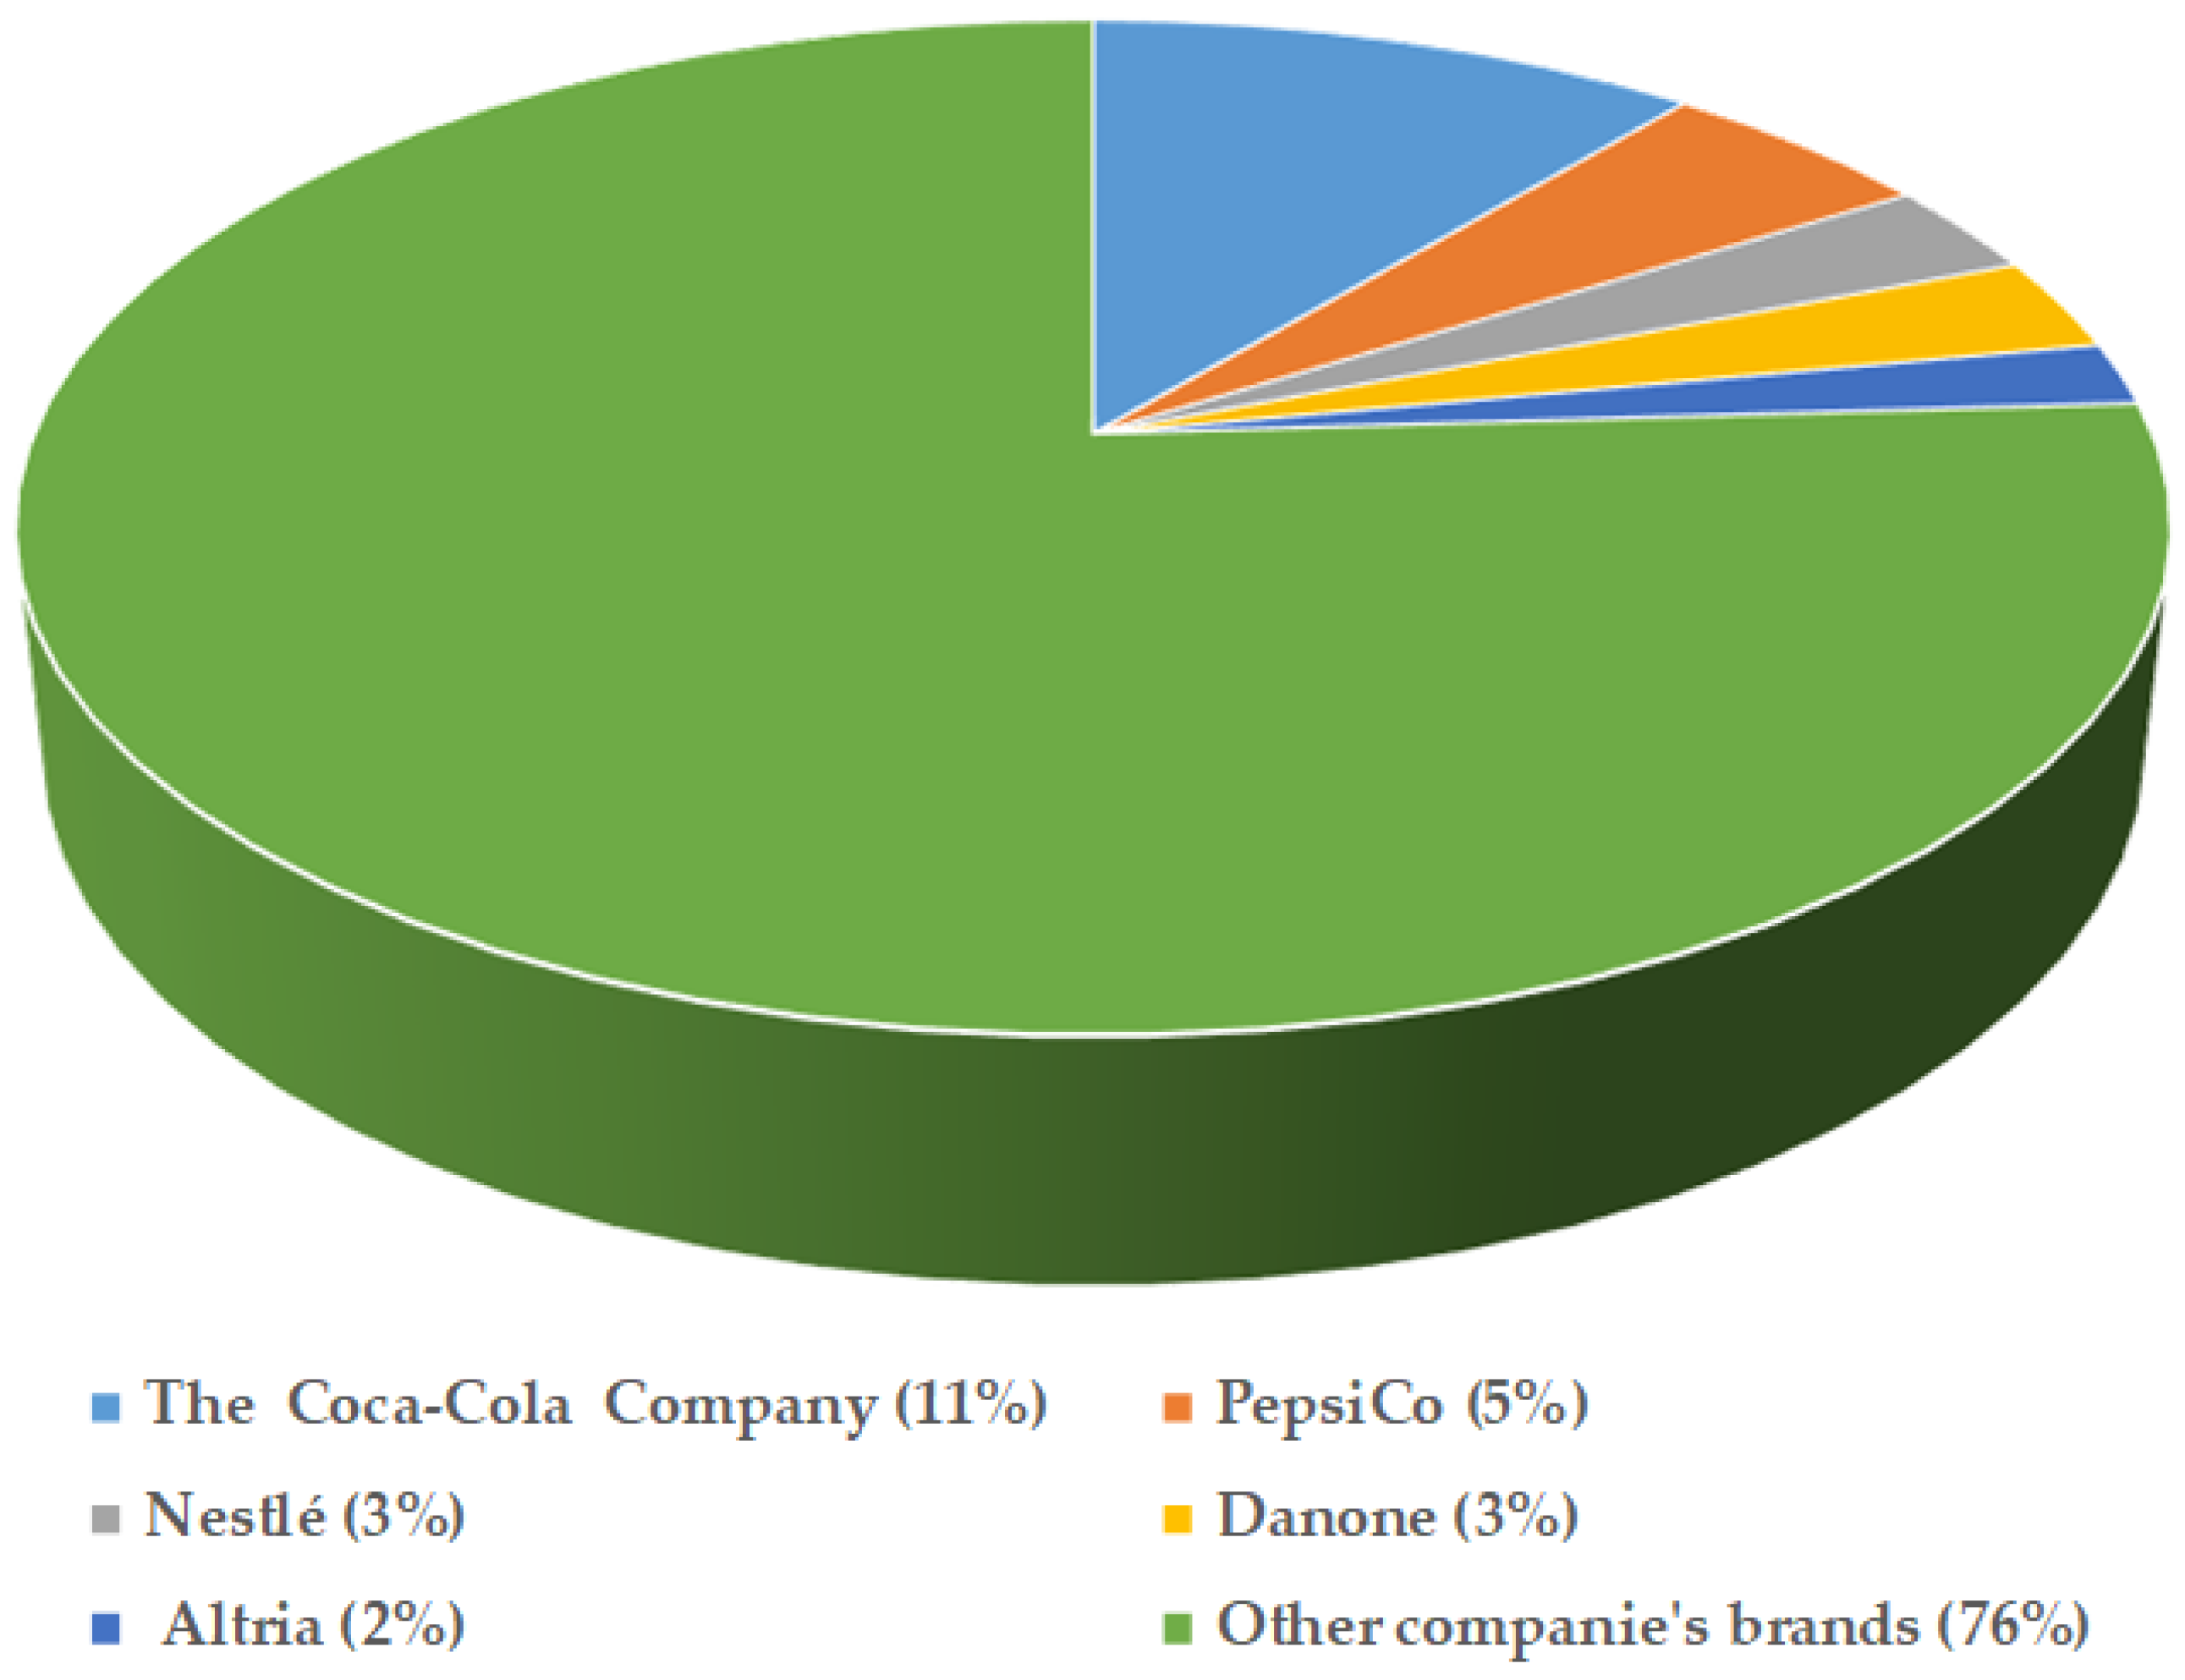
Plastic waste generation is a two-sided problem in the consumer goods industry. One of the issues has to do with the disposal of waste for multiple reasons by societies. The other side is related to the generation of plastic waste through branded product packaging from companies. In this way, there has been an increasing amount of single-use plastic and waste produced by companies worldwide. Moreover, because the packaging industry is the one that generates the most waste, as described in Section 4, the situation is becoming increasingly worrying. A recent study, entitled “Global producer responsibility for plastic pollution” [55], which looked at the relationship between companies’ annual production of plastic and their branded plastic pollution, indicated food and beverage companies as being the ones that generate the most plastic waste for the environment. Companies such as the Coca-Cola Company, PepsiCo, Nestlé, Danone, and Altria occupied the top five (Figure 9) in terms of pollution of brands associated with their companies globally.
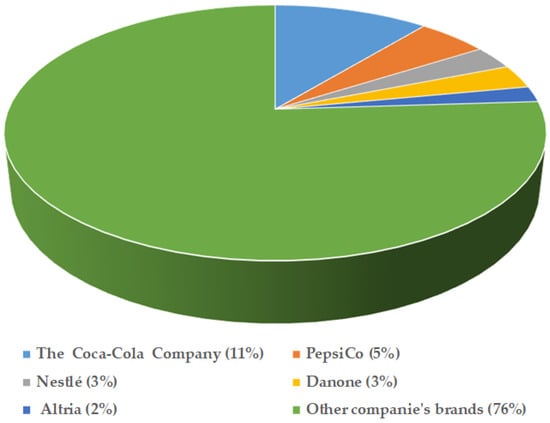
Figure 9.
The global percentage of the top five companies’ branded plastic waste generated throughout their value chain. Source: authors’ own elaboration based on data obtained from reference [55].
The Coca-Cola Company accounted for 11% of the total, followed by PepsiCo, Nestlé, Danone, and Altria, with 5%, 3%, 3%, and 2%, respectively, with these five companies alone accounting for 24% of the global branded count. The remaining 76% belonged to other companies, which were not mentioned in the study. As can be seen in the figure, the first four companies belong to the food and beverage sector and the fifth (Altria) to the tobacco industry. The study analyzed around 1.87 million items of plastic waste found in the environment, recorded between 2018 and 2022, in 84 countries worldwide. Half of the items analyzed came from 56 companies. The study also found that 52% of the items analyzed did not have an identifiable brand, which highlights the pressing need for better transparency about the production and labeling of plastic products to improve their traceability and corporate accountability.
5.3. Main Sources of Plastic Waste Generation
Kibria et al. [56] presented a comprehensive overview of the main sources of plastic waste generation. The main sources of plastic waste generation include five categories, namely (i) household plastic wastes; (ii) industrial plastic wastes; (iii) agricultural plastic wastes; (iv) medical plastic wastes; and (v) electrical plastic wastes.
5.3.1. Household Plastic Wastes
Household plastic waste is basically characterized by plastic waste generated in homes resulting from its use in household activities. Household plastic waste comprises packaging from different food items (such as processed meat packages, milk bottles, plastic soft drinks, water bottles, salad dressing containers, margarine containers, yogurt containers, bread bags, sweet trays, frozen food bags, egg cartons, fast food trays, fruit plastic packaging, caps for containers, etc.), shopping bags, disposable plastic silverware, printed matters, nappies, clothing, furniture, carpet, shrink-wraps, garment bags, shampoo bottles, detergent bottles, toys, toothbrushes, toothpastes, paper, packaging for electronics and household appliances, etc. The main plastic materials involved in the manufacture of the above items include, among others, PET, HDPE, LDPE, PVC, PP, and PS.
5.3.2. Industrial Plastic Waste
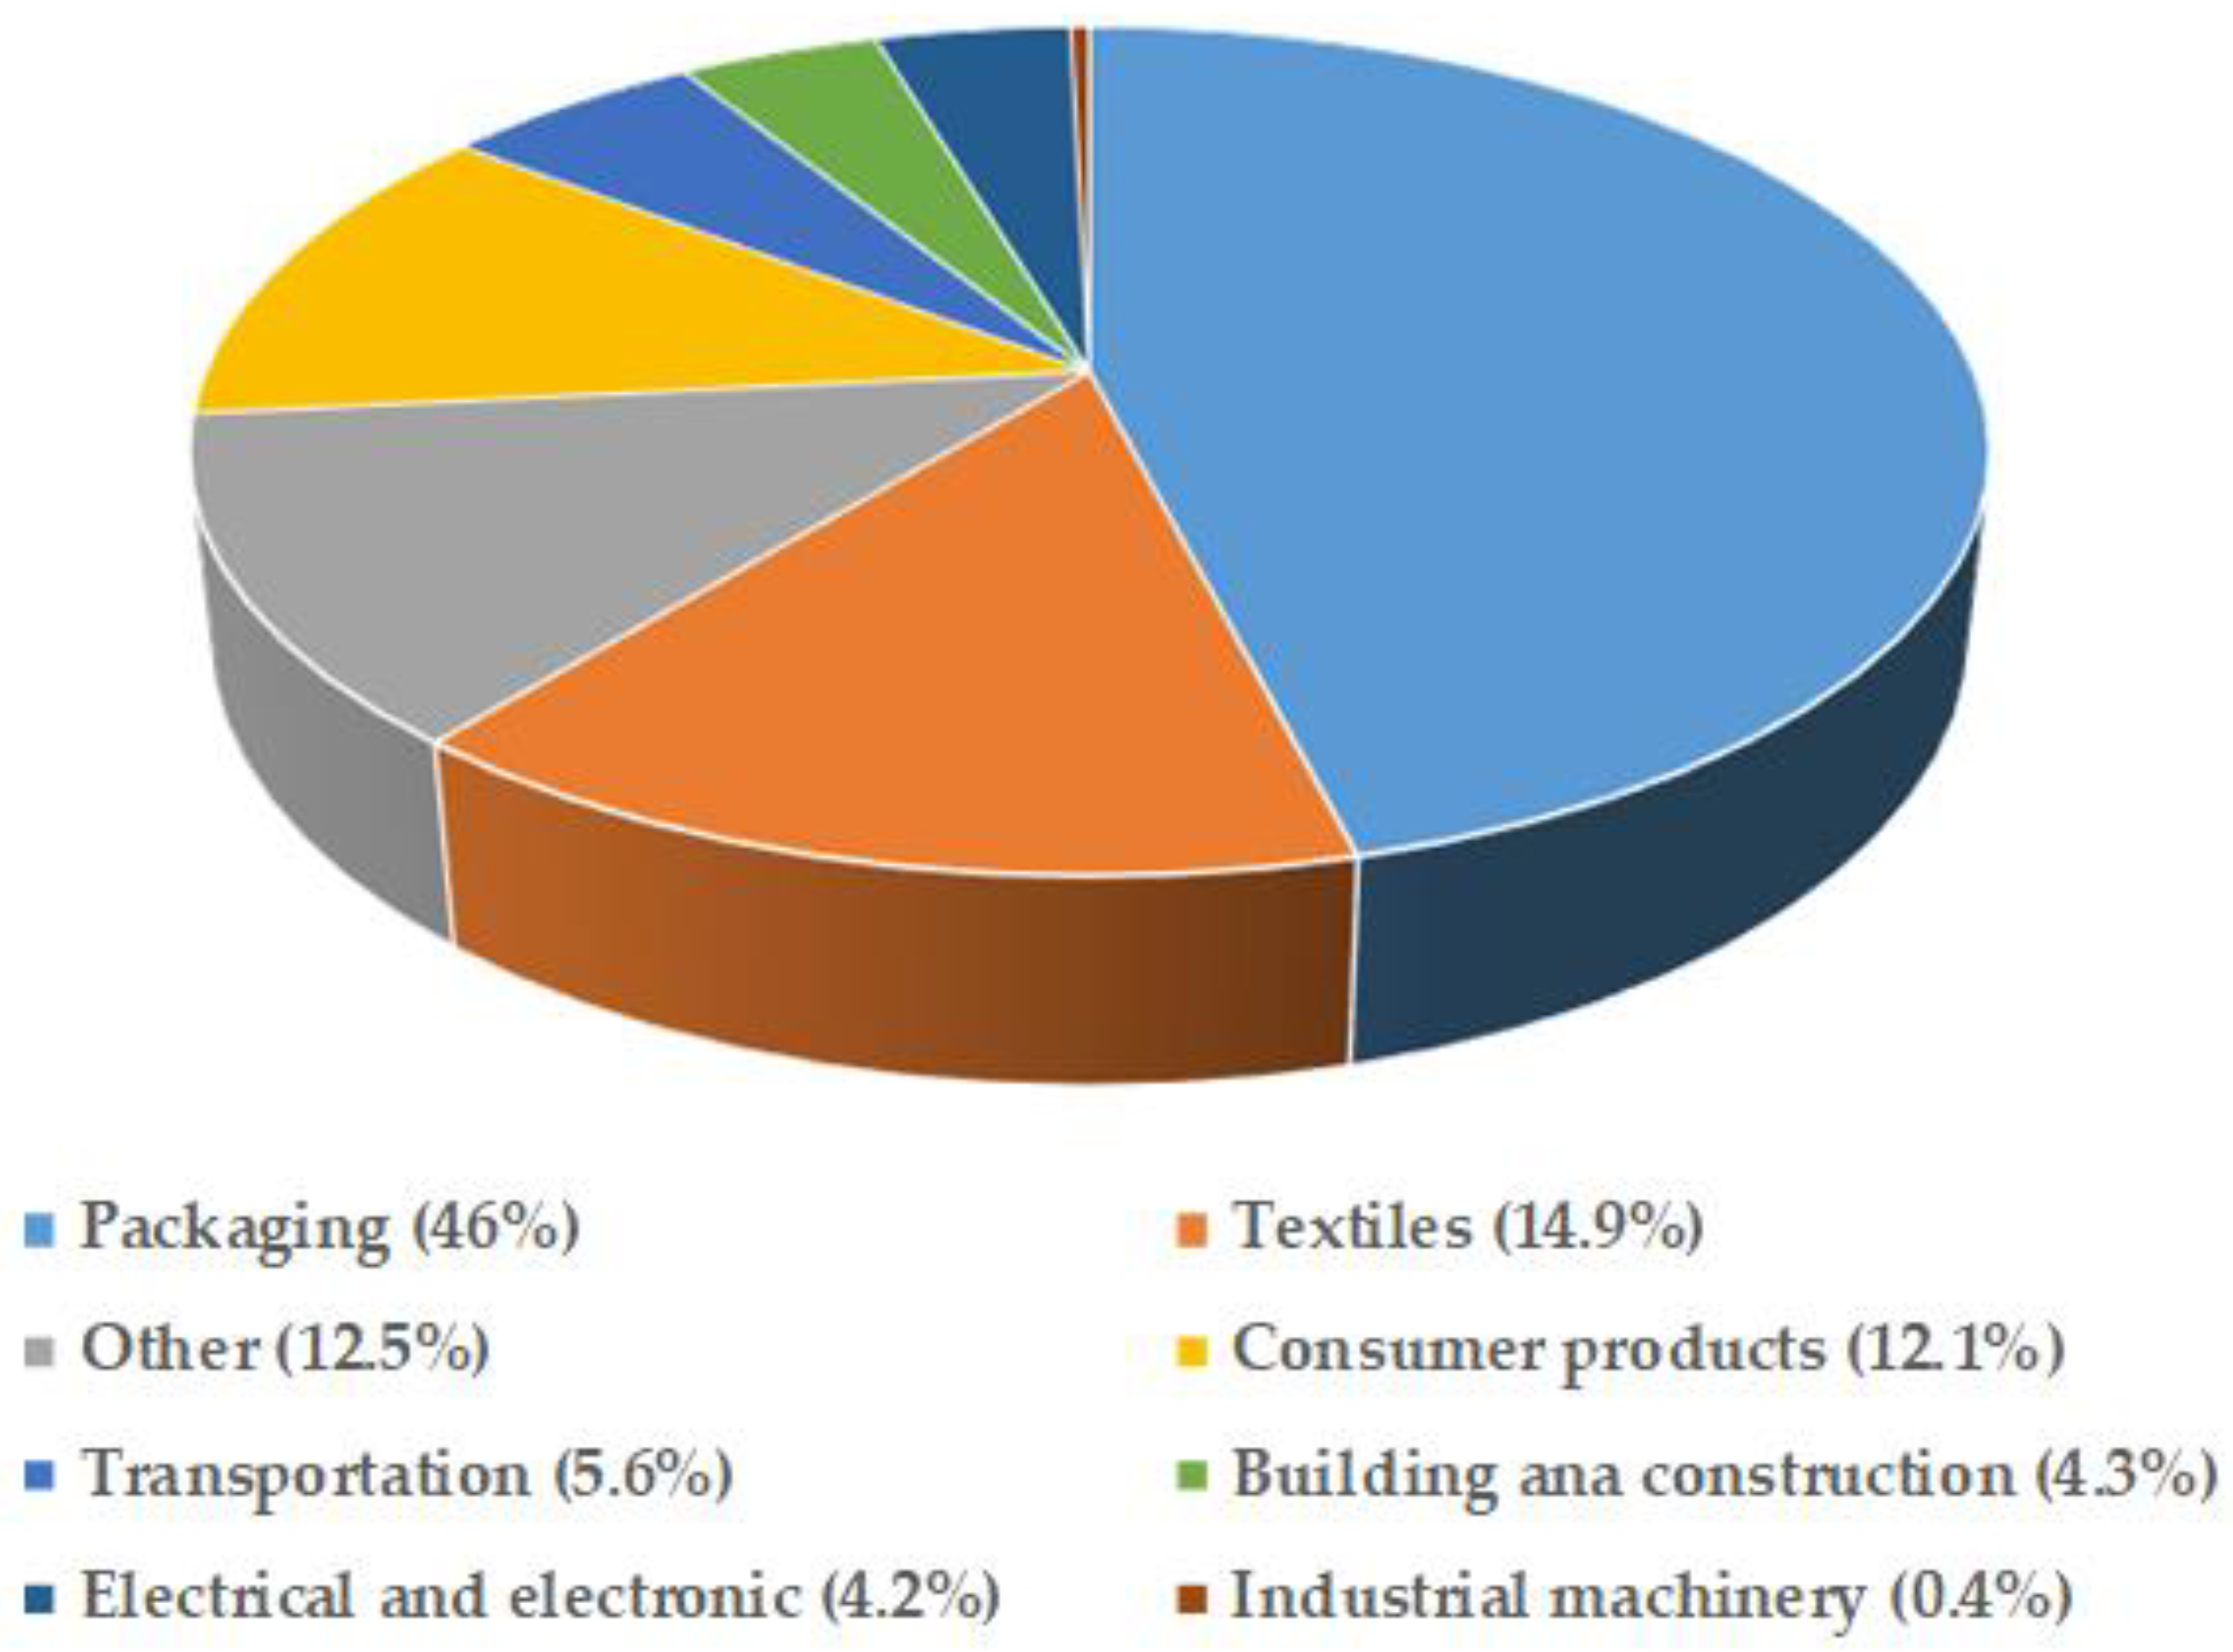
Industrial plastic waste includes materials arising from mass production, processing, and packaging industry activities. Much of this waste results from the packaging industry, construction sector (building or destroying infrastructure), the automotive and aeronautical industry, the electrical and electronics industry, etc. The main waste in this category includes plastic bags, sacks, wraps, packaging items, bottles, electrical cables, plumbing tubes, celling materials, etc. [56]. It is important to note that the packaging sector is the main source of plastic waste generation of the industrial segment [52,57]. Figure 10 shows the distribution of plastic waste generation worldwide in 2018, by industrial sector. As can be seen, the packaging sector contributed a significant amount of plastic waste, reaching around 46%, followed by the textile sector in second place, with almost 15% of the total.
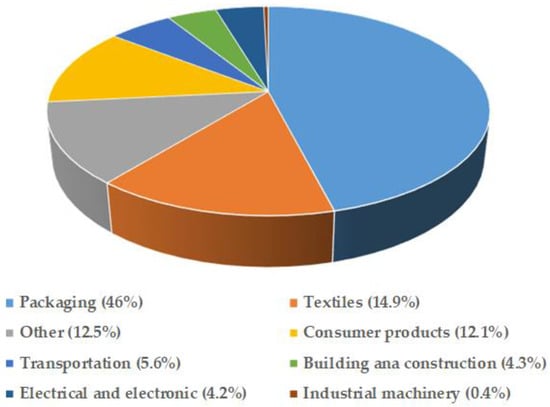
Figure 10.
Distribution of plastic waste generation worldwide in 2018, by industrial sector. Source: authors’ own elaboration based on data obtained from reference [58].
5.3.3. Agricultural Plastic Wastes
Agricultural plastic waste is waste that comes from agricultural activities. Waste results from agrochemical packaging, seed packaging, fertilizer bags, irrigation activities, mulching, silage covering, crop protection, post-harvesting operations, etc. It is important to note that a large amount of plastic waste results from nets used to protect crops from adverse weather conditions, insects, and animals. The main plastic materials involved in the manufacture of the above items include, among others, PE, HDPE, LDPE, PVC, PP, and PS.
5.3.4. Medical Plastic Wastes
Medical plastic waste results from health sector activities. The main waste from this sector includes personal protection equipment, gloves, syringes, cannula pipes, medicine coverings, facemasks, hand sanitizer bottles, plastic takeout bags, food and pharmaceutical product containers, reagent kits, etc. The main plastic materials involved in the manufacture of the above items include, among others, PET, PE, ABS, HDPE, LDPE, PVC, PP, and PS.
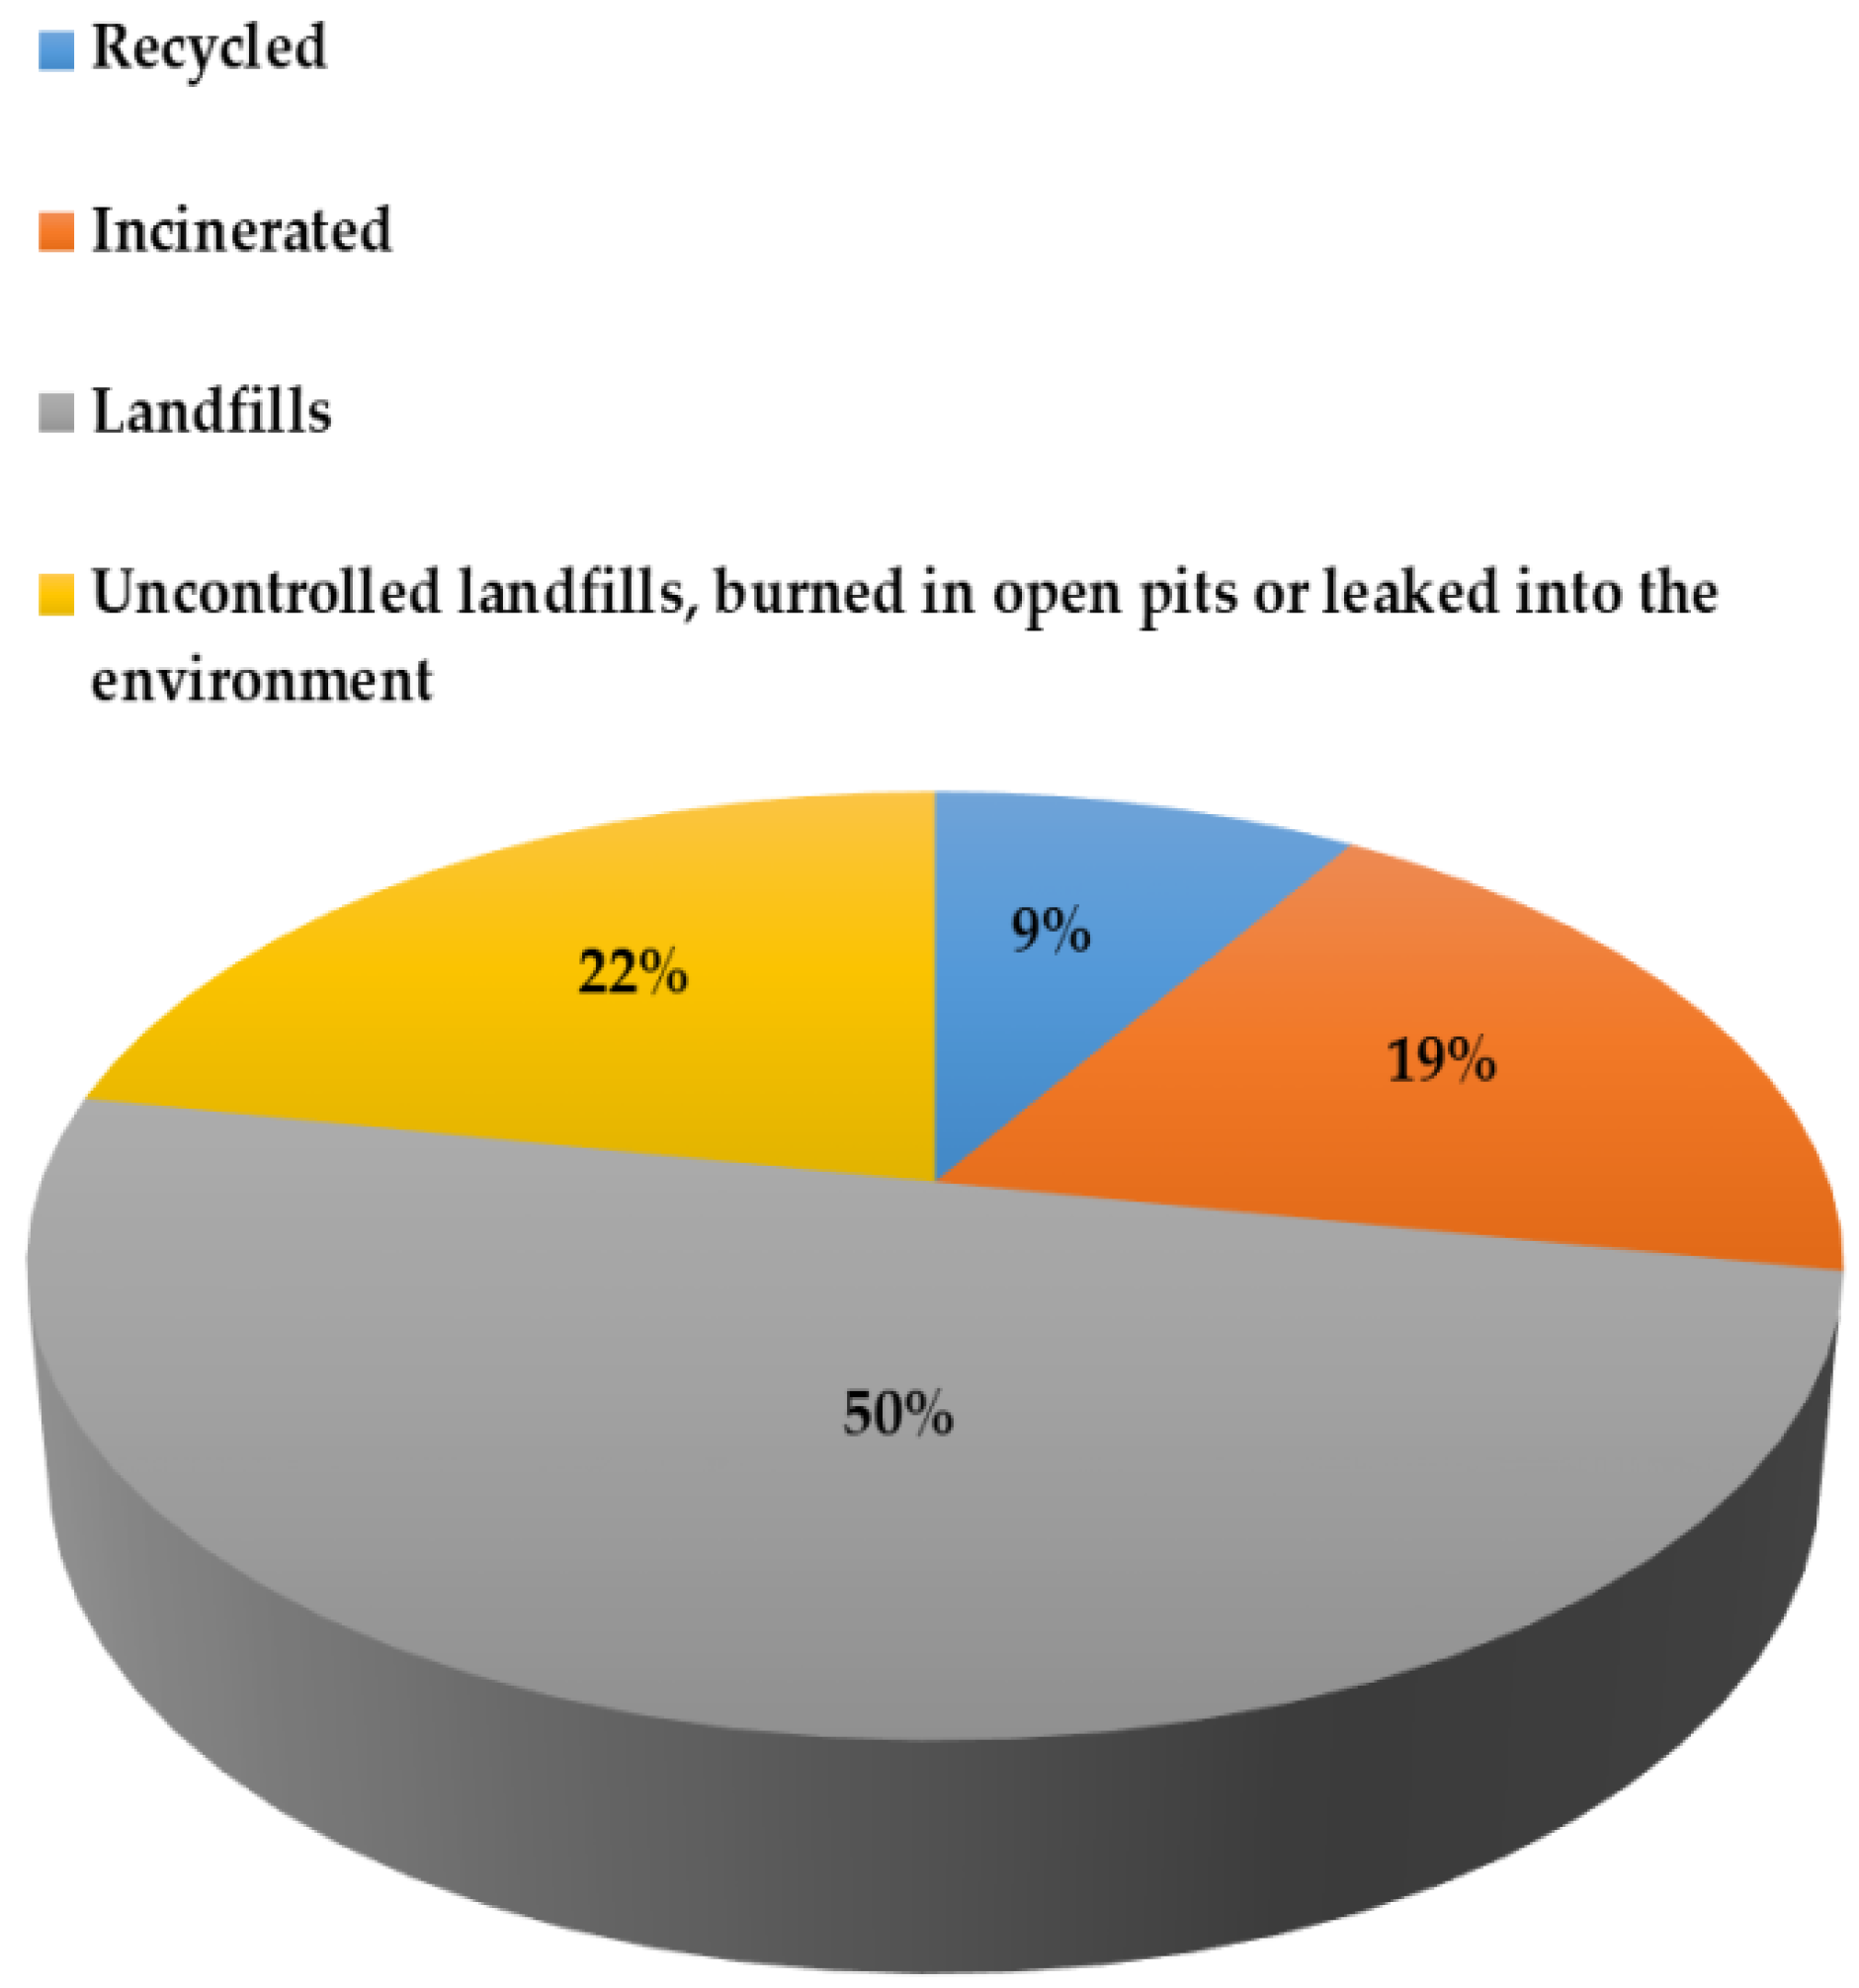
As can be seen above, packaging materials are present in three of the five categories. This is not surprising at all, since, on the one hand, the packaging industry is the one that consumes the largest portion of the total global volume of production of plastic, on the other hand, proportionally, it is the sector that generates the most plastic waste. The saddest part of this situation is that only 14% of the total waste generated from the sector is collected for recycling. The remaining part ends up in the environment (buried in dumps or landfills (40%), incinerated (14%), or leaked into the ecosystem (32%)).
5.3.5. Electrical Plastic Wastes
Electrical plastic waste is one of the fastest growing waste streams worldwide. The main waste in this category includes cell phones, computers, monitors, televisions, cameras, printers, and photocopiers, among others. According to Kibria et al. [56], secondary scraps derived from electrical and electronics items such as copper, steel, other metals, and plastic glasses can also be included in this category.
5.4. Export and Import of Plastic Waste
At a time where environmental pollution has become a global concern and the treatment of solid waste is almost a requirement for states and nations, the export of plastic waste to countries with lower treatment rates or with other policies that do not involve waste treatment is an increasingly frequent reality. The export of plastic waste is part of a platform called “Global plastic waste trade”. Global plastic waste trade is the international trade of plastic waste between countries for further treatment, disposal, or recycling. In fact, the export of plastic waste to developing countries that lack efficient waste management infrastructure is nothing more than a move that aims to reduce costs involved in its management, reduce pressure on local recycling facilities and landfills, dissipate responsibilities, and reduce pollution in the environment of each of the exporting countries from a strictly local perspective. Researchers point out the most industrialized and economically developed countries as those that produce and export the most plastic waste.
For destination countries, the so-called importing countries, on the other hand, the import of plastic waste comes with certain financial benefits too. The import of plastic waste has seen a positive impact on the economic growth of many countries, including low-income countries. The use of recycled plastic in the manufacture of goods, for example, is seen as a cheaper option for industries instead of importing virgin plastic. However, not everything is a bed of roses in these countries. For example, when exporting countries send unusable and non-recyclable contaminated plastics, importing countries only incur financial losses, associated with environmental degradation.
Table 1 shows the world’s top 10 exports of plastic waste from 2016 to 2018, 2020, and 2022. As can be seen, in 2016 and 2017, Hong Kong, the USA, Japan, Germany, and Mexico were the countries that led the first five positions in terms of exports of plastic waste, with cumulative amounts of around 3.41, 3.13, 1.73, 0.89, and 0.60 million t, respectively. In 2018, Hong Kong left first place and dropped to fifth, and Japan took its place, followed by the USA and Germany in the second and third positions, respectively. In 2020, Germany moved to first place, with 0.85 million t, followed by Japan and the USA, with 0.82 and 0.62 million tons, respectively. In 2022, Germany continued to lead the ranking, with shipments totaling over 0.73 million t, followed by the Netherlands and Japan, with 0.68 and 0.60 million t. In regional terms, Germany is the largest exporter on the European continent in the period under review, while the USA leads the American continent. Asia’s largest plastic exports are from Japan.

Table 1.
The world’s top 10 exports of plastic waste (10,000 t) from 2016 to 2018, 2020, and 2022 [59,60,61].
The largest destinations for Germany’s exports are the Netherlands, Poland, Austria, Switzerland, Turkey, and Malaysia. Japan’s exports go to neighboring countries such as Malaysia, Vietnam, Thailand, and the Republic of Korea. In turn, the USA’s exports are destined for Canada, Mexico, Malaysia, Vietnam, India, Hong Kong, and Indonesia [60].
Although the data in the table come from different sources, overall, there is a clear trend towards a reduction in exports in the period under evaluation. With the emergence of new policies or laws on the production and management of waste in destination countries, global pressure on the need to preserve the environment through adequate management of plastic waste may be behind this situation. On the other hand, the amendment to the Basel Convention in May 2019, the so-called “Basel Convention on the Control of Transboundary Movements of Hazardous Wastes and their Disposal”, which now includes plastic waste, may also be restricting the main players in this market.
It is obvious that if there are exporting countries, it is because there are destination countries, that is, the so-called receiving countries, or simply importing countries. As previously stated, importing plastics brings certain financial benefits to importing countries. One of the benefits that stands out most is the fact that recycled plastics can be reused in the manufacture of goods, a much cheaper option for industries than buying newly manufactured plastics, which are expensive.
Table 2 shows the world’s top 10 imports of plastic waste from 2016 to 2018, 2020, and 2022. In 2016 and 2017, China and Hong Kong were the world’s largest importers of plastic waste, with cumulative amounts of around 13.24 and 12.08 million t for China and Hong Kong, respectively, followed by Germany, Japan, and the Netherlands, with cumulative amounts of around 3.54, 2.96, and 2.07 million t, respectively. It is important, however, to note that China’s leadership in waste plastic exports dates back to 1990. However, things changed completely when, in 2017, China announced a ban on foreign waste imports. With this measure, from 2018 to 2022, China completely disappeared from the ranking, and surprisingly, Malaysia began to lead imports, having imported in 2018 and 2020, respectively, around 0.87 and 0.72 million t of plastic waste. In 2022, and also surprisingly, for the very first time, Sri Lanka appeared to lead the top 10, pushing countries such as Malaysia, Hong Kong, the Netherlands, Germany, and Turkey into the first three places.

Table 2.
The world’s top 10 imports of plastic waste (10,000 tons) from 2016 to 2018, 2020,er and 2022 [59,60,62].
In the regional context, the Asian continent leads the ranking, with China, Hong Kong, Malaysia, and now Sri Lanka being the main players, followed by the European continent, where the market is led by Germany and the Netherlands, and finally by the American continent (north and south), which is being led by the USA.
The presence of countries belonging to the world’s top 10 exporters of plastic waste in Table 2 should not be seen as a surprise, and the explanation is very simple. Industrialized and economically stable countries export waste plastic as a way of getting rid of their legal and environmental responsibilities and many other factors, however, when it comes to specific plastic recycling capabilities and needs, so while they might export some plastic waste, they also import others that are useful for the consumer goods manufacturing industry.
6. The Environmental Problems of Plastic Waste
Despite the multiple positive effects provided by plastic materials to the growth of the world economy, their massive production and use, in combination with poor end-of-life waste management, has resulted in growing adverse effects on human health and the natural environment, including on climate change, marine pollution, endangering biodiversity, and chemical contamination as well as economic losses [2,3,7,8]. Plastic waste contaminates all major ecosystems on the planet, with concern increasing about its potential impacts on wildlife and human health, as smaller and more widespread plastic particles are identified in both the natural and built environment [63]. The scenario becomes critical for developing countries, especially for African countries where infrastructure for waste management such as recycling is scarce or non-existent.
One of the biggest concerns related to plastics is associated with the toxicity component. Although this concern often focuses on only two types of plastics, namely PVC and PS, experts say that, in principle, all plastics are toxic, and as is natural, some are worse than others. Preliminary data from an ongoing study indicate that there are around 16,000 identifiable chemicals of concern in plastic. Two-thirds of them have not been assessed for safety at all, a quarter are classified as hazardous in some way, while the remaining part is classified as less hazardous or not classified as hazardous but not fully assessed. Some of the chemicals described here are used as ingredients in the polymerization process, while others are additives to impart unique qualities or properties to plastic materials, such as strength, flexibility, color, etc. Some of them appear as contaminants contained in raw materials used for the production of plastics such as oil and natural gas. Unreacted monomers that stay in the final product and some accidental byproducts of production are also part of the chemicals mentioned here [64,65]. In the following subsections, the negative impacts of plastic waste in various environments are described and discussed in more detail.
6.1. Plastic Waste’s Negative Impact on the Soil and Terrestrial Environment
The vast majority of plastic waste is non-biodegradable. Non-biodegradable plastics are almost completely derived from petrochemicals produced from fossil oil, gas, and occasionally coal. It is estimated that about 300 million t of non-biodegradable plastic waste are generated annually worldwide. From 1950 to 2018, the world generated around 6 billion t of non-biodegradable plastic waste [23,66]. To date, nobody knows exactly how long non-biodegradable plastics can take to disintegrate when they are disposed of as litter in the natural environment. But there is evidence that these materials can take half a century or a millennium to decompose, having adverse effects on the terrestrial environment, especially in agricultural soils [10,67,68].
When discarded in the terrestrial environment, plastic wastes have great potential to cause seasonal flooding and proliferation of mosquitoes and pests, as they block drainages, waterways, land spaces, and pipes [27,69]. Poor disposal of plastic waste is also pointed out as being responsible for the emergence and transmission of vector-borne diseases and toxic chemicals, including persistent organic pollutants. Plastic waste, in addition to harming the beauty and visibility of urban centers, also interferes negatively with the biogeochemical cycle of terrestrial ecosystems [22,70,71].
The presence of plastic waste in the soil can negatively affect crucial soil properties such as porosity and soil binding properties due to possible soil aggregation and changes in the dynamics of water contained in the soil. The problem becomes even more complex when plastic waste is present in the form of microplastics. As is very well known, microplastics contain toxic additives and hazardous contaminants, including polybrominated diphenyl ether (PBDE), perfluorochemicals (PFOS), and heavy metals like copper, zinc, and lead, so the interaction of these particles with the soil matrix can contribute to the degradation of soil fertility by affecting the growth of earthworms and other useful microorganisms [56].
6.2. Plastic Waste’s Negative Impact on Water Sources and the Marine Environment
Reliable data on the actual amount of plastic material that enters the ocean, including the mechanisms of its transport and distribution in the ocean and the respective sources of origin, are still scarce. However, there is very strong evidence that on a global scale, the amounts of plastic entering the ocean are very high. As mentioned previously, estimates indicate that the ocean receives annually between 7 and 13 million metric t of plastic waste, coming from both high- and low-income countries. If the situation continues at this rate, the global accumulated amount of plastic waste in the ocean will be equal to the amount of fish by 2035 [7,14], and there will be more plastics (by weight) than fish by 2050 [8]. The marine environment is estimated to already contain over 150 million t of plastic [72], of which around 250,000 t are fragmented into 5 trillion micro- (less than 5 mm) or macro-plastic particles [73].
Statistical data derived from [15] show very interesting ocean pollution facts:
- (a)
- About 75 to 199 million tons of plastic waste are in our oceans.
- (b)
- There are around 33 billion pounds of plastic waste entering the marine environment every single year.
- (c)
- By 2050, plastic waste will likely outweigh all fish in the sea.
- (d)
- Almost 1000 species of marine animals are impacted by ocean pollution, and over 500 locations are recorded as dead zones where marine life cannot exist.
- (e)
- About 17% of the species affected by plastic in the ocean are on the International Union for Conservation of Nature Red List of Threatened Species.
- (f)
- Around 80% of global marine pollution comes from agriculture runoff, untreated sewage, and discharge of nutrients and pesticides.
- (g)
- The oceans absorb as much as a quarter of all artificial carbon emissions, which changes the pH of surface waters and leads to acidification.
- (h)
- Around 20% of the ocean’s plastic waste pollution comes from industrial fishing.
- (i)
- Between 1950 and 1998, over 100 nuclear blast tests occurred in the oceans.
- (j)
- If current trends continue, ocean plastic pollution will triple over 40 years, with waste exceeding one billion t.
- (k)
- Ocean pollution affects more than 817 animal species worldwide.
- (l)
- Marine plastic waste pollution has affected 100% of marine turtles, 59% of whales, 36% of seals, and 40% of seabird species.
- (m)
- Only 1% of marine litter floats. Everything else sinks to the sea floor.
- (n)
- Approximately 5000 items of marine plastic pollution have been found per mile of beach in the UK.
- (o)
- About 500 marine locations are now recorded as dead zones globally, currently the size of the UK’s surface (245,000 km2).
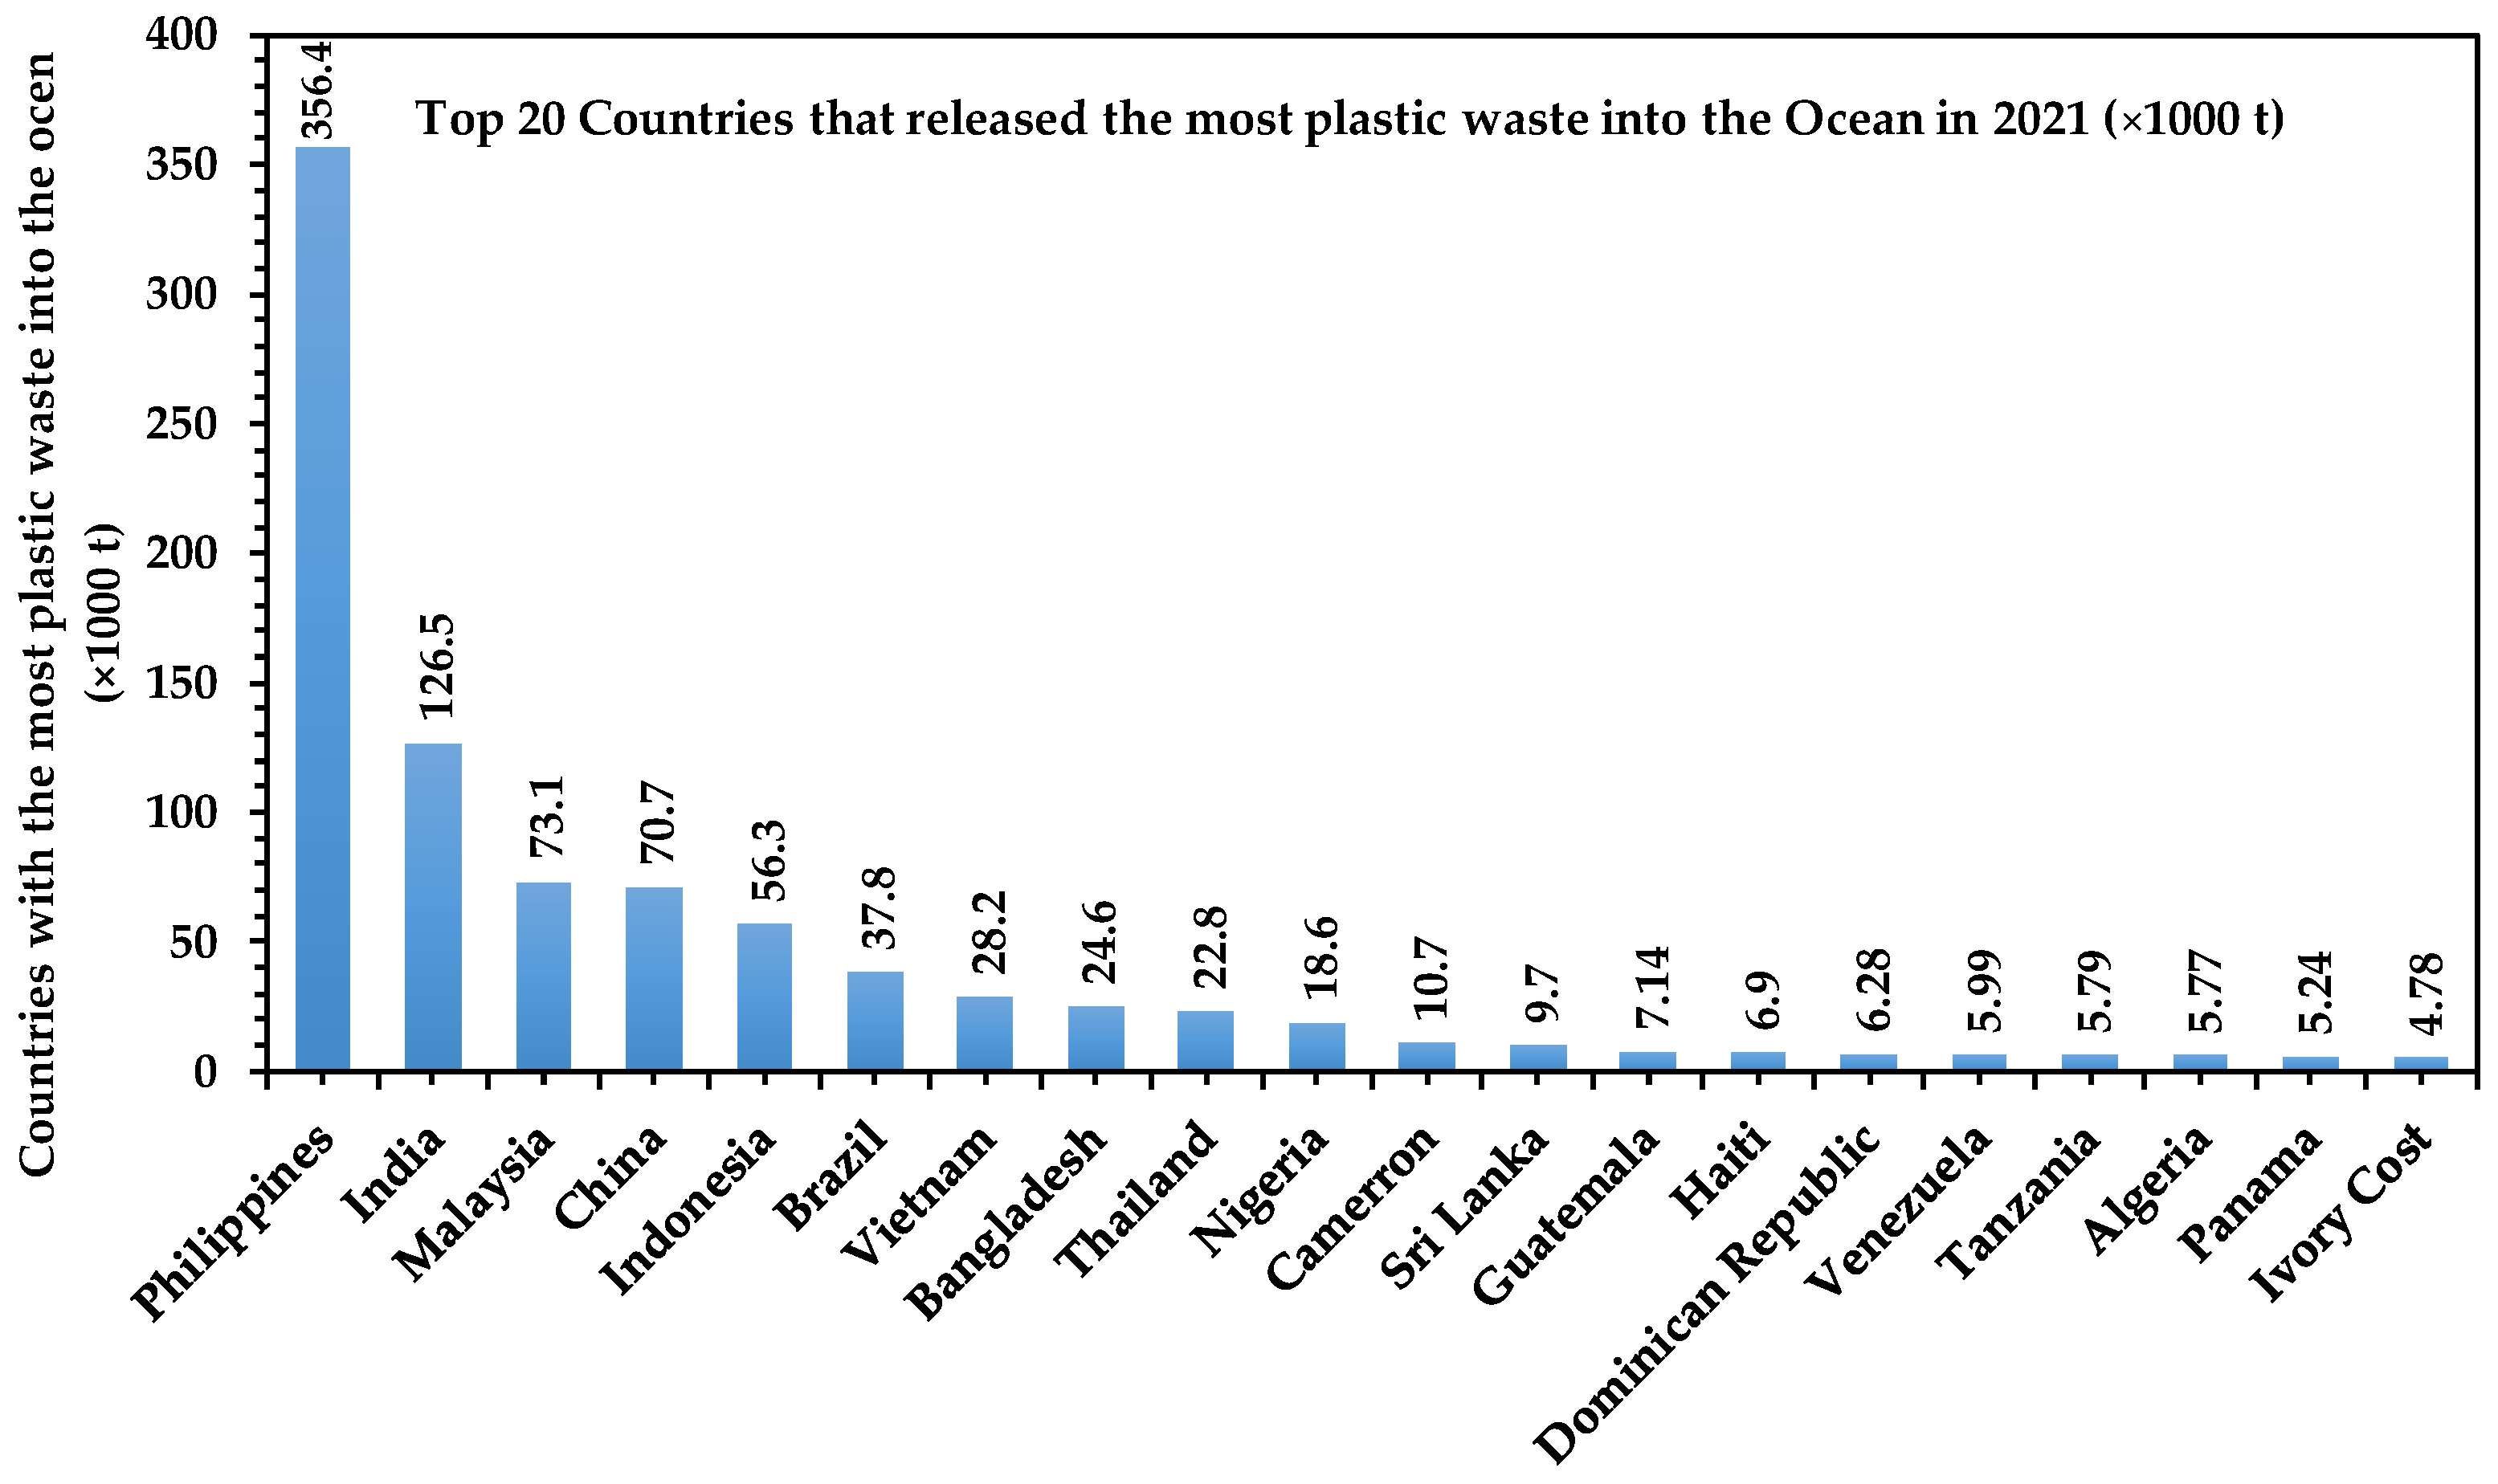
Figure 11 shows the top 20 countries that released the most plastic waste into the ocean in 2021, in thousands of t. The Philippines introduced more plastic waste into the ocean than the 19 other countries, reaching around 356.4 thousand t. From the figure, it is clear that Asian countries, in particular the coastal ones, were responsible for the highest quantities of plastic pollution in the ocean, with the Philippines, India, Malaysia, China, and Indonesia among the worst culprits. The data presented here corroborate research carried out in 2017 and 2021, which concluded that 80% of mismanaged plastic in the ocean came from Asian countries such as China, Thailand, Vietnam, Indonesia, and the Philippines [49].
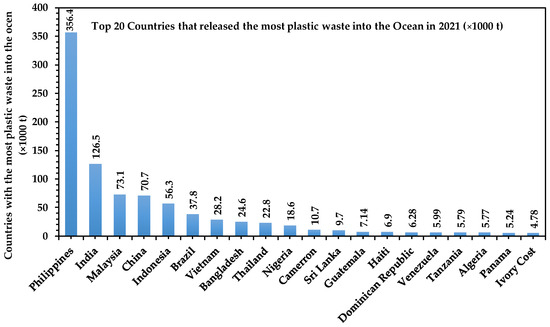
Figure 11.
Top 20 countries that released the most plastic waste into the ocean in 2021, in thousands of t. Source: authors’ own elaboration based on data obtained from reference [15,49].
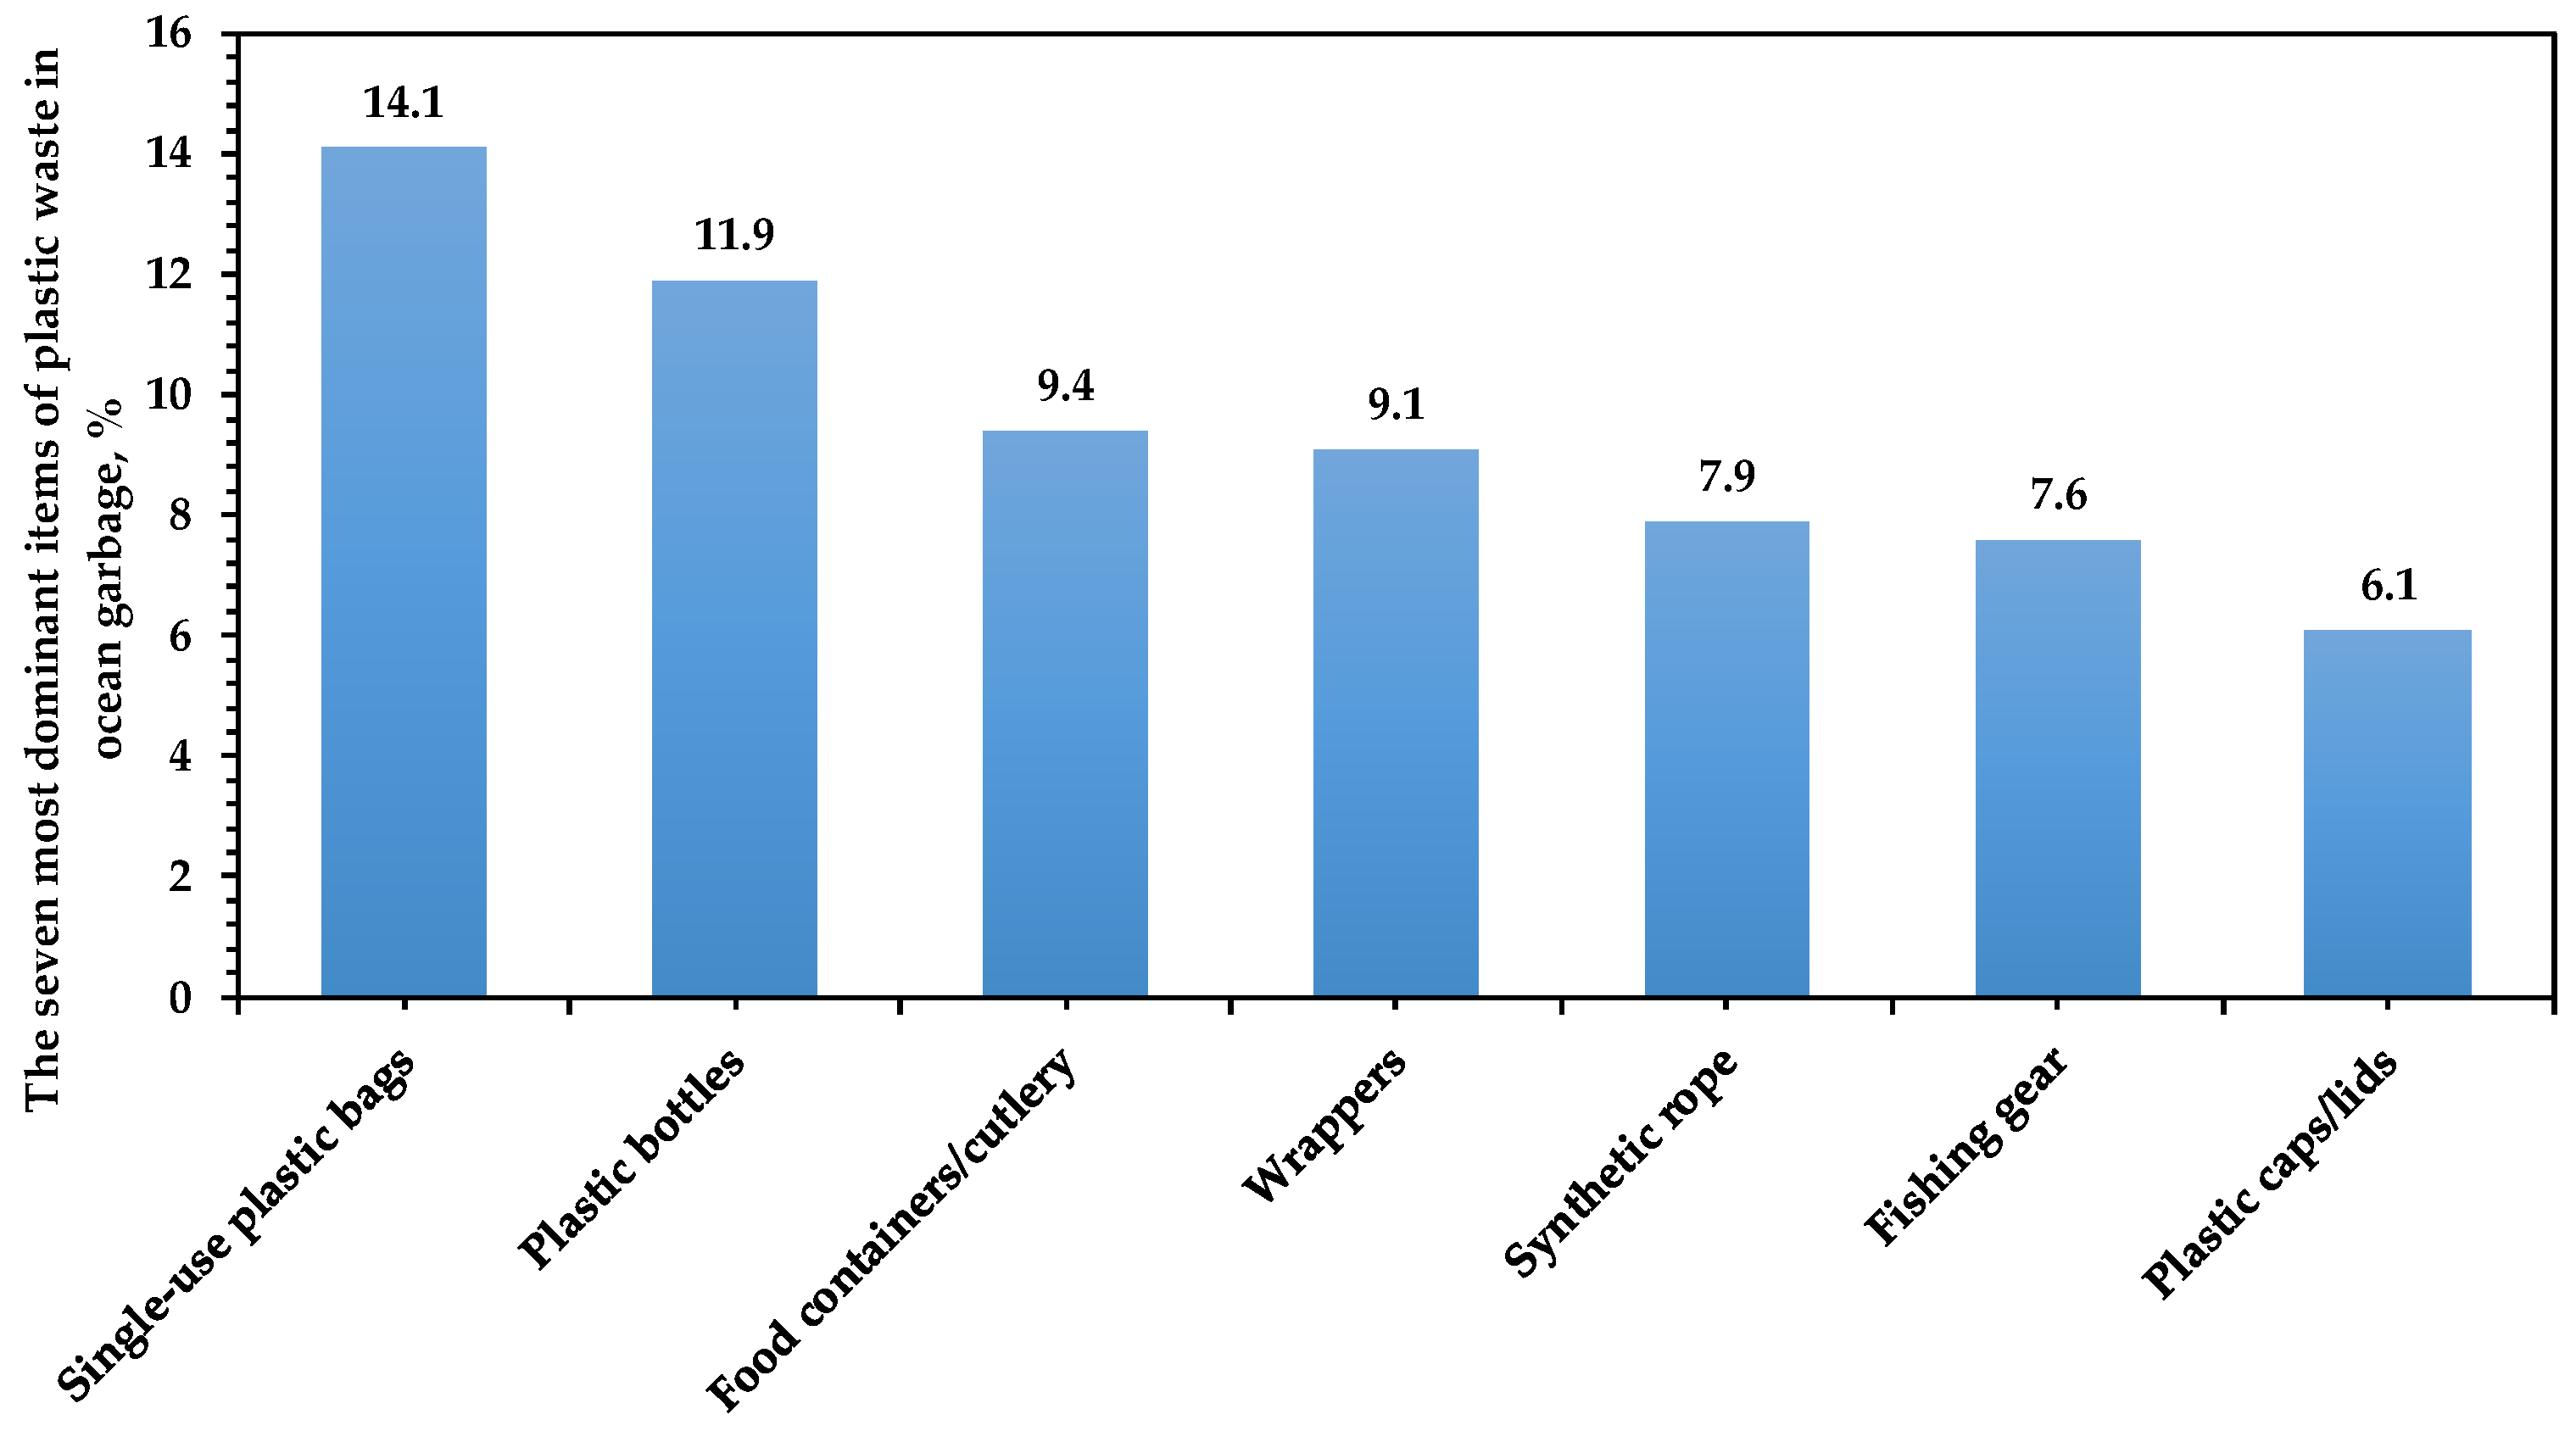
It is important to note that a large part of ocean pollution comes from plastic waste, estimated at almost 66% of the total. The remaining portion is from chemical pollution, oil spills, thing pollution, and climate change. Figure 12 shows the seven most dominant items of plastic waste in ocean garbage. The data show that single-use plastic bags and plastic bottles are the items that share the largest portion of plastic waste that ends up in the oceans.
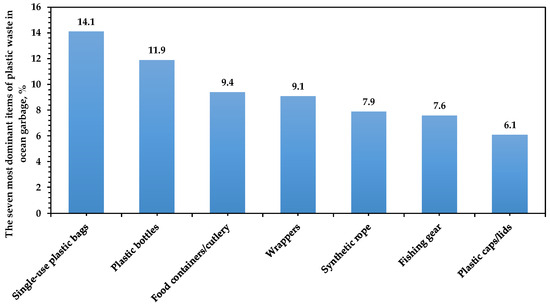
Figure 12.
The seven most dominant items of plastic waste in ocean garbage. Source: authors’ own elaboration based on data obtained from reference [15].
The main sources of more than 80% of the plastic that enters the ocean are land-based sources such as rivers, groundwater run-off, combined municipal sewer overflows, cluttering, wastewaters from industries, solid waste disposal and landfills, fisheries, aquaculture, commercial cruise or private ships [13,74], wind, rain, and floods. However, rivers are the biggest carriers of plastic into the oceans. A study carried out by Meijer and colleagues [75] used a modelling approach, which included geographically distributed data on plastic waste, land use, wind, precipitation, and rivers. By calculating the probability for plastic waste reaching a river and subsequently the ocean, the group found that more than 1000 rivers, including small urban rivers, account for 80% of global riverine plastic emissions annually.
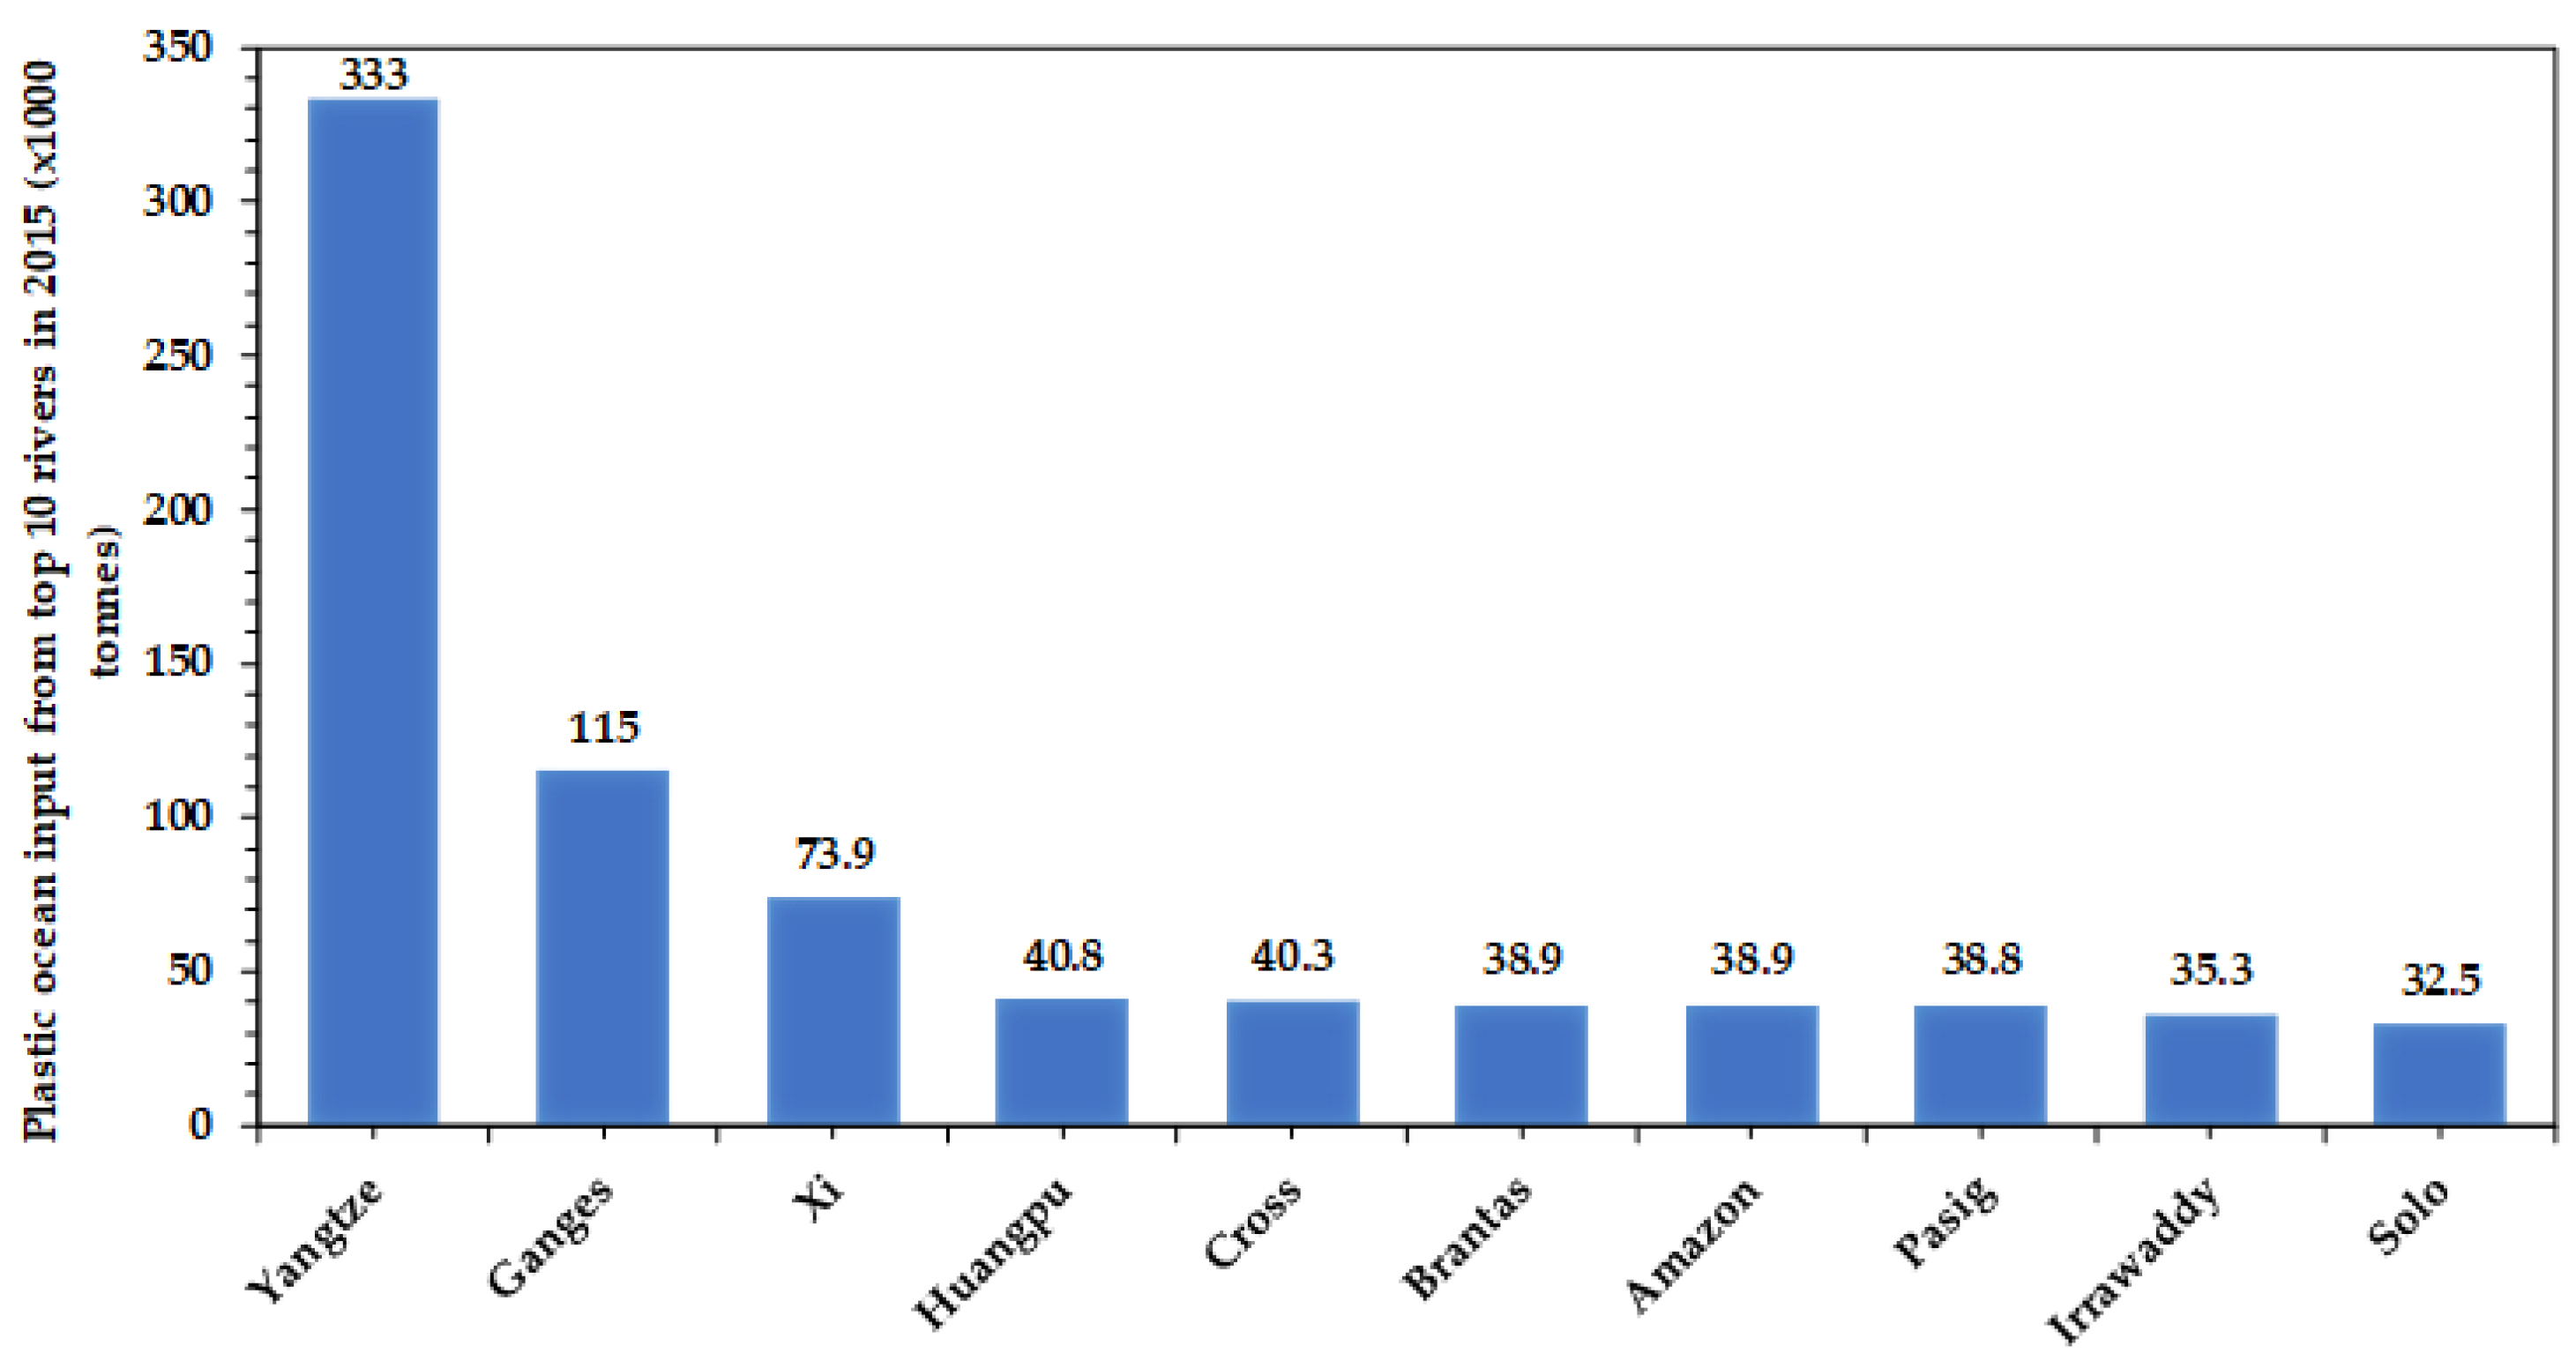
A recent study [56] presented the top 10 rivers in the world that throw the most plastic waste into the ocean and the contribution from different continents in 2015. The rivers that make up the top 10 include (a) Yangtze (China), (b) Ganges (India and Bangladesh), (c) Xi (China), (d) Huangpu (China), (e) Cross (Nigeria, Cameroon), (f) Brantas (Indonesia), (g) Amazon (Brazil, Peru, Colombia, Ecuador), (h) Pasig (Philippines), (i) Irrawaddy (Myanmar), and (j) Solo (Indonesia). Figure 13 shows the respective numbers, in kilo t. From the figure, it is clear that the rivers that flow in Asian countries are the ones that dump the most waste plastic into the ocean and that contribute more to marine pollution than other rivers.
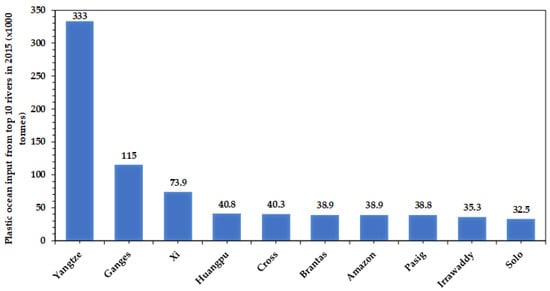
Figure 13.
Plastic Ocean input from top 10 rivers in 2015, in kilo t. Source: authors’ own elaboration based on data obtained from reference [56].
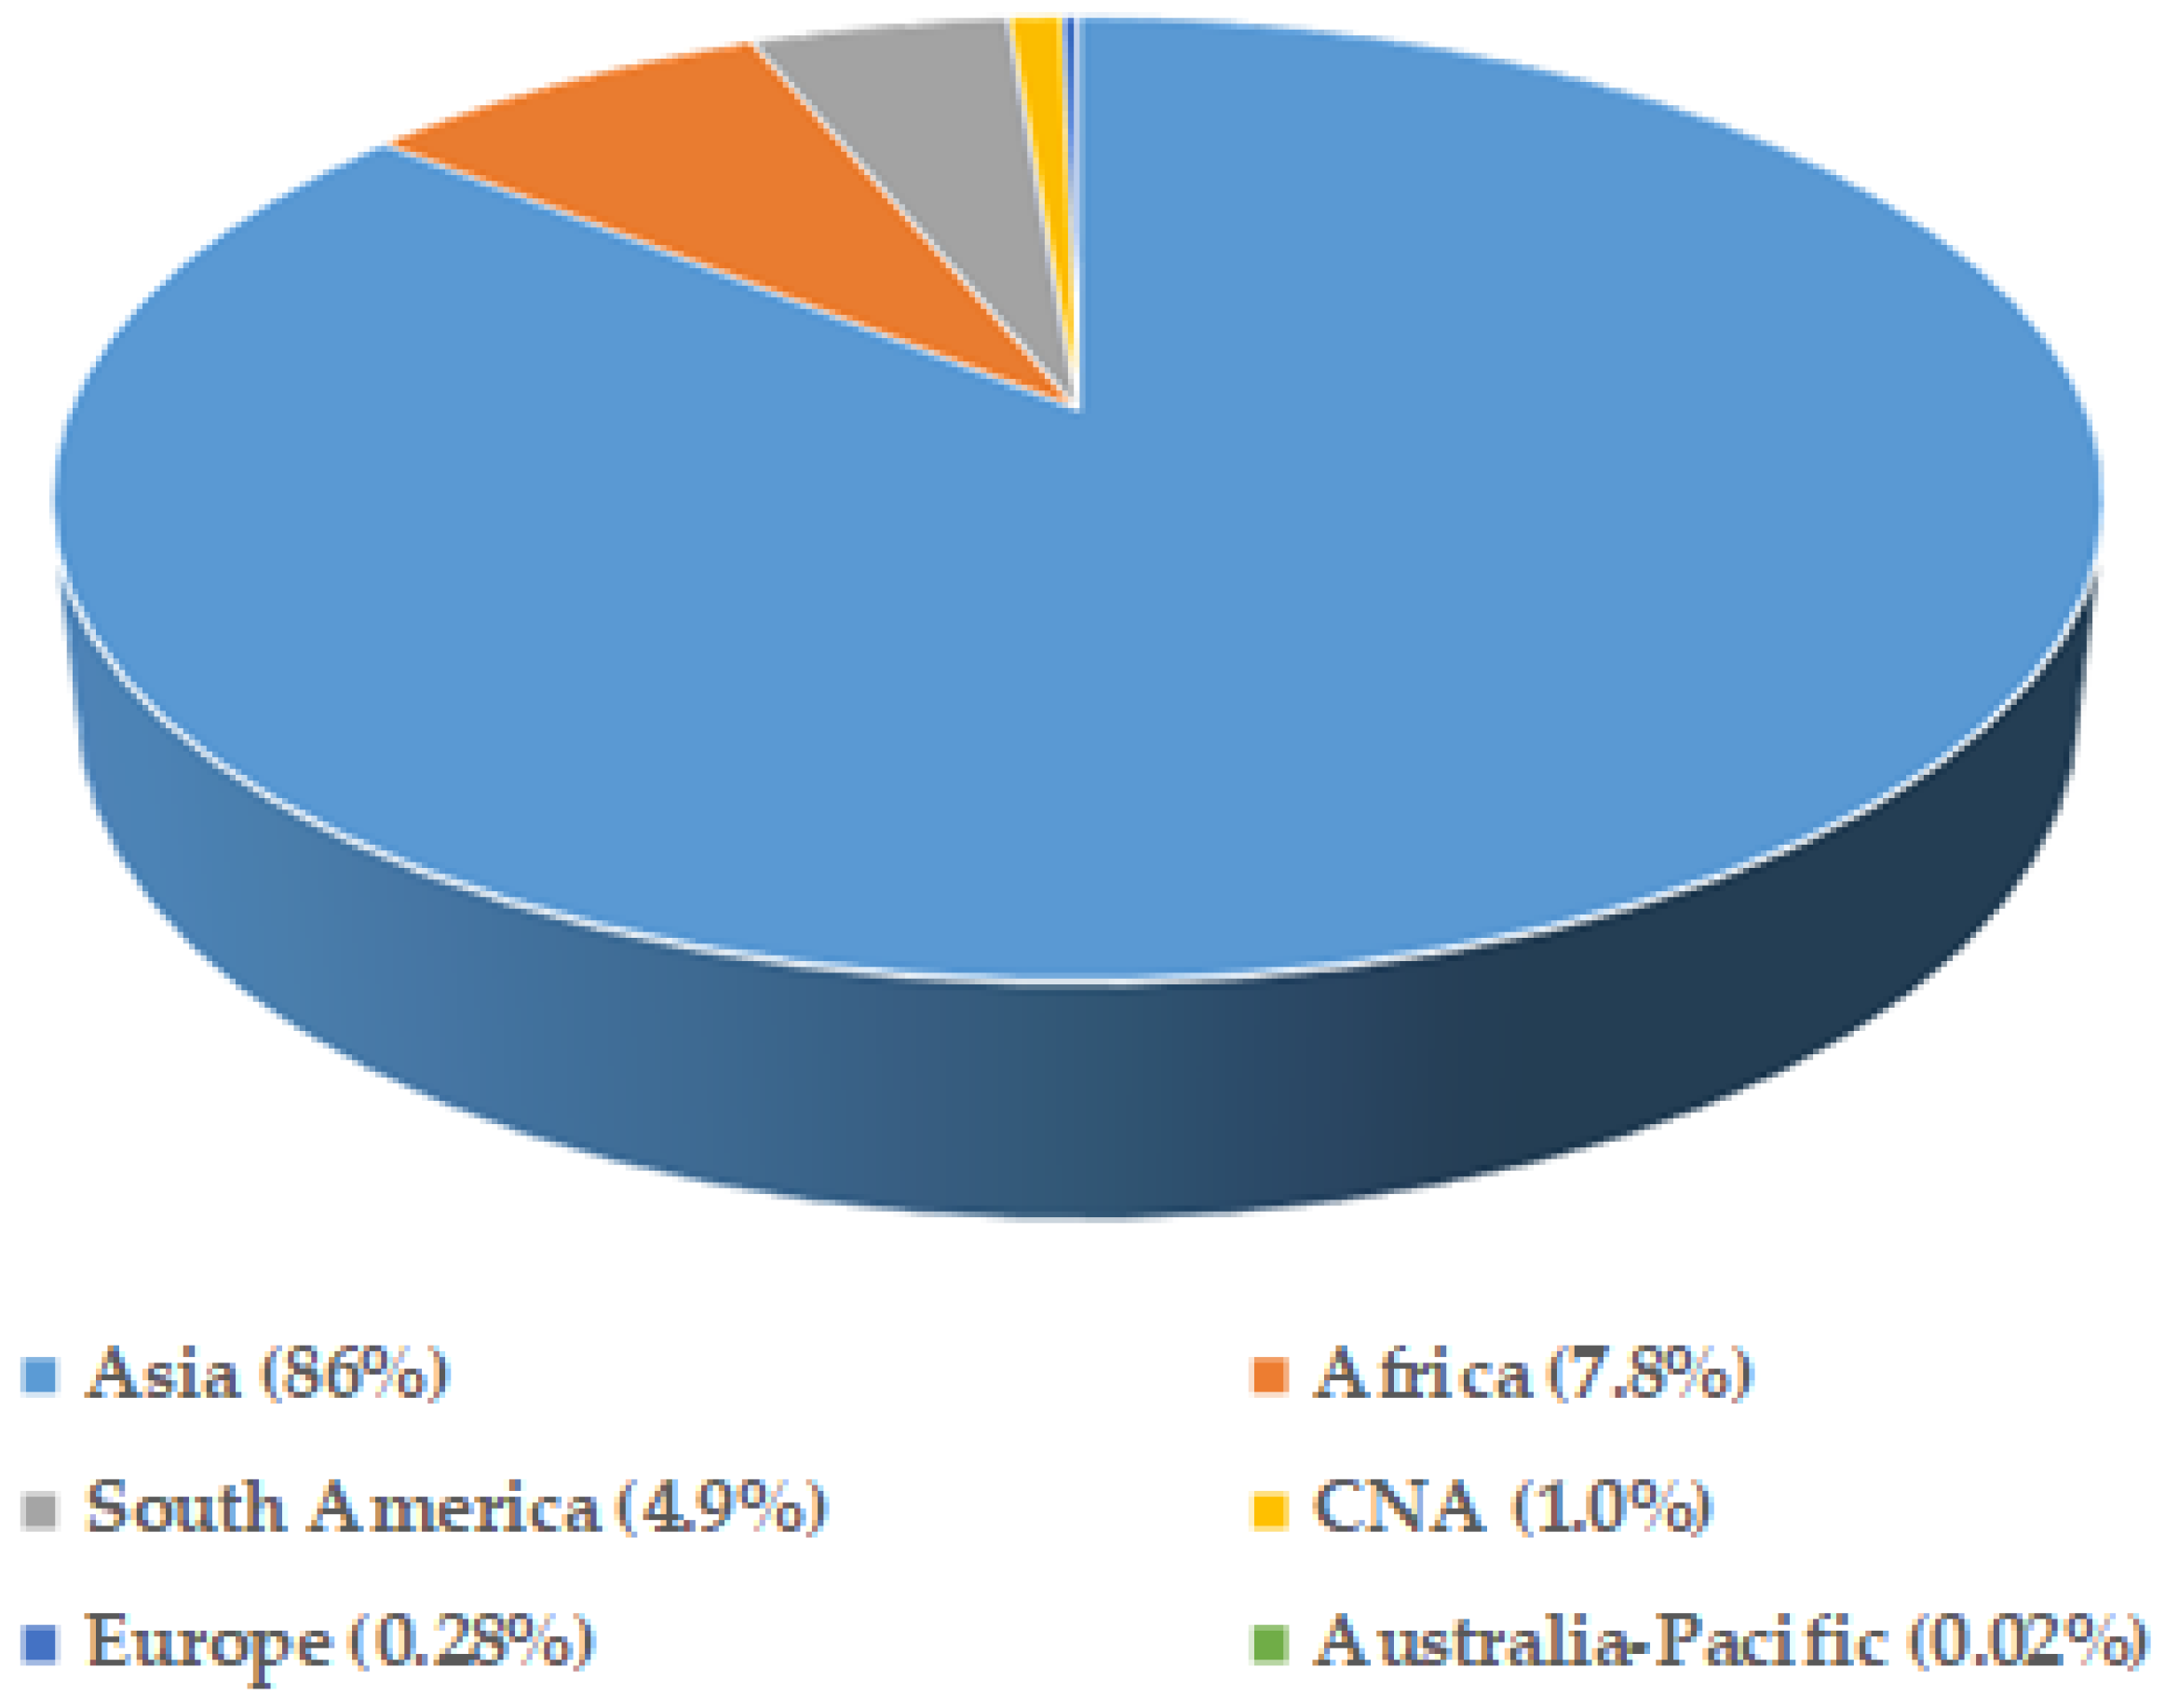
Figure 14 shows Plastic Ocean input from rivers in the regional context in 2015. As can be seen, the scenario has not changed. The rivers of the most populous continent in the world injected more plastic waste than all other regions combined, having reached 86% of the total, followed by Africa, South America, Central and North America, Europe, and Australia-Pacific, with 7.8%, 4.8%, 0.95%, 0.28%, and 0.02%, respectively [56].
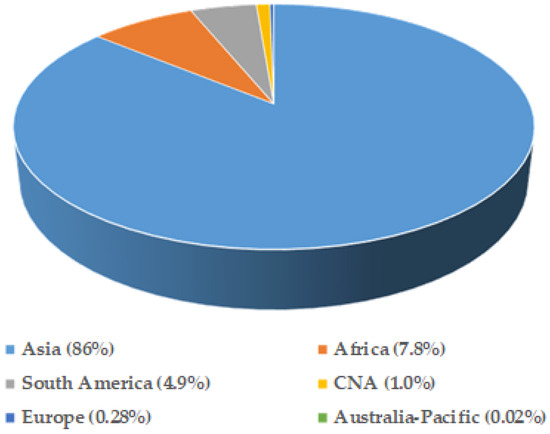
Figure 14.
Plastic Ocean input from rivers in the regional context in 2015 (in %). Source: authors’ own elaboration based on data obtained from reference [56]. (CAN—Central and North America).
A recent study estimates that more than 109 million metric t of plastic waste has accumulated in rivers worldwide [52], a clear demonstration that if the current trend continues, the leakage into the ocean will increase drastically for decades to come, even if mismanaged plastic waste could be significantly reduced. Since plastic materials may contain a variety of harmful chemicals such as polychlorinated biphenyls, polychlorodibenzofurans, quaternary ammonium compounds heavy metals, etc., if their wastes are not properly disposed of, they can release toxic substances into the soil. Over time, these toxic substances could flow into groundwater or be carried away by rain or wind and pollute other surrounding water sources such as rivers, oceans, lakes, streams, etc. The direct implications of this scenario are the negative impacts on organisms that directly depend on these water sources, such as humans, animals, and plants [8], as well as on the overall sustainability of fisheries.
The presence of plastic wastes in aquatic environments such as oceans and rivers leads to suffocation and prevents the free movement of aquatic organisms like fish, seabirds, turtles, mussels, crustaceans, and sea mammals [75,76]. In the specific case of marine fauna, the scenario is of great concern. About 700 marine species are believed to be interacting with plastic waste [77]. Ecological and aesthetic damage, including losses in coastal tourism revenue, are also associated with marine plastic litter [6,78,79].
6.3. Plastic Waste’s Negative Impact on Air Pollution
The air we breathe is one of the most precious assets on planet Earth. Without it, the existence of living beings would be impossible. However, in recent decades, air pollution has been one of the biggest threats to human health. Recent studies, including those from the World Health Organization, indicate that seven million people die from air pollution every year, and it is estimated that 92% of the global population breathe toxic air. Around the world, the Bahamas have the cleanest air, while Bangladesh has the worst air quality [54]. This scenario makes it clear that billions of people suffer from the effects of poor air quality.
Waste plastic is also one of the materials that most contributes to air pollution. In many countries around the world, especially low-income ones, burning solid waste in open environments is a common practice. The burning of solid waste, including plastics, is often used as an alternative method to waste management, a situation motivated by the lack of appropriate solid waste management infrastructure such as recycling as well as the need to overcome landfill challenges such as land occupancy and soil fertility [80]. Poor families in developing countries burn plastic to use it as an energy source for cooking or heating purposes. However, sometimes the burning of plastic waste in many urban centers happens as a result of stubbornness and sabotage by the people.
Unfortunately, this practice happens without the slightest notion of the side-effects arising from the combustion process of plastic materials. The incineration of plastic waste in an open field is a major source of air pollution. The burning of plastics releases into the atmosphere harmful chemicals such as dioxins, polycyclic aromatic hydrocarbons (PAHs), furans, mercury, ammonium substances, PVC, soot, solid residue ash, and polychlorinated biphenyls, substances that possess a high potential to negatively impact vegetative systems, human and animal health, and the environment as a whole. Depending on the prevailing atmospheric conditions, the released substances resulting from the combustion of plastic wastes can travel thousands of kilometers and reach other more distant locations [8,81,82]. The wind is the main medium responsible for depositing the emissions of particulate plastic material into the atmosphere, for example, from farms through soil dust during agricultural processes. Particulate plastic material can also reach the atmospheric environment from seawater, also carried by air. This happens when plastic particles are sitting on the top layer of the seawater where they are tossed into the air by sea waves [83].
The direct implications resulting from the scenarios described above are the negative impacts on human and animal health and the environment as a whole. According to a pilot study of beach recreation [84], during the PVC combustion process, for example, hazardous halogens are released, with great potential to affect negatively the air. The burning of polystyrene releases toxic gases with a negative impact on the nervous system, while the hazardous brominated compounds act as carcinogens and mutagens. On the other hand, dioxins, which are lethal persistent organic pollutants, associated with the worst components, such as 2, 3, 7, 8 tetrachlorodibenzo-p-dioxin, can settle on crops and in waterways, where they may eventually migrate up the food chain and cause catastrophic effects on human health.
6.4. Plastic Waste and Greenhouse Gas Emissions
The greenhouse effect is a natural process that occurs when certain gases present in the atmosphere, such as carbon dioxide (CO2), methane (CH4), and water vapor (H2O), retain part of the solar radiation reflected by the Earth’s surface. The greenhouse effect is an essential natural process to keep the planet at a desirable temperature for the beings that live on it. Without the greenhouse effect, planet Earth would be extremely cold, making life unviable for many species. However, the excessive emission of these gases into the atmosphere intensifies the greenhouse effect, making it difficult to release heat into space, resulting in global warming and climate change. At a global level, the largest emitters of gases that intensify the greenhouse effect result from anthropogenic activities, and these include (a) combustion of fossil fuels; (b) deforestation; (c) livestock activities; (d) agricultural activities; (e) decomposition of organic waste; and (f) industrial activities. A large part of CO2 emissions, one of the most common greenhouse gas (GHG) emissions, results from the combustion of fossil fuels, such as coal and oil. CH4 gas, with 20 times more power to raise temperatures than CO2, comes from activities linked to landfills, dumps, and livestock farming. N2O, with the potential to increase temperatures by 265 times more than CO2, results from agricultural activities such as soil cultivation, use of nitrogen fertilizers and waste treatment. Fluoridated gases resulting from industrial activities include hydrofluorocarbons, used in cooling and refrigeration systems; sulfur hexafluoride, used in the electronics industry; perfluorocarbon, emitted in aluminum production; and chlorofluorocarbon (CFC), which causes a hole in the ozone layer. In turn, water vapor, whose concentration varies with atmospheric temperature, is the main GHG. It also contributes to the greenhouse effect by forming clouds that then retain heat [84].
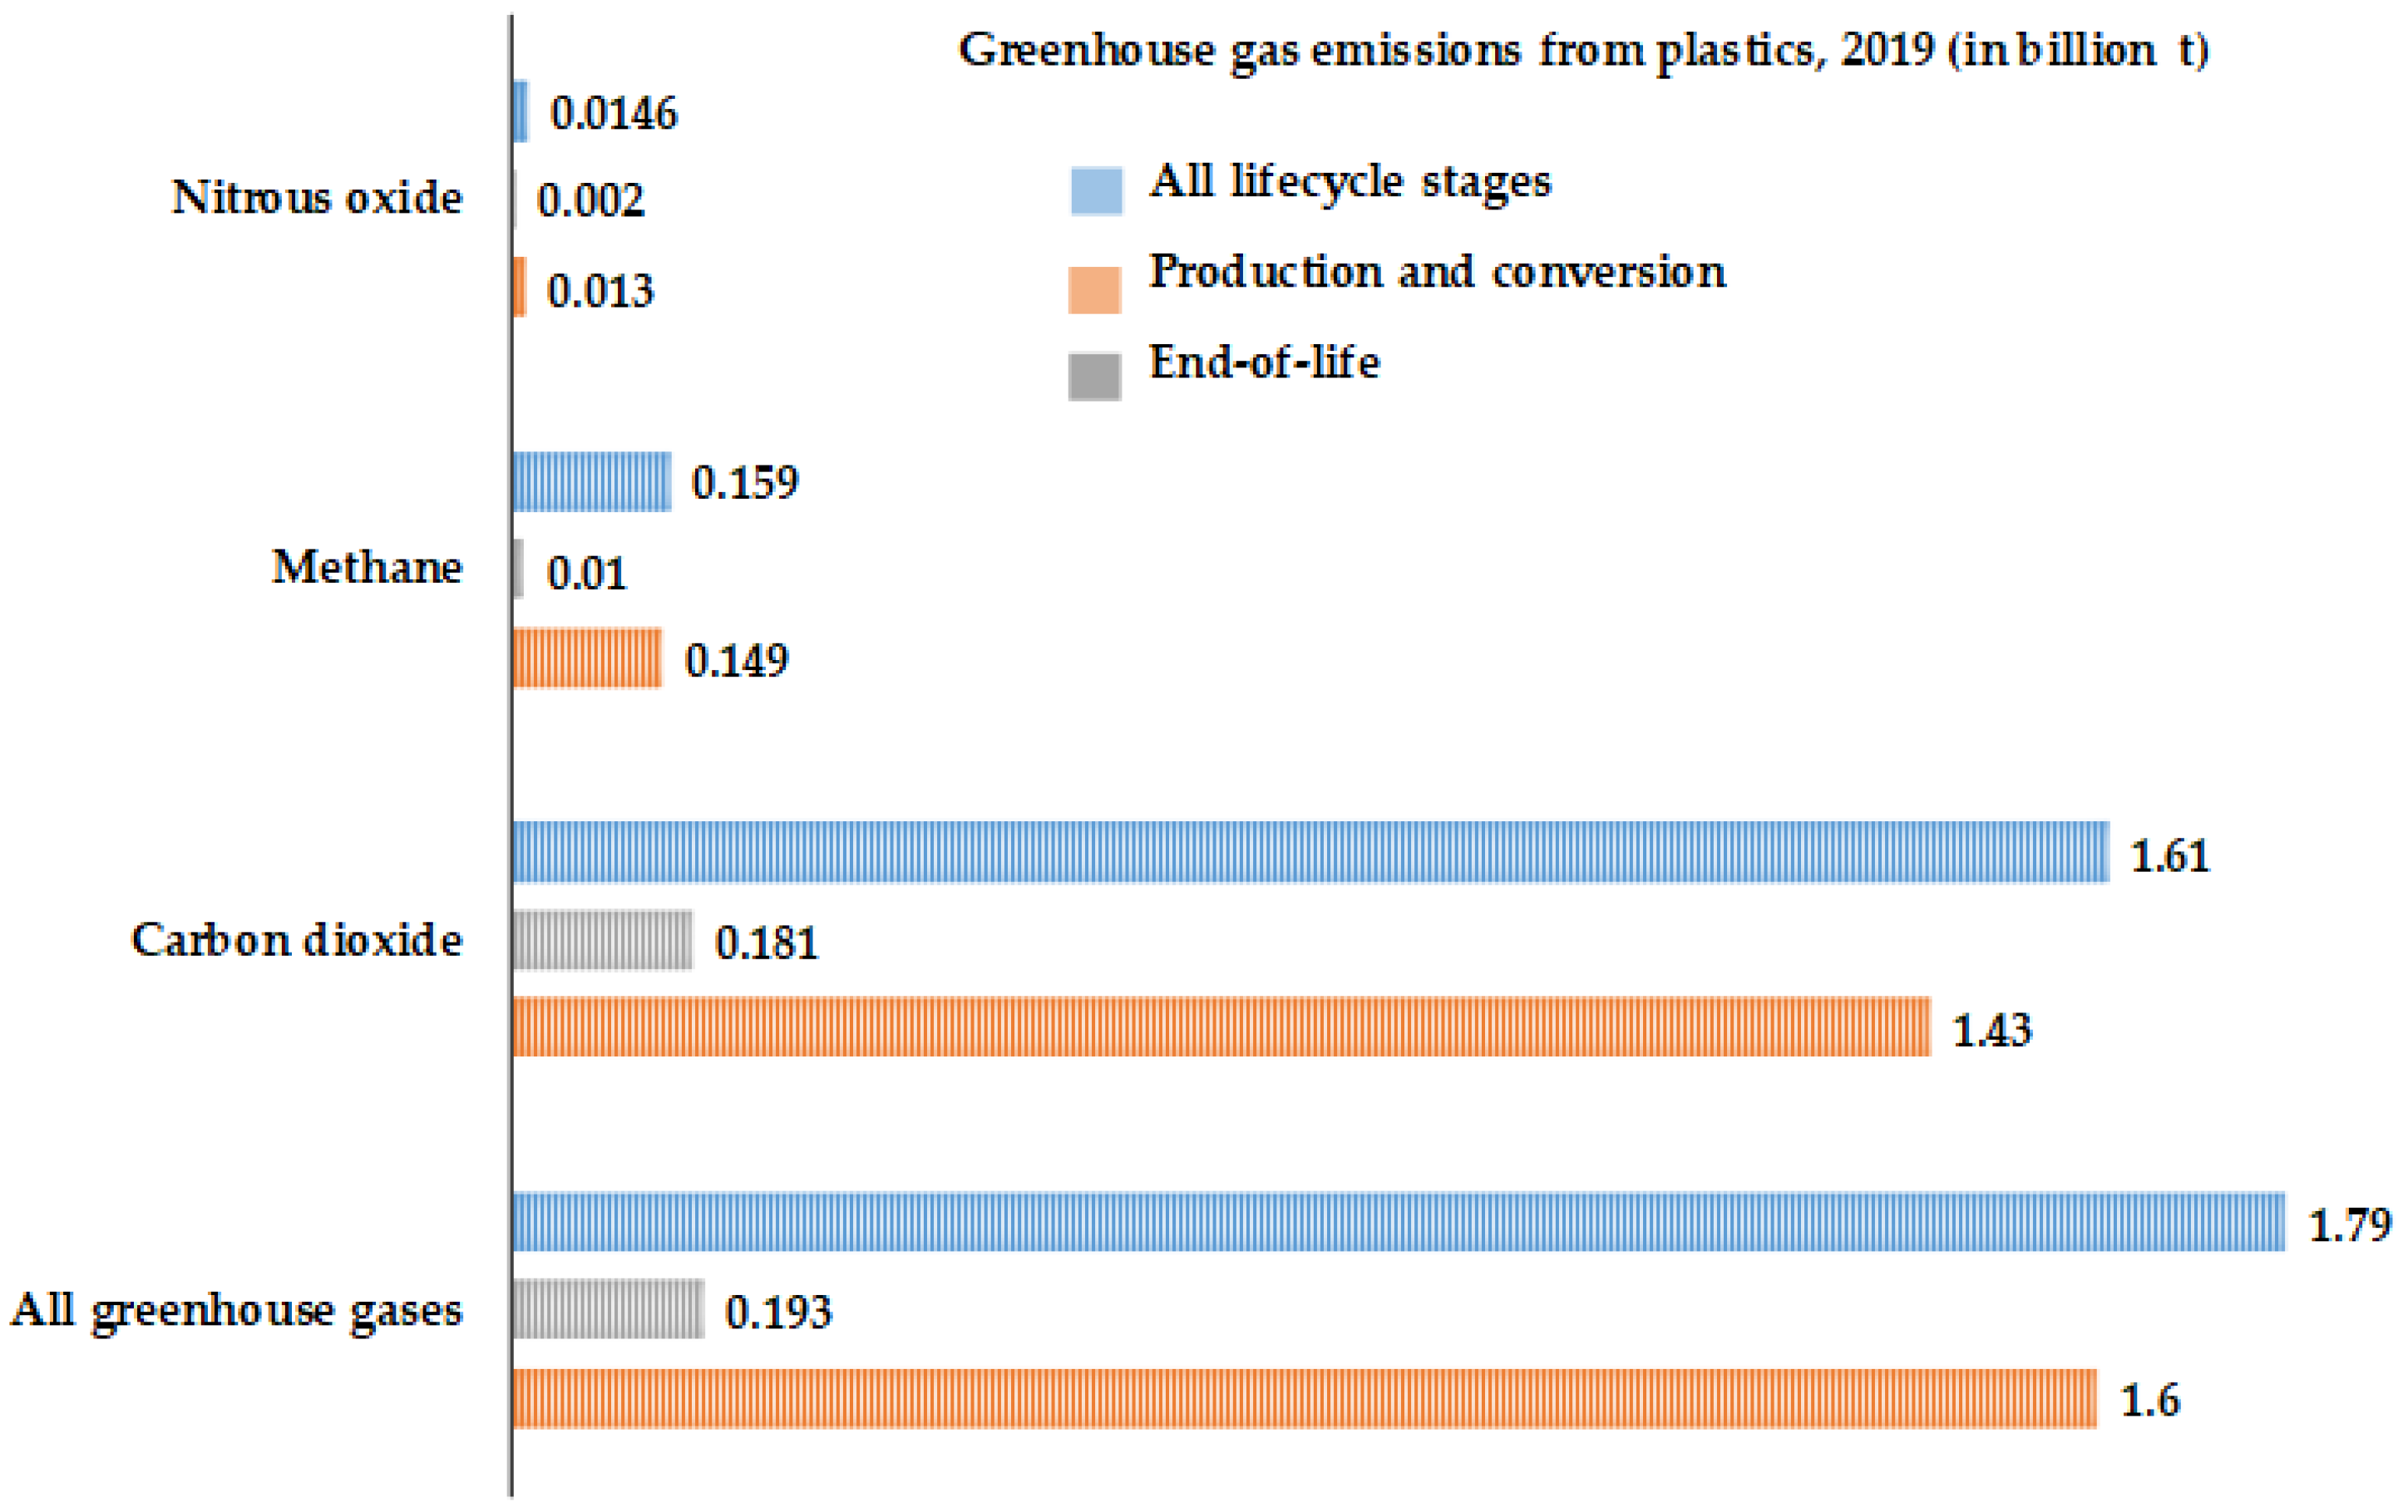
In addition to contaminating oceans, rivers, animals, and humans, plastic also contributes to climate change, and the explanation for this scenario is very simple, as 99% of what makes up current plastic materials comes from fossil fuels. The main greenhouse gas emissions occur throughout the lifecycle of plastic materials, which includes resin production, conversion, and end-of-life phase. The end of life of plastic materials includes disposal in landfills and incineration. Figure 15 shows the greenhouse gas emissions (in billion t) from plastics in 2019 that occurred at all lifecycle stages of the plastic materials. As can be seen from the figure, the production and conversion phases (orange bars) are the phases with the highest emissions when compared to the end-of-life phase (grey bars). The explanation for this scenario is simple; resin production is the phase in which the most emissions are produced, estimated at around 61%, a percentage that can be achieved mainly when virgin polymers are processed. The conversion phase contributes 30% and the end of life around 9% [5]. That is, the production and conversion phases together contribute 91%.
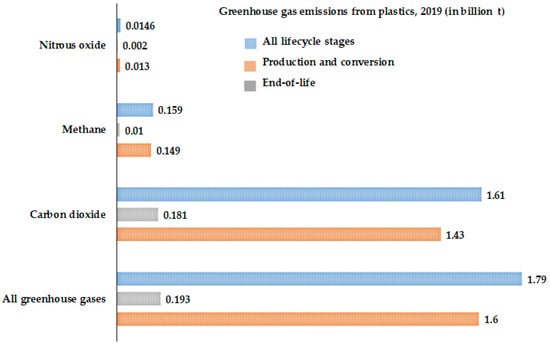
Figure 15.
Greenhouse gas emissions (in billion t) from plastics in 2019 (emissions measured in t of carbon dioxide-equivalents (CO2-e). The numbers that appear in the figure mean billions of t of greenhouse gas emitted. Source: authors’ own elaboration based on data obtained from references [85,86].
The above observations clearly show that GHG emissions from the plastics industry will continue. In fact, environmental experts argue that at the current rate of growth in the global demand for plastics, by 2050, 15% of GHG emissions (around 6.5 Gt of CO2-e) will come from this industry alone, compared to the current 3.5%, equivalent to 1.7 Gt of CO2-e [5].
6.5. Plastic Waste’s Negative Impact on Animals
Improper disposal of plastic wastes associated with their harmful chemicals also has a negative impact on animals’ health. Millions of animals, from terrestrial to aquatic, are killed by plastic wastes annually. Land animals such as cattle, sheep, and goats, and aquatic animals like fish, dolphins, turtles, seabirds, mussels, crustaceans, and sea mammals, have been reported to die after ingesting plastics, which become entangled in their stomachs [22,87]. The situation is more critical in the marine environment. While Gall and Thompson [77] believe that about 700 marine species are currently interacting with plastic waste, Jambeck and co-workers [14] projected that marine litter may harm almost 600 species by 2050; 90% of seabirds will be under threat due to plastic ingestion, and approximately 15% of the marine species come under endangered categories because of the ingestion and entanglement of plastics.
Animals are exposed to plastic debris via ingestion and entanglement, ingestion being the most common way. Marine animals, for instance, ingest plastic debris because they mistake it for food. Since plastic wastes contain toxic chemicals, including persistent organic pollutants, the ingestion of plastic could be very deadly for marine species. Excessive ingestion of plastic makes the animal’s digestive system become blocked, leading to starvation. The massive presence of plastic in the sea reduces the free movement of aquatic organisms to search for food or to escape from their predators, a situation that sometimes leads to mortalities by hunger or by predators. The massive presence of plastic waste in the sea may also make aquatic species become trapped, creating injuries and infections in them due to the abrasiveness of the plastic particles [13,88]. In addition, the presence of plastic waste in aquatic environments is responsible for decreasing the amount of light penetrating the water as well as the amount of oxygen content in the subsurface, which are extremely important factors for the aquatic species that inhabit there.
6.6. Plastic Waste’s Negative Impact on Human Health
The life of human beings is largely sustained by four different spheres, namely the atmosphere, lithosphere, hydrosphere, and biosphere. It is from these spheres that food is produced, where the breathed air comes from, as well as other products that provide for the well-being of societies. From here, it is clear that any environmental threat to these four spheres will pose direct threats to human health. Plastic waste pollution poses serious risks to human health. For instance, the toxins released from plastic waste combustion could increase the risk of heart diseases and aggravate respiratory ailments such as asthma and emphysema [82,89,90,91]. Moreover, plastics can have various negative effects on human health, including endocrine disruption. Some types of plastics contain chemicals called endocrine disruptors, which can interfere with the body’s hormonal balance. These chemicals can mimic hormones or block their function, leading to a variety of health problems such as developmental disorders, reproductive issues, neurological disorders, obesity, and increased risk of certain cancers [92,93,94,95]. Toxins can also damage the kidney, liver, reproductive and nervous system, skin, and cause rashes, nausea, headaches, and possibly death [22,96,97]. In addition, plastic waste blocking drainages, waterways, land spaces, and pipes, which are responsible for seasonal flooding, also poses a threat to human health, as residents are at risk of catching malaria as a result of mosquito bites in malaria-prone areas or they can become infected by water-borne diseases such as diarrhea [98,99].
One of the major concerns for the World Health Organization (WHO) regarding the plastic pollution issue is related to the possible chemical bioaccumulation in the food chain, with great potential to pose a threat to human health. It is believed that humans are exposed to plastic chemicals via the consumption of sea and terrestrial food products, drinking water, and the air. Chemicals derived from plastic particles have been found in human blood, seafood such as fish and shellfish [100,101,102] and terrestrial animals such as cows and pigs [103], in tap water and bottled water, as well as sea salts [8,104], where in some cases, it is not even known exactly the mechanism by which the particles entered such products.
6.7. Microplastic Particles: An Emerging Threat to the Environment and Human Health
One of the emerging problems related to plastic is associated with its very small fragments, which are generated from the breakdown of mismanaged waste. Given their synthetic nature, plastics do not decompose completely. Over time, they continually fragment into smaller and smaller pieces, commonly called microplastics [83]. Microplastics are plastic particles which contain less than 5 mm in diameter, including nanoplastics, which are less than 0.1 μm [105].
As for the source of origin, microplastics can be categorized into two main families, namely primary and secondary microplastics. Primary microplastics are originally manufactured in a particular size for specific applications, which include pellets used to manufacture plastic products and microbeads that are used in cosmetic, personal cleansing, and household products [106]. Fragmentation into smaller and smaller pieces by photochemical, mechanical, and biological processes, typical of non-biodegradable plastics, whether in the terrestrial or marine environment, results in secondary microplastics. Synthetic fibers released by wastewater resulting from washing clothes and discarding the wastewater in terrestrial or aquatic environments are also part of secondary microplastics [107].
Microplastics are found in the regular cycles of the four different spheres of the earth, circulating around the planet like air or water. Microplastics have been found in underground water streams [108], in deep ocean waters [109], in the atmospheric environment, in the blood of farm animals, including cows and pigs [103], etc. Ocean and riverine systems, urban dust, civil runoff, tires, road wear particulates, and recently the atmosphere have been highlighted as diffuser sources and transporters of microplastic pollution [14,110,111,112]. Microplastics can travel thousands of miles in the open sea and, depending on their degree of degradation, they can remain at various depths of the ocean surface [113]. There are many sources of microplastics, but the main and best known and identified to date include [29]:
- (a)
- Industrial abrasives;
- (b)
- Specific medical products;
- (c)
- Personal care and cleaning products;
- (d)
- Drilling fluids;
- (e)
- Plastic resin pellets;
- (f)
- Packaging;
- (g)
- General littering;
- (h)
- Plastic waste dumping;
- (i)
- Discarded fishing gear;
- (j)
- Abrasion in landfill and recycling sites and facilities;
- (k)
- Abrasion of vehicles tires;
- (l)
- Fibers released from synthetic textiles;
- (m)
- Ship-generated litter;
- (n)
- Fibers from hygiene products;
- (o)
- Plastic material from organic waste;
- (p)
- Abrasion during paint removal;
- (q)
- Weathering of different kinds of paints;
- (r)
- Bottled water;
- (s)
- Polymers found in compost additives.
Microplastics threaten the sustainability of ecosystems and they are seen as vectors for absorbed environmental pollutants. Like macroplastics, microplastics or nanoplastics may contain chemical additives and contaminants, including some known endocrine disruptors that may be harmful to marine biota at extremely low concentrations. This poses potential risks to marine ecosystems, biodiversity, and food availability [13]. In addition, and since microplastics tend to bioaccumulate and biomagnify through the food chain there is also concern about human exposure [114,115].
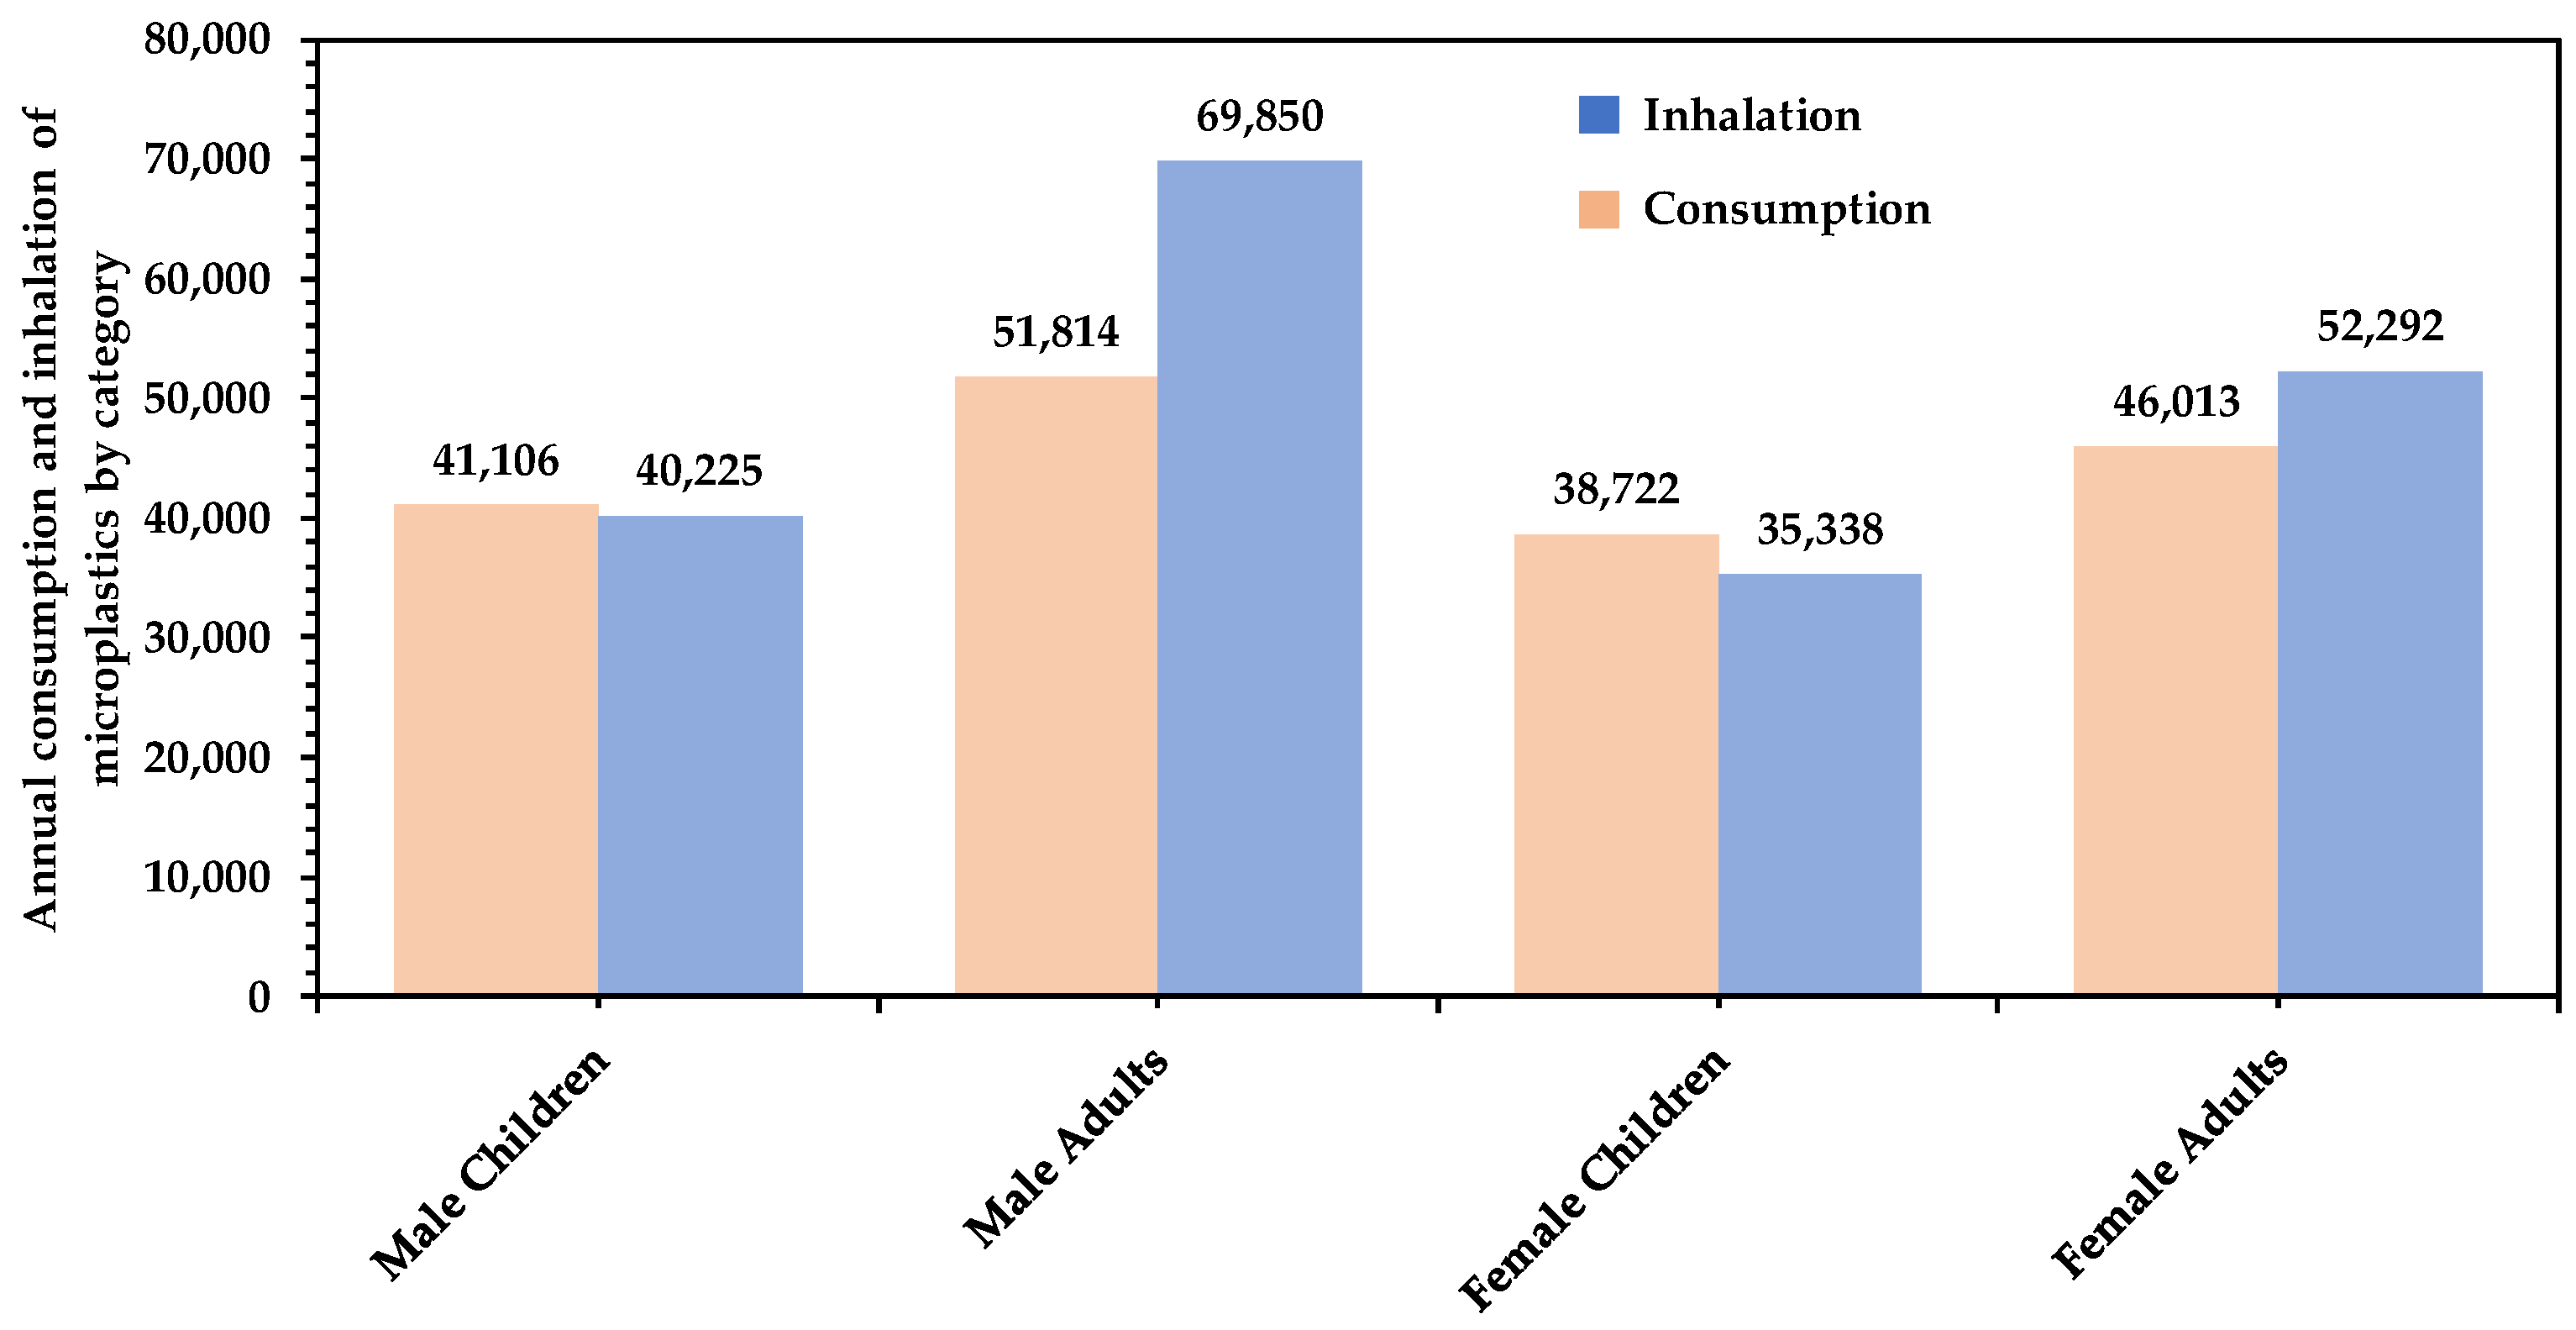
The negative influence of microplastics on soil processes and food production [116,117,118]; on the human food chain, including marine and terrestrial chains [119,120]; on the microbial community composition [121,122,123]; and biota [124] has been reported. Since day-to-day human life is intimately dependent on a large part of the above-mentioned segments, there is no doubt that microplastics and their associated contaminants are inevitably consumed by humans. Even though the impact that microplastics could have on the health of human beings is still unclear, there is undoubtedly a great potential to cause adverse health effects [125,126]. Estimates indicate that a person may be consuming and inhaling around 94,000 microplastic particles annually, with the largest proportion resulting from inhalation. However, the amount of particles consumed or inhaled depends on the age and sex of the individual. Figure 16 shows estimated annual consumption and inhalation of microplastic particles by category (female and male, children and adults) [7]. The average consumption and inhalation for the four categories are 44.414 and 49.426, respectively. As can be seen from the figure, contact between humans and microplastic particles is more through inhalation than through consumption. Adults, however, consume and inhale more microplastic particles than children. The types of activities carried out by this category of individuals may be behind this situation.
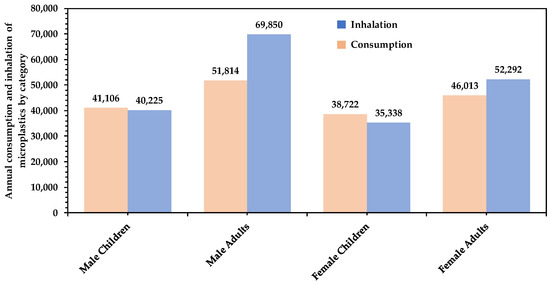
Figure 16.
Estimated annual consumption and inhalation of microplastic particles for female and male, children and adults. Source: authors’ own elaboration based on data obtained from reference [7].
For individuals who rely entirely on water from plastic bottles, in addition to the 94,000 particles annually, they may be consuming an additional amount of around 90,000 microplastic particles annually and around 4000 for those who consume tap water [7]. The presence of higher amounts of plastic particles in plastic water bottles than in tap water is not at all surprising. Scientists say drinking water sold in plastic bottles is a potential source of microplastics because it contains thousands of tiny plastics. A recent study, for example, carried out by Columbia University revealed frightening results. The results showed that a single bottle of water could contain nearly a quarter of a million microscopic particles of plastic [127]. These particles appear to originate primarily from the bottle itself and the reverse osmosis filters.
In the marine environment, for instance, microplastics may absorb and concentrate toxic organic pollutants and thus increase their toxicity by a factor of 10, posing a great threat to human health [128]. The presence of microplastics in the human body may make people more resistant to antibiotics [129]. When compared to aquatic environments, the terrestrial ones seem to be the most contaminated. This is justified by the fact that plastic products are mostly produced and used in terrestrial environments [130]. A new dataset estimates 24 trillion pieces of microplastics in the ocean, the equivalent of roughly 30 billion 500 mL plastic water bottles [131].
6.8. Plastic Waste’s Negative Impact on Socioeconomic Issues
Plastic waste causes serious socio-economic problems globally, which results from damage to the tourism industry, fishing activities, shipping activities, and the environment in general. At a global level, the damage and negative impacts on marine environments caused by waste plastic pollution (except for microplastics or nanoplastics) are enormous, and this totals around USD 13 billion per year, which essentially includes losses incurred by fisheries and tourism due to plastic littering, as well as beach clean-up costs [12]. Meanwhile, the reduction in services provided by aquatic ecosystems resulting from microplastic or nanoplastic pollution caused financial losses estimated at USD 2.5 trillion [132]. Europe alone spends around USD 293 annually on cleaning plastic waste from coasts and beaches, while the failure to recycle costs USD 116 billion [29]. The negative impact caused by plastic waste on the tourism industry and fishing activities, including the costs of coastal cleaning activities, for the Asian-Pacific Rim alone stands at USD 1.26 billion per year [133].
High levels of plastic pollution in the ocean can affect people’s social well-being in several ways. According to [67], plastic waste left or washed up on the coast can affect residents’ quality of life by reducing recreational opportunities and can demoralize coastal visitors. This reduces their access to the health benefits associated with outdoor activity, as well as potentially affecting the tourism industry.
7. Benefits of Plastic Materials to Humanity
A careful analysis of the scenarios described in Section 6.1, Section 6.2, Section 6.3, Section 6.4, Section 6.5, Section 6.6, Section 6.7 and Section 6.8 leaves a clear indication that the current use practices of plastics are not sustainable. This situation has been causing negative sentiments globally regarding plastic materials. The widespread negative sentiment has been growing much louder, and some voices from civil society organizations have even suggested banning the production of plastics completely. Plastic materials possess unparalleled properties such as affordability when compared to many other material types, low production costs, versatility, their lightweight nature, hydrophobicity, flexibility, transparency, durability, corrosion resistance, a high strength to-weight ratio, etc. Plastic materials have found a wide range of applications in packaging, textiles, household and consumer products, sports, electrical products and electronics, building and construction, the automotive and aeronautical industries, as well as in the health sector. In the following subsections, a brief review of some of the most convincing cases for the use of plastic materials is given.
7.1. Plastic Materials in Packaging
Plastic materials have greatly revolutionized the packaging industry. The industry is currently responsible for more than 40% of the consumption of all plastic materials produced globally [2]. In 2022, the global packaging plastics market was worth USD 413.7 billion. If the trend continues, in 2032, the market could reach USD 612.1 billion, with a compound annual growth rate of 5.6% from 2023 [134]. Offering solutions for different types of products, the successful use of plastic materials in packaging is thanks to the combination of unquestionable characteristics and qualities, such as high flexibility; mechanical, thermal, and chemical resistance; durability; light weight; low density; low permeability; stability; permeability; and sterilization facility, among other things. According to Rouch [7], there are five key functions for which plastic materials are most demanded by the packaging industry, namely to protect products from damage or contamination by micro-organisms and air, moisture, and toxins; to prevent products from spilling, in the case of liquids; to identify the product via labeling; to facilitate transportation and storage; and for advertising and product promotion purposes.
The most prominent among the plastic materials used in packaging are PE (high and low density), PS, PP, PVC, PET, and EPS. In the packaging industry, plastic materials find application in four main areas, which include food and beverages, industrial packaging, pharmaceuticals, and personal and household care products [134]. The list of packaging items produced is vast but, the most common and well known are the following [7,21]: water and soft drink bottles, salad domes, biscuit trays, salad dressing and peanut butter containers, milk bottles, freezer bags, dip tubs, crinkly shopping bags, ice cream containers, juice bottles, shampoo, chemical and detergent bottles, cosmetic containers, commercial cling wrap, squeeze bottles, cling wrap, shrink wrap, rubbish bags, microwave dishes, ice cream tubs, potato chip bags and dip tubs, water station cups, plastic cutlery, video cases, foamed polystyrene hot drink cups, hamburger takeaway clamshells, foamed meat trays, protective packaging for fragile items, water cooler bottles, flexible films, and multi-material packaging.
In spite of being controversial and widely criticized in view of the negative impacts on the environment, it is important to mention that the current prosperity of the food sector business, for example, is thanks to single-use plastic packaging. Some countries at a global level have been designing and implementing a series of regulations, which include the banning of single-use plastics. However, the banning of single-use plastic packaging could compromise the food sector’s immeasurable efforts to contribute to greater food security for human beings. In the food sector, plastic packages are critical because, in addition to facilitating sales in supermarkets, they enable the packaging of food and beverages (cold or hot) as such; transportation and protection against risks of contamination prolong the shelf life of food without compromising its quality and flavor until they reach the final consumer’s table and avoid food wastage. The food transport sector is certainly not imagining going back to the era where many consumer products, such as mineral water and soft drinks, were packaged in metal or glass, consuming excessive energy and creating pollution during transport due to the extra weight of these packages. The light weight of plastic packaging saves fuel consumption and obviously reduces carbon dioxide emissions during the transport of food products or beverages. The low density facilitates the transport of products, in addition to being more resistant to impacts, avoiding possible breakages.
7.2. Plastic Materials in Clothing
If, in the past, the use of plastic materials in the textile industry was a trend, now it has become a reality for this sector that is so important for the daily lives of human beings. Several pieces of clothing, such as jackets, blankets, pants, t-shirts, shorts, lingerie, backpacks, bags, and shoes, among others, are made from plastic materials. The insertion of plastic materials in clothes, often in combination with natural fibers such as cotton, provides them with light weight, protection, functionality, shine, beauty, more comfort, and durability, at a lower cost, thus promoting a healthy lifestyle among people [10]. PVC, nylon, polyester, PE, PP, EVA, and spandex are some plastic materials commonly used for this purpose. Currently, plastic materials are also being used in the fashion industry through the use of recycled PET bottle fibers. The first application of plastic in the fashion industry, in the specific case of nylon, dates back to the 1930s. However, today, almost a century later, more than 60% of the 100 billion pieces of clothing produced annually by the industry are made of plastic synthetic fibers [135]. The use of recycled plastic in clothing is seen by fashion designers as a sustainable practice because, according to them, this will contribute to minimizing the environmental impacts caused by plastics.
7.3. Plastic Materials in Household Appliances and Consumer Products
The biggest advantage of plastic materials for the domestic utility sector over traditional materials such as stainless steel, cast iron, aluminum, glass, and ceramics is their versatility and applicability. These characteristics give industrial designers freedom and ease to create new products and new concepts, without compromising the economic component. Additionally, when compared to other materials, plastic materials offer competitive advantages in terms of hygiene. Consumption and investment in the household appliance industry have been increasing every day worldwide. For example, in 2021, the United States household appliances market was valued at USD 52.65 billion, and in 2030, the market is expected to grow by around 6.5% each year from 2022 [136]. Products such as cups, plates, cutlery, bowls, trays, baskets, tables, chairs, footwear, buckets, hoses for green space watering, and basins, among other products, are just a few examples of plastic products most commonly used domestically. In addition to the household items mentioned above, plastic materials are also present in essential appliances in everyday life, such as coffee pots, mixers, toasters, blenders or liquefiers, microwave ovens, refrigerators, air conditioners, and washing machines, among others. The most commonly used plastics in the manufacture of household appliances include PVC, ABS, HDPE, LDPE, medium-density polyethylene (MDPE), high-impact polystyrene (HIPS), thermoplastic polyurethane (TPU), TPE, polyethylene terephthalate (PETG), Noryl® PPO, extra-high-molecular-weight polyethylene (EHMW), thermoplastic olefin (TPO), thermoplastic vulcanizates (TPVs), etc. [137].
7.4. Plastic Materials in the Sports Industry
In sport fishing and fishing for sustenance, the fishing nets are made of plastic materials. Plastic materials such as artificial polyamides like nylon or organic polyamides such as wool or silk are utilized [138]. On the other hand, modern fishing gear is composed of different plastics, with PE, PP, and PA being the most preferred plastics for this application [139].
In football, plastic materials are found in football boots, players’ uniforms, shin guards for leg protection, goalkeeper gloves, and goal nets, as well as the ball itself. However, the outstanding innovation in this sport is the use of synthetic grass made of plastic materials inside the playing field. The use of synthetic grass is extremely important, especially in environments/climates where natural grass cannot grow or has difficulties growing, or where grass maintenance is expensive. Polyethylene, polypropylene, or nylon serve as the main raw materials in the production of synthetic grass. These in turn are mixed with some plastics, including dyes to give the green color (like natural grass) and other chemicals that guarantee protection from harsh environments, such as UV radiation. Despite complaints due to the possible high temperature generated by synthetic grass, the installation of this material, in addition to providing aesthetics, saves time and money. The installation of synthetic grass eliminates costs and lost time with pruning and fertilization. Synthetic grass provides great water savings, thus ensuring a low water bill. For example, depending on the prevailing climate, a standard 30 m × 50 m football field with natural grass, which normally requires weekly watering, uses about 15,000 L of water monthly [140]. A clearer and more vivid example of the use of high amounts of water is that of the most recent World Cup, in Qatar in 2022. Qatar used at least 10,000 liters of water every day for each of its pitches, equivalent to 80,000 liters of water for a total of eight pitches. While this seems like an elegant solution, the practice was not welcomed by analysts and experts in the field of water, because in addition to sacrificing the availability of the limited fresh water in the Gulf, this water has undergone a desalination process that has huge financial and environmental costs [141]. With synthetic grass, this situation could have been avoided or minimized. It could also save on water and time used in washing the athletes’ uniforms, as the fields are free of mud, a very common situation on fields with natural grass, especially on rainy days.
7.5. Plastic Materials in Electrical and Electronic Industry
Electricity plays an extremely important role in the daily life of human beings. It is practically unimaginable what would become of modern societies without electricity. At home, electricity is used for lighting, to operate devices such as washing machines, air conditioners, microwave ovens, kettles, hairdryers, electric razors, food mixers, refrigerators, electronic devices, etc. In the workplace, electricity is used to run computers, printers, photocopiers, air conditioners, and other devices. In industry in general, electricity is used to run machines and equipment in production processes for consumer goods and more. However, the most interesting fact is that everywhere that electricity is found, plastic is also there. The progress of the electrical industry is only possible with the use of plastic materials, and the explanation is very simple; in the electrical industry, plastic materials are used to make electrical devices or goods safer, lighter, more attractive, quieter, more environmentally friendly, and more durable systems [142].
One of the outstanding applications of plastic materials in the electrical industry is electrical insulation. Since plastic materials do not conduct electricity, they are excellent insulators in a variety of applications where their insulating properties are needed. Electrical insulation has the following main roles: to protect the cables and wires from exterior hazards such as chemical attack and corrosion; to protect the users or consumer from the risk of electric shock; to protect electrical equipment; to minimize energy losses; and to keep the cables and wires fairly flexible, so they will not break down easily [142,143,144,145,146]. Polyvinyl chloride (PVC) is the most widely known and used insulating material owing to its excellent flame-retardant properties, high flexibility, good electrical resistivity, high resistance to abrasion, inertness, and the great cost/benefit ratio compared to other thermoplastics. Hence, some of the recently proposed bans of PVC usage may, in fact, create a bigger problem if the proposal were accepted [10]. Other applications of plastic materials in the electrical industry include casings/housings, circuit breaker housings, conduits, and circuit boards.
Plastic materials have also revolutionized the electronics industry. Characteristics such as durability, lightness, malleability, and protection capacity are what make plastic materials more attractive for this industry. Many components of computers, cell phones, televisions, and stereos are now made of plastic materials, because they make them lighter and more energy-efficient. For example, the plastics utilized in the liquid crystalline display (LCD) for screen televisions require less energy than traditional cathode ray tube screens. The touch screens of cell phones, computers, and other electronic devices are made of polycarbonate (PC) film, which possesses high light transmittance and excellent surface uniformity. The tiny microphones on cell phones are made of polymers for their shock resistance [147]. There are basically five reasons why electronics depend on plastics, namely heat response and stability, the insulating power of plastics, flame resistance, chemical and moisture immunity, and robustness and resilience.
The demand for plastics across the electrical and electronics industries has been and will continue to grow with each passing day. For example, in 2023, the size of the market of global plastics in the electrical and electronics industry was estimated at USD 37.72 billion and is expected to reach USD 39.94 billion in 2024. Experts indicate that between 2024 and 2030, the market will grow at a CAGR of 5.2%, reaching USD 53.27 billion in 2030. The increasing demand from the building and construction industry worldwide and the growth of the electronics industry due to the explosion of emerging technologies such as 5G, IoT, and AI technologies may be behind this scenario. The plastic materials most sought after by the industry include PVC, PC, PE, ABS, PP, polymethylmethacrylate (PMM), PU, and PA. However, PVC and PC dominated the market in 2023 in terms of revenue share, with 28.0 and 19.0%, respectively. In terms of application area, the electronic device segment led the market in 2023, with a revenue share above 34.0%, followed by the wires and cables sector, with 26.0%. The following positions were occupied by electrical insulation, electrical connectors, printed circuit boards, and other sectors. In the regional context, in 2023, Asia Pacific led the world market, with a market share of around 42.0% [148].
7.6. Plastic Materials in the Building and Construction Sector
Building and construction is one of the most demanding sectors for plastic products globally, including a diversified range of resins. The sector alone consumes around 20% of all plastics produced globally each year, and this quantity could double by 2050 [149].
Plastic materials provide more comfort and economy for modern societies. The combination of properties or characteristics such as excellent strength-to-weight ratio, cost effectiveness, low maintenance, scratch resistance, corrosion resistance, flexibility, versatility, and easy application makes plastic materials the most attractive for the building and construction industry [150,151]. Thanks to the aforementioned properties and characteristics, plastic materials in the construction sector are increasingly replacing traditional materials such as metals, cement, and ceramics. Due to the environmental pollution problem caused by plastic materials, in recent years, there has been an attempt to substitute these materials with glass wool. However, in terms of efficiency, when compared to plastic materials, glass wool has limitations; to achieve better results, it will be necessary to have very thick walls. On the other hand, the impact of plastic materials on the environment is much smaller when compared to other industrial or application segments or even sources of waste generation. For example, in 2018, the sector generated around 4% of the plastic waste produced globally and it is currently generating only 6%. The long service life exhibited by plastic materials goes beyond this situation [58,152].
Looking at the current trend of modern societies, there is still room for an even greater presence of plastic materials in this sector, until new and better technologies emerge. The proof of this is that the construction plastics market continues to grow, as illustrated in Figure 17. In 2020, for example, the global building and construction plastics market was valued at USD 95 billion. Three years later, i.e., in 2023, the market size grew by around USD101.79 and is expected to reach USD 109.84 in 2024 and USD 153.04 billion by 2033 [151,153]. According to [151], the key precursors to the strong growth in market size so far are increased need for the renovation or repair of buildings; construction and infrastructure projects; increased need for the construction of green buildings that guarantee sustainability; increased regulatory compliance; and urbanization and increase in the world population. In relation to the forecast period (2024–2033), an increase in digital construction workflows, circular economy practices, construction safety standards, emerging market growth, and adaptation to climate change are the leading factors for the growth in plastic market size in the building and construction industry.
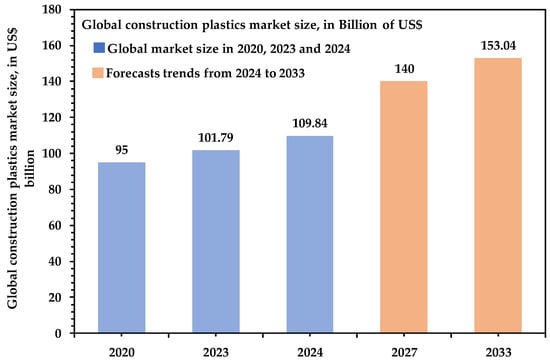
Figure 17.
Global building and construction plastics market size, in USD billion. Source: authors’ own elaboration based on data obtained from references [151,153].
The most sought-after plastic materials in the building and construction industry include PVC, PP, PS, acrylics, PU, and PE. PVC, however, is the most demanded in the production of plastic in the building and construction sector, with a global use of 70% of all PVC produced each year [149]. Its low conductivity, long life, insulation durability, ergonomic nature, processability, design flexibility, and scratch resistance are just a few properties or characteristics that make PVC more attractive for the construction industry. Plastics are mostly applied to roofing, insulation, pipes and ducts, doors, and windows in the construction industry. However, pipes and ducts are the segments that have recorded the highest market share in the sector. Plastic pipes find application in various fields of construction, including water service, plumbing, hydronic heating and cooling, fire protection, snow melting, and geothermal piping systems [154,155,156].
In the regional context, in 2023, the main players in the building and construction plastics market include North America, with countries such as the United States and Canada standing out; Europe, with Germany, France, the UK, Italy, and Russia being the biggest players on the continent; Asia-Pacific, with China, Japan, Republic of Korea, India, China, Taiwan, Indonesia, and Malaysia leading the continent; Latin America, with countries such as Mexico, Brazil, Argentina, and Colombia being the main protagonists; and the Middle East and Africa, with Turkey, Saudi Arabia, and the United Arab Emirates being the main players. Asia-Pacific, however, was the region that most dominated the market size [151,153].
7.7. Plastic Materials in the Automotive and Aeronautical Industry
The economic and safe transport of people and goods is vital for the growth of the world economy and for the well-being of societies. With the growing demands for modern means of transport (cars, planes, boats, and trains) that are safer, faster, more comfortable, more economical, more energy = efficient, and more environmentally sustainable, the use of plastics in the manufacture of parts to power these modes of transport has increased exponentially. The production of lighter and more economical vehicles is a goal pursued tirelessly by the automotive industry. Plastic materials, however, have been seen as the best candidates for achieving this goal. The preference for plastic is due to their lower density compared to steel, offering increasingly better properties in terms of mechanical strength and durability. The replacement of metal parts, mostly steel- and aluminum-based ones, with plastic has been taking place since the 1960s. The use of plastic materials, in addition to allowing the use of simpler and more economical manufacturing processes than those used with metals, also allows designers to adopt bolder vehicle designs. Today, on average, an automobile has around 50 kg of parts and accessories made of plastic materials, an amount that replaces around 350 kg of the steel used previously [157]. Given its degree of lightness and durability, plastic has been seen as the ideal material for the manufacture of cars, trucks, and other vehicles. Nowadays, plastic materials represent between 10% and 15% of the total weight of a new vehicle and more than 50% of its volume. Plastic has 85% less specific gravity when compared to metals. When used in automotive components, they enable approximately 80% weight savings and 30% to 50% cost savings in individual components. The immediate result of this is a drastic fuel/energy savings as well as a drastic reduction in the wear and tear of road pavements. Steering wheels, floor mats, door trims, and stereo components are all made of plastic, even some engine components. For every 10% reduction in weight, a car or truck saves about 5% to 7% in fuel use, a reduction that will also be reflected in a reduction in vehicle weight and translated in turn into a reduction in carbon dioxide emissions. Plastics also make vehicles safer and more comfortable. Occupants today are safer than ever during a road accident, as most structural components are made from plastics. Components such as life-saving seat belts and airbags, padded plastic pumps, door frames, foam door panel inserts, plastic foam-filled roof supports, and pillars are just a few examples of plastic-based materials present in modern vehicles. One of the best-known plastic-based parts of modern vehicles is the bumper (front or rear bumpers). As is well known, bumpers are devices installed on vehicles in order to absorb damage in the event of a slight impact with fixed objects or pedestrians. The plastic front bumpers, especially, have brought about significant gains because, in addition to minimizing damage to vehicles, they appear to reduce the severity of impact on pedestrians’ legs [10,147].
The aeronautical industry is no exception to the rule; the replacement of metal-based parts such as titanium, steel, and aluminum by plastic materials combined with carbon fibers has also gained prominence. The combination of plastics and carbon fibers makes up the materials commonly called composites (or simply “carbon fiber-reinforced polymer”), materials of lesser weight (40% lighter than aluminum) and greater mechanical, thermal, corrosion, and fire resistance, including little smoke emission, obtaining results that gain in practicality while maintaining the strength and greater flight autonomy of the planes, making it the second safest means of transport in the world. It is important to note that the use of plastic materials in airplanes is not a new thing; it has been around for quite some time. Just remember that the luggage racks, the tables in front of the passengers, and the finishing and comfort of the passengers have always been composed of plastic materials. However, the contribution of plastic-based composites is more evident over the recent past for modern passenger jets such as the Boeing 787 or the Airbus A350.
The Boeing 787 planes, for example, developed by the American company Boeing, which has models capable of carrying from 210 to 330 passengers, have around 50% of the weight of their structure formed by “composites”. A similar percentage of plastic materials and weight of their structure is presented in the A350 range of Airbuses (models capable of carrying 250 to 340 passengers), developed by the European Airbus consortium. These air cruises have considerably reduced their weights, resulting in up to a 30% reduction in jet fuel consumption. The A380, with the capacity to carry no less than 555 passengers, another large launch by Airbus, has 20% of the weight of its structure in plastic materials. It is without a doubt a very significant weight reduction considering the gigantic dimensions of the planes and the previous models of these brands [147,157].
One of the great advantages of planes made of plastic and carbon composites when compared to traditional planes (with an aluminum hull) is the greater strength of the fuselage, so that the cabin can receive twice as much pressurized air, resulting in greater safety and less passenger fatigue [158]. On the other hand, although initially more expensive to produce than traditional metal parts, components made of plastic and carbon composites can save aircraft operators money on future maintenance costs, and the explanation is simple; components made of plastic and carbon composites do not corrode, so there is greater durability of the structure, especially those that are impossible to change. An A350, for example, requires 50% less maintenance work on the structure, and the threshold for a complete structural check is 12 years compared to eight for the A380.
Regarding the issue of environmental pollution in the transport sector, plastics can be a greener option than other materials such as metals. The fuel savings that result from the light weight of means of transport made of plastic materials could significantly reduce carbon dioxide emissions. Estimates suggest that for every kilogram lighter a car is made to be, it will reduce carbon dioxide emissions by about 20 kg over its lifetime [147,159]. On the other hand, in terms of waste generation, the transportation industry is currently generating around 5% of plastic waste produced globally, an impact on the environment considered minor when compared to other industrial or application segments or even sources of waste generation [58]. Analyses of the automotive and aerospace plastics market size indicate a favorable scenario. The global automotive plastics market size was USD 30.44 billion in 2023. If the trend continues, in 2030, the market could reach USD 43.77 billion, a compound annual growth rate of 5.6% from 2024 [160]. On the other hand, the global aerospace plastics market size was estimated at USD 7.61 billion in 2023 and is expected to grow up to USD 13.89 billion in 2030, at a compound annual growth rate of 9.3% from 2024 [161].
The most sought-after plastic materials in the automotive industry include acrylonitrile butadiene styrene (ABS), PVC, PP, PU, PE, polyamides (nylon 6 and nylon 6,6), PC, and PMMA. Key applications in the sector include interior furnishing; electrical components; exterior furnishing; power trains; under the hood; and chassis [160]. In turn, the plastic materials most sought after by the aerospace industry include polyetherketone, polyphenylsulfone, PC, polyetherimide, PMMA, PA, polyphenylsulfide, polyamide-imide, and polyphenylene ether. Main applications include cabin interiors; structural components; electrical; electronics and control panel; window and window shields; doors and canopies; and flooring and wall panels [161].
7.8. Plastic Materials in the Health Sector
Due to their infinite versatility and their properties such as durability, impermeability, transparency, and compatibility with other materials, plastics have become essential for the development of medicine [162]. According to Markets and Markets [163], the global market for medical plastics was valued at roughly USD 22.8 billion in 2019 and is predicted to reach USD 31.7 billion by 2024, at a CAGR of 6.8%. Plastics have transformed the medical industry due to their chemical resistance, sterilization capability, and excellent thermal properties [164].
Plastic materials are often used in dental health management. Globally, tooth brushing is the most common mechanical means of plaque management and is considered to prevent periodontal disease [165]. Toothbrushes and toothpaste protect teeth from gum disease and other oral health concerns that can cause tooth decay, cavities, bad breath, tooth loss, and more. Modern-day standard toothbrushes came into existence around 1938 when plastic was first used to make bristles in the USA [166]. Nowadays, bristles of most modern commercial toothbrushes are made of softer nylon and occasionally silicon. The toothbrush handles are made of polypropylene and polyethylene. Nylon bristles are a better choice over natural hair for a number of reasons, as pointed out by. Nylon bristles flex as much as 10 times more often than natural bristles before breaking; they do not split or abrade and are easier to clean. The configurations and hardness of nylon bristles can be standardized within specified and reproducible tolerances. Natural bristle diameters, since they are tapered, vary greatly in each filament. This can lead to wide variations in the resulting texture of the marketed toothbrush. As a result of the advantages of nylon, as well as its ease and economy of production, relatively few natural bristle toothbrushes are marketed today [167].
Apart from dental health, plastic materials are vital in the public health sector. In many developing countries, particularly in Africa, HIV and malaria still represent a major public health problem. The condom is, to date, the most popular, accessible, and effective method of preventing HIV infection. In addition to HIV, condoms also prevent other sexually transmitted infections, such as syphilis, gonorrhea, and some types of hepatitis [168]. They are also used as a birth control method. Currently, most condoms are made from latex, a stable colloidal dispersion of a polymeric substance. People who are allergic to latex condoms, on the other hand, can use plastic condoms [169]. In the case of malaria, the use of mosquito nets to reduce the possibility of being bitten by the mosquito that transmits the disease is the best-known prevention method so far. Mosquito nets are entirely made from nylon or polyethylene [170].
The benefits of plastic materials in medicine go beyond combating or preventing HIV and malaria. In the past, syringes were made of vitreous materials, materials that represented a high risk of breakage and contamination problems in case of failures in the sterilization process. To overcome this situation, nowadays, most syringes in use are made of plastic [171]. The removal or introduction of fluids in human organisms would not have been possible without flexible tubes, commonly called catheters, made from plastic materials such as PVC. The microphones and sound transmission devices connected to a microcomputer that are part of hearing aids (implants) would not have been possible without plastic materials either [172]. Innovative and advanced plastic products are currently offering multiple benefits in medical applications where it is necessary to administer therapeutic agents to specific targeted sites in a steady and controlled manner. With nano-sized plastics, for example, it is now possible to treat several chronic and deadly human diseases such as cancers more effectively and precisely via targeted drug delivery systems [173,174]. Medicine has not yet found a substitute material other than plastic for the storage and conservation of blood, a vital liquid for human beings. Medical devices made from plastic materials also find application in the sectors of hemodialysis, in cardiology for the manufacture of heart valves, wound saturation, orthopedics for the manufacture of prostheses, in ophthalmology, for the production of contact lenses, and in dentistry for dental implants, among other procedures.
7.9. Plastic Materials and the COVID-19 Pandemic
The COVID-19 pandemic outbreak in December 2019 and its rapid global spread, which has pushed practically all healthcare systems across the world into crisis, has forced the whole world to realize the absolute need for access to medical single-use, less expensive, and more flexible plastic materials. During the terrible public health crisis, there was a huge demand for life-saving medical devices such as personal protection equipment, testing kits, syringes, gloves, protective gowns, face masks, plastic screens, and plastic sampling swaps for large-scale COVID-19 testing, the majority of which are made of plastic. The COVID-19 crisis was kept under control thanks to plastic-based products [175,176,177,178]. Furthermore, as discussed previously, with social distancing measures in place and the intention of preventing additional infection, many consumers were obliged to order their meals in takeaway packaging to eat at home or at their offices rather than going to their favorite restaurants [179]. Again, the COVID-19 scenario was saved by the use of plastic-based products, mostly polypropylene and extruded polystyrene in plastic packaging bags.
8. Current Practices, Challenges, and Possible Solutions for Improving Plastic Waste Management
From the applications and benefits illustrated in the previous sections, it is clear that despite their associated negative effects, plastic materials are undoubtedly critical to humanity. The list of benefits of plastic materials to humanity is endless. Recognizing that plastics play a vital role for humanity, some countries have been conducting a series of actions aimed at improving plastic waste management, and this includes, but is not limited to, (a) bans and taxes on micro- and nano-sized plastics; (b) landfills; (c) burning and energy recovery; (d) re-use of plastic; (e) recycling; (f) innovative technologies; and (g) other (non-technological) actions. Some of these actions, including the challenges surrounding them, are presented and described in the subsequent subsections. Possible solutions for improving plastic waste management, including advances in technologies for the production of alternative materials that are more sustainable and environmentally friendly than petroleum-based ones, are also presented.
8.1. Current Practices and Challenges
8.1.1. Banning or Imposing Taxes as Strategies for Plastic Waste Management
Many government agencies, non-governmental organizations (NGOs), research institutions, international organizations such as the United Nations, etc., have been proposing a series of strategies aimed at ending the plastic pollution problem. Banning and imposing taxes to pay for the use of plastic are just some of the various strategies adopted. Several countries in Africa, Asia, North and South America, Canada, or Europe have successfully implemented these strategies. According to Kumar et al. [22], so far, around 127 countries had already regulated the use of plastics, while 115 implemented various laws and policies to combat plastic waste both nationally and locally. Table 3 shows some restrictive actions on the use of plastic materials in different countries, which include banning plastic, imposing taxes, or other types of restrictions. Although the names of many countries are not included in the table above, it is important to highlight that there are many positive actions taking place in these countries aimed at mitigating the negative effects of plastic waste. Some of them have even committed to significantly reducing the use of plastics by 2030.

Table 3.
Plastic restrictions used in different countries [22,51,53,56,180,181,182].
From the actions described in the previous table, it is clear that countries globally are concerned and are already realizing that there is a pressing and urgent need to reduce plastic waste and its impact on the environment. However, strategies such as banning and imposing taxes on single-use plastic have proven to be inappropriate and ineffective in some countries because most regulations were limited to items that make up a tiny share of plastic waste, such as plastic bags. The strategy of banning plastic bags will only be more effective at reducing littering than curbing plastic consumption [183]. On the other hand, some countries have adopted and implemented a ban on single-use plastic without providing affordable alternatives, a situation that could lead to the emergence of black markets [184]. For example, nearly a decade ago, California became the first state in the USA to ban single-use plastic bags in an effort to reduce the proliferation of plastic waste. To replace disposable plastic bags, reusable and resistant plastic bags were introduced, designed to withstand dozens of uses and be technically recyclable. However, because the new plastics were similar to the flimsy bags they replaced, many people did not reuse them, even though they were stamped with the recycling symbol. As a result and according to California’s Recycling Agency, in 2023, Californians will throw away more plastic bags, by weight, compared to when the ban law was implemented [185]. Another factor associated with this situation is the fact that certain countries have adopted a ban on single-use plastic pointing to paper shopping bags as an alternative. However, although many people believe that paper is much less harmful to the environment than plastic and consider it an alternative raw material in the manufacturing processes for most objects made from plastic, using paper shopping bags does not seem to be the best alternative to plastic ones, for the following reasons [186,187,188,189]:
- (a)
- Lifecycle analysis of the paper production process, which includes extracting the raw materials, refining them, manufacturing the product, packaging it for shipping, its transport and distribution, its use and possible reuse, recycling and final disposal, points out that it takes “four times more energy to make a paper bag than to make a plastic bag”.
- (b)
- Although most paper is made from a renewable and biodegradable resource when compared to plastic, for the production of one ton of paper bags, it would be necessary to cut down approximately 17 trees. This could cause deforestation or desertification.
- (c)
- When compared to the manufacture of disposable plastic bags, the paper manufacturing process involves the use of toxic chemicals including limestone, sulfurous acid, etc., and as a result, paper is responsible for 70 times more air pollution and 50 times more water pollution than the production of plastic bags made from HDPE, resulting in more toxicity to humans and the environment.
- (d)
- When compared to plastic bags, paper bags weigh about six to ten times more. This means that its transportation and distribution will require greater efforts and more fuel and will cost more, increasing its carbon footprint. The volume of paper bags also affects the transportation. Paper bags take up more space than plastic bags. It is estimated that to transport the same number of plastic bags that can be transported by a single truck, seven trucks will be needed to transport paper bags.
- (e)
- Although it decomposes more easily and quickly than plastic, paper will require more space in landfills due to the greater volume that it occupies.
- (f)
- Paper bags do not offer the conditions to be regularly reused the necessary number of times due to their low durability, being more prone to tearing, especially if they get wet.
- (g)
- Plastic bags are pointed out as being better for the environment than paper or reusable bags because, to become more environmentally friendly than disposable plastic bags, paper bags must be used often. By comparison, a bleached paper bag would need to be reused 43 times to equal the environmental impact of LDPE, which has not been possible to date, for the reasons indicated in the previous item.
- (h)
- Although 66% of paper and cardboard are recycled, the recycling process is more difficult when compared to plastic recycling. The biggest challenge is keeping the material in a recyclable condition, as paper can easily get wet, dirty, and greasy, which is identified as the main factor behind this problem. On the other hand, the recycling process requires additional chemical products to remove the ink and return the paper to pulp, a situation that contributes to environmental pollution, with an emphasis on the loss of water quality in rivers and streams.
With the observations listed above, it is clear that any material, no matter whether it is paper or plastic, has the potential to cause damage to the environment and threaten life on the planet, each with its own specificities. How much of this pollution will actually be practiced is in the hands of human beings. Imposing a tax on plastic shopping bags in supermarkets, in addition to being a measure that encourages the reuse of bags for shopping, helps to reduce plastic consumption and reduces the volume of waste. However, this measure will not be effective in countries where populations have low or no income, such as in developing countries. Faced with this situation, perhaps one of the solutions to the problem would necessarily involve changing the attitude of consumers and adopting an attitude that leads to a more sustainable planet. Avoiding incorrect disposal of plastic waste, adopting selective separation, avoiding unrestrained consumption, and focusing on reuse are just a few examples of changing attitudes. Another solution would be to think about investing in redesigning plastic products in a circular economy context, in such a way that they can be readily broken down and remanufactured. The use of instruments, such as “Extended Producer Responsibility” schemes for packaging and durables, landfill taxes, deposit–refund, and “Pay-as-You-Throw” systems [183], and the development of better recycling technologies are also factors to consider.
8.1.2. Landfill
Landfill is the conventional and most preferred approach to waste management. If properly managed, landfills provide a safe and secure place for any type of waste (including hazardous waste, such as chemicals and medical waste) to be disposed of properly, ensuring that waste does not contaminate the surrounding environment. Figure 18 shows the global share of plastic waste landfilled in 2019, in percentage. As can be seen, of the amount of plastic waste generated globally, almost 50% has gone to landfills, proving the preference for this method of waste management. Canada landfilled more plastic waste than all countries or blocks/organizations, having reached around 82%. In terms of individual countries, the USA ranks second after Canada, with 73% of landfilled waste, followed by India and China, with 36% each. From the figure, it is clear that American countries were responsible for the highest quantities of plastic waste landfilled, followed by European countries, Asian countries, and finally, African countries [52,190].
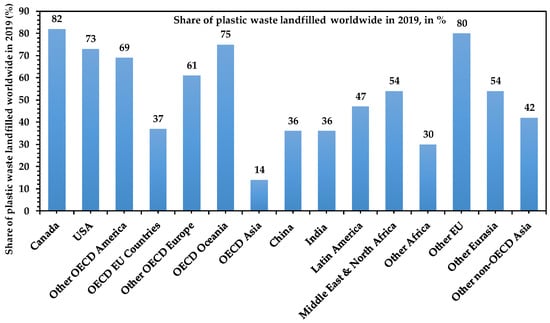
Figure 18.
Share of plastic waste landfilled worldwide in 2019. Source: authors’ own elaboration based on data obtained from references [52].
However, one of the main disadvantages of a landfill is that the process demands large areas of land. For countries where land is becoming scarce, landfilling becomes a challenging approach. On the other hand, if not well managed, landfills may imply the postponement of the problem rather than its resolution. Conditions within a landfill may also cause the chemicals contained within plastic to leach more readily into the environment. If not well-managed, landfills can also release, via organic matter decomposition, chemicals such as fossil fuels and greenhouse gases, with a catalytic effect on global warming. Carbon dioxide, methane, sulfur, and nitrogen gases are just some examples of greenhouse gases that can be released. Harmful substances from landfill leachates such as heavy metals (lead, cadmium, and mercury), pesticides, disinfectants, pharmaceutical wastes, organics, and chemical substances could also contaminate soils and groundwater. From the landfill leachates, contaminants can also be released with great potential to alter the structure and texture of soils, and with negative consequences for agricultural activities [8,22,191].
Another problem with landfilling is related with the costs of the activity. Landfilling involves land excavation, an operation closely linked with the underlying geology and land use patterns of the region. For regions with a hard underlying volcanic bedrock and permeability from the sea, landfilling is an expensive operation with huge engineering outlays. Looking from a sustainability perspective, one of the major drawbacks of landfills is that none of the starting material used to produce the plastic is recovered; the material flow is linear rather than cyclic [28].
However, with a cautious analysis of the drawbacks described above, perhaps a possible solution would be to discourage the practice by applying very high disposal costs. High disposal costs may create opportunities for the adoption of reasonably economical and sustainable practices such as re-use, recycling, energy recovery, etc.
8.1.3. Burning and Energy Recovery
Burning of solid waste is one of the primary methods of solid waste management, along with landfills. Usually carried out under controlled conditions, burning is seen as a sustainable practice of solid waste management, since the process reduces the need for a landfill of solid waste as well as the volume of the initial material, leaving only an inert residue. In addition to significantly reducing the volume of waste, the burning process has the potential to destroy possible organic material, which may include microorganisms and viruses present in waste, mainly contained in hospital and industrial waste, and which could cause diseases to humans. However, there should be measures in place to prevent or reduce air pollution specifically for hospital and industrial waste. There is abundant evidence for the failure of proper disposal of hospital and industrial waste and its effects on human health.
Burning of solid waste includes two options, namely pyrolysis and incineration. The difference between the two options lies in the type of treatment; incineration mainly occurs in the presence of oxygen, while pyrolysis does not. The most widely documented data are those related to the incineration process. A typical incineration process may involve, among other equipment, the following: (a) a program control system, (b) detection system, (c) cyclone separator, (d) combustion chamber, (e) air supply pump, (f) cooling system, (g) computer storing date of FTIR, (h) exhaust fan, (i) ash trap, (j) heating sleeve, etc. [56].
Figure 19 shows the share of plastic waste incinerated worldwide in 2019. Asian countries are the ones that incinerated the most plastic waste compared to European, American, Oceanian, and African countries. In individual terms, China leads the list, followed by the USA, with 24% and 19%, respectively. Overall, the world in 2019 incinerated an average of around 19%.
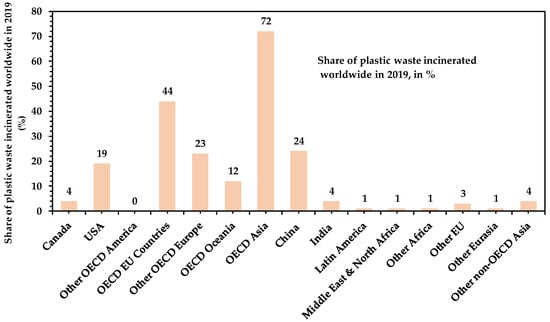
Figure 19.
Share of plastic waste incinerated worldwide in 2019. Source: authors’ own elaboration based on data obtained from references [52].
For the specific case of plastic materials, the burning process is seen as the most suitable way of dealing with highly mixed plastic such as some electronic and electrical wastes and automotive shredder residue [28]. One of the biggest gains arising from the burning of plastic waste, either by incineration or by pyrolysis, is the possible recovery of energy contained in these materials, taking advantage of the calorific power of some plastics, which is quite large. For example, the calorific values of plastics such as PE, PP, and PS range between 41 and 48, values very close to the calorific values of gasoline, petroleum, and kerosene, which are 46, 42.3, and 46.5, respectively. Since the main products of incineration products are water and carbon dioxide, there is enormous potential to consider the possibility of using these materials as substitutes for conventional fossil fuels [56]. However, the useful energy recovered will vary substantially depending on the purpose for which the energy is used.
Between incineration and pyrolysis, the latter is the most preferable method. Contrary to the incineration process, which simply produces fly ash, which is usually sent to landfills, and increased greenhouse gas emissions [7], the pyrolysis of plastic waste can play an important role in converting these residues into economically valuable hydrocarbons, either in liquid or gaseous form. Gaseous products can be used to produce energy, while the liquid ones can be used directly as fuel or as raw material in the petrochemical industry for later conversion into more valuable secondary fuels [192,193]. The generated amount of the carbon is transformed to biochar, a useful product that can be used for improving the qualities of soil.
The temperature for the thermal degradation of plastics plays a critical role in the yields of liquids or gases produced. Lower temperatures in the range of 450–700 °C yield more liquids. The addition of a catalyst, commonly natural zeolite, enhances the plastics’ degradation into liquids at lower temperatures (230–350 °C). Alternative and more efficient technologies combine biomass and plastic pyrolysis. It is known that co-pyrolysis produces liquids which are richer in aromatics and can, after very little upgrade, substitute fuels for vehicles (diesel).
Despite the advantages listed above, burning has the disadvantage of being a costly process. Large-scale burning plants are expensive to install, maintain, and operate. The situation becomes critical, for example, when a constant and reliable supply of raw materials is not guaranteed. For the specific case of plastic waste, the burning process raises health and environmental concerns because of a possible release into the atmosphere of greenhouse gases and hazardous substances such as dioxins, polycyclic aromatic hydrocarbons (PAHs), polychlorinated biphenyls, and furans [194,195]. The presence of fly ash and organic or inorganic chlorine metal ions, for instance, is pointed out as one of the causes leading to dioxin formation [196]. Plastic materials such as polyvinyl chloride, low-density polyethylene, polypropylene, polystyrene, and polycarbonates are just a few examples of plastics whose burning poses a danger to human health. Another waste plastic that is not recommended to be burned is PET bottles. Although still in the embryonic phase, studies indicate the possible presence of antimony derivatives in these bottles [197]. The unfavorable scenarios indicated here make the burning process a less attractive waste management strategy when compared, for example, with landfill and mechanical recycling processes.
A possible solution that can contribute to minimizing the effects of environmental pollution will involve the use of emission control devices for both incinerator and pyrolysis infrastructure. Devices such as filters with a dry injection system, packed bed, scrubbers, and electrostatic precipitator are just some examples of devices that can be used as emission controllers. Strict regulations for monitoring these activities should not be ignored.
8.1.4. Re-Use of Plastic
The re-use of post-consumer items plays an extremely important role in the daily lives of societies. Re-use, in addition to preserving primary sources, especially the non-renewable and exhaustible ones, can largely save electricity in industries from the beginning of the production cycle, which includes everything from the exploitation of the primary material to the formation of the final product. In a context of a circular economy, this constitutes a great gain, as it increases the productivity of the material as well as the industries. The re-use can create value in several segments, with an emphasis on business-to-business and business-to-consumer applications. However, the success of this practice will be closely dependent on the adoption by individual or shared companies of appropriate or innovative systems.
For the specific case of plastics, there are ample opportunities for re-use of plastics used for the transport of goods, and for potential re-use or re-manufacture from some plastic components into high-value consumer goods such as vehicles and electronic and electrical equipment. In the very recent past, the re-use of post-consumer packaging has already been a successful and common practice. However, the same can no longer be said in relation to rigid containers, where the application of this practice faces limitations of a conjuncture scope. According to Hopewell et al. [28], limitations to the broader application of rigid container re-use are at least partially logistical, where distribution and collection points are distant from centralized product-filling factories and would result in considerable back-haul distances. In addition, the wide range of containers and packs for branding and marketing purposes makes direct take-back and refilling less feasible.
For the plastics industry, sometimes one of the greatest dilemmas of reusing or remanufacturing plastic items is related to economic aspects and sometimes aspects related to the quality of the intended final product or item. When cheap oil floods the global markets, like what happened during the COVID-19 period, then for the industry, it becomes much cheaper to produce new plastic than to reuse or use recycled plastic.
One of the measures or alternatives is to evaluate the possibility of adapting current plastic production processes in order to make them more ecological. The production of fully recycled plastic will allow these materials to be reused again and again, a measure that in addition to reducing the pressure on natural resources can also significantly reduce the impact of this essential material on the planet. The world must move towards a circular economy approach in which materials and resources are re-used as much as possible.
One of the current approaches widely explored in the scientific community is the re-use of plastic materials in additive manufacturing (AM) technologies. Also known as 3D printing, AM is a bottom-up manufacturing process that develops new products by adding materials layer by layer using 3D model data. The reuse of plastic waste materials in AM technologies via 3D printing is an innovative approach in the manufacturing sector to tackling plastic waste and presents a promising pathway to reduce environmental impact, thus promoting sustainability. Its direct or distributed manufacturing capabilities are becoming a key industrial process that could play a relevant role in the transition from a linear to a circular economy [198,199].
AM technologies are poised to transform the world. Numerous products are already being produced using AM. The authors of [200] predict that in the near future, the number of products that can be printed with AM will greatly surpass current figures, thanks to advancements in multi-material production and integrated functionalities. Economically, the global AM market is projected to reach USD 23.33 billion by 2026. The process of converting waste plastic to 3D-printed parts involves nine steps [199]: (a) collection of plastic waste; (b) separation as per gate/type; (c) scrape grinder; (d) cleaning; (e) hot air oven; (f) development of composition; (g) filament extrusion; (h) filament deposition modeling feedstock; and (i) product printing.
The main disadvantages of reusing plastic waste materials in AM technologies via 3D printing lie in the following. (a) Material quality: for cases in which there are inconsistencies in the quality and properties of recycled plastics, the performance and reliability of printed objects can be affected. (b) The presence of contaminated residual plastic material can make the process resource-intensive, and to overcome this situation, plastic waste needs to be carefully sorted and cleaned. (c) Because of the requirements of 3D printing, some recycled plastics may require additional processing or additives. (d) There is a pressing need to ensure that recycled plastic materials meet industry standards and certifications for safety and performance.
8.1.5. Plastic Recycling
A simple definition, taken from Wikipedia, defines “recycling” as a process that converts waste or transforms used materials, such as glass, paper, metal, plastic, fabric, and electronic components, into new materials or potentially useful products. It constitutes an essential and modern component of waste management and is third in the “reduce, reuse and recycle” waste hierarchy.
Recycling is by far one of the most important and promising waste management strategies to deal with the plastic pollution problem. Seen as an example of implementing the concept of industrial ecology, nowadays, recycling is one of the most dynamic areas in the plastics industry. Governments around the world have been calling for and encouraging the need to use recycled plastic in various applications. In addition to being an important tool in reducing environmental impacts, energy usage per unit of output, and precious primary resource depletion such as oil, natural gas, coal, and mineral usage, recycling also provides opportunities to reduce carbon dioxide emissions, contributing to the fight against climate change. Recycling has been shown to save over 700 million t in carbon dioxide emissions annually, with an emphasis on emissions generated by the aviation industry [200].
In the industrial field, recycling of plastic materials comprises four levels, namely (a) Primary Recycling (Mechanical Recycling); (b) Secondary Recycling (Mechanical Recycling); (c) Tertiary Recycling (Chemical Recycling); and (d) Quaternary Recycling (Energy Recovery). It is important to mention, however, that each corresponds to different stages of recycling processes and types of plastics.
The authors of [21,56] briefly and succinctly define each of the categories.
- (a)
- Primary Recycling (Mechanical Recycling)—Mechanical recycling is a widely used and straightforward method for recycling plastic, encompassing both primary and secondary recycling processes. Primary recycling includes closed-loop recycling solutions where the plastic material is recycled and used in applications identical to those from which they were recovered. The method involves converting waste plastic into new products or similar items through mechanical means. As a key component of the circular economy, primary recycling promotes sustainable resource use and reduces the environmental impact of plastic waste. The main steps in this process are (a.1) collection and sorting, (a.2) cleaning, (a.3) shredding and grinding, (a.4) melting and reprocessing, and (a.5) forming new products. The process offers significant environmental benefits, including a reduction in plastic waste in landfills and oceans, conservation of natural resources, and decreased greenhouse gas emissions. It also saves energy and raw materials, leading to substantial economic benefits. Additionally, the process preserves the physical properties of plastics, making the recycled material suitable for high-quality applications. The success of mechanical recycling largely depends on the homogeneity of the raw material, which should ideally be single-polymer plastics; the purity of the recycled material; sorting efficiency; and market demand. Innovative solutions in this field include advanced sorting technologies such as robotics to enhance sorting and separation efficiency; new extrusion techniques to improve the quality of recycled plastic; and the implementation of “Closed-Loop Recycling Systems”, which allow products to be recycled back into the same products, like PET bottles into new PET bottles, thus reducing contamination and improving material quality.
- (b)
- Secondary Recycling—Secondary recycling transforms plastic waste into lower-quality products through physical reprocessing without significantly altering the plastics’ chemical structure. This process is vital for managing plastic waste and supporting a circular economy, despite the challenge of maintaining material quality. The main steps include (b.1) collection and sorting; (b.2) crushing and washing; (b.3) melting and extruding; and (b.4) cooling and pelletization. The products generated include outdoor furniture like park benches and picnic tables, plastic lumber for construction and landscaping, containers and bins, automotive parts, textile fibers for clothing and carpeting, and non-food packaging materials. Like primary recycling, secondary recycling offers environmental benefits by reducing plastic waste in landfills and oceans, conserving natural resources by reusing existing plastics, and consuming less energy compared to producing new plastics from raw materials. However, the main challenge is the quality of the final product, as recycled plastics often have inferior mechanical properties compared to virgin plastics due to contamination and degradation during processing, making them unsuitable for high-performance applications, such as food contact products. Innovative solutions for this process include advances in sorting technology, such as near-infrared (NIR) spectroscopy, to improve the efficiency and accuracy of plastic sorting; creating high-value products like construction materials, furniture, and decking from mixed plastic waste; improving blending technologies for recycled plastics with virgin materials or other waste types to create durable products; transforming lower-quality recycled plastics into high-value items through innovative design and manufacturing techniques; and developing additives and compatibilizers to enhance the properties of recycled plastics, making them more comparable to virgin materials.
- (c)
- Tertiary Recycling (Chemical Recycling)—Tertiary recycling, also called chemical recycling, involves converting plastic waste back into its original monomers or other basic chemicals. This process breaks down the polymer chains of plastics into their chemical components, allowing for the creation of new plastics or other valuable chemicals. Tertiary recycling presents a promising solution for managing plastic waste, particularly for types that are difficult to recycle mechanically. With advancements in technology and decreasing costs, chemical recycling has the potential to play a significant role in sustainable plastic waste management. The steps of chemical recycling involve pyrolysis, a thermal decomposition process in the absence of oxygen that converts plastic waste into liquid oil, gases, and char; gasification, a process that involves heating plastic waste in a controlled amount of oxygen, producing synthesis gas (syngas); hydrolysis, the use of water to break down plastic polymers into monomers; methanolysis, the process in which plastics are treated with methanol to produce dimethyl terephthalate (DMT) and ethylene glycol, which can be repolymerized; and glycolysis, which is the breakdown of polyethylene terephthalate (PET) using glycol, yielding monomers for repolymerization. Tertiary recycling offers resource recovery by converting waste plastics into valuable raw materials, supporting the circular economy by turning waste into resources for new products, and reducing the volume of plastic waste in landfills. It is a versatile process that can handle mixed and contaminated plastic waste, unlike mechanical recycling, which requires clean and sorted plastics. However, the main challenges include the high costs of the process. Chemical recycling is more expensive than mechanical recycling due to its complex processes and energy requirements, and it remains in the developmental stage for many plastics, necessitating further research and innovation. Environmental impact is another challenge, as some processes may produce harmful emissions if not properly managed. The environmental impact is another challenge, as some processes may produce harmful emissions if not properly managed. Innovative solutions for improving the process include (c.1) developing more advanced processes for pyrolysis and gasification to ensure the conversion of plastic waste into fuels and feedstocks for new plastic production; (c.2) improving depolymerization technologies to break down polymers into monomers, which can be repolymerized into high-quality plastics; (c.3) developing new catalyst technologies that efficiently convert mixed plastic waste into valuable chemicals and new plastic materials; (c.4) government support through regulations and incentives as part of broader waste management and sustainability goals; and (c.5) collaboration between chemical industries, waste management firms, and governments to scale up chemical recycling infrastructure.
- (d)
- Quaternary Recycling (Energy Recovery)—The process of converting plastic waste into energy typically involves methods such as incineration, pyrolysis, or gasification. The main products of the three methods mentioned here include liquid oil (which can be refined into fuels), gases (which can be used as energy sources), and char (a solid residue), and syngas can be used to generate electricity, produce hydrogen, or serve as a building block for chemical production. Quaternary recycling is vital for managing plastic waste, especially when other recycling methods are impractical. For instance, quaternary recycling, which operates at high temperatures between 450 and 700 °C, is suitable for handling composite materials containing carbon fibers. This approach reduces landfill use and recovers energy from plastics, contributing to a more sustainable waste management system. However, it can release harmful emissions, including greenhouse gases and toxic substances, if not properly managed. Therefore, careful management is essential to minimize environmental pollution. Additionally, the financial aspect is significant, as pyrolysis and gasification require substantial investment in technology and infrastructure and can be energy-intensive.
With the growth in the production capacity of biodegradable plastics, another process to take into account for plastic waste management is so-called “Biological Recycling”. Biological recycling, also considered as “tertiary recycling” or “organic recycling”, leverages microorganisms or enzymes to break down plastics into their basic components. It is a process completely contrary to the traditional methods previously mentioned, such as mechanical and chemical recycling. The method uses biological processes to manage plastic waste, thanks to the use of aerobic composting, aerobic bacteria, and fungi. In fact, certain microorganisms (bacteria and fungi) can consume plastics as a food source. These microorganisms secrete enzymes that break down the long polymer chains in plastics into smaller, biodegradable molecules. Enzymes (which are biological catalysts), in turn, speed up chemical reactions [21,56].
The main steps in the process include (a) the identification and isolation of suitable microorganisms or enzymes capable of degrading specific types of plastics; (b) cultivation of microorganisms and cultivation in controlled environments to optimize their plastic-degrading capabilities; (c) application of microorganisms or enzymes to plastic waste, either in bioreactors or directly at waste sites; and (d) degradation, in which the plastics are broken down into smaller molecules such as carbon dioxide, water, and biomass.
Biological recycling is a promising method because, in addition to complementing existing recycling technologies, the method contributes to more sustainable waste management practices than traditional recycling methods, reducing carbon footprint and environmental impact. The process is versatile, as it can potentially handle a wide range of plastics, including those that are difficult to recycle mechanically or chemically. The main challenges of the method are related to its efficiency, as current biological processes can be slow and may not yet be efficient enough for large-scale application, on the one hand. On the other hand, some microorganisms or enzymes may only work on specific types of plastics, limiting their applicability. These observations draw attention to the need to continue developing research to discover and engineer microorganisms and enzymes that are more effective for plastic degradation.
The plastic recycling market is an already established market and has been growing with each passing day. The constant increases in demand and use of plastic in the manufacturing of lightweight components used in various industrial segments are the key factors that have been contributing to the constant growth of the market. In the economic context, the plastic recycling industry employs approximately 1.6 million people worldwide, and recycled materials supply 40% of the world’s raw material needs. Annually, the industry is investing around USD 20 million into job creation, improving recycling efficiency and environmental impact. The contribution of the sector towards the global GDP is projected to exceed USD 400 billion per year in 2028 [200]. In turn, the plastic recycling market size also continues to grow. In 2021, for instance, the global plastic recycling market size was valued at roughly USD 40 billion. The plastic recycling industry is projected to reach approximately USD 78 billion in 2031, growing at a CAGR of 7% during the forecast period of 2022 and 2031 [57]. In the regional context, the Asian Pacific plastic recycling market size was the region that most dominated the market, having accounted for around USD 16 billion in 2021, and projections indicate a growth of around 41.50% in 2030. The demand for construction materials such as flooring, insulation, fences, carpets, and roofing tiles for the construction of non-residential infrastructures, such as schools and hospitals, justifies the significant growth of the Asia Pacific market. In terms of application, the industrial sectors that absorb the most recyclable plastics include packaging, construction, textile, automotive, and others. The packaging sector, therefore, dominated the end-use segmentation in 2022, having reached a market size value of about 25.0%. The demand for key applications such as packaged meals, beverages, personal and household care, medicines, electrical and electronics, and textiles, and the global penetration of e-commerce are driving the demand for plastic packaging. On the other hand, the most demanded recycled plastic materials include PET, HDPE, LDPE, PP, and others. PET topped the list, with around 35% market share in 2021, with the mechanical process being the one that most dominated when compared to the chemical one [52,57].
The list of the main players or companies in the plastic recycling market includes [53] Jayplas, Corby, Nottinghamshire (UK), Joe’s Plastics Inc., Los Angels, CA (USA), Kuusakoski Goup Oy, Espoo (Filand), KW Plastics Inc., Try, AL (USA), Montello S.p.A., Montello (Italy), MTM Plastics GmbH, Niedergebra (Germany), Plasgran Ltd., Canbridgeshire, (UK), Plastipak Holdings Inc., Plymouth, MI (USA), Recycled Plastics UK, South Woodham Ferrers, Essex (UK), RJM International Inc., Tustin, CA (USA), Seraphim Plastics, Detroit, MI (USA), Shakti Plastics Industries, Mumbai (India), Teijin Limited, Tokyo (Japan), Ultra Poly Corporation, Portland, PA (USA), UltrePET, Albany, NY (USA), Veolia, Aubervilliers (France), Custom Polymers Inc., Charlotte, NC (USA), Envision Plastics, Reidsville, NC (USA), Plastic Recycling Inc., Indianapolis, IN (USA), MBA Polymers Inc., Hackensack, NJ (USA), and Green-O-Tech India, New Delhi (India). As can be seen from the list, the United States of America has the largest number of companies/players in the plastic recycling market.
However, despite the pomp and circumstance surrounding the recycling process, this tool is still far from being the solution to the plastic pollution problem that society is looking for. Figure 20 shows the share of plastic waste recycling worldwide in 2019 for some countries and regions. From the figure, it can be seen that recycling activities represent a minuscule part of the waste management process, when compared to other management alternatives such as landfill and incineration, shown in Figure 18 and Figure 19, respectively. The world today recycles only 9% of all waste plastic generated, as shown in Figure 21. The most preferred forms of plastic waste management are landfill, with almost 50%, followed by incineration, with approximately 19%. The remaining 22% is discarded in uncontrolled landfills, burned in open pits, or leaked in terrestrial or aquatic environments, especially in poorer countries [52,190].
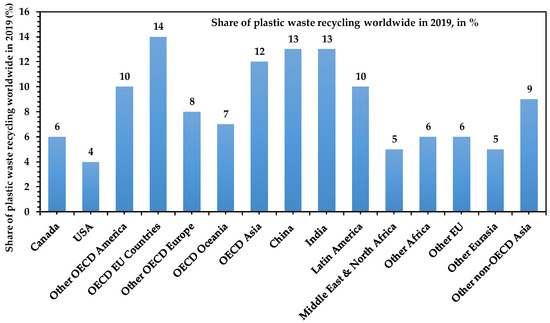
Figure 20.
Share of plastic waste recycling worldwide in 2019. Source: authors’ own elaboration based on data obtained from references [52].
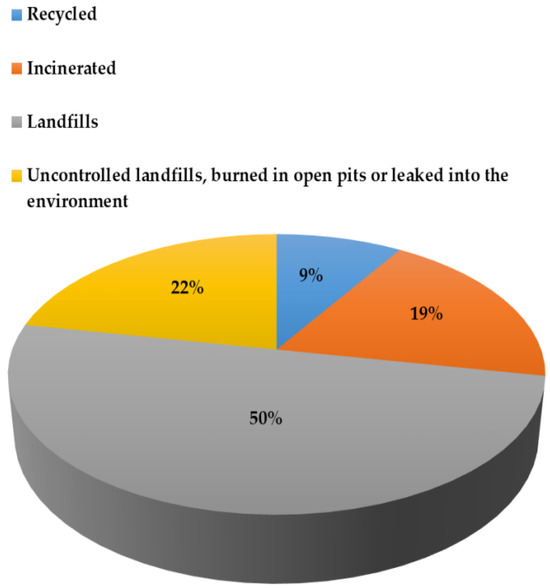
Figure 21.
Global recycling rate compared to other forms of plastic waste management. Source: authors’ own elaboration based on data obtained from references [190].
Asian countries are the ones that recycled the most plastic waste compared to European, American, Oceanian, and African countries. In individual terms, China and India lead the list, with 13% each, followed by Canada and the USA, with 6% and 4%, respectively.
The list of factors that contribute to the failure of the recycling process is huge and endless. In the following subsections, some of these factors are described.
- (a)
- Confused perception regarding the recycling process
Discussions about “Recycling” are still a myth and continue to divide opinions worldwide. There is a wing that has been arguing for decades that recycling can be a solution to the problem of waste plastic and the other is opposed to this idea. However, the vast majority of the world’s population agrees with the latter opinion, according to which recycling will not solve the problem of plastic pollution. The skepticism of this vast majority about the failure of recycling was further reinforced by an article published by “The Guardian Organization”, dated 15 February 2024. Titled “They lied-plastics producers deceived public about recycling”, the article reveals that plastic producers have known for more than three decades that recycling is not an economically or technically feasible plastic waste management solution but, even so, companies continued to make consumers believe that recycling is the magic solution to the plastic pollution problem.
Without a doubt, the best way to deal with whatever waste is to create a feasible plan in which consumer goods, after they have been used, are returned to the retailer, who in turn will return them to the manufacturers. This reverse cycle, once established, will in fact be a great success. Well, in the specific case of plastic materials, in addition to being an illusory, unrealistic, and cynical idea on the part of the plastics industry, it creates confusion among the public in general. Except for some well-defined cases such as single-use PET bottles and HDPE, which are used to make some types of plastic bags and detergent bottles, the recycling of other types of plastics such as PVC, LDPE, PP, PS, and PC is more complicated [10]. Recycling is still embryonic for much shorter-lived consumer products based on these five types of plastics. Economic aspects related to recycling, the difficulty of recycling multilayer plastic materials, the long and winding path of the process, and aspects related to the lack of quality and cost-competitiveness when compared to virgin materials are just some examples related to the difficulties of the recycling process [10,28]). The plastic manufacturing industry is aware of this situation, but unfortunately, it has been repeatedly and cynically promoting recycling as the solution to the pollution problem. In a sales context, the practice will certainly have a positive impact on producers, as it encourages greater consumption of new plastic materials, but the same cannot be said for the environment. The environment will be more and more harmed because, if the consumers think that recycling is working, then they will not care about the pollution issue. If the plastics industry really wants to be part of the solution, then it should not be guided by false claims but by fair and realistic information.
- (b)
- Recycling value chain too long, sinuous, and costly
Depending on the solid waste management system in place, the number of recycling steps may vary from one country or continent to another. However, the recycling of plastic materials, especially for post-consumer recycling processes, comprises the following key steps: collection, sorting, cleaning, size reduction, separation, and recycling.
The collection of plastic wastes is one of the most important steps for the success of the recycling process as a whole. The collection can be carried out via delivery or through curbside collection schemes. The delivery scheme is likely to work perfectly in advanced societies where the population is highly committed and informed about the risks of plastic to the environment. This is very common in advanced societies where people adhere to the scheme because they know they are doing the right thing for the environment. On the contrary, only the curbside collection scheme will be the most recommended, assuming obviously that the solid waste collection and management system is adequate and organized. Delivery schemes can also result in high collection rates where participation in the scheme is through an economic incentive. These findings allow us to conclude that the success of any of the collection schemes indicated above will depend very much on the level of engagement, commitment, and information to consumers, but above all, a strong financial investment in the business.
The sorting process of any type of waste consists of separating the materials that will be sent for recycling, according to their physical–chemical characteristics and according to the interest of recyclers. Considered as the initial step in the production of new materials, sorting is an essential step in the recycling process. Sorting can be carried out by both automatic and manual methods. Manual sorting involves the separation of household waste and the activity of waste pickers. It is an inefficient process and has low productivity. In turn, automatic sorting has the ability to receive large amounts of waste, making sorting faster and more efficient, with quality and reliability. Available technologies used in automatic screening include Fourier-transform near-infrared (FT-NIR) spectroscopy, X-ray detection, trommels and density-based air classification systems, ballistic separators, and sophisticated hydro-cyclones [28]. However, one of the major dilemmas with automatic garbage sorting is related to the high investment required in equipment and space. It is not a suitable method for small cities and societies with deficient solid waste management or treatment infrastructure.
- (c)
- Recycled plastics are not quality- and cost-competitive when compared to virgin materials
The recycling process of plastic materials is closely linked with the behavior of products under changed temperature. Well, looking from this perspective, it is clear that thermoplastics are more suitable for recycling than thermosets. Thermoplastics are composed of thread-like chain molecules tangled together. This group of plastics takes its name from the properties resulting from such structures. When heated to their melting point, thermoplastics soften into a liquid form, which allows them to be shaped or reshaped repeatedly to a desired designed mold and then become hard again as they cool. This process is reversible, implying that they can be reheated, granulated, re-molded, and recycled again and again.
However, despite the attractive characteristics mentioned above with regard to thermoplastic materials, unfortunately, the recycling process has limitations. The quality of the resulting product decreases with each recycling cycle. The degradation of polymer properties occurs in the plastics each time they are reused/recycled, and residual impurities (organic, mineral), which are difficult to eliminate, as well as inherent pollutants such as toxins, carcinogens, and other pollutants are behind this situation. These remaining impurities and pollutants have the potential to negatively affect some quality attributes of the plastic, such as color, clarity, or thermomechanical properties and severely degrade the functionality of the new product. The impurities can be eliminated using chemical solvents or heating at a temperature far higher than the degradation temperature, but this process will require additional financial resources. The elimination of pollutants also makes the recycling process too expensive and complicated.
One of the other factors that contributes to the failure of the recycling process is that current recycling technologies are unable to return plastic to the monomer or molecular state. Even for those polymers for which their raw materials are both easily sortable and homogeneous, it is difficult to return them to the monomer or molecular state, as can be achieved for traditional materials, such as metals or glass. Solutions for the recovery of polymer monomers have been researched and applied. Depolymerization is one of them, but it is far from being the ideal solution because, in addition to being valid only for polymers made by polycondensation that are also both sortable and homogeneous, the process remains expensive, energy-intensive, and sometimes polluting.
In addition to the challenges described above, the recycling industry still faces difficulties in recycling multi-layered items. Multi-layered items are devices which are made of multiple material types. One of the main advantages of multi-layered items is that they can combine the functional properties of different materials in one item. In the food industry, for example, the use of multi-layer plastic items aims at preserving food, maintaining its organoleptic properties and shelf life by putting up barriers against the diffusion of gases. In other sectors, such as the automotive, aeronautical, and civil construction sectors, the application of multi-layer plastic items may be related to the need to improve the mechanical strength of materials or products. The packaging industry stands out among the many destinations where multilayers find application.
The major challenge for recycling multi-layer plastic items is that most multi-layer plastic constituents are not easily and mechanically separable. Additionally, multi-layer plastic constituents are not compatible with each other because of their high level of inherent immiscibility and variability at the molecular level and differences in processing requirements at a macro-scale. Being inseparable, a solution to this problem would be grinding the item. But the grinding of multi-layered or multi-material items can result in contamination between different polymer types and seriously compromise the properties of the final product and its quality. According to [28], the presence of a small amount of PVC contaminant in a PET recycle stream will degrade the recycled PET resin owing to the evolution of hydrochloric acid gas from the PVC at a higher temperature required to melt and reprocess PET. However, PET in a PVC recycle stream will form solid lumps of undispersed crystalline PET. Both situations will negatively impact the value and quality of the recycled material. Any attempt at decontamination will obviously demand additional financial resources, which will make the process too expensive and complicated.
From the above, it is evident that with the current infrastructure and technologies, the recycling process becomes technically and economically unfeasible, and physical recycling into high-purity and high-quality material will continue to be far from reality. In this way, for the plastic industry, it will always be much cheaper to produce new plastic than using recycled plastic, a situation always expected when cheap oil floods the global markets.
One of the solutions to improve the quality of recycled materials and make them more competitive when compared to virgin materials is the use of virgin plastic mixed with recycled plastic. The use of virgin plastic mixed with recycled plastic is a common practice in manufacturing to balance cost, quality, and environmental impact. Adding as little as 30% virgin material may be enough to create a blended plastic with properties close to that of 100% virgin material. Although it does not necessarily mean the complete replacement of virgin plastic from fossil fuels, the incorporation of virgin plastic can greatly reduce the overall volume produced [201]. The combination of virgin and recycled plastics, in addition to creating more sustainable products without compromising on quality or performance, is an approach that plays in favor of the circular economy component and contributes to mitigating the environmental impact of plastic waste. Since virgin plastics are generally more expensive than recycled ones due to the cost of raw materials and production processes, blending recycled plastic with virgin plastic, manufacturers can reduce costs while maintaining acceptable product standards. Blending recycled plastic with virgin plastic can also help manufacturers comply with local or international legislation, thus increasing their environmental credentials. The main challenges, however, are related to the technical component; mixing virgin and recycled plastics can pose technical challenges, such as ensuring compatibility between different types of plastics and maintaining consistent material properties. This draws attention to the pressing need for the development of advanced technologies. The advances in technology mentioned here must result from the improvement of existing ones, those that are part of the different levels of recycling previously indicated, including biological recycling.
- (d)
- Some recycling practices may simply be postponing the problem
As mentioned previously, the textile industry is one of the sectors that most consumes plastic materials. Several brands already use various synthetic plastic fibers to make clothes. Nylon, polyester, PVC, PE, PP, EVA, lycra, spandex, etc., are just a few examples of synthetic plastic fibers most commonly used for this purpose. The fashion industry, therefore, has been one of the biggest consumers of plastic in the sector. In addition to providing a good fit to the pieces, plastic fibers give more comfort and durability, at a lower cost [10]. Known as one of the industries with the greatest environmental impact on the planet, the textile industry has been receiving a lot of pressure for the need to review its relationship with the environment. Faced with this scenario, fashion designers have been shifting towards more creative and innovative alternatives. One of the most explored innovations is the partial or complete replacement of virgin plastic in their supply chain with recycled plastic fibers. The use of recycled plastic fibers constitutes an innovative practice that will contribute to the minimization of the environmental impacts caused by plastics. But the big question that hangs in the air is this: Will the use of recycled synthetic plastic fibers in clothes really solve the pollution problem? Unfortunately, it will not. A careful analysis of recycled plastic usage in clothes indeed indicates that the plastic pollution problem, rather than being solved, is simply being shifted from the consumer or producer to the fashion industry, but above all, it is being postponed to an uncertain future. The use of recycled plastic can even be an effective and better solution when compared to virgin petroleum-based plastic, but the question here is this: What will be done with these recycled plastic-based clothes after use? Another issue is that every time that the garment is washed, microscopic plastic particles are released into the water streams, poisoning seafood and eventually human beings. The problem of microplastic particles might even be worse compared to macroplastics because, unlike the latter, which can be collected and separated and eventually reused, microplastics such as those that come from polyester clothing will hardly be able to receive the same treatment.
In order to bridge the gap between the convenience of recycled plastic and the environmental benefits of the material, some fashion companies have been exploring the use of biodegradable plastics. What is intended is that at the end of the useful life of the garment, it can be placed in a compost bin and decomposed. This is undoubtedly a wise and encouraging idea, but since it is not yet known exactly under what specific environmental conditions (temperature, pressure, and humidity) these materials decompose, it is clear that this is still far from being an ideal solution to the pollution problem. More details about biodegradable plastics are presented in the following section.
8.2. Possible Solutions for Improving Plastic Waste Management
8.2.1. Improving Plastic Waste Recycling
Notwithstanding the plastic industry’s continued promotion of recycling as a solution to the plastic waste pollution issue, the above findings demonstrate that recycling is still far from being the golden bullet that society seeks. Recycling is still embryonic for so much waste plastic in the world, except for some well-defined cases such as PET bottles. The plastics sector must go further in its quest for more sustainable solutions that do not compromise the characteristics or quality of the end-product or its uses. As mentioned in previous sections, one solution to the issue is to assess the feasibility of altering existing plastic manufacturing techniques to make them more environmentally friendly. For example, concentrating on the manufacturing of plastic materials that are 100% recyclable, as well as encouraging recycling, would represent huge strides in the right direction toward solving the issue. Developing mechanisms that ensure the manufacture of entirely recycled plastics while also allowing it to be reused again, hence lessening the strain on natural resources, will also lead the world to a point when the notion of plastic waste will no longer exist.
Although this may not be the case, it is feasible to find solutions that can help to improve the current practices inherent in the recycling process. In fact, advances in recycling will require some of the following actions:
- (a)
- Since it is not feasible to alter present plastic manufacturing techniques to generate more environmentally friendly materials, maybe the greatest approach would be to develop plastic recycling systems. Sometimes, the rejection of the use of recycled plastic is not a result of its potential detrimental effect on the mechanical properties of the finished product, but rather its aesthetic look. Thus, advanced polymer processes such as the co-injection molding technique can be explored for the tuning of the aesthetic value of the recycled plastic regardless of the possible increase in production cost.
- (b)
- Recycling is a civic responsibility in developed nations but an economic component in developing countries. Recycling programs, however, will need education and awareness in both circumstances. In order to achieve this goal and provide an effective education, investing in children’s education from a young age in order to encourage selective sorting of plastic waste from their houses may be the greatest way. Nonetheless, the success of this activity will rely on additional cooperative efforts from several stakeholders, which includes the government, policy makers, industry, and others. The plastics sector would seek out creative solutions for its operations while government and policy officials are occupied with planning and putting into effect strict reforms and regulatory measures that encourage large-scale collection and sorting of plastic garbage.
- (c)
- Another approach is the introduction of environmental taxes and legislative ban on certain single-use plastics as per the UNEP [202]. Although some countries have passed a legislative ban on plastic bags and implemented it or have passed a law with the intention of implementation, with the increased use of plastic (single-use masks, gloves, and bottles for sanitizers) due to COVID-19, the implementation of these policies has been set back.
- (d)
- Additionally, single-use plastic manufacture needs to be curtailed or highly taxed by the government and the consumers charged a fee for plastic use, which will incentivize behavioral change.
- (e)
- Moreover, the discouragement of the incineration of garbage and the usage of landfills for untreated waste might be another regulatory solution. A financial incentive for recycling might be provided by high landfill charges.
- (f)
- Another legal step to consider is the extension of the plastic industry’s responsibilities via deposit–refund programs or any other means, similar to what has been occurring in Germany, Australia, and the United Kingdom [28]. Importers and merchants should share responsibility. These synergistic activities, however slight, will reduce plastic pollution.
- (g)
- Recycled plastics are neither as high-quality nor as inexpensive as virgin materials, as was described in the preceding sections. This problem can be solved by giving free access to high-purity materials to recycling facilities in developing countries.
- (h)
- One of the destination markets for recycled materials, given their low quality when compared to virgin material, would be for the production of items for non-critical applications, applications that do not require, for example, high pressures or tensions. Garbage bags, pipes for irrigation activities, drainage pipes, cones for public road signs, vases, and hygiene materials such as brooms are just some of these applications. The idea would be to use recycled resins and blend them with virgin resin in the required proportions.
- (i)
- To solve the limitations of recycling multi-layer plastic materials, it will include the synthesis of multifunctional polymeric materials that can combine numerous properties into one. Nanotechnology, an emerging scientific and cross-cutting field, might be part of the solution. Nanotechnology is a field of applied science focused on design, formation, identification, and application of materials and devices on the nanoscale (1–100 nm). Nanomaterials have superior properties relative to bulk materials, such as increased catalytic activity, electrical conductivity, surface area, chemical activity, etc. Nanotechnology has been shown to be one of the most powerful scientific topics, with a wide range of applications in energy, medicine, agriculture, and environment sectors. The use of nanotechnology, for example, has allowed the generation of innovative and smart solutions such as the design of recyclable food packaging materials with longer shelf life, thus reducing food waste [203]. In regards to plastic recycling, the application of nanotechnology would enable the creation of so-called “polymer nanocomposites” by the inclusion of inorganic nanofillers to enhance polymer characteristics, allowing them to be employed in a range of applications. Nevertheless, using nanoclays to reduce production costs is the best option. The recommendation for the usage of nanoclays is based on economic and environmental considerations. Nanoclays are inexpensive natural materials that are widely available in all nations. Even after the necessary treatments, their price is still acceptable due to the huge increase in the characteristics of the unfilled polymer or when compared to polymer nanocomposites filled with other standard nano-materials such as carbon nanotubes, carbon nanofibers, and graphene.
- (j)
- In order to achieve the combined and desired properties of hard-to-blend polymers resulting from incompatible resins of multi-layer or inseparable materials, recyclers can turn to additives called compatibilizers, a practice that actually is already a reality.
- (k)
- One of the most significant barriers to recycling is the absence of widely accepted standards and enough knowledge of the composition and behavior of various plastics. This circumstance might be the result of issues with firm trade secrets. Product standards must be established among firms to facilitate greater recycling efficiency. Knowledge of plastics is essential because it will allow some of these recovered polymer products to be employed in well-defined applications.
8.2.2. Converting Plastic into Value-Added and Useful Materials, Waste Management Technologies and Strategies
Waste plastic may be converted into value-added and useful materials or chemicals, but this will require creative and innovative ideas, including, obviously, innovative research. Some of these ideas are presented below.
- (a)
- Plastic waste can be converted into building materials, which can find applications, for instance, in pavement laying, the concrete industry, as an asphalt binder in road construction projects, and in the production of bricks for building housing. Studies, although still in the embryonic stage, have already shown, for example, that cement bricks made using plastic material as an additive are durable and exhibit insulating and waterproof properties, hence their potential use as building materials for regions prone to humidity and hot climates.
- (b)
- Plastic waste such as PE can be readily used as an oxidizer for household waste in incineration facilities. This is due to its high power or calorific value, also known as heating value, which is equivalent to that of fuel. Thus, plastic waste can be converted into energy technology contributing to sustainable development [204].
- (c)
- Discarded plastic can be used in the production of carbon-based compounds. Among the carbon-based compounds, the highlight goes to activated carbon [205]. Given its power in removing contaminants from water and adsorbing greenhouse gases, activated carbon has a guaranteed market in the field of environmental remediation, in an approach to achieve circular economy.
- (d)
- Discarded plastic can be converted into nanomaterials such as nanofoam and carbon nanotubes, where the latter finds wide applications in energy storage, device modelling, automotive parts, hydrogen storage, electrochemical supercapacitors, and construction [206].
- (e)
- Last but not least, waste plastic can be converted into synthetic fuels and chemicals [207]. These can include succinic, glutaric, and adipic acid, which can be obtained from HDPE waste. These acids in turn could then be converted to plasticizers for producing biodegradable polylactic acid (PLA) plastic. In addition, PE can be upcycled to long-chain alkylaromatics by tandem hydrogenolysis/aromatization, which could be sulfonated to form biodegradable surfactants [208,209].
Much of the plastic waste accumulated in the environment today is generally managed through conventional techniques such as landfilling, incineration, dumping, and recycling. However, due to the large amounts of waste generated annually and given the fact that a large fraction is non-biodegradable plastic waste, these techniques have proven to be ineffective at decreasing the quantity of discarded plastic waste. On the other hand, techniques such as landfills and incineration are harmful to the environment. To overcome these situations, researchers worldwide have been looking for alternative solutions that can lead to sustainable and perhaps environmentally friendly plastic waste management. To this end, many advanced technologies and emerging strategies have been reported, and these include (i) hydrocracking or hydrogenation, (ii) gasification, (iii) chemolysis, (iv) alcoholysis, (v) hydrolysis, (vi) methanolysis, (vii) microwave-assisted conversion, (viii) plasma-assisted conversion, (ix) supercritical water conversion, (x) photo reforming, and (xi) compatibilization [56,210]. However, the above-mentioned technologies and strategies are not a magic wand for the plastic waste problem. They have their own technical and economic limitations. Some of these limitations are described below.
- (a)
- Hydrocracking, a process in which long-chain hydrocarbons are converted into small molecules by the addition of hydrogen in the presence of catalysts under high pressure, is a costly process, as it requires high-cost equipment.
- (b)
- Chemolysis, also defined as depolymerization or solvolysis, is actually a recycling process with a resource recovery component. The major disadvantage of the technology is the fact of being highly dependent on the type of plastic, encountering limitations in recycling a mixture of different plastics.
- (c)
- In gasification technology, plastic waste is degraded by using air, steam, and oxygen via fixed beds, fluidized beds, and enclosed flow gasifiers to generate synthesis gas, which is an environmentally friendly gas compared to combustion. The synthesis gas produced includes CO, H2, and CH4. One of the major disadvantages of this technology is the production of hazardous gases such as CO2, nitrogen oxide, sulfur oxide, and hydrocarbons. Additionally, the syngas produced has a low calorific value due to the use of air as a gasification agent.
- (d)
- Microwave-assisted conversion technology, although considered one of the efficient routes for recycling plastic waste and despite the fact that it contributes to the circular economy, has a disadvantage in that it requires electrical power and microwave adsorbents, a situation that, in a certain way, limits large-scale/industrial production.
- (e)
- Plasma-assisted conversion technology is the process of producing hydrogen species in the form of radicals and ions that then break the C-C bond in the polymer structure to produce syngas. The technique has the advantage of producing products with a relative quality and higher yield. The main limitation of the process is that it involves higher energy utilization.
- (f)
- Supercritical water conversion is the technology seen as appropriate for producing efficient and clean energy from plastic waste. However, the technique will have limitations in large-scale production as, for long periods of operation, there is a risk of reactor clogging.
- (g)
- Compatibilization is seen as one of the promising technologies to overcome the difficulties of blending and recycling materials such as composite plastics and flexible packaging items through compatibilizers. However, the major limitation is related to the cost component; the process involves high costs due to the long residence times of the reactions.
The findings above make it clear that despite researchers’ efforts, the world is still far from finding an effective solution to the problem of waste plastic. To achieve meaningful results, solid waste management requires environmentally sound technologies and strategies for the entire chain, from the primary collection, transportation, treatment, disposal, and recycle and recovery stage. Most current technologies and strategies are in an embryonic and laboratory phase, especially emerging strategies. Further research needs to be carried out and innovative ideas also need to emerge to overcome the technical and operational costs issues associated with the matter. The big challenge for the emerging strategies described above lies in the need to scale up. While current technologies and strategies are not solving the environmental problem caused by waste plastic, the most effective solution would be to reduce the amount of plastic waste dispersed in cities and rivers.
8.2.3. Bioplastics as Alternative Materials
As alternatives to the previously described plastic waste management approaches or practices, scientists are searching for new, safer, and sustainable plastic technologies that can offer solutions without harming human health and the environment. Some innovators are developing bioplastics, which are made from plant crops and agro-industrial waste instead of fossil fuels, in an attempt to create materials that are more sustainable and environmentally friendly than petroleum-based ones. Other scientists and innovators are seeking to make plastics that are biodegradable. Biodegradable plastics are made from natural agricultural products such as corn or sugar cane. Making plastic that degrades in weeks or months rather than millennia is a daunting challenge. As a result, biodegradable polymers are viewed as the wave of the future. World production of bioplastics was 1.81 million t in 2022 and 2.18 in 2023, representing a growth of about 17% compared to 2022, as indicated in Figure 22 [211].
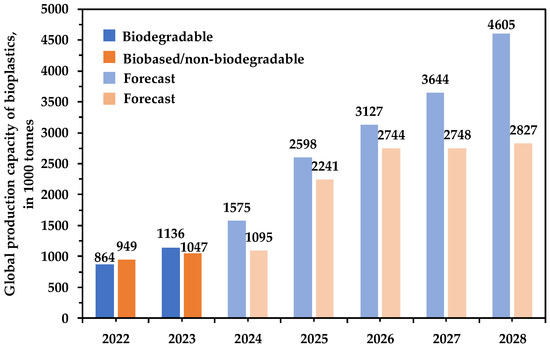
Figure 22.
Global production capacities of bioplastics (in 1000 t). Blue and orange bars indicate the historic figures in 2022 and 2023; lighter blue and orange bars indicate the forecasts of historic trends to 2028. Source: authors’ own elaboration based on data obtained from reference [211].
Biodegradable bioplastics accounted for 0.86 and 1.14 million t of the total capacity in 2022 and 2023, respectively. Worldwide production capacity is expected to grow to approximately 7.43 million t in 2028, with 4.61 million t being the volume of biodegradable bioplastics. When compared to the global production of plastic in 2022 (Figure 1), this represented about 0.5 percent of the over 400.3 million t for 2023.
The global market size of bioplastics in 2022 was valued at USD 8.4 billion and is projected to reach a value of USD 19.2 billion by 2030 at a CAGR of 11.1% from 2023. The global biodegradable plastic market size in turn, was USD 5.28 billion and is expected to reach USD 14.43 billion in 2030 [212,213].
Bioplastics are thought to be more environmentally friendly than traditional petroleum-based non-biodegradable plastics. The following are some of the benefits of biodegradable plastics: (i) they create a circular economy; (ii) they lower CO2 emissions by reducing the use of petroleum-based plastics; (iii) they lead to fewer single-use plastics; (iv) they reduce waste disposal costs; and (v) they provide a valuable end product to the world. However, despite the hype surrounding these materials, several experts argue that biodegradable plastics will not address the worldwide plastic epidemic [214]. The use of bioplastics alone will not solve the waste problem, as their composting or incineration produces emissions similar to, if not greater than, those emitted by hydrocarbon plastics. They do not disintegrate into harmless byproducts in the environment as rapidly or fully as the proponents would want us to believe. It is not as simple as merely putting them into the environment and expecting nature to take care of them. Biodegradable polymers, for example, do not breakdown in the marine environment [215]. Biodegradation needs a specialized environment in which temperature, humidity, duration, and pressure factors are crucial, an environment that is not often reached in most existing waste treatment plants. If consumers are unable to compost at home, biodegradable plastic will face the same issues as conventional plastics.
One of the primary challenges with bio- and biodegradable polymers in the industrial sector is their cost and characteristics. Biopolymers are already offering promising properties for a variety of applications. However, when compared to equivalent petroleum-based ones, bioplastics and biodegradable plastics often feature relatively poor properties (mechanical, physical, and processing properties). This restricts their direct usage in high-tech applications, and the issue becomes critical when it comes to engineering applications. On the other hand, the equipment for bio- and biodegradable plastics processing is more costly. This situation contributes to the high commercialization prices of these materials. Polylactic acid (PLA), for instance, one of the biodegradable plastics, typically costs 20 to 50% more than comparable materials. All of these drawbacks make biodegradable polymers less competitive in most applications when compared to similar petroleum-based plastics.
Land users for food production, in turn, are concerned about the extent of manufacturing bioplastics. Since they are created from plant crops and natural agricultural products as raw materials, land users believe that meeting the current world demand for plastic would necessitate enormous tracts of land, taking away valuable property currently used to produce food crops. Indeed, there seem to be reasons for so much skepticism on the part of food producers. In 2022, for example, the total agricultural land area that was used in the production of bioplastics amounted to approximately 0.8 million hectares. This area is expected to triple by 2027, which represents almost 0.058 percent of the global agricultural area currently available [215].
The use of multidisciplinary research between scientists and technological innovation can contribute to improving the properties of biopolymers. Here again, the use of nanofillers through the concepts of nanotechnology previously mentioned is one of the solutions to be intensely explored. The addition of inorganic nanofillers has been shown to significantly improve biodegradable plastics’ properties, allowing them to be used in different fields of application. Continuous and innovative research is needed regarding the specific environmental conditions, including the time when these materials actually biodegrade. Continuous and innovative research is also required to identify technologies that will undoubtedly reduce the cost of biodegradable plastic manufacturing processes.
8.2.4. Public Support and Local Community Involvement in Improving Plastic Waste Management
Many regulatory and household-based instruments are in place and implemented worldwide to improve plastic waste management. The regulatory instruments include banning and taxation on single-use plastics and landfills and incineration taxes. For instance, bans and taxes on single-use plastics exist in more than 120 countries but this is still not enough to reduce the global pollution problem. One of the main disadvantages of banning single-use plastic, which contributes to its ineffectiveness, is related to the need of inexpensive alternatives, and as mentioned in Section 8.1.1, this action encourages customers to switch to reusable bags. The inefficiency draws attention to the need to look for other, more proactive solutions to ensure sustainable production and consumption of plastics. In addition to the possible solutions previously indicated, public support and local community involvement are actions that play an essential role in the fight to reduce the negative impacts of plastic waste. In fact, public support and local community engagement are the powerhouses of waste management efforts. This is because waste management, particularly in the Global South, is more of a behavior problem than it is a technical one [216].
One of the critical measures to be adopted to secure public support is to increase public awareness or community campaigns. Public awareness, for example, can assist and encourage post-consumer recycling and encourage local authorities to organize the collection process of recyclable plastic materials through policy or legislation. Furthermore, with well-established public awareness, manufacturers and other businesses will be equally encouraged to develop and supply products with recycled content in line with public demand.
Local community involvement through community-based projects is another crucial factor to consider when dealing with issues related to sustainability and the environment. If well-designed and implemented, community-focused projects can be more effective than non-community-based ones, assuming that the local communities’ cultural and traditional behaviors are considered [216]. The community referred to here includes schools, low-income human settlements, and informal waste collectors. However, the successful involvement of communities will necessarily involve educating them about the dangers of plastic pollution, training them, providing them with safe working conditions and proper resources. As previously mentioned, plastic waste management is a form of civic duty for developed countries, while for developing countries, it is largely related to the economy and livelihoods. For developing countries, the success of community involvement will also depend on monetary incentives. Local communities can be influenced and engaged in active plastic waste collection. Using various innovative schemes, communities’ plastic waste management habits can be changed through monetary incentives. Extended responsibility for plastic producers mentioned in Section 8.1.1 above must also be considered. For this specific case, the responsibility should also fall on the industries or packaging companies in the plastic value chain. The plastics manufacturing industry and its global packaging network must assume an unconditional commitment and leadership and take actions that contribute to a planet free of plastic waste. Actions should fall on various stakeholders, for example, for the entire lifecycle of packaging—from the stage in which the plastic material is designed and produced to how they are reused and recycled. There are already living examples of these actions. For example, in Mexico, PetStar has developed a vertically integrated recycling chain with the Coca-Cola Company and partnered with informal workers to supply used plastic bottles [217]. Combining all these actions and actively empowering and motivating communities to participate in sustainability may also bring socio-economic benefits to communities, especially socially vulnerable populations. This set of actions can also provide opportunities for creating small businesses for local communities, an action that meets the sustainable development goals (The 2030 Agenda): Goal 11.
8.2.5. The Role of Governments, Policy-Makers and City Planners for Successful and Sustainable Plastic Waste Management
The various actions carried out worldwide, including banning and taxation of single-use plastics and landfills and incineration taxes, if properly planned and enforced, can effectively counter one of the causes of plastic overuse. Nevertheless, to tackle the roots of the problem, governments and policymakers need to introduce more and holistic plastic waste management systems. Governments and policymakers need to improve waste management practices and introduce financial incentives to change the habits of consumers, importers, retailers, and manufacturers, enacting robust regulatory instruments and policies that push for a more circular model of design and production of plastics. Governments must finance more research and development of alternative materials and waste treatment technology, raise consumer awareness, fund innovation, ensure plastic products are appropriately labelled, and carefully weigh possible solutions to the current crisis. Governments must engage a broad range of stakeholders in the decision-making process to tackle the crisis. Stakeholders include manufacturers, importers, retailers, environmental lobbies, mass media, civil society, tourism associations, and consumers. Government, especially local government intervention in cities, is critical in plastic waste management and enforcement. Once an adequate plastic waste management system is in place, city planners can pursue focused interventions, including banning certain types of plastic such as thin-film single-use plastics used in packaging. Nevertheless, the targeted interventions mentioned here must be accompanied by appropriate policy reforms that consider the incentives and management structures that comply with the willing buyer and willing seller principle with social and environmental safeguards in hindsight. However, the above instruments/actions will only achieve meaningful results if the following principles of sustainable plastic waste policies are respected [218]:
- (a)
- Equity: Regulation should be fair to ensure that all the stakeholders contribute towards a change. Policies are better if they do not disproportionately place an unfair burden on any member of society.
- (b)
- Environmental effectiveness: A policy will only be effective if it can achieve the desired environmental goal.
- (c)
- Administrative feasibility: Administrative feasibility is closely dependent on the design of the policy and the effectiveness of the administrative authority charged with enforcement.
- (d)
- Cost efficiency: The policy must have the ability to produce the maximum environmental benefit at the lowest cost.
- (e)
- Incentives for improvement: The policy should provide a strong incentive for individuals and groups to find new innovative ways of reducing their impact on the environment.
- (f)
- Social and political acceptability: The policy should fit in with the government’s wider priorities, those of interest groups, as well as the mass media and the general public.
For the achievement of meaningful results and sustainable plastic waste governance through the actions mentioned above, it will also be necessary to consider the following roadmap:
- (g)
- Target the most problematic single-use plastics, as well as the current causes, extent, and impacts of their mismanagement.
- (h)
- Consider the best actions to tackle the problem (e.g., through regulatory, economic, persuasive, and voluntary actions), given the country’s socio-economic standing.
- (i)
- Assess the potential social, economic, and environmental impacts of the preferred instruments/actions. Issues such as “how will the poor be affected?” and “what impact will the preferred course of action have on different sectors and industries?” must be raised.
- (j)
- Identify and engage key stakeholder groups—retailers, consumers, industry representatives, local government, manufacturers, civil society, schools, waste pickers, environmental groups, and tourism associations—to ensure broad buy-in.
- (k)
- Raise public awareness about the harm caused by single-use plastics. Clearly explain the decision and any punitive measures that will follow.
- (l)
- Promote alternatives. Provide economic incentives to encourage the uptake of eco-friendly and fit-for-purpose alternatives that do not cause more harm.
- (m)
- Provide incentives to the industry by introducing tax rebates or other conditions to support its transition. Governments will face resistance from the plastics industry, including importers and distributors of plastic packaging. Give them time to adapt.
- (n)
- Use revenues collected from taxes or levies on single-use plastics to maximize the public good. Support environmental projects or boost local recycling interventions with the funds.
- (o)
- Enforce the chosen measure effectively, by making sure that there is a clear allocation of roles and responsibilities.
- (p)
- Monitor and adjust the chosen measure if necessary and update the public on progress.
8.2.6. International Co-Operation for Successful and Sustainable Plastic Waste Management
It is well known that the plastic pollution problem is a global problem. From this perspective, it is clear that nothing can change without collective actions dedicated to harnessing synergies in plastic waste management. Improved plastic waste management at a global level will require increased international co-operation platforms and partnerships between countries. This will contribute towards reducing plastic pollution and will go a long way in boosting innovation and supporting improved environmental standards, mainly for emerging markets and for low- and middle-income countries. To this end, developed countries, with the support of governments (at the global, regional, national, and local levels) and national and international governmental and non-governmental organizations, are called upon to use all kinds of resources at their disposal to help developing countries improve their plastic waste management processes. The actions to be carried out would include, for example, sharing best practices in plastic waste management, sharing regulatory instruments such as public policies, knowledge exchange, sharing waste management technologies, technical assistance for improving recycling infrastructure, and development of markets for recyclable materials, among other forms of international co-operation platforms.
8.2.7. Circular Economy Issue in Plastic Waste Management
It has become evident that the conventional model of plastic production, which consists of extracting the natural resources required to produce products and, at the end of their useful life, disposing of them into the waste stream, is no longer feasible. The current economic model of plastic production needs to shift from a system that produces low-value waste, by design, to a model in which plastic materials and their products are designed to be used, reused, repaired, and recycled. Plastic and its products must be designed in such a way that they can minimize the drawbacks to human health and the environment while maximizing the economic and societal benefits [7]. The circular economy model can constitute a strong alternative to the current linear model. The top priority of the circular economy is the conservation of natural resources, in close alignment with the United Nations Sustainable Development Goal 12 (SDG12), which encourages more sustainable consumption and production patterns. The main concept of the model is to use resources, products, and materials to their depletion at all times. At the end of their service life, these products and materials must be able to be recovered and reformulated into new products. The model allows products and materials to be circulated at their highest possible value. Figure 23 presents a proposal for a possible closed loop to be used for the management of resources and plastic waste, in a circular economy context. Emphasis, however, was given to petroleum-based materials, which are the most problematic.
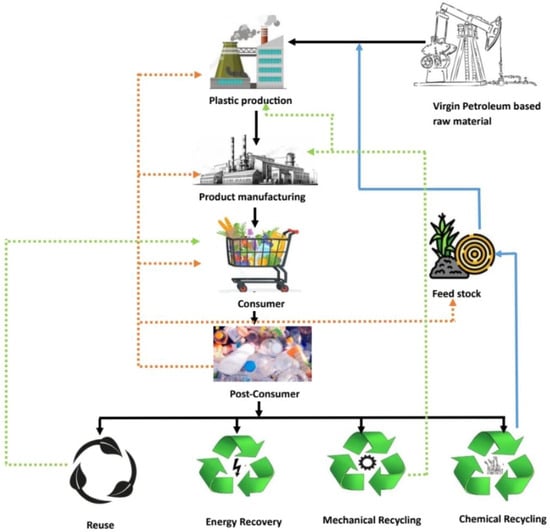
Figure 23.
Proposal of a closed loop to be used for resources and plastic waste management in a circular economy context. Source: authors’ own elaboration based on the information obtained from reference [21].
The success of the plastic circular economy model must be accompanied by the following strategies [6,21]:
- (a)
- Producing plastics from alternative non-fossil fuel feedstock.
- (b)
- Redesigning plastic manufacturing processes and products to enhance longevity, reusability, and waste minimization.
- (c)
- Collaboration between all sectors to encourage recycling and increase the value of plastic waste products. This must include business players, consumers, researchers, government, manufactures, enforcement agencies, policy makers, etc.
- (d)
- Encouraging sustainable business models which promote plastic products as services and encouraging sharing and leasing.
- (e)
- Developing robust information platforms to aid circular solutions.
- (f)
- Adopting fiscal and regulatory measures to support the circular economy.
Even though the circular economy will not completely solve the global plastic problem, this solution will help minimize plastic waste and keep materials in the economy and out of landfills and incinerators.
8.2.8. Adoption of the General Waste Management Hierarchy
The success of most of the solutions proposed above for plastic waste management depends on those actions that prioritize the recirculation of products and the conservation of resources. For this purpose and for the specific case of plastic waste management, the use of the general waste management hierarchy is crucial, respecting the following sequence [7,56]: (1) Reduce, (2) Reuse, (3) Repair, (4) Recycle, (5) Recover, and (6) Disposal. Here, number (1) represents the most preferred, and (6) the least.
- (a)
- Reduce—Reducing means practicing conscious and responsible consumption and involves buying less and focusing more on quality rather than quantity, especially single-use plastics. To this end, consumers have a major role. This includes reducing the use of plastics in general shopping packaging, food and beverage packaging, and bathroom products. In the technological and industrial context, reduction involves redesigning products or adopting business models that guarantee the conservation of resources.
- (b)
- Reuse—Reusing is one of the greatest allies in the fight against plastic waste and is considered an “inner loop” to enhance material productivity in a circular economy. Reuse avoids purchasing new products and, obviously, avoids new extraction of raw materials, saves energy associated with the production of materials, and reduces costs associated with transportation, as well as the impact that disposing of the object can have. Reusing is a way of valuing longevity, caring for and loving what already exists. In addition to being one of the best weapons against disposables, reuse also has immediate financial effects.
- (c)
- Repair—Whenever possible, repair is one of the most valuable options in the pyramid. In addition to being reused without requiring any processing, successfully repaired products can also contribute to conserving resources.
- (d)
- Recycle—As mentioned in the previous sections, recycling is an essential part of plastic waste management, but this practice cannot be seen as a one-size-fits-all solution to reducing waste. Most or almost all of the different recycling options face enormous challenges associated with economic viability, technical performance, legal status, and environmental concerns. For this reason, recycling appears in fourth place.
- (e)
- Recover—The success of recycling presupposes the use of homogeneous raw materials. However, in real life, it is not always like that. Waste plastic may come in mixed form with other waste or may be contaminated with organic material that may include pathogenic bacteria and viruses. In these cases, the plastic waste can be burned under controlled conditions, through pyrolysis and incineration, recovering the product in the form of energy. Mixed waste can also be recovered for the production of building materials such as blocks.
- (f)
- Disposal—Disposal is the least preferred option among the six. At this stage, nothing is recovered, and when not properly discarded, disposal has very significant environmental impacts.
9. Concluding Remarks
The authors recognize that the plastic pollution problem is real and needs to be resolved urgently. However, banning plastic does not seem to be a reasonable and rational measure to solve the problem. The vision of the world has to be guided by an economic model that minimizes the amount of plastics in the waste stream. Plastics have proved to be critical to modern life and that is why they have become the most popular and highly desirable and demanded materials for many industrial and household applications. During the recent deadly COVID-19 pandemic, for instance, the world has recognized the importance of having access to single-use plastic personal protection equipment. The terrible public health crisis would have been worse if societies did not have access to cheap single-use personal protection equipment such as gloves, protective gowns, face masks, and plastic sampling swaps for wide-scale COVID-19 testing.
The authors are of the opinion that there are other solutions for the plastic pollution problem without having to abandon a material that offers so many benefits to society. The minimization of the plastic pollution problem would involve developing reasonable and common-sense solutions based on scientific approaches as well as combined global objectives, efforts, and strategies. Nevertheless, the ban on plastic products must be balanced out against the potential risks that could be posed, for example, to the construction sector, the packaging sector, the automotive and aeronautical sectors, human healthcare issues, food, and water security as well as the general well-being of societies.
Recycling is by far seen as a “magical solution” to the plastic pollution problem. However, the authors think that there is still a long road ahead toward achieving a much higher rate of recycling, because as long as plastic materials are not made from a single polymeric material, then the idea of “recycling 100% of plastics” is not only unrealistic but could also create confusion among the public and delay the adoption of sensible and realistic solutions. An alternative to recycling is the development of biodegradable polymers, especially in packaging. However, this solution is far from being effective because biodegradation still requires specific pressure and temperature conditions that are not generally achieved in most existing waste treatment plants. On the other hand, for engineering applications, biodegradable plastics have limitations. This implies that new and innovative studies are still needed.
International co-operation and partnerships with sound guiding principles and policies can ensure that synergies are built and stakeholders (governments, policy makers, industry, importers, consumers, retailers, etc.) actively undertake their roles so that successful and sustainable plastic waste management is effectively carried out whilst considering different institutional mandates and responsibilities.
Many studies to date regarding microplastic particles have focused on the source of the particles, their distribution, transport, fate in different environments (air, food, freshwater, soil, and ocean), and toxicological effects, including toxicity mechanisms. However, many of these studies are not quite comprehensive, and beyond that, most of them have only focused on marine environments, meaning that new studies are needed to cater to the holistic fate of plastic waste in the different spheres of life.
While current technologies and strategies are not solving the environmental problem caused by waste plastic, the most effective solution would be to adopt the first two levels of the waste management hierarchy, which are “reduce” and “reuse”.
Author Contributions
Conceptualization, A.D.M.; methodology, A.D.M.; software, A.D.M.; investigation, A.D.M.; resources, A.D.M. and L.H.M.L.; writing—original draft preparation, A.D.M.; writing—review and editing, L.H.M.L., B.M., J.L.A., E.M., V.K.O. and S.D.M.; project administration, A.D.M. and L.H.M.L.; funding acquisition, A.D.M. and L.H.M.L. All authors have read and agreed to the published version of the manuscript.
Funding
This research was funded by the World Bank Group, through the Eastern and Southern Africa Higher Education Centres of Excellence Project Initiative (ACE II), and the European Union (Grant no. DCI-PANAF/2020/420-028), through the African Research Initiative for Scientific Excellence (ARISE), pilot programme. The contents of this document are the sole responsibility of the author(s) and can under no circumstances be regarded as reflecting the position of the World Bank Group, European Union, African Academy of Sciences, and the African Union Commission.
Conflicts of Interest
The authors declare no conflicts of interest.
References
- Thompson, R.C.; Swan, S.H.; Moore, C.J.; Vom Saal, F.S. Our plastic age. Philos. Trans. R. Soc. B 2009, 364, 1973–1976. [Google Scholar] [CrossRef]
- Geyer, R.; Jambeck, J.R.; Law, K.L. Production, use, and fate of all plastics ever made. Sci. Adv. 2017, 7, e1700782. [Google Scholar] [CrossRef]
- Plastics—The Facts 2020. Available online: https://plasticseurope.org/knowledge-hub/plastics-the-facts-2020/ (accessed on 5 May 2021).
- Annual Production of Plastics Worldwide from 1950 to 2021. Available online: https://www.statista.com/statistics/282732/global-production-of-plastics-since-1950/ (accessed on 7 April 2023).
- Great Italian Food Trade: Emissões de Plástico e Gases de Efeito Estufa, Uma Emergência a Ser Evitada. Estudo Científico. Available online: https://www.greatitalianfoodtrade.it/pt/imballaggi-e-moca/plastica-ed-emissioni-di-gas-serra-unemergenza-da-prevenire-studio-scientifico/ (accessed on 4 January 2024).
- Plastics and the Circular Economy. Available online: https://www.thegef.org/sites/default/files/publications/PLASTICS%20for%20posting.pdf (accessed on 6 December 2020).
- Ho Rouch, D.A. Plastic future: How to reduce the increasing environmental footprint of plastic packaging. Clarendon Policy Strategy Group 2021, 11, 1–43. [Google Scholar]
- Improving Plastics Management: Trends, Policy Responses, and the Role of International Co-Operation and Trade. Available online: https://www.oecd-ilibrary.org/environment/improving-plastics-management_c5f7c448-en (accessed on 13 February 2021).
- Perspectives on Plastic Waste Generation and Management: Challenges and Possible Solutions for Sustainable Cities and Coasts in Africa—A Case Study of the Western Indian Ocean Region. Available online: https://symposium.wiomsa.org (accessed on 7 April 2022).
- A Personal Perspective on Polymer Recycling: Challenges and Possible Solutions. November 2020 PPS Newsletter—Information to Polymer Processing Society Members. Available online: https://cms.tpps.org/wp-content/uploads/2023/09/NEWSLETTER-PPS-11-2020-November.pdf (accessed on 17 June 2021).
- A European Strategy for Plastics in a Circular Economy. Available online: https://ec.europa.eu/environment/circular-economy/pdf/plastics-strategy.pdf (accessed on 13 June 2021).
- Gibovic, D.; Bikfalvi, A. Incentives for Plastic Recycling: How to Engage Citizens in Active Collection. Empirical Evidence from Spain. Recycling 2021, 6, 29. [Google Scholar] [CrossRef]
- Jambeck, J.; Hardesty, B.D.; Brooks, A.L.; Friend, T.; Teleki, K.; Fabres, J.; Wilcox, C. Challenges and emerging solutions to the land-based plastic waste issue in Africa. Mar. Policy 2018, 96, 256–263. [Google Scholar] [CrossRef]
- Jambeck, J.R.; Geyer, R.; Wilcox, C.; Siegler, T.R.; Perryman, M.; Andrady, A.; Law, K.L. Plastic waste inputs from land into the ocean. Science 2015, 347, 768–771. [Google Scholar] [CrossRef]
- Ocean Pollution: A Deep Dive into Current Statistics and Trends. Available online: https://www.greenmatch.co.uk/ocean-pollution-facts (accessed on 18 January 2024).
- Lavers, J.L.; Bond, A.L. Exceptional and rapid accumulation of anthropogenic debris on one of the world’s most remote and pristine islands. Proc. Natl. Acad. Sci. USA 2017, 114, 6052–6055. [Google Scholar] [CrossRef]
- Kehinde, O.; Ramonu, O.J.; Babaremu, K.O.; Justin, L.D. Plastic wastes: Environmental hazard and instrument for wealth creation in Nigeria. Heliyon 2020, 10, e05131. [Google Scholar] [CrossRef]
- Dutta, J.; Choudhury, M. Plastic pollution: A global problem from a local perspective. J. Waste Manag. Exnobiot. 2018, 1, 000102. [Google Scholar]
- United Nations Environment Programme. Valuing Plastics: The Business Case for Measuring, Managing and Disclosing Plastic Use in the Consumer Goods Industry; United Nations Environment Programme: Nairobi, Kenya, 2014; Available online: https://wedocs.unep.org/handle/20.500.11822/9238 (accessed on 13 June 2021).
- Gallo, F.; Fossi, C.; Weber, R.; Santillo, D.; Sousa, J.; Ingram, I.; Romano, D. Marine litter plastics and microplastics and their toxic chemicals components: The need for urgent preventive measures. In Analysis of Nanoplastics and Microplastics in Food; CRC Press: Boca Raton, FL, USA, 2020; pp. 159–179. [Google Scholar]
- Ncube, L.K.; Ude, A.U.; Ogunmuyiwa, E.N.; Zulkifli, R.; Beas, I.N. An overview of plastic waste generation and management in food packaging industries. Recycling 2021, 6, 12. [Google Scholar] [CrossRef]
- Kumar, R.; Verma, A.; Shome, A.; Sinha, R.; Sinha, S.; Jha, P.K.; Kumar, R.; Kumar, P.; Shubham; Das, S.; et al. Impacts of Plastic Pollution on Ecosystem Services, Sustainable Development Goals, and Need to Focus on Circular Economy and Policy Interventions. Sustainability 2021, 13, 9963. [Google Scholar] [CrossRef]
- Ayeleru, O.O.; Dlova, S.; Akinribide, O.J.; Ntuli, F.; Kupolati, W.K.; Marina, P.F.; Blencowe, A.; Olubambi, P.A. Challenges of plastic waste generation and management in sub-Saharan Africa: A review. J. Waste Manag. 2020, 110, 24–42. [Google Scholar] [CrossRef] [PubMed]
- Godfrey, L. Waste plastic, the challenge facing developing countries—Ban it, change it, collect it? Recycling 2019, 4, 3. [Google Scholar] [CrossRef]
- Dayrit, F.M. The Challenge of Single-Use Plastic. Faculty Publication. 2019 (Archīum Ateneo). Available online: https://archium.ateneo.edu/chemistry-faculty-pubs/140 (accessed on 17 June 2021).
- Babayemi, J.O.; Nnorom, I.C.; Osibanjo, O.; Weber, R. Ensuring sustainability in plastics use in Africa: Consumption, waste generation, and projections. Environ. Sci. Eur. 2019, 31, 60. [Google Scholar] [CrossRef]
- Horvath, B.; Mallinguh, E.; Fogarassy, C. Designing business solutions for plastic waste management to enhance circular transitions in Kenya. Sustainability 2018, 10, 1664. [Google Scholar] [CrossRef]
- Hopewell, J.; Dvorak, R.; Kosior, E. Plastics recycling: Challenges and opportunities. Philos. Trans. R. Soc. B Biol. Sci. 2009, 364, 2115–2126. [Google Scholar] [CrossRef] [PubMed]
- Da Costa, J.P.; Rocha-Santos, T.; Duarte, A.C. The Environmental Impacts of Plastics and Micro-Plastics Use, Waste and Pollution: EU and National Measures; European Union: Brussels, Belgium, 2020. [Google Scholar]
- Callister Junior, W.D.; Rethwisch, D.G. Ciência e Engenharia de Materiais: Uma Introdução, 5th ed.; Livros Técnicos e CientífiMco: Rio de Janeiro, Brazil, 2002; pp. 1–4. [Google Scholar]
- Padilha, A.F. Microestrutura e Propriedades; Hemus: São Paulo, Brazil, 1997; p. 18. [Google Scholar]
- Young, R.J.; Lovell, P.A. Introduction to Polymers, 3rd ed.; CRC Press: Boca Raton, FL, USA, 2011; pp. 1–12. [Google Scholar]
- Rennie, A.R. Thermoplastics and Thermosets. In Mechanical Properties and Testing of Polymers; Swallowe, G.M., Ed.; Kluwer Academic Publishers: New York, NY, USA, 1999; Volume 3, pp. 23–33. [Google Scholar]
- Piringer, O.G.; Baner, A.L. Plastic Packaging: Interactions with Food and Pharmaceuticals, 2nd ed.; John Wiley & Sons: Hoboken, NJ, USA, 2008; p. 17. [Google Scholar]
- Harper, C.A. Handbook of Plastics Technology: The Complete Guide to Properties and Performance; McGraw-Hill Education: New York, NY, USA, 2006; pp. 1.1–3.76. [Google Scholar]
- Nagalakshmaiah, M.; Afrin, S.; Malladi, R.P.; Elkoun, S.; Robert, M.; Ansari, M.A.; Karim, Z. Biocomposites: Present trends and challenges for the future. In Green Composites for Automotive Applications; Elsevier B.V.: Amsterdam, The Netherlands, 2019; pp. 197–215. [Google Scholar]
- Hablot, E.; Donnio, B.; Bouquey, M.; Avérous, L. Dimer acid-based thermoplastic bio-polyamides: Reaction kinetics, properties and structure. Polymer 2010, 25, 5895–5902. [Google Scholar] [CrossRef]
- de Espinosa, L.M.; Meier, M.A. Plant oils: The perfect renewable resource for polymer science. Eur. Polym. J. 2011, 47, 837–852. [Google Scholar] [CrossRef]
- Matadi, R.; Hablot, E.; Wang, K.; Bahlouli, N.; Ahzi, S.; Avérous, L. High strain rate behaviour of renewable biocomposites based on dimer fatty acid polyamides and cellulose fibres. Compos. Sci. Technol. 2011, 71, 674–682. [Google Scholar] [CrossRef]
- Petersson, L.; Oksman, K. Biopolymer based nanocomposites: Comparing layered silicates and microcrystalline cellulose as nanoreinforcement. Compos. Sci. Technol. 2006, 66, 2187–2196. [Google Scholar] [CrossRef]
- Satyanarayana, K.G.; Arizaga, G.G.; Wypych, F. Biodegradable composites based on lignocellulosic fibers—An over-view. Prog. Polym. Sci. 2009, 34, 982–1021. [Google Scholar] [CrossRef]
- Mohanty, A.; Misra, M.; DrzaL, L. Sustainable bio-composites from renewable resources: Opportunities and challenges in the green materials world. J. Polym. Environ. 2002, 10, 19–26. [Google Scholar] [CrossRef]
- Lunt, J. Large-scale production, properties and commercial applications of polylactic acid polymers. Polym. Degrad. Stab. 1998, 59, 145–152. [Google Scholar] [CrossRef]
- Patel, M.; Bastioli, C.; Marini, L.; Würdinger, E. Life-cycle Assessment of Bio-based Polymers and Natural Fiber Composites. Biopolym. Online Biol. Chem. Biotechnol. Appl. 2005, 63, 321–332. [Google Scholar]
- Storz, H.; Vorlop, K.D. Bio-based plastics: Status, challenges and trends. Appl. Agric. For. Res. 2013, 63, 321–332. [Google Scholar]
- Babu, R.P.; O’Connor, K.; Seeram, R. Current progress on bio-based polymers and their future trends. Prog. Biomater. 2013, 2, 8. [Google Scholar] [CrossRef] [PubMed]
- Rudin, A.; Choi, P. The Elements of Polymer Science and Engineering: An Introductory Text for Engineers and Chemists, 3rd ed.; Academic Press: Oxford, UK, 2013; pp. 1–62. [Google Scholar]
- Andrady, A.L.; Neal, M.A. Applications and societal benefits of plastics. Philos. Trans. R. Soc. 2009, 364, 1977–1984. [Google Scholar] [CrossRef] [PubMed]
- Plastic Pollution by Country 2024. Available online: https://worldpopulationreview.com/country-rankings/plastic-pollution-by-country (accessed on 8 January 2024).
- World Plastics Production: Plastics—The Fast Facts 2023. Available online: https://plasticseurope.org/knowledge-hub/plastics-the-fast-facts-2023/ (accessed on 15 January 2024).
- Plastics, Polymers & Resins, Plastic Market Size, Share, Trends & Growth Report, 2030. Available online: https://www.grandviewresearch.com/industry-analysis/global-plastics-market (accessed on 16 January 2023).
- Plastic Pollution Is Growing Relentlessly as Waste Management and Recycling Fall Short, Says OECD. Available online: https://www.oecd.org/environment/plastic-pollution-is-growing-relentlessly-as-waste-management-and-recycling-fall-short.htm (accessed on 16 January 2023).
- Plastic Recycling Market Research Report Information—Market Forecast till 2030. Available online: https://www.marketresearchfuture.com/reports/plastic-recycling-market-2859?utm_source=adwords&utm_medium=ppc&utm_campaign=competitors&utm_id=mixed+reprot&campaign=20188667444&content=660639673897&keyword=plastic%20recycling%20market&utm_term=plastic%20recycling%20market&utm_campaign=MIXREPORTS_June_2023&utm_source=adwords&utm_medium=ppc&hsa_acc=2893753364&hsa_cam=19645853684&hsa_grp=152686828271&hsa_ad=660639673897&hsa_src=g&hsa_tgt=kwd-323580632636&hsa_kw=plastic%20recycling%20market&hsa_mt=p&hsa_net=adwords&hsa_ver=3&gad_source=1&gclid=CjwKCAiA75itBhA6EiwAkho9eztRqhY9ffYt9ql66OJOn2gPnoI-EbOwDJlRgH5Z74VZuF76H09_7hoCUYcQAvD_BwE (accessed on 16 January 2023).
- Atlas & Boots, the UK’s Most Popular Outdoor Travel Blog. Available online: https://www.atlasandboots.com/travel-blog/which-countries-produce-the-most-plastic-waste/?nowprocket=1 (accessed on 8 January 2024).
- Cowger, W.; Willis, K.A.; Bullock, S.; Conlon, K.; Emmanuel, J.; Erdle, L.M.; Eriksen, M.; Farrelly, T.A.; Hardesty, B.D.; Kerge, K.; et al. Global producer responsibility for plastic pollution. Sci. Adv. 2024, 10, eadj8275. [Google Scholar] [CrossRef] [PubMed]
- Kibria, M.G.; Masuk, N.I.; Safayet, R.; Nguyen, H.Q.; Mourshed, M. Plastic waste: Challenges and opportunities to mitigate pollution and effective management. Int. J. Environ. Res. 2023, 17, 20. [Google Scholar] [CrossRef]
- Plastic Waste Generation Worldwide from 1980 to 2019, by Application. Available online: https://www.statista.com/statistics/1339124/global-plastic-waste-generation-by-application/ (accessed on 17 January 2024).
- Statista-Distribution of Plastic Waste Generation Worldwide in 2018, by Sector. Available online: https://www.statista.com/statistics/1166582/global-plastic-waste-generation-by-sector/ (accessed on 24 April 2024).
- Zhao, C.; Liu, M.; Du, H.; Gong, Y. The Evolutionary Trend and Impact of Global Plastic Waste Trade Network. Sustainability 2021, 13, 3662. [Google Scholar] [CrossRef]
- Charted: The Global Plastic Waste Trade. Available online: https://www.visualcapitalist.com/cp/charting-the-movement-of-global-plastic-waste/ (accessed on 8 April 2024).
- Exports of Plastic Waste Worldwide in 2022, by Leading Country. Available online: https://www.statista.com/statistics/1357841/plastic-waste-export-volume-by-country/ (accessed on 18 April 2024).
- Imports of Plastic Waste Worldwide in 2022, by Leading Country. Available online: https://www.statista.com/statistics/866958/by-country-waste-plastic-import-volume/ (accessed on 19 April 2024).
- Law, K.L.; Starr, N.; Siegler, T.R.; Jambeck, J.R.; Mallos, N.J.; Leonard, G.H. The United States’ contribution of plastic waste to land and ocean. Sci. Adv. 2020, 6, eabd0288. [Google Scholar] [CrossRef]
- Identifying Chemicals and Polymers of Concern. Available online: https://www.youtube.com/watch?v=6xYZ13R5Jj0&t=1195s (accessed on 15 February 2024).
- As the World Swims in Plastic, Some Offer an Answer: Ban the Toxic Two. Available online: https://news.mongabay.com/2024/01/as-the-world-swims-in-plastic-some-offer-an-answer-ban-the-toxic-two/ (accessed on 15 February 2024).
- Tulashie, S.K.; Boadu, E.K.; Kotoka, F.; Mensah, D. Plastic Wastes to Pavement Blocks: A significant Alternative Way to Reducing Plastic Wastes Generation and Accumulation in Ghana. Constr. Build. Mater. 2020, 241, 118044. [Google Scholar] [CrossRef]
- Plastic Waste. Available online: https://researchbriefings.files.parliament.uk/documents/CBP-8515/CBP-8515.pdf (accessed on 10 January 2021).
- Matthews, C.; Moran, F.; Jaiswal, A.K. A review on European Union’s strategy for plastics in a circular economy and its im-pact on food safety. J. Clean. Prod. 2021, 283, 125263. [Google Scholar] [CrossRef]
- Nwabue, F.I.; Unah, U.; Itumoh, E.J. Production and characterization of smokeless bio-coal briquettes incorporating plastic waste materials. Environ. Technol. Innov. 2017, 8, 233–245. [Google Scholar] [CrossRef]
- Sanchez, W.; Bender, C.; Porcher, J.M. Wild gudgeons (Gobio gobio) from French rivers are contaminated by microplastics: Preliminary study and first evidence. Environ. Res. 2014, 128, 98–100. [Google Scholar] [CrossRef]
- Van Raamsdonk, L.W.; van der Zande, M.; Koelmans, A.A.; Hoogenboom, R.L.; Peters, R.J.; Groot, M.J.; Peijnenburg, A.A.; Weesepoel, Y.J. Current insights into monitoring, bioaccumulation, and potential health effects of microplastics present in the food chain. Foods 2020, 9, 72. [Google Scholar] [CrossRef]
- Stemming the Tide: Land-Based Strategies for a Plastic-Free Ocean. Available online: https://ceiba.org/wp-content/uploads/OceanConservancy_StemmingTide_2015_ExecSumm.pdf (accessed on 25 March 2022).
- Eriksen, M.; Lebreton, L.C.; Carson, H.S.; Thiel, M.; Moore, C.J.; Borerro, J.C.; Reisser, J. Plastic pollution in the world’s oceans: More than 5 trillion plastic pieces weighing over 250,000 tons afloat at sea. PLoS ONE 2014, 9, e111913. [Google Scholar] [CrossRef]
- Blettler, M.C.; Abrial, E.; Khan, F.R.; Sivri, N.; Espinola, L.A. Freshwater plastic pollution: Recognizing research biases and identifying knowledge gaps. Water Res. 2018, 143, 416–424. [Google Scholar] [CrossRef]
- Meijer, L.J.; Van Emmerik, T.; Van Der Ent, R.; Schmidt, C.; Lebreton, L. More than 1000 rivers account for 80% of global river-ine plastic emissions into the ocean. Sci. Adv. 2021, 7, eaaz5803. [Google Scholar] [CrossRef]
- Science for Environment Policy. Available online: https://environment.ec.europa.eu/research-and-innovation/science-environment-policy_en (accessed on 20 June 2022).
- Gall, S.C.; Thompson, R.C. The impact of debris on marine life. Mar. Pollut. Bull. 2015, 92, 170–179. [Google Scholar] [CrossRef]
- Assessing the Economic Benefits of Reductions in Marine Debris: A Pilot Study of Beach Recreation in Orange County, Califor-Nia. Available online: https://stacks.stanford.edu/file/druid:ks485yz2876/MarineDebrisEconomicStudy.pdf (accessed on 4 May 2022).
- Jang, Y.C.; Hong, S.; Lee, J.; Lee, M.J.; Shim, W.J. Estimation of lost tourism revenue in Geoje Island from the 2011 marine debris pollution event in South Korea. Mar. Pollut. Bull. 2014, 81, 49–54. [Google Scholar] [CrossRef] [PubMed]
- Sarker, M. Converting waste plastic to hydrocarbon fuel materials. Energy Eng. 2011, 108, 35–43. [Google Scholar] [CrossRef]
- Alabi, O.A.; Ologbonjaye, K.I.; Awosolu, O.; Alalade, O.E. Public and environmental health effects of plastic wastes disposal: A review. J. Toxicol. Risk Assess 2019, 5, 21. [Google Scholar]
- Verma, R.; Vinoda, K.S.; Papireddy, M.; Gowda, A.N.S. Toxic pollutants from plastic waste—A review. Procedia Environ. Sci. 2016, 35, 701–708. [Google Scholar] [CrossRef]
- Brahney, J.; Hallerud, M.; Heim, E.; Hahnenberger, M.; Sukumaran, S. Plastic rain in protected areas of the United States. Science 2020, 368, 1257–1260. [Google Scholar] [CrossRef]
- Efeito Estufa—Portal da Indústria, Indústria de A–Z. Available online: https://www.portaldaindustria.com.br/industria-de-a-z/efeito-estufa/ (accessed on 4 January 2024).
- Organisation for Economic Co-Operation and Development. Global Plastics Outlook: Economic Drivers, Environmental Impacts and Policy Options; OECD Publishing: Paris, France, 2022. [Google Scholar]
- Plastic Pollution—Our World in Data. Available online: https://ourworldindata.org/plastic-pollution#total-plastic-waste-by-country (accessed on 4 January 2024).
- Bashir, N.H. Plastic problem in Africa. Jpn. J. Vet. Res. 2013, 61, S1–S11. [Google Scholar]
- Wildlife Over Waste-Environment America. Available online: https://environmentamerica.org/feature/ame/wildlife-over-waste (accessed on 25 July 2022).
- Simoneit, B.R.; Medeiros, P.M.; Didyk, B.M. Combustion products of plastics as indicators for refuse burning in the atmosphere. Environ. Sci. Technol. 2005, 39, 6961–6970. [Google Scholar] [CrossRef] [PubMed]
- Valavanidis, A.; Iliopoulos, N.; Gotsis, G.; Fiotakis, K. Persistent free radicals, heavy metals and PAHs generated in particulate soot emissions and residue ash from controlled combustion of common types of plastic. J. Hazard. Mater. 2008, 156, 277–284. [Google Scholar] [CrossRef]
- Kumari, K.; Kumar, S.; Rajagopal, V.; Khare, A.; Kumar, R. Emission from open burning of municipal solid waste in India. Environ. Technol. 2019, 40, 2201–2214. [Google Scholar] [CrossRef]
- Staples, C.A.; Dome, P.B.; Klecka, G.M.; Oblock, S.T.; Harris, L.R. A review of the environmental fate, effects, and exposures of bisphenol A. Chemosphere 1998, 36, 2149–2173. [Google Scholar] [CrossRef]
- Grün, F.; Blumberg, B. Endocrine disrupters as obesogens. Mol. Cell. Endocrinol. 2009, 304, 19–29. [Google Scholar] [CrossRef] [PubMed]
- Li, D.K.; Zhou, Z.; Miao, M.; He, Y.; Wang, J.; Ferber, J.; Herrinton, L.J.; Gao, E.; Yuan, W. Urine bisphenol-A (BPA) level in relation to semen quality. Fertil. Steril. 2011, 95, 625–630. [Google Scholar] [CrossRef] [PubMed]
- Grandjean, P.; Landrigan, P.J. Neurobehavioural effects of developmental toxicity. Lancet Neurol. 2014, 13, 330–338. [Google Scholar] [CrossRef] [PubMed]
- Single-Use Plastics: A Roadmap for Sustainability. Available online: https://www.unep.org/resources/report/single-use-plastics-roadmap-sustainability (accessed on 11 September 2022).
- Sustainable Development Challenges—World Economic and Social Survey 2013. Available online: https://sustainabledevelopment.un.org/content/documents/2843WESS2013.pdf (accessed on 20 March 2021).
- Kamau, H.W. Housing and Health: The Relationship between the Residential Environment and the Health Status of Households: A Study of Jericho Estate, Umoja Estate, and Lindi Village. Ph.D. Thesis, University of Nairobi, Nairobi, Kenya, 2000. [Google Scholar]
- UN-Habitat. Breaking Cycles of Risk Accumulation in African Cities; United Nations Human Settlements Programme (UN-Habitat): Nairobi, Kenya, 2020. [Google Scholar]
- Microplastics Found in Human Blood for First Time. Available online: https://www.theguardian.com/environment/2022/mar/24/microplastics-found-in-human-blood-for-first-time (accessed on 24 March 2022).
- Thompson, R.C. Microplastics in the marine environment: Sources, consequences and solutions. In Marine Anthropogenic Litter; Springer: Cham, Switzerland, 2015; pp. 185–200. [Google Scholar]
- Koelmans, A.A.; Besseling, E.; Foekema, E.; Kooi, M.; Mintenig, S.; Ossendorp, B.C.; Scheffer, M. Risks of plastic debris: Un-ravelling fact, opinion, perception, and belief. Environ. Sci. Technol. 2017, 51, 11513–11519. [Google Scholar] [CrossRef] [PubMed]
- Microplastics are Found in the Blood of Farm Animals Including Cows and Pigs for the First Time—Raising Concerns about Their Movement through the Food Chain. Available online: https://newatlas.com/environment/microplastics-meat-milk-blood-farm-animals/ (accessed on 29 March 2022).
- Yang, D.; Shi, H.; Li, L.; Li, J.; Jabeen, K.; Kolandhasamy, P. Microplastic pollution in table salts from China. Environ. Sci. Technol. 2015, 49, 13622–13627. [Google Scholar] [CrossRef] [PubMed]
- De Souza Machado, A.A.; Kloas, W.; Zarfl, C.; Hempel, S.; Rillig, M.C. Microplastics as an emerging threat to terrestrial eco-systems. Glob. Chang. Biol. 2018, 24, 1405–1416. [Google Scholar] [CrossRef] [PubMed]
- Arthur, C.; Baker, J.E.; Bamford, H.A. Summary of the international research workshop on the occurrence, effects, and fate of microplastic marine debris. In Proceedings of the International Research Workshop on the Occurrence, Effects, and Fate of Microplastic Marine Debris, Tacoma, WA, USA, 9–11 September 2008. [Google Scholar]
- Browne, M.A.; Galloway, T.; Thompson, R. Microplastic—An emerging contaminant of potential concern? Integr. Environ. Assess. Manag. 2007, 3, 559–561. [Google Scholar] [CrossRef]
- Microplastics Found Deep Underground in UK Waters. Available online: https://www.theguardian.com/environment/2022/mar/21/microplastics-found-deep-underground-in-uk-waters (accessed on 21 March 2022).
- Woodall, L.C.; Sanchez-Vidal, A.; Canals, M.; Paterson, G.L.J.; Coppock, R.; Sleight, V.; Calafat, A.; Rogers, A.D.; Naraya-naswamy, B.E.; Thompson, R.C. The deep sea is a major sink for microplastic debris. R. Soc. Open Sci. 2014, 1, 140317. [Google Scholar] [CrossRef] [PubMed]
- Campanale, C.; Galafassi, S.; Savino, I.; Massarelli, C.; Ancona, V.; Volta, P.; Uricchio, V.F. Microplastics pollution in the terrestrial environments: Poorly known diffuse sources and implications for plants. Sci. Total Environ. 2022, 805, 150431. [Google Scholar] [CrossRef]
- Allen, S.; Allen, D.; Phoenix, V.R.; Le Roux, G.; Durántez Jiménez, P.; Simonneau, A.; Galop, D. Atmospheric transport and deposition of microplastics in a remote mountain catchment. Nat. Geosci. 2019, 12, 339–344. [Google Scholar] [CrossRef]
- Van Sebille, E.; Spathi, C.; Gilbert, A. The ocean plastic pollution challenge: Towards solutions in the UK. Grant. Brief. Pap. 2016, 19, 1–16. [Google Scholar]
- New Dataset Calculates 24 Trillion Pieces of Microplastics in the Ocean and Counting. Available online: https://phys.org/news/2021-10-dataset-trillion-pieces-microplastics-ocean.html (accessed on 21 October 2022).
- He, D.; Bristow, K.; Filipović, V.; Lv, J.; He, H. Microplastics in terrestrial ecosystems: A scientometric analy-sis. Sustainability 2020, 12, 8739. [Google Scholar] [CrossRef]
- Rehse, S.; Kloas, W.; Zarfl, C. Microplastics reduce short-term effects of environmental contaminants. Part I: Effects of bi-sphenol A on freshwater zooplankton are lower in presence of polyamide particles. Int. J. Environ. Res. Public Health 2018, 15, 280. [Google Scholar] [CrossRef] [PubMed]
- Zhang, D.; Ng, E.L.; Hu, W.; Wang, H.; Galaviz, P.; Yang, H.; Liu, H. Plastic pollution in croplands threatens long-term food security. Glob. Chang. Biol. 2020, 26, 3356–3367. [Google Scholar] [CrossRef]
- Wang, J.; Lv, S.; Zhang, M.; Chen, G.; Zhu, T.; Zhang, S.; Luo, Y. Effects of plastic film residues on occurrence of phthalates and microbial activity in soils. Chemosphere 2016, 151, 171–177. [Google Scholar] [CrossRef] [PubMed]
- Huang, Y.; Zhao, Y.; Wang, J.; Zhang, M.; Jia, W.; Qin, X. LDPE microplastic films alter microbial community composition and enzymatic activities in soil. Environ. Pollut. 2019, 254, 112983. [Google Scholar] [CrossRef]
- Kershaw, P.J.; Rochman, C.M. Sources, Fate and Effects of Microplastics in the Marine Environment: Part 2 of a Global Assessment; Reports and Studies-IMO/FAO/UNESCO-IOC/WMO/IAEA/UN/UNEP Joint Group of Experts on the Scientific Aspects of Marine Environmental Protection (GESAMP) 2015, Eng No. 93; Food and Agriculture Organization: Rome, Italy, 2015; p. 220. [Google Scholar]
- Chae, Y.; An, Y.J. Nanoplastic ingestion induces behavioral disorders in terrestrial snails: Trophic transfer effects via vascular plants. Environ. Sci. Nano 2020, 7, 975–983. [Google Scholar] [CrossRef]
- Ng, E.L.; Lin, S.Y.; Dungan, A.M.; Colwell, J.M.; Ede, S.; Lwanga, E.H.; Chen, D. Microplastic pollution alters forest soil mi-crobiome. J. Hazard. Mater. 2021, 409, 124606. [Google Scholar] [CrossRef]
- Kettner, M.T.; Rojas-Jimenez, K.; Oberbeckmann, S.; Labrenz, M.; Grossart, H.P. Microplastics alter composition of fungal communities in aquatic ecosystems. Environ. Microbiol. 2017, 19, 4447–4459. [Google Scholar] [CrossRef]
- Oberbeckmann, S.; Loeder, M.G.J.; Gerdts, G.; Osborn, A.M. Spatial and seasonal variation in diversity and structure of mi-crobial biofilms on marine plastics in Northern European waters. FEMS Microbiol. Ecol. 2014, 90, 478–492. [Google Scholar] [CrossRef]
- Wang, W.; Gao, H.; Jin, S.; Li, R.; Na, G. The ecotoxicological effects of microplastics on aquatic food web, from primary producer to human: A review. Ecotoxicol. Environ. Saf. 2019, 173, 110–117. [Google Scholar] [CrossRef] [PubMed]
- Hirt, H.; Body-Malapel, M. Immunotoxicity and intestinal effects of nano- and micro plastics: A review of the literature. Part. Fibre Toxicol. 2020, 17, 57. [Google Scholar] [CrossRef] [PubMed]
- Rubio, L.; Marcos, R.; Hernández, A. Potential adverse health effects of ingested micro and nanoplastics on humans. Lessons learned from in vivo and in vitro mammalian models. J. Toxicol. Environ. Health B Crit. Rev. 2020, 23, 51–68. [Google Scholar] [CrossRef] [PubMed]
- New Discovery Shows Water Bottles Contain Quarter of a Million Microplastics. Available online: https://www.youtube.com/watch?v=s-aABMuCOdk (accessed on 24 February 2024).
- Microplastics Increase the Toxicity of Organic Pollutants in the Environment by a Factor of 10. Available online: https://phys.org/news/2022-02-microplastics-toxicity-pollutants-environment-factor.html (accessed on 16 February 2022).
- Antibiotic Resistance is an ‘Overlooked’ Impact of Microplastic Pollution, Study Finds. Available online: https://www.euronews.com/green/2021/12/08/antibiotic-resistance-is-an-overlooked-impact-of-microplastic-pollution-study-finds (accessed on 5 December 2022).
- Bigalke, M.; Fieber, M.; Foetisch, A.; Reynes, J.; Tollan, P. Microplastics in agricultural drainage water: A link between terres-trial and aquatic microplastic pollution. Sci. Total Environ. 2022, 806, 150709. [Google Scholar] [CrossRef]
- Isobe, A.; Azuma, T.; Cordova, M.R.; Cózar, A.; Galgani, F.; Hagita, R.; Zhang, W. A multilevel dataset of microplastic abundance in the world’s upper ocean and the Laurentian Great Lakes. Microplast. Nanoplast. 2021, 1, 16. [Google Scholar] [CrossRef]
- Beaumont, N.J.; Aanesen, M.; Austen, M.C.; Börger, T.; Clark, J.R.; Cole, M.; Hooper, T.; Lindeque, P.K.; Pascoe, C.; Wyles, K.J. Global ecological, social and economic impacts of marine plastic. Mar. Pollut. Bull. 2019, 142, 189–195. [Google Scholar] [CrossRef]
- McIlgorm, A.; Campbell, H.F.; Rule, M.J. The economic cost and control of marine debris damage in the Asia-Pacific region. Ocean Coast. Manag. 2011, 54, 643–651. [Google Scholar] [CrossRef]
- Plastic Packaging Market Size, Share and Scope Prediction: Predicting Share and Scope for 2033. Available online: https://www.linkedin.com/pulse/plastic-packaging-market-size-share-scope-peghf (accessed on 26 April 2024).
- Recycled Plastic Is Everywhere—And It’s Harming the Planet: Recycled Plastic Will Not Save the Environment. Available online: https://www.fastcompany.com/90585634/recycled-plastic-wont-save-the-planet (accessed on 20 December 2020).
- The Use of Plastic in Household Appliances: What You Didn’t Know. Available online: https://www.hansenplastics.com/the-use-of-plastic-in-household-appliances-what-you-didnt-know/ (accessed on 8 April 2022).
- The Use of Plastic in Household Appliances. Available online: https://www.preferredplastics.com/blog/2020/09/22/the-use-of-plastics-in-household-appliances/ (accessed on 8 April 2022).
- Are Fishing Nets Made of Plastic? If Not, What? Available online: https://fishbaron.com/are-fishing-nets-made-of-plastic/ (accessed on 8 April 2022).
- Andrady, A.L. Microplastics in the marine environment. Mar. Pollut. Bull. 2011, 62, 1596–1605. [Google Scholar] [CrossRef] [PubMed]
- Cinco Motivos para Instalar Grama Sintética na Casa ou Empresa. Available online: https://mundograma.com.br/5-motivos-instalar-grama-sintetica-casa-empresa/ (accessed on 7 April 2022).
- 10,000 Litres a Day for Each Pitch: Water Strain in the Gulf and the Qatar World Cup. Available online: https://www.theguardian.com/environment/2022/oct/07/10000-litres-day-pitch-qatar-world-cup-huge-impact-gulf-waters (accessed on 25 December 2022).
- Plastics in Electrical and Electronic Applications. Available online: https://www.bpf.co.uk/innovation/Plastics_in_Electrical_and_Electronic_Applications.aspx (accessed on 8 April 2022).
- 5 Common Applications for Plastics in the Electrical Industry. Available online: https://sealectplastics.com/news/5-common-applications-for-plastics-in-the-electrical-industry/ (accessed on 8 April 2022).
- 5 Applications That Call For Electrical Plastics. Available online: https://www.acplasticsinc.com/informationcenter/r/common-uses-for-electrical-plastics (accessed on 8 April 2022).
- Goosey, M.T. (Ed.) Plastics for Electronics, 2nd ed.; Kluwer Academic Publishers: Dordrecht, The Netherlands, 1999. [Google Scholar]
- George, S. Plastics we cannot live without. In Plastic Waste and Recycling; Academic Press: Cambridge, MA, USA, 2020; pp. 449–466. [Google Scholar]
- Bello-Copo. Available online: https://www.bellocopo.com.br/post/os-7-setores-em-que-o-plastico-melhora-as-nossas-vidas (accessed on 9 April 2022).
- Plastics, Polymers & Resins» Plastics in Electrical and Electronics Market Report. 2030. Available online: https://www.grandviewresearch.com/industry-analysis/plastics-electrical-electronics-market-report# (accessed on 20 April 2024).
- Built Environment Journal—Why We Must Limit Use of Construction Plastics. Available online: https://ww3.rics.org/uk/en/journals/built-environment-journal/plastics-construction-materials-health.html (accessed on 24 April 2024).
- Agarwal, S.; Gupta, R.K. Plastics in buildings and construction. In Applied Plastics Engineering Handbook; William Andrew Publishing: New York, NY, USA, 2017; pp. 635–649. [Google Scholar]
- Construction Plastics Global Market Report 2024. Available online: https://www.thebusinessresearchcompany.com/report/construction-plastics-global-market-report (accessed on 23 April 2024).
- Modern Building Alliance—Environmental Sustainability of Plastics in Construction. Available online: https://www.modernbuildingalliance.eu/environmental-sustainability-plastics-construction/ (accessed on 24 April 2024).
- Construction Plastics Market Size 2023–2030 Global Industrial Analysis, Key Geographical Regions, Market Share, Top Key Players, Product Types and Forecast. Available online: https://www.linkedin.com/pulse/construction-plastics-market-size-2023-2030-global-2dxde/ (accessed on 23 April 2024).
- Building and Construction Plastics Market. Available online: https://straitsresearch.com/report/building-and-construction-plastics-market (accessed on 23 April 2024).
- Construction Plastics Market Outlook 2023 to 2033. Available online: https://www.factmr.com/report/construction-plastics-market (accessed on 23 April 2024).
- Halliwell, S. Polymers in Building and Construction; iSmithers Rapra Publishing: Shropshire, UK, 2002; Volume 154. [Google Scholar]
- Plástico no Automóvel: Advento do Carro Elétrico Gera Desafios Adicionais. Available online: https://www.plastico.com.br/plastico-no-automovel-advento-do-carro-eletrico-gera-desafios-adicionais/ (accessed on 5 April 2022).
- Material plástico é Utilizado Para Construção de Avião. Available online: https://plasticovirtual.com.br/material-plastico-e-utilizado-para-construcao-de-aviao/ (accessed on 5 April 2022).
- Veja Como a Airbus Constrói uma Estrutura em Fibra de Carbono. Available online: https://www.aeroflap.com.br/veja-como-airbus-constroi-uma-estrutura-em-fibra-de-carbono/ (accessed on 5 April 2022).
- Automotive Plastics Market Size, Share & Trends Analysis Report 2024–2030. Available online: https://www.grandviewresearch.com/industry-analysis/automotive-plastics-market (accessed on 24 March 2024).
- Aerospace Plastics Market Size, Share & Trends Analysis Report 2024–2030. Available online: https://www.grandviewresearch.com/industry-analysis/aerospace-plastics-market (accessed on 24 March 2024).
- Ingraham, F.D.; Alexander, E., Jr.; Matson, D.D. Synthetic plastic materials in surgery. N. Engl. J. Med. 1947, 236, 362–368. [Google Scholar] [CrossRef]
- Markets and Markets. Available online: https://www.marketsandmarkets.com/Market-Reports/medical-plastics-market-83738633.html#:~:text=The%20medical%20plastics%20market%20was,6.8%25%20from%202019%20to%202024 (accessed on 5 April 2023).
- McKeen, L.W. Plastics used in medical devices. In Handbook of Polymer Applications in Medicine and Medical Devices; William Andrew Publishing: New York, NY, USA, 2014; pp. 21–53. [Google Scholar]
- Van Leeuwen, M.P.; Van der Weijden, F.A.; Slot, D.E.; Rosema, M.A. Toothbrush wear in relation to toothbrushing effectiveness. Int. J. Dent. Hyg. 2019, 17, 77–84. [Google Scholar] [CrossRef]
- Who Invented the Toothbrush and When Was It Invented? Available online: https://www.loc.gov/everyday-mysteries/item/who-invented-the-toothbrush-and-when-was-it-invented (accessed on 5 April 2022).
- Baruah, K.; Thumpala, V.K.; Khetani, P.; Baruah, Q.; Tiwari, R.V.; Dixit, H. A review on toothbrushes and tooth brushing methods. Int. J. Pharm. Sci. 2017, 6, 29–38. [Google Scholar]
- Holmes, K.K.; Levine, R.; Weaver, M. Effectiveness of condoms in preventing sexually transmitted infections. Bull. World Health Organ. 2004, 82, 454–461. [Google Scholar]
- Steiner, M.J.; Dominik, R.; Rountree, R.W.; Nanda, K.; Dorflinger, L.J. Contraceptive effectiveness of a polyurethane condom and a latex condom: A randomized controlled trial. Obstet. Gynecol. 2003, 101, 539–547. [Google Scholar] [CrossRef]
- Sanders, D.L.; Kingsnorth, A.N.; Moate, R.; Steer, J.A. An in vitro study assessing the infection risk of low-cost polyethylene mosquito net compared with commercial hernia prosthetics. J. Surg. Res. 2013, 183, e31–e37. [Google Scholar] [CrossRef] [PubMed]
- Adorjan, A.; David, C.U.S. Patents by Inventor Csaba David. Patent No. 4,704,105, 3 November 1987. [Google Scholar]
- Spałek, J.; Ociepa, P.; Deptuła, P.; Piktel, E.; Daniluk, T.; Król, G.; Góźdź, S.; Bucki, R.; Okła, S. Biocompatible materials in otorhinolaryngology and their antibacterial properties. Int. J. Mol. Sci. 2022, 23, 2575. [Google Scholar] [CrossRef]
- Jalilian, A.R.; Ocampo-García, B.; Pasanphan, W.; Sakr, T.M.; Melendez-Alafort, L.; Grasselli, M.; Lugao, A.B.; Yousefnia, H.; Dispenza, C.; Janib, S.M.; et al. IAEA Contribution to Nanosized Targeted Radiopharmaceuticals for Drug Delivery. Pharmaceutics 2022, 14, 1060. [Google Scholar] [CrossRef]
- Dakwar, G.R.; Zagato, E.; Delanghe, J.; Hobel, S.; Aigner, A.; Denys, H.; Braeckmans, K.; Ceelen, W.; De Smedt, S.C.; Remaut, K. Colloidal stability of nano-sized particles in the peritoneal fluid: Towards optimizing drug delivery systems for intraperitoneal therapy. Acta Biomater. 2014, 10, 2965–2975. [Google Scholar] [CrossRef] [PubMed]
- Prata, J.C.; Silva, A.L.; Walker, T.R.; Duarte, A.C.; Rocha-Santos, T. COVID-19 pandemic repercussions on the use and management of plastics. Environ. Sci. Technol. 2020, 54, 7760–7765. [Google Scholar] [CrossRef]
- Rational Use of Personal Protective Equipment for Coronavirus Disease (COVID-19). World Health Organization: Interim Guidance, 27 February 2020; (No. WHO/2019-nCov/IPCPPE_use/2020.1); WHO: Geneva, Switzerland, 2019.
- Mahmood, S.U.; Crimbly, F.; Khan, S.; Choudry, E.; Mehwish, S. Strategies for rational use of personal protective equipment (PPE) among healthcare providers during the COVID-19 crisis. Cureus 2020, 12, e8248. [Google Scholar] [CrossRef]
- De Sousa, F.D.B. Pros and cons of plastic during the COVID-19 pandemic. Recycling 2020, 5, 27. [Google Scholar] [CrossRef]
- Kochańska, E.; Łukasik, R.M.; Dzikuć, M. New circular challenges in the development of take-away food packaging in the COVID-19 period. Energies 2021, 14, 4705. [Google Scholar] [CrossRef]
- 34 Plastic Bans in Africa—A Reality Check. Available online: https://www.greenpeace.org/africa/en/blogs/11156/34-plastic-bans-in-africa/ (accessed on 8 October 2022).
- Ban Single-Use Plastic? Right Problem, Wrong Solution. Available online: https://greenmantra.com/ban-single-use-plastic-right-problem-wrong-solution/ (accessed on 8 April 2023).
- Dealing with Plastic Waste. Available online: https://www.thenews.com.pk/print/500044-dealing-with-plastic-waste (accessed on 10 December 2020).
- Are Bans the Solution to Plastic Pollution? Available online: https://www.enhesa.com/resources/article/are-bans-the-solution-to-plastic-pollution/ (accessed on 8 April 2023).
- California Tried to Ban Plastic Grocery Bags. It Didn’t Work. Available online: https://www.nytimes.com/2024/02/15/climate/california-plastic-bag-ban.html (accessed on 22 February 2024).
- Plástico ou Papel: Qual Sacola é Menos Prejudicial ao Meio Ambiente? Available online: https://g1.globo.com/natureza/noticia/2019/01/31/plastico-ou-papel-qual-sacola-e-menos-prejudicial-ao-meio-ambiente.ghtml (accessed on 25 December 2023).
- Plástico, Papel ou Algodão: Qual Sacola de Compras é a Melhor? Available online: http://pt.scienceaq.com/Nature/1004051808.html (accessed on 25 December 2023).
- Plástico X Papel: Qual é Mais Nocivo para o Meio Ambiente? Available online: https://www.libreplast.com.br/plastico-x-papel-qual-e-mais-nocivo-para-o-meio-ambiente/ (accessed on 25 December 2023).
- How to Reduce the Impacts of Single-Use Plastic Products. Available online: https://www.unep.org/news-and-stories/story/how-reduce-impacts-single-use-plastic-products (accessed on 8 April 2023).
- Poluição por Plásticos—Reciclar Não Basta e Não Resolve!!, por Marcos Helano Montenegro. Available online: https://jornalggn.com.br/meio-ambiente/poluicao-por-plasticos-reciclar-nao-basta-e-nao-resolve/ (accessed on 15 February 2024).
- Hakeem, I.G.; Aberuagba, F.; Musa, U. Catalytic pyrolysis of waste polypropylene using Ahoko kaolin from Nigeria. Appl. Petrochem. Res. 2018, 8, 203–210. [Google Scholar] [CrossRef]
- Kim, Y.S.; Kim, Y.S.; Kim, S.H. Investigation of Thermodynamic Parameters in the Thermal Decomposition of Plastic Waste-Waste Lube Oil Compounds. Environ. Sci. Technol. 2010, 44, 5313–5317. [Google Scholar] [CrossRef] [PubMed]
- Arvanitoyannis, I.; Bosnea, L. Recycling of polymeric materials used for food packaging: Current status and perspectives. Food Rev. Int. 2001, 17, 291–346. [Google Scholar] [CrossRef]
- Batterman, S. Assessment of Small-Scale Incinerators for Health Care Waste, Water, Sanitation and Health Protection of the Human Environment; World Health Organization: Geneva, Switzerland, 2004. [Google Scholar]
- Gilpin, R.K.; Wagel, D.J.; Solch, J.G. Production, distribution, and fate of polychlorinated dibenzo-p-dioxins, dibenzofurans, and related organohalogens in the environment. In Dioxins and Health; John Wiley & Sons: Hoboken, NJ, USA, 2003; pp. 55–87. [Google Scholar]
- Huang, H.; Bueckens, A. De Novo Synthesis of Polychlorinated Dibenzo-p-dioxins and Dibenzofurans—Proposal of a Mechanistic Scheme. Sci. Total Environ. 1996, 93, 121–141. [Google Scholar] [CrossRef]
- Filella, M. Antimony and PET bottles: Checking facts. Chemosphere 2020, 261, 127732. [Google Scholar] [CrossRef] [PubMed]
- Sanchez, F.A.C.; Boudaoud, H.; Camargo, M.; Pearce, J.M. Plastic recycling in additive manufacturing: A systematic literature review and opportunities for the circular economy. J. Clean. Prod. 2020, 264, 121602. [Google Scholar] [CrossRef]
- Shanmugam, V.; Das, O.; Neisiany, R.E.; Babu, K.; Singh, S.; Hedenqvist, M.S.; Berto, F.; Ramakrishna, S. Polymer recycling in additive manufacturing: An opportunity for the circular economy. Mater. Circ. Econ. 2020, 2, 11. [Google Scholar] [CrossRef]
- Bureau of International Recycling—BIR 2018. Available online: https://www.globalrecyclingday.com/wp-content/uploads/2017/12/ManifestoFINAL.pdf (accessed on 15 April 2022).
- The Performance of Recycled Plastics Vs Virgin Plastics. Available online: https://oceanworks.co/blogs/ocean-plastic-news/the-performance-of-recycled-vs-virgin-plastics (accessed on 5 July 2024).
- Xanthos, D.; Walker, T.R. International policies to reduce plastic marine pollution from single-use plastics (plastic bags and microbeads): A review. Mar. Pollut. Bull. 2017, 118, 17–26. [Google Scholar] [CrossRef]
- Mihindukulasuriya, S.D.F.; Lim, L.T. Nanotechnology development in food packaging: A review. Trends Food Sci. Technol. 2014, 40, 149–167. [Google Scholar] [CrossRef]
- Rispoli, A.L.; Verdone, N.; Vilardi, G. Green fuel production by coupling plastic waste oxy-combustion and PtG technologies: Economic, energy, exergy and CO2-cycle analysis. Fuel Process. Technol. 2021, 221, 106922. [Google Scholar] [CrossRef]
- Bhattacharya, R. A review on production and application of activated carbon from discarded plastics in the context of ‘waste treats waste’. J. Environ. Manag. 2023, 325, 116613. [Google Scholar] [CrossRef] [PubMed]
- Makgabutlane, B.; Maubane-Nkadimeng, M.S.; Coville, N.J.; Mhlanga, S.D. Plastic-fly ash waste composites reinforced with carbon nanotubes for sustainable building and construction applications: A review. Results Chem. 2022, 4, 100405. [Google Scholar] [CrossRef]
- Christopher, F.J.; Kumar, P.S.; Vo, D.V.N.; Christopher, F.C.; Jayaraman, L. Methods for chemical conversion of plastic wastes into fuels and chemicals. A review. Environ. Chem. Lett. 2021, 20, 223–242. [Google Scholar] [CrossRef]
- Weckhuysen, B.M. Creating value from plastic waste. Science 2020, 370, 400–401. [Google Scholar] [CrossRef] [PubMed]
- Zhang, F.; Zeng, M.; Yappert, R.D.; Jiakal, S.; Lee, Y.H.; Lapointe, A.M.; Peters, B.; Abu-Omar, M.M.; Scott, S.L. Polyethylene upcycling to long-chain alkylaromatics by tandem hydrogenolysis/aromatization. Science 2020, 370, 437–441. [Google Scholar] [CrossRef] [PubMed]
- Maitlo, G.; Ali, I.; Maitlo, H.A.; Ali, S.; Unar, I.N.; Ahmad, M.B.; Bhutto, D.K.; Karmani, R.K.; Naich, S.u.R.; Sajjad, R.U.; et al. Plastic Waste Recycling, Applications, and Future Prospects for a Sustainable Environment. Sustainability 2022, 14, 11637. [Google Scholar] [CrossRef]
- Bioplastics Market Development Update 2023. Available online: https://www.european-bioplastics.org/market/ (accessed on 28 April 2024).
- Bioplastics Market Size, Share & Trends Analysis Report by 2030. Available online: https://www.linkedin.com/pulse/bioplastics-market-size-share-trends-analysis-report-2030-hancock (accessed on 28 April 2024).
- Market Value of Biodegradable Plastics Worldwide in 2022, with a Forecast for 2030. Available online: https://www.statista.com/statistics/979050/global-market-value-of-biodegradable-plastics/ (accessed on 28 April 2024).
- Narancic, T.; Verstichel, S.; Reddy, C.S.; Morales-Gamez, L.; Kenny, S.T.; De Wilde, B.; Babu Padamati, R.; O’Connor, K.E. Biodegradable plastic blends create new possibilities for end-of-life management of plastics but they are not a panacea for plastic pollution. Environ. Sci. Technol. 2018, 52, 10441–10452. [Google Scholar] [CrossRef]
- Zhu, J.; Wang, C. Biodegradable plastics: Green hope or greenwashing? Mar. Pollut. Bull. 2020, 161, 111774. [Google Scholar] [CrossRef]
- Estimated Land Use for Bioplastics Production Worldwide from 2022 with a Forecast to 2027. Available online: https://www.statista.com/statistics/678929/agricultural-land-use-for-bioplastics-production/ (accessed on 28 April 2024).
- Salvia, G.; Zimmermann, N.; Willan, C.; Hale, J.; Gitau, H.; Muindi, K.; Gichana, E.; Davies, M. The wicked problem of waste management: An attention-based analysis of stakeholder behaviours. J. Clean. Prod. 2021, 326, 129200. [Google Scholar] [CrossRef]
- Five Ways Cities Can Curb Plastic Waste. Available online: https://blogs.worldbank.org/sustainablecities/five-ways-cities-can-curb-plastic-waste (accessed on 7 January 2023).
- Ambuchi, D.O. Plastic Waste Management in Kenya: An Evaluation of Policies and Regulations on Plastic Bags and Plastic Bottle Wastes in Nairobi. Ph.D. Thesis, University of Nairobi, Nairobi, Kenya, 2006. [Google Scholar]
Disclaimer/Publisher’s Note: The statements, opinions and data contained in all publications are solely those of the individual author(s) and contributor(s) and not of MDPI and/or the editor(s). MDPI and/or the editor(s) disclaim responsibility for any injury to people or property resulting from any ideas, methods, instructions or products referred to in the content. |
© 2024 by the authors. Licensee MDPI, Basel, Switzerland. This article is an open access article distributed under the terms and conditions of the Creative Commons Attribution (CC BY) license (https://creativecommons.org/licenses/by/4.0/).

