Article

Mechanical Recycling of PET Multi-Layer Post-Consumer Packaging: Effects of Impurity Content

by
Giusy Santomasi
1,*,
Francesco Todaro
1,*,
Andrea Petrella
1,
Michele Notarnicola
1 and
Eggo Ulphard Thoden van Velzen
2
1
Department of Civil, Environmental, Land, Building Engineering and Chemistry (DICATECh), Polytechnic University of Bari, Via E. Orabona n.4, I-70125 Bari, Italy
2
Wageningen Food & Biobased Research, Wageningen University & Research, Bornse Weilanden 9, 6708 WG Wageningen, The Netherlands
*
Authors to whom correspondence should be addressed.
Recycling 2024, 9(5), 93; https://doi.org/10.3390/recycling9050093
Submission received: 6 September 2024 / Revised: 20 September 2024 / Accepted: 6 October 2024 / Published: 8 October 2024
(This article belongs to the Special Issue Challenges and Opportunities in Plastic Waste Management)

Abstract

:
The recycling of PET trays is highly challenging. The aim of this paper was to investigate the issues related to the mechanical recycling process and, the correlation between feedstock composition and the quality of the produced rPET. Four feedstocks with different degrees of impurity were mechanically recycled at a laboratory pilot scale. The optical and thermal properties of the rPET products were examined to determine the quality and to seek relations with the starting level of impurities. The final products of the PET trays’ mechanical recycling were found to be affected by the presence of impurities (organics) and multi-material (non-PET) elements in the feedstocks. The rPET products crystallised faster for contaminated feedstocks showed lower molecular mass and higher yellow index values due to thermal degradation. Yellowing is a crucial parameter in assessing the thermal degradation of rPET. Injection moulded samples corresponding to higher contamination levels, reported values of Yellow Index equal to 179 and 177 compared to 15 of mono-PET sample. The intrinsic viscosity decreased from 0.60 dL/g to just above 0.30 dL/g, and losses were more significant for soiled or multi-material feedstocks. A method of improving the final quality would involve the purification of the starting feedstock from impurities.

1. Introduction

Plastics play a key role in shaping a circular and climate-neutral economy by replicating, in everyday applications, properties such as durability, resource conservation, and optimised energy efficiency [1]. Additionally, their recyclability facilitates the circularity of products and a climate-neutral society [2]. To continue building on its potential, plastic waste must be diverted from landfill and incineration to recycling. The 2022 data showed that the recycling rate increased to nearly 35% in Europe, but 65% of post-consumer plastics waste was still sent for energy recovery or to landfill. Indeed, more needs to be done to increase the circularity of plastics [3]. The current industrial framework for plastic recycling relies on mechanical recycling technologies that require updating. Beginning with the sorting stage, the increasing variety of packaging placed on the European market necessitates more accurate sorting technologies to divide them into appropriate streams for recycling processes. From a technological perspective, emerging methods such as chemical recycling require substantial capital investment, higher initial costs, and strong institutional and legal backing [4].
In particular, packaging is the dominant end-use for plastic, constituting 39.1% of total demand in 2021, with PET (polyethylene terephthalate) among the main used polymers [3].
In 2022, 2.3 million tonnes of virgin PET was used for applications such as bottles, films, sheets (trays), strapping, etc., in Europe, while production from recycled material reached 1.6 million tonnes [5]. Additionally, the Single-Use Plastic Directive [6] mandates all PET beverage bottles must contain 25% recycled content by 2025. Moreover, the proposed Packaging and Packaging Waste Regulation [7] sets even higher recycled content targets for all PET-based packaging: 30% in 2030 and 50% in 2040. Nevertheless, food-grade rPET production faced challenges during 2022, a considerable lack of material led to record-high prices of rPET showing that a structured management of rPET is needed to address the high demand in Europe [8]. In 2022, the rPET content for bottles was 24%, which is the average value among the European countries. The average recycled content rates vary between countries (it ranges from over 30% for Nordic countries to 15% for Western Europe), depending on the rate of adoption of rPET by producers across the region. Additionally, the majority of rPET volumes were utilised in the bottle sector, where higher prices were absorbed in production costs. This was at the expense of volume available for other applications, namely polyester fibre and trays, which saw a decrease in the share; only 25% of rPET produced was used for trays and around 15% for polyester fibre [5]. Therefore, more rPET should be produced in order to produce more bottle-grade rPET and to achieve the bottle-to-bottle requirement in every country but especially to obtain more high quality, clear, food-grade rPET to produce in other applications, such as trays, by recycling PET food-packaging [5]. PET trays constitute the second food packaging, after bottles, in terms of quantity placed on the European market [9,10], with a rate of 21% [5]. Thus, the production of clear food-grade rPET can be increased by identifying technologies for the recovery of this packaging. Indeed, tray-to-tray closed-loop recycling is gaining more interest in Europe, some member states have started to sort out PET tray waste [9,10,11,12,13,14]. Additionally, some recycling facilities, Cirrec, Duiven [15] in The Netherlands and B. for PET [16] in Italy began to recycle PET trays, producing translucent or opaque rPET. Thus, recycling capacities for clear mono-material or/and coloured trays are in development, but producing clear rPET from sorted PET trays is still challenging.
Hitherto, PET trays have been mainly treated as contaminants, as these are removed from sorted PET bottle feedstocks before recycling, especially because impurities affect the recycling efficiency [9,11]. The impurities are material or chemical impurities that contaminate the plastic waste stream by affecting its sorting potential and its recyclability and altering the physio-chemical properties of the secondary raw material [17]. Furthermore, in multi-material streams, impurities are often found within the packaging itself due to its multi-layered structure, which is difficult to recycle [18]. Most of the sorted PET trays are not recycled in a circular tray-to-tray system but are rather recycled and used in an open loop by the fibre and textile industry in what is known as an “open-loop system” [6]. The actual main challenges in closing the PET tray loop are: (i) the high level of organic contamination into the waste stream [10]; (ii) the waste stream of PET thermoforms is much more heterogeneous than PET bottles, with many more different types of packaging designs present ranging from mono/multi-materials to differing colours, lids, labels, etc. [10,19,20,21]; (iii) trays placed on the market are mostly (almost 60%) multi-layered [6,10]. Indeed, PET trays have much more complex compositions than bottles, with lids, labels, and absorbers composed of a broad variety of polymers, but also frequently still contain product residues, which are challenging to remove during recycling processes. For multilayer streams, mechanical recycling is more challenging than mono-material streams. When applied, it provides blend compatibilisation and opacity to recycled material [22]. Multilayer packaging could be chemically recycled via depolymerisation [22,23,24,25,26,27,28,29,30,31] to various monomers, such as terephthalic acid, which can be repolymerised after purification. Mechanical recycling includes crushing, washing, and drying the material and then converting it into pellets by extrusion [32,33,34].
Although mechanical recycling can result in inferior products at lower yields, it also comes at lower economic and environmental costs than chemical recycling [35,36,37]. Hence, mechanical recycling could be preferred to chemical recycling if it results in better, technologically and environmentally balanced results [38,39]. However, it is currently insufficiently clear to what extent impurities present in the sorted PET tray feedstock can be removed during mechanical recycling and the impact is of the remaining impurities on the quality of the produced rPET [21,40,41].
Therefore, this study aims to investigate the quality of rPET that can be made from the sorted PET tray feedstock with a conventional mechanical recycling process and with four derived feedstocks that underwent different levels of some pre-sorting. In total, 4 batches of 10–20 kg PET tray feedstocks were prepared with decreasing levels of contamination, ranging from cases where external contaminants (other types of packaging and organic contaminants) were introduced into the sample to feedstock without external contaminants and multi-layer trays (containing contaminants within their structure). This distinction was made based on a previous study [10] that identified the polymer composition of each category. The four feedstocks were then mechanically recycled into washed milled goods, extruded pellets, and injection-moulded plaques. These recycled PET products were characterised by a focus on purity and optical properties. This study provided a comprehensive assessment of mechanical recycling limitations associated with the removal of impurities during washing and of the complex and heterogeneous PET trays’ feedstock composition, which is missing in the scientific literature.

2. Framework of the Study

The overall approach is reported in Figure 1.
Four feedstocks of different combinations of PET tray categories were recycled and analysed. The composition of the starting feedstock was determined—based on data from a previous study [10] about PET tray characterisation and mechanical recycling—to define the weight percentage and category composition of the feedstocks. The feedstocks were prepared by sorting a bale of PET tray sorted products into the different categories. Only the transparent categories have been analysed considering that the study’s objective was to obtain food-grade, transparent, high-quality rPET from PET trays. Mechanical treatments were applied at a laboratory pilot scale on 15 kg of material, such as rinsing, coarse shredding, hot alkaline washing, rinsing (pH neutralisation), elutriation, drying, milling treatments, and extrusion and injection moulding in plaques for thermal and optical analyses. The flake samples resulting from the mechanical recycling steps, the pellets resulting from the extrusion step, and the rPET test samples obtained from the injection moulding were studied using the following chemical and thermal analyses: DSC (Differential Scanner Calorimetry), ATR-FTIR (Attenuated total reflection Fourier-transform infrared spectroscopy), intrinsic viscosity measurement, NIR-flake analysis. Compression-moulded sheets of washed flakes and extruded pellets were also optically analysed through colour and haze measurements and microscope analysis.
These analyses, carried out in the same manner at each step of the applied mechanical process (after washing, extrusion, injection moulding), allowed a final comparison of the same parameters for all steps for the different feedstocks considered, and thus identified the relationship between contaminants present in the starting feedstock and the applied process.

3. Results

3.1. Yield of the Mechanical Recycling Process

After implementing the pilot scale mechanical recycling process, the products obtained underwent characterisation and mass balancing. Table S1 shows the composition of the resulting flakes in terms of PET content, and other polymers obtained from IR and NIR flakes analyses. These data provided an initial insight into the separation efficiency of contamination materials during the mechanical process. Based on this first analysis, an increasing value of PET content can be observed from sample T.1 to sample T.4. Sample T.2 has the lowest PET concentration and the highest level of contamination (mainly PE and PP). Sample T.1, despite containing the sorting errors and the PET trays categories (as Sample T.2), appears to have a higher PET content than sample T.2, which can be attributed to the presence of PET bottles in the T.1 feedstock. Even in the pictures (shown in Table S1), the presence of coloured films is evident, distinct from the transparent PET flakes. By averaging the results of the weight percentages obtained from the two analyses, the average PET content (cPET) in the flakes resulting from the 4 mechanical recycling tests was defined (Table S2). Table S2 shows the resultant content of PET from the average of saponification and NIR flake analyses. The average cPET values were used for the mass balance to determine the yield of the washing step.
Applying the equations described in Section 3.2 allowed obtaining the ηPET and the mass recovery for each treatment, which are reported in Figure 2 and Table S3.
Notably, the second test exhibits the lowest values for recovered mass and PET yield, attributable to a high level of contamination in this feedstock. It is noteworthy that the first feedstock, despite its more heterogeneous composition compared to other feedstocks, demonstrates a high PET content, only 3 percentage points lower than the fourth feedstock, characterised by lower contamination and a higher initial feedstock PET content. This anomaly might be attributed to PET bottles in the first feedstock which enhanced the yields instead of jeopardising them. As expected, the fourth feedstock delivers the most favourable results, given its initial composition, which lacks subcomponents that could impact the data, and a mono-material composition in the feedstock. As expected, feedstock 3 yields slightly lower than the fourth test.
The samples’ intrinsic viscosity and molecular weight values were determined and shown in Table S4 and Figure 3.
The intrinsic viscosity value of the reference sample 0 (related to only shredded, not-washed products) is comparably low compared to the other 4 samples, implying that the degradation of PET chains can be attributed to the extrusion and injection-moulding processes at high temperatures. The relatively elevated IV value of Sample 1 in comparison to the values of Samples 2, 3, and 4 can be linked to the presence of bottles in the first feedstock, which is characterised by a higher IV value than trays (0.8 dL/g [42]).
Unexpectedly, the IV of flakes of Sample 1 is the lowest. Presumably, the small sample of flakes, taken for the IV measurements, was not representative of the whole. In contrast, the results after extrusion are well-aligned with the expectation, as these samples are well-mixed during processing. The intrinsic viscosity of all extruded samples significantly decreased, and samples 0 and 1 exhibit the highest values. The reduction in intrinsic viscosity of the samples probably arose from a combination of thermal and mechanical degradation that can occur during extrusion [43,44].
Furthermore, there were subtle variations in IV between extrusion and injection moulding, with values showing both increases and decreases. The IV values of samples 0, 1, and 2 even reduced after injection moulding, while samples 3 and 4 slightly increased. However, the values remain notably low compared to the starting values (at least 0.62 dL/g) or the value required for further applications. Indeed, all samples necessitated further molecular weight-increasing processes, such as solid-state polymerisation (SSP) [45], to reach a higher level for industrial applications.
The contamination in the recycled samples could also justify this high decrease of IV, contaminants which could generate acid compounds, induce chain scission processes and lead to the reduction of intrinsic viscosity and average molecular weight of recycled resins [46,47]. So, these results underscored the importance of purity in maintaining the intrinsic viscosity of PET during melt processing [48].

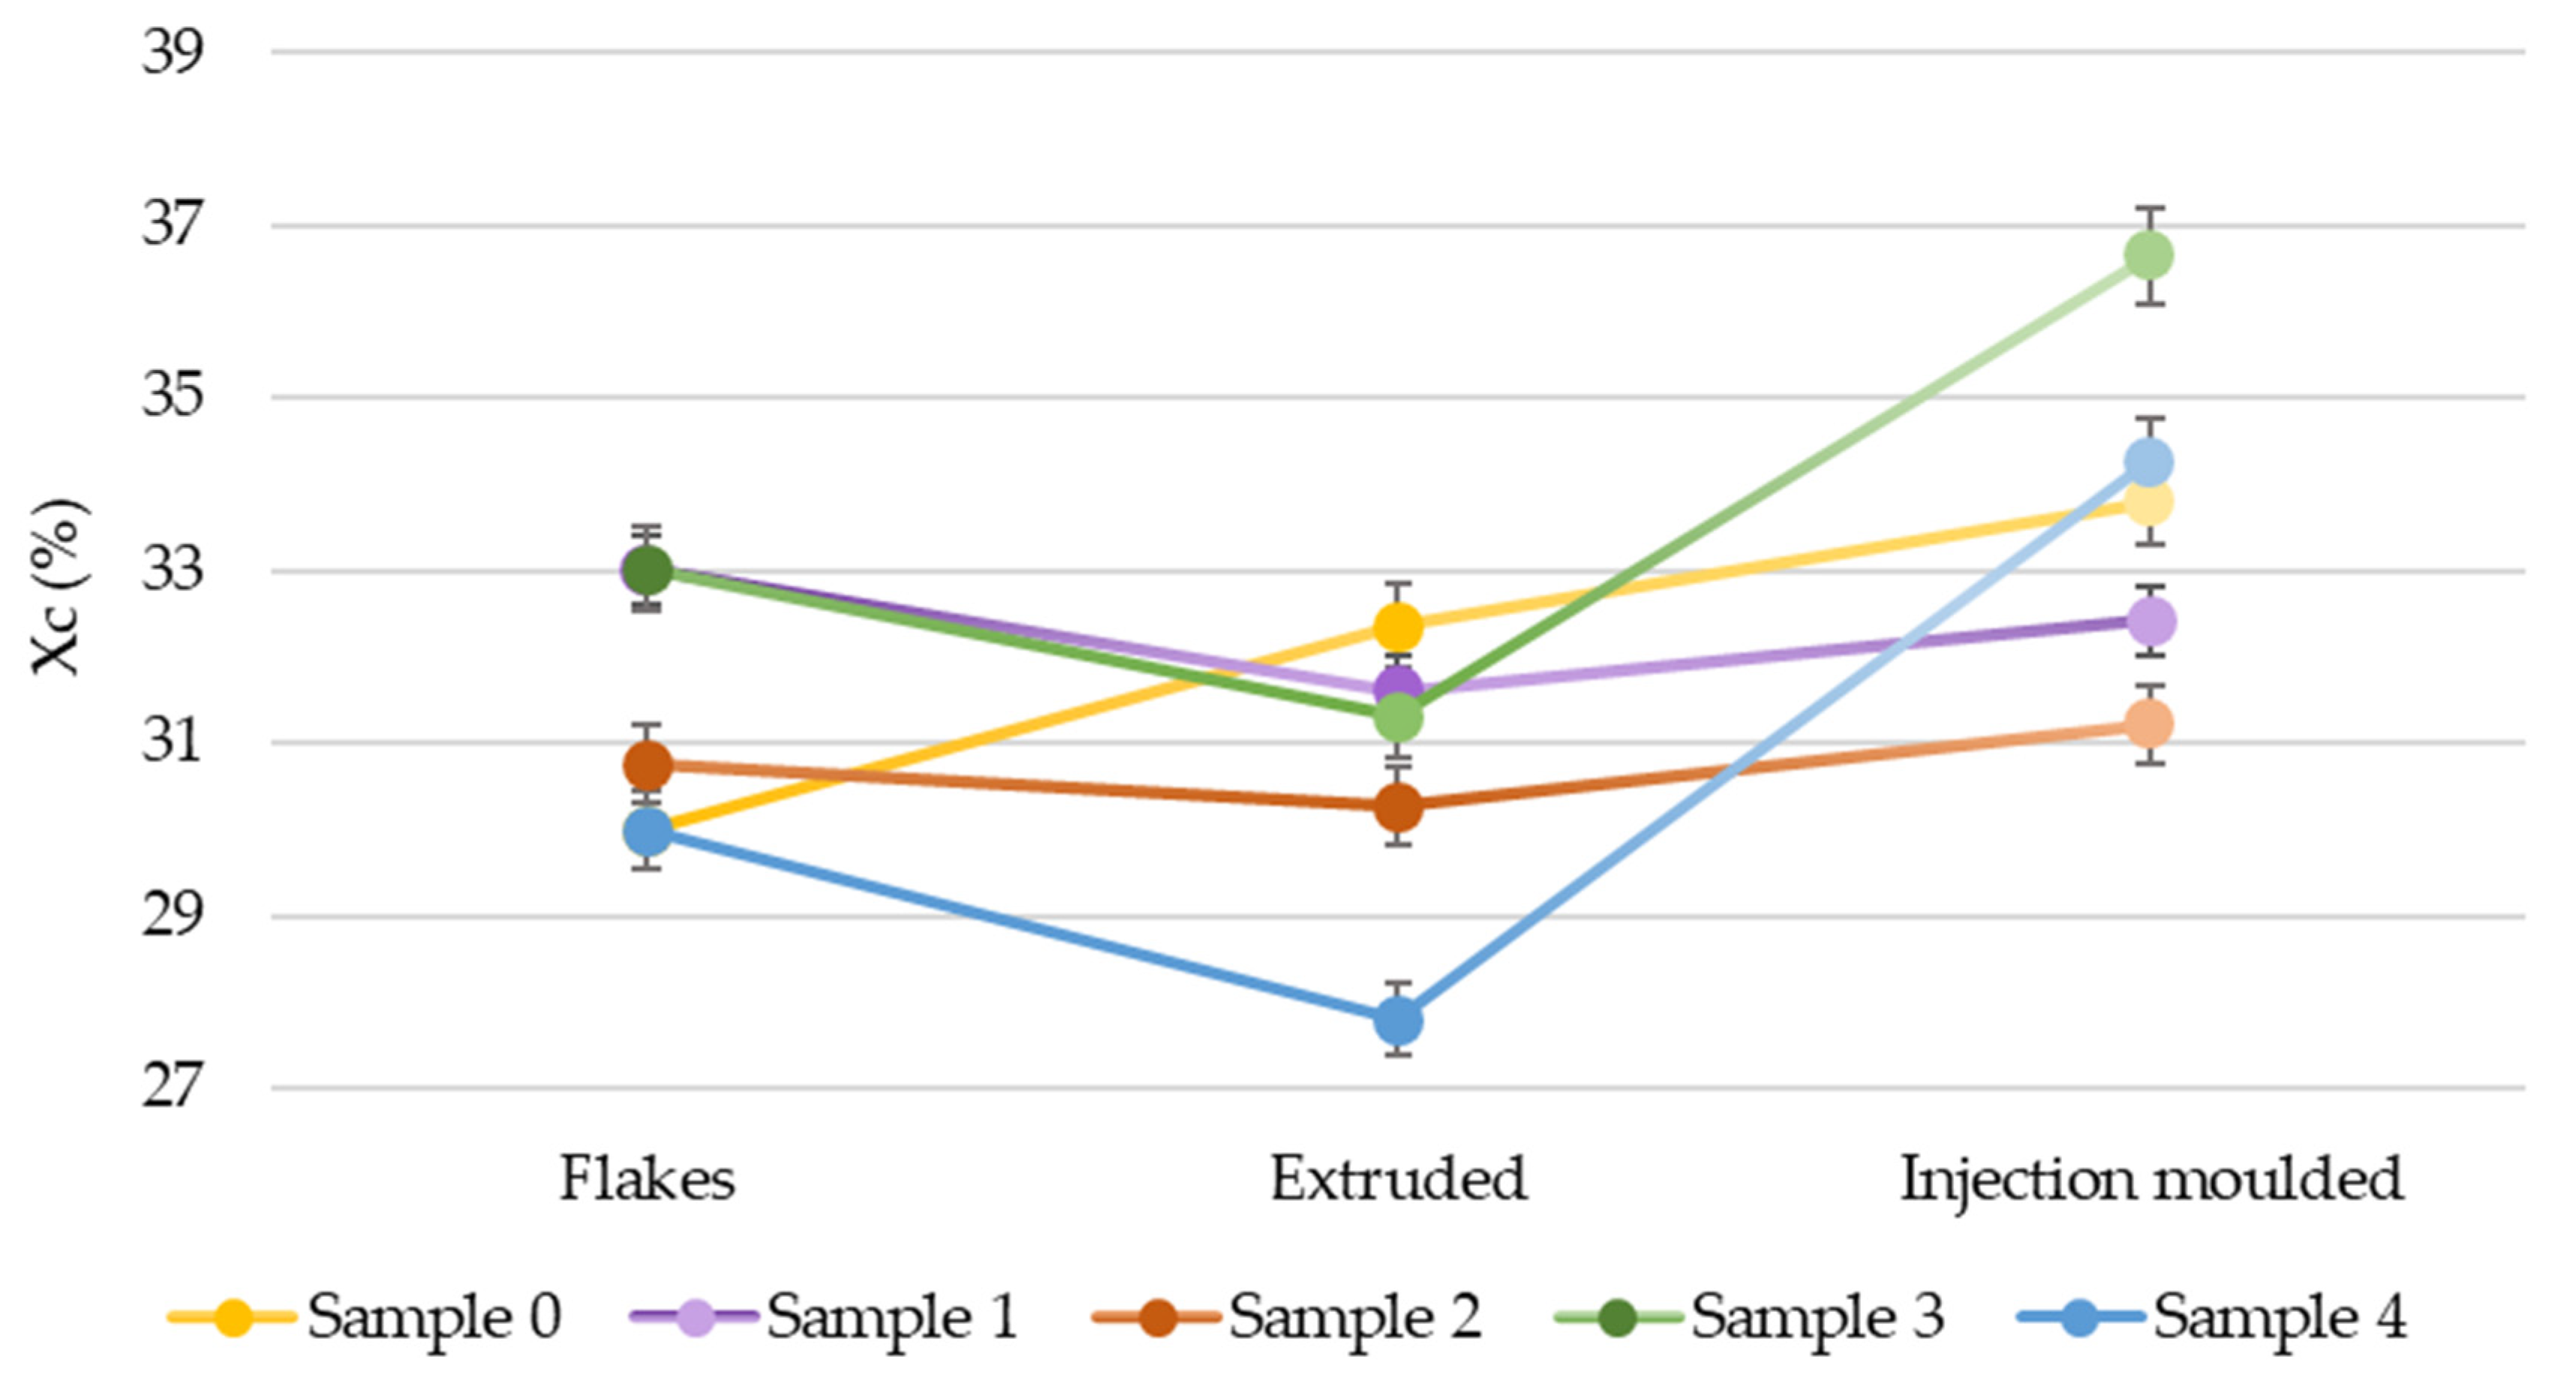
3.2. Crystallinity Evaluation

All the data derived from the DSC thermograms have been listed in Tables S8 and S9. This encompasses the peak of melting temperature (Tm), degree of crystallinity (Xc) values, onset of cooling temperature (Tc,onset) and glass transition temperature (Tg) for the washed milled goods, the extruded pellets, and the injection moulded plaques made from the 5 different feedstocks.
Figure 4 (and Tables S5 and S6) indicates the derived degrees of crystallisation for the different samples ranged from 30% to almost 33% for washed flakes, between 28% and 32% for pellets, and between 31% and 38% for injection moulded samples, with higher values for the injection-moulded samples.
The flakes’ Xc was slightly higher than the Xc of the extruded pellets, except the reference sample. The differences are comparable, with a high increase with the injection moulding. The chains are oriented during injection, so they crystallise more easily. Also, the crystallisation of recycled PET is facilitated by contaminants, such as PVC, nucleating agents and adhesives [48]. Thermo-mechanical degradation induces profound alterations in the microstructure and characteristics of PET during the recycling process. Injection moulding treatment exhibits a noteworthy surge in the degree of crystallinity, causing substantial embrittlement of the recycled material. After three reprocessing steps (hot-washing, extrusion, moulding), the material experiences a complete loss of plastic deformation properties. The chain scission reactions triggered by thermo-mechanical degradation can lead to a non-uniform distribution of polymeric chain lengths in the molten state. This, in turn, modifies the amorphous and crystalline microstructure in recycled PET due to chain rearrangement during cooling [49].
Similar behaviour can be observed in the fT values obtained from the IR analysis (Table S7), for which fT values for extruded and moulded (higher than 0.14) could be related to a high degree of crystallinity. The samples’ molecular weight (see Table S4) diminishes step by step, facilitating the formation of a more perfect crystal structure [50].
The observed trend indicates an increase in crystallinity from extrusion to injection moulding. This stems from thermo-oxidative degradation, which promotes the formation of crystallites containing low molar mass cyclic and linear oligomers. Consequently, Tm (melting temperature) decreased [51], except for the reference sample 0, possibly due to the absence of contaminants.
In Figure S1, the glass transition temperature Tg values are shown, which are characterised by slight variation and range from 74 to 86 °C for flake samples, from 72 °C to 80 °C for compression-moulded pellets, and between 73 °C and 83 °C for injection moulded plaques. All the observed Tg values of the samples were found to be between the reported minimum and maximum Tg values for virgin PET, namely between 69–115 °C [52].
IR spectra were examined to qualitatively and quantitatively assess the sample’s degree of crystallisation and the extent of sample degradation induced by the mechanical process. A comparison of normalised spectra of samples of the different steps was accomplished by merging different studies [44,52,53]. The evaluations have been reported in Table S8.
The main observations obtained by comparing spectra between post-hot-washing flakes, extrusion and injection moulding are explained, with considerations on material crystallinity and degradation [54,55].
The CH2 wagging vibration detected in correspondence with the wavelength of 1340 cm−1 corresponds to the trans conformers of the ethylene glycol moiety. A shift in the peak position to a higher wavenumber (1342 cm−1) indicates that the ethylene glycol segment is present in a highly ordered structure, such as in thermally crystallised PET [53]. As shown in Figures S4 and S5, all samples show characteristic peaks of increased crystallinity at these wavelengths for extruded and injection moulded samples in comparison to flakes. Additionally, all samples present increased in peak intensity at 1470 cm−1, which was linked to the crystallisation and appeared after trans-conformation of the ethylene glycol segment [44].
Furthermore, all extruded samples show increases in peak intensity at 845 and 973 cm−1 related to the trans-conformation of the ethylene glycol segment that occurs during crystallisation [44], which can be attributable to the extrusion step. This indicated that samples subjected to thermo-mechanical treatments underwent degradation and an increase in the level of crystallinity.

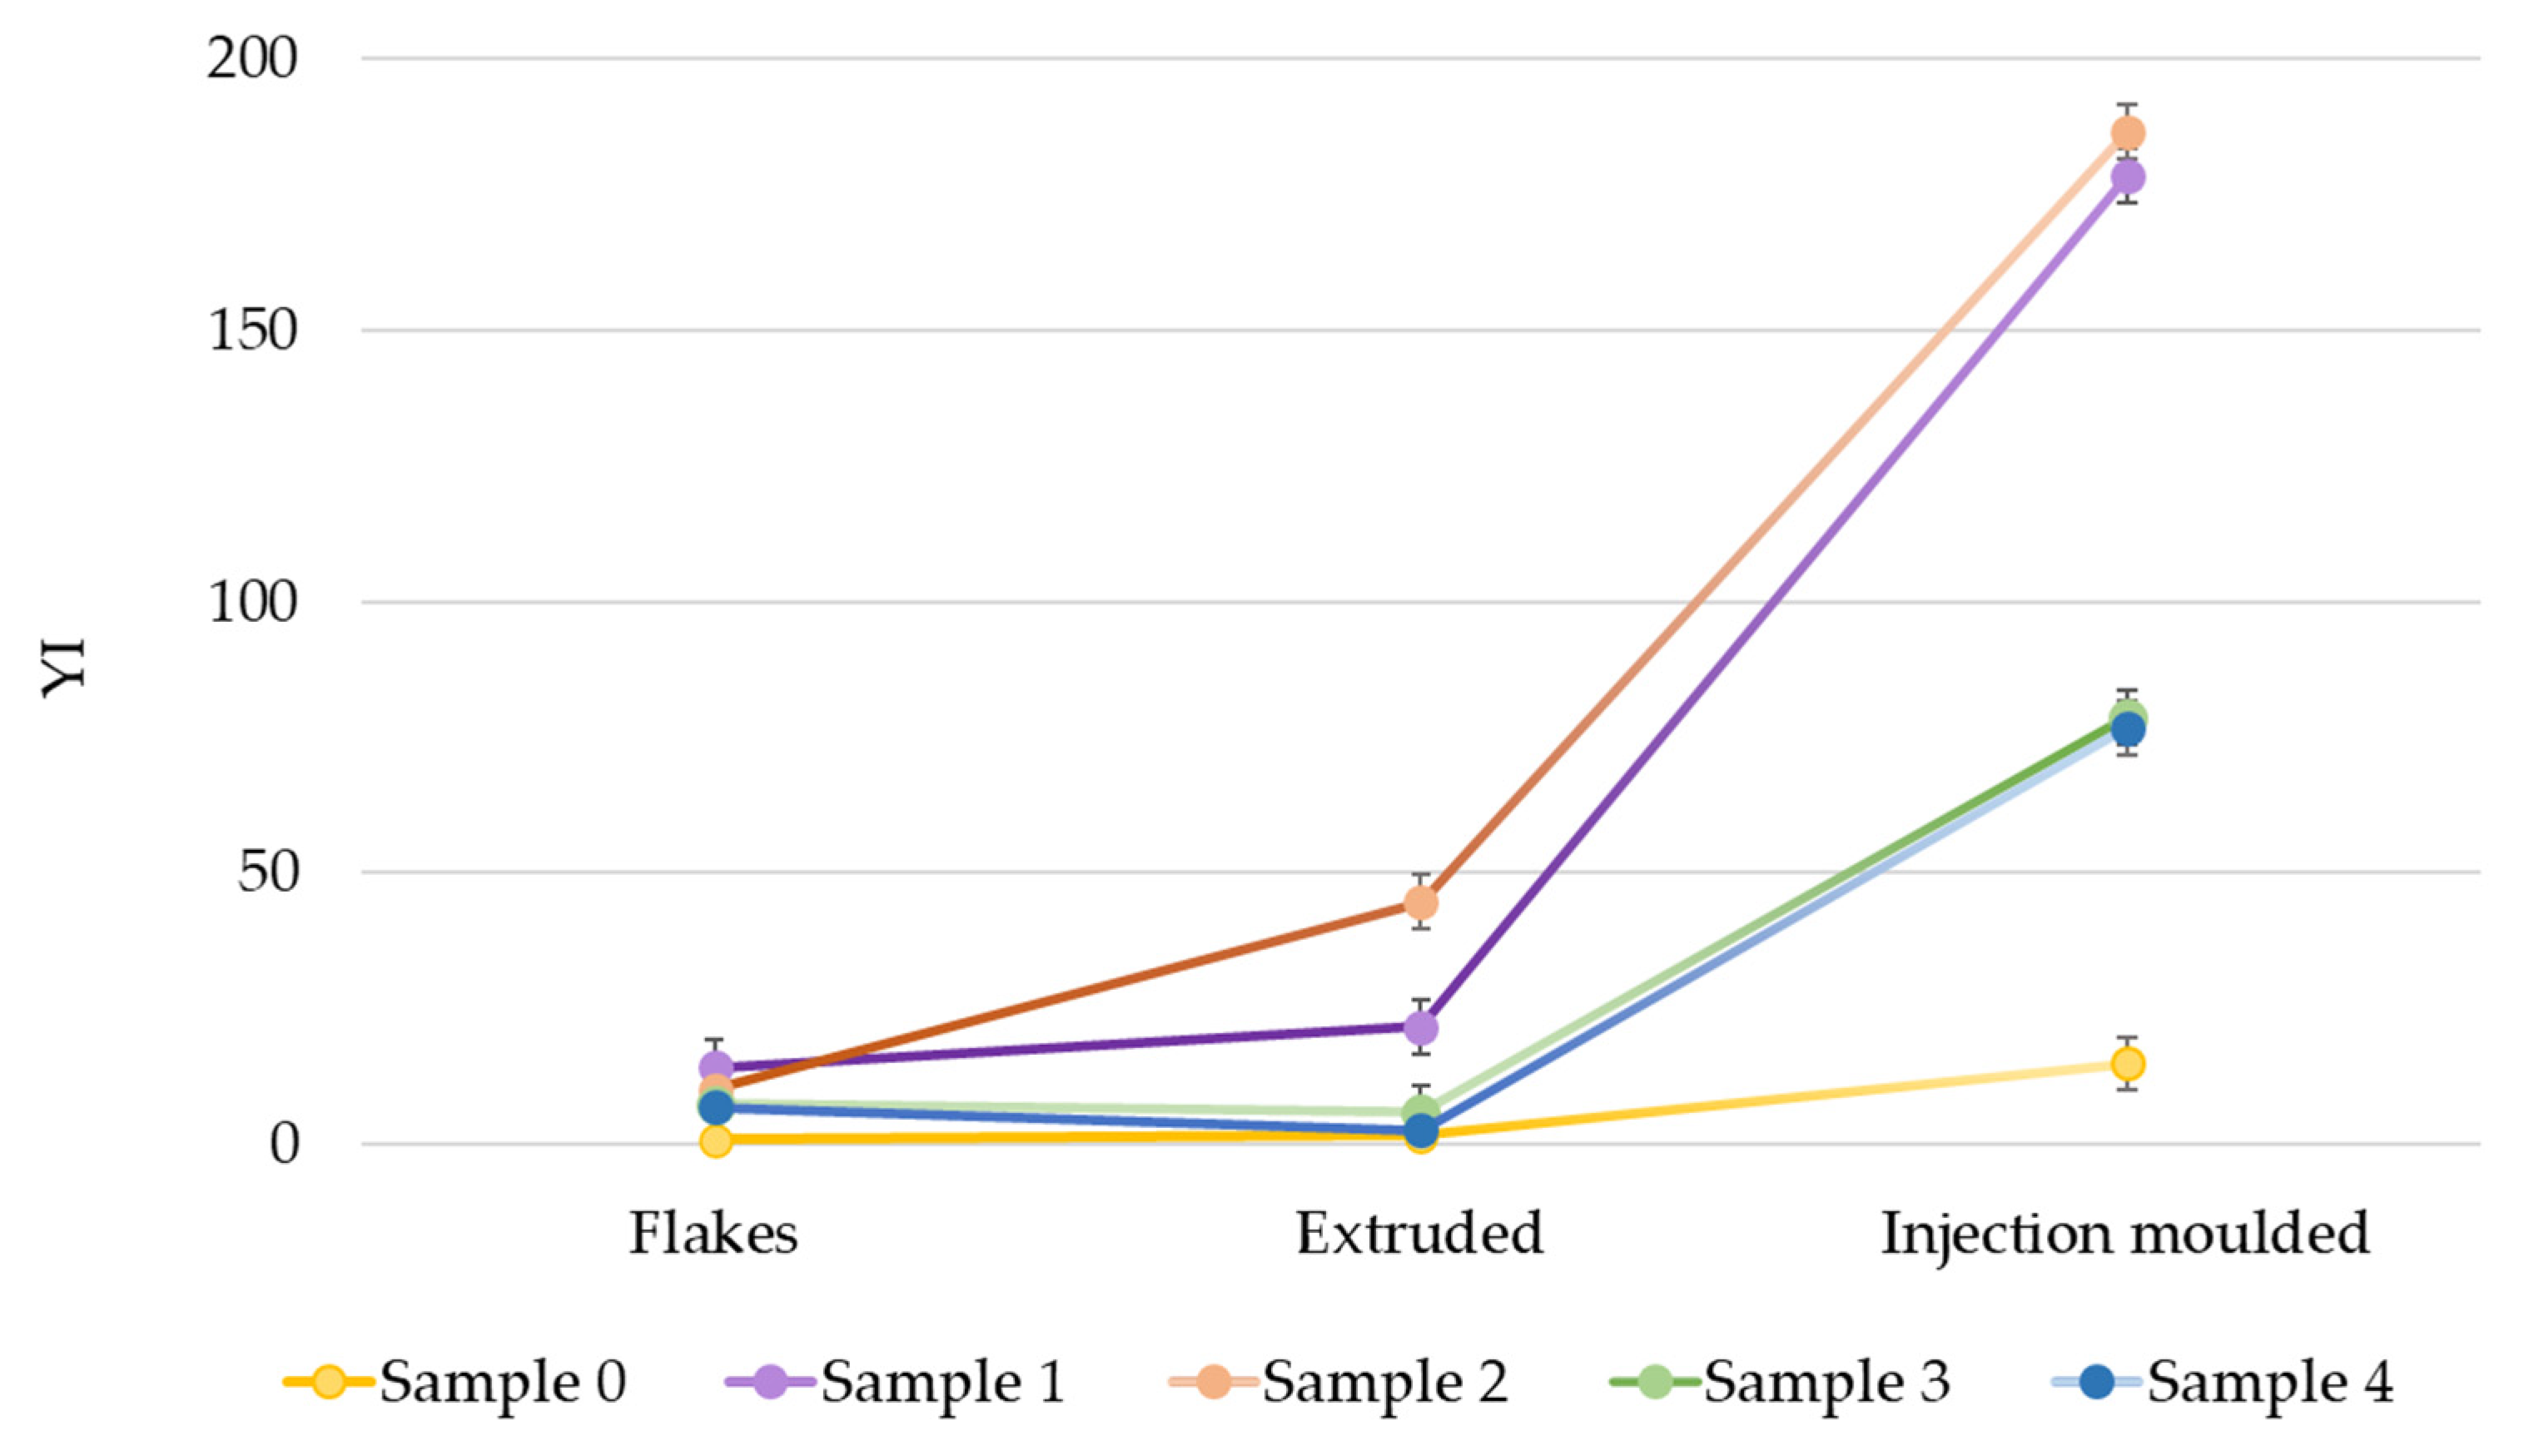
3.3. Optical Properties

The optical properties of compression moulded rPET sheets and the injection moulded plaques were measured.
Table S9 and Figure S1 show the CieLab values, revealing a prevalent green tone (a* negative) and notably elevated yellow values (b* positive) across all samples. Additionally, the low L* values indicate a generally greyish colouration, particularly in the case of injection-moulded plaques where L* values are relatively low, resulting in a darker appearance. The b* values for these samples are noticeably high, indicating a dominant yellow colour. This observation aligns with the elevated YI (yellow index) values shown in Figure 5.
Yellowing of recycled poly(ethylene terephthalate) during reprocessing at high temperatures (280–300 °C) may also result in reduced quality [56,57], indeed yellowing increases due to hydroxylated aromatic rings, quinones and stilbene quinones formation [58,59,60]. Namely the PET yellowing is caused by the possible oxidation or degradation reactions occurring during the mechanical recycling in presence of water and O2 [61,62]. Indeed, the chain scission often generated polymer radicals with hydroxyl and carboxyl end groups. These groups acted as catalyst to promote further degradation [44,63]. Yellowing is a crucial parameter in assessing the quality of PET, as it can substantially impact the material’s visual appearance and overall quality [58,63].
In this case, the increases in YI values are more marked for samples 1 and 2, corresponding to higher contamination levels.
Finally, optical microscopy images were analysed to detect the presence of impurities and contaminants by close optical investigation of the sheets obtained by compression moulding from the washed flakes. The analysis allows for quantifying these impurities across all samples, facilitating a comparative assessment of purity levels among the different samples.
Upon thorough examination of the microscopic images presented in Figures S7 and S8 and the X and Y values (shown in Table 1), it is evident—even upon initial inspection—that the findings align with those obtained through other analyses, including optical colour analysis and pictures.
The reference sample (0) exhibits more clear sheets and plaques. Indeed, higher scores of X and Y denote a greater number of transparent squares. X and Y values relate with optical impurities and hence the presence of extraneous material, but also yellow and brown shades related to effects of degradation. Notably, sheets of flakes and pellets from test 3 and 4 displayed higher X and Y values (X higher than 5, and Y greater than 1000), which can be attributed to a lower level of contamination; the opposite samples of test 1 and 2 are characterised by higher contaminations and higher evidence of PET degradation. In particular, the extruded samples had lower scores.

4. Materials and Methods

4.1. Materials

A sample of 300 kg PET tray sorted product (DKR 328-5 [64]) in the form of a pressed bale was picked up from the sorting plant Attero, Wijster (Drenthe, the Netherlands). It was sorted [10] into different transparent PET tray categories (12 main categories and 2 sub-categories) based on the previous use (e.g., food-grade package categories) manually through visual product inspection based on label descriptions. In this study, 16 (clear) of the 20 categories identified by Santomasi et al. were used. In particular, for categories 1 and 5, mono-material subcategories (1a and 5c) could not be distinguished during manual selection and so were considered in the same category. The material composition of the feedstocks (Table 2) was calculated from two datasets: data of the sorting phase on the level of packaging categories and average material compositions of PET tray categories [10]. The four different types of PET feedstock were mechanically recycled, starting with the industrially PET tray SPs (PET sorted products are denoted with “PET trays SPs”, and correspond to one of the output products from the sorting plant according to DKR 328-5) and gradually reducing the complexity by manually removing different packaging components and objects.
Then, 15 kg of waste was prepared to compose 4 feedstocks, and each fraction was weighed, as shown in Table 2 (and Table S10 in Supplementary Materials). The feedstock used in Test 1 is the most heterogenous, and its composition reflects the sorted PET tray product, including all PET tray categories and sorting errors (i.e., PE films, paper, organic contaminants, but also clear PET bottles, see Table S10). Thus, the first feedstock is the most contaminated, and the other three feedstocks analysed stepwise contain fewer impurities. Hence, feedstock 2 is largely the same as feedstock 1—only non-PET-tray sorting errors are excluded. Feedstock 3 consists of PET tray categories designated as highly recyclable through mechanical processes: bowls and fresh salad trays (2); clamshells and top-sealed trays with moisture absorber (3b); smearable salad trays (4); jars (10); loose lids and caps (11); clamshells and top-sealed trays for fresh fruit (3); clamshells and top-sealed trays for fruit with PE bubble wrap inlay (3a); clamshells for cookies and bakery products (5); non-food blisters (6); container for eggs (8). The fourth feedstock is largely the same as the third, although non-PET packaging components (such as paper labels or of other polymers, closure films made of other polymers and materials) were removed. The fourth feedstock represents an almost ideal feedstock of PET trays with a minimal level of impurities.

4.2. Mechanical Recycling Treatment

The mechanical recycling pilot plant comprises a shredder, a washing tank with baffles and a stirrer, containers for sink-float separation, a centrifuge, a fine mill and an oven. The applied process was defined from the combination of real plant processes [15,16], literature analyses [65], and internal protocols of Wageningen Research settled to the quantities that can be processed at the laboratory pilot plant level.
Of each feedstock, 15 kg samples were prepared. The dry-matter contents of these feedstocks were measured. After that, the feedstock was first rinsed to remove the abundant attached dirt and product residues. Most of the dirt was already removed by pre-rinsing, and less dirt will become enclosed in the ultimate PET flakes. In this case, the process started with 15 kg of feedstock divided into three roughly equal batches to be rinsed; 5 kg of dirty trays at a time were stirred for 5 min into the washing tank with cold tap water. Three times, the sludges of three dimensions (6 mm square mesh, 3 mm square mesh, and 0.5 mm round mesh) were sieved from the rinsing water and dried in an oven at 65 °C to calculate the net dry sludge weight.
Afterwards, the feedstocks were milled using a Weima single-shaft shredder equipped with a 3 cm sieve plate. The total weight of the moist milled goods, the dry matter content average and standard deviation (dm2) were determined. At this point, the weight of the shredded material was greater than the starting 15 kg due to the increase in water content from the rinsing phase. Thus, 12.5 kg of wet shredded material was sent to hot washing (to respect the proportions with water 1:8) with 100 L of water. The washing process of waste PET trays was carried out at 85 °C in 0.25 M solution of sodium hydroxide (NaOH; M = 40.0 g mol−1, ρ = 2.13 g cm−3, Sigma-Aldrich), with constant stirring at the mixing speed 800–1000 rpm for 15 min. After washing, the solution was filtered and PET flakes were washed on 3 sieves (6 mm square mesh, 3 mm square mesh, and 0.5 round mesh) to sort the residual sludge from the flakes. The flakes were rinsed with cold tap water until the alkaline pH was neutralised. Again, three sludge types were collected from the rinsing water. Next, the sink–float separation was operated with tap water, adding PET-washed goods in containers, stirring and letting the flakes settle for 1 min. The floating fraction was scooped off from the top with a sieve, and the sinking fractions were collected separately from the bottom. In the end, all the sinking and floating fractions were dried first in the centrifuge and then placed for 12 h at 75 °C in the oven.
The treatment yielded the following: washed and dried PET flakes, waste sludge (collected in three different sizes), and wastewater. The recovered mass was determined by the ratio of the weights of products and starting feedstock.
For waste samples, the dry-matter content of each category was determined on a waste sample before the start of the process and after milling. The dry matter content (dm1 and dm2) was determined by the ratio between the average dry weight and the average gross weight.
After the washing process, yields ( η P E T ) , in terms of recovered PET material, were calculated from the material composition data of the different categories (sorting errors, subcomponents of packaging) composing the feedstocks ( c f e e d s t o c k P E T ), applying Equation (1):
η P E T = c s i n k i n g f r a c t i o n P E T m s i n k i n g f r a c t i o n d m c f e e d s t o c k P E T m f e e d s t o c k g r o s s n m c
where
m s i n k i n g f r a c t i o n d m is the dried weight of the sinking fraction;
c s i n k i n g f r a c t i o n P E T is defined by SIRO-PAD analysis and saponification testing on post-washing-recovered sinking fraction flakes (see Table S11);
c f e e d s t o c k P E T is the concentration of PET in the feedstock;
m f e e d s t o c k g r o s s is 12.5 kg of dirty milled flakes per category;
n m c is net material content.
Moreover, the recovery of mass ( R m s i n k i n g f r a c t i o n ) was calculated as quotient of the dry sinking fraction weight and the dry feedstock weight, derived from the gross feedstock weight per the dry matter content:
R m s i n k i n g f r a c t i o n = m s i n k i n g f r a c t i o n d m m f e e d s t o c k g r o s s d m
Table S12 illustrates the codes assigned to the samples in their corresponding treatments.
The washing and shredding treatments encompassed 4 tests, while extrusion and injection moulding were conducted on 1 additional reference sample. This reference sample was produced from freshly produced mono PET trays (without any other component) directly obtained from the producer [66]. These trays underwent all treatment steps except rinsing, washing and sink–float separation, as it was already a clean production trays. This reference sample represents the absence of contaminants in the feedstock.
The washed milled flakes were dried at 105 °C for 12 h using a desiccant dryer before the next treatments. The drying process (105 °C overnight) and subsequent extrusion were also applied to virgin trays obtained from the manufacturer [66] after milling at a sieve size of 8 mm.
Compounding extrusion was performed using a Berstorff ZE 25, KraussMaffei, Munich, Gemany (25 mm, 40D) co-rotating twin screw extruder with strain pelletising. Processing conditions are shown in Table S13. The extruded filament was water-cooled in a trough and pelletised with a rotating knife. The degassing unit in the extruder had to be switched off, as the viscosity of the material was too low.
Later, rPET granulates were injection moulded into 5 test specimens. These test specimens were manufactured using a DEMAG D25NC IV, Sumitomo (SHI), Wiehe, Germany injection moulding machine. Materials were processed at a cylinder temperature of 275 °C, and the mould temperature was set at 70 °C. Again, before injection moulding, materials were dried at 105 °C for 12 h using a desiccant dryer to prevent hydrolysis [67,68].
At each step of the applied mechanical process, the obtained products (flakes, pellets, and plaques) were characterised.

4.3. Material Characterisation

The material composition of the post-washing sinking flakes (30–40 g) was determined with an IOSYS-SIROpad NIR analyser, IOSYS-Seidel e.K. (Ratingen, Germany) [69] through a near-infrared measuring system for plastic flakes and granules (non-black), allowing measurement of the concentration of PET in the recovered product ( c s i n k i n g f r a c t i o n P E T ).
Additionally, saponification [70] was applied to determine the material composition of flakes, pellets, and plaques. Roughly 5 g of rPET samples was dissolved in a solution NaOH 4 M, 20 g NaOH (NaOH; M = 40.0 g mol−1, ρ = 2.13 g cm−3, Sigma-Aldrich, St. Louis, MO, USA), 200 mL of demineralised water, 250 mg MTOAB (methyl-trioctyl ammonium bromide) using 250 mL glass Scott bottles. These were placed with their bottoms in a water bath at 95 °C with magnetic stirring bars and stirred at 300 rpm for 16 h. Then, the solutions were filtered and dried in aluminium trays in the oven at 105 °C for 2 h. By weighing this residue, it was possible to determine the amount of PET in the packaging component under the assumption that the residual material is not saponifiable, which is valid for most other materials and polymers. These residues were then analysed with IR to identify the type of material.
The IR technique was used to identify the different materials, but in particular to detect the differences between the post-washed samples and the extruded and injection moulded ones in order to identify the crystal structure in comparison. The Alpha II Fourier-transform infrared spectroscopy (FTIR) instrument equipped with a platinum ATR single reflection diamond sampling module (Bruker Optics, Ettlingen, Germany) was used to record IR spectra between the wavenumber range of 400–4000 cm−1 at a resolution of 4 cm−1 [71], controlled by Optics User Software (OPUS) version 8.1. Infrared spectroscopy is a valuable tool for studying molecular structure, and it has been widely used in the study of PET [72,73]. IR conformational bands have been used to follow PET’s crystallisation process and assess the presence of the crystalline phase in the analysed samples. In particular, the fraction of glycolic segment in trans conformation (fT) is obtained as:
f T = A 1340 A 1340 + k A 1370
In Equation (3), Ai is the integrated absorption intensity of the infrared absorption bands that have a maximum at wave number i, and k is a constant derived by Bertoldo et al. [74] for a free-standing reference PET film of 20 mm thickness and is equal to 6.7.
In support of these measurements, DSC studies [75] were also carried out twofold on samples of 10–15 mg of flakes, pellets and injection moulded samples, with a Perkin Elmer DSC-8000 calorimeter to obtain thermograms of samples of the different tests. A specific program was carried out: conditioning for 5 min at 0 °C, heating at 10 °C per minute to 300 °C, cooling to 0 °C, conditioning for 5 min at 0 °C, heating at 10 °C per minute to 300 °C. The degree of crystallinity was determined from the melting peak and the cold crystallisation peak according to the method of Torres et al. [48]:
X c w t . % = 100 Δ H m   ( T m ) Δ H c ( T c ) Δ H m 0 ( T m 0 )
where Xc is the degree of crystallinity; ΔHm (Tm) is the enthalpy of fusion measured at the melting point, Tm; and Δ H m 0 ( T m 0 ) is the enthalpy of fusion of the totally crystalline (is invariably taken as the value at the equilibrium melting point) polymer measured at the equilibrium melting point, T m 0 .
The intrinsic viscosity (IV) was determined according to ASTM D4603-03 [76,77]. Samples of 250 mg rPET flakes, pellets and plaques were dissolved in 50 mL phenol/tetrachloroethane (60/40 w/w) at 100 °C for 30 min. After preparing the solution, the viscosities were determined in calibrated Cannon–Fenske capillaries of type 100 (as well as a reference solvent) at 30 °C. The intrinsic viscosity (η) was calculated by using the Billmeyer [78] relationship:
η = 0.25 ( η r 1 + 3 ln η r ) C
Two samples per type were evaluated; the results are presented as the average and standard deviations of the two measurements. Subsequently, the viscosity–average molecular weight (Mw) of the samples could be calculated based on the viscosity data with the following expression [48]:
M w = ( η K ) 1 α
where K = 7.44 × 10⁻⁴ and α = 0.648.

4.4. Optical Analyses

To analyse the optical properties and colour of the washed PET flakes and extruded pellets, a few grams (5–10 g) were compression moulded in a hydraulic press [79]. A PHI hydraulic press, which is composed of electrically heated platens, was used. These platens were heated at 280 °C for 5 min to allow the melting of the samples and then pressed, applying minimum pressure, between two steel plates separated by Teflon sheets. Cooling was performed as fast as possible in iced water at 0 °C to avoid PET crystallisation and to obtain amorphous PET foils 20 cm in diameter and less than 1 mm thick. Then, these PET foils were studied through optical analysis.
A Konica Minolta Chroma meter CR-5, Konica Minolta INC. (Tokyo, Japan) was used to determine the colour of compression moulded sheets and injection moulded plaques according to the CIEL*a*b* method [80,81]. A white tile was used as a background reference. This yielded three colour parameters: L*(100 = white; 0 = black), a* (positive = red; negative = green; 0 = grey), and b* (positive = yellow; negative = blue; 0 = grey). The total colour difference ΔE and the yellowness (YI) of the samples were calculated as:
ΔE = [(ΔL*)2 + (Δa*)2 + (Δb*)2]1/2
Indeed, the yellow index as [82]:
YI = 142.86 × b*/L*
Additionally, haze measurements were determined by using the colour measurement on the same samples and with the Konica Minolta Chroma meter CR-5, recording 4 measures for each sample. Then, the total colour difference, yellowing, and haze, were determined between the rPET sheets and mono-PET tray products, which were used as a standard reference.
Optical studies were performed on obtained rPET sheets utilising BRESSER Science MPO 401 Microscope Bresser GmbH (Rhede, Germany) [83], equipped with an objective lens having magnification from 40 to 1000. For the analysis of PET foils, 4× and 10× magnifying camera lenses were employed to obtain well-defined images, taken by the BRESSER MikroCam II 20 MP 1″ microscope camera (Bresser GmbH, Rhede, Germany).
Additionally, photos were taken of the PET sheets in the lightning cabinet under controlled (fixed) lightening conditions (see Figure S2). The photos from the lighting cabinet and the images from the microscope were analysed for visible imperfections. These imperfections were counted by creating a square grid on the images and counting the squares affected by the visible light, yellow, dark impurities, wires, and drops concerning transparent squares. This gave two values, named X, quantifying the squares in the grid that are not affected by coarse impurities in the regular photo (Figure S2), and Y, quantifying the squares in the grid that are not affected by micro impurities on microscope images (Figure S3). Lower values of these factors correspond to low optical quality and thus increased impurity content.

5. Discussion

The prominent outcome observed is the brown discolouration of rPET during heating processes [61], which significantly limits its potential applications. Furthermore, the PET waste underwent processing at a temperature of 280 °C, resulting in degradation reactions and a subsequent decrease in molecular weight.
The brown colouration is likely linked to thermal degradation, a phenomenon often associated in the literature with specific contaminants. This involves the formation of particular alcohols and acids, with the acids serving as catalysts for chain scission reactions during the melt processing of PET waste [84,85]. Notably, the most detrimental acids to the post-consumer PET recycling process include acetic acid, originating from the degradation of poly(vinyl acetate) closures; abietic acid from adhesives; and hydrochloric acid from PVC [44].
In rPET, however, various contaminants can be present. Paci and Mantia [86] observed the impact of a small quantity of PVC during the melt processing of PET, reporting that even a minimal presence of PVC (as low as 100 ppm) would enhance PET chain scission due to the catalytic effect of hydrogen chloride evolving during PVC degradation [87]. Barrier layers in PET packaging materials can be a further cause of yellow discolouration in thermally treated PET. It is supposed that foreign polymers or impurities in PET flakes may contribute to yellow discolouration [58]. Additionally, other studies [58,88,89] have demonstrated that the presence of PVC and PA leads to discolouration of PET during processing. PVC often originates from sorting errors and packaging components, PA or EVOH is a widely used additive which reduces the gas permeability in polymers, as in top-sealed trays, the top film might contain them to render sufficient low gas permeability and when these top-films are insufficiently removed during recycling they might cause discolouration. In this case, Sample 1 may have been affected by the presence of PVC, as it might have been included due to sorting errors in the feedstock of test 1. Instead, PVC was likely absent in the other samples, which consisted exclusively of PET tray categories (see [10]).
The removal of contaminants from PET waste stands as a crucial step in the mechanical recycling process, as elevated levels of contamination by other materials contribute significantly to the deterioration of PET during processing. In light of the compositional analysis results from this study regarding the washed flakes, no trace amounts of PVC or PA were identified in the cleaned flakes, also for Sample 1. Therefore, PVC does not seem to provide an explanation for the discolouration observed in the extruded and injected recycled PET. Pressure-sensitive adhesives (PSA) on the other hand are present in PET trays and might explain this discolouration. There are numerous production variants of PSA on the market; indeed, PSA could be produced using waxes such as rosin esters or by utilising poly(vinyl acetate). The most common type of PSA is based on polyacrylates, often produced with monomers like 2-ethylhexyl acrylate, n-butyl acrylate, and acrylic acid [90].
The thermal degradation of acrylic pressure-sensitive adhesives occurs at 250 °C, leading to the formation of unsaturated monomers like butyl acrylate and butyl methacrylate [91,92]. Indeed, the applied treatment temperature on PET waste is precisely 250 °C. Consequently, a plausible hypothesis to explain the discolouration could be linked to the “sticky” residue detected during the saponification process. This residue, possibly comprising PSA from the numerous labels on PET trays, might persist on the tray even in the 4th test (feedstock without labels, top films, etc.) after removing other elements, especially considering the impossibility in this study to apply the filter and degassing equipment.
An alternative explanation for the excessive browning could be the presence of residual PE [93]. Finally, the significant shear force in the injection moulding machine might also have contributed to the browning reaction, particularly in the 4th pilot test, where residual PE should be minimal. Indeed, the fundamental difference between samples 1 and 2 compared to tests 3, 4, and the reference test 0 lies in the fact that samples 1 and 2 also include multi-material trays (mainly composed of PE/PET layers) in the starting feedstock. For these, PE impurity could be the main cause of degradation for Sample 1 and 2, as it could not be removed through mechanical recycling. It is crucial to note that the obtained rPET from this experimental study represents an initial attempt and that there is room for improvement through additional tests and deeper investigations. The analyses conducted on rPET have highlighted two main factors contributing to its degradation: the alteration of the material itself and the influence of external impurities that were not completely removed by the applied treatment.
Typically, rPET from bottles undergoes solid state polycondensation (SSP) treatment to enhance its molecular weight and colour characteristics [94,95], which could also be a viable approach for rPET derived from PET trays. Additionally, blending recycled flakes in certain ratios with virgin PET flakes might still yield higher quality rPET. Further analyses could be carried out, including a solid-state polymerization (SSP) treatment, which would increase the intrinsic viscosity of the polymer and could minimise the effects of degradation induced by recycling and impurities. This treatment could thus provide insights into the nature of the degradation, particularly if it allows overcoming the current limitations of the recycling process.
Moreover, the idea of studying alternative technologies to be associated with mechanical recycling for waste streams containing multi-material packaging is crucial. Such packaging, often made up of layers of different materials (such as PET combined with other polymers or aluminum), poses greater challenges in recycling, as the different components require specific treatments. Technologies like chemical recycling, selective dissolution [96], delamination [97], compatibilisation [98]; gasification, pyrolysis, fluid-catalyzed cracking, and hydrocracking [99]; or advanced separation systems could be explored to address these complex cases [18].
In summary, further investigation into treatments such as SSP and the adoption of complementary technologies alongside mechanical recycling could significantly improve the quality of recycled rPET, making it more suitable for high-quality applications.

6. Conclusions

Four different feedstocks of PET trays with a decreasing level of impurities have been mechanically processed. The purer feedstocks were recycled into washed flakes with high PET concentrations and hence low levels of contamination, whereas the more impure feedstocks also resulted in a less pure rPET product. All produced rPET products were found to be degraded especially after thermal treatments after extrusion and injection moulding treatments. During thermal processing the rPETs experience a drop in intrinsic viscosity, decreasing from 0.60 dL/g to just above 0.30 dL/g, and consequently in molecular weight, these decreases are more significant when the feedstock is soiled or composed of multiple materials, a growth in degrees of crystallinity and intensification of the yellowing index, accompanied by the presence of microscopic-level contamination and a high level of degradation as identified through IR analysis.
In conclusion, the impurity content in PET tray feedstock significantly affects the resultant recycled material, including the PET recovery rate, optical properties, as well as crystallinity and intrinsic viscosity. Notably, while Sample 1, with an impurity content of 19.03%, was expected to show the lowest performance, Sample 2, despite having about 3.51% less impurities, exhibited the lowest quality. This suggests that not only the impurity content but also the type of impurities plays a crucial role. Indeed, for Sample 1, the added sorting errors were also composed by PET bottles, which improved the overall results. Meanwhile, the reference sample 0 demonstrates the least impact of degradation across all factors, thanks to the absence of impurities in the initial feedstock.
Additionally, samples 1 and 2 are constituted of multi-material trays, for which other solutions need to be addressed to increase the possibility of valorisation. For example, to promote the valorisation of sorted PET tray waste and to increase the production of rPET via mechanical recycling, technology needs to be improved. Further research should be conducted to identify practical solutions for minimising the degradation of the resulting rPET and recycling the multi-material fraction. Recycling companies need to continue improving the recycling processes and add additional treatments to the process to restore the molecular weight of the rPET product. Additionally, PET trays should be re-designed for recycling and be composed of only PET with labels and other packaging components that can be removed completely in the mechanical recycling process. Those PET trays that cannot be redesigned for recycling need to be marked in such a manner that sorting companies can recognise and remove them.

Supplementary Materials

The following supporting information can be downloaded at: https://www.mdpi.com/article/10.3390/recycling9050093/s1, Figure S1. Temperature of glass transition (°C) derived from the 1st heating run; Figure S2. Square grid for visual counting on photos of compression moulded rPET sheets for categories; Figure S3. Example of the square grid for visual counting on microscope images of compression moulded rPET sheets: (a) Magnitude 4×; (b) Magnitude 10×; Figure S4. Spectra comparison between flake, extruded and injection moulded samples wavelength 1300–1600 cm−1; Figure S5. Spectra comparison between flake, extruded and injection moulded samples wavelength 700–1100 cm−1; Figure S6. L*a*b* values into the 3D space for all samples; Figure S7. Optical microscope photos of compression moulded sheets from post-washed flakes; Figure S8. Optical microscope photos of compression moulded sheets from extrusion. Table S1. Sinking fraction composition per sample; Table S2. PET content (weight percentage) in the post-washing flake samples; Table S3. Yields of PET content and recovered mass (Rm); Table S4. Intrinsic viscosity and molecular weight values of post-washing, extruded, and injection-moulded samples; Table S5. DSC data for rPET flakes: melting temperature, onset of cooling temperature, degree of crystallinity values and glass transition temperature; Table S6. DSC data for category: melting temperature (Tm), onset of crystallisation temperature (Tc), degree of crystallinity values (Xc) and glass transition temperature (Tg); Table S7. fT values obtained from the IR analysis comparison among flakes, pellets and plaques; Table S8. Main peaks of PET samples (post-washed, extruded, injection moulded); Table S9. Haze, CieLab and yellow index values of samples. Table S10. Feedstocks composition in terms of weight and percentage for PET tray categories; Table S11. PET concentration in the 4 feedstocks calculated from the object composition in packaging categories and the average material composition per packaging category (%); Table S12. rPET flakes, sheets, pellets and plaques sample codes; Table S13. Extrusion processing characteristics.

Author Contributions

G.S.: conceptualization, data curation, formal analysis, investigation, visualization, writing—original draft. A.P.: data curation, validation, writing—review and editing. F.T.: conceptualization, supervision, writing—review and editing. M.N.: resources, supervision, writing—review and editing. E.U.T.v.V.: conceptualization, data curation, supervision, validation, writing—review and editing. All authors have read and agreed to the published version of the manuscript.

Funding

We thank all partners in the project “An Integrated approach towards Recycling of Plastics”, managed and coordinated by ISPT (Institute for Sustainable Process Technology) and DPI in The Netherlands. The project receives its funding from the Netherlands Enterprise Agency (RVO) under the MOOI subsidy program; funding number MOOI42013.

Data Availability Statement

The original contributions presented in the study are included in the article/Supplementary Materials; further inquiries can be directed to the corresponding authors.

Acknowledgments

We would like to thank Wageningen Food & Biobased Research for supporting this research. Herman de Beukelaer and Wouter Teunissen are thanked for their brilliant scientific guidance and technical support. Yarek Workala is thanked for his excellent support. We are grateful for the assistance of Kees Bouter and Freddy Brouwer (Attero, Wijster) in providing the municipal waste samples.

Conflicts of Interest

The authors declare no conflicts of interest.

Abbreviations

ATR-FTIR: attenuated total reflection Fourier-transform infrared spectroscopy; DSC: differential scanning calorimetry; NIR: near-infrared; PA: polyamide; PE: polyethylene; PET: polyethylene terephthalate; PP: polypropylene; PVC: polyvinyl chloride; rPET: recycled polyethylene terephthalate; SP: sorted products; SSP: solid-state polycondensation; YI: yellow index.

References

  1. Plastics Europe. The Circular Economy for Plastics—A European Overview. 2022. Available online: https://www.rigk.de/Editors/RIGK/Dateien/Downloads/Studien/PlasticsEurope-CircularityReport-2021_28022022_1.pdf (accessed on 17 August 2023).
  2. Sharma, N.K.; Govindan, K.; Lai, K.K.; Chen, W.K.; Kumar, V. The Transition from Linear Economy to Circular Economy for Sustainability among SMEs: A Study on Prospects, Impediments, and Prerequisites. Bus Strategy Environ. 2021, 30, 1803–1822. [Google Scholar] [CrossRef]
  3. Plastics Europe. Plastics the Facts 2022. 2022. Available online: https://plasticseurope.org/knowledge-hub/plastics-the-facts-2022/ (accessed on 12 August 2023).
  4. Ferronato, N.; Rada, E.C.; Gorritty Portillo, M.A.; Cioca, L.I.; Ragazzi, M.; Torretta, V. Introduction of the Circular Economy within Developing Regions: A Comparative Analysis of Advantages and Opportunities for Waste Valorization. J. Environ. Manag. 2019, 230, 366–378. [Google Scholar] [CrossRef] [PubMed]
  5. ICIS; PET. Market in Europe: State of Play, Production, Collection and Recycling Data 2022. Indep. Commod. Intell. Serv. 2024. Available online: https://www.icis.com/explore/resources/pet-market-state-of-play-2022/ (accessed on 10 June 2024).
  6. European Parliament and Council Directive (EU) 2019/904 on the Reduction of the Impact of Certain Plastic Products on the Environment; Official Journal of the European Union, Brussels: Brussels, Belgium, 2019.
  7. European Parliament and Council. European Commission Proposal for a Regulation of the European Parliament and of the Council; Joint Research Centre (European Commission): Brussels, Belgium, 2022. [Google Scholar]
  8. Kahlert, S.; Bening, C.R. Why pledges alone will not get plastics recycled: Comparing recyclate production and anticipated demand. Resour. Conserv. Recycl. 2022, 181, 106279. [Google Scholar] [CrossRef]
  9. Souder, J.; Kennedy, E.; Xu, C.; Gruber, B.; Paes, C.; Hu, R.; Bustelo, V.; Kamps, J.; Garcia, S.; Björk, M.; et al. The Plastic Product Mass Flow Model 2.0 Modelling Plastic Product Flows and Recycling in the EU; Report; Joint Research Centre (European Commission): Brussels, Belgium, 2024. [Google Scholar] [CrossRef]
  10. Santomasi, G.; Aquilino, R.; Brouwer, M.; De Gisi, S.; Smeding, I.; Todaro, F.; Notarnicola, M.; Thoden van Velzen, E.U. Strategies to Enhance the Circularity of Non-Bottle PET Packaging Waste Based on a Detailed Material Characterisation. Waste Manag. 2024, 186, 293–306. [Google Scholar] [CrossRef]
  11. Eriksen, M.K.; Astrup, T.F. Characterisation of Source-Separated, Rigid Plastic Waste and Evaluation of Recycling Initiatives: Effects of Product Design and Source-Separation System. Waste Manag. 2019, 87, 161–172. [Google Scholar] [CrossRef] [PubMed]
  12. Picuno, C.; Alassali, A.; Chong, Z.K.; Kuchta, K. Flows of Post-Consumer Plastic Packaging in Germany: An MFA-Aided Case Study. Resour. Conserv. Recycl. 2021, 169, 105515. [Google Scholar] [CrossRef]
  13. Brouwer, M.; Thoden van Velzen, E.U.; Augustinus, A.; Soethoudt, H.; De Meester, S.; Ragaert, K. Predictive Model for the Dutch Post-Consumer Plastic Packaging Recycling System and Implications for the Circular Economy. Waste Manag. 2018, 71, 62–85. [Google Scholar] [CrossRef] [PubMed]
  14. Kleinhans, K.; Hallemans, M.; Huysveld, S.; Thomassen, G.; Ragaert, K.; Van Geem, K.M.; Roosen, M.; Mys, N.; Dewulf, J.; De Meester, S. Development and Application of a Predictive Modelling Approach for Household Packaging Waste Flows in Sorting Facilities. Waste Manag. 2021, 120, 290–302. [Google Scholar] [CrossRef]
  15. Faerch Group Cirrec Website. Available online: https://www.cirrec.nl/ (accessed on 5 September 2023).
  16. B4PET Renewable Plastics B4PET Sito Web. Available online: https://b4pet.com/ (accessed on 10 November 2023).
  17. Faraca, G.; Astrup, T. Plastic waste from recycling centres: Characterisation and evaluation of plastic recyclability. Waste Manag. 2019, 95, 388–398. [Google Scholar] [CrossRef]
  18. De Mello Soares, C.T.; Ek, M.; Östmark, E.; Gällstedt, M.; Karlsson, S. Recycling of multi-material multilayer plastic packaging: Current trends and future scenarios. Resour. Conserv. Recycl. 2022, 176, 105905. [Google Scholar] [CrossRef]
  19. Smith, R.L.; Takkellapati, S.; Riegerix, R.C. Recycling of Plastics in the United States: Plastic Material Flows and Polyethylene Terephthalate (PET) Recycling Processes. ACS Sustain. Chem. Eng. 2022, 10, 2084–2096. [Google Scholar] [CrossRef] [PubMed]
  20. Roosen, M.; Mys, N.; Kusenberg, M.; Billen, P.; Dumoulin, A.; Dewulf, J.; Van Geem, K.M.; Ragaert, K.; De Meester, S. Detailed Analysis of the Composition of Selected Plastic Packaging Waste Products and Its Implications for Mechanical and Thermochemical Recycling. Environ. Sci. Technol. 2020, 54, 13282–13293. [Google Scholar] [CrossRef] [PubMed]
  21. Gabriel, V.H.; Schaffernak, A.; Pfitzner, M.; Fellner, J.; Tacker, M.; Apprich, S. Rigid Polyethylene Terephthalate Packaging Waste: An Investigation of Waste Composition and Its Recycling Potential in Austria. Resources 2023, 12, 128. [Google Scholar] [CrossRef]
  22. Schyns, Z.O.G.; Shaver, M.P. Mechanical Recycling of Packaging Plastics: A Review. Macromol. Rapid Commun. 2021, 42, 2000415. [Google Scholar] [CrossRef] [PubMed]
  23. Zhou, G.; Gu, Y.; Wu, Y.; Gong, Y.; Mu, X.; Han, H.; Chang, T. A Systematic Review of the Deposit-Refund System for Beverage Packaging: Operating Mode, Key Parameter and Development Trend. J. Clean. Prod. 2020, 251, 119660. [Google Scholar] [CrossRef]
  24. Uehara, G.A.; França, M.P.; Canevarolo Junior, S.V. Recycling Assessment of Multilayer Flexible Packaging Films Using Design of Experiments. Polimeros 2015, 25, 371–381. [Google Scholar] [CrossRef]
  25. Ügdüler, S.; Van Geem, K.M.; Denolf, R.; Roosen, M.; Mys, N.; Ragaert, K.; De Meester, S. Towards Closed-Loop Recycling of Multilayer and Coloured PET Plastic Waste by Alkaline Hydrolysis. Green Chem. 2020, 22, 5376–5394. [Google Scholar] [CrossRef]
  26. Chen, H.; Wan, K.; Zhang, Y.; Wang, Y. Waste to Wealth: Chemical Recycling and Chemical Upcycling of Waste Plastics for a Great Future. Chem. Sus. Chem. 2021, 14, 4123–4136. [Google Scholar] [CrossRef]
  27. Tamizhdurai, P.; Mangesh, V.L.; Santhosh, S.; Vedavalli, R.; Kavitha, C.; Bhutto, J.K.; Alreshidi, M.A.; Yadav, K.K.; Kumaran, R. A State-of-the-Art Review of Multilayer Packaging Recycling: Challenges, Alternatives, and Outlook. J. Clean. Prod. 2024, 447, 141403. [Google Scholar] [CrossRef]
  28. Thoden van Velzen, E.U.; Santomasi, G. Tailor-Made Enzymes Poised to Propel Plastic Recycling into a New Era. Nature 2022, 604, 631–633. [Google Scholar] [CrossRef]
  29. Lu, H.; Diaz, D.J.; Czarnecki, N.J.; Zhu, C.; Kim, W.; Shroff, R.; Acosta, D.J.; Alexander, B.R.; Cole, H.O.; Zhang, Y.; et al. Machine Learning-Aided Engineering of Hydrolases for PET Depolymerization. Nature 2022, 604, 662–667. [Google Scholar] [CrossRef] [PubMed]
  30. Amundarain, I.; López-Montenegro, S.; Fulgencio-Medrano, L.; Leivar, J.; Iruskieta, A.; Asueta, A.; Miguel-Fernández, R.; Arnaiz, S.; Pereda-Ayo, B. Improving the Sustainability of Catalytic Glycolysis of Complex PET Waste through Bio-Solvolysis. Polymers 2024, 16, 142. [Google Scholar] [CrossRef] [PubMed]
  31. Khan, A.; Naveed, M.; Aayanifard, Z.; Rabnawaz, M. Efficient Chemical Recycling of Waste Polyethylene Terephthalate. Resour. Conserv. Recycl. 2022, 187, 106639. [Google Scholar] [CrossRef]
  32. Al-Salem, S.M.; Lettieri, P.; Baeyens, J. Recycling and Recovery Routes of Plastic Solid Waste (PSW): A Review. Waste Manag. 2009, 29, 2625–2643. [Google Scholar] [CrossRef] [PubMed]
  33. De Moura Giraldi, A.L.F.; De Jesus, R.C.; Mei, L.H.I. The Influence of Extrusion Variables on the Interfacial Adhesion and Mechanical Properties of Recycled PET Composites. J. Mater. Process. Technol. 2005, 162–163, 90–95. [Google Scholar] [CrossRef]
  34. Singh, N.; Hui, D.; Singh, R.; Ahuja, I.P.S.; Feo, L.; Fraternali, F. Recycling of Plastic Solid Waste: A State of Art Review and Future Applications. Compos. B Eng. 2017, 115, 409–422. [Google Scholar] [CrossRef]
  35. Seier, M.; Archodoulaki, V.M.; Koch, T.; Duscher, B.; Gahleitner, M. Polyethylene Terephthalate Based Multilayer Food Packaging: Deterioration Effects during Mechanical Recycling. Food Packag. Shelf Life 2022, 33, 100890. [Google Scholar] [CrossRef]
  36. Mangold, H.; von Vacano, B. The Frontier of Plastics Recycling: Rethinking Waste as a Resource for High-Value Applications. Macromol. Chem. Phys. 2022, 223, 2100488. [Google Scholar] [CrossRef]
  37. Ghosh, T.; Avery, G.; Bhatt, A.; Uekert, T.; Walzberg, J.; Carpenter, A. Towards a Circular Economy for PET Bottle Resin Using a System Dynamics Inspired Material Flow Model. J. Clean. Prod. 2023, 383, 135208. [Google Scholar] [CrossRef]
  38. Trossaert, L.; De Vel, M.; Cardon, L.; Edeleva, M. Lifting the Sustainability of Modified PET-Based Multilayer Packaging Material with Enhanced Mechanical Recycling Potential and Processing. Polymers 2022, 14, 196. [Google Scholar] [CrossRef]
  39. Gracida-Alvarez, U.R.; Xu, H.; Benavides, P.T.; Wang, M.; Hawkins, T.R. Circular Economy Sustainability Analysis Framework for Plastics: Application for Poly(Ethylene Terephthalate) (PET). ACS Sustain. Chem. Eng. 2023, 11, 514–524. [Google Scholar] [CrossRef]
  40. Mager, M.; Berghofer, M.; Fischer, J. Polyolefin Recyclates for Rigid Packaging Applications: The Influence of Input Stream Composition on Recyclate Quality. Polymers 2023, 15, 2776. [Google Scholar] [CrossRef]
  41. Schmidt, J.; Auer, M.; Maletz, R.; Galler, V.; Woidasky, J. Consumer Influence on Lightweight Packaging Waste Generation in Germany. Clean. Responsible Consum. 2024, 12, 100185. [Google Scholar] [CrossRef]
  42. Kim, D.Y.; Park, T.H.; Choo, J.E.; Hwang, S.W. Evaluation of PET Recyclability and Characterization of Modified Reprocessed-PET for Industrial Application. J. Appl. Polym. Sci. 2024, 141. [Google Scholar] [CrossRef]
  43. Candal, M.V.; Safari, M.; Fernández, M.; Otaegi, I.; Múgica, A.; Zubitur, M.; Gerrica-Echevarria, G.; Sebastián, V.; Irusta, S.; Loaeza, D.; et al. Structure and Properties of Reactively Extruded Opaque Post-Consumer Recycled PET. Polymers 2021, 13, 3531. [Google Scholar] [CrossRef]
  44. Awaja, F.; Pavel, D. Recycling of PET. Eur. Polym. J. 2005, 41, 1453–1477. [Google Scholar] [CrossRef]
  45. Bocz, K.; Molnár, B.; Marosi, G.; Ronkay, F. Preparation of Low-Density Microcellular Foams from Recycled PET Modified by Solid State Polymerization and Chain Extension. J. Polym. Environ. 2019, 27, 343–351. [Google Scholar] [CrossRef]
  46. Oromiehie, A.; Mamizadeh, A. Recycling PET Beverage Bottles and Improving Properties. Polym. Int. 2004, 53, 728–732. [Google Scholar] [CrossRef]
  47. Romão, W.; Franco, M.F.; Bueno, M.I.M.S.; De Paoli, M.A. Distinguishing between Virgin and Post-Consumption Bottle-Grade Poly (Ethylene Terephthalate) Using Thermal Properties. Polym. Test. 2010, 29, 879–885. [Google Scholar] [CrossRef]
  48. Torres, N.; Robin, J.J.; Boutevin, B.; Re, C.E.; Ma, P. Study of Thermal and Mechanical Properties of Virgin and Recycled Poly(Ethylene Terephthalate) before and after Injection Molding. Eur. Polym. J. 1999, 36, 2075–2080. [Google Scholar] [CrossRef]
  49. Badía, J.D.; Vilaplana, F.; Karlsson, S.; Ribes-Greus, A. Thermal Analysis as a Quality Tool for Assessing the Influence of Thermo-Mechanical Degradation on Recycled Poly(Ethylene Terephthalate). Polym. Test. 2009, 28, 169–175. [Google Scholar] [CrossRef]
  50. Kiliaris, P.; Papaspyrides, C.D.; Pfaendner, R. Reactive-Extrusion Route for the Closed-Loop Recycling of Poly(Ethylene Terephthalate). J. Appl. Polym. Sci. 2007, 104, 1671–1678. [Google Scholar] [CrossRef]
  51. Romão, W.; Franco, M.F.; Corilo, Y.E.; Eberlin, M.N.; Spinacé, M.A.S.; De Paoli, M.A. Poly (Ethylene Terephthalate) Thermo-Mechanical and Thermo-Oxidative Degradation Mechanisms. Polym. Degrad. Stab. 2009, 94, 1849–1859. [Google Scholar] [CrossRef]
  52. Badia, J.D.; Strömberg, E.; Karlsson, S.; Ribes-Greus, A. The Role of Crystalline, Mobile Amorphous and Rigid Amorphous Fractions in the Performance of Recycled Poly (Ethylene Terephthalate) (PET). Polym. Degrad. Stab. 2012, 97, 98–107. [Google Scholar] [CrossRef]
  53. Cole, K.C.; Ajjii, A.; Pellerin, É. New Insights into the Development of Ordered Structure in Poly(Ethylene Terephthalate). 1. Results from External Reflection Infrared Spectroscopy. Macromolecules 2002, 35, 770–784. [Google Scholar] [CrossRef]
  54. Peltzer, M.A.; Simoneau, C.; Institute for Health and Consumer Protection. Report of an Inter-Laboratory Comparison from the European Reference Laboratory for Food Contact Materials: ILC 002 2013: Identification of Polymeric Materials; Joint Research Centre (European Commission): Brussels, Belgium, 2013; ISBN 9789279352676. [Google Scholar]
  55. Sammon, C.; Yarwood, J.; Everall, N. An FTIR Study of the Effect of Hydrolytic Degradation on the Structure of Thin PET films. Polym. Degrad. Stab. 2000, 67, 149–158. [Google Scholar] [CrossRef]
  56. Edge, M.; Allen, N.S.; Wiles, R.; Mcdonald, W.; Mortlock, S.V. Identification of Luminescent Species Contributing to the Yellowing of Poly(Ethylene Terephthalate) on Degradation. Polymer, 1995; 36, 227–234. [Google Scholar] [CrossRef]
  57. Allen, N.S.; Edge, M.; Hussain, S. Perspectives on Yellowing in the Degradation of Polymer Materials: Inter-Relationship of Structure, Mechanisms and Modes of Stabilisation. Polym. Degrad. Stab. 2022, 201, 109977. [Google Scholar] [CrossRef]
  58. Berg, D.; Schaefer, K.; Koerner, A.; Kaufmann, R.; Tillmann, W.; Moeller, M. Reasons for the Discoloration of Postconsumer Poly(Ethylene Terephthalate) during Reprocessing. Macromol. Mater. Eng. 2016, 301, 1454–1467. [Google Scholar] [CrossRef]
  59. Fashandi, H.; Zadhoush, A.; Haghighat, M. Effect of Orientation and Crystallinity on the Photodegradation of Poly(Ethylene Terephthalate) Fibers. Polym. Eng. Sci. 2008, 48, 949–956. [Google Scholar] [CrossRef]
  60. Fechine, G.J.M.; Rabello, M.S.; Souto Maior, R.M.; Catalani, L.H. Surface Characterization of Photodegraded Poly(Ethylene Terephthalate). The Effect of Ultraviolet Absorbers. Polymer 2004, 45, 2303–2308. [Google Scholar] [CrossRef]
  61. Ciolacu, C.F.L.; Roy Choudhury, N.; Dutta, N.K. Colour Formation in Poly(Ethylene Terephthalate) during Melt Processing. Polym. Degrad. Stab. 2006, 91, 875–885. [Google Scholar] [CrossRef]
  62. Chilton, T.; Burnley, S.; Nesaratnam, S. A Life Cycle Assessment of the Closed-Loop Recycling and Thermal Recovery of Post-Consumer PET. Resour. Conserv. Recycl. 2010, 54, 1241–1249. [Google Scholar] [CrossRef]
  63. Masmoudi, F.; Fenouillot, F.; Mehri, A.; Jaziri, M.; Ammar, E. Characterization and Quality Assessment of Recycled Post-Consumption Poly(Ethylene Terephthalate) (PET). Environ. Sci. Pollut. Res. 2018, 25, 23307–23314. [Google Scholar] [CrossRef]
  64. Gruene Punkt Gruener Punkt—Website. Available online: https://www.gruener-punkt.de/en/downloads (accessed on 5 September 2023).
  65. Krehula, L.K.; Siročić, A.P.; Dukić, M.; Hrnjak-Murgić, Z. Cleaning Efficiency of Poly(Ethylene Terephthalate) Washing Procedure in Recycling Process. J. Elastom. Plast. 2013, 45, 429–444. [Google Scholar] [CrossRef]
  66. Bliston Bliston Packaging Producer. Available online: https://bliston.nl/en/ (accessed on 23 October 2023).
  67. Nisticò, R. Polyethylene Terephthalate (PET) in the Packaging Industry. Polym. Test. 2020, 90, 106707. [Google Scholar] [CrossRef]
  68. Hosseini, S.S.; Taheri, S.; Zadhoush, A.; Mehrabani-Zeinabad, A. Hydrolytic Degradation of Poly(Ethylene Terephthalate). J. Appl. Polym. Sci. 2007, 103, 2304–2309. [Google Scholar] [CrossRef]
  69. Alvarado Chacon, F.; Brouwer, M.T.; Thoden van Velzen, E.U.; Smeding, I.W. A First Assessment of the Impact of Impurities in PP and PE Recycled Plastics; Report; Wageningen Food & Biobased Research: Wageningen, The Netherlands, 2020. [Google Scholar] [CrossRef]
  70. Spaseska, D.; Civkaroska, M. Alkaline Hydrolysis of Poly(Ethylene Terephthalate) Recycled from the Post-Consumer Soft-Drink Bottles. J. Univ. Chem. Technol. Metall. 2010, 45, 379–384. [Google Scholar]
  71. Baskaran, S.; Sathiavelu, M. Application of Attenuated Total Reflection—Fourier Transform Infrared Spectroscopy to Characterize the Degradation of Littered Multilayer Food Packaging Plastics. Vib. Spectrosc. 2020, 109, 103105. [Google Scholar] [CrossRef]
  72. He, J.J.; Gilpatrick, B. Applications of DSC in Conjunction with FTIR in Plastic Identification; CRC Press: Boca Raton, FL, USA, 1999. [Google Scholar]
  73. Martin, L.; Brandau, O. PET Preforms. In Bottles, Preforms and Closures; Elsevier: Amsterdam, The Netherlands, 2012; pp. 47–77. [Google Scholar]
  74. Bertoldo, M.; Labardi, M.; Rotella, C.; Capaccioli, S. Enhanced Crystallization Kinetics in Poly(Ethylene Terephthalate) Thin Films Evidenced by Infrared Spectroscopy. Polymer 2010, 51, 3660–3668. [Google Scholar] [CrossRef]
  75. Šudomová, L.; Doležalová Weissmannová, H.; Steinmetz, Z.; Řezáčová, V.; Kučerík, J. A Differential Scanning Calorimetry (DSC) Approach for Assessing the Quality of Polyethylene Terephthalate (PET) Waste for Physical Recycling: A Proof-of-Concept Study. J. Therm. Anal. Calorim. 2023, 148, 10843–10855. [Google Scholar] [CrossRef]
  76. ASTM D4603 03; Standard Test Method for Determining Inherent Viscosity of Poly(Ethylene Terephthalate) (PET) by Glass Capillary Viscometer. ASTM International: West Conshohocken, PA, USA, 2012. [CrossRef]
  77. Berkowitz, S. Viscosity Molecular Weight Relationships for Poly(Ethylene Terephthalate) in Hexafluoroisopropanol-Pentafluorophenol Using SEC-LALLS. J. Appl. Polym. Sci. 1984, 29, 4353–4361. [Google Scholar] [CrossRef]
  78. Billmeyer, F.W. Methods for Estimating Intrinsic Viscosity. J. Polym. Sci. 1949, 4, 83–86. [Google Scholar] [CrossRef]
  79. Sommerhuber, P.F.; Welling, J.; Krause, A. Substitution Potentials of Recycled HDPE and Wood Particles from Post-Consumer Packaging Waste in Wood-Plastic Composites. Waste Manag. 2015, 46, 76–85. [Google Scholar] [CrossRef]
  80. Adebayo, G.O.; Yahya, R. Characterisation of Heat Modified Mangrove Fibre for Polymer Composite Applications. In Proceedings of the Scholar summit 2017 Conference, Depok, Indonesia, 10–11 October 2017. [Google Scholar]
  81. Arrieta, M.P.; López, J.; Ferrándiz, S.; Peltzer, M.A. Characterization of PLA-Limonene Blends for Food Packaging Applications. Polym. Test. 2013, 32, 760–768. [Google Scholar] [CrossRef]
  82. Saberi, B.; Thakur, R.; Vuong, Q.V.; Chockchaisawasdee, S.; Golding, J.B.; Scarlett, C.J.; Stathopoulos, C.E. Optimization of Physical and Optical Properties of Biodegradable Edible Films Based on Pea Starch and Guar Gum. Ind. Crops Prod. 2016, 86, 342–352. [Google Scholar] [CrossRef]
  83. Boehme, M.; Charton, C. Properties of ITO on PET Film in Dependence on the Coating Conditions and Thermal Processing. Surf. Coat. Technol. 2005, 200, 932–935. [Google Scholar] [CrossRef]
  84. Cardi, N.; Po, R.; Giannotta, G.; Occhiello, E.; Garbassi, F.; Messina, G. Chain Extension of Recycled Poly(Ethylene Terephthalate) with 2,2′-Bis(2-Oxazoline). J. Appl. Polym. Sci. 1993, 50, 1501–1509. [Google Scholar] [CrossRef]
  85. Paci, M.; Mantis, F.P. La Competition between Degradation and Chain Extension during Processing of Reclaimed Poly(Ethylene Terephthalate). Polym. Degrad. Stab. 1998, 61, 417–420. [Google Scholar] [CrossRef]
  86. Paci, M.; Mantia, F.P. La Influence of Small Amounts of Polyvinylchloride on the Recycling of Polyethyleneterephthalate. Polym. Degrad. Stab. 1999, 63, 11–14. [Google Scholar] [CrossRef]
  87. Dimitrov, N.; Kratofil Krehula, L.; Ptiček Siročić, A.; Hrnjak-Murgić, Z. Analysis of Recycled PET Bottles Products by Pyrolysis-Gas Chromatography. Polym. Degrad. Stab. 2013, 98, 972–979. [Google Scholar] [CrossRef]
  88. Szarka, G.; Iván, B. Thermal Properties, Degradation and Stability of Poly(Vinyl Chloride) Predegraded Thermooxidatively in the Presence of Dioctyl Phthalate Plasticizer. J. Macromol. Sci. A 2013, 50, 208–214. [Google Scholar] [CrossRef]
  89. Elamri, A.; Zdiri, K.; Harzallah, O.; Lallam, A. Progress in Polyethylene Terephthalate Recycling. In Polyethylene Terephthalate: Uses, Properties and Degradation; Nova Science Publishers: Hauppauge, NY, USA, 2020; ISBN 9781536119916. [Google Scholar]
  90. Park, S.H.; Lee, T.H.; Park, Y., II; Noh, S.M.; Kim, J.C. Effect of the N-Butyl Acrylate/2-Ethylhexyl Acrylate Weight Ratio on the Performances of Waterborne Core–Shell PSAs. J. Ind. Eng. Chem. 2017, 53, 111–118. [Google Scholar] [CrossRef]
  91. Czech, Z.; Pelech, R. The Thermal Degradation of Acrylic Pressure-Sensitive Adhesives Based on Butyl Acrylate and Acrylic Acid. Prog. Org. Coat. 2009, 65, 84–87. [Google Scholar] [CrossRef]
  92. Czech, Z.; Kowalczyk, A.; Kabatc, J.; Swiderska, J. Thermal Stability of Poly(2-Ethylhexyl Acrylates) Used as Plasticizers for Medical Application. Polym. Bull. 2013, 70, 1911–1918. [Google Scholar] [CrossRef]
  93. Navarro, R.; Ferrándiz, S.; López, J.; Seguí, V.J. The Influence of Polyethylene in the Mechanical Recycling of Polyethylene Terephtalate. J. Mater. Process Technol. 2008, 195, 110–116. [Google Scholar] [CrossRef]
  94. Fitaroni, L.B.; de Oliveira, É.C.; Marcomini, A.L.; Paranhos, C.M.; Freitas, F.L.; Cruz, S.A. Reprocessing and Solid State Polymerization on Contaminated Post-Consumer PET: Thermal and Crystallization Behavior. J. Polym. Environ. 2020, 28, 91–99. [Google Scholar] [CrossRef]
  95. Welle, F. Simulation of the Decontamination Efficiency of PET Recycling Processes Based on Solid-State Polycondensation. Packag. Technol. Sci. 2014, 27, 141–148. [Google Scholar] [CrossRef]
  96. Hadi, A.J.; Najmuldeen, G.F.; Ahmed, I. Polyolefins Waste Materials Reconditioning Using Dissolution/Reprecipitation Method. APCBEE Proc. 2012, 3, 281–286. [Google Scholar] [CrossRef]
  97. Horodytska, O.; Valdés, F.J.; Fullana, A. Plastic flexible films waste management—A state of art review. Waste Manag. 2018, 77, 413–425. [Google Scholar] [CrossRef]
  98. Mostafapoor, F.; Khosravi, A.; Fereidoon, A.; Khalili, R.; Jafari, S.H.; Vahabi, H.; Formela, K.; Saeb, M.K. Chapter 12—Interface analysis of compatibilized polymer blends. In Compatibilization of Polymer Blends; Elsevier: Amsterdam, The Netherlands, 2020; pp. 349–371. [Google Scholar] [CrossRef]
  99. Ragaert, K.; Delva, L.; Van Geem, K. Mechanical and chemical recycling of solid plastic waste. Waste Manag. 2017, 69, 24–58. [Google Scholar] [CrossRef]
Figure 1. Graphical representation of the experimental approach of this study.
Recycling 09 00093 g001
Figure 2. PET yields and recovered mass (Rm) of the four recycling tests with four different PET tray feedstocks.
Recycling 09 00093 g002
Figure 3. Comparison of intrinsic viscosity values.
Recycling 09 00093 g003
Figure 4. Development of the degree of crystallisation of the samples through the different steps of the recycling process.
Recycling 09 00093 g004
Figure 5. Yellow index comparison for the different samples.
Recycling 09 00093 g005
Table 1. Counting impurities resulting from microscopic pictures (Y) and photos (X).
SampleXY
T.11717
T.22950
T.34.51473
T.471735
E.071925
E.11.5509
E.21.5589
E.351284
E.461402
T.1: Sample 1 flakes; T.2: Sample 2 flakes; T.3: Sample 3 flakes; T.4: Sample 4 flakes; E.0: Sample 0 extruded; E.1: Sample 1 extruded; E.2: Sample 2 extruded; E.3: Sample 3 extruded; E.4: Sample 4 extruded.
Table 2. The four different types of PET feedstock that were mechanically recycled.
SampleFeedstocks CompositionImpurity Concentration *PET
Concentration
0Reference sample, mono-material PET tray from producer (not waste), without objects0%100%
1Industrial PET tray SPs from Dutch system, including faulty sorted objects and attached residual waste (only non-coloured waste)19.03%80.97%
2 Industrial PET tray SPs from Dutch system, excluding faulty sorted objects and attached residual waste (only non-coloured waste)15.52%84.48%
3 Complete PET trays, including packaging components made from non-PET polymers such as labels, caps and closures (only non-coloured waste)4.33%95.67%
4PET trays, excluding packaging components made from non-PET polymers such as labels, caps and closures (only non-coloured waste) 1.48%98.52%
* the concentration of impurities has been estimated as the percentage content of polymers other than PET in the feedstock (thus corresponding to the complement to c f e e d s t o c k P E T ).
Disclaimer/Publisher’s Note: The statements, opinions and data contained in all publications are solely those of the individual author(s) and contributor(s) and not of MDPI and/or the editor(s). MDPI and/or the editor(s) disclaim responsibility for any injury to people or property resulting from any ideas, methods, instructions or products referred to in the content.

