Article

Utilizing Ceramic Factory Waste to Produce Low-Cost Refractory Ceramics

by
Gamal A. Khater
1,*,
Maximina Romero
2,
Aurora López-Delgado
2,
Isabel Padilla
2,
Amany A. El-Kheshen
1,
Mohammad M. Farag
1,
Mohammad S. Elmaghraby
3,
Hussain Shendy
4 and
Naglaa H. S. Nasralla
5
1
Glass Research Department, National Research Centre, Dokki 12622, Giza, Egypt
2
Eduardo Torroja Institute for Construction Sciences (IETcc-CSIC), 28033 Madrid, Spain
3
Refractories, Ceramics and Building Materials Department, National Research Centre, Dokki 12622, Giza, Egypt
4
Geology Department, Faculty of Science, Beni-Suef University, Beni-Suef 62511, Beni Suef, Egypt
5
Electron Microscopy and Thin Films Department, National Research Centre, Dokki 12622, Giza, Egypt
*
Author to whom correspondence should be addressed.
Recycling 2024, 9(5), 98; https://doi.org/10.3390/recycling9050098
Submission received: 4 August 2024 / Revised: 19 September 2024 / Accepted: 9 October 2024 / Published: 14 October 2024

Abstract

:
The use of solid waste such as ceramic sludge, ceramic rollers, and magnesite was studied to obtain cheap refractory ceramics at temperatures of 1300 °C based on XRF, XRD SEM, EDX, bending strength, and dielectric properties. The prepared samples were examined. The results showed that the significant crystalline phases formed were mullite, spinel, and corundum. They also showed that mullite hindered the formation of cordierite and enhanced spinel formation. With increased cordierite content, the microstructure varied from fine grained to coarse grained. Bending strength increased with increasing mullite content and bulk density, ranging from 10.80 to 13.50 MPa. Bulk density increased with the increase in mullite content and sintering temperature and ranged from 1.99 to 1.94 g/cm3, while the percentage of porosity and water absorption decreased and ranged from 29.40 to 38.83, respectively. To examine the effect of the produced phases on the dielectric characteristics, the permittivity (ε′), dielectric loss (ε″), and AC conductivity (σac) were measured in the frequency range of 10−1 Hz to 106 Hz. As the concentration of cordierite increased, there was a noticeable drop in ε′ from 35.6 to 8.2 and σac from 10−8 s/cm to around 10−11 s/cm and high values of resistivity from 108 cm/s to about 1010 cm/s, suggesting that this material might be an excellent insulator.

1. Introduction

As civilization develops, living standards progress; thus, the production of industrial solid waste, which has a negative impact on the environment and public health, increases [1,2]. Recycling waste materials is a good choice as a well-established solid waste management method for producing high-value products.
Solid waste is also produced during the various processing stages of the ceramic manufacturing process, such as raw material grinding, fired product burnishing, and end product shorting (quality check) [3,4]. A more suitable waste management strategy is to recycle this waste into raw materials for another sector. Because these waste materials are frequently dumped in landfill and take up a considerable amount of space, they may constitute a hazard to the environment [5,6,7]. With the growing awareness of environmental protection, the safe removal and resource utilization of ceramic waste has become crucial.
Waste ceramic (WC) is mainly created from ceramic production. There are numerous varieties of WC, including ceramic tiles, sanitary wares, ceramic electrical insulator waste, ceramic sludge, and ceramic rollers. Quartz, feldspar, clay, sand, and other natural ingredients are fired to create ceramic tiles [8,9,10].
Sludge from the production of ceramics is one type of waste made of ceramic materials; it primarily consists of components based on silico-aluminous materials (>50%) and typically has low levels of heavy metals. This kind of waste is related to the production of ceramics and is frequently disposed of inadequately despite being a substantial source of additives in producing bricks and other materials if new mixes are properly planned. Its composition is comparable to the basic clayey materials used to make bricks. SiO2, Al2O3, oxides of alkaline and alkaline earth metals, and trace amounts of heavy metal oxides such as cadmium, lead, and chromium are the main ingredients of ceramic sludge [11,12,13,14,15].
The primary piece of equipment for firing ceramic tiles is regarded as a roller kiln. Roller kilns are preferred over tunnel kilns because they are more affordable and efficient, maintain constant heat and temperature, and may be utilized for rapid firing operations [16]. The size of the output that will be fired in it is determined by the gap between the rollers [17]. Because of how they operate, roller kilns adversely affect the environment, and surface grinding of their rollers is required periodically to remove any residue. The rollers are manufactured mostly from alumina. The primary causes of contamination are either alkali salt precipitation during the condensation phase in the kiln’s cooling zone or glaze seeping from tile edges. These alkali salts are used to imbue ceramic tiles with unique characteristics. The fact that this trash is stored outside poses a severe risk to human health [18,19]. Mullite (3Al2O3·2SiO2) or alumina-mullite formations are typically found in kiln rollers. The primary justifications for using both kiln roller materials are alumina’s high strength and mullite’s strong creep strength at increased temperatures [20].
Refractories are the fundamental materials used in the furnace and oven industries. Recently, with increased demand for saving energy and reducing CO2 release, more emphasis has been placed on lightweight refractories. Traditionally, the use of lightweight refractories for the working lining of high-temperature furnaces has been limited due to their large pore size and uneven pore size distribution, which results in low strength and low thermal shock resistance. These refractories are created using a standard powder processing method with the addition of some pore-forming agents [21].
Understanding the thermo-mechanical behavior of refractory materials is crucial for their usage as linings in high-temperature furnaces and refining vessels in the cement, metallurgical, and petrochemical industries. The increasing utilization of finite element computations to predict behavior under real-world conditions necessitates understanding mechanical properties closely linked to damage evolution at elevated temperatures, which aligns with the materials’ application area [22].
The development of fast-firing systems currently permits the creation of cordierite–mullite refractory composites using affordable technology. Two examples of technically significant ceramic materials with various uses are cordierite and mullite [23].
Refractory materials made of cordierite and mullite are widely employed as furnace support elements in the production of ceramics. They undergo several temperature cycles while accounting for their service circumstances. These materials have a complicated microstructure with a silicate glassy phase surviving and crystalline phases with differing elastic characteristics and mismatched thermal expansion. Some microstructural phenomena are present, as in many multiphase refractories, which result in internal stresses and damage during cooling. The primary source of these occurrences is variations in thermal expansion properties [24].
Alumina substitution may be viable because of cordierite’s excellent thermal shock resistance, low thermal expansion coefficient, and high chemical and thermal stability [25]. However, several of the envisaged applications are limited by the poor mechanical characteristics of cordierite [26,27,28,29,30]. Mullite, on the other hand, has better mechanical qualities both at room temperature and at higher temperatures [23].
To create premium mullite-based refractory ceramics at 1500 °C, up to 40 weight percent of ceramic waste and 60 weight percent raw bauxite can be used. The mechanical characteristics increase when the percentage of ceramic waste decreases [31]. Refractory ceramics were made from leftover alumina and clay materials heat-treated in a traditional furnace between 1300 and 1400 °C, with a dwell period of two and three hours at the highest temperature and a heating rate of 5 °C/min. Prior to heat treatment, the formulation with the highest concentration of fluxing oxides showed the most linear shrinkage according to the data. Mullite was identified as the predominant phase following XRD analysis, and SEM revealed needle-shaped crystals that were characteristic of mullite and were derived from clay minerals. The specimens’ physicomechanical characteristics were enhanced by raising the firing temperature and staying at the highest temperature for a longer period of time. Between 25 and 1000 °C, the thermal expansion coefficient (TEC) varied from 6.2 to 6.9 × 10⁻⁶ °C−1 [32].
Compared to metals, ceramics have incredibly low electrical conductivity because of ionic–covalent interaction, which inhibits the creation of free electrons. Most ceramic materials are dielectric, so they can support an electrostatic field even though they have very low electric conductivity. The electrical conductivity of ceramics varies with the applied field frequency and temperature. This can be attributed to the frequency dependence of charge transport processes. Furthermore, it is also feasible to understand the kind of mechanism responsible for conductivity from AC conductivity data.
The ability of a material to transport an alternating current, or the dielectric constant (concerning vacuum conditions), is another crucial characteristic of dielectric materials. The dielectric constant of the dielectric material used in a capacitor is directly proportional to its capacitance [29]. Capacitors, resistors, and insulators are made from dielectric ceramics.
In order to evaluate the dielectric and electrical properties of the ceramic rollers and ceramic sludge used in manufacturing mullite and cordierite refractories fired at 1200 °C and 1300 °C, we aimed to figure out a possible low-cost material for electronics-related applications. Dielectric spectroscopy is an essential instrument for examining the electrical and dielectric properties of prepared samples. Thus, the dielectric parameters such as AC conductivity (σac), permittivity (ε′), dielectric loss (ε″), and the electric loss modulus (M″), were measured at room temperature and over a wide range of frequencies, from 10−1 to 106 Hz. Samples were prepared using a parallel plate capacitor design between two gold-plated stainless-steel electrodes.
The novelty of this research is investigating the possibility of utilizing local industrial and mining waste, represented by ceramic sludge, a ceramic roller, and magnesite, in producing low-cost, valuable, and economic refractory ceramics such as mullite, spinel, corundum, and cordierite phases at low temperatures in a clean manner, protecting the environment from this harmful waste.

2. Results and Discussion

2.1. Chemical Composition of the Studied Materials

Table 1 illustrates the significant oxides for ceramic roller waste, ceramic sludge, magnesite, and silica sand. The ceramic roller is composed of alumina, silica, and zirconia at 60, 28.19, and 6.95%, respectively. Minor and trace amounts of other oxides are exhibited in Table 1. The phase composition of the roller waste is displayed in Figure 1a, and it was confirmed that four phases were detected as mullite (Al6Si2O13), corundum (Al2O3), and baddeleyite (ZrO2) in descending order. These phases ensure that the primary chemical composition is alumina, silica, and zirconia phases.
Ceramic sludge is essentially composed of silica as the essential oxide content, alumina, and calcia at 77.32, 7.60, and 7.23%, respectively. Minor and trace amounts of other oxides are exhibited in Table 1. The phase composition of the ceramic sludge is displayed in Figure 1b, which shows that the detected phases are quartz (SiO2), kaolinite (Al2Si2O5) (OH)4, and calcite (CaCO3). These phases ensure that XRF technology performs chemical analysis of the data.
The chemical and phase composition of magnesite is illustrated in Table 1. Magnesia has significant oxide content at 36.92%, while that of calcium oxide is at 8.56%. Lower amounts of silica, alumina, and iron oxide were detected, with values of 2.85, 1.94, and 1.28%, respectively. The loss on ignition was recorded as 48.14%, which refers to the carbon dioxide content of the major phases. The phase composition of the magnesite sample confirms its chemical composition as the essential phase is magnesite (MgCO3) with a subordinate amount of dolomite CaMg (CO3)2, while silica content is represented as antigorite Mg3Si2O5(OH)4 as minor content in the sample, Figure 1c.
The chemical composition of silica sand is mainly silica at 98.35% and a minor amount of alumina at 1.24% and iron oxide at 0.26%. The phase composition of silica sand shows only quartz (SiO2) content as one phase, which confirms its chemical composition, Figure 1d.

2.2. Physical Properties of the Investigated Samples

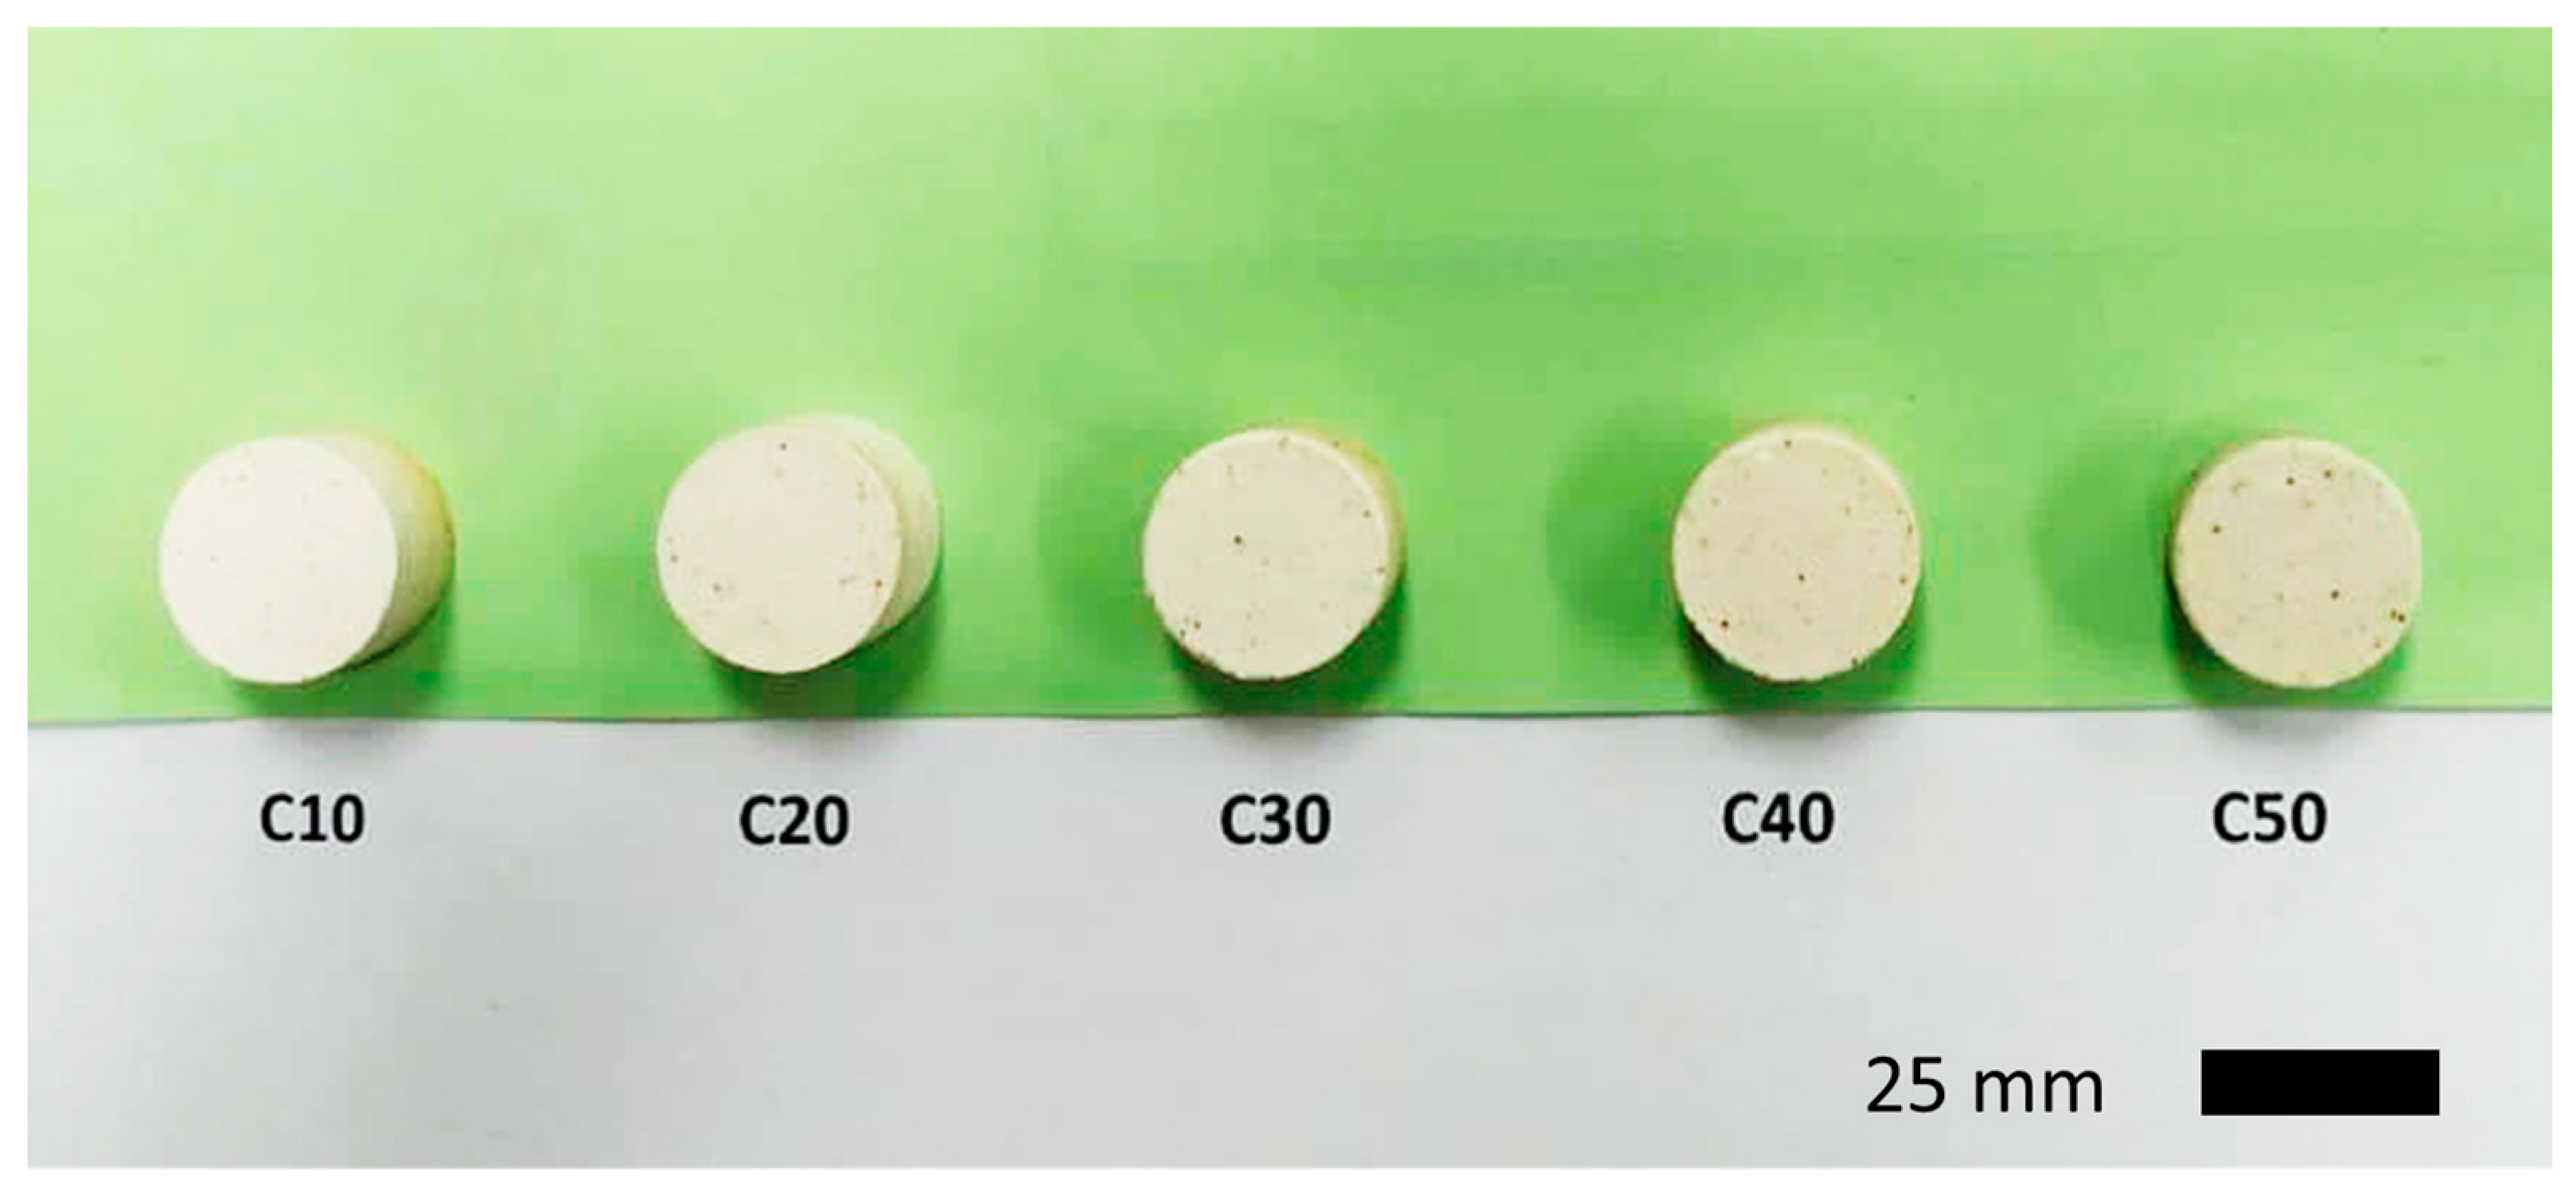
The samples prepared from aforementioned raw materials are shown in Figure 2. The studied physical properties are the bulk density, porosity, and water absorption determined after sintering the samples at a temperature of 1200 °C for two hours, as shown in (Table 2 and Figure 3). The results show a decrease in the bulk density from C10 to C50. Its values ranged from 1.99 g/cm3 to 1.94. At the same time, both porosity and water absorption increased from C10 to C50, i.e., inversely proportional to bulk density, and their values ranged from 29.40 to 38.83 in porosity and 12.69 to 14.96 in water absorption after firing at a temperature of 1300 °C for two hours, as shown in (Table 3 and Figure 4). The results show a decrease in bulk density from C10 to C50. The values ranged from 2.32 g/cm3 to 1.98. At the same time, both porosity and water absorption increase from C10 to C50, i.e., inversely proportional to bulk density, and their values ranged from 29.54 to 39.67 in porosity and 13.12 to 15.02 in water absorption. Generally, the higher the firing temperature, the closer the bond between particles. This leads to an increase in bulk density and reduces the porosity. The decrease in bulk density from C10 to C50 is due to an increase in the percentage of the cordierite phase, which has a density of 2.60 g/cm3 [28], and a decrease in the percentage of mullite, which has a density of 3.16 g/cm3 [29]. The increase in the percentage of porosity and water absorption from C10 to C50 is related to bulk density; an increase in bulk density means a reduction in the liquid phase, which helps close and shrink the pores, and vice versa, i.e., a decrease in bulk density is followed by an increase in the liquid phase, which leads to an increase in porosity and water absorption. These results concur with other studies by several researchers, who published that the density of corundum and spinel [29,32,33,34,35,36] phases is higher than those of cordierite [28]. The densities of the spinel and corundum in those earlier studies were 3.58 g/cm3 and 3.97 g/cm3, respectively, whereas for cordierite, the determined value was 2.3 g/cm3. These previous data are in agreement with the results of the current study. Mouiya et al. [37] revealed that the increase in bulk density caused by fire is most probable due to the formation of a glassy phase with more considerable liquid phase production and reduced porosity.

2.3. X-ray Diffraction of the Investigated Samples

2.3.1. X-ray Diffraction (XRD) of All Samples

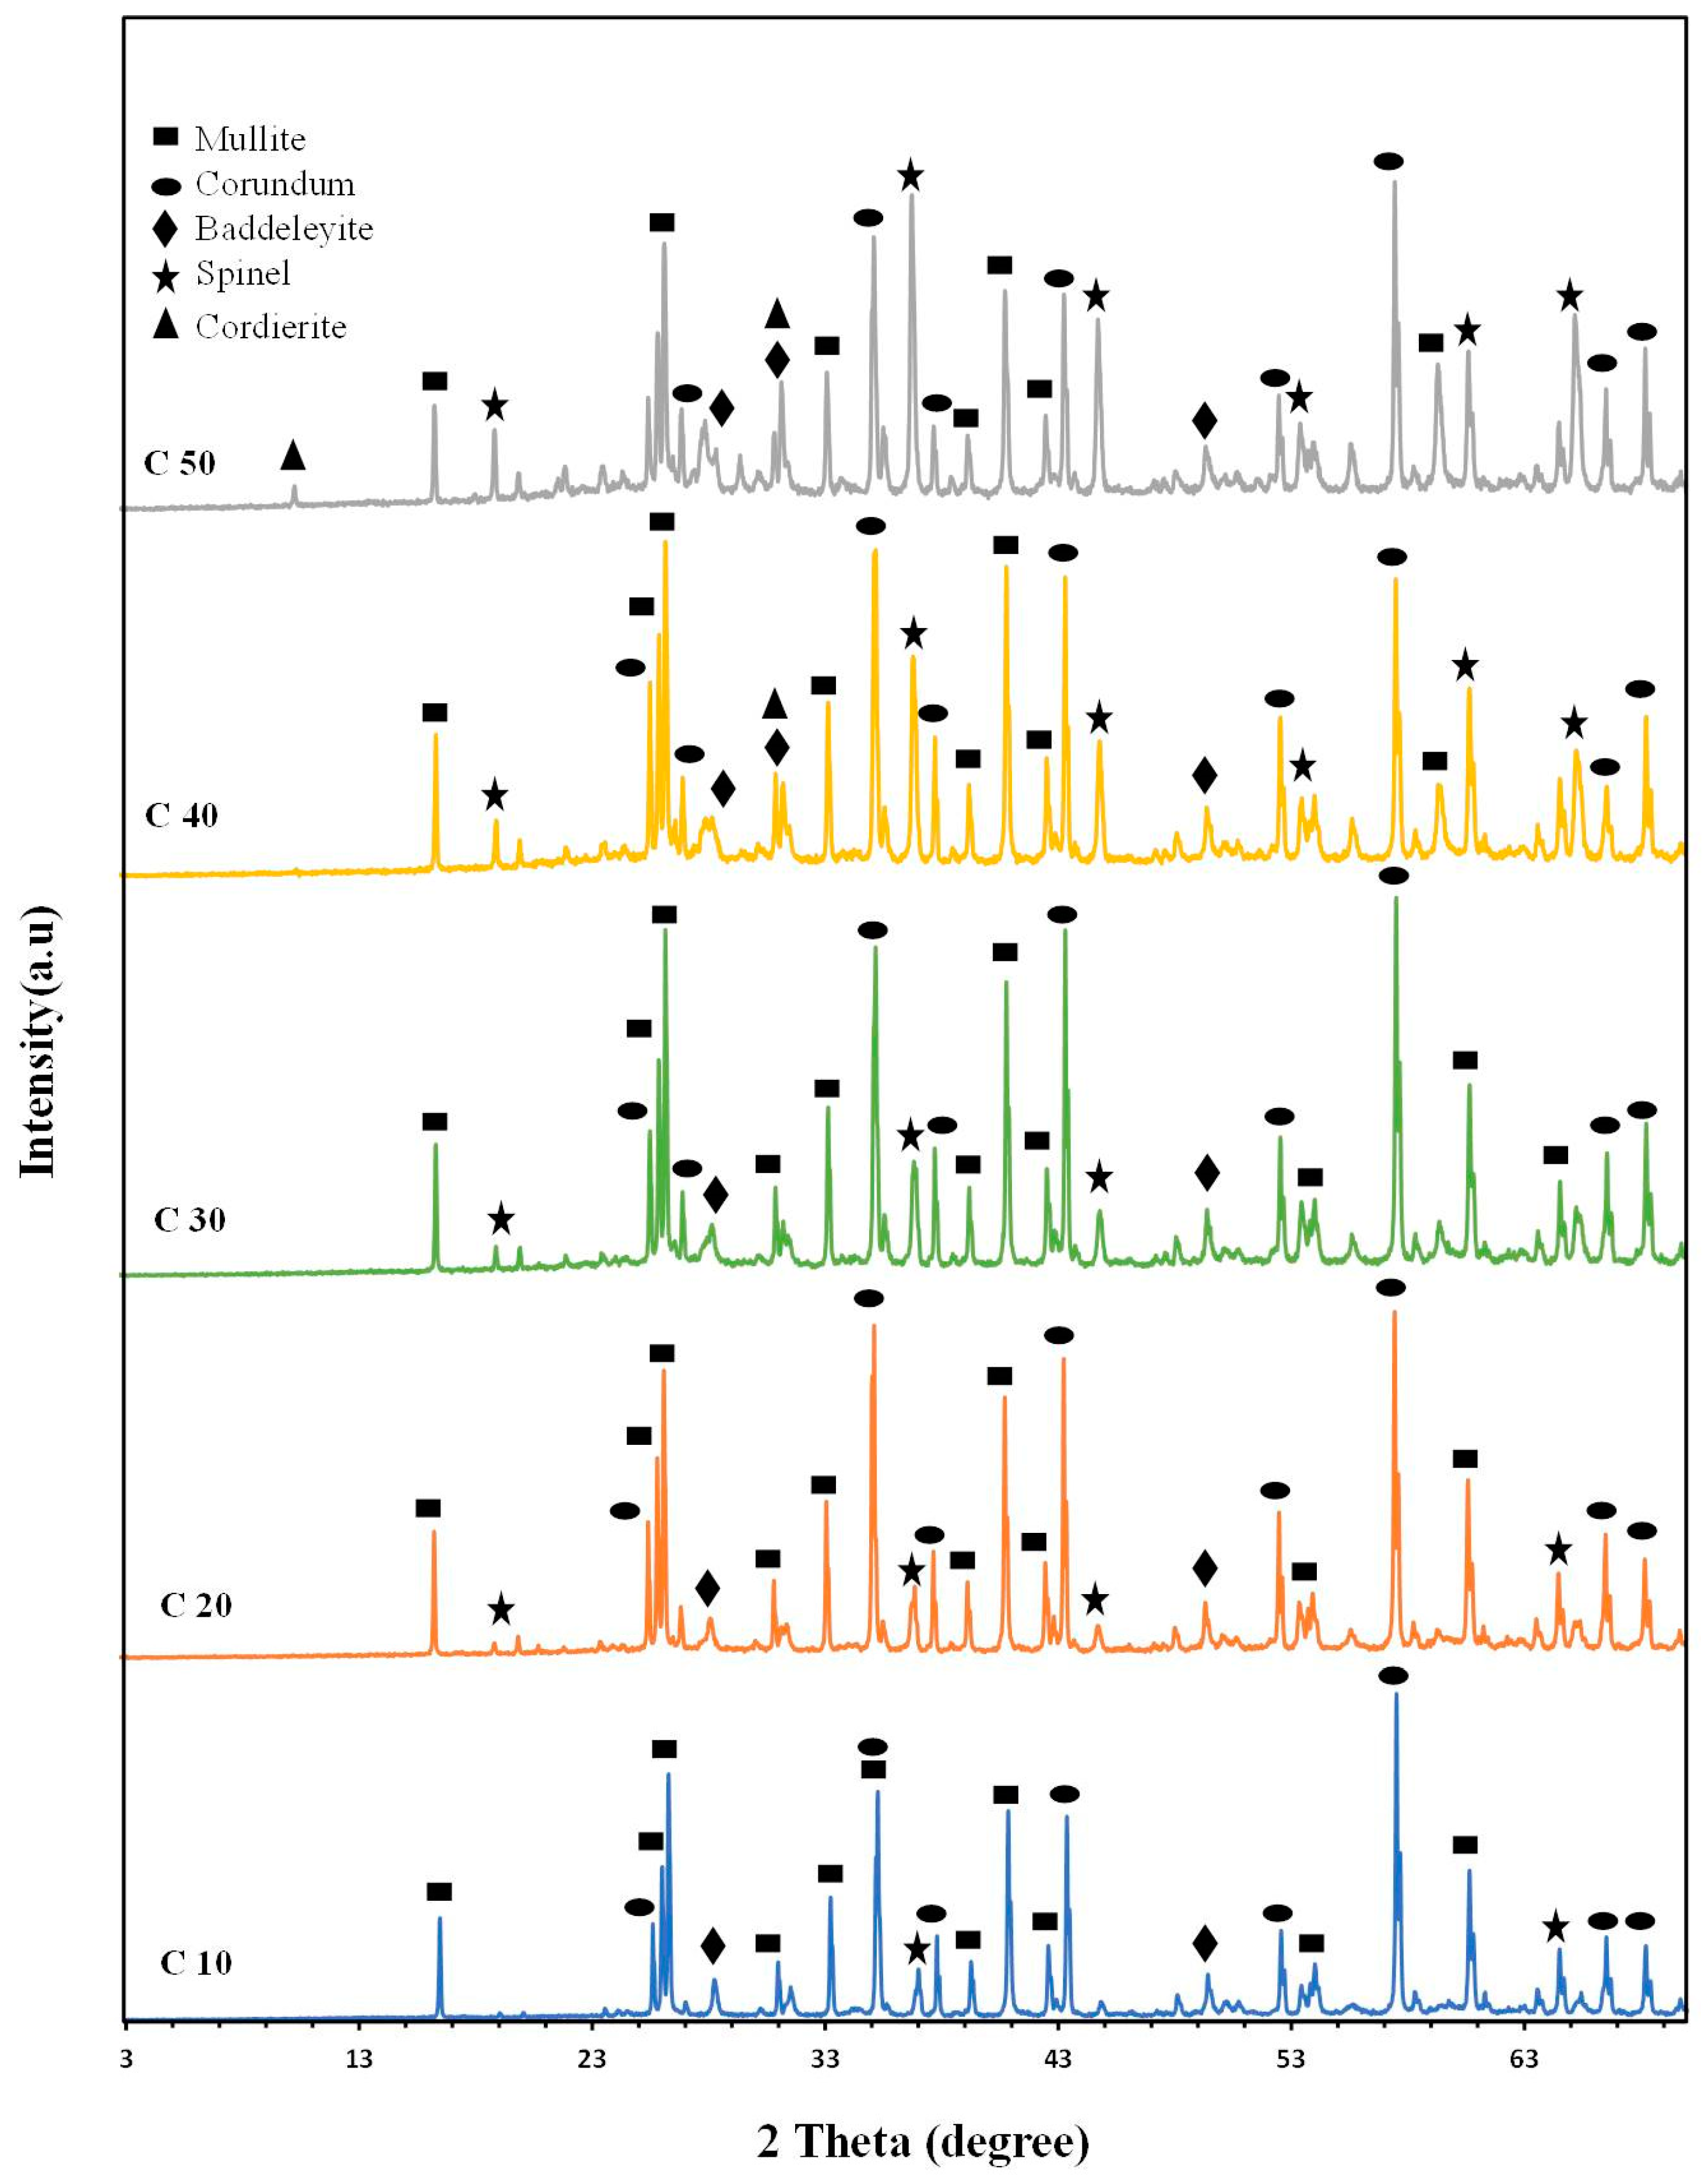
Figure 5 shows the XRD of the studied samples treated at 1300 °C for two hours; mullite (Al6Si2O13) (JSPDS No. 15-776), which has characteristic peaks of 3.39, 3.43, and 2.54 Å, and corundum (Al2O3) (JSPDS No. 10-173), which has lines of 2.08, 2.55 and 1.60 Å, are the major phases formed in C10 to C50. The spinel phase formed in all samples (MgAl2O4) (JSPDS No. 21-1152) with lines of 2.43, 2.85, and 1.43 Å, and it developed from C10 to C50, in addition to a small amount of baddeleyite (ZrO2) (JSPDS No. 13-307) with the characteristic lines of 3.16, 2.83, and 2.62 Å formed in all samples. Cordierite (Mg2Al4Si5O18) (JSPDS No. 12-303) has characteristic lines of 3.13, 8.54, 4.09, 3.39, and 3.04 Å; it begins to appear from C40 and begins to develop toward sample C50. The formation of mullite and corundum as major phases in all samples is due to the increased Al2O3 content and the ceramic roller. The formation of the spinel phase in all samples and its development from C10 to C50 is due to the increase in MgO. Cordierite is decomposed into spinel and silica according to the following equation: Mg2Al4Si5O18 → 2MgAl2O4 (spinal) + SiO2 (liquid phase).
The findings of this study are consistent with those of Simon Sembiring et al. [38]; utilizing a heat treatment regimen at a temperature of roughly 1230 °C, they investigated the impact of adding Al2O3 on the conversion and crystallization behavior of cordierite refractory ceramics based on rice husk silica. Their results indicated that adding Al2O3 led to the evolution of the crystallization of cordierite into spinel and corundum. It was also found that adding 10–30% Al2O3 increases the amount of spinel and reduces the amount of corundum and cristobalite phases. The occurrence of corundum, spinel, and cristobalite causes an increase in density and flexural strength, while the opposite is observed for porosity. The samples’ coefficient of thermal expansion reaches a somewhat consistent value of 9.5 × 10⁻⁶/°C once around 15–30% alumina is added. The predominant crystalline phase is spinel, followed by smaller amounts of corundum and cristobalite.

2.3.2. Influence of Firing Temperature on the Formed Crystalline Phases

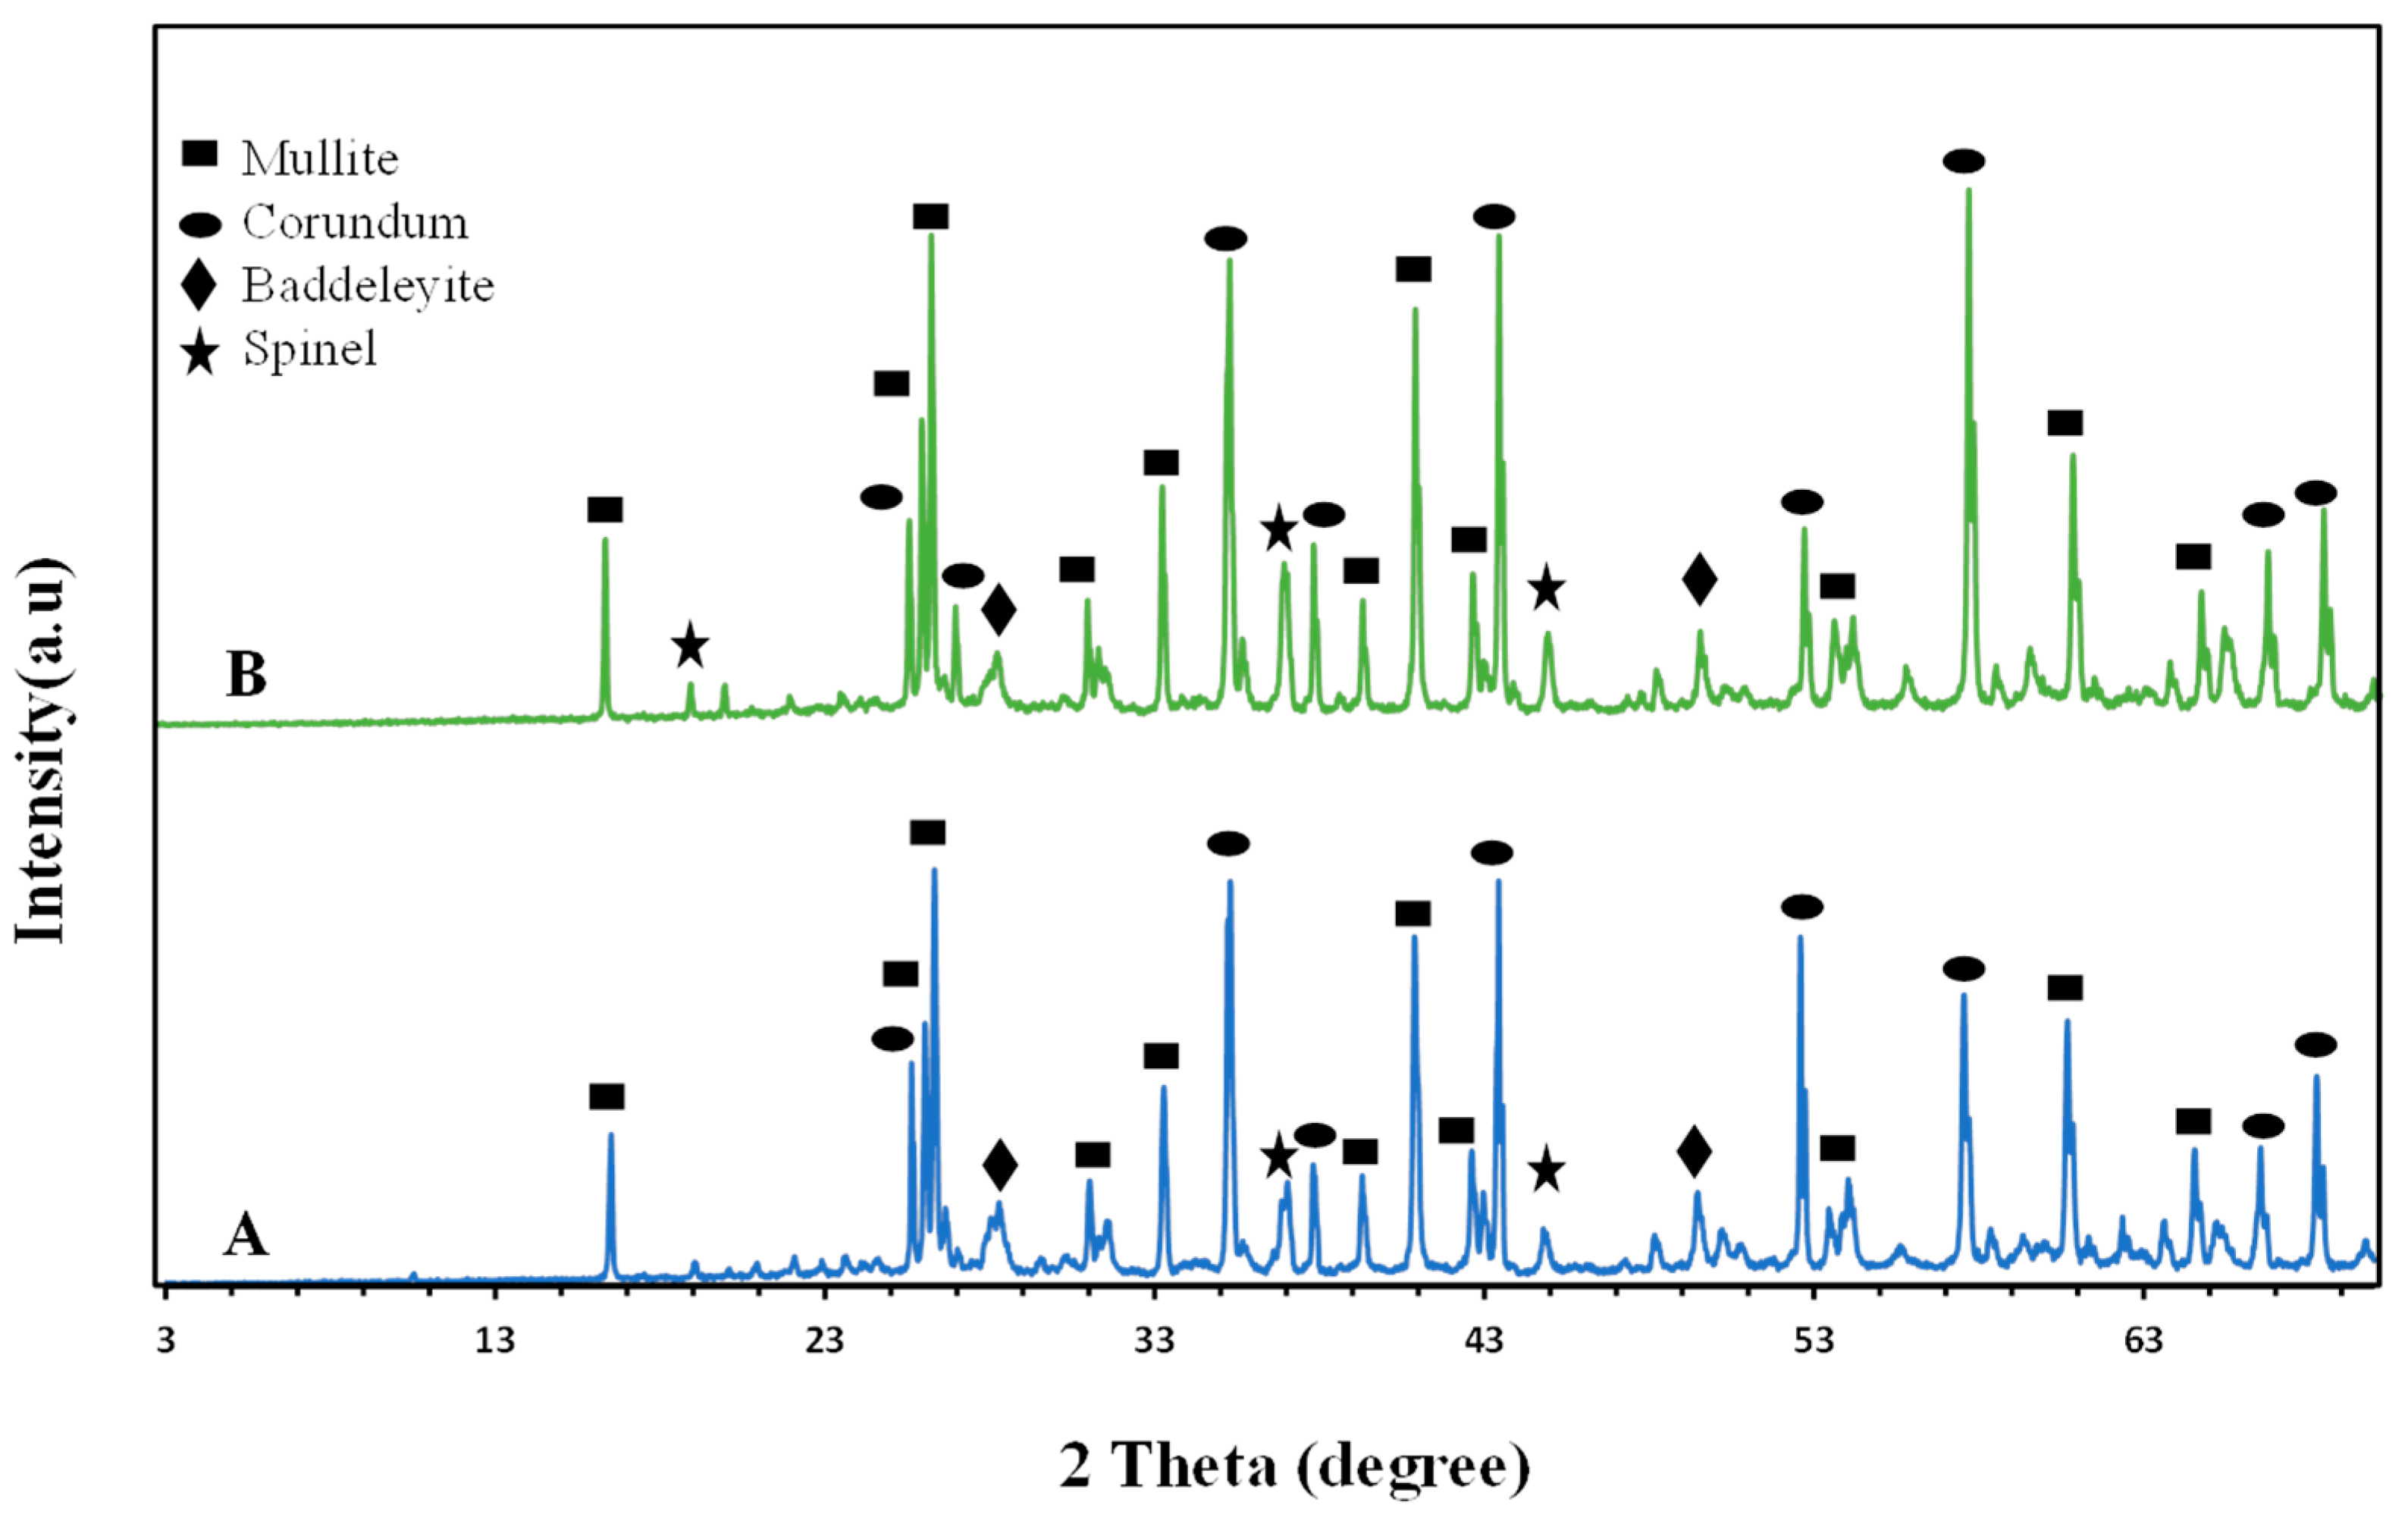
The effect of firing temperature on sample C30 was studied because it represents the mean sample of the studied ones. Figure 6 shows the X-ray diffraction of C30 after being fired at 1200 °C and 1300 °C for 2 h; the phases formed are mullite, spinel, corundum, and baddeleyite. Figure 6 shows a weak formation of the crystalline phases with a decrease in the intensity of their lines. Mullite represents the primary phase, followed by the corundum and spinel phases, and then a tiny amount of baddeleyite. When the temperature is raised to 1300 °C, crystalline phases develop, and the intensity of the lines increases for all crystalline phases (Figure 6). This means that at a temperature of 1200 °C, there is a percentage of the amorphous glassy phase. As the temperature increases, this glassy phase transforms into the previous crystalline phases, which helps in increasing the intensity of the lines of previous crystalline phases. The findings of this study agree with those of Cao, Zhimin, and Li, Ping [39], who demonstrated that by increasing the firing temperature, the intensity of the diffraction peak of the cordierite phase increased first as the temperature reached 1300 °C and the percent of cordierite phase increased from 56.8 wt% to 68.4 wt.%.

2.4. Microstructures (SEM and EDX)

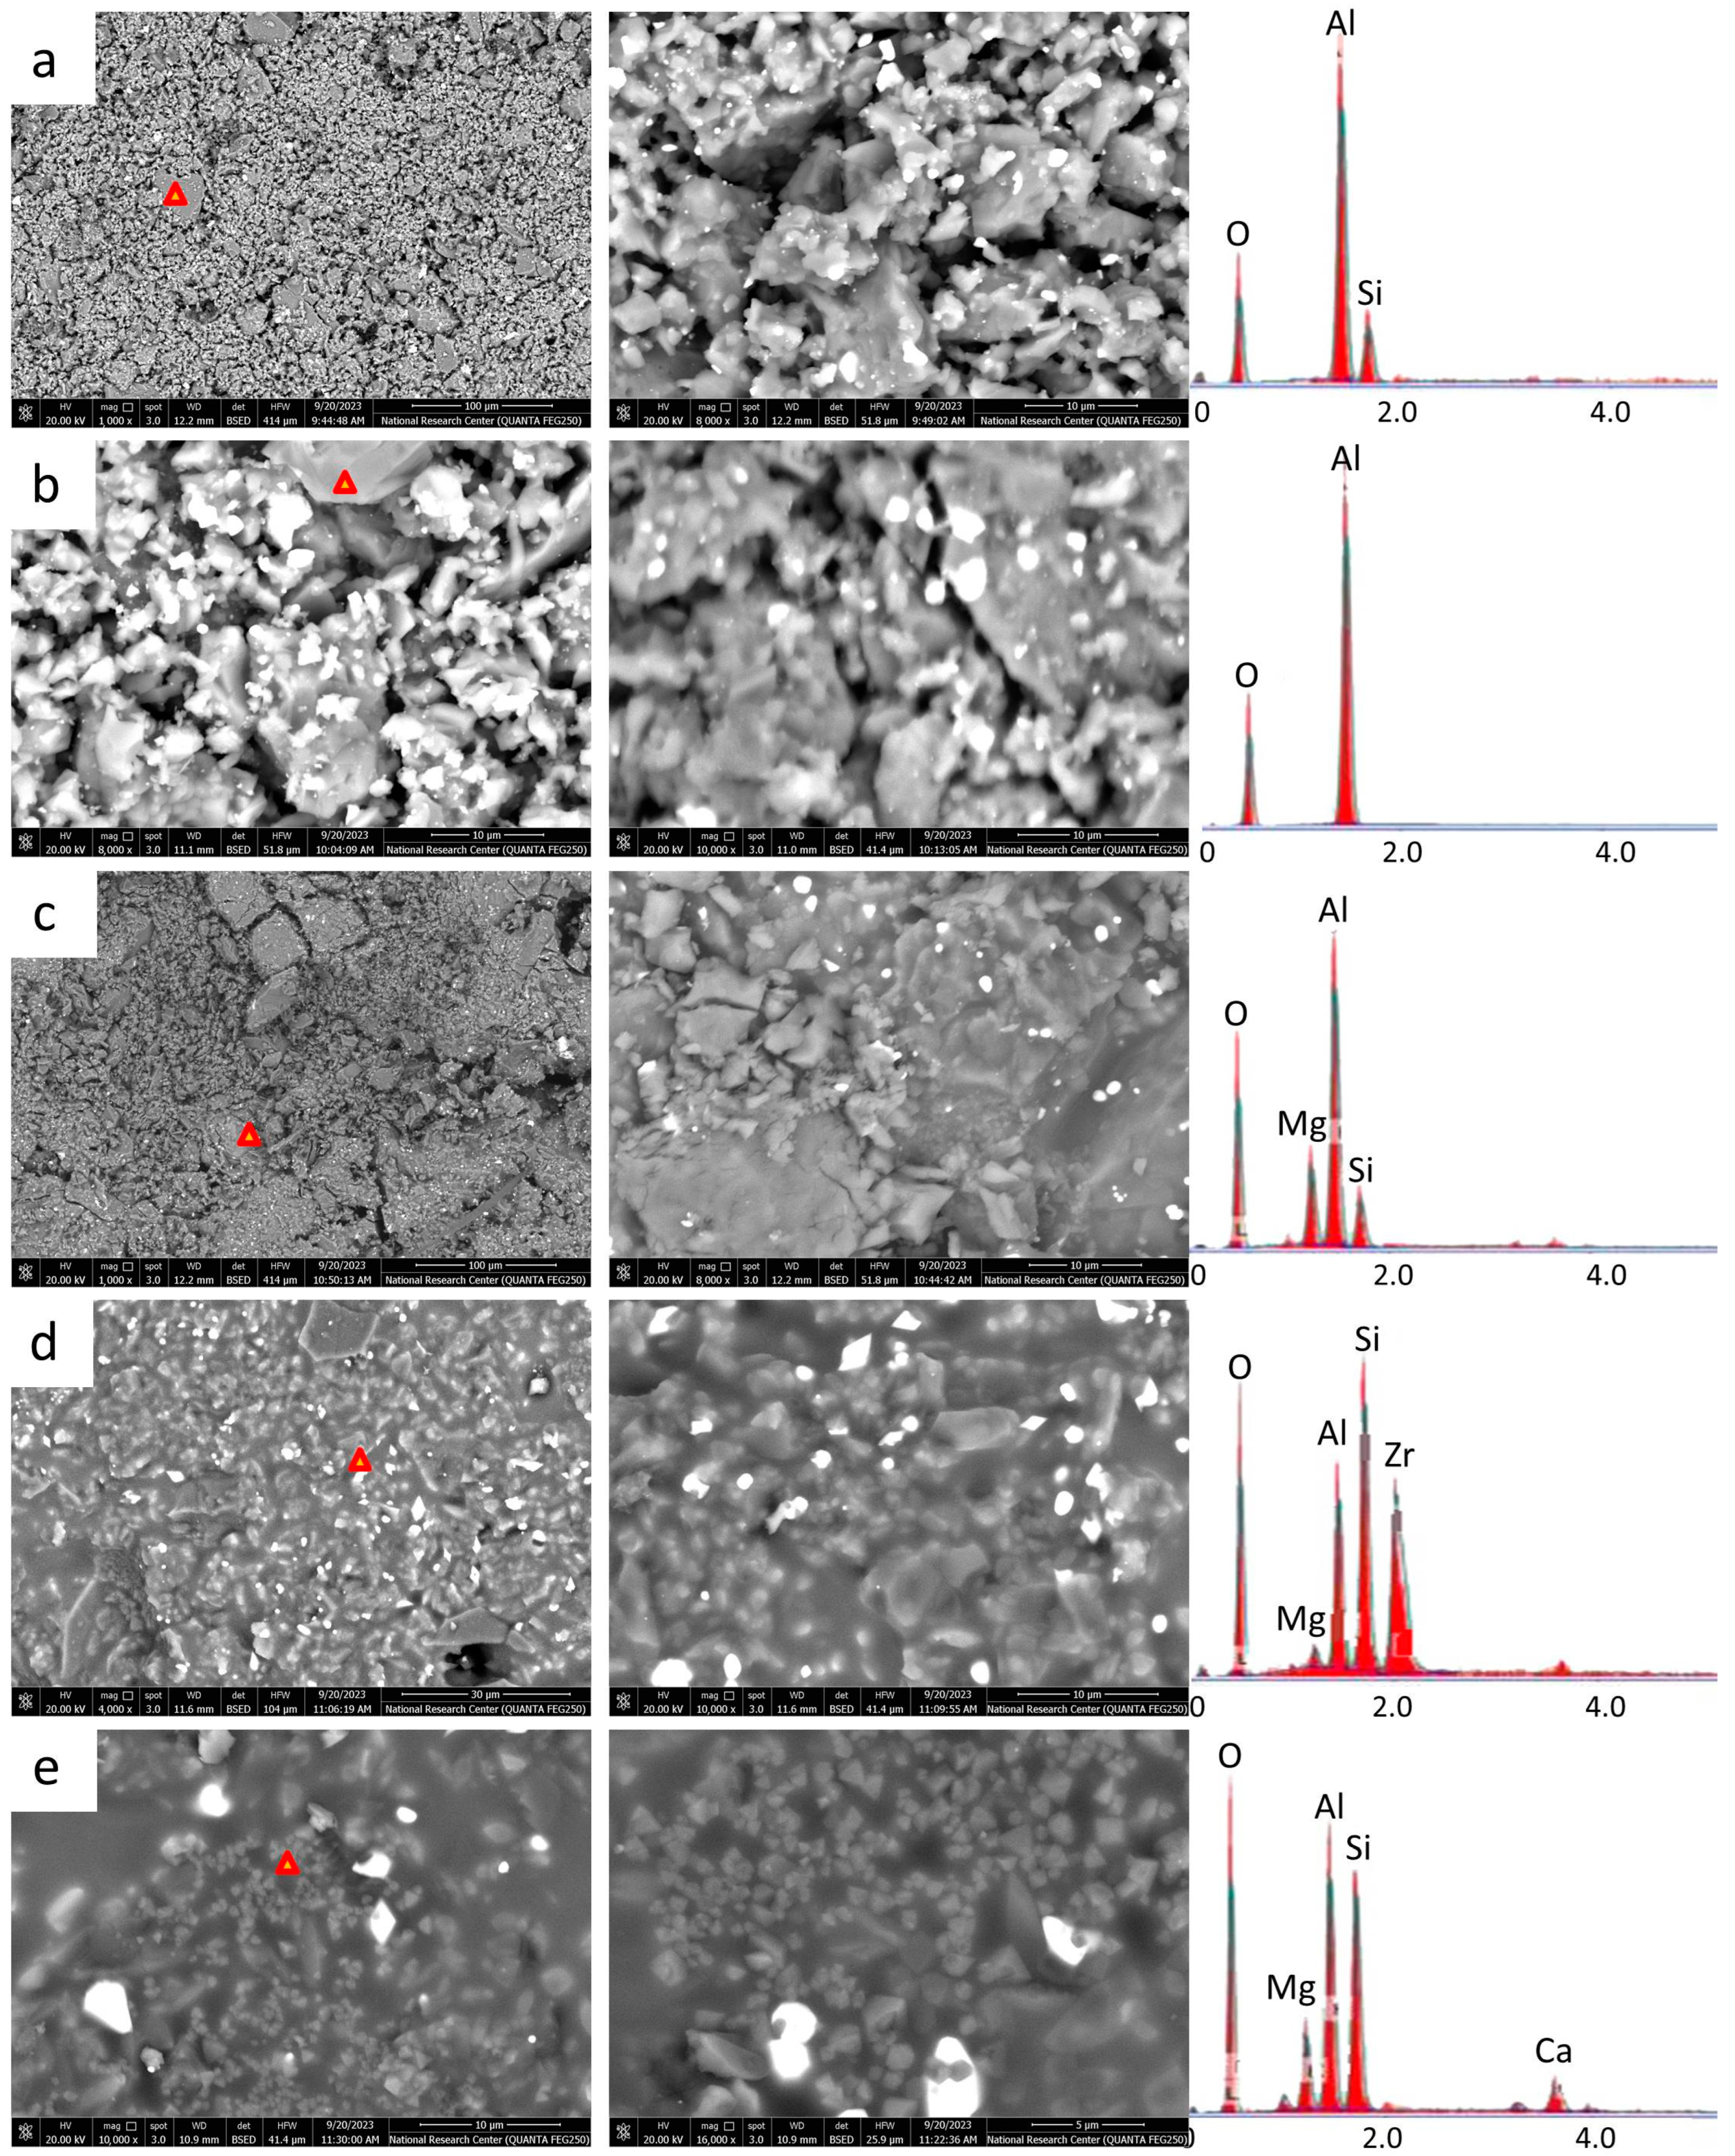
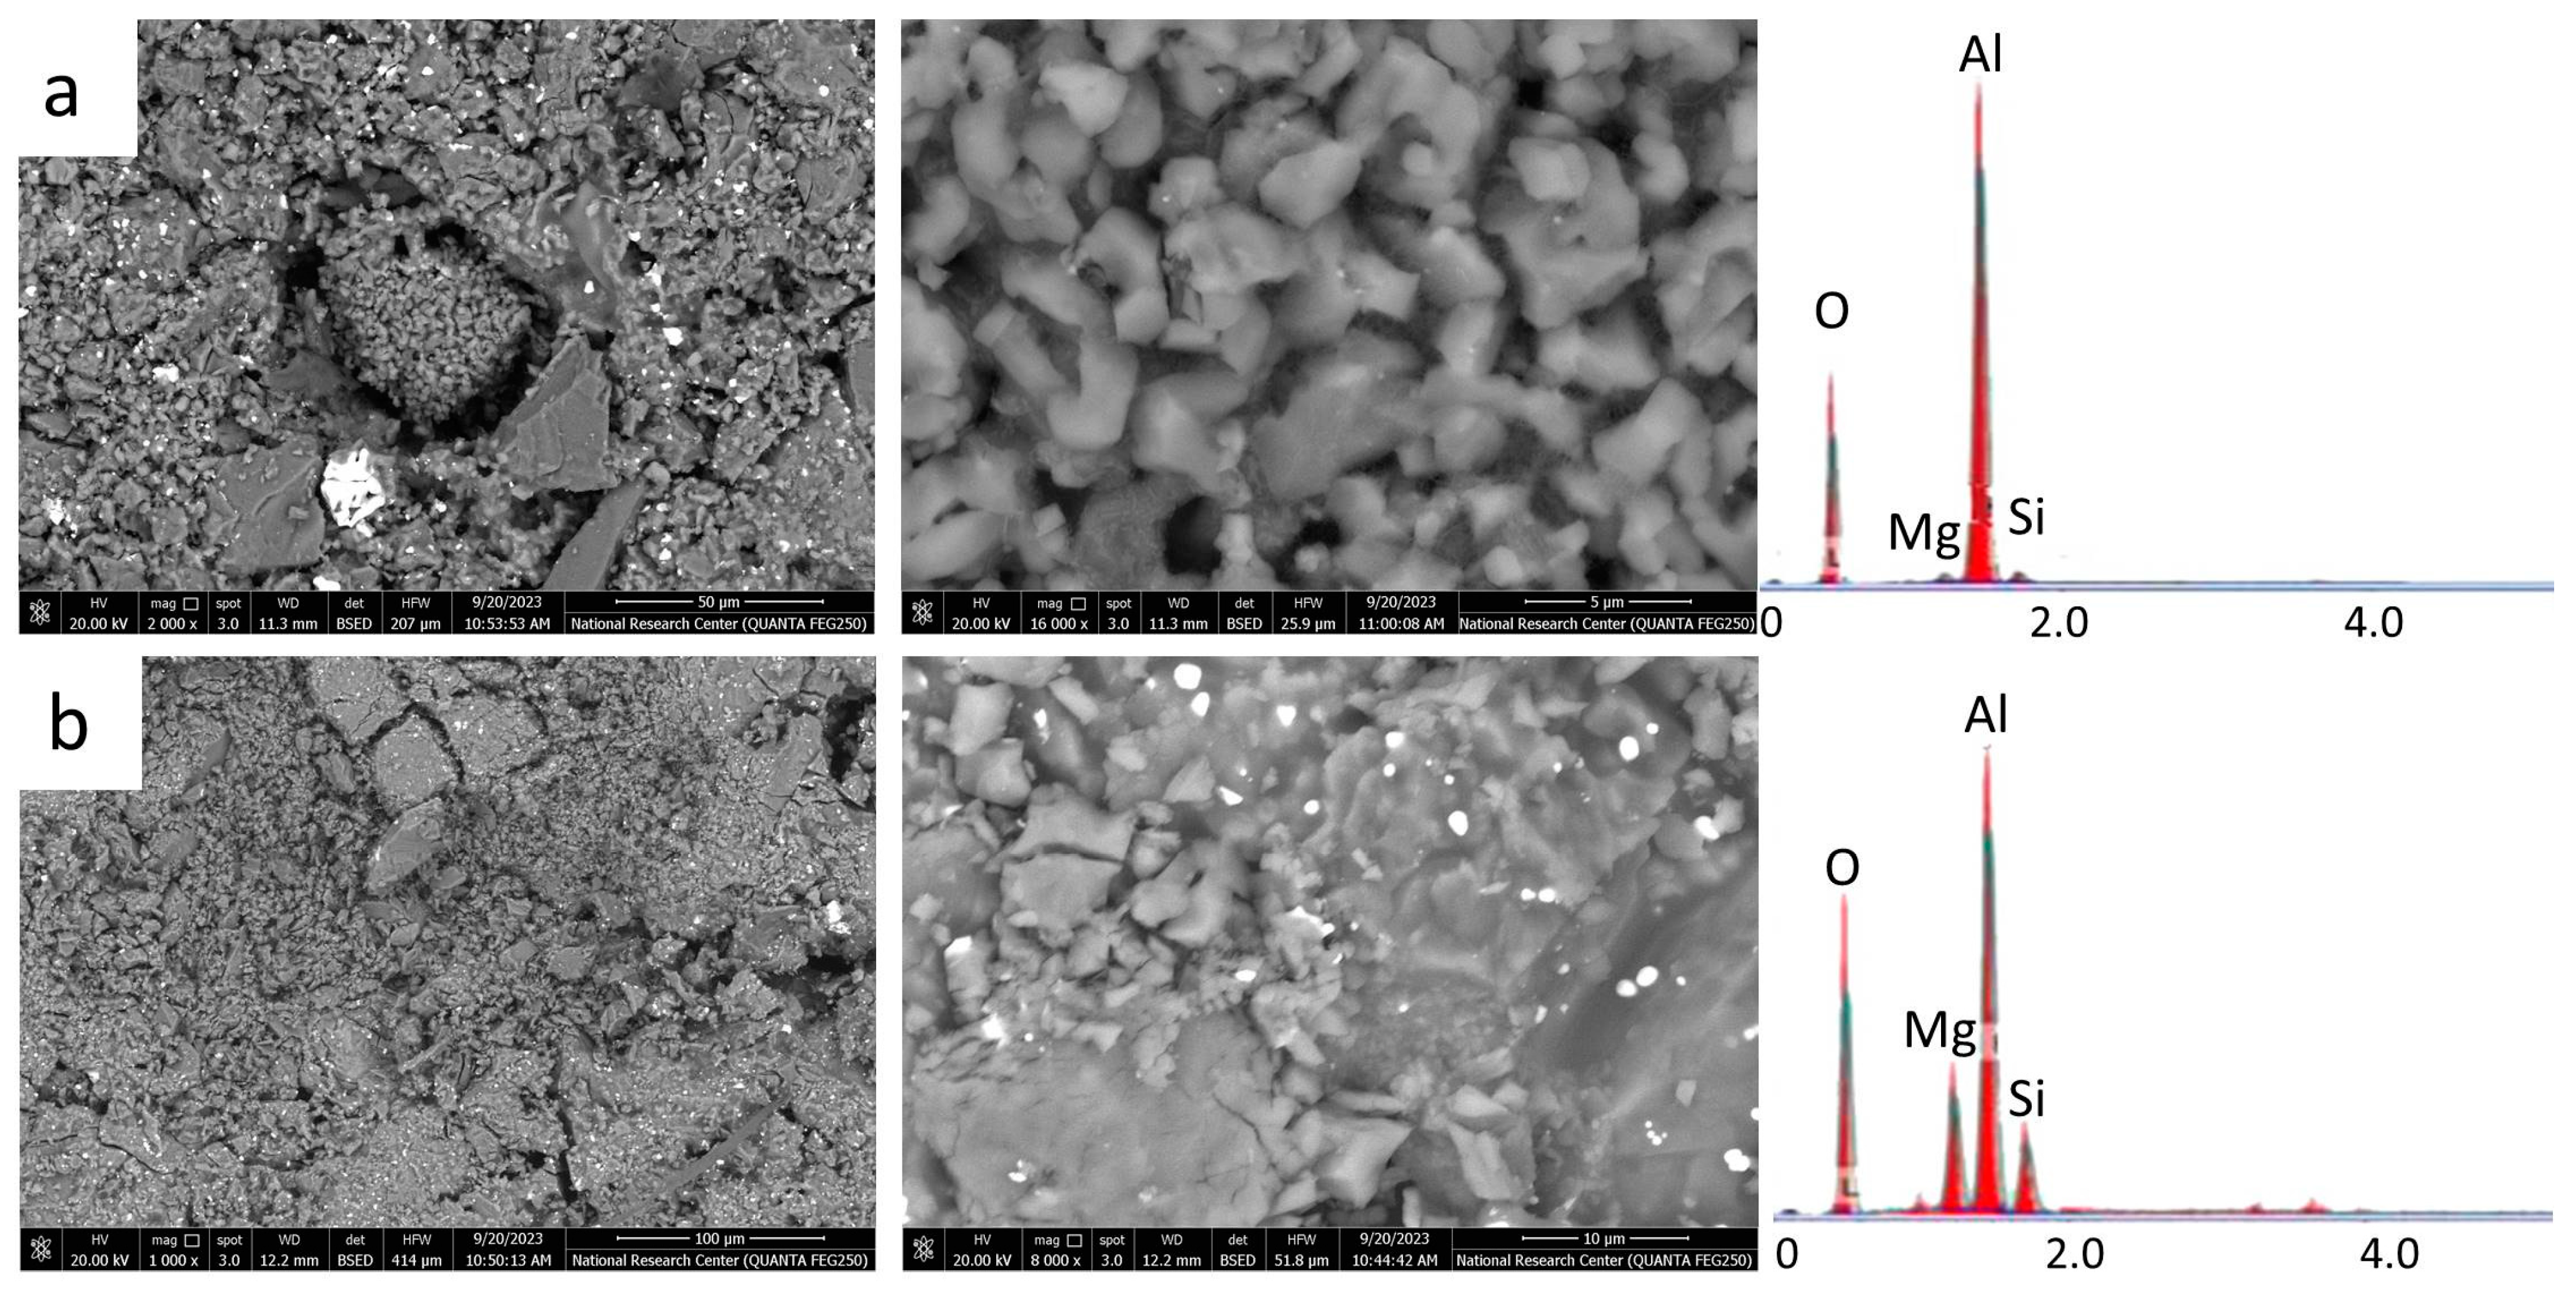
The study of the microstructure of the refractories is essential, as the microstructure directly affects different physical properties, such as porosity, density, and mechanical strength. In the study presented herein, the microstructure and surface chemical analysis of different refractory samples sintered at 1300 °C were studied using SEM and EDX, respectively (Figure 7). It can be seen from the figure that the C10 sample is essentially composed of refined grains of anhedral crystals of mullite and corundum, as confirmed by the EDX analysis of Al and Si peaks, as well as a few irregular grains bright in color embedded in a very fine grain of corundum which was detected during EDX analysis as baddeleyite. In the case of C20, clusters of corundum grains and mullite can also be observed and proven using EDX analysis. Increasing the percentage of magnesium oxide and replacing corundum and mullite helps in forming small amounts of spinel (the previous XRD analysis confirmed this). The peak of Mg appears in the EDX graph in sample C30 [26,40]. The C40 and C50 microstructures mainly comprise anhedral crystals of mullite and corundum attacked by magnesium oxide to form cordierite and spinel. Cordierite and spinel are embedded in very fine grains of corundum. Relics of mullite in prismatic form surrounded spinel’s new phase and rounded grains of zirconia. A low sintering temperature is preferred from an economic perspective. Therefore, sample C30 was selected because it possesses optimum properties to be heat treated at 1200 °C, and we studied the effect of temperature on the microstructure of this sample. SEM and EDX examination results for the C30 sample heated to 1200 and 1300 degrees Celsius is displayed in Figure 8. As shown in the figure, fine anhedral crystals of corundum and spinel scattered in refined grains of the same composition are predominant in the microstructure of the C30 sample sintered at 1200 °C. Also, refined grains of bright zirconia dispersed within the groundmass were detected. Subhedral-to-euhedral crystals of spinel were also observed. These results were confirmed using EDX analysis. The formation mechanism of these crystals can be explained by attacking mullite, as the primary phase, with active magnesia to give magnesia and alumina, which reacts with active magnesia to produce spinel. The corundum acted as a less active phase during the sequence of these reactions. The elevation in the sintering temperature resulted in a significant increase in densification, leading to more diffused and interconnected grain boundaries. Consequently, the ceramic grains experienced expansion, which resulted in a finer microstructure, thereby enhancing density and reducing porosity. In contrast, sintering at lower temperatures did not provide adequate energy to facilitate grain bonding, resulting in an open and porous structure. Thus, the ceramic microstructure was directly influenced by the sintering temperature, which had a notable impact on the mechanical properties of the material [41].

2.5. Bending Strength (BS)

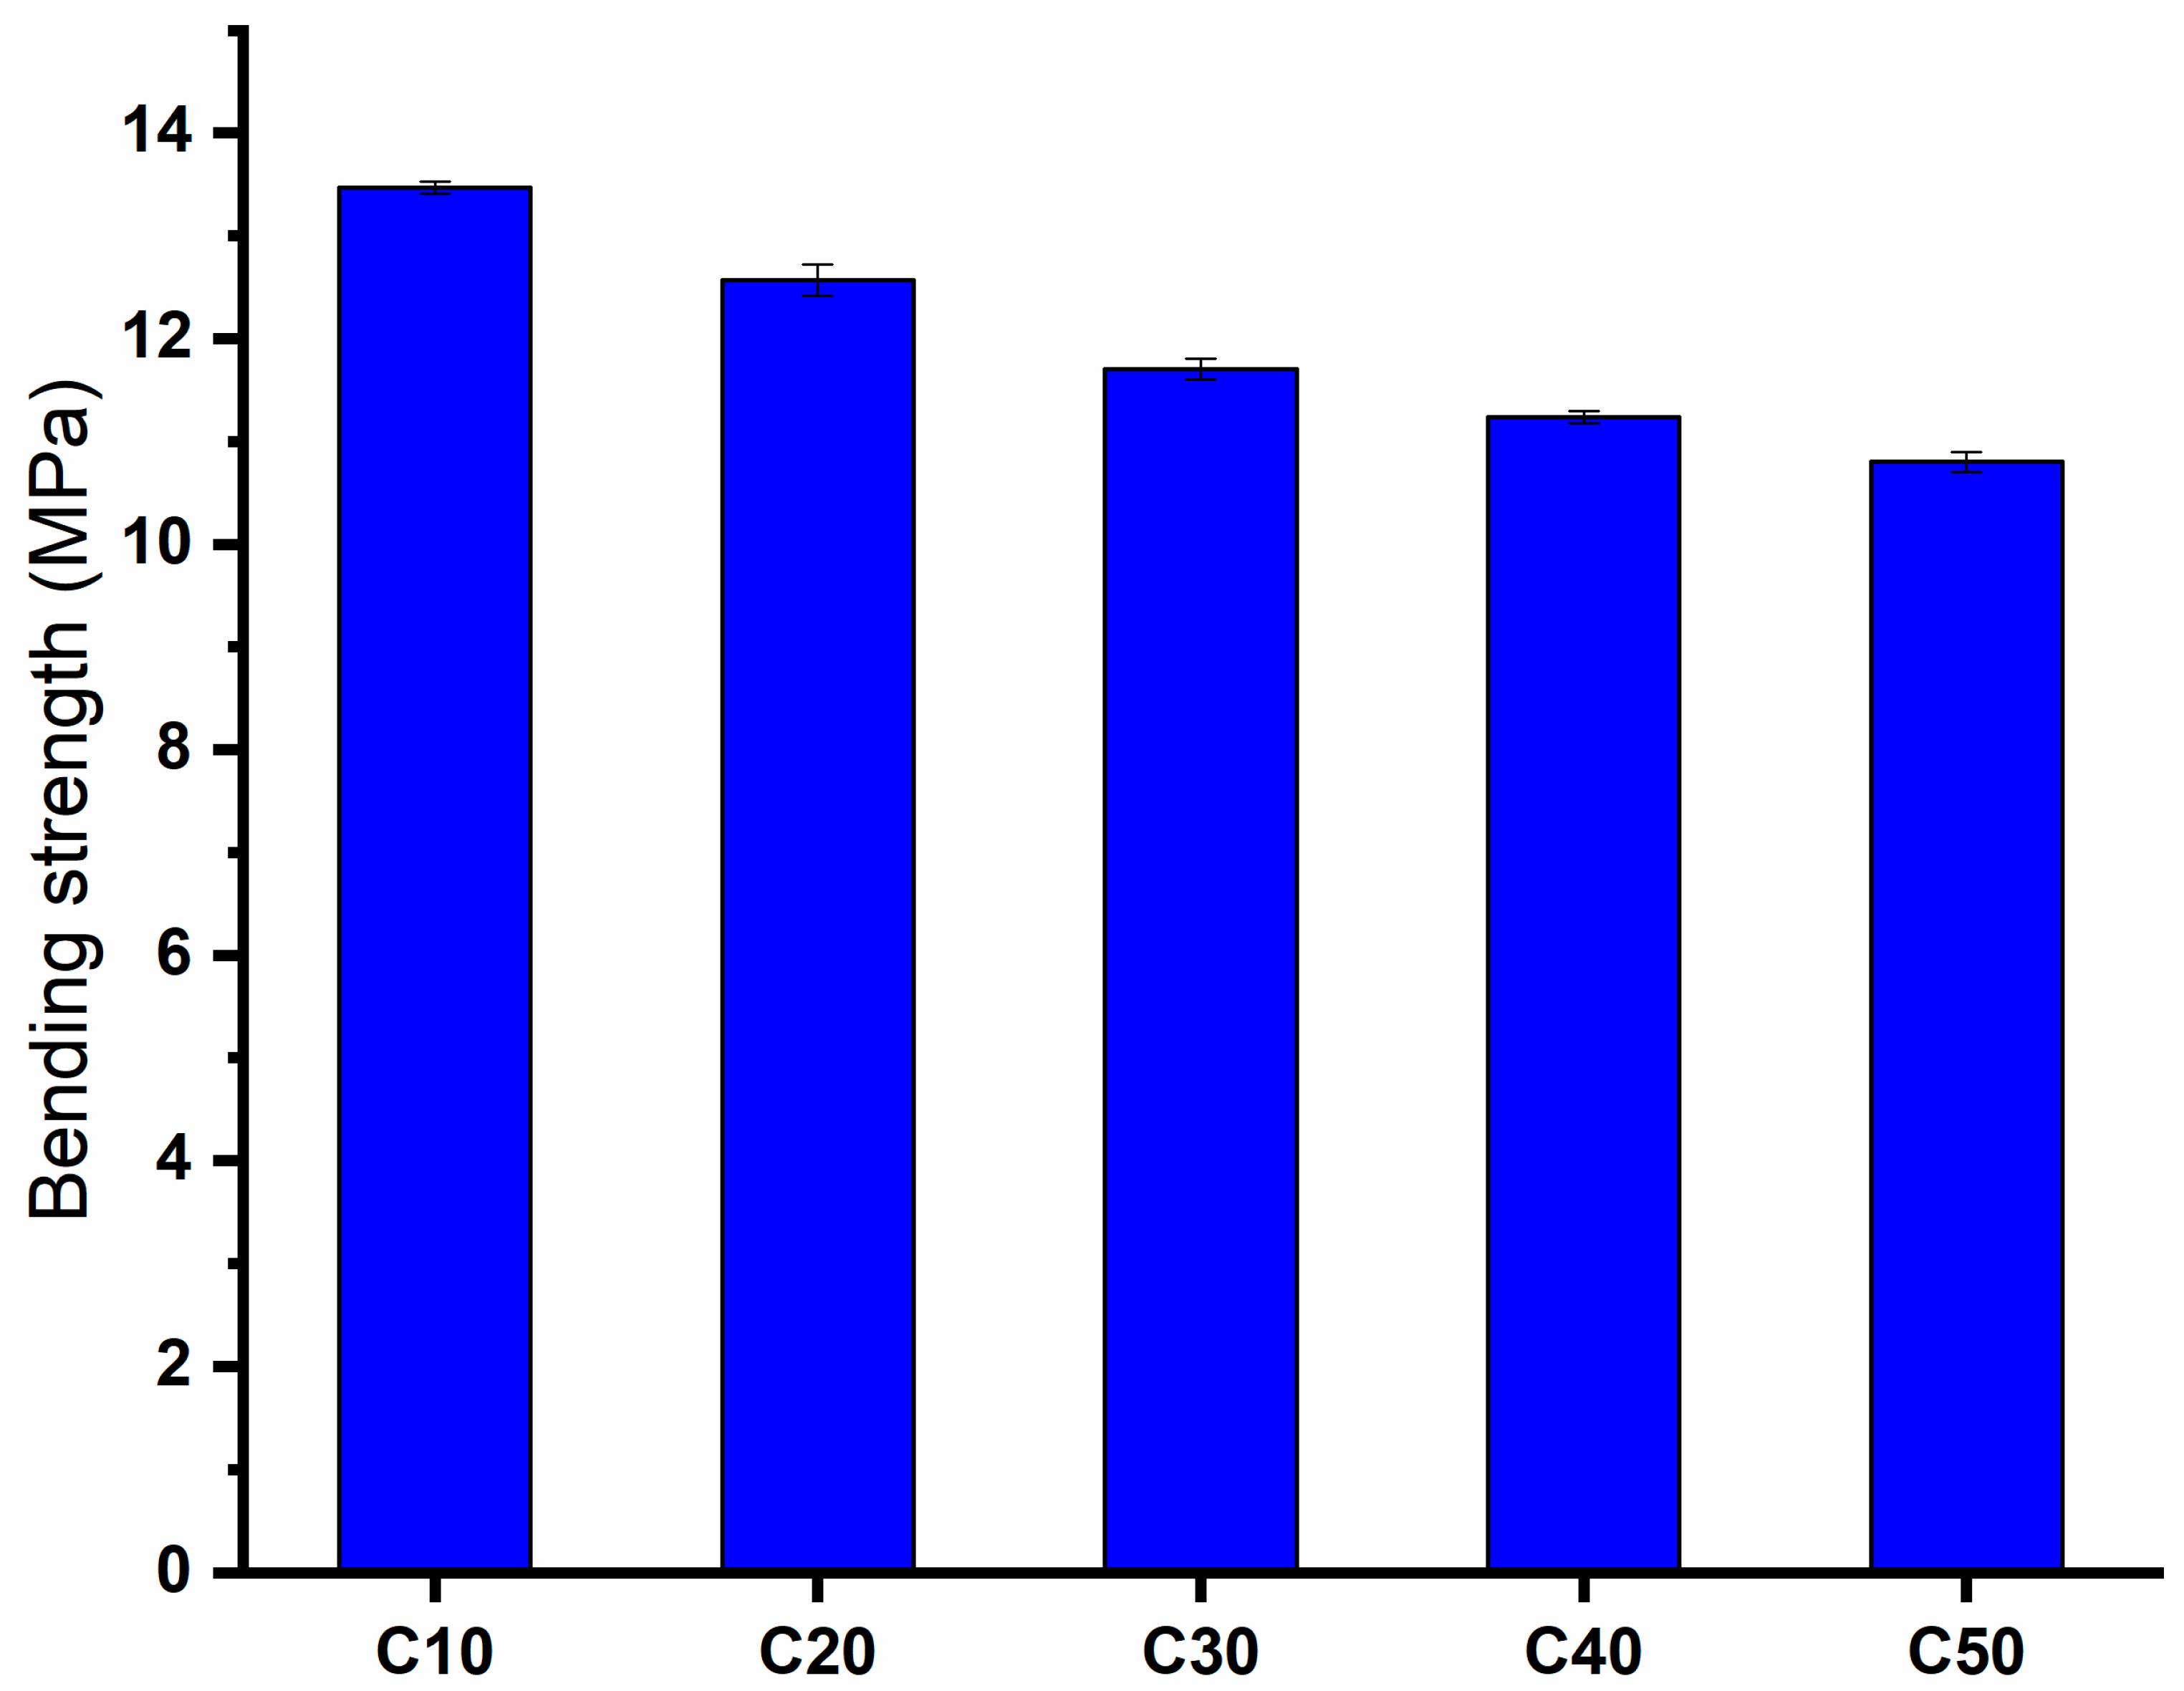
Figure 9 shows the ultimate bending strength (MPa) of the C10, C20, C30, C40, and C50 samples. It can be observed from the figure that the strength of bending slightly decreased as the nominal cordierite content increased, where the strength values were 13.50, 12.60, 11.70, 11.20, and 10.80 for C10, C20, C30, C40, and C50, respectively. A ceramic’s mechanical properties are intensely related to its microstructure, comprising porosity, pore size, density, and the formed crystalline secondary phase. As mentioned before, the ceramic density decreased and the porosity increased with a nominal increase in cordierite percentage (Table 3), from C10 to C50. This increase in pore percent was clearly caused by a reduction in bending strength. Moreover, the formed cordierite secondary phase that increased from C10 to C50 decreased the BS. Cordierite possesses mechanical strength lower than the main crystalline phases, mullite, and corundum [38,42,43].

2.6. Dielectric Properties

Based on established knowledge of capacitance and conductance studies for cordierite–mullite compositions in the frequency range from 10−1 Hz to 106 Hz at room temperature, the frequency dependence of ε′, ε″, σac, and M″ was evaluated. The permittivity complex can be expressed as follows [44]:
ε * ( ω ) = ε ( ω ) i ε ( ω ) = 1 M * = σ * i ω ε o
where i is the imaginary root of −1, and ε′ and ε″ are the real and imaginary components of the complex permittivity. The complex permittivity formula was used to characterize the electrical and dielectric properties. The following formula can be used to determine the dielectric material’s AC electrical conductivity (σac) [27,44]:
σac = εoωε″
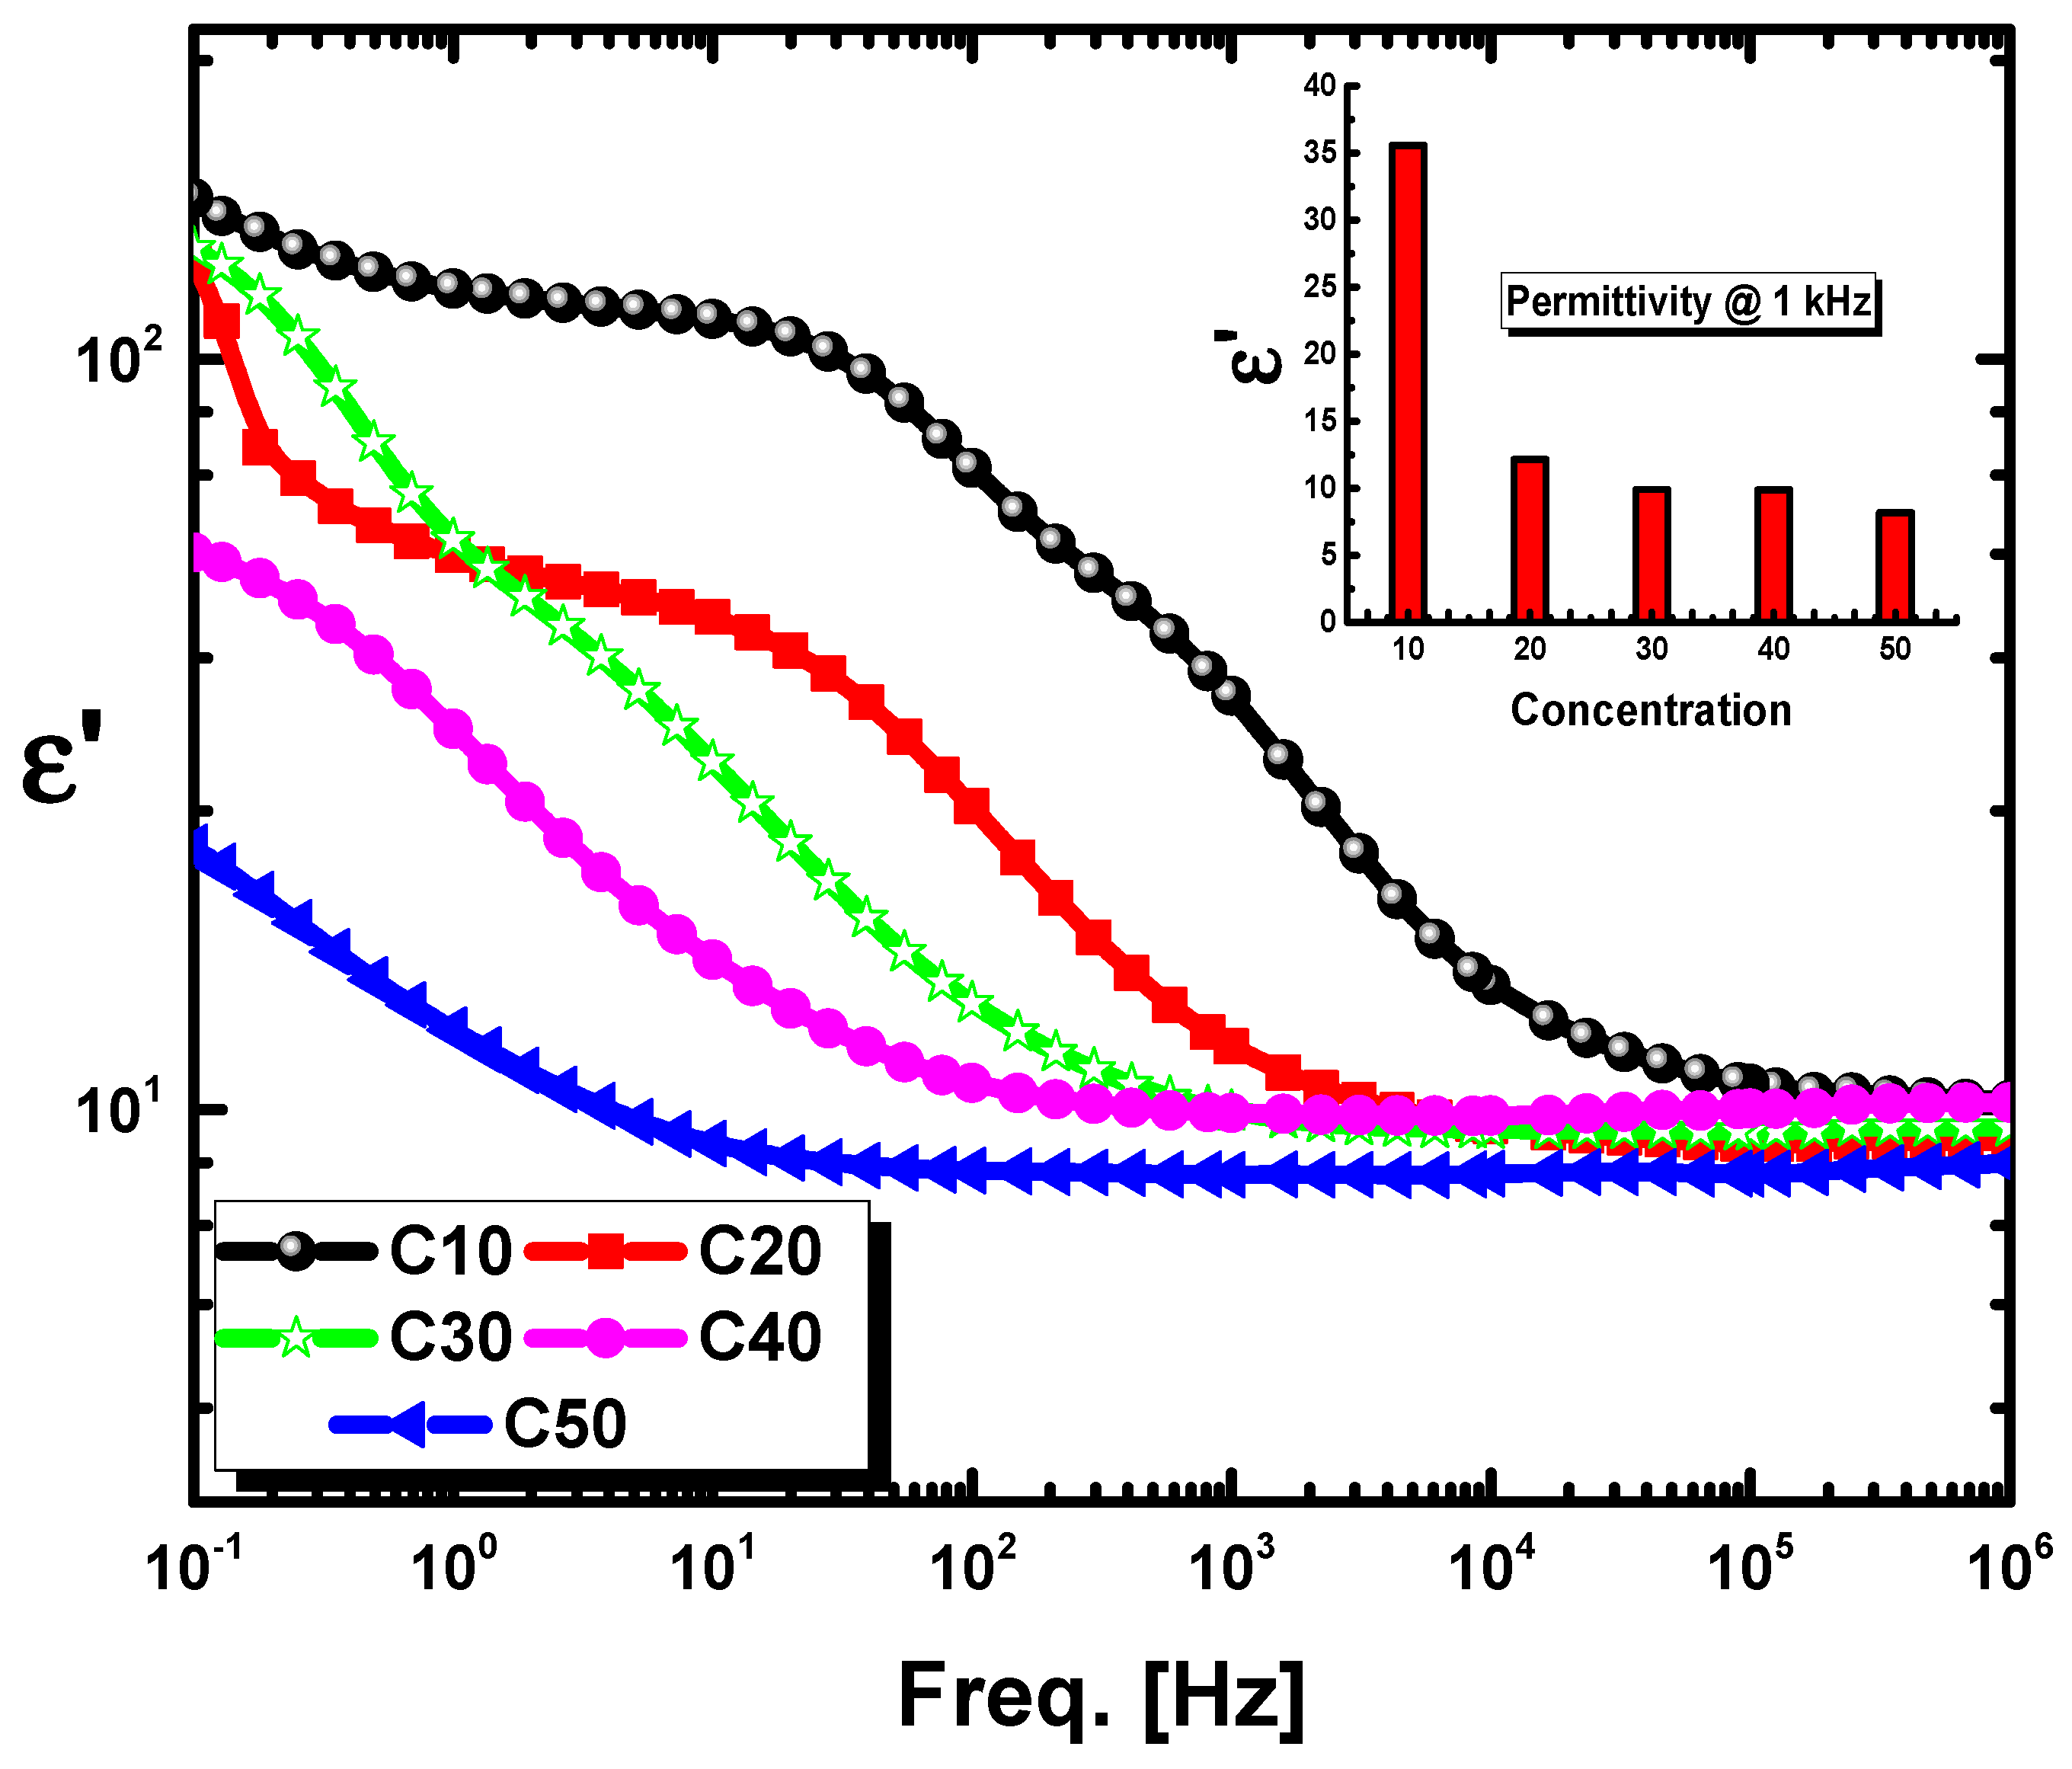
where ε0 = 8.854 × 10⁻¹² V−1 m−1 is the permittivity of free space, ω is the angular frequency, and ε″(ω) is the imaginary part for permittivity. Figure 10 represents the frequency dependence of the cordierite–mullite composition’s permittivity, ε′, at various concentrations. The figure shows a clear dispersion that reduced in intensity and shifted toward lower frequencies as the concentration of cordierite increased. This dispersion step is due to the free space polarization generated at the interfaces from the buildup of free charge carriers in such inhomogeneous structures. This has become a prominent feature in such inhomogeneous structures. On the other hand, the remarkable decrease in polarization decreases the composition’s permittivity as the cordierite concentration increases from 10 to 20%. Further increases in cordierite concentration have no further effect on the permittivity values, reflecting the effect of cordierite in reducing the density of charge carriers.
On the low-frequency side of this figure (<102 Hz), the dielectric constant curve has its highest value for lower concentrations. Here, each polarization has enough time to develop and add its entire amount to the dielectric constant, accompanied by a constancy of ε′ in the lower frequency region, usually called the zero-frequency or static dielectric constant as a result of the absence of charge transport (due to conductivity) and electrode polarization contributions. With increasing frequency, a sharp decrease in ε′ begins with an abrupt decrease in permittivity as some dynamic processes take place, known as the interfacial polarization’s relaxation frequency [27,45,46]. At still higher frequencies, as the frequency becomes too high for the field to appreciably affect the orientation of dipoles, the permittivity ε′ reaches a constant lower value known as the infinite-frequency dielectric constant. In other words, the applied frequency is higher than the polarization’s relaxation frequency because it does not have enough time to be noticeably formed [47,48]. The first anomalous dispersion region, which was caused by interfacial polarizations, is comparable to this third region. In addition, it can be seen in (Figure 11 and Figure 12) that the values of ε′ and ε″ at high frequencies are nearly independent of both concentration and frequency. Furthermore, because the charge at interface states cannot follow an external AC signal [49,50] as the carrier lifetime (τ) is significantly larger than the inverse of angular frequency (1/ω) [46], the values of ε′ approach the values of ε″ at high frequencies.
By increasing the concentrations of cordierite from C10 to C50, which means increasing the concentration of silica and decreasing the alumina concentration for the base composition of the cordierite–mullite system, the permittivity decreases sharply from 35.6 to 8.2.
The electric modulus M″ versus frequency exhibits two peaks at low concentrations; however, there is just one peak at high concentrations, the values of the peaks decreasing with increasing concentrations, as shown in Figure 12.
The first peak, at low frequency, is for charge transportation and the highest one is for interfacial polarization. As mentioned before, these peaks shifted to a lower frequency by decreasing concentration and disappeared from the lower peak due to the absence of electrode polarization and charge transport. The AC conductivity, as shown in (Figure 12), decreases with the decrease in the concentration of cordierite. For all samples, the conductivity is very low as it is around 10−8 s/cm for C10 and 10−11 s/cm for C50, which means that the resistivity is very high for all concentrations in the range between 108 for the C10 sample to 1010 for the C50 sample, as shown in (Table 4) and predicted before in Figure 11 from the reduction in the intensity in the dispersion step and its movements toward lower frequency (slower motion) with increasing cordierite concentration, as this reflects the reduction in the charge carrier concentration and hence the enhancement of the electric resistivity seen, resulting in these materials being perfect insulation materials.

3. Materials and Experimental Techniques

3.1. Materials

The raw materials used in this study were a ceramic roller, ceramic sludge, magnesite, and silica sand. The ceramic rollers and ceramic sludge were supplied by “Ceramica Venezia Company” located on the 6th of October City, Egypt, while magnesite and silica sand were received from Al-Nasr Mining Company (Aswan, egypt). After being pulverized and crushed, the materials were put through a 63-micron sieve. They were weighed and mixed well in a proper ratio.

3.2. Chemical Analysis

Chemical composition analysis was carried out by using XRF. Using six analysis crystals and the X-ray fluorescence equipment PW 2404, XRF analysis was performed on powder samples smaller than 74 μm. Utilizing the software programs SuperQ4 and SemiQ, the concentration of the analyzed elements was calculated with a 99.99% accuracy rate and a 96.7% confidence level.

3.3. Batch Calculation and Preparation

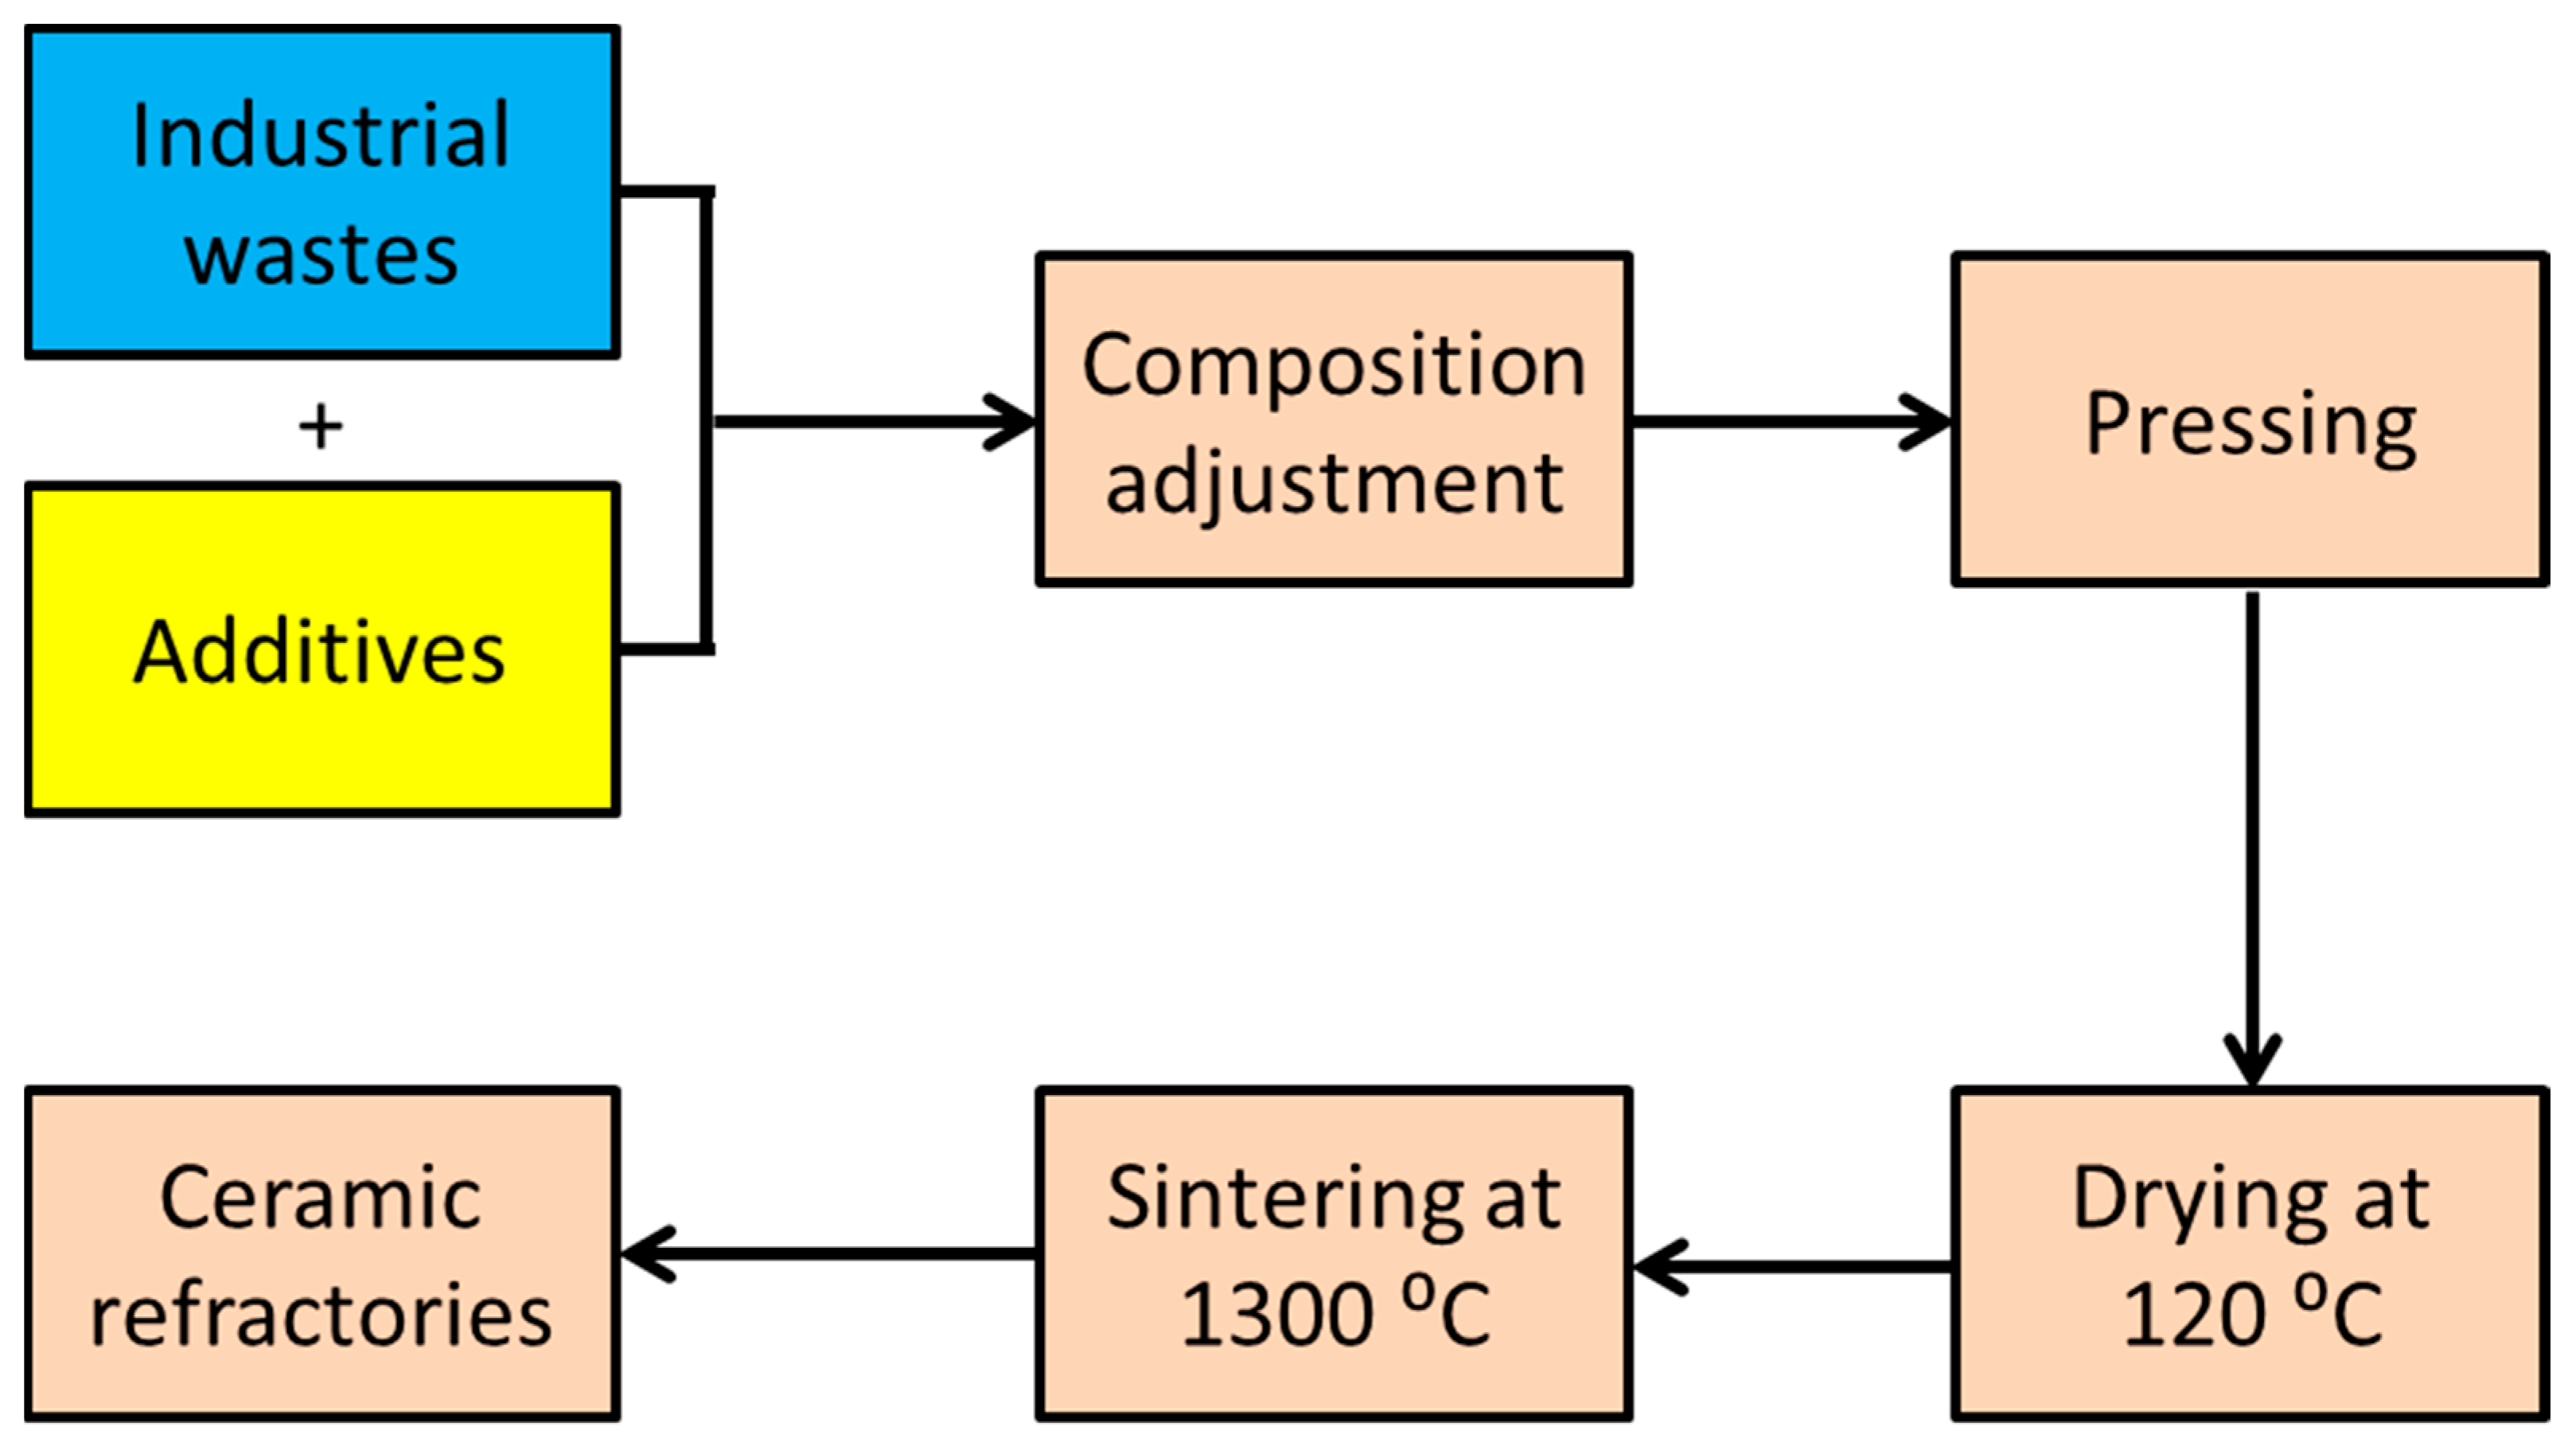
Five batches were designed based on cordierite–mullite phases using the aforementioned waste materials. The designed batches were calculated to produce cordierite and mullite as major phases and other minor phases, as illustrated in Table 1 and Table 5 and Figure 1a–d. Afterward, we calculated the composition of the five samples of ceramic refractories (C10, C20, C30, C40, and C50), with details listed in (Table 5). The proper weight of about 300 g of each waste material was crushed and ground by a ball mill (Ceramic Instrument/Italy) for two hours until homogeneity and then passed through a 63-micron sieve. Then, the powdered raw materials were thoroughly mixed. A binder of approximately 5% water was added to each 5 g of every sample, and the mixture was compressed via a 40 MPa uniaxial load using differently shaped molds (the size of each disc sample was 2.5 cm × 2.5 cm × 10 mL and the rod sample size was 1 cm × 2 cm × 6 cm), and five samples for each composition were prepared. Following 20 h of drying at about 120 °C in an oven furnace, the produced samples were sintered for two hours at 1300 °C at a heating rate of 10 °C/min. The sample C30 was selected to examine the effect of sintering temperature on its properties and formed phases. It was treated at 1200 °C and 1300 °C for two hours (as shown in Figure 13).

3.4. Densification Properties

Using the liquid displacement method, the physical characteristics of the batches heated at 1200 °C and 1300 °C were ascertained in terms of bulk density, apparent porosity, and water absorption. Each sample was measured in triplicate (n = 3).

3.4.1. Bulk Density (BD) and Apparent Porosity (AP)

Using distilled water as a liquid medium, the Archimedes principle was used to calculate bulk density and apparent porosity using the following formulas:
Bulk density (BD) = [w1/(w2 − w3)] × ρliquid
Apparent porosity (AP) = AP = [(w2 − w1)/(w2 − w3)] × 100

3.4.2. Water Absorption (WA, %)

Water absorption of the specimens was calculated using the following equation:
A = M u M s M s × 100
where Mu: sample mass after immersion in water for 24 h (g) and Ms: sample mass before water immersion (g).

3.5. X-ray Diffraction (XRD)

Bruker D8 Discover Cu target wavelength 1.54 A, 40 Kv, and 40 mA (Germany) XRD technology was used in this study.

3.6. Scanning Electron Microscope (SEM)

In this study, we employed a scanning electron microscope (SEM) to identify minerals and examine microstructures. The microstructure of the samples under investigation was examined using a scanning electron microscope equipped with an EDX unit (Energy Dispersive X-ray Analyses) and SEM Model Quanta 250 FEG (Field Emission Gun), FEI Company, Eindhoven, The Netherlands. The microscope had an accelerating voltage of 30 K.V. and a magnification range of 14× to 1,000,000×.

3.7. Bending Strength

The prepared refractory samples were tested with a universal testing machine (model Tinius Olsen 10ST) with a span of 30 mm and a loading speed of 0.5 mm/min. The ultimate bending strength of the samples was determined using the three-point bending method with dimensions of height × width × length = 10 mm × 12 mm × 50 mm. Each sample was measured in triplicate (n = 3).

3.8. Electrical Properties and Electrical Conductivity

Dielectric spectroscopy is an essential instrument for examining the electrical and dielectric properties of prepared samples. Thus, the dielectric parameters such as AC conductivity (σac), permittivity (ε′), dielectric loss (ε″), and the electric loss modulus (M″), were measured
A Novocontrol high-resolution alpha analyzer (Concept 40) was used to examine the investigated samples’ electrical conductivity and dielectric characteristics in the frequency range of 0.1 Hz to 20 MHz. The applied voltages were chosen in the linear regime and in the order of 0.1 V. The current measurements were carried out at room temperature with accuracy better than 99%. The film was pressed between two circular metallic plates of 20 mm diameter for the upper electrode and 40 mm for the lower one. The samples were prepared using a parallel plate capacitor design of two gold-plated stainless-steel electrodes. More information about the setup can be found elsewhere [33,34,35].

4. Conclusions

  • Solid waste in the form of ceramic rollers, ceramic sludge, and magnesite can be used to manufacture heat-resistant ceramics at 1300 °C.
  • The main precipitated phases are mullite, corundum, and spinel.
  • Bending strength increases with increasing mullite concentration, bulk density, and refined grain microstructures
  • By increasing the concentration of cordierite, the density decreases and the porosity and water absorption increase.
  • Bulk density increases with increasing sintering temperature, whereas water absorption and porosity decrease due to liquid phase formation.
  • With the increase in cordierite concentration, the microstructures vary from fine grained to coarse grained.
  • Mullite led to decomposition, inhibited the formation of cordierite, and enhanced spinel formation.
  • The increase in cordierite content from C10 to C50 significantly lowered the dielectric properties of the compositions, as the maximum values of permittivity, AC conductivity, and resistivity for the C10 sample were found to be 35.6, 10−8 s/cm, and 108 cm/s, respectively, at room temperature with the lowest values for the C50 sample as its dielectric constant of about 8.2, conductivity of around 3 × 10⁻¹¹ s/cm, and resistivity of 3 × 1010 cm/s. These values suggest the potential of these compositions as perfect insulation materials.
  • We successfully achieved the production of refractory ceramics from industrial waste. Therefore, the application areas for which the product is suitable are furnace lining and refractory bricks
  • Based on the physical, mechanical, electrical, crystalline, and economic properties, it appears that the best sample that can be used for industrial purposes is C10, and its chemical composition is SiO2 = 30.48%, Al2O3 = 68.14%, and MgO = 1.38

Author Contributions

G.A.K.: conceptualization, writing—review and editing, supervision, and funding acquisition; M.R.: methodology, writing—review and editing, and supervision; A.L.-D.: investigation and validation; I.P.: software and visualization; A.A.E.-K.: formal analysis and investigation; M.M.F.: methodology and investigation; M.S.E.: resources and data curation; H.S.: methodology and writing—original draft; N.H.S.N.: writing—review and editing. All authors have read and agreed to the published version of the manuscript.

Funding

This research was funded by the Science and Technology Development Fund Authority (STDF) grant number 45862, and The APC was funded by the same funder.

Institutional Review Board Statement

Not applicable.

Informed Consent Statement

Not applicable.

Data Availability Statement

There are no supported data.

Acknowledgments

The authors thank the National Research Centre and Eduardo Torroja Institute for Construction Sciences for the possibility to use their equipment and facilities.

Conflicts of Interest

The authors declare that they have no conflict of interest.

References

  1. Choudhary, J.; Kumar, B.; Gupta, A. Utilization of solid waste materials as alternative fillers in asphalt mixes: A review. Constr. Build. Mater. 2020, 234, 117271. [Google Scholar] [CrossRef]
  2. Brunner, P.H.; Rechberger, H. Waste to energy–key element for sustainable waste management. Waste Manag. 2015, 37, 3–12. [Google Scholar] [CrossRef] [PubMed]
  3. Juan, A.; Medina, C.; Guerra, M.I.; Morán, J.M.; Aguado, P.J.; Sánchez de Rojas, M.I.; Frías, M.; Rodríguez, O. Re-use of ceramic wastes in construction. In Ceramic Materials; IntechOpen, 2010; pp. 197–214. Available online: https://www.researchgate.net/profile/Olga-Largo/publication/221909437_Re-Use_of_Ceramic_Wastes_in_Construction/links/54102e480cf2f2b29a3f066c/Re-Use-of-Ceramic-Wastes-in-Construction.pdf (accessed on 3 August 2024).
  4. Juan, A.; Medina, C.; Morán, J.; Aguado, P.; Guerra, M. Re-use of industrial and construction and demolition wastes for the elaboration of recycled eco-efficient concretes. In Proceedings of the International Conference on Agricultural Engineering—AgEng 2010: Towards Environmental Technologies, Clermont-Ferrand, France, 6–8 September 2010. [Google Scholar]
  5. Koyuncu, H.; Guney, Y.; Yılmaz, G.; Koyuncu, S.; Bakis, R. Utilization of ceramic wastes in the construction sector. Key Eng. Mater. 2004, 264, 2509–2512. [Google Scholar] [CrossRef]
  6. Daigo, I.; Kiyohara, S.; Okada, T.; Okamoto, D.; Goto, Y. Element-based optimization of waste ceramic materials and glasses recycling. Resour. Conserv. Recycl. 2018, 133, 375–384. [Google Scholar] [CrossRef]
  7. Nepomuceno, M.C.; Isidoro, R.A.; Catarino, J.P. Mechanical performance evaluation of concrete made with recycled ceramic coarse aggregates from industrial brick waste. Constr. Build. Mater. 2018, 165, 284–294. [Google Scholar] [CrossRef]
  8. Abadou, Y.; Mitiche-Kettab, R.; Ghrieb, A. Ceramic waste influence on dune sand mortar performance. Constr. Build. Mater. 2016, 125, 703–713. [Google Scholar] [CrossRef]
  9. Zhang, G.-Y.; Bae, S.-C.; Lin, R.-S.; Wang, X.-Y. Effect of waste ceramic powder on the properties of alkali–activated slag and fly ash pastes exposed to high temperature. Polymers 2021, 13, 3797. [Google Scholar] [CrossRef]
  10. Meena, R.V.; Jain, J.K.; Chouhan, H.S.; Beniwal, A.S. Use of waste ceramics to produce sustainable concrete: A review. Clean. Mater. 2022, 4, 100085. [Google Scholar] [CrossRef]
  11. Coletti, C.; Maritan, L.; Cultrone, G.; Mazzoli, C. Use of industrial ceramic sludge in brick production: Effect on aesthetic quality and physical properties. Constr. Build. Mater. 2016, 124, 219–227. [Google Scholar] [CrossRef]
  12. Nandi, V.; Raupp-Pereira, F.; Montedo, O.; Oliveira, A. The use of ceramic sludge and recycled glass to obtain engobes for manufacturing ceramic tiles. J. Clean. Prod. 2015, 86, 461–470. [Google Scholar] [CrossRef]
  13. Khater, G.; Nabawy, B.S.; El-Kheshen, A.A.; Abdel-Baki, M.; Farag, M.; Abd Elsatar, A. Preparation and characterization of low-cost wollastonite and gehlenite ceramics based on industrial wastes. Constr. Build. Mater. 2021, 310, 125214. [Google Scholar] [CrossRef]
  14. Khater, G.A.; Nabawy, B.S.; El-Kheshen, A.A.; Abdel Latif, M.A.-B.; Farag, M.M. Use of arc furnace slag and ceramic sludge for the production of lightweight and highly porous ceramic materials. Materials 2022, 15, 1112. [Google Scholar] [CrossRef] [PubMed]
  15. Khater, G.; Nabawy, B.S.; El-Kheshen, A.A.; Abdel-Baki, M.; Farag, M. Utilizing of solid waste materials for producing porous and lightweight ceramics. Mater. Chem. Phys. 2022, 280, 125784. [Google Scholar] [CrossRef]
  16. Roushdy, M.H. Recycling of the Mixture Resulted from Roller Kiln Waste and Ceramic Tiles Sludge Waste in the Manufacturing of Ceramic Floor Tiles. Int. J. Innov. Technol. Explor. Eng. 2019, 8, 1132–1138. [Google Scholar] [CrossRef]
  17. Mark. A International Company Catalogue; Mark: Gujarat, India, 2009. [Google Scholar]
  18. Quah, S.R. International Encyclopedia of Public Health; Academic Press: Cambridge, MA, USA, 2016. [Google Scholar]
  19. Mehta, A.J.; Miedinger, D.; Keidel, D.; Bettschart, R.; Bircher, A.; Bridevaux, P.O.; Curjuric, I.; Kromhout, H.; Rochat, T.; Rothe, T.; et al. Occupational exposure to dusts, gases, and fumes and incidence of chronic obstructive pulmonary disease in the Swiss Cohort Study on Air Pollution and Lung and Heart Diseases in Adults. Am. J. Respir. Crit. Care Med. 2012, 185, 1292–1300. [Google Scholar] [CrossRef]
  20. Oytac, Z.E.; Tarhan, M.; Yay, B. Investigation of the effects of kiln roller waste addition on porcelain tile matte-opaque glazes. J. Therm. Anal. Calorim. 2024, 149, 2137–2146. [Google Scholar] [CrossRef]
  21. Yan, W.; Chen, J.; Li, N.; Han, B.; Wei, Y. Lightweight cordierite–mullite refractories with low coefficients of thermal conductivity and high mechanical properties. Bull. Mater. Sci. 2015, 38, 409–415. [Google Scholar] [CrossRef]
  22. Chotard, T.; Soro, J.; Lemercier, H.; Huger, M.; Gault, C. High temperature characterisation of cordierite–mullite refractory by ultrasonic means. J. Eur. Ceram. Soc. 2008, 28, 2129–2135. [Google Scholar] [CrossRef]
  23. Chlup, Z.; Dlouhý, I.; Boccaccini, A.R.; Boccaccini, D.N.; Leonelli, C.; Romagnoli, M. Thermal shock resistance of cordierite-mullite refractory composites. Key Eng. Mater. 2005, 290, 260–263. [Google Scholar] [CrossRef]
  24. Boccaccini, D.N.; Leonelli, C.; Rivasi, M.R.; Romagnoli, M.; Boccaccini, A. Microstructural investigations in cordierite–mullite refractories. Ceram. Int. 2005, 31, 417–432. [Google Scholar] [CrossRef]
  25. Sittiakkaranon, S.; Phonphuak, N. Microstructural and Physical Characterization of Cordierite-Mullite Ceramics Refractories. GEOMATE J. 2023, 25, 233–240. [Google Scholar] [CrossRef]
  26. de Brito, I.P.; de Almeida, E.P.; de Araújo Neves, G.; de Lucena Lira, H.; Menezes, R.R.; da Silva, V.J.; de Lima Santana, L.N. Development of cordierite/mullite composites using industrial wastes. Int. J. Appl. Ceram. Technol. 2021, 18, 253–261. [Google Scholar] [CrossRef]
  27. Ganesh, I. Fabrication of magnesium aluminate (MgAl2O4) spinel foams. Ceram. Int. 2011, 37, 2237–2245. [Google Scholar] [CrossRef]
  28. Ren, X.; Ma, B.; Fu, G.; Qian, F.; Liu, G.; Yu, J.; Li, Y. Facile synthesis of MgO–Mg2SiO4 composite ceramics with high strength and low thermal conductivity. Ceram. Int. 2021, 47, 19959–19969. [Google Scholar] [CrossRef]
  29. Marimuthu, S.; Malathi, A.C.; Raghavan, V.; Grace, A.N. Fundamentals of electronic ceramics. In Advanced Ceramics for Energy Storage, Thermoelectrics and Photonics; Elsevier: Amsterdam, The Netherlands, 2023. [Google Scholar]
  30. Marikkannan, S.K.; Ayyasamy, E.P. Synthesis, characterisation and sintering behaviour influencing the mechanical, thermal and physical properties of cordierite-doped TiO2. J. Mater. Res. Technol. 2013, 2, 269–275. [Google Scholar] [CrossRef]
  31. Khalil, N.M.; Algamal, Y. Recycling of Ceramic Wastes for the Production of High Performance Mullite Refractories. Silicon 2020, 12, 1557–1565. [Google Scholar] [CrossRef]
  32. Silva, V.J.; Taveira, S.K.; Silva, K.R.; Neves, G.A.; Lira, H.L.; Santana, L.N. Refractory Ceramics of Clay and Alumina Waste. Mater. Res. 2021, 24, e20200485. [Google Scholar] [CrossRef]
  33. Abomostafa, H.; Mansour, D.-E.A.; Mahani, R.; Nasralla, N. Investigation of structure, thermal and dielectric study of Dy0.05Ba0.7Sr0.25TiO3/polystyrene nanocomposites. Phys. Scr. 2023, 98, 085919. [Google Scholar] [CrossRef]
  34. Kremer, F.; Schönhals, A. Broadband Dielectric Spectroscopy; Springer Science & Business Media: Berlin/Heidelberg, Germany, 2002. [Google Scholar]
  35. Tohamy, H.-A.S.; Elnasharty, M.M.; Abdel-Aziz, M.S.; El-Sakhawy, M.; Turky, G.; Kamel, S. Antibacterial activity and dielectric properties of the PVA/cellulose nanocrystal composite using the synergistic effect of rGO@ CuNPs. Int. J. Biol. Macromol. 2024, 261, 129801. [Google Scholar] [CrossRef]
  36. Harper, C.A. Handbook of Ceramics, Glasses and Diamonds; McGraw-Hill Companies: New York, NY, USA, 2001. [Google Scholar]
  37. Mouiya, M.; Bouazizi, A.; Abourriche, A.; El Khessaimi, Y.; Benhammou, A.; Taha, Y.; Oumam, M.; Abouliatim, Y.; Smith, A.; Hannache, H. Effect of sintering temperature on the microstructure and mechanical behavior of porous ceramics made from clay and banana peel powder. Results Mater. 2019, 4, 100028. [Google Scholar] [CrossRef]
  38. Sembiring, S.; Simanjuntak, W.; Situmeang, R.; Riyanto, A.; Karo-Karo, P. Effect of alumina addition on the phase transformation and crystallisation properties of refractory cordierite prepared from amorphous rice husk silica. J. Asian Ceram. Soc. 2017, 5, 186–192. [Google Scholar] [CrossRef]
  39. Cao, Z.; Li, P. In-Situ Crystallization Process of Ferrochrome Slag for Preparing Cordierite Material Using Quartz as Nucleating Agent. Available online: https://ssrn.com/abstract=4272274 (accessed on 3 August 2024). [CrossRef]
  40. Wang, S.; Yan, W.; Yan, J.; Schafföner, S.; Chen, Z.; Sang, S. Microstructures and properties of microporous mullite-corundum aggregates for lightweight refractories. Int. J. Appl. Ceram. Technol. 2022, 19, 3300–3310. [Google Scholar] [CrossRef]
  41. Manullang, R.J.; Purnawan, M.; Taufik, D.; Noordiningsih, K. The effect of pore former addition and sintering temperature on the characteristic of ceramic membrane. In AIP Conference Proceedings; AIP Publishing: Melville, NY, USA, 2022. [Google Scholar]
  42. Osendi, M.; Baudin, C. Mechanical properties of mullite materials. J. Eur. Ceram. Soc. 1996, 16, 217–224. [Google Scholar] [CrossRef]
  43. Idbenjadi, F.E.; Benhammou, A.; Abourriche, A.; Abouliatim, Y. Effect of sintering temperature on the thermal and mechanical properties of cordierite-based refractory. Mater. Today Proc. 2024. [Google Scholar] [CrossRef]
  44. Atef, N.; El Damrawi, G.; Hassan, A.; El-Deen, L.S. Dielectric Studies on CuO-Na2OB2O3 Glasses. New J. Glass Ceram. 2020, 10, 45. [Google Scholar] [CrossRef]
  45. Chaturvedi, A.K.; Pappu, A.; Gupta, M.K. Unraveling the role of agro waste-derived graphene quantum dots on dielectric and mechanical property of the fly ash based polymer nanocomposite. J. Alloys Compd. 2022, 903, 163953. [Google Scholar] [CrossRef]
  46. Chaturvedi, A.K.; Pappu, A.; Srivastava, A.K.; Gupta, M.K. Synthesis dielectric and mechanical properties of paddy straw derived graphene quantum dots-stone waste nanocomposite. Mater. Lett. 2021, 301, 130323. [Google Scholar] [CrossRef]
  47. Abouhaswa, A.; Rammah, Y.; Turky, G.M. Characterization of zinc lead-borate glasses doped with Fe3+ ions: Optical, dielectric, and ac-conductivity investigations. J. Mater. Sci. Mater. Electron. 2020, 31, 17044–17054. [Google Scholar] [CrossRef]
  48. Rehim, M.H.A.; Badawy, A.A.; Turky, G. Electrical properties and heavy ions removal ability of graphitic carbon nitride/polypyrrole composite. J. Phys. Chem. Solids 2022, 167, 110741. [Google Scholar] [CrossRef]
  49. Şahingöz, R.; Kanbur, H.; Voigt, M.; Soykan, C. The determination of interface states and series resistance profile of Al/polymer/PEDOT-PSS/ITO heterojunction diode by I–V and C–V methods. Synth. Met. 2008, 158, 727–731. [Google Scholar] [CrossRef]
  50. Yıldız, D.E.; Dökme, İ. Frequency and gate voltage effects on the dielectric properties and electrical conductivity of Al/SiO2/p-Si metal-insulator-semiconductor Schottky diodes. J. Appl. Phys. 2011, 110, 014507. [Google Scholar] [CrossRef] [PubMed]
Figure 1. (a) XRD pattern of the ceramic roller; (b) XRD pattern of the ceramic sludge; (c) XRD pattern of the magnesite; (d) XRD pattern of the silica sand.
Recycling 09 00098 g001aRecycling 09 00098 g001b
Figure 2. Visual observation of the investigated samples after sintering at 1300 °C for 2 h.
Recycling 09 00098 g002
Figure 3. Density, apparent porosity %, and water absorption % of C10, C20, C30, C40, and C50 samples sintered at 1200 °C for 2 h.
Recycling 09 00098 g003
Figure 4. Density, apparent porosity %, and water absorption % of C10, C20, C30, C40, and C50 samples sintered at 1300 °C for 2 h.
Recycling 09 00098 g004
Figure 5. X-ray diffraction of the investigated samples after firing at 1300 °C for 2 h.
Recycling 09 00098 g005
Figure 6. X-ray diffraction of sample C30 after firing at different temperatures. A = fired at 1200 °C/2 h; B = fired 1300 °C/2 h.
Recycling 09 00098 g006
Figure 7. SEM photos (left and middle) and EDX analysis (right) of C10, C20, C30, C40, and C50 ((ae), respectively fired at 1300 °C for 2 h.
Recycling 09 00098 g007
Figure 8. SEM photos (left and middle) and EDX analysis (right) of C30 fired at 1200 °C (a) and 1300 °C (b) for 2 h.
Recycling 09 00098 g008
Figure 9. Bending strength of C10, C20, C30, C40, and C50 samples fired at 1300 °C for 2 h.
Recycling 09 00098 g009
Figure 10. The frequency dependence of permittivity, ε′, of C10–C50, and the inset is for the investigated samples independent of ε′ at the representative frequency f = 1 kHz for the different compositions.
Recycling 09 00098 g010
Figure 11. The frequency dependence of dielectric loss (ε″) and Modulus″ of C10–C50 as represented by (a) and (b), respectively.
Recycling 09 00098 g011
Figure 12. The frequency dependence of conductivity (σac) of C10–C50, and the inset is the ceramic independent of resistivity at representative frequency f = 1 kHz for the different compositions.
Recycling 09 00098 g012
Figure 13. Schematic presentation for the production of ceramic refractories from industrial waste.
Recycling 09 00098 g013
Table 1. Chemical composition (XRF, expressed as wt.% oxide) and loss of ignition (LOI) (%) of the ceramic roller, ceramic sludge, magnesite, and silica sand.
Main Constituents (wt%)Ceramic RollerCeramic SludgeMagnesiteSilica Sand
SiO228.1977.322.8598.35
Al2O3607.61.941.24
Fe2O30.760.351.280.26
TiO20.520.52--
MgO0.31.0336.92-
CaO0.37.238.56-
ZrO26.95---
BaO-0.296--
P2O50.120.28--
Na2O0.692.6--
K2O0.531.13--
L.O.I.--48.14-
Table 2. Densification parameters of the investigated samples fired at 1200 °C for 2 h.
Batch SymbolDensification Parameters
Bulk Density
gm/cm3
Apparent Porosity
%
Water Absorption
C101.9929.412.69
C201.9834.3812.95
C301.9736.4013.36
C401.9637.2614.28
C501.9438.8314.96
Table 3. Densification parameters of the investigated samples fired at 1300 °C for 2 h.
Batch SymbolDensification Parameters
Bulk Density
gm/cm3
Apparent Porosity
%
Water Absorption
C102.3229.5413.12
C202.2834.8213.94
C302.1936.9314.21
C402.1537.4514.87
C501.9839.6715.02
Table 4. AC-conductivity and resistivity of the investigated samples as determined at representative spot frequency point f = 1 KHz for the different compositions, C10–C50.
Batch SymbolConductivity (σac)Resistivity (ρ)
C101.19 × 10−88.38 × 10⁷
C202.79 × 10−93.59 × 10⁸
C308.55 × 10−101.17 × 10⁹
C402.03 × 10−104.91 × 10⁹
C503.10 × 10−113.23 × 10¹⁰
Table 5. Designation of the different mixtures studied, as well as the percentage of raw materials and the content of silicon, aluminum, and magnesium oxides in each mixture.
Batch No.Nominal PhaseBatch Composition%Batch Constituents%
CordieriteMulliteSiO2Al2O3MgOCeramic RollerMagnesiteSludgeSilica Sand
C10109030.4868.141.3896.813.19--
C20208032.8164.432.7690.236.302.610.86
C30307035.1360.744.1382.519.156.751.59
C40406037.1357.035.5175.4711.8910.711.93
C50505039.7653.356.8968.6314.5014.402.47
Disclaimer/Publisher’s Note: The statements, opinions and data contained in all publications are solely those of the individual author(s) and contributor(s) and not of MDPI and/or the editor(s). MDPI and/or the editor(s) disclaim responsibility for any injury to people or property resulting from any ideas, methods, instructions or products referred to in the content.