
Sustainable Resource Management: The End of Nickel Mining?

 ,
,  ,
, 
Abstract
1. Introduction
1.1. Background
1.2. Previous Studies
1.3. Scope and Objectives
- Will nickel mining and recycling be sufficient to meet the nickel demand by 2100?
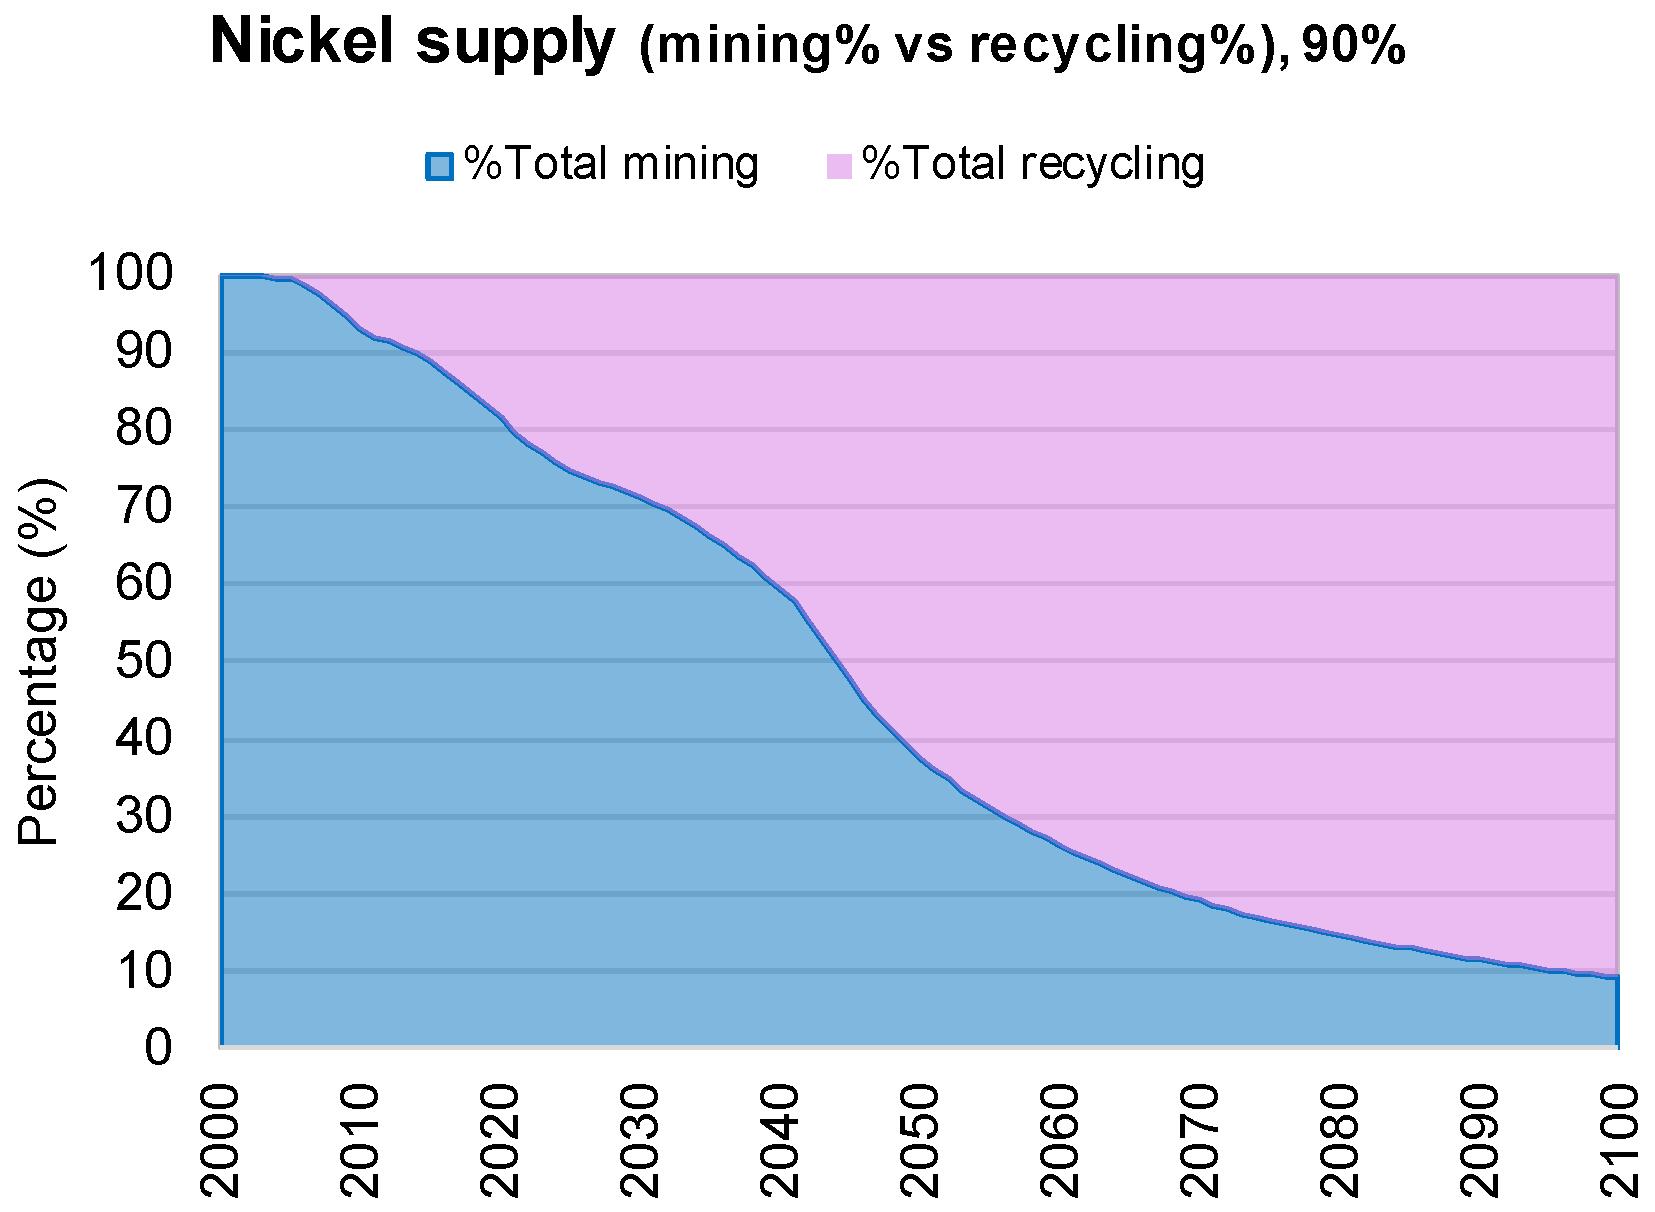
- At what date will nickel recycling make up 90% of the total supply (where primary nickel mining will be responsible for the remaining 10%)? (The choice of a 90% recycling and 10% primary nickel mining split is based on practical considerations of material flows and industry needs. Even in scenarios of zero or negative growth in nickel demand, 100% reliance on recycling is unrealistic due to inevitable losses in material quality, efficiency, and availability during the recycling process. Additionally, certain high-purity applications may continue to require primary nickel, which is more readily tailored to specific industrial needs. The 10% allowance for primary nickel ensures that these needs can be met while reflecting a significant shift towards a circular economy. This target is ambitious yet feasible, acknowledging both the limitations of current recycling technologies and the ongoing necessity of some primary nickel production).
2. Scenarios
2.1. Base Case Scenario (“STEPS”)
- For the STEPS scenario, the forecast nickel demand in 2040 will be 4052 kt [31].
2.2. Medium Change Case Scenario (“SDS”)
- For the SDS scenario, the forecast nickel demand in 2040 will be 6265 kt [31].
2.3. Rapid Change Case Scenario (“1.5 °C”)
3. Method
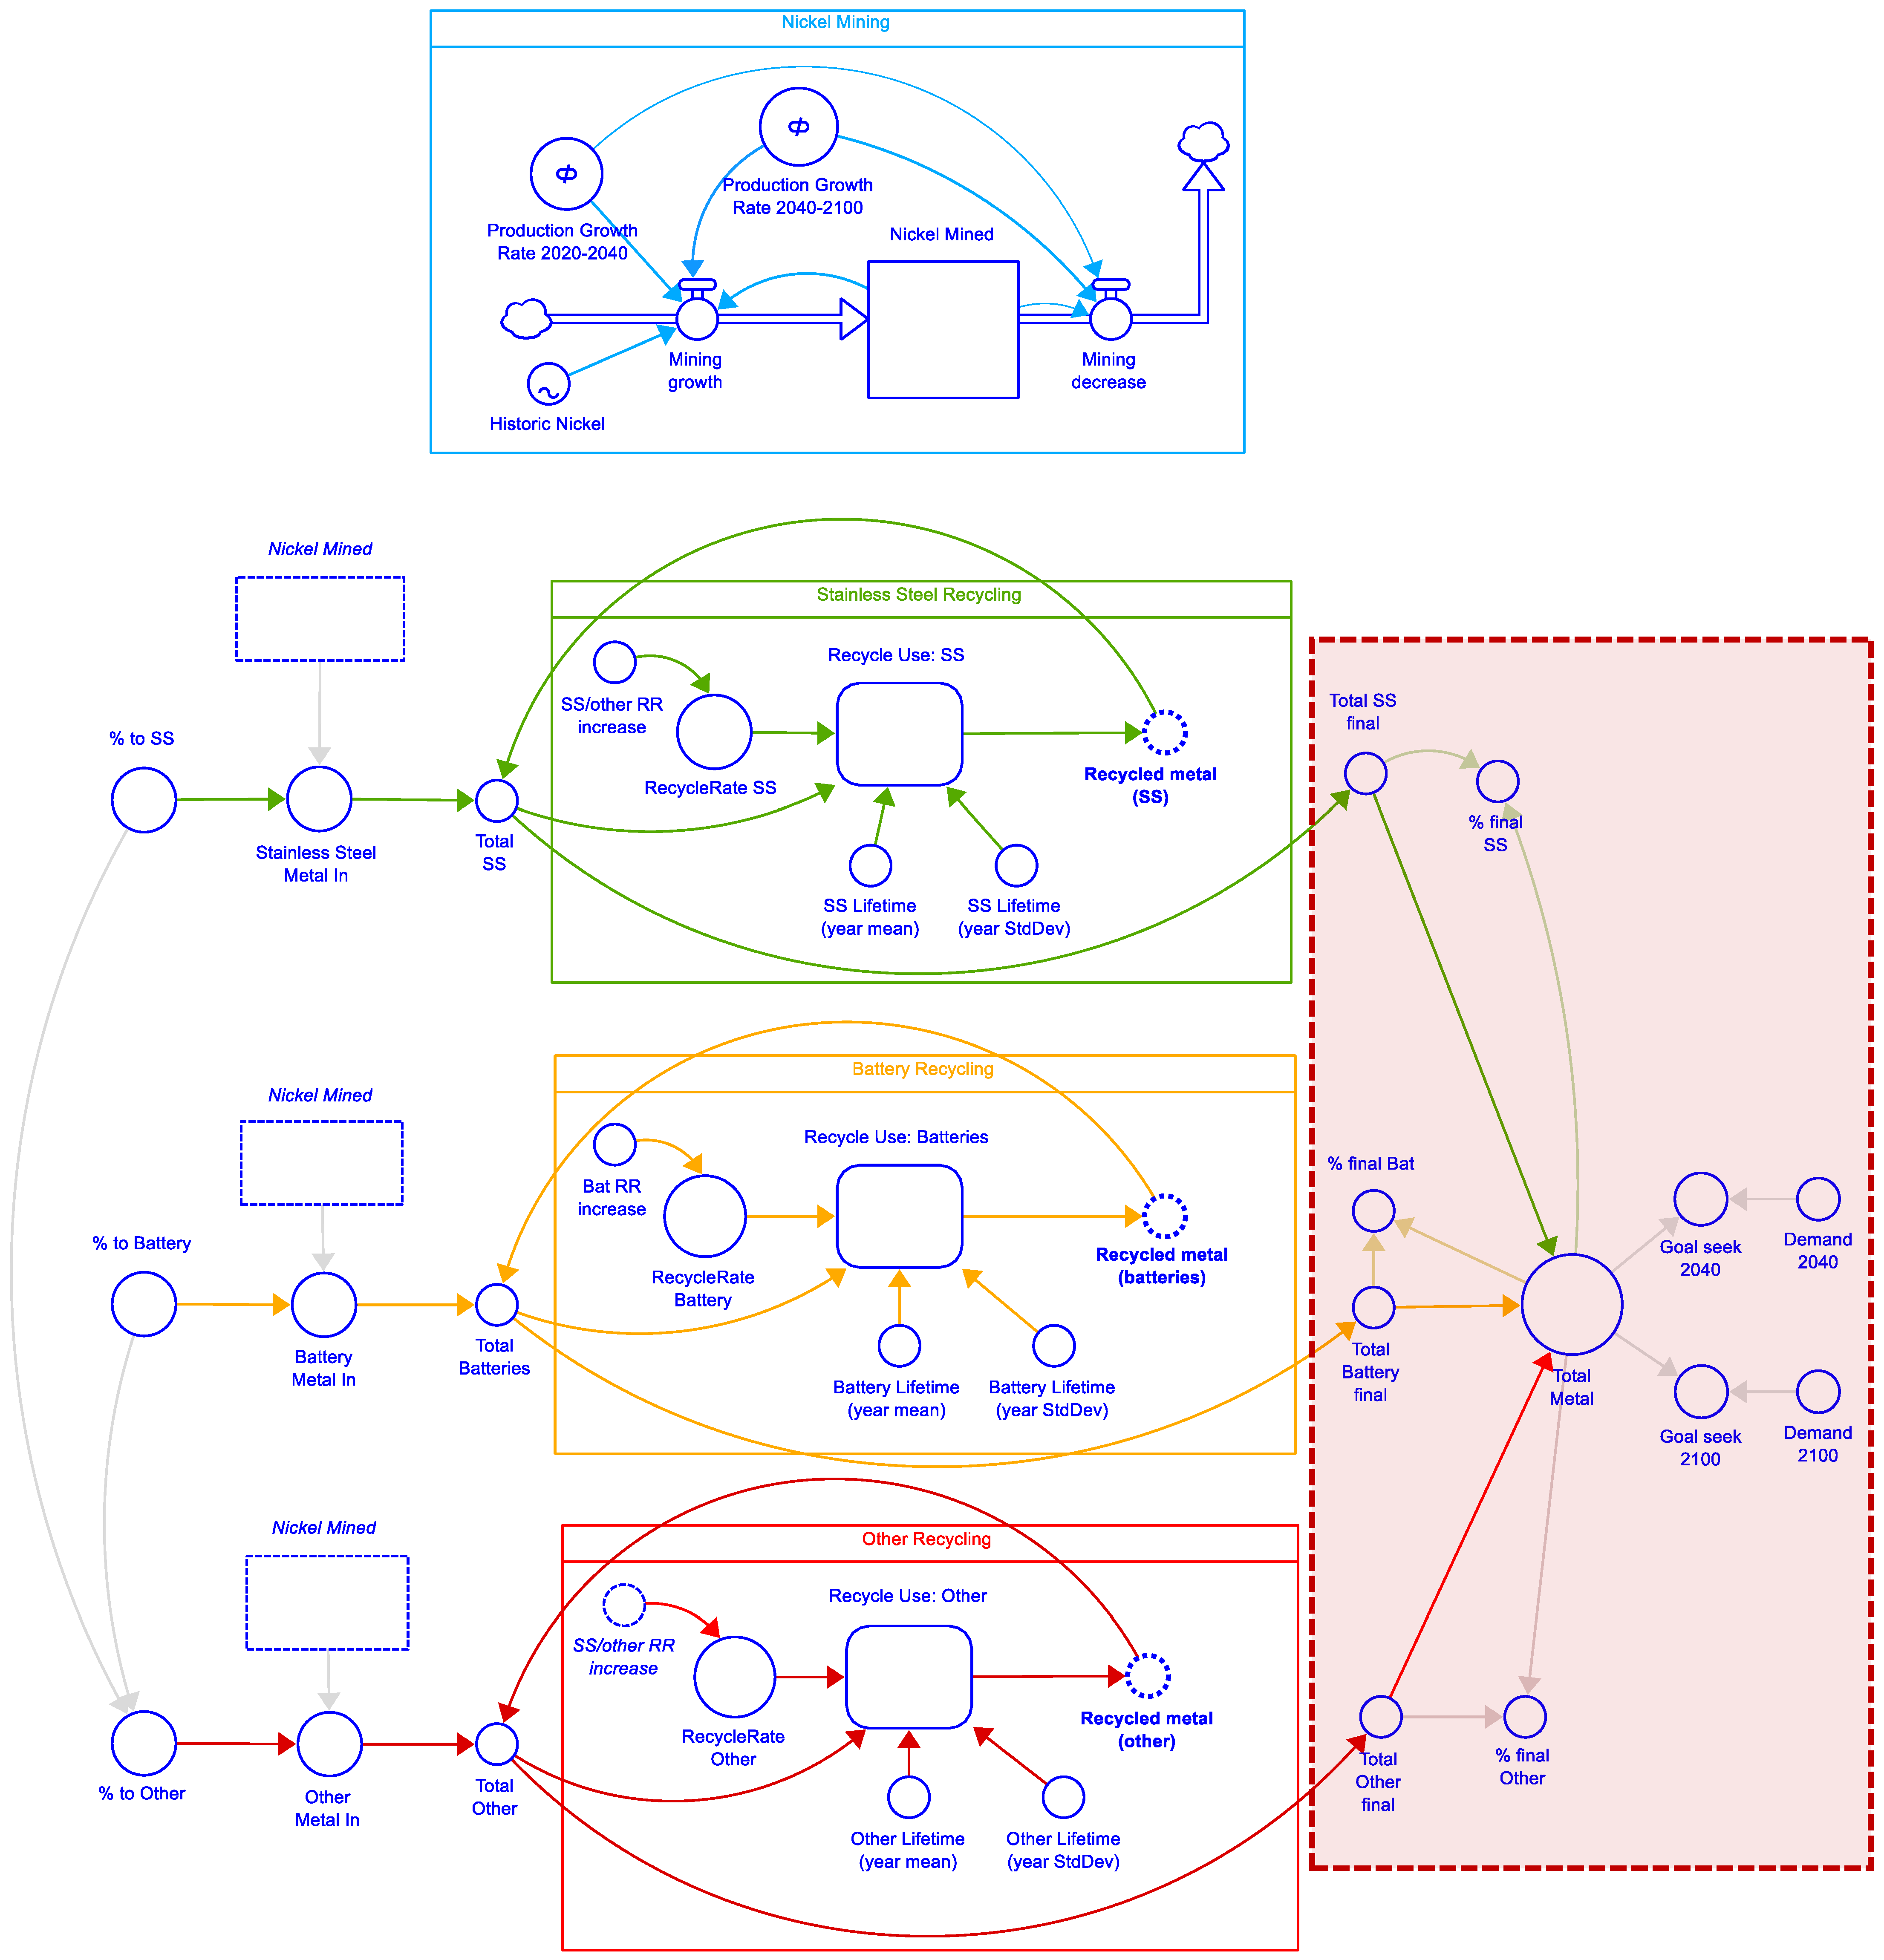
3.1. Modelling Overview
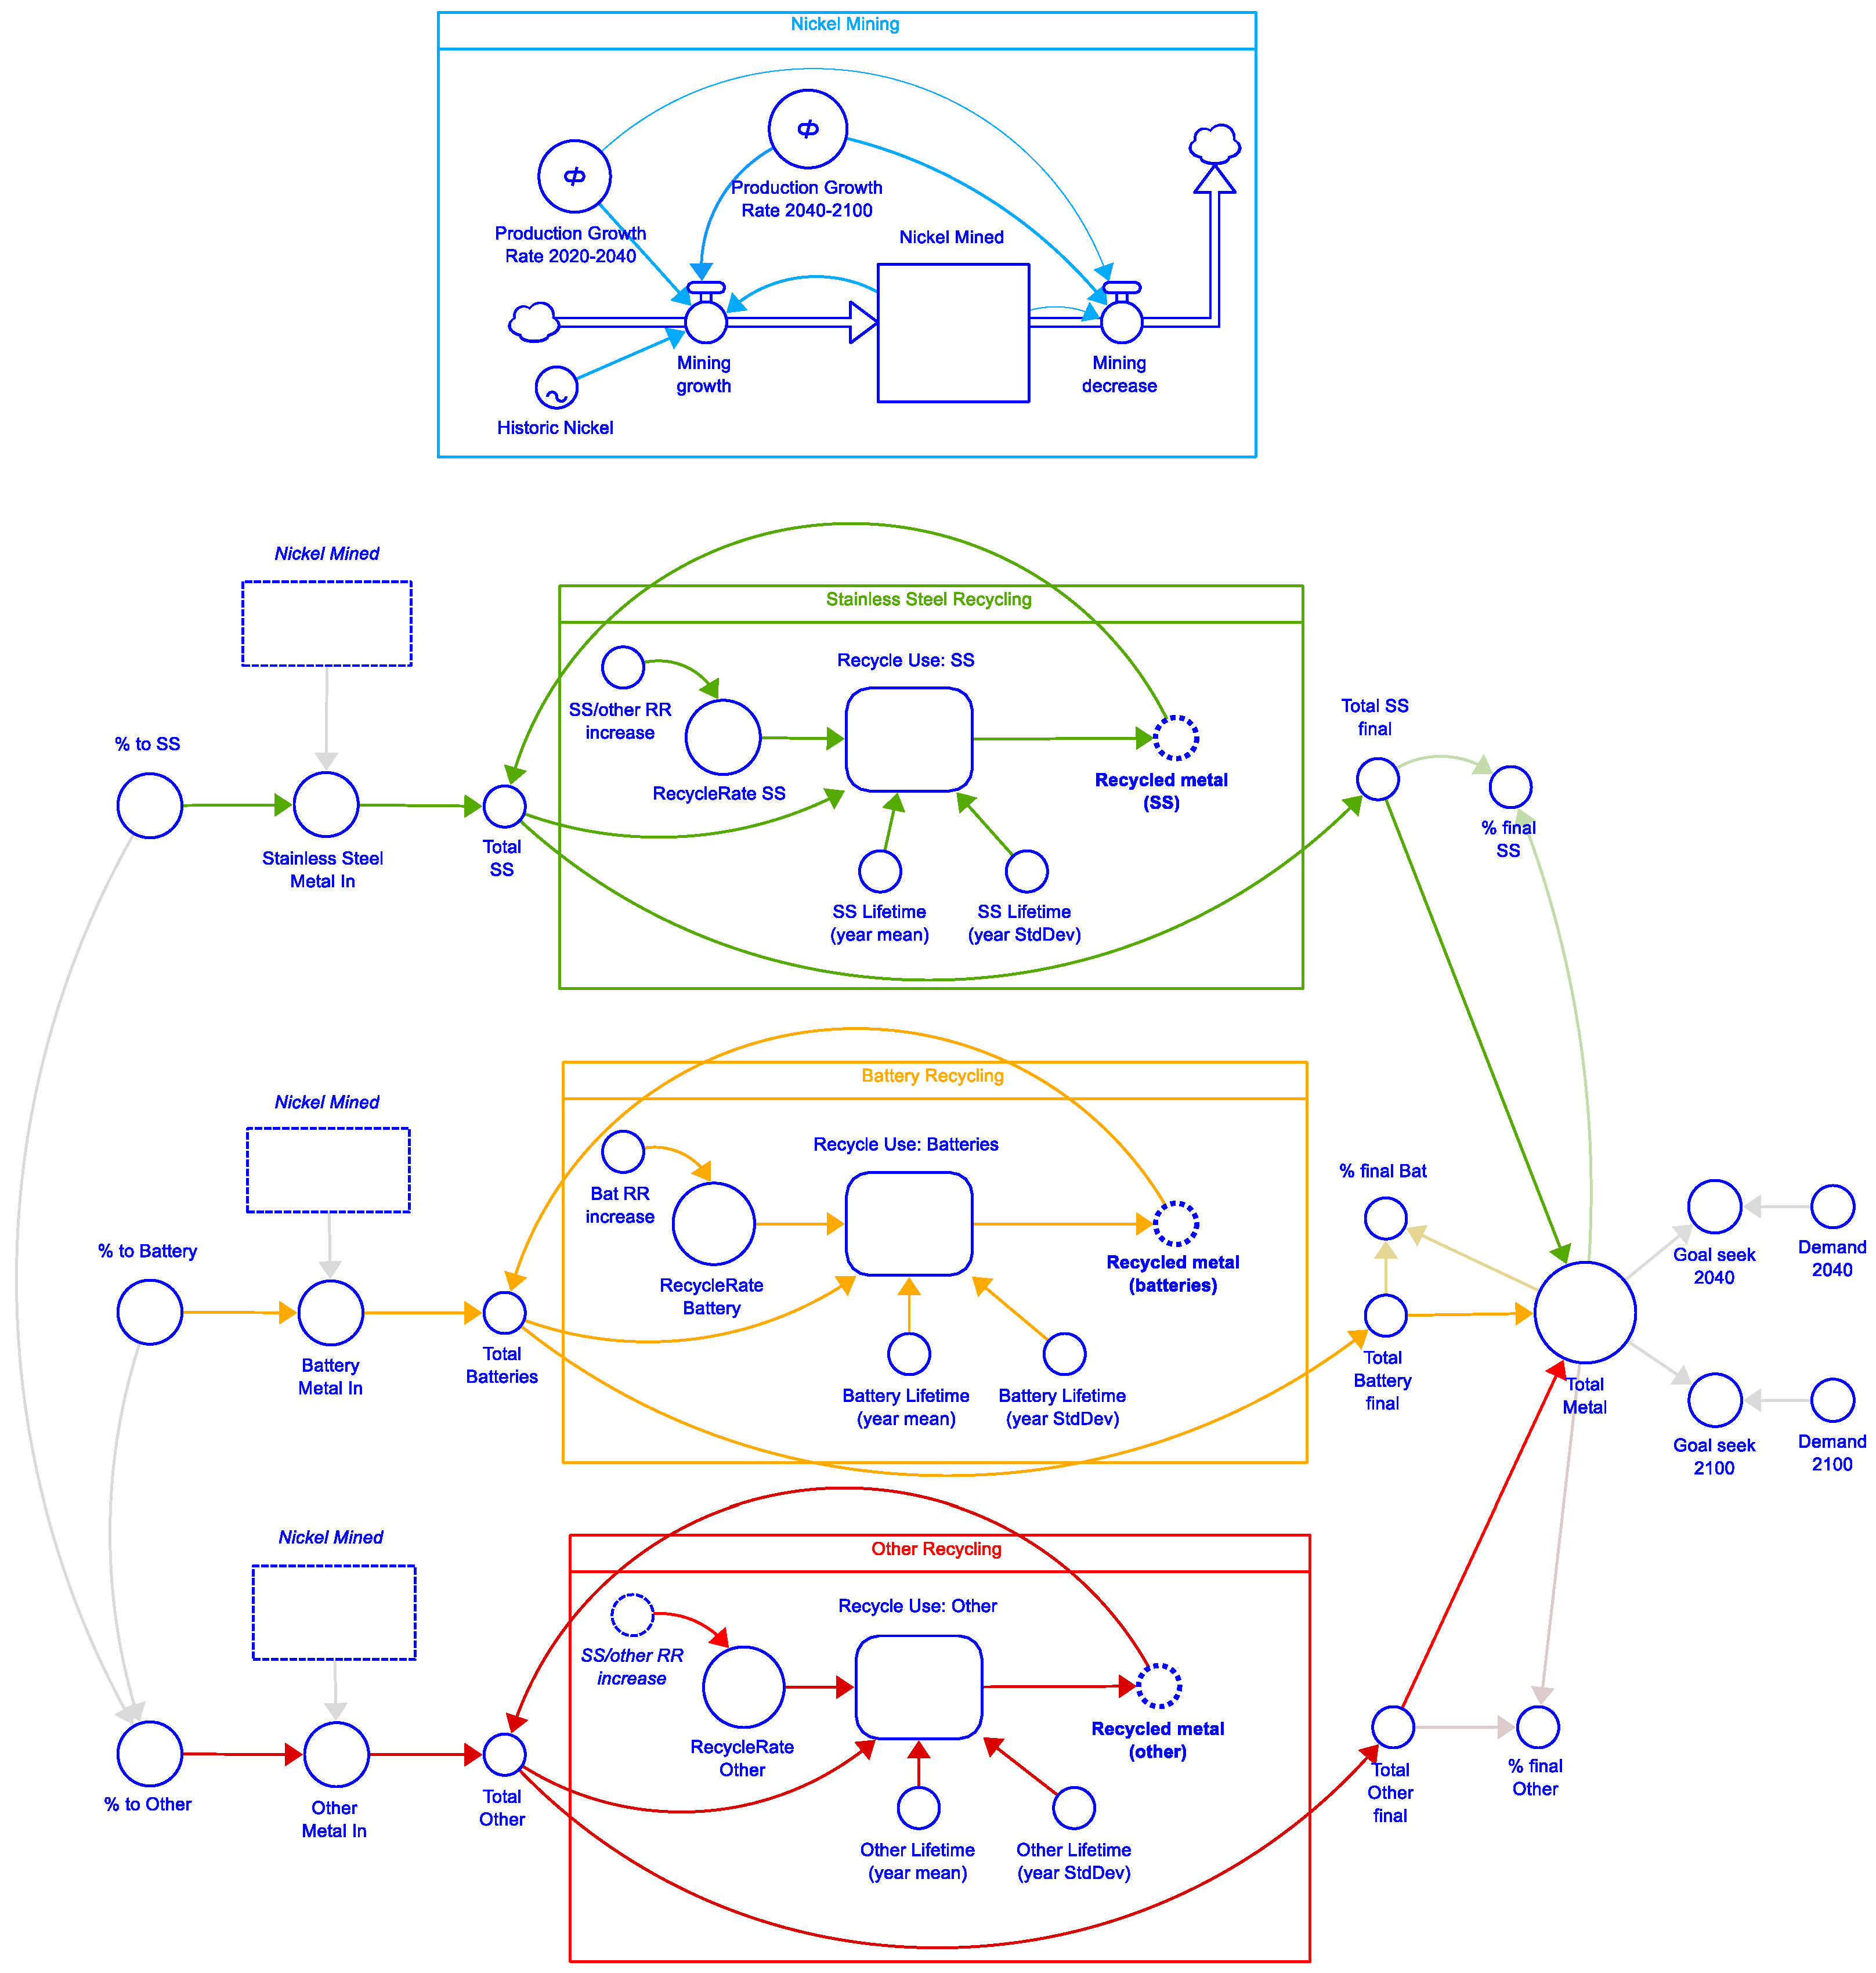
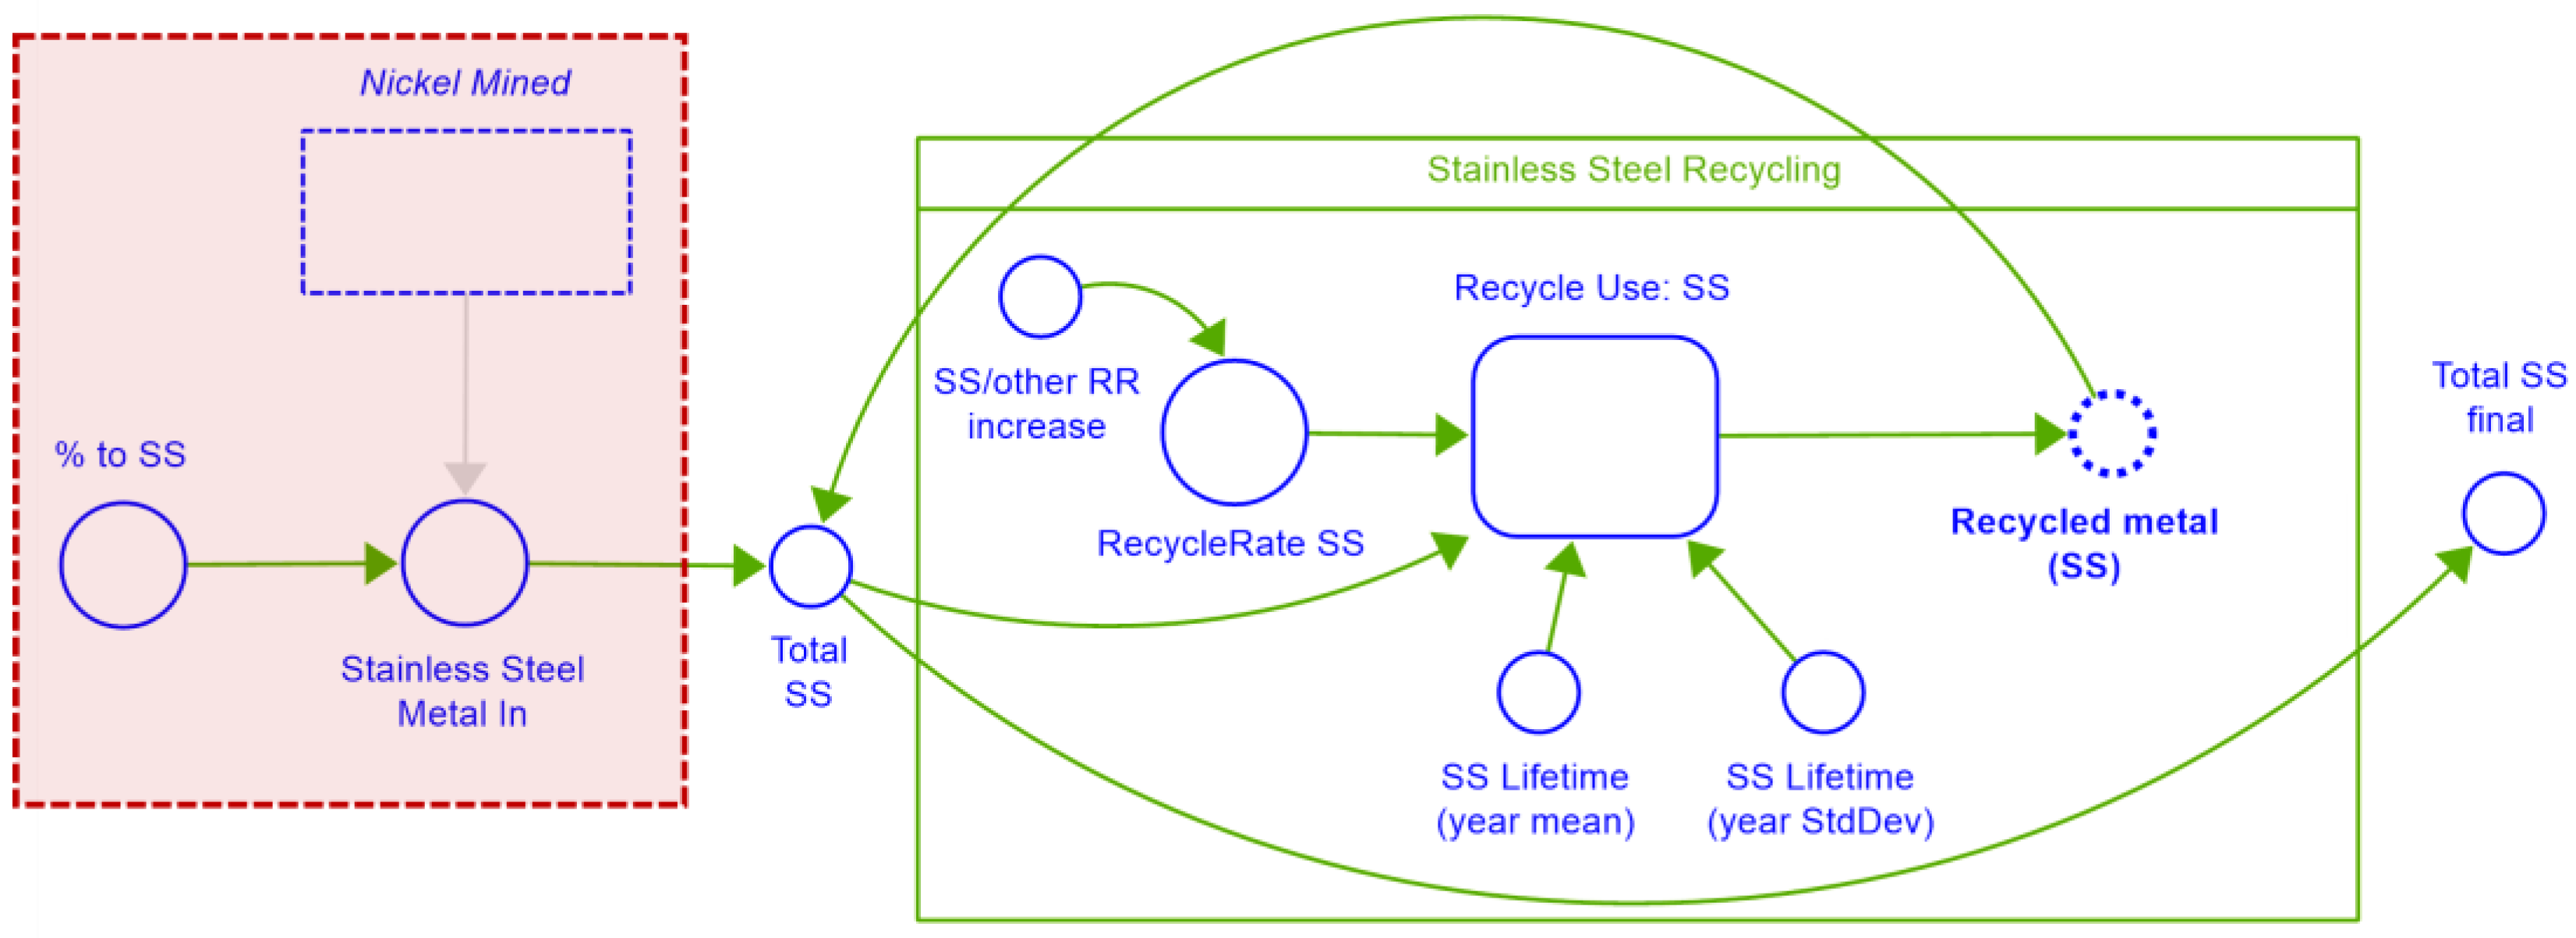
3.2. Model Structure
3.3. Model Parameters
3.3.1. Nickel Mining
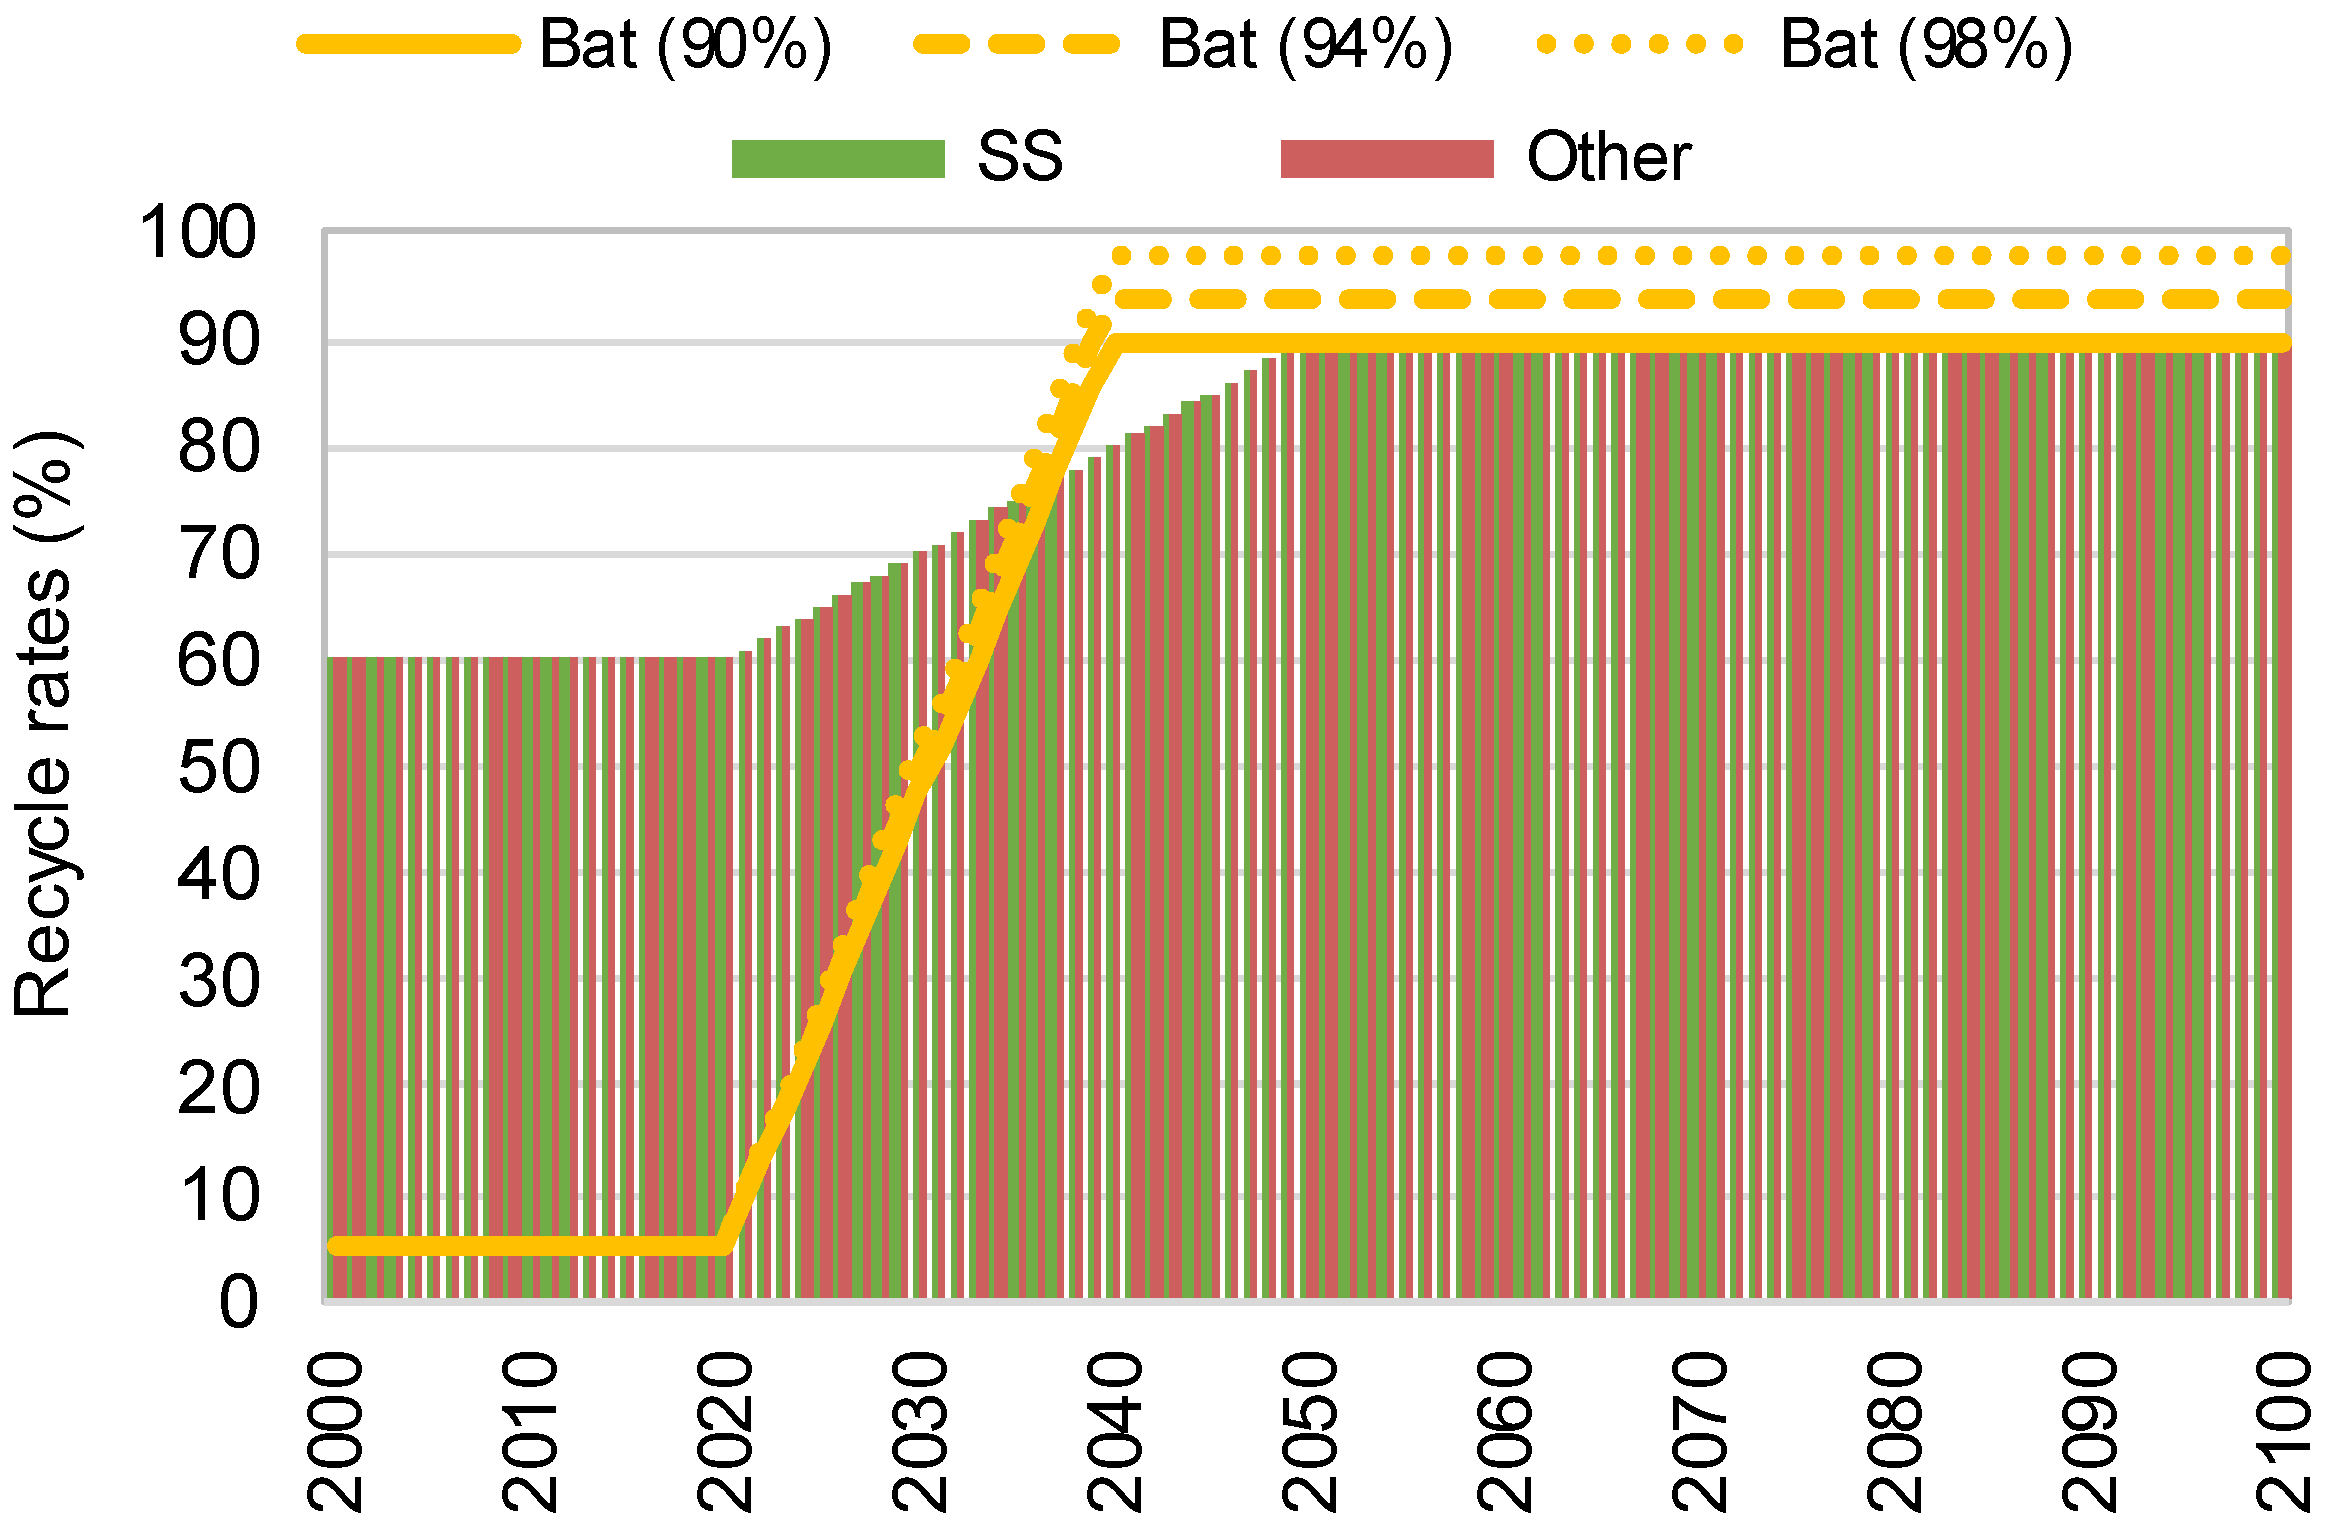
3.3.2. Nickel Recycling
3.3.3. Meeting Future Demands
3.4. Model Assumptions and Limitations
- 2020 is the current year (since there is much reference to 2020 as a starting point, this was a simple way to incorporate certain assumptions) [41].
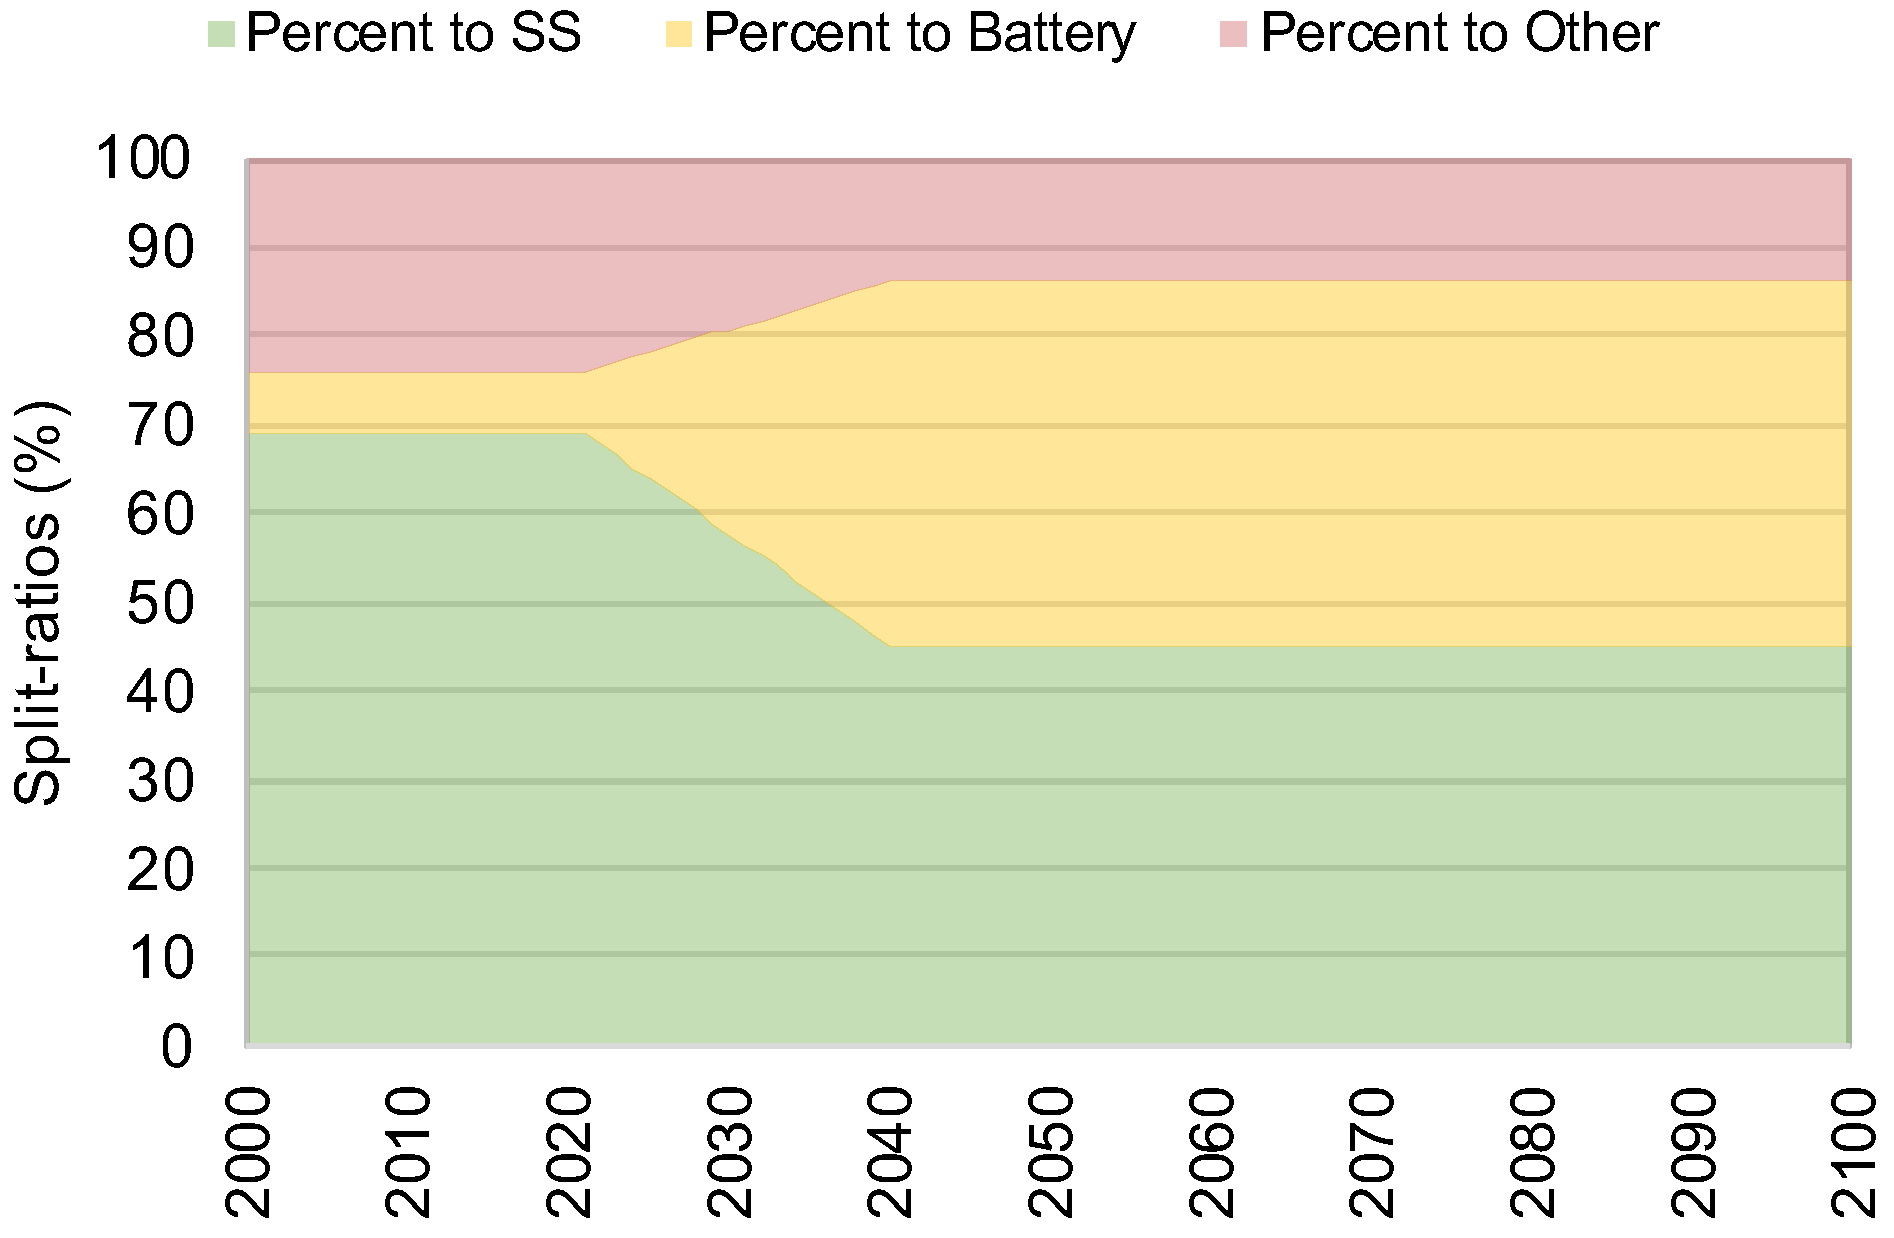
- Pre-2021 split ratios of nickel use cases are assumed to be the same as in 2021.
- Nickel demand (between 2050 and 2100) is driven by world population [39].
- Nickel within all products can be recycled again and again (infinite recycling) [8].
- Once nickel is used in a certain product (e.g., an EV battery), it will always be used in this product, and never for another product (e.g., stainless steel) [36]; i.e., “Once a battery, always a battery”. This is because the process of extracting nickel from complex materials (like an EV battery) to revert it to a pure, raw form is energy-intensive and costly. This assumption was also made for model simplification purposes.
- Possible nickel exhaustion will only be an issue after 2100 [39]; i.e., resource exhaustion is not considered in this paper.
- All metal required to produce nickel products in the first year must come from mining only, and none is available for recycling before 1994 [44].
4. Results
4.1. Meeting Future Demands
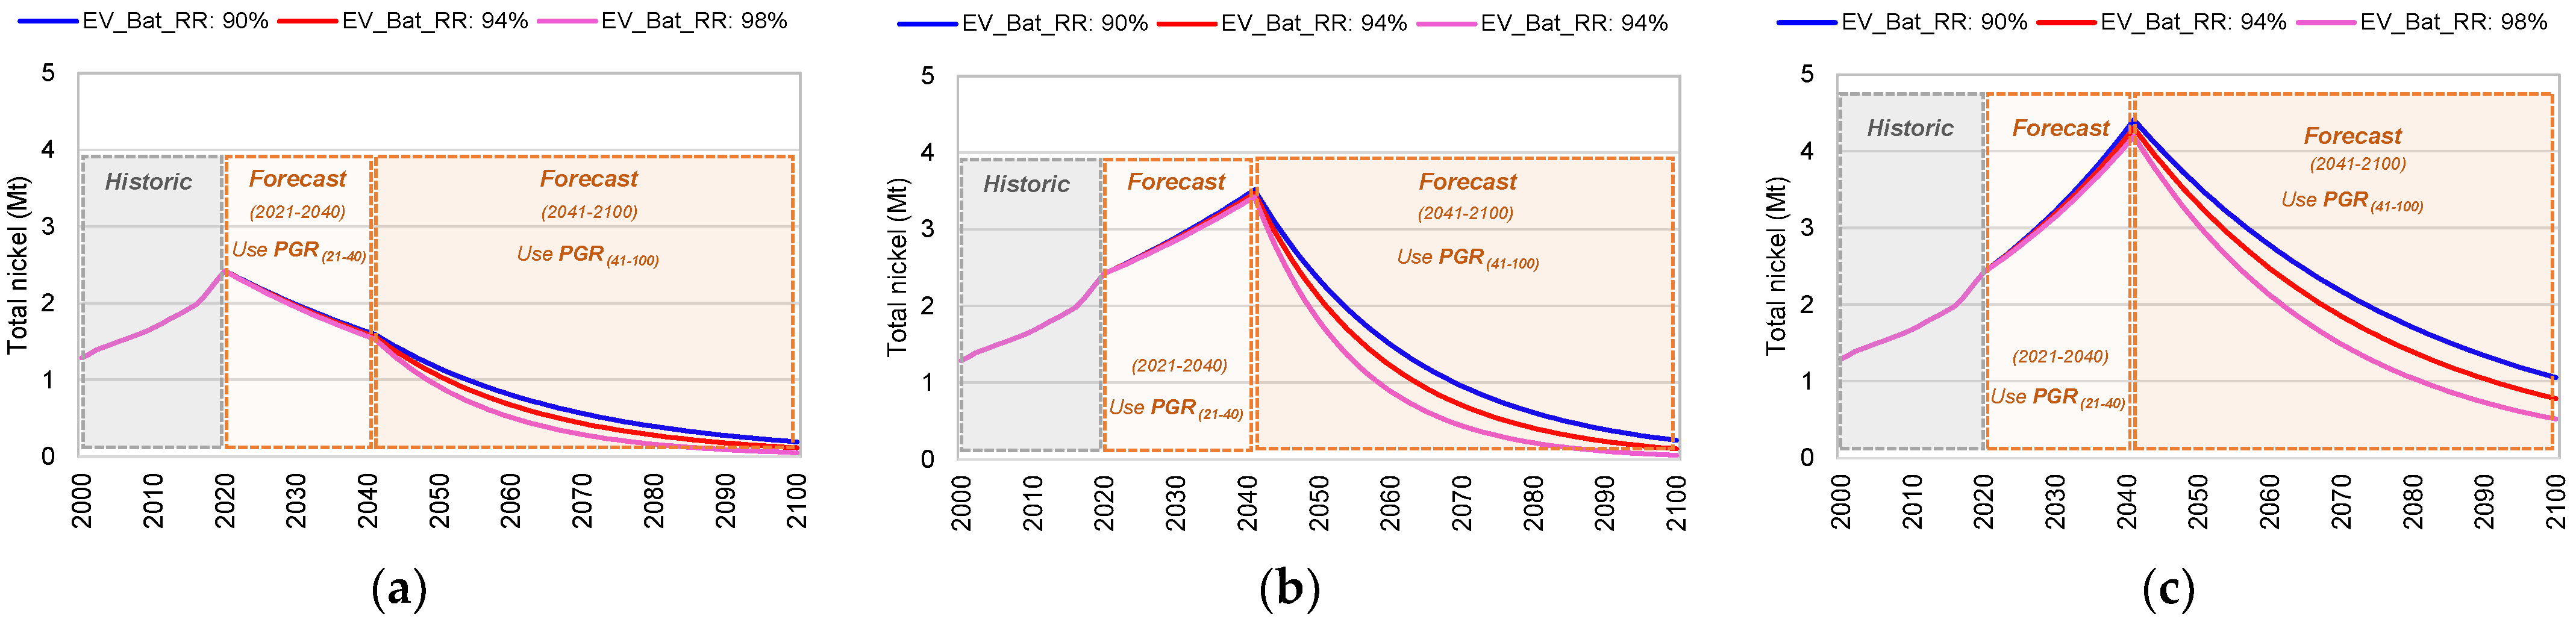
4.2. Nickel Mining
4.3. Nickel Recycling
5. Discussion
5.1. Nickel Mining Trends
5.2. Recycling and Recycle Rates
5.3. Implications
5.4. Comparison to CSIRO Model
6. Conclusions
6.1. Will the Current Ni Mining and Recycling Be Sufficient to Meet the Ni Demand by 2100?
6.2. By When Will Ni Recycling Make up 90% of the Total Demand?
Author Contributions
Funding
Data Availability Statement
Acknowledgments
Conflicts of Interest
References
- Chen, J.M. Carbon neutrality: Toward a sustainable future. Innovation 2021, 2, 100127. [Google Scholar] [CrossRef] [PubMed]
- Nowotny, J.; Dodson, J.; Fiechter, S.; Gür, T.M.; Kennedy, B.; Macyk, W.; Bak, T.; Sigmund, W.; Yamawaki, M.; Rahman, K.A. Towards global sustainability: Education on environmentally clean energy technologies. Renew. Sustain. Energy Rev. 2018, 81, 2541–2551. [Google Scholar] [CrossRef]
- Aldy, J.E.; Kotchen, M.J.; Stavins, R.N.; Stock, J.H. Keep climate policy focused on the social cost of carbon. Science 2021, 373, 850–852. [Google Scholar] [CrossRef] [PubMed]
- Sovacool, B.K.; Ali, S.H.; Bazilian, M.; Radley, B.; Nemery, B.; Okatz, J.; Mulvaney, D. Policy coordination is needed for global supply chains. Science 2020, 367, 30–33. [Google Scholar] [CrossRef]
- Alonso, E.; Sherman, A.M.; Wallington, T.J.; Everson, M.P.; Field, F.R.; Roth, R.; Kirchain, R.E. Evaluating rare earth element availability: A case with revolutionary demand from clean technologies. Environ. Sci. Technol. 2012, 46, 3406–3414. [Google Scholar] [CrossRef]
- Hund, K.; La Porta, D.; Fabregas, T.P.; Laing, T.; Drexhage, J. Minerals for Climate Action: The Mineral Intensity of the Clean Energy Transition; World Bank: Washington, DC, USA, 2023. [Google Scholar]
- De Koning, A.; Kleijn, R.; Huppes, G.; Sprecher, B.; Van Engelen, G.; Tukker, A. Metal supply constraints for a low-carbon economy? Resour. Conserv. Recycl. 2018, 129, 202–208. [Google Scholar] [CrossRef]
- Nickel Institute. About Nickel and Its Application. Available online: https://nickelinstitute.org/en/about-nickel-and-its-applications/ (accessed on 30 October 2023).
- Mudd, G.M. Global trends and environmental issues in nickel mining: Sulfides versus laterites. Ore Geol. Rev. 2010, 38, 9–26. [Google Scholar] [CrossRef]
- Henckens, M.; Worrell, E. Reviewing the availability of copper and nickel for future generations. The balance between production growth, sustainability and recycling rates. J. Clean. Prod. 2020, 264, 121460. [Google Scholar] [CrossRef]
- British Geological Survey. Available online: https://www2.bgs.ac.uk/mineralsuk/home.html (accessed on 5 November 2023).
- Statista. Primary Nickel Consumption Worldwide by Industry. 2022. Available online: https://www.statista.com/statistics/693415/nickel-consumption-worldwide-by-industry/ (accessed on 14 September 2023).
- Nickel Institute. Nickel Energizing Batteries. 2018. Available online: https://nickelinstitute.org/media/1987/nickel_battery_infographic-final2.pdf (accessed on 11 July 2023).
- Gunn, G.; Petavratzi, E. Battery Raw Materials; British Geological Survey: Minerals, UK, 2018; Available online: https://nora.nerc.ac.uk/id/eprint/534463/1/batteryRawMaterial.pdf (accessed on 11 July 2023).
- Ober, J.A. Mineral Commodity Summaries 2018. In Mineral Commodity Summaries; U.S. Geological Survey: Reston, VA, USA, Report 2018; Available online: https://pubs.usgs.gov/publication/70194932 (accessed on 2 October 2023).
- USGS. Mineral Commodity Summaries 2024; U.S. Geological Survey: 2024. Available online: https://pubs.usgs.gov/periodicals/mcs2024/mcs2024.pdf (accessed on 26 September 2023).
- Nakano, J. The Geopolitics of Critical Minerals Supply Chains; JSTOR: New York, NY, USA, 2021. [Google Scholar]
- Meadows, D.H.; Meadows, D.L.; Randers, J.; Behrens, W.W. The Limits to Growth; Universe Book: New York, NY, USA, 1972. [Google Scholar]
- Bardi, U. Extracted: How the Quest for Mineral Wealth Is Plundering the Planet; Chelsea Green Publishing: White River Junction, VT, USA, 2014. [Google Scholar]
- Sverdrup, H.U.; Ragnarsdottir, K.V.; Koca, D. On modelling the global copper mining rates, market supply, copper price and the end of copper reserves. Resour. Conserv. Recycl. 2014, 87, 158–174. [Google Scholar] [CrossRef]
- Reck, B.K.; Gordon, R.B. Nickel and chromium cycles: Stocks and flows project part IV. JOM 2008, 60, 55–59. [Google Scholar] [CrossRef]
- Reck, B.K.; Müller, D.B.; Rostkowski, K.; Graedel, T. Anthropogenic nickel cycle: Insights into use, trade, and recycling. Environ. Sci. Technol. 2008, 42, 3394–3400. [Google Scholar] [CrossRef] [PubMed]
- Nakajima, K.; Ohno, H.; Kondo, Y.; Matsubae, K.; Takeda, O.; Miki, T.; Nakamura, S.; Nagasaka, T. Simultaneous material flow analysis of nickel, chromium, and molybdenum used in alloy steel by means of input–output analysis. Environ. Sci. Technol. 2013, 47, 4653–4660. [Google Scholar] [CrossRef] [PubMed]
- Turner, D.A.; Williams, I.D.; Kemp, S. Combined material flow analysis and life cycle assessment as a support tool for solid waste management decision making. J. Clean. Prod. 2016, 129, 234–248. [Google Scholar] [CrossRef]
- Choi, C.H.; Cao, J.; Zhao, F. System dynamics modeling of indium material flows under wide deployment of clean energy technologies. Resour. Conserv. Recycl. 2016, 114, 59–71. [Google Scholar] [CrossRef]
- Houari, Y.; Speirs, J.; Candelise, C.; Gross, R. A system dynamics model of tellurium availability for CdTe PV. Prog. Photovolt. Res. Appl. 2014, 22, 129–146. [Google Scholar] [CrossRef]
- Golroudbary, S.R.; Calisaya-Azpilcueta, D.; Kraslawski, A. The life cycle of energy consumption and greenhouse gas emissions from critical minerals recycling: Case of lithium-ion batteries. Procedia CIRP 2019, 80, 316–321. [Google Scholar] [CrossRef]
- Schmidt, T.; Buchert, M.; Schebek, L. Investigation of the primary production routes of nickel and cobalt products used for Li-ion batteries. Resour. Conserv. Recycl. 2016, 112, 107–122. [Google Scholar] [CrossRef]
- Elshkaki, A.; Reck, B.K.; Graedel, T. Anthropogenic nickel supply, demand, and associated energy and water use. Resour. Conserv. Recycl. 2017, 125, 300–307. [Google Scholar] [CrossRef]
- Giljum, S.; Hubacek, K. Conceptual foundations and applications of physical input-output tables. In Handbook of Input-Output Economics in Industrial Ecology; Springer: Dordrecht, The Netherlands, 2009; pp. 61–75. [Google Scholar]
- IEA. The Role of Critical Minerals in Clean Energy Transitions; Paris. 2021. Available online: https://www.iea.org/reports/the-role-of-critical-minerals-in-clean-energy-transitions (accessed on 4 February 2024).
- BHP. Climate Change Report. 2020. Available online: https://www.bhp.com/-/media/documents/investors/annual-reports/2020/200910_bhpclimatechangereport2020.pdf (accessed on 4 February 2024).
- SYSTEMIQ. Critical Raw Materials for the Energy Transition in the EU: How Circular Economy Approaches Can Increase Supply Security for Critical Raw Materials. 2022. Available online: https://www.systemiq.earth/wp-content/uploads/2022/11/Systemiq-2022.-Circular-Economy-Critical-Raw-Materials-factsheets_final.pdf (accessed on 4 February 2024).
- Zhang, H.; Liu, G.; Li, J.; Qiao, D.; Zhang, S.; Li, T.; Guo, X.; Liu, M. Modeling the impact of nickel recycling from batteries on nickel demand during vehicle electrification in China from 2010 to 2050. Sci. Total Environ. 2023, 859, 159964. [Google Scholar] [CrossRef]
- Dominish, E.; Florin, N.; Wakefield-Rann, R. Reducing New Mining for Electric Vehicle Battery Metals: Responsible Sourcing through Demand Reduction Strategies and Recycling; UTS: Sydney, Australia, 2021. [Google Scholar]
- Teske, S. Achieving the Paris Climate Agreement Goals: Global and Regional 100% Renewable Energy Scenarios with Non-Energy GHG Pathways for+ 1.5 C and+ 2 C; Springer Nature: Cham, Germany, 2019. [Google Scholar]
- Statista. Mine Production of Nickel Worldwide from 2010 to 2022. Available online: https://www.statista.com/statistics/260748/mine-production-of-nickel-since-2006/ (accessed on 24 September 2023).
- Natural Resources Canada. Nickel Facts. Available online: https://natural-resources.canada.ca/our-natural-resources/minerals-mining/minerals-metals-facts/nickel-facts/20519 (accessed on 19 October 2023).
- Olafsdottir, A.H.; Sverdrup, H.U. Modelling global nickel mining, supply, recycling, stocks-in-use and price under different resources and demand assumptions for 1850–2200. Min. Metall. Explor. 2021, 38, 819–840. [Google Scholar] [CrossRef]
- Our World in Data. Population Growth. Available online: https://ourworldindata.org/population-growth (accessed on 17 October 2023).
- Wood Mackenzie. Wood Mackenzie Future Facing Mined Commodities 2022. Available online: https://www.woodmac.com/reports/metals-future-facing-mined-commodities-forum-150011028/ (accessed on 22 May 2023).
- Worldstainless. The Global Life Cycle of Stainless Steels. 2019. Available online: https://www.worldstainless.org/files/issf/non-image-files/PDF/Team_Stainless/The_Global_Life_Cycle_of_Stainless_Steels.pdf (accessed on 10 July 2023).
- Cooper, D.R.; Ryan, N.A.; Syndergaard, K.; Zhu, Y. The potential for material circularity and independence in the US steel sector. J. Ind. Ecol. 2020, 24, 748–762. [Google Scholar] [CrossRef]
- Nickel Institute. The Life Cycle of Nickel; 2014. Available online: https://nickelinstitute.org/media/2767/nickelmag_vol29-1.pdf (accessed on 10 November 2023).
- CSIRO. Known Unknowns: The DEVIL in the Details of Energy Metal Demand; Using an Integrated Physical Framework to explore Opportunities and Risks for Metals in the Energy Transition. 2021. Available online: https://www.csiro.au/en/news/All/News/2021/November/CSIRO-report-sheds-new-light-on-future-of-critical-metals-demand-in-the-energy-transition (accessed on 14 June 2023).
- Emma Woollacott from BBC News. Electric Cars: What will Happen to All the Dead Batteries? Available online: https://www.bbc.com/news/business-56574779 (accessed on 20 October 2023).
- Gaines, L.; Zhang, J.; He, X.; Bouchard, J.; Melin, H.E. Tracking Flows of End-of-Life Battery Materials and Manufacturing Scrap. Batteries 2023, 9, 360. [Google Scholar] [CrossRef]


| Scenario | Scenario Reference | Scenario Description | Ni Demand Forecast |
|---|---|---|---|
| Base case | STEPS [31] | Based on analysis of current policies | 4052 kt (by 2040) |
| Medium change | SDS [31] | Required to meet Paris Agreement goals | 6265 kt (by 2040) |
| Rapid change | 1.5 °C [32,33] | Required to reach much below 1.5 °C | 9500 kt (by 2050) |
| Scenario | Ni Demand Forecast (2040, unless Stated Otherwise) | Ni Demand Forecast (2100) b |
|---|---|---|
| STEPS | 4052 kt | 4564 kt |
| SDS | 6265 kt | 7057 kt |
| 1.5 °C | 9500 kt (2050) a | 11,550 kt |
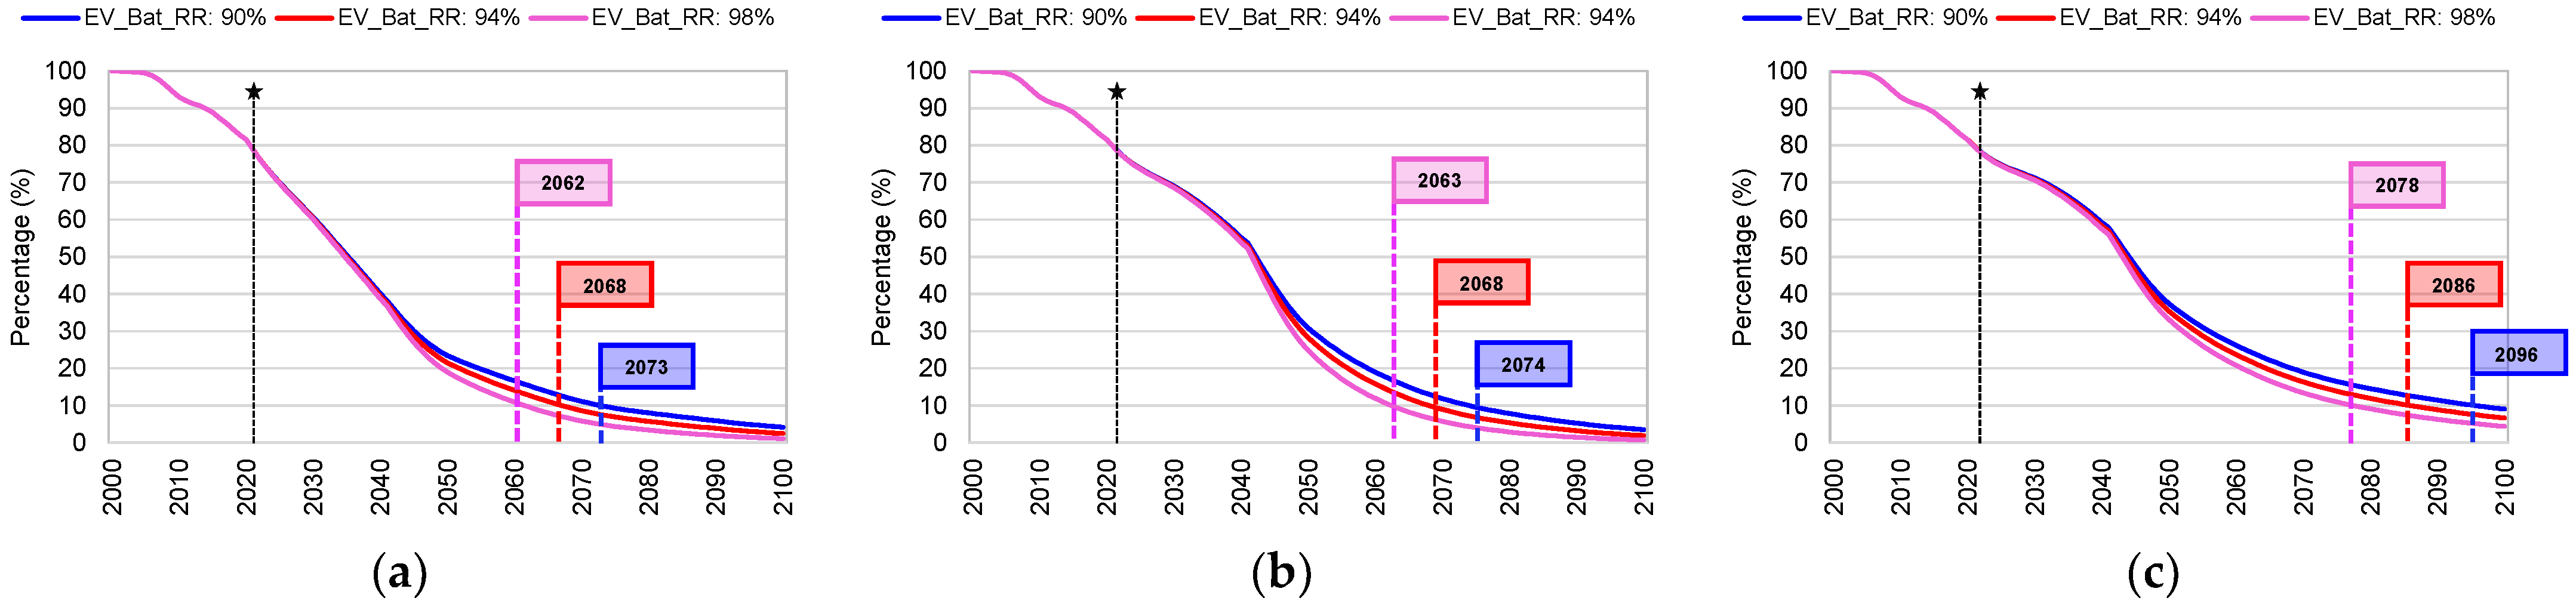
| Scenario | EV Batteries Recycle Rate | ||
|---|---|---|---|
| 90% | 94% | 98% | |
| STEPS | 2073 | 2068 | 2062 |
| SDS | 2074 | 2068 | 2063 |
| 1.5 °C | 2096 | 2086 | 2078 |
| Scenario | EV Batteries Recycle Rate | |||||
|---|---|---|---|---|---|---|
| 90% | 94% | 98% | ||||
| MPGR: 2020–2040 | MPGR: 2040–2100 | MPGR: 2020–2040 | MPGR: 2040–2100 | MPGR: 2020–2040 | MPGR: 2040–2100 | |
| STEPS | −1.98 | −3.52 | −2.07 | −4.33 | −2.16 | −5.62 |
| SDS | 1.79 | −4.39 | 1.73 | −5.34 | 1.66 | −6.84 |
| 1.5 °C | 2.9 | −2.41 | 2.77 | −2.87 | 2.65 | −3.52 |
Disclaimer/Publisher’s Note: The statements, opinions and data contained in all publications are solely those of the individual author(s) and contributor(s) and not of MDPI and/or the editor(s). MDPI and/or the editor(s) disclaim responsibility for any injury to people or property resulting from any ideas, methods, instructions or products referred to in the content. |
© 2024 by the authors. Licensee MDPI, Basel, Switzerland. This article is an open access article distributed under the terms and conditions of the Creative Commons Attribution (CC BY) license (https://creativecommons.org/licenses/by/4.0/).
Share and Cite
Nell, K.; Valenta, R.K.; Forbes, G.; Yahyaei, M.; Ilyas, H.M.A. Sustainable Resource Management: The End of Nickel Mining? Recycling 2024, 9, 102. https://doi.org/10.3390/recycling9060102
Nell K, Valenta RK, Forbes G, Yahyaei M, Ilyas HMA. Sustainable Resource Management: The End of Nickel Mining? Recycling. 2024; 9(6):102. https://doi.org/10.3390/recycling9060102
Chicago/Turabian StyleNell (née Campbell), Kristy, Richard K. Valenta, Gordon Forbes, Mohsen Yahyaei, and Hafiz M. A. Ilyas. 2024. "Sustainable Resource Management: The End of Nickel Mining?" Recycling 9, no. 6: 102. https://doi.org/10.3390/recycling9060102
APA StyleNell, K., Valenta, R. K., Forbes, G., Yahyaei, M., & Ilyas, H. M. A. (2024). Sustainable Resource Management: The End of Nickel Mining? Recycling, 9(6), 102. https://doi.org/10.3390/recycling9060102