Article

Enhancing System Safety and Reliability through Integrated FMEA and Game Theory: A Multi-Factor Approach

1
School of Computing, Engineering & Physical Sciences, University of the West of Scotland (UWS), London E14 2BE, UK
2
School of Engineering, Faculty of Science and Engineering, Macquarie University, Sydney, NSW 2109, Australia
Submission received: 22 November 2023 / Revised: 19 December 2023 / Accepted: 20 December 2023 / Published: 22 December 2023

Abstract

:
This study aims to address the limitations of traditional Failure Mode and Effect Analysis (FMEA) in managing safety and reliability within complex systems characterized by interdependent critical factors. We propose an integrated framework that combines FMEA with the strategic decision-making principles of Game Theory, thereby enhancing the assessment and mitigation of risks in intricate environments. The novel inclusion of the Best Worst Method (BWM) and Pythagorean fuzzy uncertain linguistic variables refines the accuracy of risk evaluation by overcoming the inherent deficiencies of conventional FMEA approaches. Through sensitivity analysis, the framework’s efficacy in identifying and prioritizing failure modes is empirically validated, guiding the development of targeted interventions. The practical application of our methodology is demonstrated in a comprehensive healthcare system analysis, showcasing its versatility and significant potential to improve operational safety and reliability across various sectors. This research is particularly beneficial for systems engineers, risk managers, and decision-makers seeking to fortify complex systems against failures and their effects.

1. Introduction

Integrating risk assessment tools within complex healthcare systems is paramount in ensuring the safety and quality of stakeholders’ care, well-being, and the overall efficiency of healthcare delivery. Healthcare, by its very nature, is a complex ecosystem where myriad factors, both clinical and non-clinical, interact, making it susceptible to various forms of risk. These risks can manifest as medical errors, patient safety incidents, financial challenges, regulatory non-compliance, and even public health crises, such as viral respiratory illness [1].
The importance of risk assessment in healthcare lies in its ability to proactively identify, evaluate, and mitigate potential risks, thereby preventing adverse events, optimizing resource allocation, and improving the overall performance of healthcare organizations [2]. A practical risk assessment framework not only enhances patient safety but also safeguards the reputation of healthcare institutions, reduces financial losses, and ensures compliance with regulatory requirements [3,4].
In recent years, healthcare systems have faced unprecedented challenges, most notably with the emergence of the pandemic. This global crisis underscored the critical need for robust risk assessment and management practices within healthcare. The pandemic’s rapid spread, overwhelming healthcare facilities, and straining of medical resources highlighted the imperative of proactive risk assessment to prepare for and respond to unforeseen events. The importance of risk assessment in healthcare cannot be overstated. It serves as a systematic approach to identifying, evaluating, and addressing potential hazards that could compromise patient care, facility functionality, or service integrity. By proactively identifying these threats, healthcare organizations can prevent adverse events, optimize resource allocation, safeguard their reputation, reduce financial losses, and ensure regulatory compliance. A robust risk assessment framework not only enhances patient safety but also instills trust among patients, staff, and the broader community. One notable example is the 2017 cyberattack on the UK’s National Health Service (NHS) using the WannaCry ransomware. This attack affected over 200,000 computers worldwide, crippling hospital systems, delaying surgeries, and causing massive disruptions in patient care. Institutions that had comprehensive risk assessments concerning cybersecurity were better prepared to fend off or mitigate the effects of the attack. Those without such precautions suffered from prolonged system outages and data breaches. This incident highlighted the critical importance of risk assessment in areas beyond just direct patient care, emphasizing its role in safeguarding essential healthcare infrastructure and sensitive patient data.
Moreover, healthcare systems today increasingly recognize the importance of adopting a holistic and data-driven approach to risk assessment. This approach considers clinical factors, patient demographics, emerging infectious diseases, supply chain vulnerabilities, and even socioeconomic determinants of health. Integrating advanced analytics, artificial intelligence, and predictive modelling techniques into risk assessment processes enables healthcare organizations to identify potential threats more accurately and in real-time. This comprehensive integration of risk assessment in healthcare is not merely a reactive measure but a proactive strategy for safeguarding the well-being of patients, healthcare workers, and the broader community. It also contributes to cost containment, resource optimization, and the sustainability of healthcare systems in an era of evolving challenges and uncertainties.
Different techniques can be applied to determine the risk priorities associated with hazards in a particular system. Among the most notable are what-if analysis, checklists, hazard and operability study (HAZOP) [5,6], failure mode and effect analysis (FMEA) [7,8,9], fault tree analysis [10,11,12,13,14], and the risk matrix [15,16]. Each of these methods offers invaluable insights, especially when assessing hazards in specialized sectors like healthcare units.
The foundation of effective risk management is the comprehensive identification of potential hazards, which can span from accidents, near misses, incidents, occupational illnesses, to environmental implications. The subsequent assessment typically involves a combination of qualitative [17] and quantitative evaluations. Qualitatively, hazards are evaluated based on factors such as potential severity and likelihood. On the other hand, the quantitative method utilizes numerical data and statistical analyses to assign exact values to these identified hazards.
Two pivotal elements in risk assessment are likelihood and severity. The former quantifies the chances of a hazard materializing, while the latter gauges its potential impact if it does [15]. After establishing these parameters, a comprehensive risk profile is developed. This profile, built on both qualitative and quantitative assessments, provides a holistic view of the overall risk, allowing stakeholders to grasp the complete nature and magnitude of the threat.
Equipped with a well-defined risk profile, necessary interventions can be determined. The goal is to reduce the identified risk to an acceptable level within the context of the system in question. Potential interventions might include process modifications, procedural enhancements, resource allocations, or the establishment of safety measures [18,19,20,21,22,23,24]. Ultimately, the aim is to ensure the system’s safety, protect individuals, and minimize environmental impacts, leading to a more effective and holistic risk management approach.
The conventional FMEA is a widely accepted proactive risk management method, which is commonly used to identify the failure modes of a complex system [25,26,27,28,29,30,31,32,33,34]. Traditional FMEA techniques employ a structured approach to assess the risks associated with failure modes within a system. This assessment revolves around three fundamental risk factors: Severity, Occurrence, and Detection, each of which is assigned a numerical score ranging from 1 to 10. In this scale, a score of 1 signifies the least significant impact or occurrence likelihood, while a score of 10 represents the highest level of importance concerning these risk factors. The calculation of the Risk Priority Number (RPN) constitutes a pivotal step in this process. It involves multiplying the individual risk factor scores associated with each failure mode. The resultant RPN serves as a quantitative indicator of the overall risk associated with that particular failure mode. These RPN values are then used to prioritize the failure modes in a descending order, with those bearing the highest RPNs demanding immediate attention and intervention actions. This systematic approach enables practitioners to pinpoint the most critical failure modes, allowing for the allocation of resources and efforts to mitigate the highest-risk areas first. It forms the basis for informed decision-making in risk management, ensuring that interventions are directed towards the areas of greatest concern to enhance system reliability and safety effectively [35,36,37,38,39,40,41].
Nonetheless, the conventional FMEA method is marred by a multitude of limitations, as scholars have astutely noted, prompting proposed enhancements to address these deficiencies: (A) Equal Weighting Assumption: Traditional FMEA assigns equal importance weights to Severity, Occurrence, and Detection [25,42], which may not accurately reflect the true significance of these factors. (B) Limited Consideration in Risk Priority Numbers: The conventional approach calculates risk priority numbers based solely on Severity, Occurrence, and Detection [37], overlooking other pertinent aspects of risk assessment. (C) Identical Risk Priority Numbers for Different Combinations: Different combinations of Severity, Occurrence, and Detection can yield the same risk priority number, leading to ambiguity. (D) Lack of Clarity in Computation: Some instances lack sufficient information to effectively judge the computation of risk priority numbers [43,44,45], adding uncertainty to the risk assessment process. (E) Interdependencies in Intervention Actions: In certain systems, failure modes may be intricately linked, making it challenging to assign intervention actions independently. (F) Static Assessment: Conventional FMEA, akin to many risk management methods, tends to evaluate system risk statically and often disregards the temporal dimension within the system profile [46,47,48,49,50,51], missing dynamic aspects. For an in-depth exploration of these limitations, a comprehensive review is available in [52]. These recognized shortcomings underscore the need for innovative methodologies that transcend these constraints and provide a more robust approach to risk assessment and management.
Classical FMEA, along with its various extensions, has been employed in healthcare to evaluate potential risks [15]. Healthcare systems comprise diverse organizations, institutions, and resources, all dedicated to facilitating health actions [53]. Such a health action is characterized as a concerted effort made through healthcare services, be it personal, public, or inter-sectoral, with the primary goal being the enhancement of health systems [54,55].
Healthcare systems have encountered a myriad of evolving challenges in recent years, including the emergence of new diseases and shifting disease patterns, a shortage of advanced medical knowledge, and the rapid evolution of medical technologies. These challenges have resulted in a steady rise in both healthcare costs and fatalities. In response to these escalating challenges, implementing FMEA techniques, with a focus on their rapid preventive capabilities, becomes imperative for averting failures across diverse healthcare systems [52].
The objectives of this research are twofold. Firstly, we endeavor to redefine the application of FMEA by infusing it with the strategic principles of Game Theory. By doing so, we aim to address the problem of prioritizing failure modes more effectively than current methodologies allow. This tailored approach is expected to offer a novel risk evaluation and management perspective. Secondly, we introduce a cutting-edge method that employs Pythagorean fuzzy uncertain linguistic variables in the computation of risk factors, aiming to refine the precision and effectiveness of risk assessments.
To delineate how our contributions stand apart from existing studies, we articulate the research questions this paper seeks to answer: How can integrating Game Theory into FMEA enhance the prioritization of failure modes within healthcare systems? Additionally, how does applying Pythagorean fuzzy uncertain linguistic variables improve the quantification of risk factors? These queries arise from recognized gaps in current risk assessment practices, particularly their inability to manage complex and uncertain healthcare environments adeptly.
The study concludes with a set of hypotheses that posits the superior performance of our proposed methodologies in risk assessment over traditional methods. It also outlines our scientific contributions to the field, which include a more systematic approach to decision-making in healthcare risk management and the potential for these methods to be applied to other domains requiring fine risk assessment. By explicitly addressing these research questions and hypotheses, our work endeavors to provide a more straightforward and more impactful addition to the body of knowledge in healthcare risk management.
The remainder of this article unfolds as follows: Section 2 conducts a comprehensive literature review on Game Theory, elucidating fundamental definitions and introducing various classes of game strategies. In Section 3, we introduce a hybrid model with a primary emphasis on Game Theory. Section 4 studies a real-world application, examining a healthcare unit in a hospital operating under the emergent conditions. Section 5 offers validation for the proposed approach, while Section 6 undertakes sensitivity analysis to assess the consistency and robustness of the hybrid model. Finally, Section 7 provides a conclusion, addressing the challenges encountered in the present study and outlining potential avenues for future research.

2. Comprehensive Review of Game Theory in the Literature

2.1. The Concept of Game Theory

In exploring Game Theory within this study, we explore several foundational concepts elucidated in reference [56]. A game is an interactive model encompassing two or more groups participating in strategic interactions. Within these games, the entities known as players take on the role of decision-makers, each representing various entities ranging from individuals to groups or even abstract concepts. The state of the game is defined as the collection of all conceivable conditions under which the players engage, setting the stage for their strategic interplay.
Players are faced with a selection of actions, each representing the possible decisions or moves available to them within the various states of the game. These actions lead to outcomes that are quantified in terms of payoffs—a numerical value assigned to the results of the players’ actions, indicative of the gains or losses accrued as the game progresses. Strategies then emerge as comprehensive plans of action tailored to the players’ objectives and the circumstances they face within the game.
A pivotal concept in Game Theory is that of equilibrium, where players, recognizing their interdependence, see no benefit in unilaterally changing their strategy as it could potentially lead to a less favorable payoff.
In sum, these concepts are the building blocks of Game Theory, providing a framework to model and analyze strategic interactions within complex systems. The section concludes that understanding these strategic frameworks is crucial not only for theoretical purposes but also for practical applications where decision-making processes are influenced by the actions and reactions of various stakeholders within a system. The equilibrium concept, in particular, serves as a cornerstone for predicting behaviors and outcomes, thereby informing the development of strategies in diverse fields ranging from economics to political science.

2.2. Introducing the Different Classes of Strategies

In Game Theory, two types of strategies are employed: pure and mixed strategies [57,58].
Pure Strategy: In this approach, players make definitive decisions for every possible game state. Each player’s strategy consists of a set of pure tactics, and all participating players aim to optimize their strategies. The game score remains equal for all players in this case. Numerous studies have leveraged pure strategies within the area of Game Theory [59,60,61,62].
Mixed Strategy: A mixed strategy involves a probabilistic blend of pure strategies and finds applications in various studies across different domains [63]. In this approach, a player randomly selects a pure strategy, and players have the flexibility to employ multiple mixed strategies, even if they have a limited set of pure strategies. It is important to note that, in a specific scenario, a pure strategy aligns with a mixed strategy when the probability of choosing a specific pure strategy equals 1, with the probability of selecting other strategies set at 0. Additionally, players can opt for either mixed or pure strategies depending on whether they face deterministic or probabilistic situations, respectively.

2.3. Nash Equilibrium

A ‘Nash Equilibrium,’ in essence, represents a situation in which none of the participants have an incentive to deviate from their chosen strategies, even in the absence of any formal rules or enforcement. To illustrate, consider two players, Alice and Bob, each selecting strategies X and Y, respectively. In this context, (X, Y) is termed a ‘Nash Equilibrium’ if, when Alice has no alternative strategies, sticking with X maximizes her payoff in response to Bob’s choice of Y. Likewise, Bob, in the absence of alternative strategies, finds Y to be the optimal choice for maximizing his payoff in response to Alice’s selection.
Building on the foundational principles of Game Theory as applied to our initial two-player game with Alice and Bob, we extend the scenario by introducing two more players—Carol and David—thereby transforming the dynamic into a more complex four-player match. In this expanded setting, the strategy profiles (X, Y, Z1, Z2) represent the decisions made by Alice, Bob, Carol, and David, respectively. In this context, a ‘Nash Equilibrium’ is a strategic configuration where no player can unilaterally improve their outcome by choosing a different strategy, given the methods chosen by all other players.
Here, X stands for the optimal strategic decision for Alice, premised on the assumption that Bob, Carol, and David are adopting strategies Y, Z1, and Z2, respectively. Similarly, Y is Bob’s optimal response when Alice chooses X and Carol and David adhere to Z1 and Z2. The variables Z1 and Z2 are particularly noteworthy as they represent the best response strategies for Carol and David, respectively. Z1 is Carol’s best response to the combination of strategy (X, Y, Z2), while Z2 is David’s best response to the strategy (X, Y, Z1).
By explaining the role of Z1 and Z2, we clarify their function within the Nash Equilibrium concept. These variables account for the additional layers of complexity introduced by more than two players in the game. Including Carol and David in the game matrix necessitates a recalibration of strategies for all players, ensuring that the equilibrium encapsulates the best possible strategy for each player in response to the others. This equilibrium, therefore, is a delicate balance where each player, considering the strategies of all others, concludes that they are better off sticking to their current strategy rather than changing course. This interplay of strategic decisions lies at the heart of Nash Equilibrium in a multiplayer game context.
In contemporary terms, the concept of ‘Nash Equilibrium’ is precisely defined with regard to mixed strategies, wherein participating players opt for a ‘probability distribution over possible pure strategies’ [64,65]. The notion of a ‘mixed-strategy equilibrium’ was originally introduced by John von Neumann and Oskar Morgenstern in their seminal 1944 work [66]. They demonstrated that a ‘mixed-strategy Nash Equilibrium’ exists in all possible zero-sum games featuring a finite set of actions [67]. A zero-sum game, in theoretical terms, can be described as follows: one player’s gain is balanced against the other player’s loss, resulting in a total payoff summing to zero. Furthermore, cooperation between these two players is absent [68,69,70,71,72]. The mathematical representation of the ‘Nash Equilibrium’ concerning a zero-sum game is subsequently presented in Section 3.3 through definitions 8 and 9.

2.4. Game Classification

Game classification is based on several properties in Game Theory [56]. Considering the nature of the decision-making problem, the proper class of game is required to be selected to solve a problem. In general, the games can be categorized into three classes. These three classes are (i) Static/Dynamic Games, (ii) zero-sum or non-zero-sum Games, and (iii) Cooperative/non-cooperative Games.

2.4.1. Static/Dynamic Games

In a static game, players make decisions without knowledge of the choices made by other players, meaning that all players make their decisions simultaneously in the static game [73]. Authors in previous studies [74,75,76] have employed static games in their research. Conversely, in a dynamic game, players can take into account the decisions made by others when making their own choices, implying that all players do not necessarily make decisions simultaneously in dynamic games. A static game can be seen as a specific case within the broader category of dynamic games [77]. In dynamic games, some actions may occur simultaneously, while others can unfold at different time intervals. Several researchers have explored static games in their studies, including examples by [78,79,80,81,82,83,84,85].

2.4.2. Zero-Sum Games

The primary focus of our current study is a category of games where the overall score remains constant throughout the game [86]. In these games, there are no score increases or decreases during gameplay. Instead, one player’s gain corresponds directly to another player’s loss. In essence, in a zero-sum game, there is always a loser for every winner, making it inherently a win–lose game. This particular aspect of Game Theory has found application in numerous works across diverse domains [87,88,89,90,91]. In Section 3.3, we explore the explanation of zero-sum games, which are utilized for ranking failures in the FMEA procedure. Conversely, a non-zero-sum game is one where all players can benefit. In these games, the total sum of profits and losses is either greater or less than zero. Scholars from various fields have explored non-zero-sum games in their research endeavors [92,93,94].

2.4.3. Cooperative/Non-Cooperative Games

A non-cooperative game is characterized by players pursuing their individual profit maximization without cooperation from others at the outset of the game [56]. This class of games places a primary emphasis on the strategies employed by individual players. Non-cooperative games have found extensive use in various applications across different domains [95,96,97,98]. In contrast, cooperative games involve a coalition of players from the same group or union working together to maximize their collective gains. For instance, if we consider a set of players {A, B, C, D, E, and F}, there can be three different player unions, such as {{A, B, C}, {D, E}, and {F}}, where each union aims to maximize their combined benefits. Similarly, cooperative games have been extensively applied in the literature across diverse applications [99,100,101].

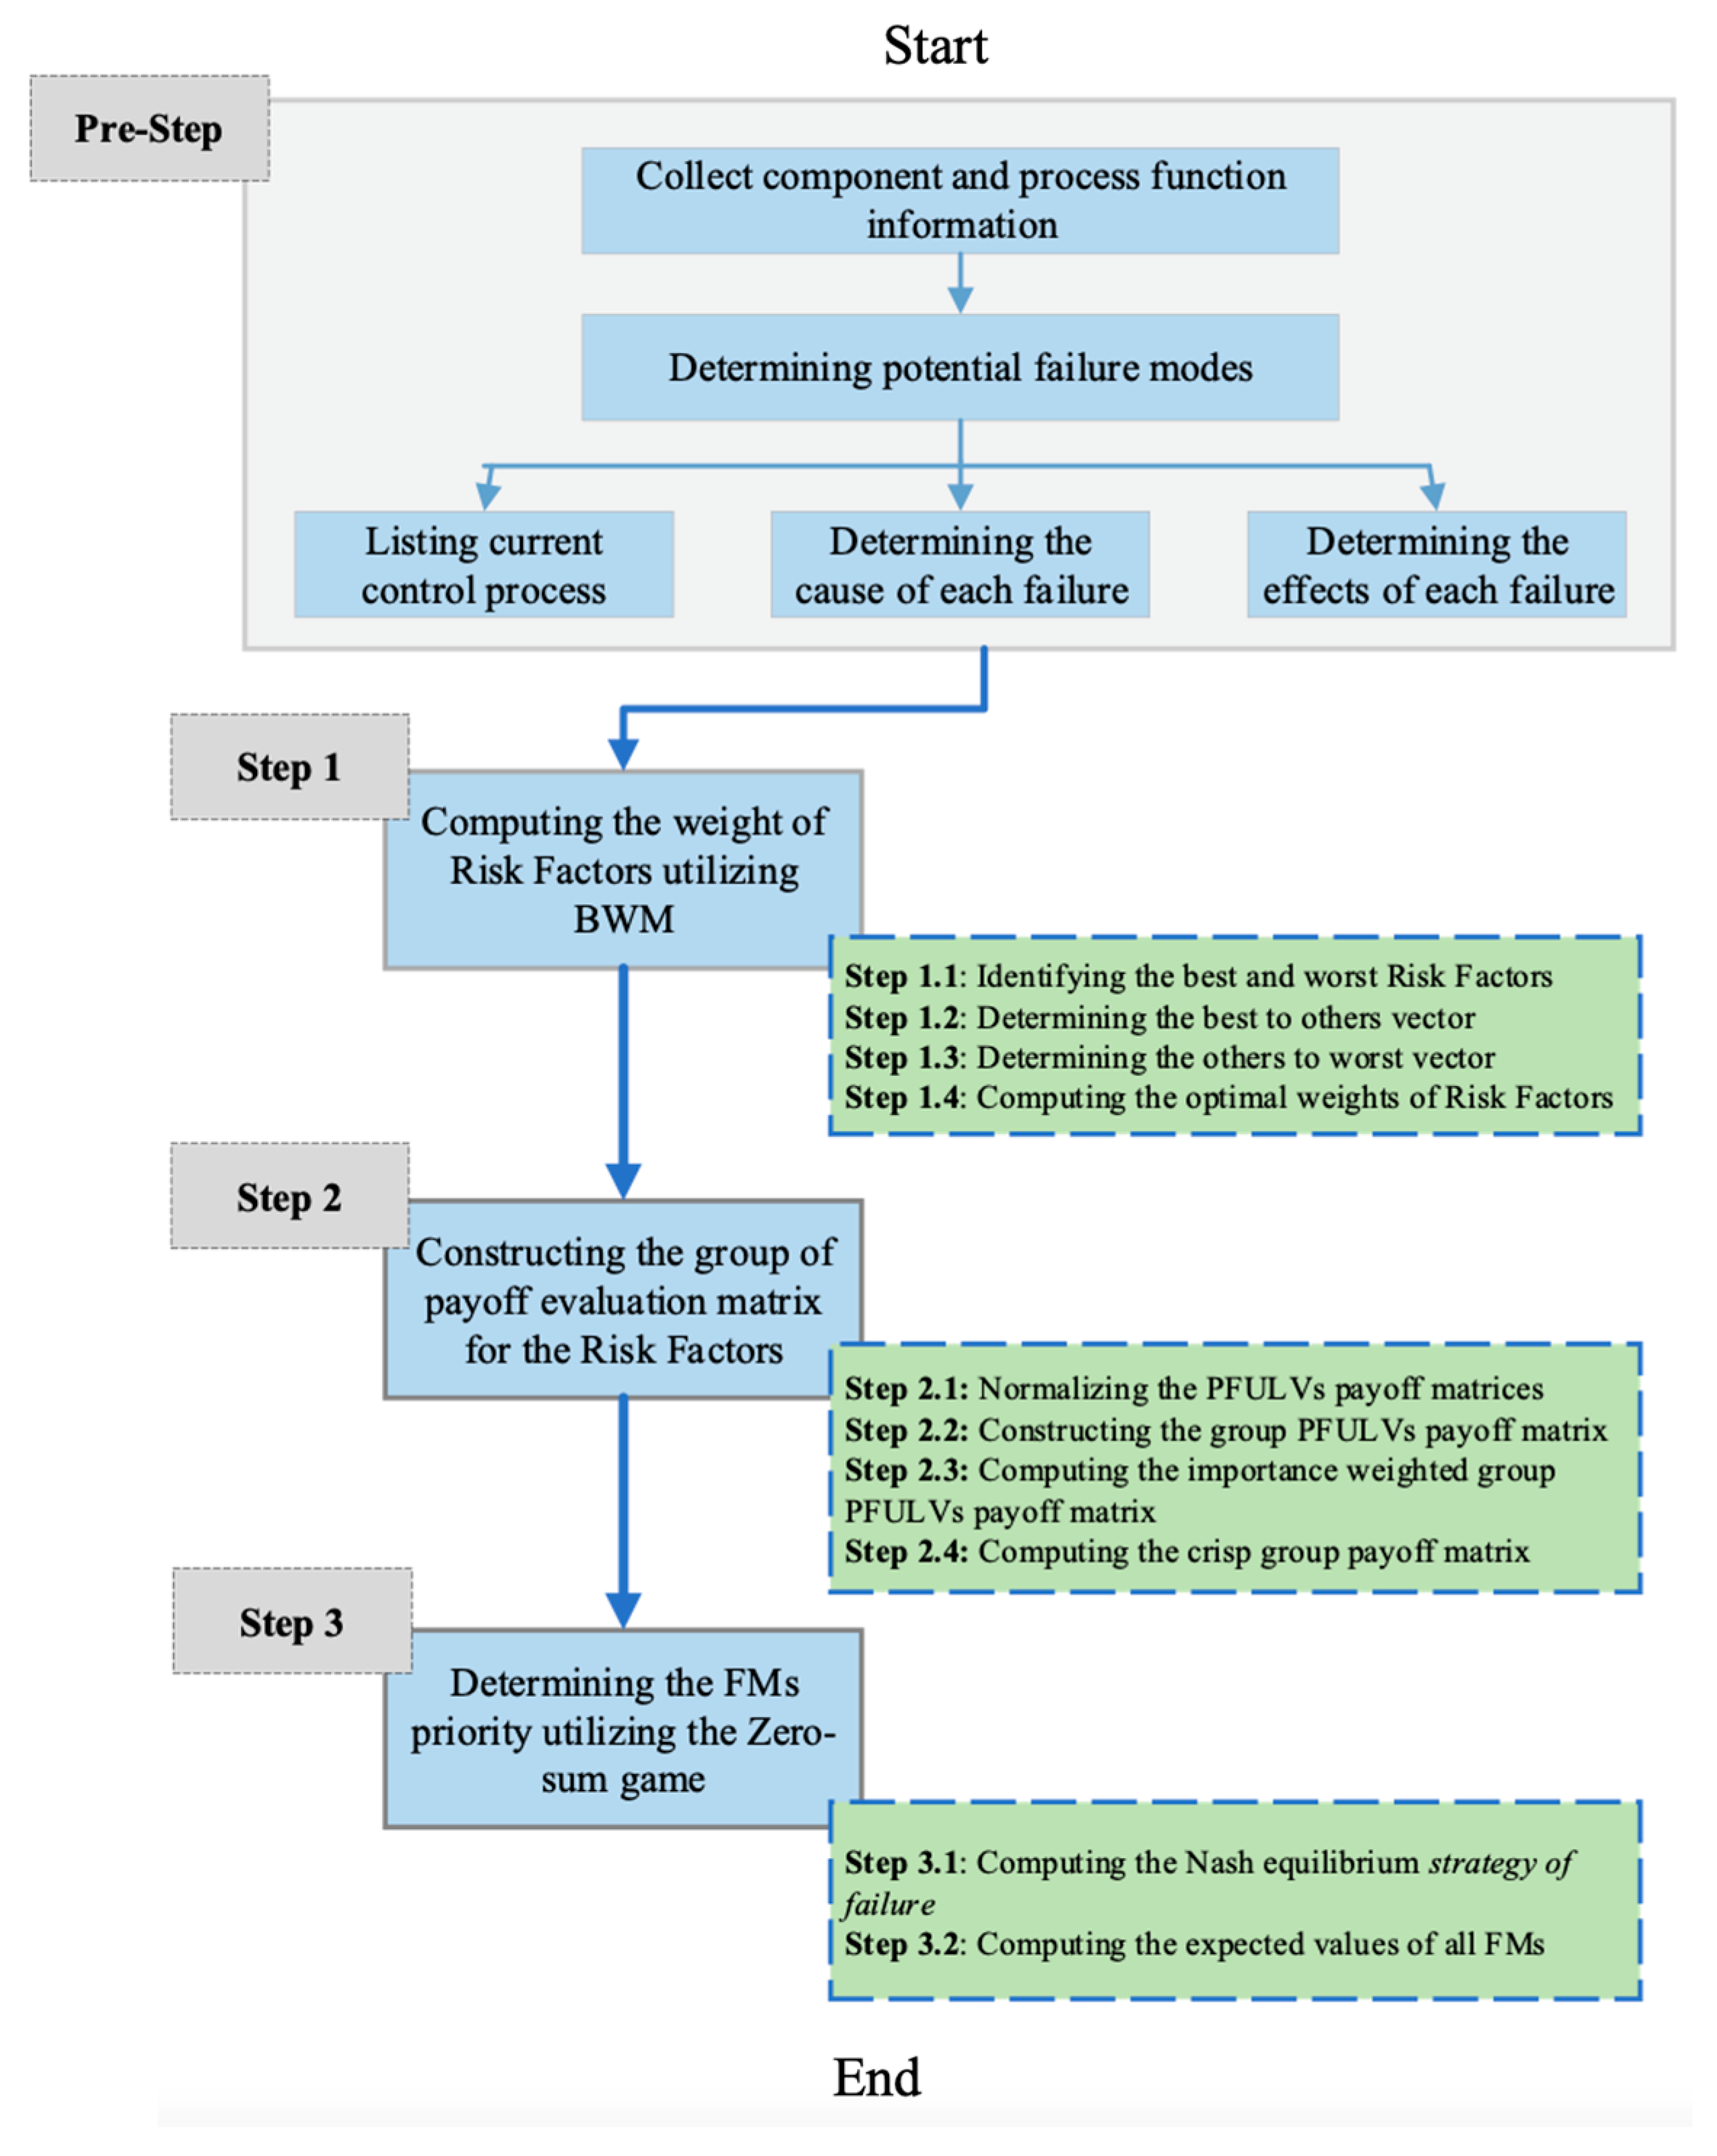
3. Proposed Methodology

This research introduces a comprehensive and reliable framework designed to determine consistent risk priorities for various failure modes, as depicted in Figure 1. This framework is structured into three pivotal stages:
  • Pre-step: The process of collecting all necessary information about the system under investigation is a meticulous endeavor that forms the bedrock of our research. It involves a comprehensive review and assimilation of data, encompassing structural details, operational dynamics, historical performance metrics, and contextual factors that influence the system. This critical step requires a multi-faceted approach, engaging with various stakeholders for insights, examining relevant documentation, and utilizing analytical tools to capture the complexities of the system. Such thorough data collection ensures a robust foundation upon which meaningful analysis can be performed, hypotheses can be tested, and accurate conclusions can be drawn, ultimately contributing to the credibility and reliability of the research outcomes.
  • Step 1: Assessing the Weight of Risk Factors: In this foundational stage, the focus is on quantifying the relevance of different risk factors. Utilizing the BWM methodology [102], we gauge the importance weights tied to the severity, occurrence, and detection of said risk factors.
  • Step 2: Formulating the Payoff Evaluation Matrix: After ascertaining the importance weights, the next step is the formulation of the payoff evaluation matrix. This matrix is crafted based on insights and evaluations from an expert panel of decision-makers. To address the inherent uncertainties, this phase incorporates Pythagorean fuzzy uncertain linguistic variables.
  • Step 3: Determining Risk Priorities of Failure Modes: The zenith of our framework is to present a detailed assessment of risk priorities associated with distinct failure modes. In this context, a zero-sum game methodology is leveraged to pinpoint the optimal strategies for both scenarios involving failure modes and those without.
Preceding these primary stages is an essential preliminary step. Here, a meticulous collection of all pertinent data related to the process in focus is undertaken. This leads to the identification of potential failure modes. For each failure mode pinpointed, an exhaustive analysis is carried out. This includes a rigorous review of control measures, the underlying causes, and the possible outcomes of each mode. Within this framework’s scope, it is imperative to understand “failure” as a situation where a crucial function or procedure does not meet the expected standards [103].
Our conception of risk factors is aligned with the standard definitions found in widely recognized frameworks and guidelines in risk assessment and management. Specifically, we adhere to the reports and classifications of risk factors outlined by industry standards such as ISO 31000, which provides principles and generic guidelines on risk management. Per these standards, risk factors in our study are identified through a systematic process involving hazard identification, risk analysis, and risk evaluation.
Each risk factor is categorized into one of three primary aspects:
  • Severity (S): This refers to the potential impact or consequences of a failure mode on the system’s functionality, the environment, or the end-users. It measures the extent of harm or disruption that could result from the failure.
  • Occurrence (O): This dimension assesses the likelihood or frequency of a particular failure mode occurring. It estimates the probability that the risk will materialize based on historical data, predictive models, or expert judgment.
  • Detectability (D): Detectability evaluates how easily a failure mode can be discovered before it leads to an operational failure. This involves assessing the effectiveness of current detection processes or control measures.
By employing these three dimensions, we can systematically quantify and prioritize risks, ensuring that the most significant chances—those likely to have the greatest impact, which are the most probable, and are the hardest to detect—are managed with appropriate urgency and resources.
Throughout this manuscript, we consistently apply this tripartite model of risk factors to analyze and evaluate the potential failure modes in the system under study. This approach allows us to construct a risk profile that is comprehensive, refined, and tailored to the specific operational context of the system, thereby facilitating informed decision-making and effective risk management.
Let us, for an FMEA worksheet, take a set of failure modes a F M i   = F M   1   , F M   2   , F M   3   , , F M   i   , which is known in FMEA procedure as the “strategy of failure” for l number of decision-makers. In addition, let us take D M = D M 1 , D M 2 , D M 3 , , D M   l   , as a set of risk factors, R F   i = S   F M   i   , O   F M i   ,   D   F M i   as a “strategy of success”, and ω   j   = ω   1   , ω   2   , ω   3   ,   , ω   n   as the importance weight of decision-makers based on their quality profile in which 0 ω   j   1 and   j = 1     n   ω j   = 1 .
Thus, all employed decision-makers share their individual payoff judgments of F M i   regarding the risk factors ( R F   j ) using Pythagorean fuzzy uncertain linguistic variables. In addition, the l payoff matrices can be derived from P   k   = p   i j     k     m × n   ( k = 1 ,   2   , , l ) , where, p   i j     k   = S   θ   i j     k     , S   τ   i j     k     , ( μ   i j   k , υ   i j   k ) , and S   θ   i j     k     , S   τ   i j     k     is the uncertain linguistic assessment. Uncertain linguistic assessment obtained from the decision-makers over F M   i with respect to the risk factors R F j collected from decision-maker l according to the linguistic term set P = S   0 , S   1 , , S   g . According to the obtained outcomes, a zero-sum game between failure and success can be demonstrated as B = Failure , Success , F M , R F , P . In the subsequent sections, we present a detailed overview of the comprehensive processes involved in the proposed FMEA method. We explore the intriguing perspective of viewing FMEA through the lens of a zero-sum game, acknowledging its practical implications. In a noteworthy study by [69], Game Theory was harnessed to rank alternative solutions in the context of emergency decision-making. In light of this, we adopt the premise that FMEA can be framed as a zero-sum game problem, and proceed to outline our methodology.
How does the proposed model consider the barriers to mitigation and prevention? Our model is conscious of the obstacles that can hinder effective risk mitigation and prevention, particularly in complex systems. It is structured to capture these barriers within the initial pre-step and throughout the framework by integrating stakeholder feedback, historical data, and expert judgment. This holistic approach ensures that the risk prioritization identifies the most critical risks and the factors that may impede successful intervention. By encompassing these barriers in our payoff evaluation matrix and subsequent analysis, our model offers a dynamic and realistic platform for risk management that is sensitive to the obstacles inherent in the practical application of risk mitigation and prevention strategies.
It should be added that, in the proposed methodology, while we adhere to the traditional FMEA framework that incorporates risk variables such as severity, occurrence, and detectability, we also recognize the crucial gap that exists between detecting a failure mode and effectively mitigating or preventing it. The detectability variable quantifies the likelihood of identifying a failure mode before it manifests into a functional failure, yet it does not encompass the subsequent processes of mitigation and prevention.
To bridge this gap, our model enhances the conventional FMEA by embedding additional evaluative dimensions that assess the system’s readiness and capability to respond to a detected failure mode. We introduce a ‘Response Efficacy’ variable that complements the detectability score by measuring the effectiveness and timeliness of the mitigation or prevention strategies that are, or can be, put in place once a failure mode is detected. This variable considers factors such as the availability of resources, the agility of the response system, the presence of backup systems, and the preparedness of personnel to implement corrective measures.
Furthermore, our model operationalizes this ‘Response Efficacy’ assessment by integrating Pythagorean fuzzy uncertain linguistic variables, which allow for a fine and flexible quantification of risk management capabilities. Decision-makers can thus express varying degrees of confidence in the system’s ability to handle potential failures, accommodating real-world systems’ inherent uncertainties and complexities.
The proposed methodology provides a more comprehensive view of the risk landscape by incorporating ‘Response Efficacy’ as a distinct factor within the risk priority calculations. This ensures that the FMEA identifies and ranks failure modes based on their detectability and the system’s overall preparedness to address and neutralize risks effectively. It allows for a more informed and holistic risk management approach, where the end goal is not merely to detect risks but to be well-equipped to manage them adeptly. This advancement in the methodology acknowledges that the true measure of a system’s resilience lies in its capacity to respond to and recover from disruptions, thus offering a more accurate and actionable assessment of risk priorities.

3.1. Computing the Importance Weight of Risk Factors Utilizing BWM

The BWM offers a promising alternative to the Analytic Hierarchy Process (AHP) for calculating the importance weights of risk factors [102,104]. BWM requires fewer data comparisons compared to AHP, yielding more robust and consistent results in pairwise comparisons. BWM techniques have found wide-ranging applications across various domains, as evidenced by [105,106,107,108]. In the context of this study, we employ BWM to determine the importance weights of three distinct risk factors—Severity, Occurrence, and Detection—within the framework of FMEA. In the current state of research, numerous scholars [109,110,111,112,113,114] have explored ways to integrate BWM with FMEA, primarily to (i) assess the importance weights of risk factors and (ii) assign weights to failure modes while subsequently ranking them. In line with these endeavors, our motivation lies in integrating the BWM tool with FMEA to ascertain the importance weights of the risk factors under examination in this study.
The procedure of BWM is briefly explained as follows:
(i)
Identifying most of the minor significant risk factors. The most critical risk factor, R F B , and the least important risk factor, R F W , have to be determined by decision-makers’ opinions from the known n risk factor. A fine approach is employed in the methodology proposed to discern the spectrum of risk factors within a system, extending from the most to the least significant. The criticality of these factors is determined through a qualitative analysis led by decision-makers who are well-versed in the intricacies of the system at hand. Recognizing the most critical risk factor denoted as R F B , and the least significant one, R F W , is pivotal in establishing a hierarchy of risks that guides the focus of risk management efforts.
Considering less significant risk factors in the analysis is both strategic and practical. While these factors may have a lower impact on the system, their cumulative effect or impact under specific conditions can be non-trivial. By including these minor factors, decision-makers can ensure a comprehensive risk assessment, leaving no potential vulnerability unaddressed. This inclusion aligns with the principles of thoroughness and precaution in risk management, especially in complex systems where seemingly minor risks can propagate or interact with other factors to cause significant issues.
To clarify the process, decision-makers typically leverage tools such as FMEA to evaluate and rank the criticality of risk factors. However, the initial identification of these factors often relies on their expertise and experiential judgment. The FMEA tool then provides a structured framework to analyze the identified factors, quantifying their severity, occurrence, and detectability to arrive at an RPN. This number assists in objectively determining the criticality of each risk factor.
In practice, achieving consensus among decision-makers on the significance of risk factors can be challenging, mainly when relying on qualitative assessments. To mitigate this, our model incorporates mechanisms for reconciling differing opinions, such as employing a Delphi method or consensus-building workshops. These methods facilitate structured communication and negotiation, allowing for the emergence of a collective judgment on the risk factors’ criticality. In instances where consensus is elusive, the model adapts by assigning possible values to each risk factor, reflecting the spectrum of expert opinions. This range is then utilized in sensitivity analyses to determine how variations in risk criticality assessment could influence the system’s overall risk profile. Such an approach ensures that the model remains robust and applicable despite subjective variability, thus maintaining its utility and relevance in real-world risk management scenarios.
(ii)
Assessing the priority of the most critical risk factor relative to others. Next, the group of decision-makers collaboratively express their judgments concerning the significance of the primary risk factor compared to the remaining risk factors, utilizing the established nine-scale table in the existing literature. Additionally, we calculate the vector representing the best-to-others (BO) preference, which is defined as R F ,   k = 1 ,   2 ,   3 , , l , as follows:
R F   B O     k   = ( R F   B 1     k   , R F   B 2     k   , , R F   B n     k   )
where R F B j   k   is the opinion of the R F B   over the R F   j   , and   R F   B B   = 1 . Consider that the l decision-makers’ importance weight are equal. Hence, l best-to-others vectors have the possibility to be further combined into a best-to-others vector R F B O   = ( R F   B 1   , R F   B 2   , , R F   B n   ) using the following equation:
R F   B j   = R F   B j     k     l   ,   j = 1 ,   2   , , n
(iii)
Computing the preference of the other risk factor over the most critical risk factor.
Similarly, l others-to-worst vector R F   O W ,   f o r   k = 1 ,   2 ,   3 , , l is computed by comparing to the other risk factor over the worst risk factor using nine-scale, as in the following equation:
R F   O W     k   = ( R F   1 W     k   , R F   2 W     k   , , R F   n W     k   )
where R F j W k is the judgement of the R F j over the R F W , and R F W W = 1 . Therefore, l other-to-worst vectors can be combined into a worst-to-others vector R F O W = ( R F 1 W , R F 2 W , , R F n W ) using the following equation:
R F   j W   =   R F   j W     k     l ,   j = 1 ,   2 , , n
(iv)
Calculate the optimum risk factors’ importance weights.
In BWM, the ratio of W B W j and W j   W W is followed by W B   W j = R F B j and W j   W   W = R F   j W   . For satisfying the above-mentioned conditions, a resolution must be determined by maximizing the value of W B   W j R F B j   and minimizing the value of R F j W   W j   W W .
Therefore, the subsequent mathematical programming model determines the optimum risk factors’ weight:
Model 1:
min max W B W j R F B j , R F j W W j W W ,
Subject to.
j = 1 n w j = 1 ,
w j 0   , j = 1 , 2 , n .
Model 1 can be re-established into Model 2 as a linearization process:
min ξ
Subject to.
W B W j R F B j ξ ,
R F j W W j W W ξ ,
j = 1 n w j = 1 ,
w j 0 , j = 1 , 2 , n .
The optimum risk factors’ importance weights are computed by solving Model 2 and are signified as w   *   = w   1     *   , w   2     *   , , w   n     *   .
It is worth noting that in the final step, it is also possible to determine the aggregated optimal importance weights. This implies that the optimal importance weights for each risk factor are initially derived from individual decision-makers’ perspectives. Subsequently, factoring in the significance of each decision-maker’s input, we arrive at the aggregated importance weight for the risk factors.
(v)
Calculate the consistency ratio of results
To calculate the consistency value, first, it is essential to obtain the consistency ratio as follows:
C R = ξ   *     C I
where C R is recognized as the consistency index according to the maximum value of ξ [102]. As much as the value of C R is small, the results would have the better consistency. In the current study, C R 0.2 is acceptable and there is in this case no need to further revise the process interactively.

3.2. Constructing the Group of Payoff Evaluation Matrix Utilizing Pythagorean Fuzzy Uncertain Linguistic Variables

Zadeh [115] argues for the concept of linguistic variables and their practical applications. Linguistic variables are linguistic expressions consisting of one or more words that convey the intrinsic value of a variable. This approach assists decision-makers in addressing ambiguities and uncertainties in data, particularly in complex decision-making scenarios where precise numerical values may be challenging to define [116,117]. Let us take β = β   0 , β   1 , , β   g as a finite set, and completely well-ordered discrete linguistic terms having odd cardinality, in which β i denotes a possible value for a linguistic term [69,118,119,120].
In 2013, Yager [121] introduced the concept of Pythagorean fuzzy sets (PFS) to fulfill a particular condition, wherein the sum of the squares of membership and non-membership degrees is constrained to be less than or equal to one [122,123,124,125]. We will now go into the fundamental concepts, definitions, and subsequent advancements related to PFS.
Definition 1
[126]. Let us consider that there is a discourse universe, as follows:
p = < x , u p x , v p x > | x X
where u p : X [ 0,1 ] illustrates the “membership degree”, and v p : X [ 0,1 ] illustrates the “non-membership degree” of the element x X to the set p , satisfying 0   u p x   2   + v p x   2   1 . The hesitancy or indeterminacy degree is defined as   π ˙ p ( x ) = 1 u p x   2   v p x   2   . Zhang and Xu [127] called u p x , v p x Pythagorean fuzzy numbers (PFNs). PFNs are illustrated by p = u p , v p to make PFS simpler to comprehend [128,129].
Definition 2
[130]. Let us take  X  as a discourse universe where  β   θ ( x ) ,   β   τ ( x )  indicates an uncertain linguistic variable. A Pythagorean fuzzy uncertain linguistic variable  P ~  in  X  can be defined as follows:
P ~ = X ,   β   θ ( x ) , β   τ ( x ) ,   u   P ~   x , v   P ~   x   | x X  
where u   P ~   x , v   P ~   x is a PFS, which denotes the membership and non-membership degree of x X , respectively, into the β   θ ( x ) , β   τ ( x ) .
In addition, the indeterminacy degree of x X is defined as π ˙ P ~ ( x ) = 1 u P ~ x 2 v P ~ x 2 into the linguistic variables β θ ( x ) , β τ ( x ) . For easier comprehension, P ~ x = β θ ( x ) , β τ ( x ) , u P ~ x , v P ~ x is named Pythagorean fuzzy uncertain linguistic variables, which further can be denoted as P ~ = β θ , β τ , u P ~ , v P ~ .
Definition 3
[130,131]. Let us take  P ~   1 = β   θ   1   , β   τ   1   , u   P ~   1   , v   P ~   1      and    P ~   2 = β   θ   2   , β   τ   2   , u   P ~   2   , v   P ~ 2      as two different Pythagorean fuzzy uncertain linguistic variables. In such case, some important operational laws of Pythagorean fuzzy uncertain linguistic variables can be defined as follows:
P ~   1   P ~   2   = β   θ   1 + θ   2 , β   τ   1   + τ   2   ,   u   P ~   1     2   + u P ~   2     2   u P ~   1     2   u P ~   2     2   ,   v   P ~   1   v   P ~   2  
P ~   1 P ~   2 = β   θ   1 θ   2 , β   τ   1 τ   2 , u P ~   1   u   P ~   2   , v   P ~   1     2   + v P ~   2     2   v P ~   1     2   v P ~   2     2    
γ P ~   1 = β   γ θ   1   , β   γ τ   1   , 1 1 u   P ~   1   2     γ     , v   P ~   1   γ  
P ~ 1 γ   = β   θ   1 γ , β   τ   1 γ , u   P ~   1   γ   , 1 1 v P ~   1   2     γ  
Definition 4
[130,132]. Let us take  β =   β   0 ,   β   1 , ,   β   g  as linguistic set terms and  P ~ = β   θ , β   τ , u , v  as Pythagorean fuzzy uncertain linguistic variables. Therefore, the score function of  P ~  can be determined as follows:
S P ~ = θ + τ   4 g   ( u   2 + 1 v   2   )
Moreover, the accuracy function of P ~ can be determined as follows:
A P ~ =   θ + τ   2 g   ( u   2   + v   2   )
Definition 5
[130,132]. Let us take  P ~ 1   = β   θ   1   , β   τ   1   , u P ~   1   , v P ~   1      and  P ~ 2   = β   θ   2   , β   τ   2   , u P ~   2 , v P ~   2    as two different Pythagorean fuzzy uncertain linguistic variables. In such a case, the “Hamming distance” between  P ~   1  and  P ~   2  can be determined as follows:
d ( P ~   1   , P ~   2   ) =   1     6 g   θ   1   u P ~   1   2   θ   2 u   P ~   2   2   + θ   1 v   P ~   1 2   θ   2 v P ~   2 2   + θ   1 π ˙   P ~   1 2   θ   2 π ˙   P ~   2 2   + τ   1 u   P ~   1 2   τ   2 u   P ~   2 2   + τ   1 v   P ~   1 2   τ   2 v   P ~   2 2   + τ   1 π ˙   P ~   1 2   τ   2 π ˙   P ~   2 2                
Definition 6
[132]. Let us take  P ~  as the collection of Pythagorean fuzzy uncertain linguistic variables;  P ~   j   = β   θ   j   , β   τ   j   , u   P ~   j   , v   P ~   j     , where  j = 1 ,   2 , , n , and the “Pythagorean fuzzy uncertain linguistic prioritized weighted averaging operator” is  P ~ n P ~ . In such as case, the “Pythagorean fuzzy uncertain linguistic prioritized weighted averaging operator” can be defined as follows:
P W A   P ~   1   , P ~   2   , , P ~   n   = φ   j = 1     n     T j     j = 1     n   T j     θ   j   , φ   j = 1     n   T   j     j = 1     n   T j     τ   j   , 1 j = 1   n ( 1 u   P ~   j   2   )   T   j   j = 1   n T j   ,   j = 1   n   ( v P ~ j     )   T j j = 1   n T j
Up to this point, the preliminary PFS and Pythagorean fuzzy uncertain linguistic variables have been explained. Next, the four steps to construct the group payoff evaluation matrix are further described as follows:
Step 1: Normalizing the Pythagorean fuzzy uncertain linguistic variables payoff matrices
The payoff-matrices-based Pythagorean fuzzy uncertain linguistic variables P k   = p   i j     k     m × n into P ~ k     = p ~   i j     k     m × n is normalized as follows:
p ~   i j     k   = S   θ ~   i j     k     , S   τ ~   i j     k       , ( μ ¯   i j     k   , υ ¯   i j     k   ) = S θ   i j       k       , S τ   i j       k     , ( μ   i j   k , υ   i j   k )         F o r   b e n e f i t   c r i t e r i a ,   S   g θ   i j     k       , S   g τ   i j     k     , ( μ   i j   k , υ   i j   k )     F o r   c o s t   c r i t e r i a ,
Step 2: Constructing the group Pythagorean fuzzy uncertain linguistic variables payoff matrix
The normalized Pythagorean fuzzy uncertain linguistic variables P ~ k   = p ~   i j     k     m × n payoff matrices, where k = 1 ,   2 ,   ,   l can be transferred into a single Pythagorean fuzzy uncertain linguistic variables payoff matrix R   = r   i j     m × n   by utilizing the modified “Pythagorean fuzzy uncertain linguistic prioritized weighted averaging operator” as follows:
r   i j   = P W A   P ~   i j     1   , P ~   i j     2   , , P ~   i j     l   = φ     k = 1     t   w   k   T   i j   k   k = 1   t T   i j   k θ   i j ´ , φ     k = 1     t w   k   T   i j     k     k = 1     t   T   i j     k   τ   i j   ´ , 1   k = 1     t   ( 1 w   k   μ ´   i j     k   2   ) T   i j     k     k = 1     t   T   i j     k   ,   k = 1     t   ( w   k   υ ´   i j     k   2   ) T   i j     k     k = 1     t   T   i j     k  
where T i j 1 = 1 , w k is the importance weight of decision-makers, and T i j k = h = 1 k 1 Φ ( p i j h ) for k = 1 , 2 , , l .
Step 3: Computing the importance weighted group Pythagorean fuzzy uncertain linguistic variables payoff matrix
In this step, the group Pythagorean fuzzy uncertain linguistic variables payoff matrix R   = r   i j   m × n is converted into the importance weighted group Pythagorean fuzzy uncertain linguistic variables payoff matrix R   ´ = r ´   i j     m × n as follows:
r ´   i j     = r   i j     w   j   *   ,   i = 1 ,   2 ,   , m   ;   j = 1 ,   2 ,   , n ,
where w   j     *   ( j = 1 ,   2 ,   , n ) is the importance weights obtained by utilizing BWM in Step 1.
Step 4: Computing the crisp group payoff matrix
The crisp group payoff matrix R ¯   = r ¯   i j     m × n can be determined as follows:
r ¯   i j     = P r   i j   = θ   i j   + τ   i j     4 g   μ   i j     2   + 1 υ   i j     2  
where i = 1 , 2 , , m and j = 1 , 2 , , n .

3.3. Determining the Risk Priority of Failure Modes Utilizing the Zero-Sum Game

Definition 7
[132]. A zero-sum game includes two  D M s  (players) and is formulated into a five-tuple as follows:
A = D M 1 , D M 2   ,   C D   , C N   , P
where C D = c i | c i C 1 0 , i = 1 m c i = 1 , i = 1 , 2 , 3 , , m , displays the mixed-based strategy set of D M 1 , C N = c ~ j | c ~ j C 1 0 , j = 1 n c ~ j = 1 , i = 1 , 2 , 3 , , n displays the mixed-based strategy set of D M 2 , and P denotes the payoff matrix of D M 1 . Note that D M 1 and D M 2 are the decision-maker and nature, respectively. Equation (16) can also be represented as follows:
B = F a i l u r e , S u c c e s s , F M , R F , P
where F M and R F repressing the set of failure modes and corresponding risk factors, respectively. P denotes the payoff matrix for failure modes.
Definition 8.
The payoff matrix is defined based on [133]. Consider that  ( c   i   , c ~   j   ) C   1   × C   2   , for  i = 1 ,   2 ,   3 , , m  is a strategy, where  c i  is the “strategy of failure” and    c ~ j  is the “strategy of success”. According to this point, for any strategies  ( c   i   , c ~   j   ) , assume that  P = ( p   i j )   m × n  denotes the payoff matrix according to the “strategy of failure”. Therefore, the payoff matrix of the “strategy of success” is equal to the  P .
For a zero-sum game, a strategy pair ( c   i     *   , c ~   j     *   ) will be the Nash Equilibrium point of B = F a i l u r e , S u c c e s s , F M , R F , P . According to this point, for a “strategy of failure”, we can construct Model 3 as follows:
Model 3:
m i n = i = 1 m c i ,
Subject to.
i = 1 m r ¯ i j c i 1 , j = 1 , 2 , 3 , , n ,
c i 0 ,   i = 1 , 2 , 3 , , m .
For D M 2 , Model 4 can be shown as follows:
Model 4:
m a x = j = 1 n c ~ j ,
Subject to.
j = 1 n r ¯ i j c ~ j 1 , i = 1 , 2 , 3 , , m ,
c ~ j 0 ,   j = 1 , 2 , 3 , , n .
As mentioned earlier, the Nash Equilibrium strategies of the “strategy of failure” and “strategy of success” are derived by c i * = ( c 1 , , c i , , c m ) and c ~ j * = ( c ~ 1 , , c ~ i , , c ~ n ) , respectively.
As a result, the modified strategies’ expected values c i   ( i = 1 ,   2 ,   3 ,   ,   m ) are determined as follows:
G i = c i * j = 1 n ( r ¯ i j c ~ j * ) i = 1 , 2 , 3 , , m
With respect to the G   i   ( G   i   0 ), the best strategy solution c i based on the maximum G i is obtained for priority of failure modes in the FMEA procedure. If G   i   = 0 , the row vectors associated with G   i   0 are disconnected from the payoff matrix, and subsequently, one must return to applying both Model 3 and 4. The remained strategies are similarly treated in order to obtain the failure modes’ risk priorities.

4. Application of Study

The proposed model is implemented in an example healthcare facility in a hypothetical metropolitan area. This hypothetical facility is dedicated to treating patients affected by severe and different health issues, and it faces unique challenges due to a fictitious high incidence rate and a fabricated shortage of medical service staff. Additionally, the facility is assumed to experience a mythical heavy daily patient flow and a growing number of severe cases requiring hospitalization, resulting in a shortage of available beds. The increased workload on fictional medical staff necessitates hypothetical frequent equipment and medical tool healthcare, which, if not managed effectively, could lead to an elevated number of confirmed cases and occupational accidents. Consequently, conducting a risk assessment for such complex hypothetical healthcare facilities is imperative.
Fictitious healthcare units in this study play a crucial role in healthcare settings as they eliminate all microorganisms from equipment and medical tools. This fabricated healthcare process consists of seven steps, including (i) decontamination, (ii) preparation, (iii) packaging, (iv) healthcare, (v) quality control, (vi) storage, and (vii) distribution. The process’s unpredictability and lack of structure stem from its reliance on fictional patient feedback. This fabrication process renders various instruments free of microorganisms within units.
The significance of the hypothetical problem at hand can be summarized as follows. This study represents the second iteration in developing the classical FMEA method for evaluating a complex healthcare unit in this hypothetical healthcare system. Managing such teams in this hypothetical scenario is challenging due to the risk of contagion and its high-risk nature. Any risk factor that emerges within this unit holds utmost importance as it can impact all other departments.
For instance, lapses in infection control, such as spreading infection through equipment due to an employee’s injury or a fabricated dry cough, can result in conditions persisting on medical tools, patients, and other healthcare staff. This transmission of infection has several negative consequences, including prolonging the duration of patient treatments, endangering patients with new risks, and increasing the number of confirmed cases, ultimately driving up healthcare costs. In the context of the fabricated hospital in our hypothetical study, all materials and equipment are assumed to be sterilized after each intensive care operation for patients with coronavirus disease.
Drawing upon insights from relevant literature [134,135], the collective wisdom of the authors, and the endorsement of healthcare system decision-makers, we have discerned a comprehensive set of 23 failure modes tailored to our specific case study. In adherence to the initial phase of our proposed model, we have diligently amassed all pertinent information pertaining to the healthcare unit within the hospital under scrutiny. This comprehensive compilation encompasses a detailed roster of control activities, causative factors, and the projected consequences associated with each identified failure mode, all of which are thoughtfully presented in Table 1.
In order to manage the identified failure modes in this study, a heterogeneous group of experts, including four different decision-makers, who have relevant experience and expertise in the health care system and have worked in healthcare units, help manage the identified failure modes in this study. Therefore, the four decision-makers D M = D M 1 , D M 2 ,   D M 3 , D M 4 are invited to evaluate the Severity, Occurrence, and Detection of identified failure modes. To achieve more realistic results, the importance weights of each decision-maker need to be obtained based on their individual decision-makers’ quality profile [136,137,138]. Decision-makers’ critical weight shows how much the final decision is close to her/his opinions. Thus, for our case, the importance weights of four decision-makers are 0.250, 0.275, 0.325, and 0.150, respectively.
In the first step, using BWM, the importance weight of risk factors is obtained. The results based on decision-makers’ evaluations are provided in Table 2. As an example, D M 2 evaluates the Severity and Detection as the best and worst risk factors, respectively. By utilizing nine scale-based factors, D M 2 gives his preference of the best risk factor as Severity over Occurrence and Detection into a best-to-others vector using Equation (1) as R F   B O   D M 2   = ( 1.000 ,   4.000 ,   8.000 ) . In addition, D M 2 gives his preference of Severity and Occurrence over the worst risk factor, Detection, into a worst-to-others vector using Equation (3) as R F   O W     D M 2     = ( 8.000 ,   4.000 ,   1.000 ) . Then, the optimal importance weight of risk factors is determined by solving Model 2, and the results are w D M 2     *   = 0.718 ,   0.205 ,   0.077 . By utilizing Equation (5), the C R value is obtained as 0.10, meaning that the results of study have a satisfactory consistency.
The four decision-makers to evaluate the risk factors (Severity and Occurrence) of 23 failure modes used the set of linguistic terms as Φ = φ   A   = Very   poor , φ   B   = Poor , φ C   = Slightly   poor , φ   D = Fair , φ   E   = Slightly   good , φ   F   = Good , φ   G   = Very   good , and for risk factor (Detection) as Φ = φ   A   = Very   good , φ   B   = good , φ   C = Slightly   good , φ D = Fair , φ E = Slightly   poor , φ   F   = poor , φ   G = Very   poor .
The Pythagorean fuzzy uncertain linguistic variables payoff matrix P k   = p   i j     k     23 × 3 ( k = 1 ,   2 ,   3 ,   and   4 ) provided by four decision-makers are shown in Table A1 in Appendix A. In the first step, the Pythagorean fuzzy uncertain linguistic variables payoff matrix is normalized using Equation (12) into P ~ k     = p ~   i j     k     23 × 3   , k = 1 ,   2 ,   ,   4 . In the second step, the normalized Pythagorean fuzzy uncertain linguistic variables payoff matrix P ~   k   is aggregated into a single payoff matrix R   = r   i j     23 × 3   , as presented in Table 3. Accordingly, the importance weight of risk factors is taken into account to construct normalized single-weighted payoff matrix R   ´ = r ´   i j     23 × 3 using Equation (14) and is tabulated in Table A2, Appendix A. In the last step, by utilizing Equation (15), the crisp single-weighted payoff matrix R ¯   = r ¯   i j     23 × 3 is computed as listed in Table A3, Appendix A.
Models 3 and 4 are conducted to resolve the Nash Equilibrium strategy. The Nash Equilibrium strategy is as follows: “ A i = ( F 1 = 0 , F 2 = 0 , F 3 = 0 , F 4 = 0 , F 5 = 0 , F 6 = 0 , F 7 = 0 , F 8 = 63.7 , F 9 = 0 , F 10 = 0 , F 11 = 0 , F 12 = 0 , F 13 = 0 , F 14 = 0 , F 15 = 0 , F 16 = 0 , F 17 = 0 , F 18 = 0 , F 19 = 0 , F 20 = 0 , F 21 = 0 , F 22 = 0 , F 23 = 0 ) and C j = ( 0 , 0 , 53.9 ) . The expected values of risk factors from optimizer are determined using Equation (18) as follows: “ G 1 = 0 , G 2 = 0 , G 3 = 0 , G 4 = 0 , G 5 = 0 , G 6 = 0 , G 7 = 0 , G 8 = 3.8 , G 9 = 0 , G 10 = 0 , G 11 = 0 , G 12 = 0 , G 13 = 0 , G 14 = 0 , G 15 = 0 , G 16 = 0 , G 17 = 0 , G 18 = 0 , G 19 = 0 , G 20 = 0 , G 21 = 0 , G 22 = 0 , G 23 = 0 ”.
Hence, among the identified failure modes, F 7 (“Increasing the level of burning”), F 11 (“Increasing the number of fallings, jamming, or tumbling”), F 23 (“Increasing allergic reactions among medical staff, particularly skin-based”), F 17 (“Increasing transmission of infections”), and F 14 (“Escalating transmission of infections”) emerge as the pivotal failure modes that warrant the decision-maker’s focused attention for subsequent intervention measures.
Subsequently, by eliminating G   i   0 , the assessment is continued, and the final ranking of failure modes is F 7 > F 11 > F 23 > F 17 > F 14 > F 16 > F 15 > F 1 > F 12 > F 4 > F 3 > F 12 > F 9 > F 22 > F 21 > F 10 > F 5 > F 8 > F 22 > F 13 > F 2 > F 19 > F 20 . It is evident that each of the failure modes has distinct rankings. For instance, in light of the global pandemic experience, revisions have been made to medical guidelines and safety protocols to diminish the likelihood of infection transmission, primarily through the adoption of personal protective equipment (PPE). In light of this development, it becomes apparent that F 13 has achieved a superior ranking compared to its previous conventional assessment.
To effectively prevent infection, it is crucial to follow recommended practices such as regular and thorough handwashing, avoiding touching one’s face, practicing appropriate respiratory etiquette, and maintaining physical distancing [132]. It is important to acknowledge that complete risk elimination may not be feasible for all individuals.
To bolster these primary measures, adopting a multi-pronged approach is beneficial in enhancing safety and reducing the likelihood of transmission:
  • Elevating the cleaning routines, with a special focus on surfaces and tools that undergo frequent handling.
  • Discouraging communal usage of equipment and supplies, thereby diminishing potential sources of contamination.
  • Designing a dynamic communication blueprint that adjusts to different risk thresholds, ensuring every employee is adequately informed and aligned with the latest safety protocols.
  • Curating a dedicated mental health support system, addressing the unique stresses and anxieties that may arise during such challenging times.
  • Amplifying environmental sanitation measures, emphasizing the disinfection of objects and surfaces that are in regular use.
  • Introducing protective installations, like clear Plexiglas barriers, at interaction points to reduce direct contact and safeguard both employees and visitors.
  • Optimally selecting and distributing personal protective equipment (PPE) after a meticulous risk evaluation, ensuring it is utilized effectively and safely.
  • Holding regular training workshops to impart knowledge about the correct methodologies for wearing and removing PPE without risking contamination.
  • Enhancing on-site surveillance and audit mechanisms to ascertain strict adherence to all safety guidelines.
  • Incorporating systematic temperature screenings and health evaluations at facility entrances, serving as preliminary checkpoints.
  • Promoting the use of touchless technologies where possible, such as automatic doors and touch-free payment systems.
  • Regularly updating and reviewing emergency response plans to address potential outbreak scenarios.
  • Encouraging telecommuting and remote work options to reduce the density of people in a confined space.
  • Facilitating virtual meetings and conferences as alternatives to in-person gatherings.
  • Providing well-ventilated spaces and considering upgrading air filtration systems to capture potential viral particles.
  • Educating and encouraging employees to stay home if they feel unwell or exhibit any symptoms.
These measures collectively contribute to a comprehensive approach to infection prevention and control.
Results from real-world evaluations in hospital healthcare units indicate that the prevailing risk assessment methods fall short, resulting in a notable number of accidents and mishaps. Many intervention strategies have primarily targeted failure modes with less critical risk priorities. However, our introduced method proves adept at pinpointing the truly vital failure modes, affirming its foundational logic. Notably, the insights gleaned from this method are not confined to the healthcare units examined. They hold potential for broad application, enhancing safety in myriad healthcare environments grappling with similar issues. By adopting the suggested corrective actions stemming from our findings, healthcare units can progressively lower their risk to a universally accepted or “As Low As Reasonably Practicable” (ALARP) standard. This methodology paves the way for fortified safety protocols in healthcare and comparable sectors.
The Nash Equilibrium strategy in our models, characterized by the state where each player’s strategy is optimally chosen against other players’ strategies, has been found to prioritize specific failure modes significantly. Particularly, failure modes like F 7, F 11, F 23, F 17, and F 14 are identified as critical intervention points, as denoted by nonzero values in our Nash Equilibrium strategy profile. These failure modes, which include diverse risks, such as ‘increased levels of burning’ to ‘escalating transmission of infections’, are highlighted for immediate attention due to their high impact on system safety and operational continuity.
In juxtaposition with major models in existing literature, our proposed model delineates a more granular and nuanced ranking of failure modes. For instance, while traditional FMEA might prioritize failure modes based solely on RPNs, our model integrates the Nash Equilibrium concept to refine this prioritization, considering the interplay of multiple decision-makers and their strategies. This allows for a dynamic assessment that can adapt to changing risk scenarios, a feature that is particularly pertinent in the wake of global health events such as the pandemic.
Moreover, applying our model extends beyond mere ranking, offering strategic intervention points. This is exemplified by the improved order of F 13, which correlates with the enhanced safety protocols in medical guidelines, particularly personal protective equipment (PPE). This response has been critical in managing infection transmission during the pandemic.
In practical terms, our model underscores the importance of proactive and preventive measures, as evidenced by the detailed, actionable strategies presented. These strategies range from heightened cleaning routines to implementing advanced surveillance mechanisms. Incorporating such comprehensive prevention and mitigation strategies reflects a significant leap from the detectability-focused assessments in traditional models.
Empirical evidence from the application of our model in hospital healthcare units reveals that while traditional risk assessments have led to interventions that focus on less critical failure modes, our model adeptly identifies those failure modes that, if unaddressed, could result in severe consequences. This assertive identification aligns with the objective to reduce risks to an ALARP level, ensuring that the safety measures implemented are theoretically sound and practically viable.
In contrasting our results with those derived from prevalent models, it is evident that our methodology offers a significant enhancement in pinpointing the failure modes that necessitate immediate and focused intervention. This comparative advantage is applicable to healthcare units and can be extrapolated to other domains where safety and risk management are paramount. The practical implications of this are profound, as adopting our model can lead to a tangible improvement in safety outcomes and a more rational allocation of resources towards mitigating the most significant risks. This discussion enriches the manuscript by providing a critical evaluation of the proposed model against the backdrop of existing methodologies, thereby elucidating its scientific contribution to the field of risk management.

5. Methodology Validations

Regarding the study of [139], the three following assessments are considered in the present study to partially validate the introduced decision-making approach:
  • Assessment 1: To ensure the dependability of a decision-making tool, it is imperative that the agency consistently upholds the superiority of the best alternative. This means that the tool should never replace the top-ranked alternative with one that is ranked lower, unless this substitution is made while considering the relative importance of each criterion’s variation. In other words, the tool should prioritize the best option unless there is a compelling reason, based on the specific criteria and their importance, to choose an alternative that is not the highest-ranked overall.
  • Assessment 2: Reliability in a decision-making tool necessitates adherence to the transitivity property. This property ensures that the tool maintains logical consistency in its decision-making process. If alternative A is preferred over alternative B, and alternative B is preferred over alternative C, then the tool should logically conclude that alternative A is preferred over alternative C. This consistency in decision outcomes is a fundamental characteristic of a reliable tool.
  • Assessment 3: In a dependable decision-making tool, when a complex decision problem is dissected into smaller components using the same tool for alternative prioritization, the combined prioritization of alternatives at the component level must align with the original prioritization of the undivided decision problem. This means that breaking down the decision into smaller parts should avoid inconsistencies or contradictions in the overall decision. In our particular approach, which involves risk assessments for failure modes, it is important to note that these assessments are interdependent. Therefore, assessment three should be exclusively conducted using our introduced approach for evaluating risk factors to maintain the integrity and consistency of the decision-making process.

5.1. Validity Examination of the Proposed Approach Using Assessment 1

To validate the effectiveness of the proposed approach, which combines Game Theory and FMEA within an advanced fuzzy environment, we begin with the first assessment. In this assessment, a non-optimal failure mode ( F M .12) is considered the worst and labeled as F M .12*. Let us assume that a group of decision-makers involved in this study provides their input on F M .12*, taking into account the risk factors (S, O, and D). By applying the same computational process outlined in this study, the resulting prioritization remains consistent: F 7 > F 11 > F 23 > F 17, with F M .12* still holding the highest priority among failure modes. This outcome underscores that the proposed approach does not alter the selection of the optimal failure mode when substituting a non-optimal one with the worst-case scenario. Consequently, the validity of the proposed approach is affirmed based on the first assessment. These findings extend to other non-optimal failure modes, such as F 16, F 15, F 2, and F 22, reinforcing the approach’s reliability in these cases as well.

5.2. Validity Examination of the Proposed Approach Using Assessments 2 and 3

To validate the methodology introduced in this study, we conducted the second and third assessments by dividing the original set of failure modes in FMEA into four smaller decision-making problems:
  • { F 7, F 23, F 14, F 11, F 16, and F 17}
  • { F 1, F 12, F 15, F 4, and F 3}
  • { F 9, F 22, F 21, F 10, and F 5}
  • { F 5, F 13, F 19, F 20, F 22, and F 8}
Following the same computational process outlined in our methodology, we determined the corresponding RPNs for each failure mode by aggregating the prioritizations from the sub-problems. The resulting overall priority ranking is as follows:
F 7 > F 11 > F 23 > F 17 > F 14 > F 16 > F 15 > F 1 > F 12 > F 4 > F 3 > F 12 > F 9 > F 22 > F 21 > F 10 > F 5 > F 8 > F 22 > F 13 > F 2 > F 19 > F 20 .
Importantly, this overall prioritization aligns perfectly with the original prioritization of the undivided set of failure modes. This demonstrates the transitive nature of the decision-making problem. As a result, the introduced methodology is validated and remains consistent under both the second and third assessments.

6. Sensitivity Analysis
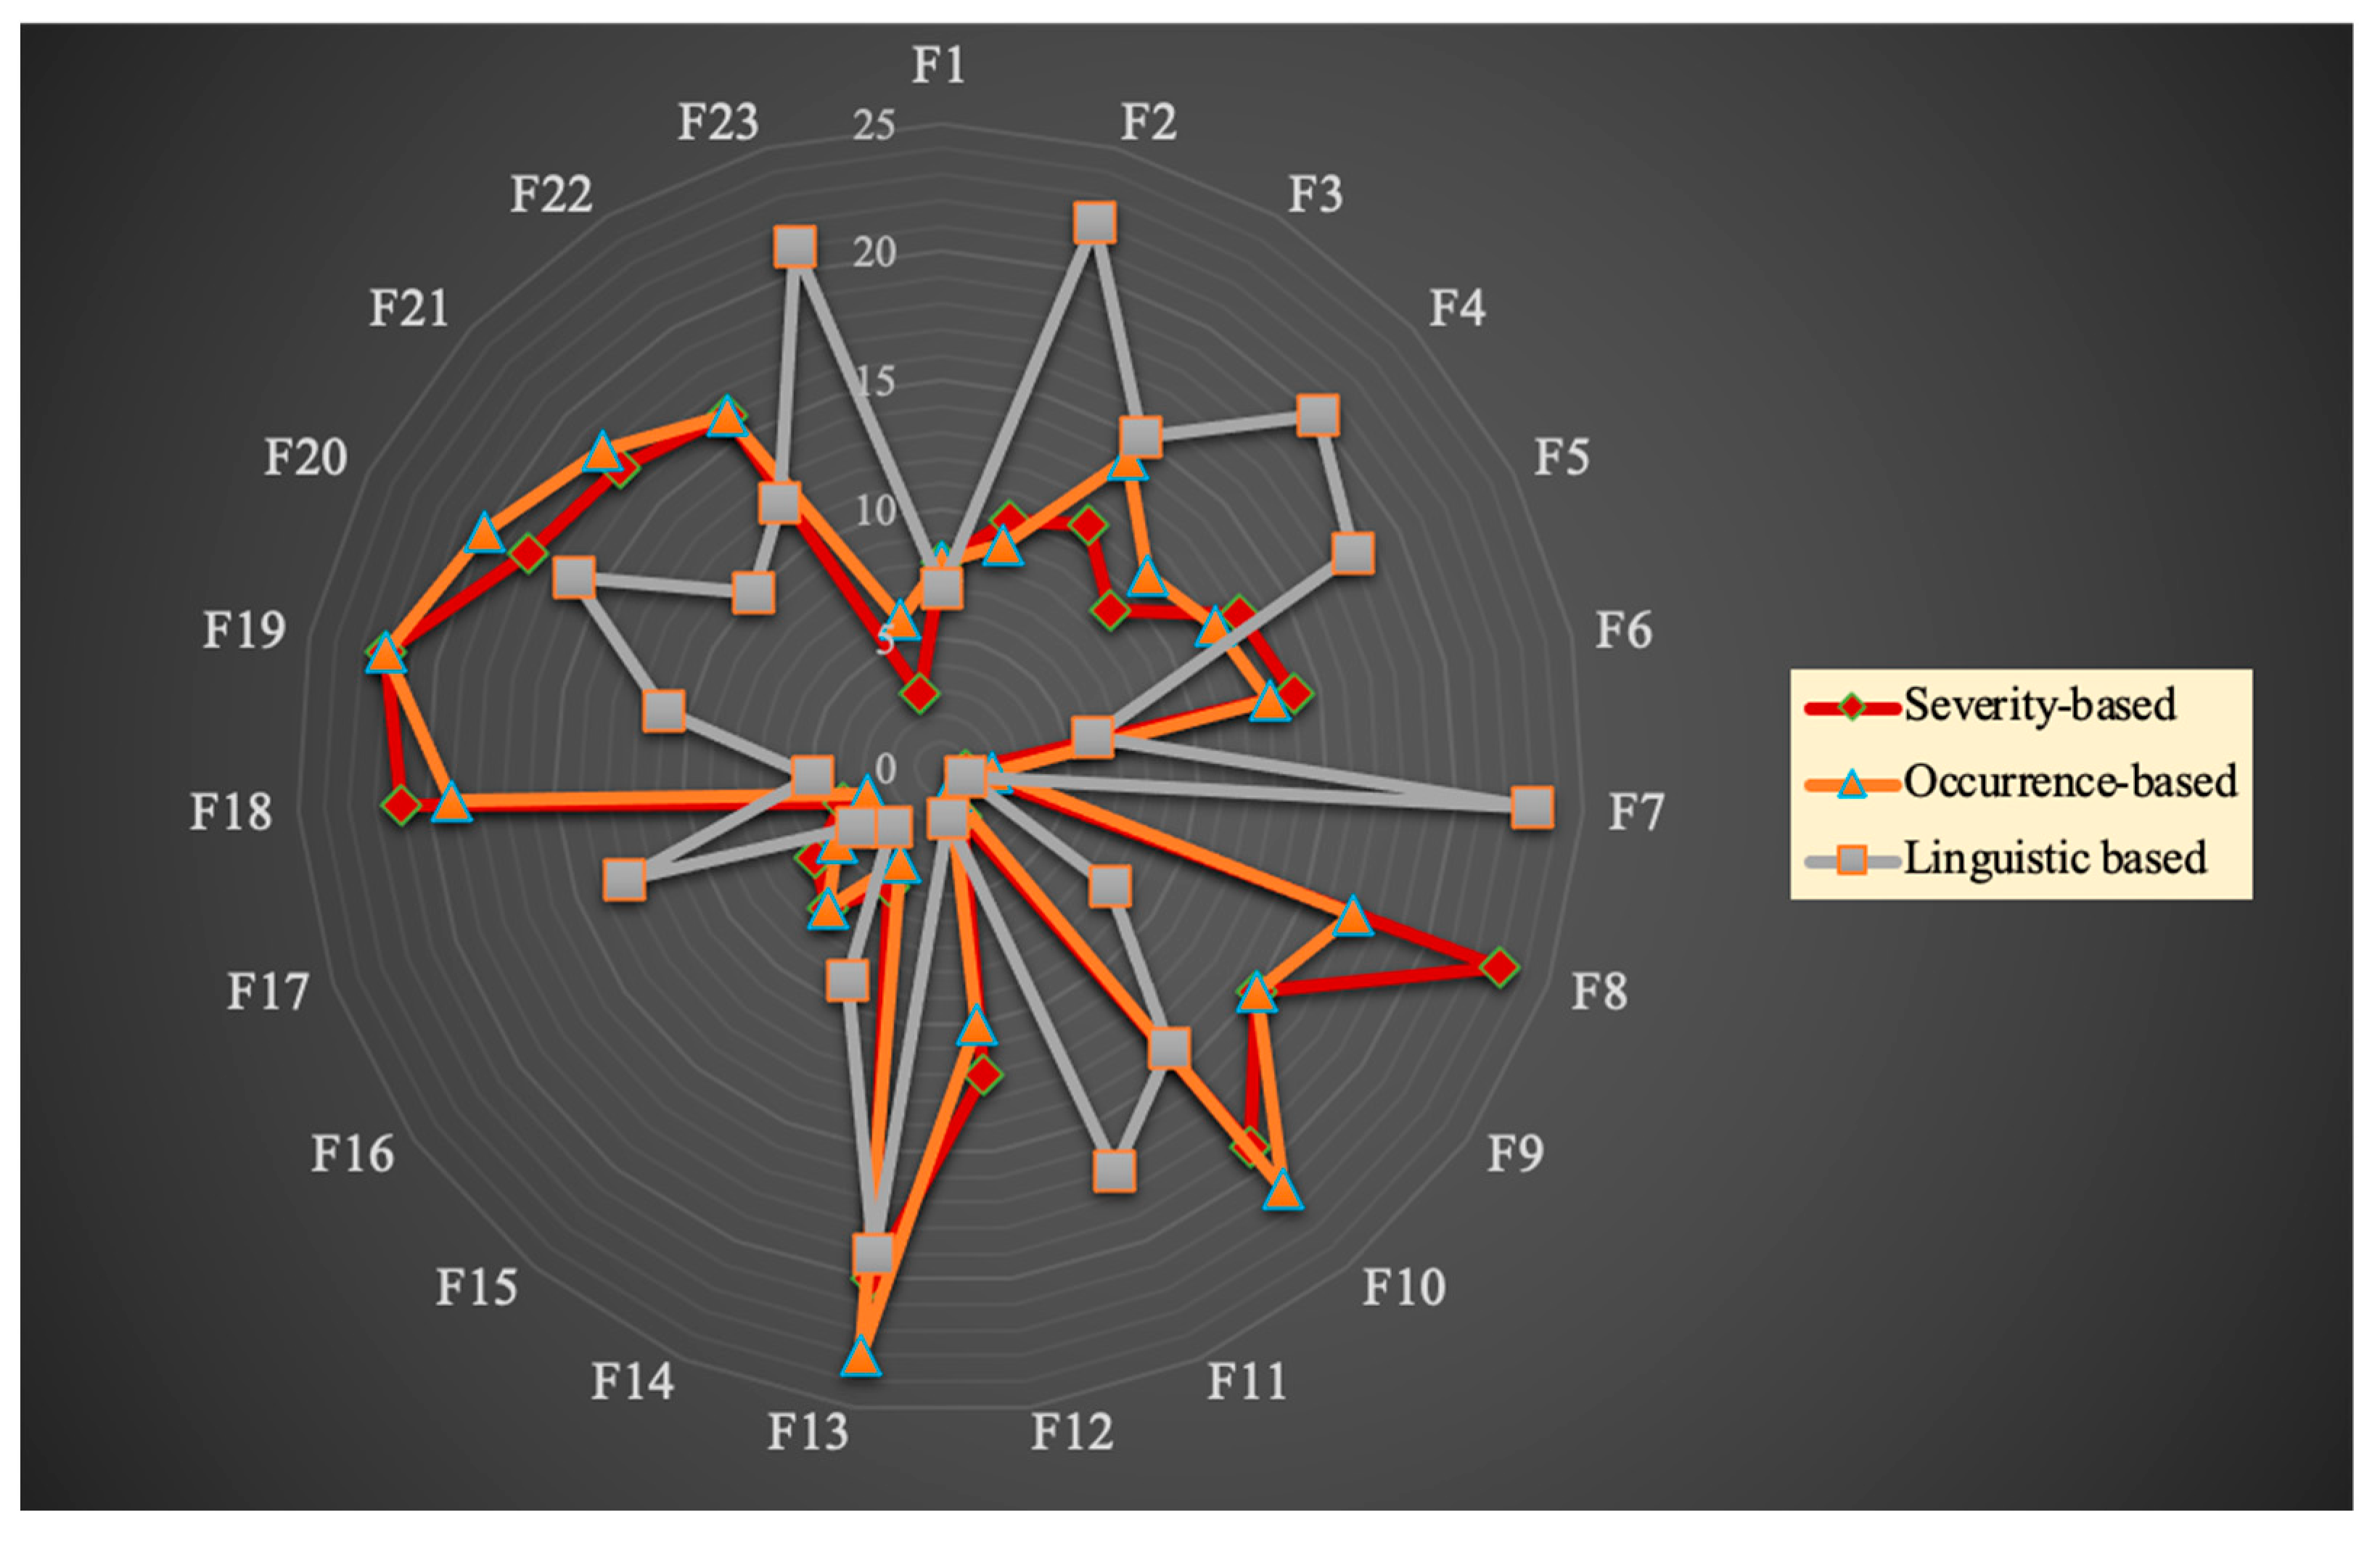
In this section, we conduct sensitivity analysis and a comparative study to demonstrate the effectiveness of the proposed model. Specifically, in our study, the risk factor “Detection” is selected as the expected value by the optimizer. To perform sensitivity analysis, we also consider the other risk factors, namely “Severity” and “Occurrence,” as expected values. The ranking of failure modes is determined based on the RPN using Pythagorean fuzzy uncertain linguistic variables, as outlined in Step 2 of our hybrid model. Table 4 presents the rankings of failure modes using each of these strategies. Figure 2 illustrates that certain failure modes, such as F 14, F 11, and F 7, exhibit similar ranking patterns when considering Severity-based and Occurrence-based rankings. However, there is a notable reversal in the ranking pattern when using Linguistic-based rankings.
Key Features:
  • Nodes: There are 23 nodes, labeled F 1 to F 23. These likely represent specific factors or features. The central positioning of some nodes (like F 1, F 2, and F 3) might suggest their importance or centrality in the network.
  • Connection Types:
    Severity-based (orange): These connections are the most prominent in the figure. Notably, F 2 appears to have the most Severity-based connections.
    Occurrence-based (gray): These are less prevalent than the Severity-based connections but are still significant. F 4 and F 5, for instance, seem to have multiple Occurrence-based connections.
    Linguistic-based (red): These connections are the least common. They primarily involve nodes like F 6, F 7, F 8, and F .
  • Clusters and Sub-networks: The nodes and their connections can be divided into distinct clusters or sub-networks. For example, F 6 to F 9 forms a cluster primarily connected by Linguistic-based relations. Similarly, nodes F 10 to F 15 are interconnected, primarily with Severity-based connections.
    Analysis:
  • Central Nodes: F 1, F 2, and F 3 appear to be central nodes given their location and the number of connections. This might indicate their importance in this network or their role as primary or overarching factors.
  • Diversity of Relations: The multiplicity of connection types suggests that the network is examining the relationships between nodes from different perspectives or criteria. The preponderance of Severity-based connections might indicate that the severity of relations or factors plays a dominant role in this context.
  • Peripheral Nodes: Nodes like F 16 to F 23 are on the periphery, with fewer connections. This could mean they are secondary or less influential factors in this network.
  • Potential Hierarchies: The central nodes’ connections to the peripheral nodes might suggest a flow of influence or a hierarchical structure. For example, F 2’s connections might indicate its influence over multiple other factors.
  • Linguistic Relations: The presence of Linguistic-based connections, especially around F 6 to F 9, might imply a subset of factors that are related based on language, semantics, or terminologies.
Furthermore, we calculate the “Spearman rank correlation coefficient” among each pair of the employed techniques, as shown in Table 5. This coefficient reflects the level of conformity in ranking importance. A higher “Spearman correlation coefficient” indicates a stronger alignment among the ranking methods, highlighting the consistency or divergence in their assessments.
As seen in Table 5, the ranking consistency of the proposed Game-Theory-based approach in this paper, when compared to other methods like Severity-based and Occurrence-based, demonstrates a higher degree of alignment. When juxtaposed with Game-Theory-based rankings and the other three methods, it becomes evident that the proposed hybrid model exhibits a comparable performance to Severity-based and Occurrence-based methods in terms of ranking conformity among failure modes. However, notable disparities highlight the superiority of the Linguistic-based method. This is attributed to the unique nature of the Linguistic-based approach, which utilizes raw and unprocessed data, resulting in substantial distinctions in its rankings compared to the other methods.
The “Spearman correlation coefficient” provides an overall assessment of the rankings generated by all methods, and its importance weighting is visualized in Figure 3. As depicted in the figure, when compared to the Linguistic-based method, our proposed Game-Theory-based approach emerges as notably more reliable and applicable. This is underscored by its enhanced capability to effectively identify failure modes within healthcare units.
In the graphical representation of our analysis, the y-axis serves as a quantitative scale, representing the aggregation of importance weights assigned to various criteria or elements under consideration. Each weight reflects the relative significance or priority of the element it corresponds to within the overall system or model being assessed. On the other hand, the x-axis delineates the method of assessment, denoting a range of evaluative techniques or measurement approaches employed to gauge the performance or impact of these elements. The intersection of these two axes in the graph forms a coordinate system that allows for a visual interpretation of how different assessment methods correlate with the weighted importance of the system’s components, facilitating a clearer understanding of where to focus strategic efforts for optimization or improvement.

7. Conclusions

The conclusion of this study illuminates the profound challenges faced by healthcare workers and systems amid the pandemic, underscoring the criticality of adept risk assessment and management within healthcare units. To bolster the responsiveness of healthcare systems during such emergencies, our research presents an advanced, Game-Theory-based adaptation of the conventional Failure Mode and Effect Analysis (FMEA) method.
This pioneering hybrid model merges Game Theory with the BWM and enriches it with Pythagorean fuzzy uncertain linguistic variables, thereby overcoming some of the limitations inherent in traditional FMEA. The practical outcomes of our research are significant, exhibiting the model’s enhanced capacity to streamline decision-making, furnish reliable risk rankings via optimization algorithms, and offer versatility in various healthcare contexts. As a result, the model contributes to the resilience of healthcare systems, enabling more decisive and accurate strategic choices that directly affect patient care and resource management.
While our Game-Theory-based FMEA stands as both a theoretical construct and a tangible tool for improved decision-making, we must acknowledge certain limitations and the simplifications or assumptions that have been made within our study:
  • Assumption of Rationality: The model assumes that all decision-makers behave rationally and that their judgments are consistent. This may only sometimes hold in real-world scenarios due to cognitive biases and emotional factors.
  • Complexity and Comprehensibility: The integration of Game Theory and Pythagorean fuzzy logic increases the complexity of the FMEA process, which may require additional training for stakeholders to utilize the model effectively.
  • Data Dependence: The model’s effectiveness is highly dependent on the accuracy and completeness of the input data. Any gaps or inaccuracies in the initial data can significantly affect the reliability of the risk assessment outcomes.
  • Static Nature of Analysis: While the model excels in capturing a snapshot of risk factors and their interactions, it may need to fully account for the dynamic nature of healthcare systems where risks can evolve rapidly.
  • Scope of Application: The current implementation of the model is tailored to healthcare systems and may require modifications to be effective in other industries or contexts.
  • Consensus Building: The model presumes a consensus among decision-makers when determining the weights of risk factors, which can be challenging to achieve in practice.
  • Resource Limitations: The application of this advanced FMEA framework demands certain computational resources and expertise, which might only be readily available in some healthcare settings.
Future research must build on these limitations, exploring the flexibility of Game Theory classes for failure mode ranking and delving into a more diverse comparative analysis of linguistic variables to reflect human judgment nuances more faithfully. Moreover, introducing imaginary RPNs could present a more robust approach to evaluating risk levels, potentially transforming the traditional FMEA process.
In conclusion, our enhanced FMEA framework marks a significant stride towards refining healthcare delivery and patient care in the face of pandemics. It equips healthcare establishments to manage the immediate strain and strengthen their preparedness for future adversities. Subsequent research, considering the limitations and assumptions of our current model, can further refine this approach, thereby exerting a substantial and lasting influence on the healthcare sector by evolving strategic risk management into a pivotal instrument for safeguarding lives and enhancing the quality of healthcare services globally.

Funding

This research received no external funding.

Institutional Review Board Statement

Not applicable.

Informed Consent Statement

Not applicable.

Data Availability Statement

The data presented in this study are available within the current study.

Conflicts of Interest

The author declare no conflict of interest.

Appendix A

Table A1. The Pythagorean fuzzy uncertain linguistic variables payoff matrix by four decision-makers.
Failure Modes TagDecision-MakersSeverityOccurrenceDetection
F 1 D M 1 φ C , φ D , ( 0.6 , 0.4 ) φ D , φ C , ( 0.7,0.3 ) φ F , φ F , ( 0.85 , 0.15 )
D M 2 [ φ B , φ C ] , ( 0.3 , 0.7 ) [ φ A , φ C ] , ( 0.25 , 0.75 ) [ φ E , φ G ] , ( 0.75 , 0.25 )
D M 3 [ φ A , φ C ] , ( 0.25 , 0.75 ) [ φ E , φ G ] , ( 0.75 , 0.25 ) [ φ B , φ C ] , ( 0.3 , 0.7 )
D M 4 [ φ A , φ A ] , ( 0.15 , 0.85 ) [ φ A , φ A ] , ( 0.15 , 0.85 ) [ φ E , φ F ] , ( 0.7 , 0.3 )
F 2 D M 1 [ φ F , φ G ] , ( 0.8 , 0.2 ) [ φ F , φ G ] , ( 0.8 , 0.2 ) [ φ A , φ A ] , ( 0.15 , 0.85 )
D M 2 [ φ E , φ G ] , ( 0.75 , 0.25 ) φ E , φ E ] , ( 0.65 , 0.35 ) [ φ A , φ A ] , ( 0.15 , 0.85 )
D M 3 [ φ B , φ E ] , ( 0.45 , 0.55 ) [ φ B , φ E ] , ( 0.45 , 0.55 ) [ φ A , φ A ] , ( 0.15 , 0.85 )
D M 4 φ E , φ E ] , ( 0.65 , 0.35 ) φ E , φ E ] , ( 0.65 , 0.35 ) [ φ A , φ A ] , ( 0.15 , 0.85 )
F 3 D M 1 [ φ D , φ F ] , ( 0.65 , 0.35 ) [ φ B , φ C ] , ( 0.3 , 0.7 ) [ φ A , φ A ] , ( 0.15 , 0.85 )
D M 2 [ φ D , φ F ] , ( 0.65 , 0.35 ) [ φ D , φ F ] , ( 0.65 , 0.35 ) [ φ D , φ F ] , ( 0.65 , 0.35 )
D M 3 [ φ D , φ F ] , ( 0.65 , 0.35 ) [ φ B , φ C ] , ( 0.3 , 0.7 ) [ φ A , φ A ] , ( 0.15 , 0.85 )
D M 4 [ φ B , φ C ] , ( 0.3 , 0.7 ) [ φ D , φ F ] , ( 0.65 , 0.35 ) [ φ D , φ F ] , ( 0.65 , 0.35 )
F 4 D M 1 [ φ D , φ F ] , ( 0.65 , 0.35 ) [ φ B , φ C ] , ( 0.3 , 0.7 ) [ φ B , φ E ] , ( 0.45 , 0.55 )
D M 2 [ φ D , φ F ] , ( 0.65 , 0.35 ) [ φ B , φ E ] , ( 0.45 , 0.55 ) [ φ D , φ F ] , ( 0.65 , 0.35 )
D M 3 [ φ D , φ F ] , ( 0.65 , 0.35 ) [ φ B , φ C ] , ( 0.3 , 0.7 ) [ φ B , φ E ] , ( 0.45 , 0.55 )
D M 4 [ φ B , φ E ] , ( 0.45 , 0.55 ) [ φ D , φ F ] , ( 0.65 , 0.35 ) [ φ D , φ F ] , ( 0.65 , 0.35 )
F 5 D M 1 [ φ E , φ F ] , ( 0.7 , 0.3 ) [ φ B , φ C ] , ( 0.3 , 0.7 ) [ φ B , φ C ] , ( 0.3 , 0.7 )
D M 2 [ φ F , φ G ] , ( 0.8 , 0.2 ) [ φ F , φ G   ] , ( 0.8 , 0.2 ) [ φ B , φ C ] , ( 0.3 , 0.7 )
D M 3 [ φ E , φ F ] , ( 0.7 , 0.3 ) [ φ E , φ F ] , ( 0.7 , 0.3 ) [ φ A , φ A ] , ( 0.15 , 0.85 )
D M 4 [ φ F , φ G ] , ( 0.8 , 0.2 ) [ φ E , φ F ] , ( 0.7 , 0.3 ) [ φ A , φ A ] , ( 0.15 , 0.85 )
F 6 D M 1 [ φ G , φ G ] , ( 0.85 , 0.15 ) [ φ E , φ F ] , ( 0.7 , 0.3 ) [ φ B , φ C ] , ( 0.3 , 0.7 )
D M 2 [ φ F , φ G ] , ( 0.8 , 0.2 ) [ φ B , φ C ] , ( 0.3 , 0.7 ) [ φ F , φ G ] , ( 0.8 , 0.2 )
D M 3 [ φ G , φ G ] , ( 0.85 , 0.15 ) [ φ E , φ F ] , ( 0.7 , 0.3 ) [ φ E , φ F ] , ( 0.7 , 0.3 )
D M 4 [ φ E , φ F ] , ( 0.7 , 0.3 ) [ φ E , φ G ] , ( 0.75 , 0.25 ) [ φ E , φ F ] , ( 0.7 , 0.3 )
F 7 D M 1 [ φ E , φ F ] , ( 0.7 , 0.3 ) [ φ B , φ C ] , ( 0.3 , 0.7 ) [ φ D , φ G ] , ( 0.75 , 0.25 )
D M 2 [ φ G , φ G ] , ( 0.85 , 0.15 ) [ φ A , φ B ] , ( 0.2 , 0.8 ) [ φ D , φ E ] , ( 0.6 , 0.4 )
D M 3 [ φ D , φ E ] , ( 0.6 , 0.4 ) [ φ A , φ B ] , ( 0.2 , 0.8 ) [ φ A , φ B ] , ( 0.2 , 0.8 )
D M 4 [ φ D , φ E ] , ( 0.6 , 0.4 ) [ φ A , φ B ] , ( 0.2 , 0.8 ) [ φ G , φ G ] , ( 0.85 , 0.15 )
F 8 D M 1 [ φ E , φ F ] , ( 0.7 , 0.3 ) [ φ B , φ C ] , ( 0.3 , 0.7 ) [ φ E , φ G ] , ( 0.75 , 0.25 )
D M 2 [ φ G , φ G ] , ( 0.85 , 0.15 ) [ φ A , φ B ] , ( 0.2 , 0.8 ) [ φ B , φ D ] , ( 0.35 , 0.65 )
D M 3 [ φ D , φ E ] , ( 0.6 , 0.4 ) [ φ A , φ B ] , ( 0.2 , 0.8 ) [ φ B , φ D ] , ( 0.35 , 0.65 )
D M 4 [ φ D , φ E ] , ( 0.6 , 0.4 ) [ φ A , φ B ] , ( 0.2 , 0.8 ) [ φ G , φ G ] , ( 0.85 , 0.15 )
F 9 D M 1 [ φ G , φ G ] , ( 0.85 , 0.15 ) [ φ E , φ F ] , ( 0.7 , 0.3 ) [ φ E , φ F ] , ( 0.7 , 0.3 )
D M 2 [ φ D , φ F ] , ( 0.65 , 0.35 ) [ φ G , φ G ] , ( 0.3 , 0.7 ) [ φ G , φ G ] , ( 0.85 , 0.15 )
D M 3 [ φ E , φ E ] , ( 0.65 , 0.35 ) [ φ G , φ G ] , ( 0.85 , 0.15 ) [ φ E , φ E ] , ( 0.65 , 0.35 )
D M 4 [ φ D , φ F ] , ( 0.65 , 0.35 ) [ φ G , φ G ] , ( 0.85 , 0.15 ) [ φ C , φ E ] , ( 0.55 , 0.45 )
F 10 D M 1 [ φ F , φ G ] , ( 0.8 , 0.2 ) [ φ B , φ C ] , ( 0.3 , 0.7 ) [ φ B , φ C ] , ( 0.3 , 0.7 )
D M 2 [ φ C , φ D ] , ( 0.4 , 0.6 ) [ φ C , φ E ] , ( 0.55 , 0.45 ) [ φ F , φ G ] , ( 0.8 , 0.2 )
D M 3 [ φ B , φ C ] , ( 0.3 , 0.7 ) [ φ C , φ D ] , ( 0.4 , 0.6 ) [ φ F , φ G ] , ( 0.8 , 0.2 )
D M 4 [ φ F , φ G ] , ( 0.8 , 0.2 ) [ φ B , φ C ] , ( 0.3 , 0.7 ) [ φ F , φ G ] , ( 0.8 , 0.2 )
F 11 D M 1 [ φ B , φ C ] , ( 0.3 , 0.7 ) [ φ A , φ B ] , ( 0.2 , 0.8 ) [ φ E , φ G ] , ( 0.75 , 0.25 )
D M 2 [ φ B , φ C ] , ( 0.3 , 0.7 ) [ φ E , φ G ] , ( 0.75 , 0.25 ) [ φ A , φ B ] , ( 0.2 , 0.8 )
D M 3 [ φ B , φ C ] , ( 0.3 , 0.7 ) [ φ C , φ E ] , ( 0.55 , 0.45 ) [ φ E , φ G ] , ( 0.75 , 0.25 )
D M 4 [ φ B , φ C ] , ( 0.3 , 0.7 ) [ φ E , φ G ] , ( 0.75 , 0.25 ) [ φ E , φ G ] , ( 0.75 , 0.25 )
F 12 D M 1 [ φ F , φ G ] , ( 0.8 , 0.2 ) [ φ F , φ G ] , ( 0.8 , 0.2 ) [ φ A , φ B ] , ( 0.2 , 0.8 )
D M 2 [ φ G , φ G ] , ( 0.85 , 0.15 ) [ φ G , φ G ] , ( 0.85 , 0.15 ) [ φ F , φ G ] , ( 0.8 , 0.2 )
D M 3 [ φ G , φ G ] , ( 0.85 , 0.15 ) [ φ A , φ B ] , ( 0.2 , 0.8 ) [ φ A , φ B ] , ( 0.2 , 0.8 )
D M 4 [ φ G , φ G ] , ( 0.85 , 0.15 ) [ φ G , φ G ] , ( 0.85 , 0.15 ) [ φ E , φ G ] , ( 0.75 , 0.25 )
F 13 D M 1 [ φ G , φ G ] , ( 0.85 , 0.15 ) [ φ A , φ B ] , ( 0.2 , 0.8 ) ) [ φ G   , φ G ] , ( 0.85 , 0.15 )
D M 2 [ φ G , φ G ] , ( 0.85 , 0.15 ) [ φ C , φ D ] , ( 0.4 , 0.6 ) [ φ G , φ G ] , ( 0.85 , 0.15 )
D M 3 [ φ B , φ C ] , ( 0.3 , 0.7 ) [ φ A , φ B ] , ( 0.2 , 0.8 ) [ φ F , φ G ] , ( 0.8 , 0.2 )
D M 4 [ φ G , φ G ] , ( 0.85 , 0.15 ) [ φ C , φ D ] , ( 0.4 , 0.6 ) [ φ E , φ G ] , ( 0.75 , 0.25 )
F 14 D M 1 [ φ G , φ G ] , ( 0.85 , 0.15 ) [ φ G , φ G ] , ( 0.85 , 0.15 ) [ φ C , φ E ] , ( 0.55 , 0.45 )
D M 2 [ φ G , φ G ] , ( 0.85 , 0.15 ) [ φ G , φ G ] , ( 0.85 , 0.15 ) [ φ C , φ D ] , ( 0.4 , 0.6 )
D M 3 [ φ G , φ G ] , ( 0.85 , 0.15 ) [ φ G , φ G ] , ( 0.85 , 0.15 ) [ φ F , φ G ] , ( 0.8 , 0.2 )
D M 4 [ φ G , φ G ] , ( 0.85 , 0.15 ) [ φ G , φ G ] , ( 0.85 , 0.15 ) [ φ C , φ D ] , ( 0.4 , 0.6 )
F 15 D M 1 [ φ G , φ G ] , ( 0.85 , 0.15 ) [ φ G , φ G ] , ( 0.85 , 0.15 ) [ φ E , φ G ] , ( 0.75 , 0.25 )
D M 2 [ φ G , φ G ] , ( 0.85 , 0.15 ) [ φ G , φ G ] , ( 0.85 , 0.15 ) [ φ C , φ D ] , ( 0.4 , 0.6 )
D M 3 [ φ G , φ G ] , ( 0.85 , 0.15 ) [ φ G , φ G ] , ( 0.85 , 0.15 ) [ φ E , φ G ] , ( 0.75 , 0.25 )
D M 4 [ φ G , φ G ] , ( 0.85 , 0.15 ) [ φ G , φ G ] , ( 0.85 , 0.15 ) [ φ E , φ G ] , ( 0.75 , 0.25 )
F 16 D M 1 [ φ G , φ G ] , ( 0.85 , 0.15 ) [ φ G , φ G ] , ( 0.85 , 0.15 ) [ φ E , φ B ] , ( 0.65 , 0.35 )
D M 2 [ φ G , φ G ] , ( 0.85 , 0.15 ) [ φ G , φ G ] , ( 0.85 , 0.15 ) [ φ C , φ D ] , ( 0.4 , 0.6 )
D M 3 [ φ G , φ G ] , ( 0.85 , 0.15 ) [ φ G , φ G ] , ( 0.85 , 0.15 ) [ φ E , φ E ] , ( 0.65 , 0.35 )
D M 4 [ φ G , φ G ] , ( 0.85 , 0.15 ) [ φ G , φ G ] , ( 0.85 , 0.15 ) [ φ C , φ D ] , ( 0.4 , 0.6 )
F 17 D M 1 [ φ G , φ G ] , ( 0.85 , 0.15 ) [ φ G , φ G ] , ( 0.85 , 0.15 ) [ φ E , φ G ] , ( 0.75 , 0.25 )
D M 2 [ φ G , φ G ] , ( 0.85 , 0.15 ) [ φ G , φ G ] , ( 0.85 , 0.15 ) [ φ E , φ E ] , ( 0.65 , 0.35 )
D M 3 [ φ G , φ G ] , ( 0.85 , 0.15 ) [ φ G , φ G ] , ( 0.85 , 0.15 ) [ φ E , φ G ] , ( 0.75 , 0.25 )
D M 4 [ φ G , φ G ] , ( 0.85 , 0.15 ) [ φ G , φ G ] , ( 0.85 , 0.15 ) [ φ E , φ G ] , ( 0.75 , 0.25 )
F 18 D M 1 [ φ D , φ E ] , ( 0.6 , 0.4 ) [ φ D , φ E ] , ( 0.6 , 0.4 ) φ F , φ G , ( 0.8 , 0.2 )
D M 2 [ φ A , φ B ] , ( 0.2 , 0.8 ) [ φ D , φ E ] , ( 0.6 , 0.4 ) [ φ A , φ B ] , ( 0.2 , 0.8 )
D M 3 [ φ E , φ G ] , ( 0.75 , 0.25 ) [ φ D , φ F ] , ( 0.65 , 0.35 ) [ φ D , φ E ] , ( 0.6 , 0.4 )
D M 4 [ φ D , φ E ] , ( 0.6 , 0.4 ) [ φ F , φ G ] , ( 0.8 , 0.2 ) [ φ F , φ G ] , ( 0.8 , 0.2 )
F 19 D M 1 [ φ D , φ F ] , ( 0.65 , 0.35 ) [ φ A , φ B ] , ( 0.2 , 0.8 ) [ φ A , φ B ] , ( 0.2 , 0.8 )
D M 2 φ D , φ F ] , ( 0.65 , 0.35 ) [ φ E , φ G ] , ( 0.75 , 0.25 ) [ φ E , φ G ] , ( 0.75 , 0.25 )
D M 3 [ φ A , φ B ] , ( 0.2 , 0.8 ) [ φ A , φ B ] , ( 0.2 , 0.8 ) [ φ A , φ B ] , ( 0.2 , 0.8 )
D M 4 [ φ D , φ F ] , ( 0.65 , 0.35 ) [ φ D , φ F ] , ( 0.65 , 0.35 ) [ φ E , φ G ] , ( 0.75 , 0.25 )
F 20 D M 1 [ φ A , φ B ] , ( 0.2 , 0.8 ) [ φ A , φ B ] , ( 0.2 , 0.8 ) [ φ A , φ B ] , ( 0.2 , 0.8 )
D M 2 [ φ E , φ G ] , ( 0.75 , 0.25 ) [ φ B , φ C ] , ( 0.3 , 0.7 ) [ φ E , φ G ] , ( 0.75 , 0.25 )
D M 3 [ φ D , φ E ] , ( 0.6 , 0.4 ) [ φ E   , φ G ] , ( 0.75 , 0.25 ) [ φ D , φ E ] , ( 0.6 , 0.4 )
D M 4 [ φ D , φ F ] , ( 0.65 , 0.35 ) [ φ B , φ C ] , ( 0.3 , 0.7 ) [ φ D , φ F ] , ( 0.65 , 0.35 )
F 21 D M 1 [ φ A ,   φ C ], (0.25, 0.75) [ φ C , φ D ] , ( 0.4 , 0.6 ) [ φ C , φ D ] , ( 0.4 , 0.6 )
D M 2 [ φ B , φ C ] , ( 0.3 , 0.7 ) [ φ A ,   φ C ], (0.25, 0.75) [ φ C , φ D ] , ( 0.4 , 0.6 )
D M 3 φ 3 , φ 4 , ( 0.6 , 0.4 ) [ φ E , φ G ] , ( 0.75 , 0.25 ) [ φ E , φ G ] , ( 0.75 , 0.25 )
D M 4 [ φ E , φ G ] , ( 0.75 , 0.25 ) φ E , φ D , ( 0.7,0.3 ) φ G , φ G , ( 0.85 , 0.15 )
F 22 D M 1 [ φ A , φ B ] , ( 0.2 , 0.8 ) φ E , φ D , ( 0.7,0.3 ) φ G , φ G , ( 0.85 , 0.15 )
D M 2 [ φ B , φ C ] , ( 0.3 , 0.7 ) [ φ A , φ B ] , ( 0.2 , 0.8 ) [ φ A , φ B ] , ( 0.2 , 0.8 )
D M 3 φ D , φ E , ( 0.6 , 0.4 ) [ φ E , φ G ] , ( 0.75 , 0.25 ) [ φ A ,   φ C ], (0.25, 0.75)
D M 4 [ φ E , φ G ] , ( 0.75 , 0.25 ) [ φ A , φ B ] , ( 0.2 , 0.8 ) [ φ E , φ G ] , ( 0.75 , 0.25 )
F 23 D M 1 [ φ A ,   φ C ] , ( 0.25 , 0.75 ) [ φ A , φ B ] , ( 0.2 , 0.8 ) φ G , φ G , ( 0.85 , 0.15 )
D M 2 [ φ C , φ D ] , ( 0.4 , 0.6 ) [ φ A , φ B ] , ( 0.2 , 0.8 ) [ φ A , φ B ] , ( 0.2 , 0.8 )
D M 3 φ D , φ E , ( 0.6 , 0.4 ) [ φ A , φ B ] , ( 0.2 , 0.8 ) [ φ A ,   φ C ], (0.25, 0.75)
D M 4 [ φ C , φ D ] , ( 0.4 , 0.6 ) [ φ A , φ B ] , ( 0.2 , 0.8 ) [ φ E , φ G ] , ( 0.75 , 0.25 )
Table A2. Aggregated normalized single-weighted Pythagorean fuzzy uncertain linguistic variables payoff matrix.
Failure Modes TagSeverityOccurrenceDetection
F 1 φ 0.1103 , φ 0.1362 , ( 0.2213 , 0.2224 ) φ 0.0343 , φ 0.0289 , ( 0.1556 , 0.6121 ) φ 0.0190 , φ 0.0180 , ( 0.1217 , 0.6397 )
F 2 φ 0.1348 , φ 0.1114 , ( 0.3088 , 0.0568 ) φ 0.0317 , φ 0.0276 , ( 0.1493 , 0.4959 ) φ 0.0091 , φ 0.0212 , ( 0.0371 , 0.8538 )
F 3 φ 0.1399 , φ 0.1076 , ( 0.2984 , 0.0860 ) φ 0.0279 , φ 0.0327 , ( 0.1190 , 0.6178 ) φ 0.0156 , φ 0.0213 , ( 0.0887 , 0.7127 )
F 4 φ 0.1399 , φ 0.1076 , ( 0.2963 , 0.0710 ) φ 0.0279 , φ 0.0327 , ( 0.0940 , 0.6951 ) φ 0.0156 , φ 0.0213 , ( 0.0973 , 0.7703 )
F 5 φ 0.1374 , φ 0.1059 , ( 0.3141 , 0.0435 ) φ 0.0253 , φ 0.0326 , ( 0.1549 , 0.5120 ) φ 0.0180 , φ 0.0176 , ( 0.0909 , 0.7923 )
F 6 φ 0.1395 , φ 0.1037 , ( 0.3501 , 0.0060 ) φ 0.0325 , φ 0.0282 , ( 0.1429 , 0.5274 ) φ 0.0167 , φ 0.0193 , ( 0.1161 , 0.7056 )
F 7 φ 0.1450 , φ 0.0723 , ( 0.3171 , 0.0348 ) φ 0.0304 , φ 0.0306 , ( 0.0690 , 0.9679 ) φ 0.0188 , φ 0.0192 , ( 0.1104 , 0.6853 )
F 8 φ 0.1403 , φ 0.0988 , ( 0.3171 , 0.0348 ) φ 0.0199 , φ 0.1234 , ( 0.0690 , 0.7421 ) φ 0.0175 , φ 0.0204 , ( 0.1083 , 0.5454 )
F 9 φ 0.1393 , φ 0.0984 , ( 0.3210 , 0.0314 ) φ 0.0280 , φ 0.0344 , ( 0.1345 , 0.5646 ) φ 0.0205 , φ 0.0137 , ( 0.1248 , 0.6666 )
F 10 φ 0.1219 , φ 0.1378 , ( 0.2851 , 0.0759 ) φ 0.0279 , φ 0.0312 , ( 0.1080 , 0.6692 ) φ 0.0202 , φ 0.0160 , ( 0.1253 , 0.6574 )
F 11 φ 0.0970 , φ 0.1387 , ( 0.1703 , 0.2438 ) φ 0.0310 , φ 0.0308 , ( 0.1388 , 0.5507 ) φ 0.0193 , φ 0.0181 , ( 0.1213 , 0.7297 )
F 12 φ 0.1465 , φ 0.0672 , ( 0.3561 , 0.0047 ) φ 0.0316 , φ 0.0334 , ( 0.1621 , 0.4534 ) φ 0.0173 , φ 0.0210 , ( 0.1023 , 0.4933 )
F 13 φ 0.1343 , φ 0.1274 , ( 0.3292 , 0.0228 ) φ 0.0224 , φ 0.0344 , ( 0.0836 , 0.7122 ) φ 0.0211 , φ 0.0103 , ( 0.1377 , 0.6637 )
F 14 φ 0.1470 , φ 0.0635 , ( 0.3601 , 0.0036 ) φ 0.0353 , φ 0.0153 , ( 0.1811 , 0.2589 ) φ 0.0199 , φ 0.0163 , ( 0.1169 , 0.6950 )
F 15 φ 0.1470 , φ 0.0635 , ( 0.3601 , 0.0036 ) φ 0.0353 , φ 0.0153 , ( 0.1811 , 0.2589 ) φ 0.0196 , φ 0.0160 , ( 0.1213 , 0.6224 )
F 16 φ 0.1470 , φ 0.0635 , ( 0.3601 , 0.0036 ) φ 0.0353 , φ 0.0153 , ( 0.1811 , 0.2589 ) φ 0.0191 , φ 0.0151 , ( 0.1082 , 0.6360 )
F 17 φ 0.1470 , φ 0.0635 , ( 0.3601 , 0.0036 ) φ 0.0353 , φ 0.0153 , ( 0.1811 , 0.2589 ) φ 0.0201 , φ 0.0126 , ( 0.1254 , 0.6827 )
F 18 φ 0.1316 , φ 0.1252 , ( 0.2940 , 0.0974 ) φ 0.0318 , φ 0.0263 , ( 0.1478 , 0.4762 ) φ 0.0186 , φ 0.0190 , ( 0.1165 , 0.7298 )
F 19 φ 0.1213 , φ 0.1359 , ( 0.2715 , 0.1002 ) φ 0.0280 , φ 0.0344 , ( 0.1234 , 0.6262 ) φ 0.0169 , φ 0.0210 , ( 0.0992 , 0.6912 )
F 20 φ 0.1315 , φ 0.1244 , ( 0.2800 , 0.0908 ) φ 0.0315 , φ 0.0308 , ( 0.1394 , 0.6607 ) φ 0.0189 , φ 0.0179 , ( 0.1081 , 0.7119 )
F 21 φ 0.1182 , φ 0.1359 , ( 0.2561 , 0.1313 ) φ 0.0308 , φ 0.0308 , ( 0.1426 , 0.5795 ) φ 0.0187 , φ 0.0178 , ( 0.1147 , 0.6963 )
F 22 φ 0.1176 , φ 0.1375 , ( 0.2562 , 0.1375 ) φ 0.0339 , φ 0.0294 , ( 0.1547 , 0.6128 ) φ 0.0171 , φ 0.0213 , ( 0.1114 , 0.7156 )
F 23 φ 0.1208 , φ 0.1283 , ( 0.2402 , 0.1720 ) φ 0.0184 , φ 0.0347 , ( 0.0608 , 0.7513 ) φ 0.0171 , φ 0.0213 , ( 0.1114 , 0.7188 )
Table A3. The crisp single-weighted payoff matrix.
Failure Modes TagSeverityOccurrenceDetection
F 10.010270.001710.00094
F 20.011210.001920.00034
F 30.011150.001600.00077
F 40.011160.001330.00064
F 50.011120.001840.00057
F 60.011380.001880.00077
F 70.009960.000170.00086
F 80.010950.002710.00113
F 90.010910.001820.00082
F 100.011630.001390.00088
F 110.009520.001840.00075
F 120.010030.002220.00122
F 130.012080.001180.00076
F 140.009910.002030.00080
F 150.009910.002030.00093
F 160.009910.002030.00086
F 170.009910.002030.00075
F 180.011520.001930.00075
F 190.011400.001620.00084
F 200.011410.001510.00078
F 210.011100.001760.00080
F 220.011120.001710.00080
F 230.010670.000970.00079

References

  1. Dodoo, J.E.; Al-Samarraie, H. A systematic review of factors leading to occupational injuries and fatalities. J. Public Health 2023, 31, 99–113. [Google Scholar] [CrossRef]
  2. Harris, C.; Cortvriend, P.; Hyde, P. Human resource management and performance in healthcare organisations. J. Health Organ. Manag. 2007, 21, 448–459. [Google Scholar] [CrossRef] [PubMed]
  3. Yazdi, M. Linguistic Methods under Fuzzy Information in System Safety and Reliability Analysis; Springer: Berlin/Heidelberg, Germany, 2022. [Google Scholar]
  4. Li, H.; Yazdi, M. Advanced decision-making methods and applications in system safety and reliability problems. In Studies in Systems, Decision and Control; Springer: Cham, Switzerland, 2022; p. 211. [Google Scholar]
  5. Kletz, T. The history of process safety. J. Loss Prev. Process Ind. 2012, 25, 763–765. [Google Scholar] [CrossRef]
  6. Ahn, J.; Chang, D. Fuzzy-based HAZOP study for process industry. J. Hazard. Mater. 2016, 317, 303–311. [Google Scholar] [CrossRef] [PubMed]
  7. Jong, C.H.; Tay, K.M.; Lim, C.P. Application of the fuzzy Failure Mode and Effect Analysis methodology to edible bird nest processing. Comput. Electron. Agric. 2013, 96, 90–108. [Google Scholar] [CrossRef]
  8. Lo, H.W.; Liou, J.J.H. A novel multiple-criteria decision-making-based FMEA model for risk assessment. Appl. Soft Comput. 2018, 73, 684–696. [Google Scholar] [CrossRef]
  9. Huang, P.; Gu, Y.; Li, H.; Yazdi, M.; Qiu, G. An Optimal Tolerance Design Approach of Robot Manipulators for Positioning Accuracy Reliability. Reliab. Eng. Syst. Saf. 2023, 237, 109347. Available online: https://www.sciencedirect.com/science/article/pii/S0951832023002612 (accessed on 10 September 2023). [CrossRef]
  10. Cheng, C.Y.; Li, S.F.; Chu, S.J.; Yeh, C.Y.; Simmons, R.J. Application of fault tree analysis to assess inventory risk: A practical case from aerospace manufacturing. Int. J. Prod. Res. 2013, 51, 6499–6514. [Google Scholar] [CrossRef]
  11. Sarkar, A.; Panja, S.C.; Das, D. Fault tree analysis of Rukhia gas turbine power plant. HKIE Trans. Hong Kong Inst. Eng. 2015, 22, 32–56. [Google Scholar] [CrossRef]
  12. Tyagi, S.; Pandey, D.; Tyagi, R. Fuzzy set theoretic approach to fault tree analysis. Int. J. Eng. Sci. Technol. 2010, 2, 276–283. [Google Scholar] [CrossRef]
  13. Yazdi, M.; Mohammadpour, J.; Li, H.; Huang, H.Z.; Zarei, E.; Pirbalouti, R.G.; Adumene, S. Fault tree analysis improvements: A bibliometric analysis and literature review. Qual. Reliab. Eng. Int. 2023, 39, 1639–1659. [Google Scholar] [CrossRef]
  14. Li, H.; Yazdi, M. (Eds.) Reliability Analysis of Correlated Failure Modes by Transforming Fault Tree Model to Bayesian Network: A Case Study of the MDS of a CNC Machine Tool. In Advanced Decision-Making Methods and Applications in System Safety and Reliability Problems: Approaches, Case Studies, Multi-Criteria Decision-Making, Multi-Objective Decision-Making, Fuzzy Risk-Based Models; Springer International Publishing: Cham, Switzerland, 2022; pp. 15–28. [Google Scholar] [CrossRef]
  15. Rausand, M.; Hoyland, A. System Reliability Theory: Models, Statistical Methods, and Applications; John Wiley & Sons: Hoboken, NJ, USA, 2004; p. 664. [Google Scholar]
  16. Markowski, A.S.; Siuta, D. Fuzzy logic approach for identifying representative accident scenarios. J. Loss Prev. Process Ind. 2018, 56, 414–423. [Google Scholar] [CrossRef]
  17. Guo, J.; Wan, J.L.; Yang, Y.; Dai, L.; Tang, A.; Huang, B.; Zhang, F.; Li, H. A deep feature learning method for remaining useful life prediction of drilling pumps. Energy 2023, 282, 128442. Available online: https://www.sciencedirect.com/science/article/pii/S0360544223018364 (accessed on 10 September 2023). [CrossRef]
  18. Cheraghi, M.; Eslami Baladeh, A.; Khakzad, N. A fuzzy multi-attribute HAZOP technique (FMA-HAZOP): Application to gas wellhead facilities. Saf. Sci. 2019, 114, 12–22. [Google Scholar] [CrossRef]
  19. Duan, Y.; Zhao, J.; Chen, J.; Bai, G. A risk matrix analysis method based on potential risk influence: A case study on cryogenic liquid hydrogen filling system. Process Saf. Environ. Prot. 2016, 102, 277–287. [Google Scholar] [CrossRef]
  20. Carnero, M.C. Waste segregation FMEA model integrating intuitionistic fuzzy set and the PAPRIKA method. Mathematics 2020, 8, 1375. [Google Scholar] [CrossRef]
  21. Rausand, M. Risk Assessment: Theory, Methods, and Applications; Wiley: New York, NY, USA, 2011; 664p. [Google Scholar]
  22. Haapasaari, P.; Helle, I.; Lehikoinen, A.; Lappalainen, J.; Kuikka, S. A proactive approach for maritime safety policy making for the Gulf of Finland: Seeking best practices. Mar. Policy 2015, 60, 107–118. [Google Scholar] [CrossRef]
  23. Zarreh, A.; Wan, H.; Lee, Y.; Saygin, C.; Janahi, R.A. Risk Assessment for Cyber Security of Manufacturing Systems: A Game Theory Approach. Procedia Manuf. 2019, 38, 605–612. [Google Scholar] [CrossRef]
  24. Li, H.; Yazdi, M. (Eds.) A Holistic Question: Is It Correct that Decision-Makers Neglect the Probability in the Risk Assessment Method? In Advanced Decision-Making Methods and Applications in System Safety and Reliability Problems: Approaches, Case Studies, Multi-Criteria Decision-Making, Multi-Objective Decision-Making, Fuzzy Risk-Based Models; Springer International Publishing: Cham, Switzerland, 2022; pp. 185–189. [Google Scholar] [CrossRef]
  25. Liu, H.C. FMEA Using Uncertainty Theories and MCDM Methods; Springer: Singapore, 2016; 219p. [Google Scholar]
  26. Liu, H.C.; Chen, X.Q.; Duan, C.Y.; Wang, Y.M. Failure mode and effect analysis using multi-criteria decision making methods: A systematic literature review. Comput. Ind. Eng. 2019, 135, 881–897. [Google Scholar] [CrossRef]
  27. Liu, H.C.; Li, Z.; Song, W.; Su, Q. Failure mode and effect analysis using cloud model theory and PROMETHEE method. IEEE Trans. Reliab. 2017, 66, 1058–1072. [Google Scholar] [CrossRef]
  28. Yazdi, M. A Brief Review of Using Linguistic Terms in System Safety and Reliability Analysis. In Linguistic Methods Under Fuzzy Information in System Safety and Reliability Analysis; Springer International Publishing: Cham, Switzerland, 2022; pp. 1–4. [Google Scholar]
  29. Liu, H.C.; Liu, L.; Liu, N. Risk evaluation approaches in failure mode and effects analysis: A literature review. Expert. Syst. Appl. 2013, 40, 828–838. [Google Scholar] [CrossRef]
  30. Liu, H.C.; You, J.X.; Shan, M.M.; Shao, L.N. Failure mode and effects analysis using intuitionistic fuzzy hybrid TOPSIS approach. Soft Comput. 2015, 19, 1085–1098. [Google Scholar] [CrossRef]
  31. Liu, H.C.; Liu, L.; Li, P. Failure mode and effects analysis using intuitionistic fuzzy hybrid weighted Euclidean distance operator. Int. J. Syst. Sci. 2014, 45, 2012–2030. [Google Scholar] [CrossRef]
  32. Liu, H.C.; You, J.X.; Fan, X.J.; Lin, Q.L. Failure mode and effects analysis using D numbers and grey relational projection method. Expert. Syst. Appl. 2014, 41, 4670–4679. [Google Scholar] [CrossRef]
  33. Liu, H.C.; Li, P.; You, J.X.; Chen, Y.Z. A Novel Approach for FMEA: Combination of Interval 2-Tuple Linguistic Variables and Gray Relational Analysis. Qual. Reliab. Eng. Int. 2015, 31, 761–772. [Google Scholar] [CrossRef]
  34. Yazdi, M. 2-tuple fuzzy-based linguistic term set approach to analyse the system safety and reliability. In Linguistic Methods Under Fuzzy Information in System Safety and Reliability Analysis; Springer International Publishing: Cham, Switzerland, 2022; pp. 5–12. [Google Scholar]
  35. Zhou, Q.; Thai, V.V. Fuzzy and grey theories in failure mode and effect analysis for tanker equipment failure prediction. Saf. Sci. 2016, 83, 74–79. [Google Scholar] [CrossRef]
  36. Yazdi, M.; Daneshvar, S.; Setareh, H. An extension to Fuzzy Developed Failure Mode and Effects Analysis (FDFMEA) application for aircraft landing system. Saf. Sci. 2017, 98, 113–123. [Google Scholar] [CrossRef]
  37. Fattahi, R.; Khalilzadeh, M. Risk evaluation using a novel hybrid method based on FMEA, extended MULTIMOORA, and AHP methods under fuzzy environment. Saf. Sci. 2018, 102, 290–300. [Google Scholar] [CrossRef]
  38. Li, H.; Díaz, H.; Guedes Soares, C. A failure analysis of floating offshore wind turbines using AHP-FMEA methodology. Ocean Eng. 2021, 234, 109261. [Google Scholar] [CrossRef]
  39. Li, H.; Soares, C.G. Reliability Analysis of Floating Offshore Wind Turbines Support Structure Using Hierarchical Bayesian Network; Research Publishing Services Singapore: Singapore, 2019. [Google Scholar]
  40. Johansen, I.L.; Rausand, M. Ambiguity in risk assessment. Saf. Sci. 2015, 80, 243–251. [Google Scholar] [CrossRef]
  41. Yazdi, M. Ignorance-aware safety and reliability analysis: A heuristic approach. Qual. Reliab. Eng. Int. 2020, 36, 652–674. [Google Scholar] [CrossRef]
  42. Helvacioglu, S.; Ozen, E. Fuzzy based failure modes and effect analysis for yacht system design. Ocean Eng. 2014, 79, 131–141. [Google Scholar] [CrossRef]
  43. Liu, H.C.; Lin, Q.L.; Mao, L.X.; Zhang, Z.Y. Dynamic adaptive fuzzy petri nets for knowledge representation and reasoning. IEEE Trans. Syst. Man. Cybern. Syst. 2013, 43, 1399–1410. [Google Scholar] [CrossRef]
  44. Chai, K.C.; Jong, C.H.; Tay, K.M.; Lim, C.P. A perceptual computing-based method to prioritize failure modes in failure mode and effect analysis and its application to edible bird nest farming. Appl. Soft Comput. J. 2016, 49, 734–747. [Google Scholar] [CrossRef]
  45. Yazdi, M.; Kabir, S.; Walker, M. Uncertainty handling in fault tree based risk assessment: State of the art and future perspectives. Process Saf. Environ. Prot. 2019, 131, 89–104. [Google Scholar] [CrossRef]
  46. Yazdi, M.; Khan, F.; Abbassi, R.; Rusli, R. Improved DEMATEL methodology for effective safety management decision- making. Saf. Sci. 2020, 127, 104705. [Google Scholar] [CrossRef]
  47. Adumene, S.; Ikue-John, H. Offshore system safety and operational challenges in harsh Arctic operations. J. Saf. Sci. Resil. 2022, 3, 153–168. [Google Scholar] [CrossRef]
  48. Kutlu, A.C.; Ekmekçioǧlu, M. Fuzzy failure modes and effects analysis by using fuzzy TOPSIS-based fuzzy AHP. Expert. Syst. Appl. 2012, 39, 61–67. [Google Scholar] [CrossRef]
  49. Nie, R.X.; Tian, Z.P.; Wang, X.K.; Wang, J.Q.; Wang, T.L. Risk evaluation by FMEA of supercritical water gasification system using multi-granular linguistic distribution assessment. Knowl. Based Syst. 2018, 162, 185–201. [Google Scholar] [CrossRef]
  50. Li, H.; Yazdi, M. Developing Failure Modes and Effect Analysis on Offshore Wind Turbines Using Two-Stage Optimization Probabilistic Linguistic Preference Relations. In Advanced Decision-Making Methods and Applications in System Safety and Reliability Problems: Approaches, Case Studies, Multi-Criteria Decision-Making, Multi-Objective Decision-Making, Fuzzy Risk-Based Models; Li, H., Yazdi, M., Eds.; Springer International Publishing: Cham, Switzerland, 2022; pp. 47–68. [Google Scholar] [CrossRef]
  51. Adesina, K.A.; Yazdi, M.; Zarei, E.; Pouyakian, M. Smart Decision Fuzzy-Based Data Envelopment Model for Failure Modes and Effects Analysis. In Linguistic Methods Under Fuzzy Information in System Safety and Reliability Analysis; Yazdi, M., Ed.; Springer International Publishing: Cham, Switzerland, 2022; pp. 151–170. [Google Scholar] [CrossRef]
  52. Liu, H.C. Improved FMEA Methods for Proactive Healthcare Risk Analysis, 1st ed.; Springer: Berlin/Heidelberg, Germany, 2019; pp. 246–253. [Google Scholar]
  53. WHO. Health Systems: Improving Performance; WHO: Geneva, Switzerland, 2000. [Google Scholar]
  54. Liu, H.C.; Ping, Y.J. Failure mode and effects analysis for proactive healthcare risk evaluation: A systematic literature review. J. Eval. Clin. Pract. 2019, 26, 1320–1337. [Google Scholar] [CrossRef]
  55. Liu, H.C.; You, X.Y.; Tsung, F.; Ji, P. An improved approach for failure mode and effect analysis involving large group of experts: An application to the healthcare field. Qual. Eng. 2018, 30, 762–775. [Google Scholar] [CrossRef]
  56. Binmore, K. Playing for Real: A Text on Game Theory; Oxford University Press: New York, NY, USA, 2007. [Google Scholar]
  57. Azgomi, H.; Sohrabi, M.K. Engineering Applications of Artificial Intelligence A game theory based framework for materialized view selection in data warehouses. Eng. Appl. Artif. Intell. 2018, 71, 125–137. [Google Scholar] [CrossRef]
  58. Sohrabi, M.K.; Azgomi, H. A Survey on the Combined Use of Optimization Methods and Game Theory. Arch. Comput. Methods Eng. 2020, 27, 59–80. [Google Scholar] [CrossRef]
  59. Khan, M.A.; Zhang, Y. Games and Economic Behavior On pure-strategy equilibria in games with correlated information. Games Econ. Behav. 2018, 111, 289–304. [Google Scholar] [CrossRef]
  60. Enomoto, H.; Hachimori, M.; Nakamura, S.; Shigeno, M. Pure-strategy Nash equilibria on competitive diffusion games. Discrete Appl. Math. 2018, 244, 1–19. [Google Scholar] [CrossRef]
  61. Khan, M.A.; Zhang, Y. Existence of pure-strategy equilibria in Bayesian games: A sharpened necessity result. Int. J. Game Theory 2017, 46, 167–183. [Google Scholar] [CrossRef]
  62. Iimura, T.; Watanabe, T. Pure strategy equilibrium in finite weakly unilaterally competitive games. Int. J. Game Theory 2016, 45, 719–729. [Google Scholar] [CrossRef]
  63. Demartsev, V.; Ilany, A.; Barocas, A.; Bar Ziv, E.; Schnitzer, I.; Koren, L.; Geffen, E. A mixed strategy of counter-singing behavior in male rock hyrax vocal competitions. Behav. Ecol. Sociobiol. 2016, 70, 2185–2193. Available online: http://www.jstor.org/stable/44856949 (accessed on 10 September 2023). [CrossRef]
  64. McKelvey, R.D.; Palfrey, T.R. Quantal Response Equilibria for Normal Form Games. Games Econ. Behav. 1995, 10, 6–38. [Google Scholar] [CrossRef]
  65. Rabin, M. Incorporating Fairness into Game Theory and Economics. Am. Econ. Rev. 1993, 83, 1281–1302. [Google Scholar]
  66. Von Neumann, J.; Morgenstern, O. Theory of Games and Economic Behavior; Princeton University Press: Princeton, NJ, USA, 1944. [Google Scholar]
  67. Carmona, G. On the Existence of Pure Strategy Nash Equilibria in Large Games. FEUNL Working Paper No 465. SSRN Electron. J. 2004, 1–24. [Google Scholar] [CrossRef]
  68. Deng, X.; Jiang, W.; Wang, Z. Zero-sum polymatrix games with link uncertainty: A Dempster-Shafer theory solution. Appl. Math. Comput. 2019, 340, 101–112. [Google Scholar] [CrossRef]
  69. Ding, X.F.; Liu, H.C. A new approach for emergency decision-making based on zero-sum game with Pythagorean fuzzy uncertain linguistic variables. Int. J. Intell. Syst. 2019, 34, 1667–1684. [Google Scholar] [CrossRef]
  70. Chen, Y.W.; Larbani, M. Two-person zero-sum game approach for fuzzy multiple attribute decision making problems. Fuzzy Sets Syst. 2006, 157, 34–51. [Google Scholar] [CrossRef]
  71. Madani, K.; Lund, J.R. A Monte-Carlo game theoretic approach for Multi-Criteria Decision Making under uncertainty. Adv. Water Resour. 2011, 34, 607–616. [Google Scholar] [CrossRef]
  72. Madani, K. Game theory and water resources. J. Hydrol. 2010, 381, 225–238. [Google Scholar] [CrossRef]
  73. Webb, J. Game Theory: Decisions, Interaction and Evolution; Springer: New York, NY, USA, 2007. [Google Scholar]
  74. Guo, J.; Liu, F.; Zeng, D.; Lui, J.C.S. A cooperative game based allocation for sharing data center networks. In Proceedings of the 2013 Proceedings IEEE INFOCOM, Turin, Italy, 14–19 April 2013; pp. 2139–2147. [Google Scholar]
  75. Li, S.; Liu, Y.; Deininger, K. How important are endogenous peer effects in group lending? Estimating a static game of incomplete information. J. Appl. Econom. 2013, 882, 864–882. [Google Scholar] [CrossRef]
  76. Guo, L.; Huang, S.; Zhuang, J.; Sadek, A.W. Modeling Parking Behavior Under Uncertainty: A Static Game Theoretic versus a Sequential Neo-additive Capacity Modeling Approach. Netw. Spat. Econ. 2013, 13, 327–350. [Google Scholar] [CrossRef]
  77. Alexander, J.M. Evolutionary game theory. In Elements in Decision Theory and Philosophy; Cambridge University Press: Cambridge, UK, 2023. [Google Scholar]
  78. Ma, J.; Liu, Y.; Song, L.; Member, S.; Han, Z. Multiact Dynamic Game Strategy for Jamming Attack in Electricity Market. IEEE Trans. Smart Grid 2015, 6, 2273–2282. [Google Scholar] [CrossRef]
  79. Mediwaththe, C.P.; Member, S.; Stephens, E.R.; Smith, D.B. A Dynamic Game for Electricity Load Management in Neighborhood Area Networks. IEEE Trans. Smart Grid 2015, 7, 1329–1336. [Google Scholar] [CrossRef]
  80. Han, Z.; Ma, J.; Si, F.; Ren, W. Entropy Complexity and Stability of a Nonlinear Dynamic Game Model with Two Delays. Entropy. 2016, 18, 317. [Google Scholar] [CrossRef]
  81. Anand, V.; Gupta, V. Markov Pricing Equilibrium in a Prosumer-Aggregator Dynamic Game. In Proceedings of the American Control Conference (ACC), Boston, MA, USA, 6–8 July 2016; pp. 4120–4125. [Google Scholar]
  82. Tian, R.; Zhang, Q.; Wang, G.; Li, H.; Chen, S.; Li, Y.; Tian, Y. Study on the promotion of natural gas-fired electricity with energy market reform in China using a dynamic game-theoretic model. Appl. Energy 2017, 185, 1832–1839. [Google Scholar] [CrossRef]
  83. Chander, P. Subgame-perfect cooperative agreements in a dynamic game of climate change $. J. Environ. Econ. Manag. 2017, 84, 173–188. [Google Scholar] [CrossRef]
  84. Zhu, K.; Hossain, E.; Niyato, D. Pricing, Spectrum Sharing, and Service Selection in Two-Tier Small Cell Networks. IEEE Trans. Mob. Comput. 2014, 13, 1843–1856. [Google Scholar] [CrossRef]
  85. Ma, J.; Guo, Z. The parameter basin and complex of dynamic game with estimation and two-stage consideration. Appl. Math. Comput. 2014, 248, 131–142. [Google Scholar] [CrossRef]
  86. Thandapani, P. An energy-efficient clustering and multipath routing for mobile wireless sensor network using game theory. Int. J. Commun. Syst. 2020, e4336. [Google Scholar] [CrossRef]
  87. Lee, J.; Liu, K.; Wu, Y. Does the Asian catch-up model of world-class universities work ? Revisiting the zero-sum game of global university rankings and government policies. Educ. Res. Policy Pract. 2020, 19, 319–343. [Google Scholar] [CrossRef]
  88. Aziz, F.M.; Li, L.; Shamma, J.S.; Stüber, G.L. Resilience of LTE eNode B against smart jammer in infinite-horizon asymmetric repeated zero-sum game. Phys. Commun. 2020, 39, 100989. [Google Scholar] [CrossRef]
  89. Lidbetter, T.; Lin, K.Y. A search game on a hypergraph with booby traps. Theor. Comput. Sci. 2020, 821, 57–70. [Google Scholar] [CrossRef]
  90. Jonge, D.D.; Zhang, D. Strategic Negotiations for Extensive-Form Games. In Autonomous Agents and Multi-Agent Systems; Springer: NewYork, NY, USA, 2020; Volume 34, pp. 1–41. [Google Scholar]
  91. He, Y.; Yang, J.; Chen, X.; Lin, K.; Zheng, Y.; Wang, Z. A two-stage approach to basin-scale water demand prediction. Water Resour. Manag. 2018, 32, 401–416. [Google Scholar] [CrossRef]
  92. Jiang, H.; Zhang, H.; Zhang, K.; Cui, X. Neurocomputing Data-driven adaptive dynamic programming schemes for non-zero-sum games of unknown discrete-time nonlinear systems. Neurocomputing 2018, 275, 649–658. [Google Scholar] [CrossRef]
  93. Odekunle, A.; Gao, W.; Davari, M.; Jiang, Z.P. Automatica Reinforcement learning and non-zero-sum game output regulation for multi-player linear uncertain systems. Automatica 2020, 112, 108672. [Google Scholar] [CrossRef]
  94. Helil, N.; Halik, A.; Rahman, K. Non-zero-sum cooperative access control game model with user trust and permission risk. Appl. Math. Comput. 2017, 307, 299–310. [Google Scholar] [CrossRef]
  95. Motalleb, M.; Ghorbani, R. Non-cooperative game-theoretic model of demand response aggregator competition for selling stored energy in storage devices. Appl. Energy 2017, 202, 581–596. [Google Scholar] [CrossRef]
  96. Fahimi, M.; Ghasemi, A. Joint spectrum load balancing and handoff management in cognitive radio networks: A non-cooperative game approach. Wirel. Netw. 2016, 22, 1161–1180. [Google Scholar] [CrossRef]
  97. Wang, Y.; Tian, L.; Chen, Z. Game analysis of access control based on user behavior trust. Information 2019, 10, 132. [Google Scholar] [CrossRef]
  98. Vamvoudakis, K.G.; Lewis, F.L. Multi-player non-zero-sum games: Online adaptive learning solution of coupled Hamilton–Jacobi equations. Automatica 2011, 47, 1556–1569. [Google Scholar] [CrossRef]
  99. Lozano, S.; Moreno, P.; Adenso-díaz, B.; Algaba, E. European Journal of Operational Research Cooperative game theory approach to allocating benefits of horizontal cooperation. Eur. J. Oper. Res. 2013, 229, 444–452. [Google Scholar] [CrossRef]
  100. Shamshirband, S.; Patel, A.; Badrul, N. Engineering Applications of Arti fi cial Intelligence Cooperative game theoretic approach using fuzzy Q-learning for detecting and preventing intrusions in wireless sensor networks. Eng. Appl. Artif. Intell. 2014, 32, 228–241. [Google Scholar] [CrossRef]
  101. Velez, J.A.; Greitemeyer, T.; Whitaker, J.L.; Ewoldsen, D.R.; Bushman, B.J. Violent Video Games and Reciprocity: The Attenuating Effects of Cooperative Game Play on Subsequent Aggression. Commun. Res. 2016, 43, 447–467. [Google Scholar] [CrossRef]
  102. Rezaei, J. Best-worst multi-criteria decision-making method. Omega 2015, 53, 49–57. [Google Scholar] [CrossRef]
  103. Rausand, M.; Høyland, A. System Reliability Theory: Models, Statistical Methods, and Applications, 2nd ed.; John Wiley & Sons, Inc.: Hoboken, NJ, USA, 1994. [Google Scholar]
  104. Rezaei, J. Best-worst multi-criteria decision-making method: Some properties and a linear model. Omega 2016, 64, 126–130. [Google Scholar] [CrossRef]
  105. Mahdiraji, H.A.; Arzaghi, S.; Stauskis, G.; Zavadskas, E.K. A hybrid fuzzy BWM-COPRAS method for analyzing key factors of sustainable architecture. Sustainability 2018, 10, 1626. [Google Scholar] [CrossRef]
  106. Yadav, G.; Mangla, S.K.; Luthra, S.; Jakhar, S. Hybrid BWM-ELECTRE-based decision framework for effective offshore outsourcing adoption: A case study. Int. J. Prod. Res. 2018, 56, 6259–6278. [Google Scholar] [CrossRef]
  107. Aboutorab, H.; Saberi, M.; Asadabadi, M.R.; Hussain, O.; Chang, E. ZBWM: The Z-number extension of Best Worst Method and its application for supplier development. Expert. Syst. Appl. 2018, 107, 115–125. [Google Scholar] [CrossRef]
  108. Li, H.; Yazdi, M. (Eds.) Advanced Decision-Making Neutrosophic Fuzzy Evidence-Based Best–Worst Method. In Advanced Decision-Making Methods and Applications in System Safety and Reliability Problems: Approaches, Case Studies, Multi-Criteria Decision-Making, Multi-Objective Decision-Making, Fuzzy Risk-Based Models; Springer International Publishing: Cham, Switzerland, 2022; pp. 153–184. [Google Scholar] [CrossRef]
  109. Mi, X.; Tang, M.; Liao, H.; Shen, W.; Lev, B. The state-of-the-art survey on integrations and applications of the best worst method in decision making: Why, what, what for and what’s next? Omega 2019, 87, 205–225. [Google Scholar] [CrossRef]
  110. Chang, T.W.; Lo, H.W.; Chen, K.Y.; Liou, J.J.H. A Novel FMEA Model Based on Rough BWM and Rough TOPSIS-AL for Risk Assessment. Mathematics 2019, 7, 874. [Google Scholar] [CrossRef]
  111. Akbari, R.; Dabbagh, R.; Ghoushchi, S.J. HSE risk prioritization of molybdenum operation process using extended FMEA approach based on Fuzzy BWM and Z-WASPAS. J. Intell. Fuzzy Syst. 2020, 38, 5157–5173. [Google Scholar] [CrossRef]
  112. Mzougui, I.; Felsoufi, Z.E. A modified method to improve failure analysis. Int. J. Syst. Assur. Eng. Manag. 2021, 12, 231–244. [Google Scholar] [CrossRef]
  113. Momen, S.; Tavakkoli-Moghaddam, R.; Ghasemkhani, A.; Shahnejat-Bushehri, S.; Tavakkoli-Moghaddam, H. Prioritizing Surgical Cancellation Factors Based on a Fuzzy Best-Worst Method: A Case Study. IFAC-PapersOnLine 2019, 52, 112–117. [Google Scholar] [CrossRef]
  114. Liou, J.J.H.; Liu, P.C.Y.; Lo, H.W. A Failure Mode Assessment Model Based on Neutrosophic Logic for Switched-Mode Power Supply Risk Analysis. Mathematics 2020, 8, 2145. [Google Scholar] [CrossRef]
  115. Zadeh, L.A. The Concept of a Linguistic Variable and its Application to Approximate Reasoning-I. Inf. Sci. 1975, 8, 199–249. [Google Scholar] [CrossRef]
  116. Deveci, M.; Eriskin, L.; Karatas, M. A survey on recent applications of pythagorean fuzzy sets: A state-of-the-art between 2013 and 2020. In Pythagorean Fuzzy Sets: Theory Applications; Springer: Berlin/Heidelberg, Germany, 2021; pp. 3–8. [Google Scholar]
  117. Li, H.; Yazdi, M. (Eds.) What Are the Critical Well-Drilling Blowouts Barriers? A Progressive DEMATEL-Game Theory. In Advanced Decision-Making Methods and Applications in System Safety and Reliability Problems: Approaches, Case Studies, Multi-Criteria Decision-Making, Multi-Objective Decision-Making, Fuzzy Risk-Based Models; Springer International Publishing: Cham, Switzerland, 2022; pp. 29–46. [Google Scholar] [CrossRef]
  118. Zhou, J.; Li, K.W.; Baležentis, T.; Streimikiene, D. Pythagorean fuzzy combinative distance-based assessment with pure linguistic information and its application to financial strategies of multi- national companies. Econ. Res.-Ekon. Istraživanja 2020, 33, 974–998. [Google Scholar] [CrossRef]
  119. Peng, X.; Selvachandran, G. Pythagorean fuzzy set: State of the art and future directions. Artif. Intell. Rev. 2019, 52, 1873–1927. [Google Scholar] [CrossRef]
  120. Ren, P.; Xu, Z.; Gou, X. Pythagorean fuzzy TODIM approach to multi-criteria decision making. Appl. Soft Comput. J. 2016, 42, 246–259. [Google Scholar] [CrossRef]
  121. Yager, R.R. Pythagorean fuzzy subsets. In Proceedings of the 2013 Joint IFSA World Congress and NAFIPS Annual Meeting, IFSA/NAFIPS 2013, Edmonton, AB, Canada, 24–28 June 2013; Volume 2, pp. 57–61. [Google Scholar]
  122. Yager, R.R. Pythagorean membership grades in multicriteria decision making. IEEE Trans. Fuzzy Syst. 2014, 22, 958–965. [Google Scholar] [CrossRef]
  123. Ozceylan, E.; Ozkan, B.; Kabak, M.; Dagdeviren, M. A survey on spherical fuzzy sets and clustering the literature. In Intelligent and Fuzzy Techniques: Smart and Innovative Solutions, Proceedings of the INFUS 2020 Conference, Istanbul, Turkey, 21–23 July 2020; Springer International Publishing: Berlin/Heidelberg, Germany, 2021; pp. 87–97. [Google Scholar]
  124. Almeraz-Durán, S.; Pérez-Domínguez, L.A.; Luviano-Cruz, D.; Hernández Hernández, J.I.; Romero López, R.; Valle-Rosales, D.J. A proposed framework for developing FMEA method using pythagorean fuzzy CODAS. Symmetry 2021, 13, 2236. [Google Scholar] [CrossRef]
  125. Li, H.; Yazdi, M. (Eds.) Integration of the Bayesian Network Approach and Interval Type-2 Fuzzy Sets for Developing Sustainable Hydrogen Storage Technology in Large Metropolitan Areas. In Advanced Decision-Making Methods and Applications in System Safety and Reliability Problems: Approaches, Case Studies, Multi-Criteria Decision-Making, Multi-Objective Decision-Making, Fuzzy Risk-Based Models; Springer International Publishing: Cham, Switzerland, 2022; pp. 69–85. [Google Scholar] [CrossRef]
  126. Zhang, X.; Xu, Z. Extension of TOPSIS to Multiple Criteria Decision Making with Pythagorean Fuzzy Sets. Int. J. Intell. Syst. 2014, 29, 1061–1078. [Google Scholar] [CrossRef]
  127. Sajjad Ali Khan, M.; Ali, A.; Abdullah, S.; Amin, F.; Hussain, F. New extension of TOPSIS method based on Pythagorean hesitant fuzzy sets with incomplete weight information. J. Intell. Fuzzy Syst. 2018, 35, 5435–5448. [Google Scholar] [CrossRef]
  128. Gul, M.; Ak, M.F.; Guneri, A.F. Pythagorean fuzzy VIKOR-based approach for safety risk assessment in mine industry. J. Saf. Res. 2019, 69, 135–153. [Google Scholar] [CrossRef]
  129. Zeng, W.; Li, D.; Yin, Q. Distance and similarity measures of Pythagorean fuzzy sets and their applications to multiple criteria group decision making. Int. J. Intell. Syst. 2018, 33, 2236–2254. [Google Scholar] [CrossRef]
  130. Geng, Y.; Liu, P.; Teng, F.; Liu, Z. Pythagorean fuzzy uncertain linguistic TODIM method and their application to multiple criteria group decision making. J. Intell. Fuzzy Syst. 2017, 33, 3383–3395. [Google Scholar] [CrossRef]
  131. Liu, C.; Tang, G.; Liu, P. An Approach to Multicriteria Group Decision-Making with Unknown Weight Information Based on Pythagorean Fuzzy Uncertain Linguistic Aggregation Operators. Math. Probl. Eng. 2017, 2017, 6414020. [Google Scholar] [CrossRef]
  132. Shakeel, M.; Aslam, M.; Jamil, M. Method of MAGDM based on pythagorean trapezoidal uncertain linguistic hesitant fuzzy aggregation operator with Einstein operations. J. Intell. Fuzzy Syst. 2020, 38, 2211–2230. [Google Scholar] [CrossRef]
  133. Ma, J.; Zheng, Y.; Wu, B.; Wang, L. Equilibrium topology of multi-agent systems with two leaders: A zero-sum game perspective. Automatica 2016, 73, 200–206. [Google Scholar] [CrossRef]
  134. Dağsuyu, C.; Göçmen, E.; Narlı, M.; Kokangül, A. Classical and fuzzy FMEA risk analysis in a sterilization unit. Comput. Ind. Eng. 2016, 101, 286–294. [Google Scholar] [CrossRef]
  135. Papi, M.; Pontecorvi, L.; Setola, R. A new model for the length of stay of hospital patients. Health Care Manag. Sci. 2016, 19, 58–65. [Google Scholar] [CrossRef]
  136. Li, H.; Peng, W.; Adumene, S.; Yazdi, M. (Eds.) Advances in Failure Prediction of Subsea Components Considering Complex Dependencies. In Intelligent Reliability and Maintainability of Energy Infrastructure Assets; Springer Nature: Cham, Switzerland, 2023; pp. 93–105. [Google Scholar] [CrossRef]
  137. Li, H.; Peng, W.; Adumene, S.; Yazdi, M. (Eds.) Operations Management of Critical Energy Infrastructure: A Sustainable Approach. In Intelligent Reliability and Maintainability of Energy Infrastructure Assets; Springer Nature: Cham, Switzerland, 2023; pp. 39–52. [Google Scholar] [CrossRef]
  138. Adesina, K.A.; Yazdi, M.; Omidvar, M. Emergency Decision Making Fuzzy-Expert Aided Disaster Management System. In Linguistic Methods Under Fuzzy Information in System Safety and Reliability Analysis; Yazdi, M., Ed.; Springer International Publishing: Cham, Switzerland, 2022; pp. 139–150. [Google Scholar] [CrossRef]
  139. Wang, X.; Triantaphyllou, E. Ranking irregularities when evaluating alternatives by using some ELECTRE methods. Omega 2008, 36, 45–63. [Google Scholar] [CrossRef]
Figure 1. The proposed framework for the developed FMEA (referred to as PFULVs, which stands for ‘Pythagorean Fuzzy Uncertain Linguistic Variables’).
Safety 10 00004 g001
Figure 2. Ranking conformity of failure modes based on different scenarios.
Safety 10 00004 g002
Figure 3. The importance ranking of all different methods.
Safety 10 00004 g003
Table 1. The developed FMEA of a complex healthcare unit under the emergency condition.
Failure Modes TagFailure Mode DescriptionCauses of Failure ModesEffect of Failure ModesCurrent Control Activities
F 1The biological growth forms Over-presence of medical staff Damp conditions slow the evaporation of moisture N/A
F 2Particles increase in the workplacePoor, or lack of, air conditioning in the workplace or positive air pressureIncreases the number of viral respiratory illness on medical staffAir conditioner
F 3Increases the anger and nerves of medical staffViral respiratory illness emergency state condition Fights, lack of motivation, suicide, and performing at low quality N/A
F 4Increasing the number of complaints by medical staffViral respiratory illness emergency state conditionPhysical fights, lack of motivation, suicide, and performing at low qualityN/A
F 5Increasing the risk of carcinogenic and mutagenicExposure increases to the hazardous substancesConfront medical staff with long-term viral respiratory illnessFollowing healthcare instruction
F 6Increasing the inhalation of ethylene oxide and formaldehydeExposure increases to the oxide and formaldehydeConfront medical staff with short- and long-term diseasesFollowing healthcare instructions
F 7Increasing the level of burning Contact with hot water from an autoclave Loss of working hoursService check of autoclave periodically
F 8Increasing the high level of burning The explosion of autoclave and contact with super steamLoss of working hoursService check of autoclave periodically
F 9Increasing the number of workplace injuries Falling, rolling, or overturning of unsecured medical tools Loss of working hoursSafety training periodically
F 10Increasing the standing posture for a long timeLack of enough employees and high workload Cardiovascular diseases and musculoskeletal problems Safety training periodically
F 11Increasing the number of falling, jamming, or tumbling incidentsWet or slippery floor of the workplaceLimbs or sprain injuriesSafety training periodically
F 12Increasing contamination of medical staff body fluids and bloodContact contaminated tools with skinIncreasing the number of diseases on medical staffFollowing healthcare instructions
F 13Increasing contamination of medical staff body fluids and bloodContact with contaminated tools with eyesIncreasing the number of diseases on medical staffFollowing healthcare instructions
F 14Increasing transmission infectionsContact with a stab wound and contaminated physical environment Increasing the number of diseases on medical staffFollowing healthcare instructions
F 15Increasing transmission infectionsContact with contaminated medical waste material Increasing the number of diseases on medical staffFollowing healthcare instructions
F 16Increasing transmission infectionsContact with a stab wound chemical waste material like GlutaraldehydeIncreasing the number of diseases on medical staffFollowing healthcare instructions
F 17Increasing transmission infectionsContact with inappropriate use of a bag to stab wasteIncreasing the number of diseases on medical staffFollowing healthcare instructions
F 18Increasing electric shock Electrical leakage from electric medical toolsLoss of working hoursSafety training periodically and using earth rods
F 19Increasing the number of physical violence incidentsContact with patients and patients’ companions Fights, lack of motivation, suicide, and performing low qualityN/A
F 20Increasing the number of verbal violence incidentsContact with patients and patients’ companionsFights, lack of motivation, suicide, and performing low qualityN/A
F 21Increasing the number of sexual harassmentsContact with patients and patients’ companionsFights, lack of motivation, suicide, and performing low qualityNA
F 22An increasing allergic reaction of medical staff (respiratory-based)Exposure to the chemical spilledLoss of working hoursNA
F 23An increasing allergic reaction of medical staff (skin-based)Use of allergy-causing medical materials like gloves, etc.Loss of working hoursNA
Table 2. The risk factors’ importance weight.
Decision-MakersSeverityOccurrenceDetectionDecision-Makers’ Importance Weight
D M 1 0.7380.1790.0830.250
D M 2 0.7180.2050.0770.275
D M 3 0.7140.1430.1430.325
D M 4 0.7080.0830.2080.150
Risk factors’ weight0.6140.1470.0881.000
Table 3. Aggregated Pythagorean fuzzy uncertain linguistic variables payoff matrix.
Failure Modes TagSeverityOccurrenceDetection
F 1 φ 0.1796 , φ 0.2218 , ( 0.2803 , 0.0865 ) φ 0.2322 , φ 0.1957 , ( 0.3913 , 0.0359 ) φ 0.2154 , φ 0.2039 , ( 0.3942 , 0.0064 )
F 2 φ 0.2195 , φ 0.1815 , ( 0.3881 , 0.0094 ) φ 0.2152 , φ 0.1871 , ( 0.3765 , 0.0086 ) φ 0.1034 , φ 0.2394 , ( 0.1243 , 0.1672 )
F 3 φ 0.2278 , φ 0.1752 , ( 0.3753 , 0.0184 ) φ 0.1891 , φ 0.2218 , ( 0.3037 , 0.0382 ) φ 0.1769 , φ 0.2404 , ( 0.2923 , 0.0217 )
F 4 φ 0.2278 , φ 0.1752 , ( 0.3728 , 0.0135 ) φ 0.1891 , φ 0.2218 , ( 0.2416 , 0.0849 ) φ 0.1769 , φ 0.2404 , ( 0.3194 , 0.0523 )
F 5 φ 0.2238 , φ 0.1725 , ( 0.3945 , 0.0061 ) φ 0.1712 , φ 0.2208 , ( 0.3895 , 0.0107 ) φ 0.2040 , φ 0.1991 , ( 0.2991 , 0.0718 )
F 6 φ 0.2272 , φ 0.1688 , ( 0.4380 , 0.0002 ) φ 0.2205 , φ 0.1915 , ( 0.3613 , 0.0131 ) φ 0.1886 , φ 0.2181 , ( 0.3771 , 0.0194 )
F 7 φ 0.2361 , φ 0.1178 , ( 0.3981 , 0.0042 ) φ 0.2065 , φ 0.2078 , ( 0.1785 , 0.8017 ) φ 0.2121 , φ 0.2177 , ( 0.3599 , 0.0139 )
F 8 φ 0.2285 , φ 0.1608 , ( 0.3981 , 0.0042 ) φ 0.1351 , φ 0.8368 , ( 0.1785 , 0.1324 ) φ 0.1977 , φ 0.2303 , ( 0.3535 , 0.0011 )
F 9 φ 0.2268 , φ 0.1602 , ( 0.4028 , 0.0036 ) φ 0.1900 , φ 0.2331 , ( 0.3413 , 0.0207 ) φ 0.2319 , φ 0.1555 , ( 0.4034 , 0.0102 )
F 10 φ 0.1984 , φ 0.2243 , ( 0.3590 , 0.0150 ) φ 0.1894 , φ 0.2115 , ( 0.2766 , 0.0656 ) φ 0.2290 , φ 0.1808 , ( 0.4047 , 0.0087 )
F 11 φ 0.1579 , φ 0.2258 , ( 0.2164 , 0.1004 ) φ 0.2101 , φ 0.2087 , ( 0.3516 , 0.0175 ) φ 0.2183 , φ 0.2045 , ( 0.3929 , 0.0283 )
F 12 φ 0.2385 , φ 0.1095 , ( 0.4451 , 0.0002 ) φ 0.2143 , φ 0.2265 , ( 0.4064 , 0.0047 ) φ 0.1953 , φ 0.2371 , ( 0.3348 , 0.0003 )
F 13 φ 0.2187 , φ 0.2075 , ( 0.4128 , 0.0021 ) φ 0.1519 , φ 0.2330 , ( 0.2155 , 0.1002 ) φ 0.2388 , φ 0.1162 , ( 0.4412 , 0.0097 )
F 14 φ 0.2394 , φ 0.1034 , ( 0.4499 , 0.0001 ) φ 0.2394 , φ 0.1034 , ( 0.4499 , 0.0001 ) φ 0.2253 , φ 0.1847 , ( 0.3796 , 0.0163 )
F 15 φ 0.2394 , φ 0.1034 , ( 0.4499 , 0.0001 ) φ 0.2394 , φ 0.1034 , ( 0.4499 , 0.0001 ) φ 0.2213 , φ 0.1806 , ( 0.3930 , 0.0047 )
F 16 φ 0.2394 , φ 0.1034 , ( 0.4499 , 0.0001 ) φ 0.2394 , φ 0.1034 , ( 0.4499 , 0.0001 ) φ 0.2155 , φ 0.1703 , ( 0.3532 , 0.0060 )
F 17 φ 0.2394 , φ 0.1034 , ( 0.4499 , 0.0001 ) φ 0.2394 , φ 0.1034 , ( 0.4499 , 0.0001 ) φ 0.2276 , φ 0.1429 , ( 0.4052 , 0.0133 )
F 18 φ 0.2143 , φ 0.2039 , ( 0.3700 , 0.0225 ) φ 0.2158 , φ 0.1785 , ( 0.3729 , 0.0065 ) φ 0.2099 , φ 0.2146 , ( 0.3784 , 0.0284 )
F 19 φ 0.1975 , φ 0.2213 , ( 0.3424 , 0.0236 ) φ 0.1902 , φ 0.2334 , ( 0.3143 , 0.0419 ) φ 0.1908 , φ 0.2373 , ( 0.3252 , 0.0154 )
F 20 φ 0.2141 , φ 0.2026 , ( 0.3528 , 0.0201 ) φ 0.2134 , φ 0.2090 , ( 0.3531 , 0.0602 ) φ 0.2141 , φ 0.2026 , ( 0.3528 , 0.0214 )
F 21 φ 0.1924 , φ 0.2213 , ( 0.3234 , 0.0366 ) φ 0.2086 , φ 0.2091 , ( 0.3606 , 0.0247 ) φ 0.2120 , φ 0.2013 , ( 0.3730 , 0.0167 )
F 22 φ 0.1915 , φ 0.2239 , ( 0.3235 , 0.0395 ) φ 0.2295 , φ 0.1990 , ( 0.3893 , 0.0361 ) φ 0.1938 , φ 0.2404 , ( 0.3629 , 0.0227 )
F 23 φ 0.1967 , φ 0.2089 , ( 0.3038 , 0.0569 ) φ 0.1250 , φ 0.2353 , ( 0.1575 , 0.1439 ) φ 0.1938 , φ 0.2404 , ( 0.3629 , 0.0239 )
Table 4. Failure modes ranking comparison.
Failure Modes TagsSeverity-BasedOccurrence-BasedLinguistic Based
F 1887
F 210922
F 3111415
F 491120
F 5131218
F 614136
F 71223
F 823171
F 915158
F 10192114
F 112117
F 1212102
F 13202319
F 14549
F 15773
F 16654
F 174313
F 1821195
F 19222211
F 20182016
F 21171810
F 22161612
F 233621
Table 5. The “Spearman correlation coefficient” of failure modes ranking among each pair of methods.
Importance WeightPairwise Comparison “Spearman Correlation Coefficient”
6Severity-basedOccurrence-based0.95
5Game-Theory-based Severity-based0.90
4Game-Theory-based Occurrence-based0.86
3Game-Theory-based Linguistic based−0.06
2Occurrence-basedLinguistic based−0.11
1Severity-basedLinguistic based−0.29
Disclaimer/Publisher’s Note: The statements, opinions and data contained in all publications are solely those of the individual author(s) and contributor(s) and not of MDPI and/or the editor(s). MDPI and/or the editor(s) disclaim responsibility for any injury to people or property resulting from any ideas, methods, instructions or products referred to in the content.

