Article

A Semantic Hybrid Temporal Approach for Detecting Driver Mental Fatigue

1
School of Electrical, Computer and Telecommunications Engineering (SECTE), University of Wollongong, Wollongong, NSW 2522, Australia
2
School of Engineering, RMIT University, Melbourne, VIC 3000, Australia
3
Department of Electronic Engineering, Larkana Campus, Quaid-e-Awam University of Engineering, Science and Technology, Larkana 77150, Pakistan
*
Author to whom correspondence should be addressed.
Submission received: 13 November 2023 / Revised: 2 January 2024 / Accepted: 4 January 2024 / Published: 9 January 2024

Abstract

:
Driver mental fatigue is considered a major factor affecting driver behavior that may result in fatal accidents. Several approaches are addressed in the literature to detect fatigue behavior in a timely manner through either physiological or in-vehicle measurement methods. However, the literature lacks the implementation of hybrid approaches that combine the strength of individual approaches to develop a robust fatigue detection system. In this regard, a hybrid temporal approach is proposed in this paper to detect driver mental fatigue through the combination of driver postural configuration with vehicle longitudinal and lateral behavior on a study sample of 34 diverse participants. A novel fully adaptive symbolic aggregate approximation (faSAX) algorithm is proposed, which adaptively segments and assigns symbols to the segmented time-variant fatigue patterns according to the discrepancy in postural behavior and vehicle parameters. These multivariate symbols are then combined to prepare the bag of words (text format dataset), which is further processed to generate a semantic report of the driver’s status and vehicle situations. The report is then analyzed by a natural language processing scheme working as a sequence-to-label classifier that detects the driver’s mental state and a possible outcome of the vehicle situation. The ground truth of report formation is validated against measurements of mental fatigue through brain signals. The experimental results show that the proposed hybrid system successfully detects time-variant driver mental fatigue and drowsiness states, along with vehicle situations, with an accuracy of 99.6% compared to state-of-the-art systems. The limitations of the current work and directions for future research are also explored.

1. Introduction

Driver fatigue significantly contributes to driving errors that, in turn, can lead to fatal crashes [1,2,3]. According to Transport for New South Wales (NSW), Australia, between 2015 and 2019, approximately 290 deaths out of 1160 reported fatalities resulted from driver fatigue, ranking it as the second most perilous factor after speeding [4]. May and Baldwin [5] suggest that driver fatigue can be experienced due to: (a) sleep deprivation during circadian rhythms causing drowsiness, or (b) cognitive underload or overload causing tiredness and inattentiveness. Overload conditions are prompted due to poor visibility at night, heavy traffic, and demanding driving tasks on complex roads. On the contrary, underload conditions are induced due to continuous driving on long monotonous highways and negligible environmental feedback due to smart suspension or shared control systems.
Various methods are employed in the literature to detect the state of mental fatigue in drivers, utilizing visual, physiological, and in-vehicle measurement approaches [2,6,7,8,9]. However, each method presents its own set of advantages and disadvantages. Clinical physiological methods, such as electroencephalography (EEG) [10], electrocardiogram (ECG) [11], and skin conductivity [12], offer precise insights into the driver’s vital signs. Nevertheless, their intrusive nature, involving the placement of sensors on the skin and the scalp, renders them impractical for real-world driving applications [10,11,12]. On the other hand, visual-based systems nonintrusively monitor facial features and eye gaze position [13,14,15]. However, challenges arise from factors like vehicle lighting, sunglasses, or face masks, posing obstacles to accurate driver state detection using camera-based systems. Wearable sensors, although still intrusive, are perceived as a viable alternative to medical-grade methods and visual techniques [16]. Devices such as smartwatches, fitness trackers, motion trackers, wearable clothes, and caps have been increasingly utilized for real-time driver behavior identification [7,17]. Moreover, human-machine shared control is also required to tackle the operator fatigue behavior [18,19]. Despite being categorized as direct driver measurement approaches focusing solely on driver characteristics, they remain unaware of the vehicle situation. In contrast, an indirect measurement approach involves monitoring driver states through vehicle dynamics and features, including path planning, speed, roll rate, steering, and lane deviations [20,21]. However, due to the inherent uncertainty in driver conditions, indirect measurement methods alone may prove insufficient for accurately detecting the true driver state [8,20].
To address the gaps identified above, this paper investigates the effects of underload mental or cognitive fatigue during peak sleepy times on body posture in conjunction with vehicle behavior (longitudinal and lateral information) on a long, monotonous, straight highway scenario. In the conducted study, temporal data from 34 subjects were acquired using XSENS motion trackers (MTs) in a simulated driving environment [22]. The raw 3D acceleration data of driver posture (head, neck, and sternum), vehicle road wheel angle, and vehicle speed were utilized to develop a multivariate hybrid dataset. A novel improved and fully adaptive temporal symbolic aggregate approximation (SAX) algorithm was then developed based on the unsupervised Gaussian mixture models (GMM) of the acquired data [23]. The GMM-generated sequences portrayed the cluster numbers for each time step in the multidimensional dataset. The proposed fully adaptive SAX (faSAX) method determined the adaptive sliding window and thresholds of the temporal data, leveraging GMM sequences for detecting temporal patterns related to mental fatigue and vehicle longitudinal and lateral situations, all without relying on predefined threshold criteria.
Leveraging the semantic or symbolic (symbols or text letters) driving patterns from faSAX, our hybrid system generated a semiotic (text-format) report, encompassing both driver and vehicle situations. The accuracy of the driver status report was rigorously validated against EEG brain signal measurements [24]. Analyzing these reports using a natural language processing (NLP) scheme based on a BiLSTM deep learning network [25], acting as a sequence-to-label classifier, enabled a precise detection of driver mental states and potential vehicle outcomes. Our experimental results showcased the superior performance of our hybrid system in accurately identifying time-variant driver mental fatigue and drowsiness states, surpassing existing state-of-the-art systems in discerning both driver conditions and vehicle situations.
The earlier results of this study were published as a conference paper [26]. This paper provides the latest results and a more detailed description of the proposed method, with the following key contributions:
  • To the best of the authors’ knowledge, this study marks the inaugural effort in concentrating on the identification of the driver’s temporal patterns of mental fatigue state through a hybrid approach integrating body posture and vehicle information.
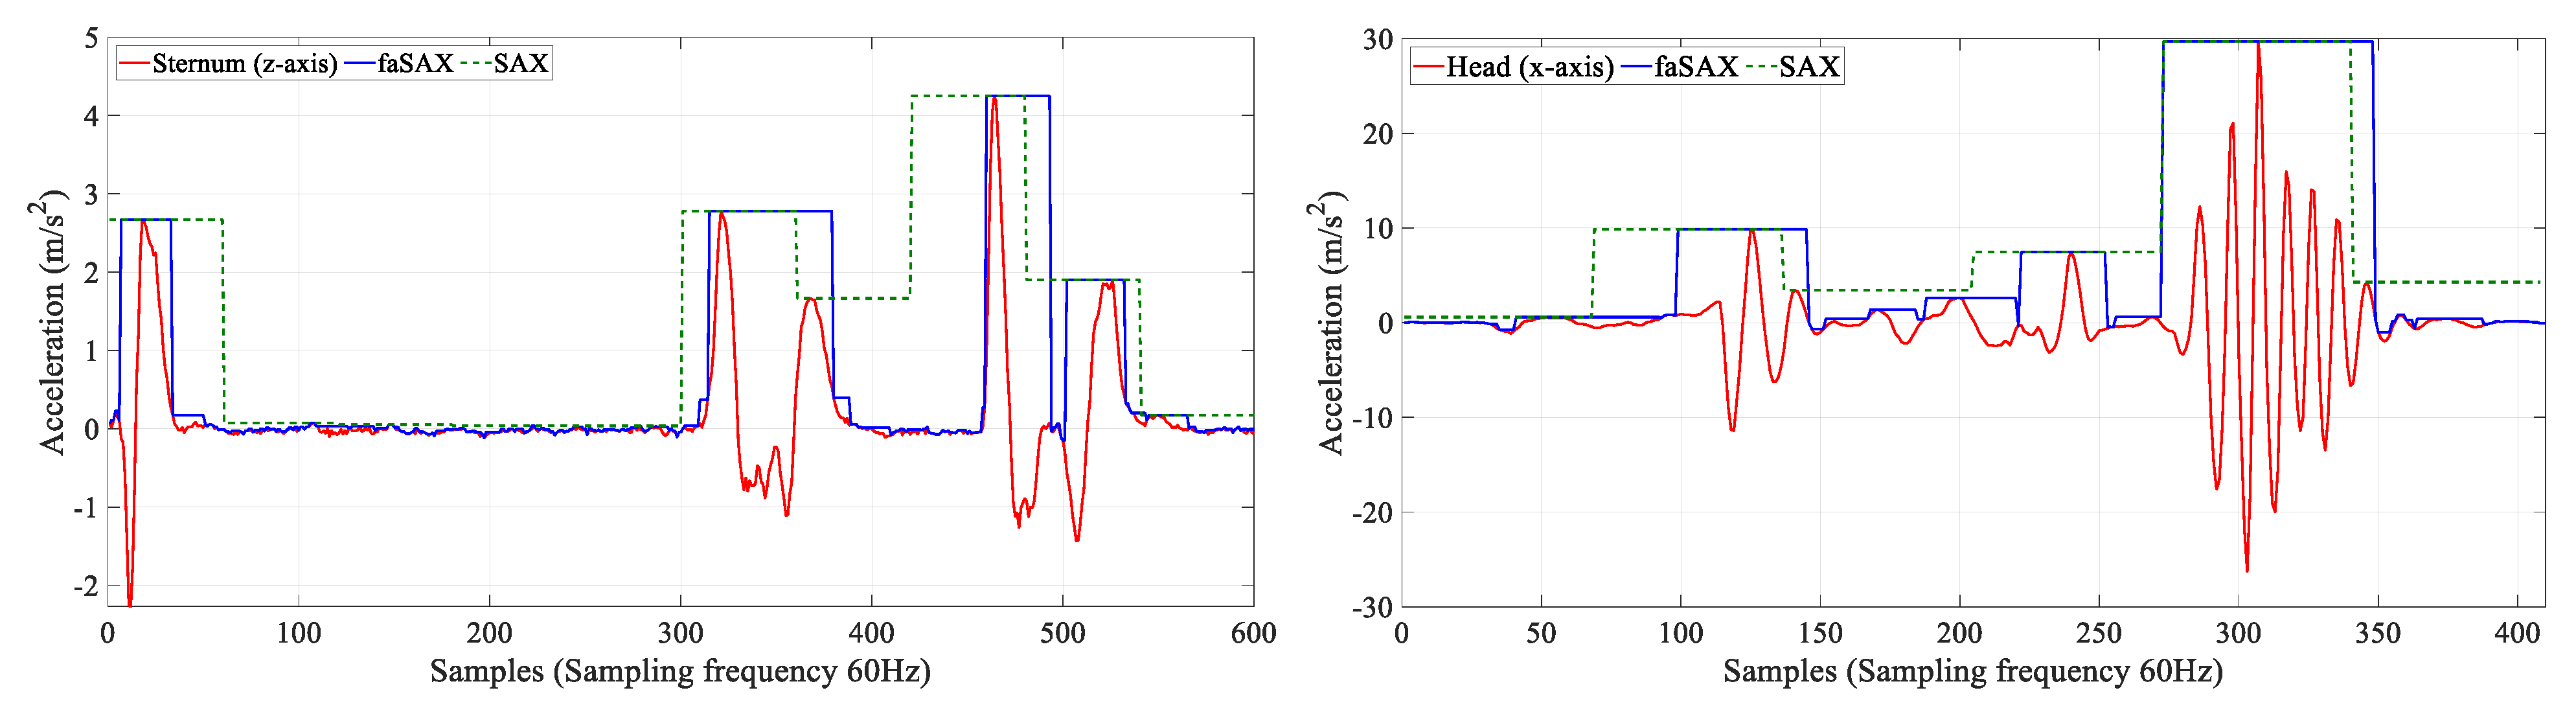
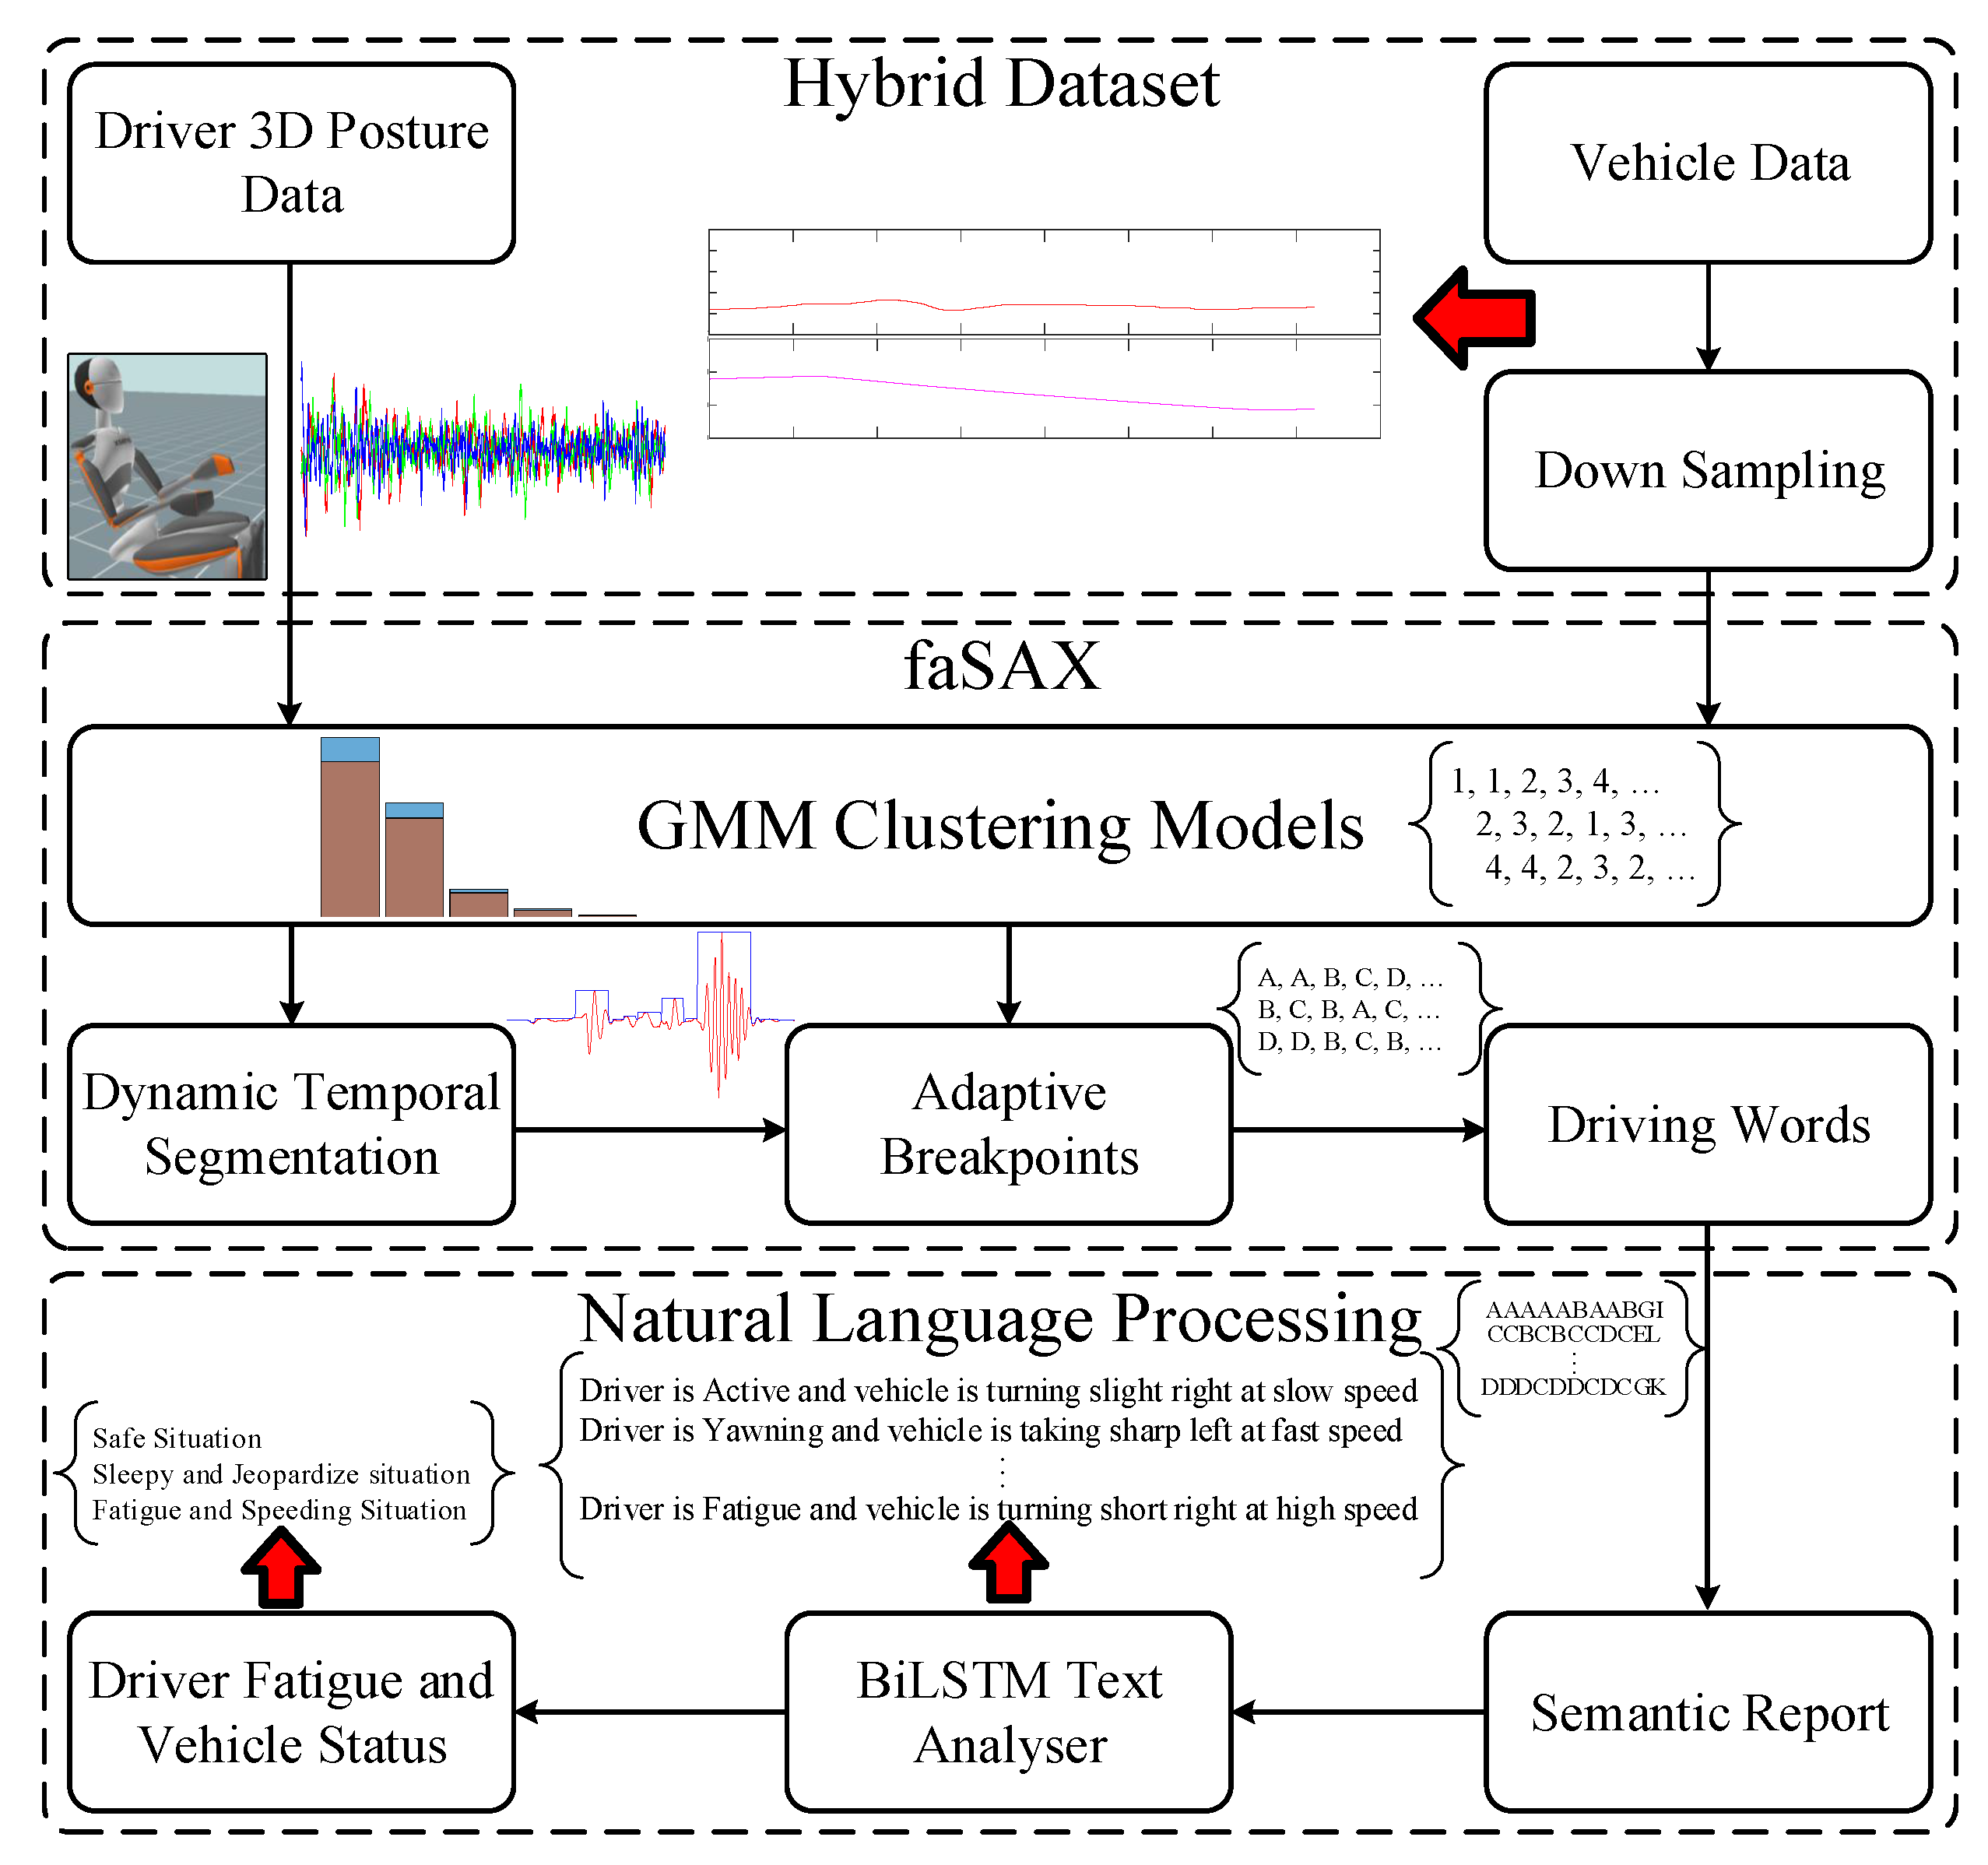
  • Introducing a novel fully adaptive temporal segmentation algorithm named faSAX, this method is designed to identify time-variant fatigue patterns. faSAX assigns symbols by comparing the approximated value of segmented hybrid data with adaptively estimated breakpoints (thresholds).
  • This work represents a significant stride in advancing the monitoring of linguistic-based temporal driver states and vehicle situations. It lays the groundwork for leveraging semiotic driving patterns to enhance the precision of shared-access control systems.
  • In this study, the symbols extracted from the proposed algorithm can be utilized to generate diverse semantic reports on the driver and vehicle status. These reports can then undergo further analysis by natural language processing schemes to facilitate the identification of potential driver and vehicle situations.
  • Highlighted by the experimental results, the proposed hybrid approach surpasses previous methodologies by precisely identifying time-variant fatigue and drowsiness patterns.
The remainder of the paper is organized as follows: Section 2 offers an overview of pertinent prior research. Section 3 outlines the methodology for the proposed hybrid strategy, including the development of the fully adaptive symbolic algorithm and NLP network. Section 4 delves into the results, validation, and discussion of the hybrid approach. Lastly, Section 5 concludes with some final remarks, addressing limitations and suggesting avenues for future research.

2. Background and Related Work

Detecting the variable temporal patterns of mental fatigue in drivers poses a challenging task. Numerous studies have been undertaken to accurately identify the temporal patterns of mental fatigue through either direct or indirect monitoring approaches. In direct methods, the driver’s vital parameters, such as EEG, ECG, respiratory characteristics, and skin conductivity, are monitored to detect temporal anomalies [8]. The study reported in [10] deployed an EEG-based system that successfully classified fatigue patterns on a simulated platform with a weighted accuracy of 99%. A similar study is presented in [27], where a simulated study involving 11 drivers was conducted based on a 32-electrode EEG recorder, achieving an accuracy of 99.23%. Furthermore, a recent study utilized a 32-channel wearable EEG cap to detect the fatigue and rest states of a driver in a real-world scenario, with an accuracy of 97.1% and 97.9% for fatigue and rest, respectively [28].
In another work reported in [11], ECG temporal intervals were monitored in real driving experiments by attaching the electrodes to the driver’s skin. Certainly, these methods provide an efficient and accurate status of the driver [11]. However, they have proven impractical in real-life driving, as the continuous mounting of sensors on the driver’s skin and head can cause irritation and movements that may confuse the feature recognition algorithm. In addition to direct measuring systems, camera or vision-based methods [29] have proven problematic in detecting facial features in poor lighting conditions or when sunglasses or face masks are worn.
Wearable sensors have proven very effective in monitoring driver behavior. They are considered a good alternative to physiological systems as they can track the driver’s heart rate, skin response, and blood oxygen without deteriorating driver performance [16]. In the work presented by Choi et al. [7], driver states were classified based on skin conductance and temperature using a wristband. An example known as Basis Peak Smartwatch was introduced by Reeder et al. [30], which could be deployed to monitor the driver’s heart rate and skin response. In another study conducted by Yang et al. [17], the driver’s head rotation and nodding response were tracked using a radio frequency identification device (RFID) worn on the head. In an earlier work reported in [22], the driver’s head posture variations reflecting various driver states were monitored using a head motion tracker. The results indicated that involuntary driver behaviors such as yawning, nodding, and head shaking performed while driving represented actions related to driver mental fatigue and drowsiness. In such situations, driver posture becomes a viable signature of various driver states. However, the study ignored vehicle situations, focusing only on driver information.
Monitoring driver fatigue through vehicle information is an indirect measurement approach. These approaches utilize vehicle and tire dynamics to detect motifs or anomalies in vehicle functions, such as lane deviation, speed variability, and unstable lateral motions [31,32]. These motifs can represent different meanings of driver status. For instance, lane deviation or speed variability can imitate a driver’s aggressive behavior instead of fatigue behavior. Therefore, due to the uncertainty of the driver’s status, the indirect methods on their own are not sufficient to detect the temporal patterns of the mental fatigue state.
Hybrid systems integrate physiological or camera-based approaches with in-vehicle monitoring systems. In the work reported in [33], a hybrid system combined heart rate information retrieved from a wearable device with facial features tracked using a camera. In another research conducted in [34], driver fatigue was diagnosed based on EEG signals, head gyroscope data, and facial images. However, despite achieving a higher detection accuracy, these hybrid methods were unaware of the vehicle status and driver posture, such as whether the driver was nodding or taking sharp turns or speeding during a fatigue event. Moreover, it is also necessary to track the temporal variations in fatigue patterns and the temporal relationship between driver status and vehicle features.
Efficient tools are essential for converting dynamic temporal data into either time-domain or frequency-domain representations. Symbolic mapping and piecewise approximation have become crucial for time-series representation. Taniguchi et al. introduced the double articulation analyzer (DAA) in natural language processing, which symbolized fixed segmented time-series data as “driving letters” and combined them to generate a driving word based on spatial distribution [35]. Similarly, the SAX algorithm stands out as a commonly employed method in time-series applications for pattern recognition. It initiates the estimation of a piecewise aggregate approximation (PAA) for segmented data using a predetermined sliding window, subsequently assigning symbols through comparisons with fixed breakpoints or thresholds [36,37]. The PAA incorporates statistical metrics like standard deviation, mean, mode, median, maximum, and minimum derived from the fixed segmented data. Nevertheless, the utilization of fixed segmented data carries the risk of misinterpretation and potential overlap of critical information.
Various adaptive SAX algorithms have been proposed, as indicated in the literature. For example, Sun et al. [38] introduced a variant of SAX for segmentation that adaptively adjusted the sliding window of time-series information using a variance-based method. However, the effectiveness of the variance function was dependent on the magnitude and a predefined multiple of the standard deviation from the temporal information. Another work, outlined in [39], entails the adaptive estimation of breakpoints through a k-means clustering algorithm. Nevertheless, when dealing with time-variant data, k-means may not exhibit optimal performance compared to alternative clustering approaches, as indicated in [40]. This paper proposes a fully adaptive symbolic approximation based on GMM clustering, which adaptively estimates the dynamic temporal length of a fatigue pattern and assigns symbols to all features of hybrid multivariate time-series events. Consequently, a multivariate hybrid word is generated, further analyzed by a deep-network-based natural language processor to identify the semiotic driver status as well as vehicle situation.

3. Methodology

The methodology deployed in designing the end-to-end driver fatigue hybrid system is shown in Figure 1. The hybrid approach comprises the following three stages:
Stage 1—Hybrid dataset: From the experiments, the 34 drivers’ data (head and chest postures) and vehicle features were combined to prepare a hybrid dataset. The data were collected in a simulated platform using XSENS MTs and through analytical nonlinear vehicle dynamics model [22].
Stage 2—faSAX: The hybrid dataset was utilized to build separate GMM clustering models for the driver posture and vehicle features based on the abundance criteria provided in [23]. The GMM sequences acquired from GMM models were then used to estimate the dynamic temporal window. The variable window then estimated the aggregate value (PAA) of each feature of the hybrid dataset. The PAA for each feature was then compared with the estimated adaptive breakpoints using GMM clustering to generate the respective symbol of a dynamic window. Finally, all the symbols were combined to form a driving word for a respective dynamic temporal size.
Stage 3—NLP: In this work, NLP indirectly processed the hybrid time-series data through the faSAX algorithm deployed in stage 2. The symbols retrieved by the proposed algorithm through the previous stage were then utilized to produce driving words in this stage. These words were then employed to generate the possible semantic reports of the driver and vehicle situations, which were further analyzed by the BiLSTM text analyzer to classify the driver fatigue state and possible vehicle situations.

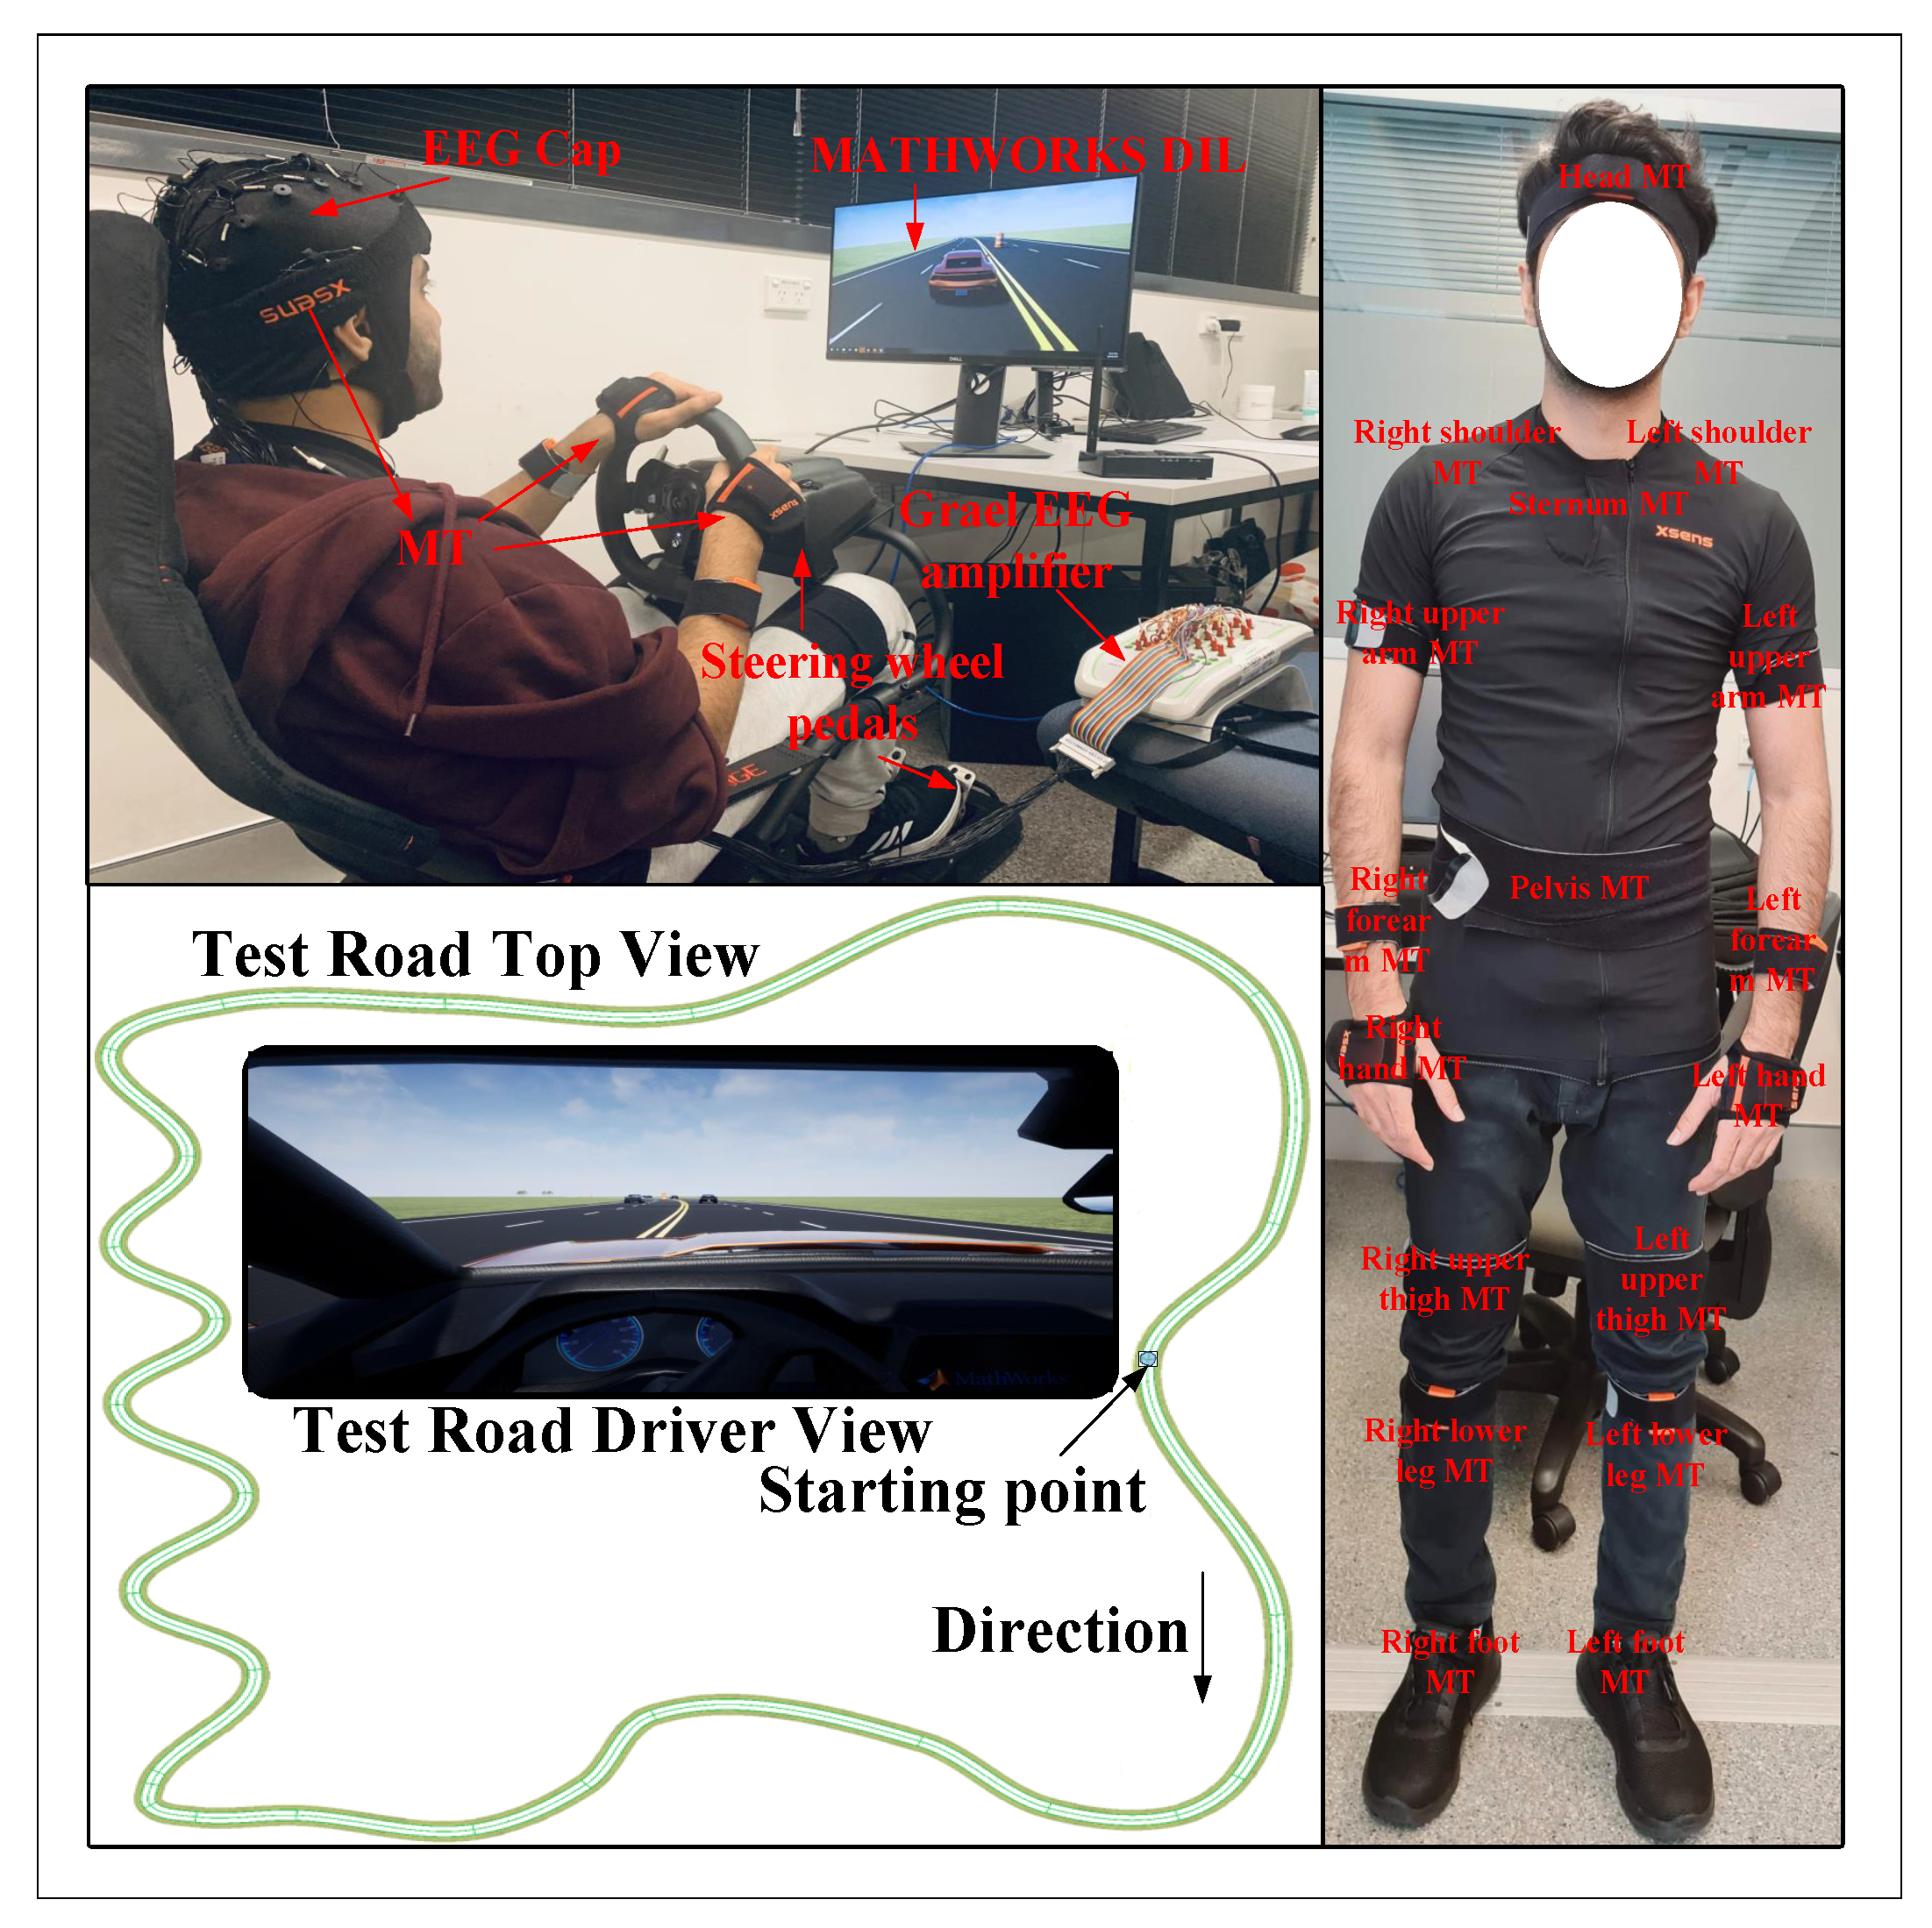
3.1. Experimental Platform and Protocol

In general, detecting a driver’s mental state, distractions, and misjudgments requires conducting experiments on driver behavior in real driving conditions, on actual roads, and under authentic driving circumstances [9]. However, conducting real-world experiments entails significant risks to the subjects and could lead to injuries or fatal accidents due to sudden variations in body posture influenced by mental fatigue and unstable driving conditions. Therefore, laboratory-based experiments conducted in a simulated environment are preferred to avoid the potential adverse consequences associated with fatigued driving. Moreover, advancements in smart suspension systems, adaptive cruise control, shared steering, and self-autonomous features found in vehicles like Mercedes Benz F015, Chevrolet FNR, Volkswagen Sport Coupe, and Tesla Smart Summon with Autopilot features contribute to a reduced driving burden [41]. These features indirectly contribute to underload mental fatigue, where, due to comfort and reliability, drivers are less engaged in driving, encountering negligent external disturbances such as road variations and bumps.
The driver-in-loop (DIL) experimental platform utilized in this study was crafted to emulate the operation of the aforementioned smart features, ensuring that the driver was shielded from environmental disruptions, road changes, and sensations. In line with the futuristic attributes outlined earlier, a static simulator is incapable of introducing external disturbances such as seat vibrations or road bumps. Consequently, these features indirectly contribute to driver fatigue during circadian rhythms, leading to an underload mental state on monotonous roads, where the driver’s body posture may undergo unexpected changes. To address this, we designed and implemented a stationary, cost-effective, customizable, and open-source DIL platform, adhering to MATHWORKS guidelines and seamlessly integrated with Unreal Engine Studio to provide a realistic virtual environment experience [22,23]. The experiments were conducted in scenarios involving long, monotonous, straight and curvy highways, as depicted in Figure 2. Additional details regarding the development of the DIL platform can be found in [22,23].
According to the literature, individuals aged between 18 and 26 years, commonly referred to as younger drivers, exhibit a higher likelihood of being involved in fatigue-related crashes. This heightened risk is attributed to their increased susceptibility to driving mistakes and short-term sleep issues, as highlighted in studies like [42,43]. Research, as suggested by [42], indicates that young adults in the 18–26 age bracket frequently experience irregular sleep patterns. Notably, the literature reveals a correlation between young drivers and a a higher incidence of crashes, particularly when they have less than 6 h of sleep. This can be attributed to the tendency of younger individuals to participate in nighttime activities such as socializing, studying, or working late hours. The extended periods of wakefulness during the night contribute significantly to a heightened risk of fatigue while driving.
In this research, a total of thirty-four university students, comprising twenty-seven males and five females aged between 18 and 32 years, participated in the experimental work. To enhance diversity, two mature males aged 52 were also included. The primary focus of the study was to investigate the influence of mental fatigue on driving performance, specifically on long monotonous highways, by examining body posture. The inclusion of a small number of older participants was intentional and aimed at introducing diversity to the study cohort. Notably, a study reported in [44] suggested that older drivers demonstrated comparable resilience to fatigue and drowsiness on extended monotonous highways compared to their younger counterparts.
Before commencing the laboratory experiments, participants were sought for voluntary consent and instructed to adhere to the ethics protocol approved by the UOW-HREC committee (approval number 2019/154), as detailed in [22,23]. The experiments took place at the Intelligent Control Laboratory, University of Wollongong, Australia. Participants underwent the experiments after having had a minimum of 7 h of sleep and being awake for at least 8 h prior to the start, a criterion subjectively verified by questioning participants before each session. The experiments were conducted during circadian rhythms, specifically in the afternoon (2:30 p.m. to 4 p.m.) and late at night (12:30 a.m. to 2 a.m.), as outlined in [23]. Building on the findings of Zhang et al. [45], which highlighted the susceptibility of drivers to fatigue within the initial 20–25 min of driving on lengthy and uneventful highways after being awake for more than eight hours, we established a minimum duration of one hour for each nonrisky experiment session. Participants also underwent a 15 min training session preceding each experiment to familiarize themselves with the driving platform. Notably, our participant cohort brought diverse driving experiences, ranging from a minimum of 2 years to a maximum of 23 years.
Additionally, to address concerns about simulation sickness, we conducted a comprehensive analysis of sickness rates within our participant cohort. Following the experimental sessions, it is noteworthy that 31 participants, including the mature participants, reported no simulation sickness. These individuals specifically mentioned that the artificial torque induced at the steering wheel successfully replicated the real-world torque feel. However, we observed that two young males and one female reported experiencing simulation sickness characterized by drowsiness and boredom after approximately 20 min of exposure. Their discomfort was associated with the absence of seat vibration in the simulation. To quantify this, the calculated sickness rate was 8.82 % . To mitigate the impact on the data, we excluded the data points affected by simulation sickness from the dataset.

3.2. Data Collection and Preprocessing

In the initial phase, body posture data were gathered using 17 wearable motion trackers (MTs) developed by XSENS technologies (manufactured by Movella, Henderson, NV, USA) via MVN Studio [22,23]. The data were recorded at a sampling frequency of 60 Hz and subsequently processed by Matlab using the MVN Studio toolbox. To identify variations in body posture influenced by mental fatigue, 3D acceleration samples in (m/s2) from the head, neck, and sternum body segments were extracted and organized to form a 9D dataset. The placement of MTs on various body locations and the driver-in-loop (DIL) platform is illustrated in Figure 2.
To concurrently collect vehicle data, we utilized the vehicle dynamics blockset introduced in [22]. The data were sampled at a frequency of 1000 Hz and were downsampled to 60 Hz to synchronize with the postural data. Among the 14-degree-of-freedom (DOF) vehicle parameters, we focused on the front road wheel steering angle (RWA) and speed, capturing both lateral and longitudinal information of the vehicle. The simulated vehicle had a lock-to-lock steering wheel angle of 900 degrees, with a 450-degree range for each side of a turn. The steering ratio was set at 20:1, resulting in a maximum turning angle of the front tires at 22.5 degrees. Finally, these datasets were held together to create a hybrid multidimensional dataset.

3.3. faSAX

In the proposed algorithm, we adaptively estimated the three components (temporal window size, piecewise aggregate approximation (PAA), symbol assignment) of the original SAX method [36,37] using the Gaussian mixture model (GMM) clustering method [23]. The determination of optimal clusters relied on achieving a minimum abundance range of 0.5–1%. This method is a common approach for estimating the number of clusters, providing information about the population rate of data points within each cluster. For a single cluster (k = 1), the abundance rate is 100%, signifying the significance of each cluster in the unsupervised data analysis and denoting the number of data points stored in the respective cluster.
The main aim of this study was to detect the driver fatigue state and its dependent vehicle maneuverability over time. Therefore, 9D postural features were considered as the independent variables, focusing directly on driver behavior, while the vehicle features were considered as dependent variables. Hence, the temporal variations in driver posture could be regarded as reference values for the vehicle features.
To determine the adaptive temporal window size for the independent body postural event, we created a Gaussian mixture model (GMM) based on 9D postural features. The resulting GMM time-series sequences were saved in a variable (Gs). A counter was employed to identify similar GMM sequences by comparing the current and past GMM sequences. The cumulative length of these similar sequences, obtained from the counter, represented the variable time-series length of the driver posture event. The pseudocode for temporal segmentation is outlined in Algorithm 1. The dynamic temporal window was then utilized to compute the piecewise aggregate approximation (PAA) for each hybrid feature (body posture + vehicle parameters). The PAA calculation involved applying various statistical functions to the dynamic segmented data, depending on the type of the original data.
Algorithm 1: Dynamic time-series segmentation and PAA
Safety 10 00009 i001
    To dynamically determine thresholds for the symbol assignment in a segmented window, we employed the unsupervised Gaussian mixture model (GMM) clustering method on the piecewise aggregate approximation (PAA) of every dimension within the overall dataset [23]. Consequently, for an 11D hybrid dataset, we constructed 11 distinct GMM clustering models. Unlike the original SAX algorithm, where the alphabet size is manually defined, our proposed algorithm assumed the number of GMM clusters to be equal to the alphabet size, with a minimum abundance index (k) ranging between 0.5 and 1% [23]. By creating optimal clusters based on abundance criteria, this approach addressed the constraint on the total number of symbols. Algorithm 2 outlines the pseudocode for estimating adaptive thresholds. Each cluster was sorted from low to high, accompanied by its estimated adaptive statistical thresholds, representing breakpoints for each estimated GMM cluster. Finally, symbols were assigned to dynamic segmented data by summing up logical comparisons of the respective PAA segment with the calculated thresholds.
Algorithm 2: Dynamic breakpoints’ determination
Input: P A A a p p l i e d t o e v e r y v a r i a b l e w i t h i n t h e h y b r i d d a t a a r r a y
Input: A l p h a b e t s i z e ( α )
Input: S e p a r a t e G M M c l u s t e r i n g m o d e l s o n P A A o f e a c h f e a t u r e u s i n g [23]
Safety 10 00009 i002

3.4. BiLSTM Text Analyzer

In the third stage, the sequences of symbols or letters generated by the (faSAX) were analyzed by the BiLSTM text analyzer. This morphological analyzer combined all the letters of hybrid features into a sequence of words for each temporal window. These bags of words represented the linguistic meaning of driver and vehicle situations. Hence, a hybrid semantic report was generated, which was further analyzed by a sequence-to-label classifier based on the BiLSTM deep learning layer to detect driver fatigue and potential vehicle situations.
In this work, the initial step involved tokenizing the hybrid semantic reports or documents to preprocess the text, eliminating repeated words, converting to lowercase, and removing punctuation. Subsequently, the BiLSTM network converted the words into numeric sequences with long dependencies. A word encoding or embedding layer was employed to map the words in a vocabulary or dictionary to numeric vectors instead of scalar indices [25]. For further details about the BiLSTM deep learning model, refer to [22]. The pseudocode for training and testing a semantic report is presented in Algorithm 3.
Algorithm 3: BiLSTM text analyzer network training and testing
  • Preprocessing
 1.
Tokenize the input documents (reports) into tokens (words).
 2.
Convert all the tokens to lower case.
 3.
Erase any punctuation present in the tokenized document.
 4.
Map all the tokens in a vocabulary to create a linguistic dictionary.
 5.
Convert the tokenized documents into sequences.
  • Training
 6.
Create a BiLSTM network with the following hyperparameters.
  • Input size = 1.
  • Embedding dimension = 100.
  • Hidden neurons = 100.
  • Number of words = total amount of words in the vocabulary or dictionary.
 7.
Deploy layers for the BiLSTM network.
  • Input sequence layer with specified input size.
  • Word-embedding layer to assign numeric vectors with specified embedding dimension.
  • BiLSTM layer with specified number of hidden neurons.
  • Fully connected layer.
  • Softmax layer.
  • Classification layer.
 8.
Specify the training characteristics based on the improved Adam optimization [46].
 9.
Train the BiLSTM sequence-to-label network (net).
  • Testing
 10.
Preprocess the test documents using the above lines (1–5).
 11.
Predict the test labels using the trained model (net).
 12.
Update the model knowledge by adding the test documents with predicted classes in the database.

4. Results and Discussion

4.1. Driver Posture and Vehicle Situation

In a state of alert posture, the driver actively and proficiently manages vehicle control. The driver’s level of focus or distraction is primarily reflected in the behavior of the head. Activities associated with an alert state include concentrating on the road, monitoring surrounding vehicles and obstacles, utilizing infotainment systems, and adjusting the head position in response to road curves. Temporal variations in this mode, as depicted by the movements of the head, neck, and sternum, are minimal, as illustrated in Figure 3.
The preceding investigation, focusing on driver fatigue detection based on head posture [22], highlighted certain driver activities such as yawning, nodding, and head shaking as indicative of the driver’s fatigue state. This work operates on a similar assumption. Unlike the prior study, which overlooked variations in chest posture reflecting respiratory behavior, the current study comprehensively monitored the driver’s states through the head, neck, and sternum body segments. Figure 3 illustrates an example of the body postural variations. Moderate variations signify a high breathing (yawning) pattern, while anomalies or motifs indicate abrupt acceleration (m/s2) variations (nodding and head shaking) in the driver’s posture.
The temporal patterns of yawning, nodding, and head shaking vary over time, depending on the degree of driver drowsiness or sleepiness. This principle extends to the nodding and head shaking patterns as well. As depicted in Figure 3, a 10-s window indicates that the driver is experiencing sleepiness, as evidenced by a yawning posture occurring over a variable time length, with the vehicle positioned laterally at high speed. Similarly, a seven-second window suggests that the driver is drowsy due to mental fatigue, characterized by nodding and head shaking postures, while the vehicle navigates sharp turns at variable speeds. It becomes apparent that instances of higher acceleration magnitudes in body posture, even for a brief duration, can be perilous, signifying that the driver is completely distracted under mental fatigue, with the vehicle executing unstable turns at high speeds.

4.2. Dynamic Temporal Segmentation and Approximation

Utilizing the proposed faSAX algorithm, the dynamic segmentation of hybrid data based on GMM sequences was employed to identify the temporal patterns associated with mental fatigue, including yawning, nodding, and head shaking. The application of Algorithm 1 specifically targeted the 9D postural data, acting as independent and reference variables in relation to the dependent in-vehicle variables, as detailed in Section III-C. This assumption is grounded in the driver’s role in influencing vehicle parameters, establishing a dependency of in-vehicle variables on the driver’s states. Consequently, the temporal window derived from postural data was applied to in-vehicle parameters, facilitating the approximation of vehicle situations, such as executing slight or sharp turns at varying speeds.
The adaptive segmentation of the driver’s drowsiness and fatigue states, characterized by yawning, nodding, and head-shaking motifs, was achieved through the faSAX algorithm, showcasing an improvement over the original SAX algorithm, as depicted in Figure 4. In the original SAX algorithm, the sliding window length was consistently fixed at 60 data samples per window, corresponding to one second of time. The effectiveness of the proposed algorithm is apparent in its ability to dynamically segment temporal variations without relying on predefined thresholds, in contrast to the original SAX algorithm, which tends to overlap and misinterpret the identified motifs.
In the original SAX method, the piecewise aggregate approximation (PAA) is utilized to represent a time series of length n in a vector X = ( x 1 , x 2 , x n ) of a different length m < n , where x 1 denotes the mean of the normalized segmented data with a sliding window of length m. However, as observed in Figure 3, the fluctuation in the head, neck, and sternum body segments exhibits an alternating nature, demonstrating similar amplitudes in both positive and negative vertical axes. Consequently, the mean of a specific temporal window is zero, as illustrated in Figure 5a. Depending on the characteristics of the postural data, a maximum function was employed to approximate the positive peak amplitude for a given temporal window, as depicted in Figure 5b. For the in-vehicle parameters, the mean of the dynamically segmented data using the same temporal window, estimated from the 9D postural data, was employed, as shown in Figure 5c,d. It is important to note that the dynamically segmented data were not normalized in this study to facilitate the utilization of raw data in real-time applications.

4.3. Adaptive Breakpoints’ Estimation and Symbol Assignment

To assign symbols to the patterns segmented by Algorithm 1, breakpoints were determined for each variable in the hybrid dataset using Algorithm 2, with a benchmark against the methodology employed in [39], as outlined in Table 1. As depicted in Figure 3, minimal amplitudes in postural behavior signify an alert posture, moderate levels indicate a yawning posture, and severe magnitudes represent a nodding and head-shaking posture. In this context, the proposed faSAX algorithm effectively estimated the necessary breakpoints, addressing both postural variations and vehicle situations.
Examples of diverse symbol assignments by the faSAX algorithm to hybrid features are illustrated in Figure 6 and Figure 7. Minor variations are denoted by symbols “A” and “B”, while inconspicuous patterns are represented by “C”, and more pronounced magnitudes in postural behavior are signified by the “D” symbol. Symbols “E” to “L” depict the vehicle’s lateral positions and longitudinal ranges, with detailed explanations provided in Table 2. To comprehend the symbol assignment process, consider the speed threshold values. If the current vehicle speed is below the breakpoint β 1 = 20.56 , then the symbol “I” is assigned to all corresponding values. Conversely, if the speed is between 20.56, 71.29, and 87.38, symbols “J”, “K”, and “L” are assigned, respectively. This principle is extended to all postural and vehicle parameters.

4.4. Validation Using EEG

To validate the faSAX algorithm and assess fatigue using MTs, the faSAX symbols were compared with cognitive fatigue measured by EEG. Among the 34 participants, the mental state of three subjects was concurrently measured using both MTs and EEG systems, as illustrated in Figure 2. We followed the approach outlined by Min et al. [24], where information from the brain’s prefrontal region (Fz, Cz) was utilized to extract the temporal mental fatigue state. In this study, the Fz and Cz EEG channels were recorded using a 32-channel Quick-cap (Compumedics-Neuroscan) at a 256 Hz sampling frequency through the Grael 4 K EEG amplifier, with the electrode impedance set under 5 kΩ. The data were processed by removing the dc offset and detrended to eliminate the straight-fit line by subtracting the polynomial trend from the respective channel’s elements using the Matlab function “detrend” based on Equation (1), where Y and Y′ are the EEG signals without dc offset and with dc offset, respectively, and N is the total length of the EEG signal [23].
Y = Y Σ i = 1 N Y / N
Figure 8 illustrates the spectrogram of a test subject, where the temporal pattern of mental fatigue is detected in EEG channels (Fz, Cz), manifested by high power (dB) in high frequencies for short intervals. The elevated power observed at frequencies around 75 Hz indicates artifacts such as yawning, head movement, and eye blinking. Additionally, the heightened power near 50 Hz corresponds to the driver’s alert state, where the brain responds to simulated driving feedback. These ground truths, represented through Fz and Cz EEG channels, were recorded by visualizing and comparing them with body posture movements in MVN Studio simultaneously. The fatigue patterns or artifacts aligned with the frequency patterns reported in [24].
Figure 9 depicts the validation of mental fatigue detection against EEG channels. Examples of alertness, yawning, nodding, and head shaking were compared against EEG channels (Fz, Cz). It is evident that yawning artifacts occurred simultaneously, and fatigue patterns (nodding and head shaking) were also detected concurrently in both body posture and EEG systems.
The faSAX algorithm dynamically segmented the data and assigns the necessary symbols to the temporal test events, as illustrated in Figure 9. By combining the 9D symbols, a nine-letter word can be generated, representing the linguistic meaning of the driver’s posture. For instance, CCC CCC DCC signifies a yawning or high-breathing event for a 7.2 s dynamically segmented window, while DDC DDD DDD indicates a nodding event for a 2.6 s duration segmented by faSAX. In our experiments, we assumed that if there were more than five “C”s in the driver’s posture word, a report would be generated indicating that the driver was yawning. Similarly, if a driving word consisted of at least six D’s, the report would be that the driver was fatigued; otherwise, all the remaining words were categorized under an alert state.

4.5. NLP

To generate a semantic and elemental linguistic meaning of the driver and vehicle status, the symbols from the hybrid dataset, returned by faSAX, were combined to form an 11-letter word. As discussed in the previous subsection, the linguistic report for driver posture was generated based on the degree of similar symbols present in the driver posture word. However, it is important to note that the symbols of different features can represent different meanings depending on the nature of the data and the application. In contrast, the set of driving words is intermittent and requires a linguistic or semantic interpretation. Table 2 provides a description of all the symbols deployed in this study.
The temporal hybrid words of the dataset returned by faSAX were then utilized to generate a hybrid report or document that depicted the status of the driver and vehicle. Subsequently, these documents were analyzed by the supervised sequence-to-label BiLSTM text classifier to provide a situation awareness classification. Nine classes were devised based on human expert knowledge, as shown in Table 3. It is important to note that the situation awareness classes are customizable. The primary contribution of this study lies in generating a hybrid status report or document that can be interpreted differently based on the expertise of different experts.
The hybrid experimental dataset of 34 subjects included several documents related to the classes of “Safe Situation” and “Tackle-able Sleepy Situation”, while the documents related to fatigued driving were relatively fewer. To adequately train the BiLSTM text analyzer network, the hybrid semantic documents were truncated and padded, as illustrated in Figure 10. Using Algorithm 3, the BiLSTM text analyzer was trained with 70% of the hybrid reports from the dataset, and the performance was validated and tested with 15% of the remaining dataset. Table 4 presents the performance evaluation of the BiLSTM text analyzer compared to a support vector machine (SVM)-based text analyzer. The proposed methodology was evaluated using eight-second test signals shown in Figure 9, as demonstrated in Table 5. Furthermore, Table 6 provides a comparison of the proposed methodology against existing state-of-the-art methods, revealing that the proposed hybrid system offers a more accurate linguistic-based detection of underload driver mental fatigue in a long monotonous highway scenario.

5. Conclusions

This paper introduced an innovative methodology for detecting underload mental fatigue in drivers on long monotonous highways, employing a hybrid approach. The method incorporated the monitoring of both the driver’s body postural information and vehicle behavior to capture temporal variations during driving. A novel version of time-series symbolic representation, referred to as faSAX, was developed to adaptively segment postural variations and vehicle situations. The research provides valuable insights into tracking sudden variations in body posture, such as nodding and head shaking, and their immediate impact on vehicle situations for brief durations. The semantic driving patterns generated by the proposed faSAX algorithm were then utilized to generate semantic driving reports. These reports were subsequently analyzed by a deep learning text analyzer to derive driving awareness situations. This study marks a significant advancement in the implementation of linguistically based temporal detection of driver and vehicle features. The semantic meanings obtained can be further applied in shared-access vehicle execution systems.
In conclusion, although our study introduces a novel methodology for detecting driver mental fatigue on long monotonous highways using a hybrid approach, it is crucial to acknowledge the inherent limitations. The use of a low-fidelity driving simulator and a small sample size, along with the inclusion of complex road intersections [47], presents challenges to generalization. Looking ahead, future studies with larger and more diverse participant groups, as well as higher-fidelity driving simulators that include challenging and complex roads, roundabouts, and junctions, are imperative to validate and enhance the robustness of our proposed methodology. These considerations will contribute to a more comprehensive understanding of the practical implications and potential applications of the approach in real-world driving scenarios.
Furthermore, our conclusions underscore the intrusive nature of the motion-capture-system-based wearable, which requires sensors to be affixed to the driver’s body. To overcome this limitation, we suggest investigating nonintrusive alternatives, such as integrating sensors into wearable clothing or embedding them within the driving seat. This adaptation would improve the feasibility of real-time fatigue monitoring during driving. Additionally, our study discusses the potential of camera-based methods to complement fatigue detection by capturing postural behaviors, such as head nodding and shaking. We acknowledge the need for further exploration in this area, particularly in extending the detection domain from facial features to encompass a broader range of postural cues.
Additionally, the study employed only a four-symbol representation of vehicle longitudinal and lateral behavior for tracking passive driver fatigue. It is worth considering the assignment of additional symbols to vehicle features by capturing information in diverse driving scenarios, including urban roads and roundabouts.

Author Contributions

Conceptualization, S.A., H.D., F.N. and D.S.; methodology, S.A., H.D., F.N. and D.S.; software, S.A. and A.A.H.; validation, S.A., H.D. and F.N.; formal analysis, S.A. and A.A.H.; investigation, S.A., H.D., F.N. and D.S.; data curation, S.A., H.D., F.N. and D.S.; writing—original draft preparation, S.A. and A.A.H.; writing—review and editing, H.D. and F.N.; visualization, S.A. and A.A.H.; supervision, H.D., F.N. and D.S.; project administration, H.D. and F.N.; funding acquisition, H.D. and F.N. All authors have read and agreed to the published version of the manuscript.

Funding

This research was jointly funded by University of Wollongong, Australia, and HEC, Pakistan.

Institutional Review Board Statement

An ethics application on conducting experiments on human drivers was approved by the UOW-HREC committee (approval number 2019/154).

Informed Consent Statement

Informed consent was obtained from all subjects involved in the study.

Data Availability Statement

Data are contained within the article.

Conflicts of Interest

The authors declare no conflicts of interest.

References

  1. Martinez, C.M.; Heucke, M.; Wang, F.Y.; Gao, B.; Cao, D. Driving style recognition for intelligent vehicle control and advanced driver assistance: A survey. IEEE Trans. Intell. Transp. Syst. 2017, 19, 666–676. [Google Scholar] [CrossRef]
  2. Ansari, S.; Du, H.; Naghdy, F.; Stirling, D. Factors Influencing Driver Behavior and Advances in Monitoring Methods. In AI-Enabled Technologies for Autonomous and Connected Vehicles; Springer: Berlin/Heidelberg, Germany, 2023; pp. 387–414. [Google Scholar]
  3. Distefano, N.; Leonardi, S.; Pulvirenti, G.; Romano, R.; Boer, E.; Wooldridge, E. Mining of the association rules between driver electrodermal activity and speed variation in different road intersections. IATSS Res. 2022, 46, 200–213. [Google Scholar] [CrossRef]
  4. NSW Government, Australia NSW Interactive Crash Statistics. 2021. Available online: https://roadsafety.transport.nsw.gov.au/statistics/interactivecrashstats/index.html (accessed on 18 May 2021).
  5. May, J.F.; Baldwin, C.L. Driver fatigue: The importance of identifying causal factors of fatigue when considering detection and countermeasure technologies. Transp. Res. Part Traffic Psychol. Behav. 2009, 12, 218–224. [Google Scholar] [CrossRef]
  6. Němcová, A.; Svozilová, V.; Bucsuházy, K.; Smíšek, R.; Mézl, M.; Hesko, B.; Belák, M.; Bilík, M.; Maxera, P.; Seitl, M.; et al. Multimodal features for detection of driver stress and fatigue. IEEE Trans. Intell. Transp. Syst. 2020, 22, 3214–3233. [Google Scholar] [CrossRef]
  7. Choi, M.; Koo, G.; Seo, M.; Kim, S.W. Wearable device-based system to monitor a driver’s stress, fatigue, and drowsiness. IEEE Trans. Instrum. Meas. 2017, 67, 634–645. [Google Scholar] [CrossRef]
  8. Sikander, G.; Anwar, S. Driver fatigue detection systems: A review. IEEE Trans. Intell. Transp. Syst. 2018, 20, 2339–2352. [Google Scholar] [CrossRef]
  9. Distefano, N.; Leonardi, S.; Pulvirenti, G.; Romano, R.; Merat, N.; Boer, E.; Woolridge, E. Physiological and driving behaviour changes associated to different road intersections. Eur. Transp. 2020, 77, 4. [Google Scholar] [CrossRef]
  10. Yang, Y.; Gao, Z.; Li, Y.; Cai, Q.; Marwan, N.; Kurths, J. A complex network-based broad learning system for detecting driver fatigue from EEG signals. IEEE Trans. Syst. Man Cybern. Syst. 2019, 51, 5800–5808. [Google Scholar] [CrossRef]
  11. Wang, L.; Li, J.; Wang, Y. Modeling and recognition of driving fatigue state based on RR intervals of ECG data. IEEE Access 2019, 7, 175584–175593. [Google Scholar] [CrossRef]
  12. Foy, H.J.; Chapman, P. Mental workload is reflected in driver behaviour, physiology, eye movements and prefrontal cortex activation. Appl. Ergon. 2018, 73, 90–99. [Google Scholar] [CrossRef]
  13. Savaş, B.K.; Becerikli, Y. Real time driver fatigue detection system based on multi-task ConNN. IEEE Access 2020, 8, 12491–12498. [Google Scholar] [CrossRef]
  14. Ed-Doughmi, Y.; Idrissi, N.; Hbali, Y. Real-time system for driver fatigue detection based on a recurrent neuronal network. J. Imaging 2020, 6, 8. [Google Scholar] [CrossRef]
  15. Liu, Z.; Peng, Y.; Hu, W. Driver fatigue detection based on deeply-learned facial expression representation. J. Vis. Commun. Image Represent. 2020, 71, 102723. [Google Scholar] [CrossRef]
  16. Ponnan, S.; Theivadas, J.R.; HemaKumar, V.; Einarson, D. Driver monitoring and passenger interaction system using wearable device in intelligent vehicle. Comput. Electr. Eng. 2022, 103, 108323. [Google Scholar] [CrossRef]
  17. Yang, C.; Wang, X.; Mao, S. Unsupervised drowsy driving detection with RFID. IEEE Trans. Veh. Technol. 2020, 69, 8151–8163. [Google Scholar] [CrossRef]
  18. Hoshu, A.A.; Wang, L.; Sattar, A.; Fisher, A. Auto-Tuning of Attitude Control System for Heterogeneous Multirotor UAS. Remote Sens. 2022, 14, 1540. [Google Scholar] [CrossRef]
  19. Hoshu, A.A.; Fisher, A.; Wang, L. Cascaded Attitude Control For Heterogeneous Multirotor UAS For Enhanced Disturbance Rejection. In Proceedings of the 2019 Australian and New Zealand Control Conference (ANZCC), Auckland, New Zealand, 27–29 November 2019; pp. 110–115. [Google Scholar]
  20. Yi, D.; Su, J.; Liu, C.; Chen, W.H. Personalized driver workload inference by learning from vehicle related measurements. IEEE Trans. Syst. Man Cybern. Syst. 2017, 49, 159–168. [Google Scholar] [CrossRef]
  21. Hoshu, A.A.; Wang, L.; Ansari, S.; Sattar, A.; Bilal, M.H.A. System Identification of Heterogeneous Multirotor Unmanned Aerial Vehicle. Drones 2022, 6, 309. [Google Scholar] [CrossRef]
  22. Ansari, S.; Naghdy, F.; Du, H.; Pahnwar, Y.N. Driver Mental Fatigue Detection Based on Head Posture Using New Modified reLU-BiLSTM Deep Neural Network. IEEE Trans. Intell. Transp. Syst. 2021, 23, 10957–10969. [Google Scholar] [CrossRef]
  23. Ansari, S.; Du, H.; Naghdy, F.; Stirling, D. Automatic Driver Cognitive Fatigue Detection based on Upper Body Posture Variations. Expert Syst. Appl. 2022, 203, 117568. [Google Scholar] [CrossRef]
  24. Min, J.; Xiong, C.; Zhang, Y.; Cai, M. Driver fatigue detection based on prefrontal EEG using multi-entropy measures and hybrid model. Biomed. Signal Process. Control 2021, 69, 102857. [Google Scholar] [CrossRef]
  25. Athira, B.; Jones, J.; Idicula, S.M.; Kulanthaivel, A.; Zhang, E. Annotating and detecting topics in social media forum and modelling the annotation to derive directions-a case study. J. Big Data 2021, 8, 41. [Google Scholar] [CrossRef]
  26. Ansari, S.; Du, H.; Naghdy, F.; Stirling, D. Application of Fully Adaptive Symbolic Representation to Driver Mental Fatigue Detection Based on Body Posture. In Proceedings of the 2021 IEEE International Conference on Systems, Man, and Cybernetics (SMC), IEEE, Melbourne, Australia, 17–20 October 2021. [Google Scholar]
  27. Sheykhivand, S.; Rezaii, T.Y.; Mousavi, Z.; Meshgini, S.; Makouei, S.; Farzamnia, A.; Danishvar, S.; Teo Tze Kin, K. Automatic Detection of Driver Fatigue Based on EEG Signals Using a Developed Deep Neural Network. Electronics 2022, 11, 2169. [Google Scholar] [CrossRef]
  28. Subasi, A.; Saikia, A.; Bagedo, K.; Singh, A.; Hazarika, A. EEG Based Driver Fatigue Detection Using FAWT and Multiboosting approaches. IEEE Trans. Ind. Inform. 2022, 18, 6602–6609. [Google Scholar] [CrossRef]
  29. Sikander, G.; Anwar, S. A novel machine vision-based 3D facial action unit identification for fatigue detection. IEEE Trans. Intell. Transp. Syst. 2020, 22, 2730–2740. [Google Scholar] [CrossRef]
  30. Reeder, B.; David, A. Health at hand: A systematic review of smart watch uses for health and wellness. J. Biomed. Inform. 2016, 63, 269–276. [Google Scholar] [CrossRef] [PubMed]
  31. Deng, Z.; Chu, D.; Wu, C.; Liu, S.; Sun, C.; Liu, T.; Cao, D. A Probabilistic Model for Driving-Style-Recognition-Enabled Driver Steering Behaviors. IEEE Trans. Syst. Man Cybern. Syst. 2020, 52, 1838–1851. [Google Scholar] [CrossRef]
  32. Hoshu, A.A.; Wang, L.; Fisher, A.; Sattar, A. Cascade control for heterogeneous multirotor UAS. Int. J. Intell. Unmanned Syst. 2022, 10(4), 363–384. [Google Scholar] [CrossRef]
  33. Du, G.; Li, T.; Li, C.; Liu, P.X.; Li, D. Vision-based fatigue driving recognition method integrating heart rate and facial features. IEEE Trans. Intell. Transp. Syst. 2020, 22, 3089–3100. [Google Scholar] [CrossRef]
  34. Karuppusamy, N.S.; Kang, B.Y. Multimodal System to Detect Driver Fatigue Using EEG, Gyroscope, and Image Processing. IEEE Access 2020, 8, 129645–129667. [Google Scholar] [CrossRef]
  35. Taniguchi, T.; Nagasaka, S.; Hitomi, K.; Chandrasiri, N.P.; Bando, T.; Takenaka, K. Sequence prediction of driving behavior using double articulation analyzer. IEEE Trans. Syst. Man Cybern. Syst. 2015, 46, 1300–1313. [Google Scholar] [CrossRef]
  36. Lin, J.; Keogh, E.; Lonardi, S.; Chiu, B. A symbolic representation of time series, with implications for streaming algorithms. In Proceedings of the 8th ACM SIGMOD Workshop on Research Issues in Data Mining and Knowledge Discovery, San Diego, CA, USA, 13 June 2003; pp. 2–11. [Google Scholar]
  37. Lin, J.; Keogh, E.; Wei, L.; Lonardi, S. Experiencing SAX: A novel symbolic representation of time series. Data Min. Knowl. Discov. 2007, 15, 107–144. [Google Scholar] [CrossRef]
  38. Sun, C.; Stirling, D.; Ritz, C.; Sammut, C. Variance-wise segmentation for a temporal-adaptive SAX. In Proceedings of the Tenth Australasian Data Mining Conference, Sydney, Australia, 5–7 December 2012; Volume 134, pp. 71–77. [Google Scholar]
  39. Pham, N.D.; Le, Q.L.; Dang, T.K. Two novel adaptive symbolic representations for similarity search in time series databases. In Proceedings of the 2010 12th International Asia-Pacific Web Conference, IEEE, Busan, Republic of Korea, 6–8 April 2010; pp. 181–187. [Google Scholar]
  40. Xu, D.; Tian, Y. A comprehensive survey of clustering algorithms. Ann. Data Sci. 2015, 2, 165–193. [Google Scholar] [CrossRef]
  41. Arakawa, T.; Hibi, R.; Fujishiro, T.a. Psychophysical assessment of a driver’s mental state in autonomous vehicles. Transp. Res. Part Policy Pract. 2019, 124, 587–610. [Google Scholar] [CrossRef]
  42. Martiniuk, A.L.; Senserrick, T.; Lo, S.; Williamson, A.; Du, W.; Grunstein, R.R.; Woodward, M.; Glozier, N.; Stevenson, M.; Norton, R.; et al. Sleep-deprived young drivers and the risk for crash: The DRIVE prospective cohort study. JAMA Pediatr. 2013, 167, 647–655. [Google Scholar] [CrossRef]
  43. Pack, A.I.; Pack, A.M.; Rodgman, E.; Cucchiara, A.; Dinges, D.F.; Schwab, C.W. Characteristics of crashes attributed to the driver having fallen asleep. Accid. Anal. Prev. 1995, 27, 769–775. [Google Scholar] [CrossRef]
  44. Song, W.; Woon, F.L.; Doong, A.; Persad, C.; Tijerina, L.; Pandit, P.; Cline, C.; Giordani, B. Fatigue in younger and older drivers: Effectiveness of an alertness-maintaining task. Hum. Factors 2017, 59, 995–1008. [Google Scholar] [CrossRef]
  45. Zhang, N.; Fard, M.; Bhuiyan, M.; Verhagen, D.; Azari, M.; Robinson, S. The effects of physical vibration on heart rate variability as a measure of drowsiness. Ergonomics 2018, 61, 1259–1272. [Google Scholar] [CrossRef]
  46. Zhang, Z. Improved adam optimizer for deep neural networks. In Proceedings of the 2018 IEEE/ACM 26th International Symposium on Quality of Service (IWQoS), IEEE, Banff, AB, Canada, 4–6 June 2018; pp. 1–2. [Google Scholar]
  47. Lyu, Z.; Qi, C.; Zhu, S.; Wang, H. The Visual Scanning Behavior and Mental Workload of Drivers at Prairie Highway Intersections With Different Characteristics. IEEE Access 2022, 10, 123043–123056. [Google Scholar] [CrossRef]
Figure 1. Framework of the hybrid temporal mental fatigue detection system.
Safety 10 00009 g001
Figure 2. MATHWORKS DIL platform and deployment of 17 MTs on various body parts.
Safety 10 00009 g002
Figure 3. Driver posture variation in conjunction with vehicle lateral and longitudinal information.
Safety 10 00009 g003
Figure 4. Comparison of temporal segmentation by proposed faSAX with original SAX: yawning motif (left), nodding and head-shaking motifs (right).
Safety 10 00009 g004
Figure 5. Approximation of hybrid dataset. From left to right: (a) mean approximation of variable 1 of MT; (b) peak approximation of variable 1 of MT; (c) mean aggregation of RWA; (d) mean approximation of vehicle speed.
Safety 10 00009 g005
Figure 6. Symbols’ assignment to the yawning motifs (left) and nodding and head-shaking motifs (right). The symbols “A to D” represent the variations in the MTs from low to high, respectively.
Safety 10 00009 g006
Figure 7. Symbols’ assignment to the vehicle features. Lateral (RWA) at (left), and longitudinal (speed) at (right). The symbols “E to H” represent a lateral behavior. The symbols “I” to “L” show the vehicle speed behavior.
Safety 10 00009 g007
Figure 8. EEG channels (Fz—left) and (Cz—right). The high power (yellow lines) in high frequencies represents the mental fatigue at different time intervals.
Safety 10 00009 g008
Figure 9. Driver posture acceleration ( α ) variations’ validation against EEG channels (Fz, Cz) data. The symbols acquired using the faSAX algorithm form a driving word that indicated the linguistic meaning of driver status.
Safety 10 00009 g009
Figure 10. Reports’ frequency with respect to the customized classes.
Safety 10 00009 g010
Table 1. Dynamic breakpoints’ determination.
VariablesaSAX Dependent upon k-Means
Method at α = 4 [39]
Presented faSAX at α = 4
β 1 β 2 β 3 β 1 β 2 β 3
Head (x-axis)0.0090.22860.5260.06860.26193.074
Head (y-axis)0.10470.8961.0430.07830.28736.9518
Head (z-axis)0.00830.25740.75270.0550.18421.8964
Neck (x-axis)0.00880.16930.830.05050.13261.6198
Neck (y-axis)0.02230.23591.08170.04770.17132.292
Neck (z-axis)0.0090.16430.8570.04630.161.6797
Sternum (x-axis)0.01530.25760.98380.06790.20491.9579
Sternum (y-axis)0.02570.31260.90760.06950.25372.9388
Sternum (z-axis)0.0110.23090.5380.0660.21511.0594
RWA (degrees)−0.560.0120.078−2.560.04412.0904
Speed (kmph)2.05694.025715.360420.5671.2987.36
Table notes: β : thresholds, α : word dimension.
Table 2. Symbols’ representation.
NumberfaSAX SymbolsDescription
1ALow acceleration (variation) in either head/neck/sternum postures (focused on road, relaxed).
2BMedium variations in body posture (head inclination, looking for surrounding).
3CHigh variations (yawning, high breathing rate).
4DSevere variations (nodding, head shaking, high breathing due to sleep).
5ESharp left turn (Vehicle front wheel steering angle).
6FSlight left maneuver.
7GSlight right maneuver.
8HSharp right maneuver/turn.
9ISlow speed (<20 kmph).
10JModerate speed.
11KHigh speed.
12LVery high speed.
Table 3. Reports and situation awareness classes.
faSAX WordsReportsSituation Awareness Classes
AAAAABAABGIDriver is active, and vehicle is turning slight right at slow speedSafe Situation
AABCBBBBBELDriver is active, and vehicle is taking sharp left at fast speedVigilant and Aggressive Situation
AAABABBBCHJDriver is yawning, and vehicle is taking sharp right at moderate speedTackle-able Sleepy Situation
CCBCBCCDCELDriver is yawning, and vehicle is taking sharp left at fast speedSleepy and Jeopardize Situation
BBCBBCCCCFLDriver is yawning, and vehicle is taking slight left at fast speedSleepy and Rushing Situation
DDCCDCDCDEJDriver is fatigued, and vehicle is taking sharp left turn at moderate speedFatigue with Dangerous Turning
DDDCBDDBCHLDriver is fatigued, and vehicle is taking sharp right turn at fast speedFatigue and Jeopardize
CCDCDDDCDFIDriver is fatigued, and vehicle is taking slight left at slow speedDriver under Fatigue
DDDCDDCDCGKDriver is fatigued, and vehicle is taking a short right at high speedFatigue and Speeding Situation
Table 4. Performance evaluation of BiLSTM text analyzer.
ClassifierTraining Rate (70%)SensitivityPrecisionF1 ScoreValidation (15%)Testing (15%)
BiLSTM99.97%98.23%98.17%98.73%99.6%99.6%
SVM95.63%91.58%91.06%91.81%95.44%95.44%
Table 5. Proposed methodology performance.
faSAX WordWindow Size (Samples)Temporal Duration (s)Documents (Reports)Situation Awareness Class
CCCCCCBBBFK230.38Driver is yawning, and vehicle is taking slight left at high speed.Sleepy and Rushing Situation
CCDCCCCCCFL560.93Driver is yawning, and vehicle is taking slight left at fast speed.Sleepy and Rushing Situation
DDDDDDCCDEI701.17Driver is nodding, and vehicle is taking sharp left at slow speed.Fatigue with Dangerous Turning
CCCCCCCCCEI500.83Driver is yawning, and vehicle is taking sharp left at slow speed.Tackle-able Sleepy Situation
BBBBBBBBAEJ530.88Driver is active, and vehicle is taking sharp left at moderate speed.Safe Situation
CCCCCCBCCFK240.4Driver is yawning, and vehicle is taking slight left at high speed.Sleepy and Rushing Situation
DDDDDDDCDGL651.08Driver is shaking, Head and vehicle is taking a short right at fast speed.Fatigue and Speeding Situation
CCCCCCCCCHI390.65Driver is yawning, and vehicle is taking a sudden right at slow speed.Tackle-able Sleepy Situation
CCCCCCBCCHJ931.55Driver is yawning, and vehicle is taking a sudden right at moderate speed.Tackle-able Sleepy Situation
Table 6. Comparison of proposed methodology against state-of-art systems.
SystemMethodPredictionMeritsDemerits
Camera [13]Facial features98%Real-time, nonintrusiveLighting problems, unaware of vehicle information, nontemporal tracking.
Hybrid [34]EEG + gyroscope + facial features93.91%Real-time, temporal tracking.Unaware of vehicle information.
Hybrid [33]Heart rate + facial features94.75%Real-time, temporal tracking.Unknown of vehicle situation.
Proposed Hybrid systemBody posture + Vehicle information99.6%Real-time, temporal tracking, sequence prediction, situation analyses, customizable linguistic or semantic dictionaryIntrusive, requires sensors attached to body, processing delay time.
Disclaimer/Publisher’s Note: The statements, opinions and data contained in all publications are solely those of the individual author(s) and contributor(s) and not of MDPI and/or the editor(s). MDPI and/or the editor(s) disclaim responsibility for any injury to people or property resulting from any ideas, methods, instructions or products referred to in the content.

