Article

An Exploratory Study: Performance Differences Between Novice Teen and Senior Drivers Using Interactive Exercises on a Driving Simulator

1
Department of Automotive Engineering, Clemson University, Greenville, SC 29607, USA
2
Department of Psychology, Clemson University, Clemson, SC 29634, USA
3
DriveSafety, Inc., Draper, UT 84020, USA
*
Author to whom correspondence should be addressed.
Safety 2025, 11(1), 21; https://doi.org/10.3390/safety11010021
Submission received: 19 December 2024 / Revised: 10 February 2025 / Accepted: 14 February 2025 / Published: 2 March 2025

Abstract

:
Clinicians who do not specialize in driving have a need for simple assessment tools for both the aging population and new drivers. While many researchers focus on complex driving scenarios presented on simulators or on-road driving, this exploratory study examines the use of interactive exercises presented using a driving simulator to determine if there are differences in the speed at which senior and novice teen drivers respond to the steering wheel and pedal stimuli. This gap is addressed by evaluating performance differences between 34 senior drivers (over 60) and 17 novice teen drivers (ages 16–17) using interactive exercises with a driving simulator: Reaction Timer Steering©, Reaction Timer Stoplight©, and Stoplight and Steering©. Overall, teens had faster reaction times and fewer errors than seniors, yet seniors demonstrated greater improvement over time. Reaction times decreased for both age groups using the Reaction Timer Stoplight exercise. For the Stoplight and Steering exercise, significant differences between the groups were identified for both the number of errors as well as their reaction times. The findings from this exploratory study suggest the potential value of using driving simulators for assessment and potentially training the motor movements associated with driving across different age groups. By providing safe and controlled environments, simulators offer value to clinicians and educators for evaluations, interventions, and skill screenings to potentially improve safety for at-risk driver populations.

1. Introduction

Driving is a fundamental activity that supports independence, mobility, and social engagement. However, certain groups of drivers are at a heightened risk for crashes and fatalities, notably teenagers and older adults. According to the National Highway Traffic Safety Administration (NHTSA), teenagers and seniors are disproportionately represented in crash statistics, making them critical populations for targeted interventions and research [1]. These two groups exhibit distinct and overlapping challenges contributing to their vulnerability, necessitating a deeper understanding of their driving behaviors and functional abilities.

1.1. Teens and Seniors: At-Risk Driver Populations

For teenagers, obtaining a driver’s license represents a pivotal milestone, symbolizing personal independence and the transition to adulthood [2,3]. The ability to drive fosters personal mobility and freedom, which are essential for both social and economic development [4]. Driving enables teenagers to attend social events, meet friends, and participate in communal activities, thereby enhancing emotional health and promoting a sense of belonging [2]. Additionally, many job opportunities are accessible to individuals who can drive, providing teens access to employment to become financially independent [4].
Despite these benefits, teenagers, particularly those aged 16 to 19, face the highest crash rates of any age group [1]. Although they make up a small portion of the driving population, they are involved in a disproportionate number of fatal and injury-related crashes. This heightened risk stems from several factors, including inexperience, risky behaviors, and an underdeveloped capacity for hazard detection and decision-making. Novice drivers often misjudge stopping distances, fail to recognize potential hazards, and exhibit delayed responses in critical situations [5,6]. Furthermore, teens are more likely to engage in dangerous behaviors such as texting while driving, speeding, tailgating, and neglecting seat belt use [7,8]. These behaviors, compounded by their limited driving experience, make teenagers particularly vulnerable on the road.
Conversely, older adults face crash risks primarily due to age-related declines in cognitive, sensory, and motor functions, which can diminish their ability to perform complex driving tasks over time. Approximately 21% of all licensed drivers in the United States are over the age of 65, a demographic for whom driving remains a vital component of life, supporting independence, autonomy, health, and social participation [9,10,11,12]. However, as people age, driving can become increasingly challenging due to factors such as neurological conditions, stiff joints, and visual and auditory impairments, as noted by the National Institute of Aging [13]. These challenges are reflected in statistics: in 2020, over 200,000 older adults were injured, and 7500 lost their lives in automobile accidents, averaging approximately 20 fatalities per day [14].
Specific driving tasks such as merging onto highways, making left turns, and navigating busy intersections become more difficult for older adults due to slower reaction times, reduced flexibility, and diminished visual acuity [11,15]. Chronic medical conditions like arthritis, diabetes, and neurological impairments further exacerbate these difficulties, affecting critical functions such as steering, braking, and maintaining control of the vehicle [16]. Additionally, medications used to manage these conditions often introduce side effects such as drowsiness and delayed motor responses, compounding potential risks [17]. Although older adults are involved in fewer crashes overall compared to teenagers, their increased physical fragility makes them more likely to sustain severe injuries or fatalities in the event of a collision [14].

1.2. Comparing and Contrasting Risks

Despite their differences, teens and seniors share notable similarities in terms of their driving risks. Both groups can struggle with managing complex driving scenarios that demand quick decision-making and precise motor coordination. For teens, the challenge lies in inexperience and an inability to anticipate or mitigate risks effectively. For seniors, age-related declines in functional abilities may make it difficult to perform tasks that require sustained attention and physical dexterity [11]. Both groups may also face difficulties in adapting to rapidly changing traffic conditions. Moreover, the consequences of these challenges are evident in crash statistics. According to the NHTSA, teenagers are involved in fatal crashes at nearly four times the rate of drivers aged 20 and older [1]. For older adults, crash rates increase after the age of 75 and peak after 85 [14]. Understanding the similarities and differences in at-risk groups’ underlying driving skills is critical for developing targeted interventions to improve safety.

1.3. The Role of Driving Simulators

Driving simulators have emerged as a valuable tool for assessing and improving driving performance, particularly for at-risk populations [18,19]. Simulators provide a controlled environment where drivers can practice and refine their skills without the real-world consequences of errors. They are widely used in clinical and educational settings to evaluate key cognitive, motor, and visual functions related to driving [20,21]. Simulators allow researchers and clinicians to measure reaction times, error rates, and adaptability across different tasks by replicating diverse driving scenarios.
The evolution of driving simulators has led to the development of a wide spectrum of systems, ranging from simple desktop-based applications to highly immersive full-motion platforms. Desktop simulators, such as the RealTime Technologies RDS-100, serve as an entry point for driver training, integrating specialized software with basic steering wheel and pedal control interfaces [22]. At the other end of the spectrum, full-motion simulators, such as the National Advanced Driving Simulator, feature advanced motion platforms, multi-degree-of-freedom (pitch, roll, and yaw) systems, and force-feedback steering mechanisms that replicate real vehicle dynamics with high precision [23].
Many modern driving simulators have incorporated enhanced display technologies to increase the drivers’ level of immersion. Wrap-around displays can be used to expand the user’s field of view, enhancing spatial awareness [24]. Virtual reality (VR) has also made substantial progress in simulator design, allowing for cost-effective, highly immersive training experiences [25,26].
Several companies have pioneered advancements in driving simulation technology. STISIMDrive specializes in research and clinical applications, offering simulation systems capable of generating over 40 driving scenarios tailored for rehabilitation and assessment [27]. DriveSafety has developed a range of driving simulators designed for clinical and research-based applications, particularly for occupational therapy and rehabilitation settings [28]. Virage Simulation focuses on professional driver training, providing simulation solutions for commercial vehicle operations, law enforcement training, and emergency response driving [29]. While advanced simulator systems offer highly detailed driving experiences, their complexity can present challenges related to cost, technical accessibility, user comfort, and the potential for simulator sickness.
Despite the technological advancements in driving simulators, simpler interactive exercises provide unique benefits, particularly in clinical and educational settings. These exercises focus on fundamental driving skills, such as steering and pedal responses, without requiring engagement in driving scenes. Such tasks allow for targeted assessments, making them useful for evaluating cognitive, visual, and motor functioning in a wide range of drivers.
A critical advantage of interactive exercises is the reduced risk of simulator sickness, a common side effect in high-fidelity, highly immersive simulation environments. Research indicates that simulator sickness is less prevalent in simple interactive exercises, such as basic steering and stoplight reaction tasks, due to limited sensory conflicts and minimal visual–vestibular discrepancies [30]. Studies show that older adults are more susceptible to simulator sickness than younger participants, further emphasizing the importance of alternative assessment methods that prioritize comfort and usability [31]. Driving simulators have been used in rehabilitation settings for training purposes and as assessment tools to determine fitness to drive after strokes and head injuries. A simple interactive exercise is used to teach the motor aspects of pre-driving skills to young adults with and without Autism Spectrum Disorder (ASD) [18].
For teenagers, simulators offer the opportunity to gain experience in challenging scenarios such as emergency braking, adverse weather conditions, and high-traffic intersections. These experiences can help teens develop hazard-detection skills and improve their decision-making under pressure [32]. For older adults, simulators can be used to evaluate functional abilities such as hand–eye coordination, pedal response, and steering accuracy [33,34]. They can also provide feedback to guide interventions aimed at enhancing driving strength, flexibility, and cognitive processing [35,36]. Although various assessment tools exist, there is a need for specialized and easy-to-understand devices that clinicians can use to deliver information to both the client and their families [37].
Many clinicians use the useful field of view (UFOV) to assess driving performance [38]. UFOV training can be used to examine divided attention in conjunction with simulator training, which can be effective for turning in traffic lights [11,39]. Therefore, the applicability of driving simulator exercises coupled with other tools is valuable in clinical, training, and educational settings to assess and train the underlying cognitive, visual, and motor components related to driving.
Recent research highlights the potential strengths and limitations of driving simulators in training and assessment contexts. Alonso et al. [40] conducted a systematic review of empirical studies assessing the utility of simulators for younger and older drivers. While the findings highlight simulators’ role in improving road safety under controlled conditions, key limitations include limited follow-up on training outcomes and a lack of standardization in validation methodologies. These findings underscore the importance of further research into the reliability and long-term benefits of simulator-based interventions.
Driving simulators have evolved into versatile tools that cater to a wide range of applications, from high-fidelity training environments to simple assessment tools for clinicians and educators. While full-motion simulators and VR systems provide a real-time environment, simpler interactive exercises offer an effective and accessible means of evaluating fundamental driving-related motor functions. By integrating these tools into clinical assessments and driver training programs, researchers and practitioners can enhance safety, accessibility, and effectiveness in driver evaluation and rehabilitation.

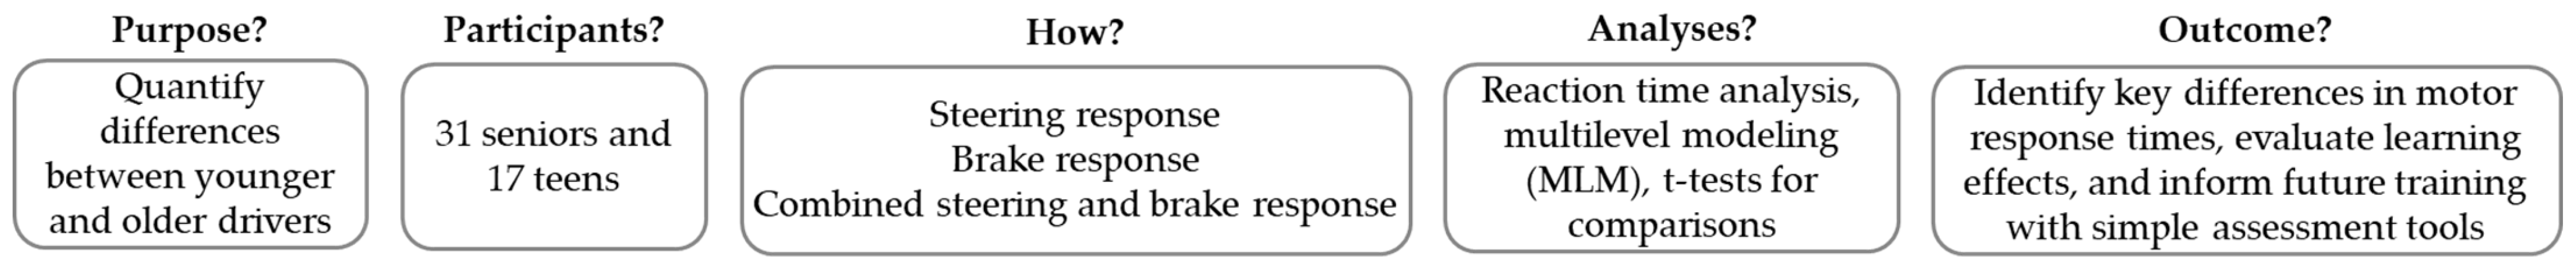
1.4. Study Objectives

This exploratory study addresses the need for simple and effective tools for a broad range of users; therefore, both aging and novice drivers utilized interactive exercises presented using a driving simulator. While many driving simulator research studies focus on complex driving scenes and/or simulator tasks using scenes of roadways, this study uses the opposite approach. While there are situations that require advanced simulators, there are also situations that may benefit from simple, straightforward exercises. Clinicians with limited experience in assessing driving should feel empowered to use their clinical reasoning skills to make clear-cut decisions with the patients they serve. For example, if an individual can no longer distinguish between the gas and brake pedals, simple driving simulator exercises can be utilized. If an individual does not have the upper-body strength to make several steering wheel movements, this is another example of a use case. This study addresses a gap in research and clinical practice, which may be addressed using simple, interactive exercises.
This study explores whether differences exist in how senior drivers (over 60) and novice teen drivers (ages 16 to 17) respond to simple stimuli to assess both steering and pedal skills. Specifically, this study evaluates potential performance differences across three interactive exercises—Reaction Timer Steering©, Reaction Timer Stoplight©, and Stoplight and Steering©—to assess reaction times, error rates, and learning effects over repeated trials.
The study investigates if teens’ and seniors’ reaction times and types of errors vary. By focusing on functional abilities, this study seeks to determine the extent to which driving simulators can effectively differentiate between the performance of these two at-risk groups. The long-term goal is to determine if these interactive exercises on a driving simulator can be used by clinicians and educators to tailor assessments, interventions, training, and skill screenings to identify potential safety concerns that need to be addressed for at-risk driver populations. The research process is outlined in Figure 1.
The following sections are structured as follows: Section 2 describes the methods, including participant recruitment, the driving simulator setup, interactive exercises, and data analysis procedures. Section 3 presents the results, detailing differences in reaction times and learning effects across the interactive exercises. Section 4 provides an in-depth discussion of the findings, their implications, and comparisons with prior research. Section 5 outlines the conclusions, summarizing the key takeaways and potential applications. Finally, Section 6 discusses the limitations and future directions, addressing the study’s constraints and suggestions for further research.

2. Methods

2.1. Participants

There were 53 participants who completed this study in the summer of 2019, including 17 teenagers and 36 healthy seniors. Data for two seniors were excluded due to being outliers. Thus, there were a total of 51 participants in this study. Among the 17 teens, ages ranged from 16 to 17 years, with a mean age of 16.4 years (SD = 0.5), including one male and 16 females. The teen participants were recruited from sports teams at a local high school. The 34 seniors ranged in age from 62 to 82 years, with a mean age of 72 years (SD = 5.4), with half of the sample being male and the other half female. They were recruited from a local senior center that offers programs and services for community-dwelling adults aged 55 and older.
Participants were eligible to participate in the study if they (a) possessed a valid driver’s license and (b) had corrected binocular visual acuity of 20/40 or better. Exclusion criteria included self-reported (a) injuries or medical conditions impacting vision, leg, or arm function, or (b) a history of motion sickness when traveling in mountainous regions.

2.2. Materials

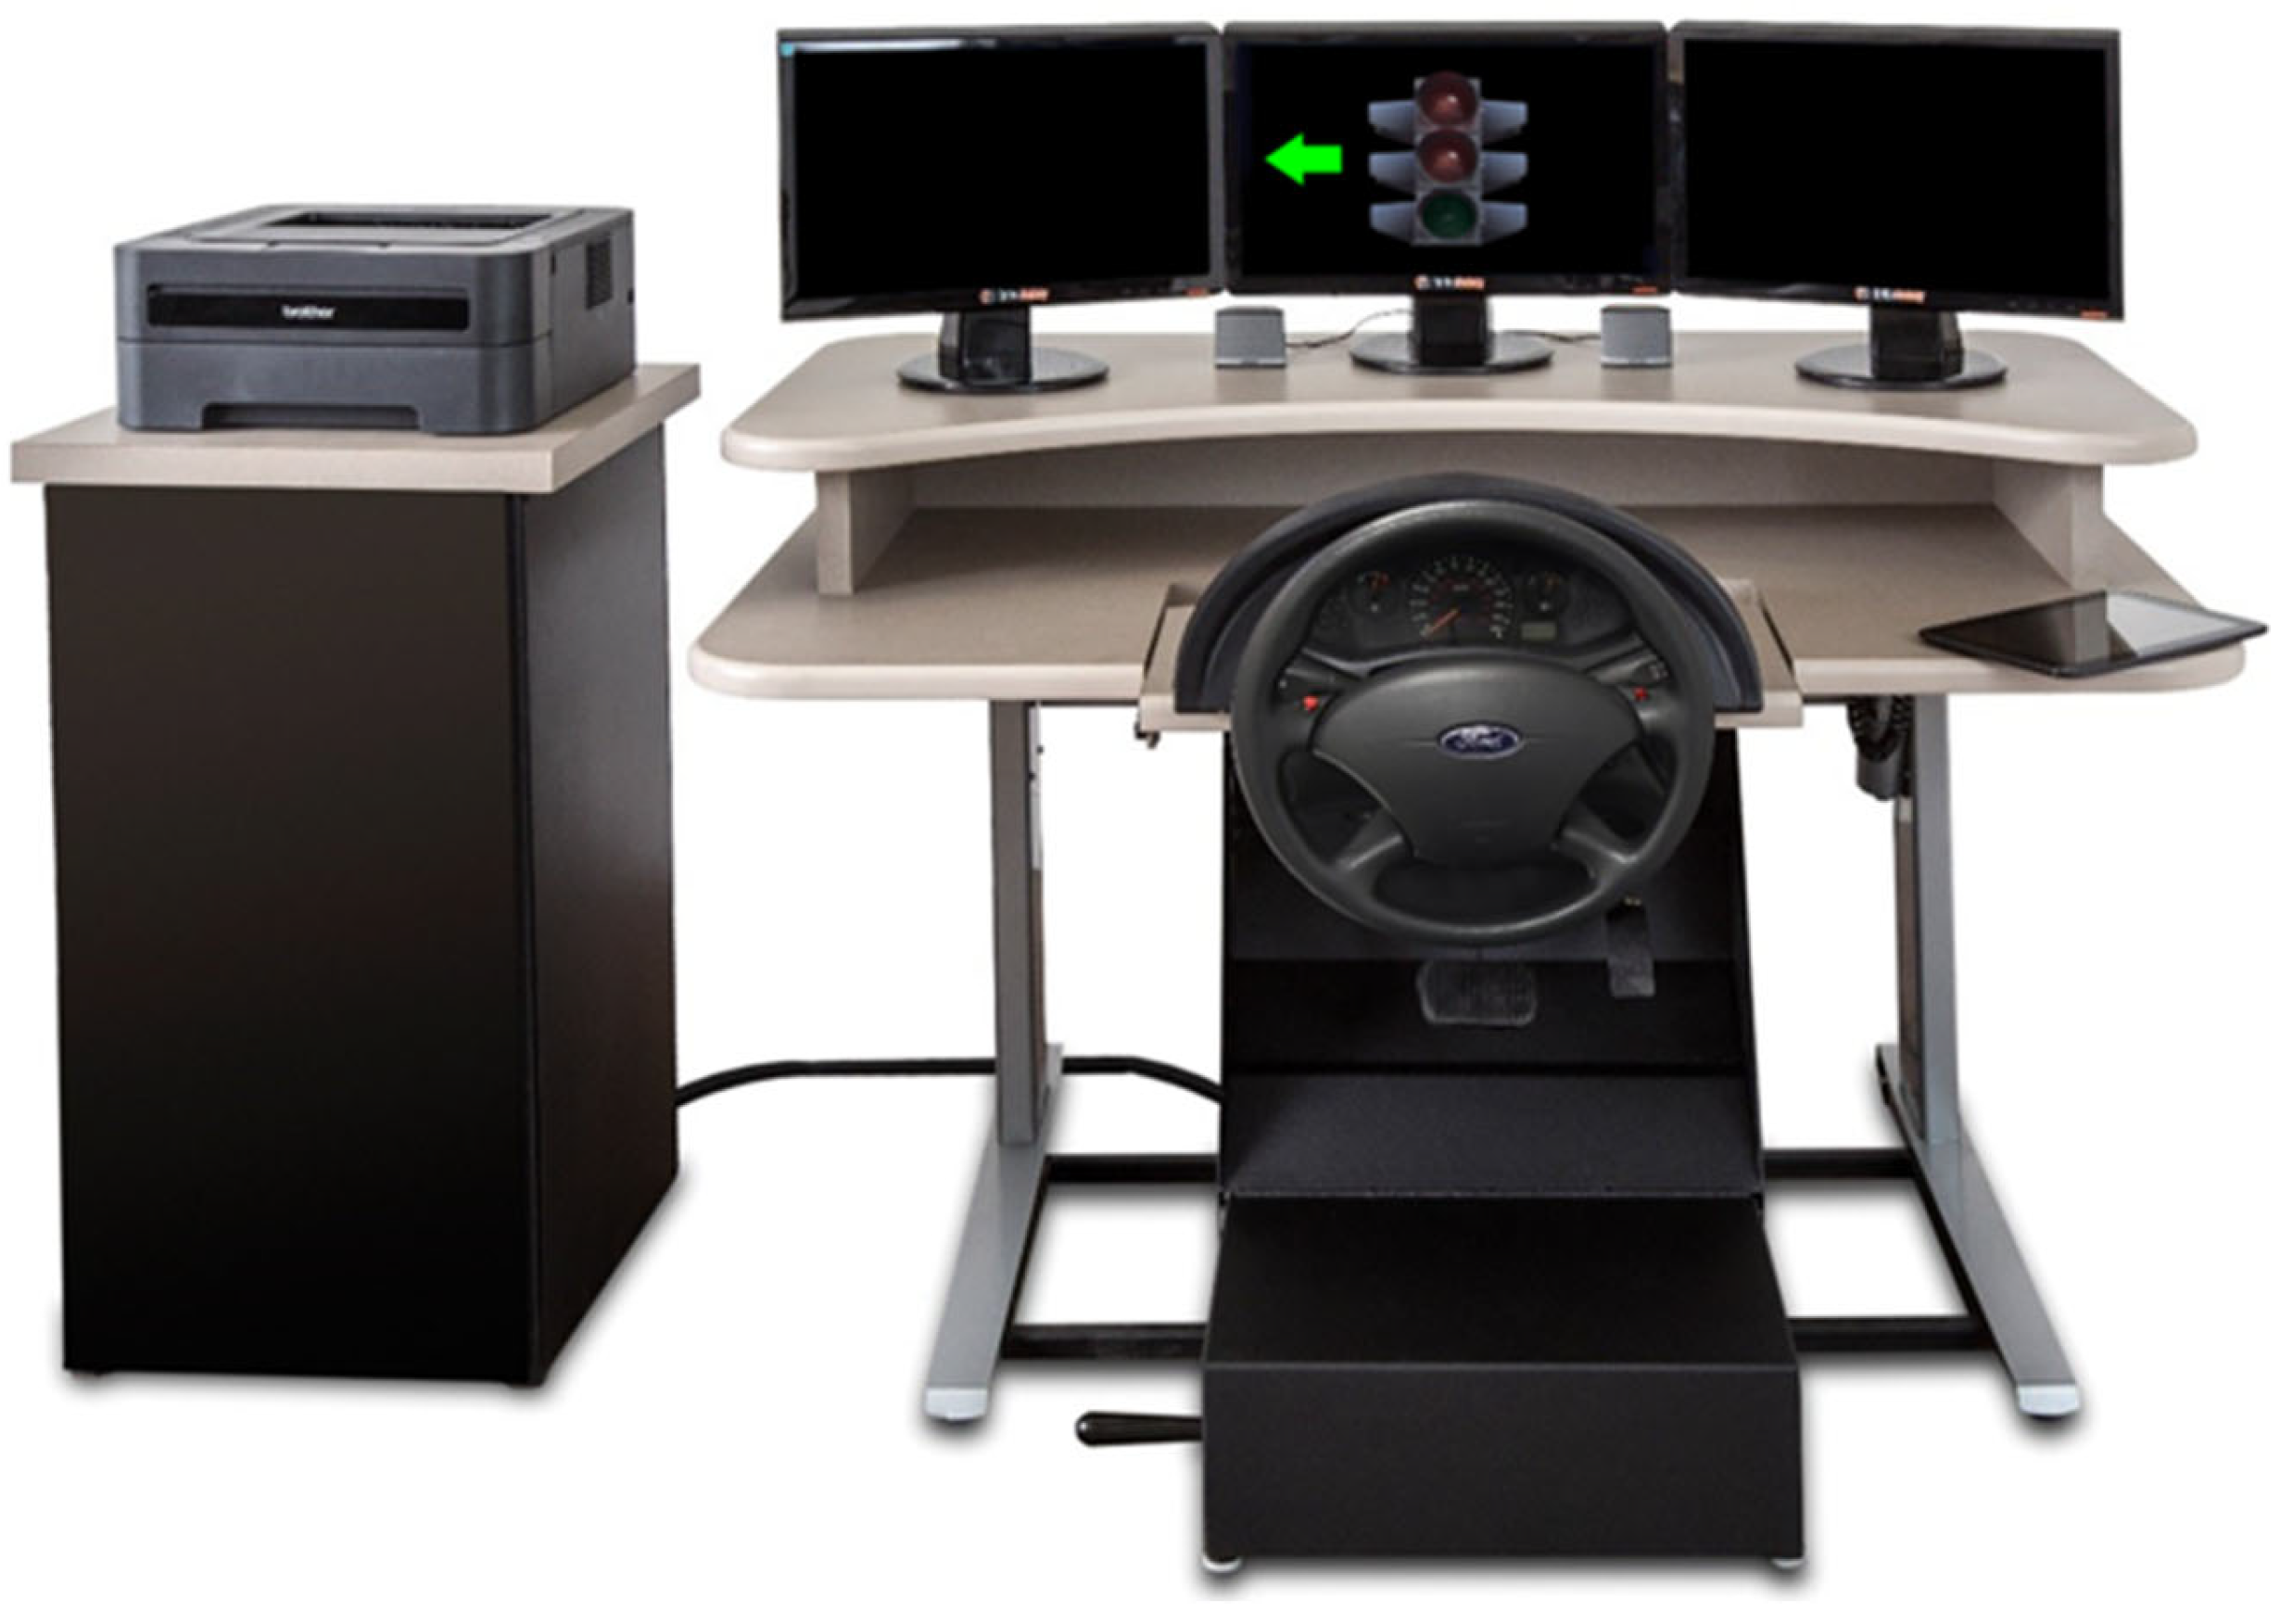
2.2.1. Driving Simulator, Simulator Fit, and Calibration

This study used a DriveSafety CDS-200 driving simulator (Figure 2), which is based on the steering wheel and pedals of a Ford Focus. For additional information about the simulator, process used to fit each participant to the simulator, and the calibration protocol for each participant, please see Brooks et al. [41] study. An integrated wireless tablet is used to select scenarios and display standardized scripts for each interactive exercise.

2.2.2. Interactive Exercises

Some interactive exercises were designed to assess the upper-body (steering) tasks separately from the lower-body (pedal) tasks. Other interactive exercises assess the upper and lower body together. Interactive exercises use images of the gas and brake pedals, as well as traffic lights or arrows, rather than roadway scenes. This allows the driver’s skills to be assessed using the steering wheel and pedal tasks without seeing a roadway scene. The use of interactive exercises focuses on the motor control aspects associated with driving as well as helping individual drivers who are uneasy using a simulator to become comfortable with the simulator’s controls. Figure 3 displays the images used in the interactive exercises (left) and screenshots of the results screen (center and right) shown to the participant immediately after task completion.

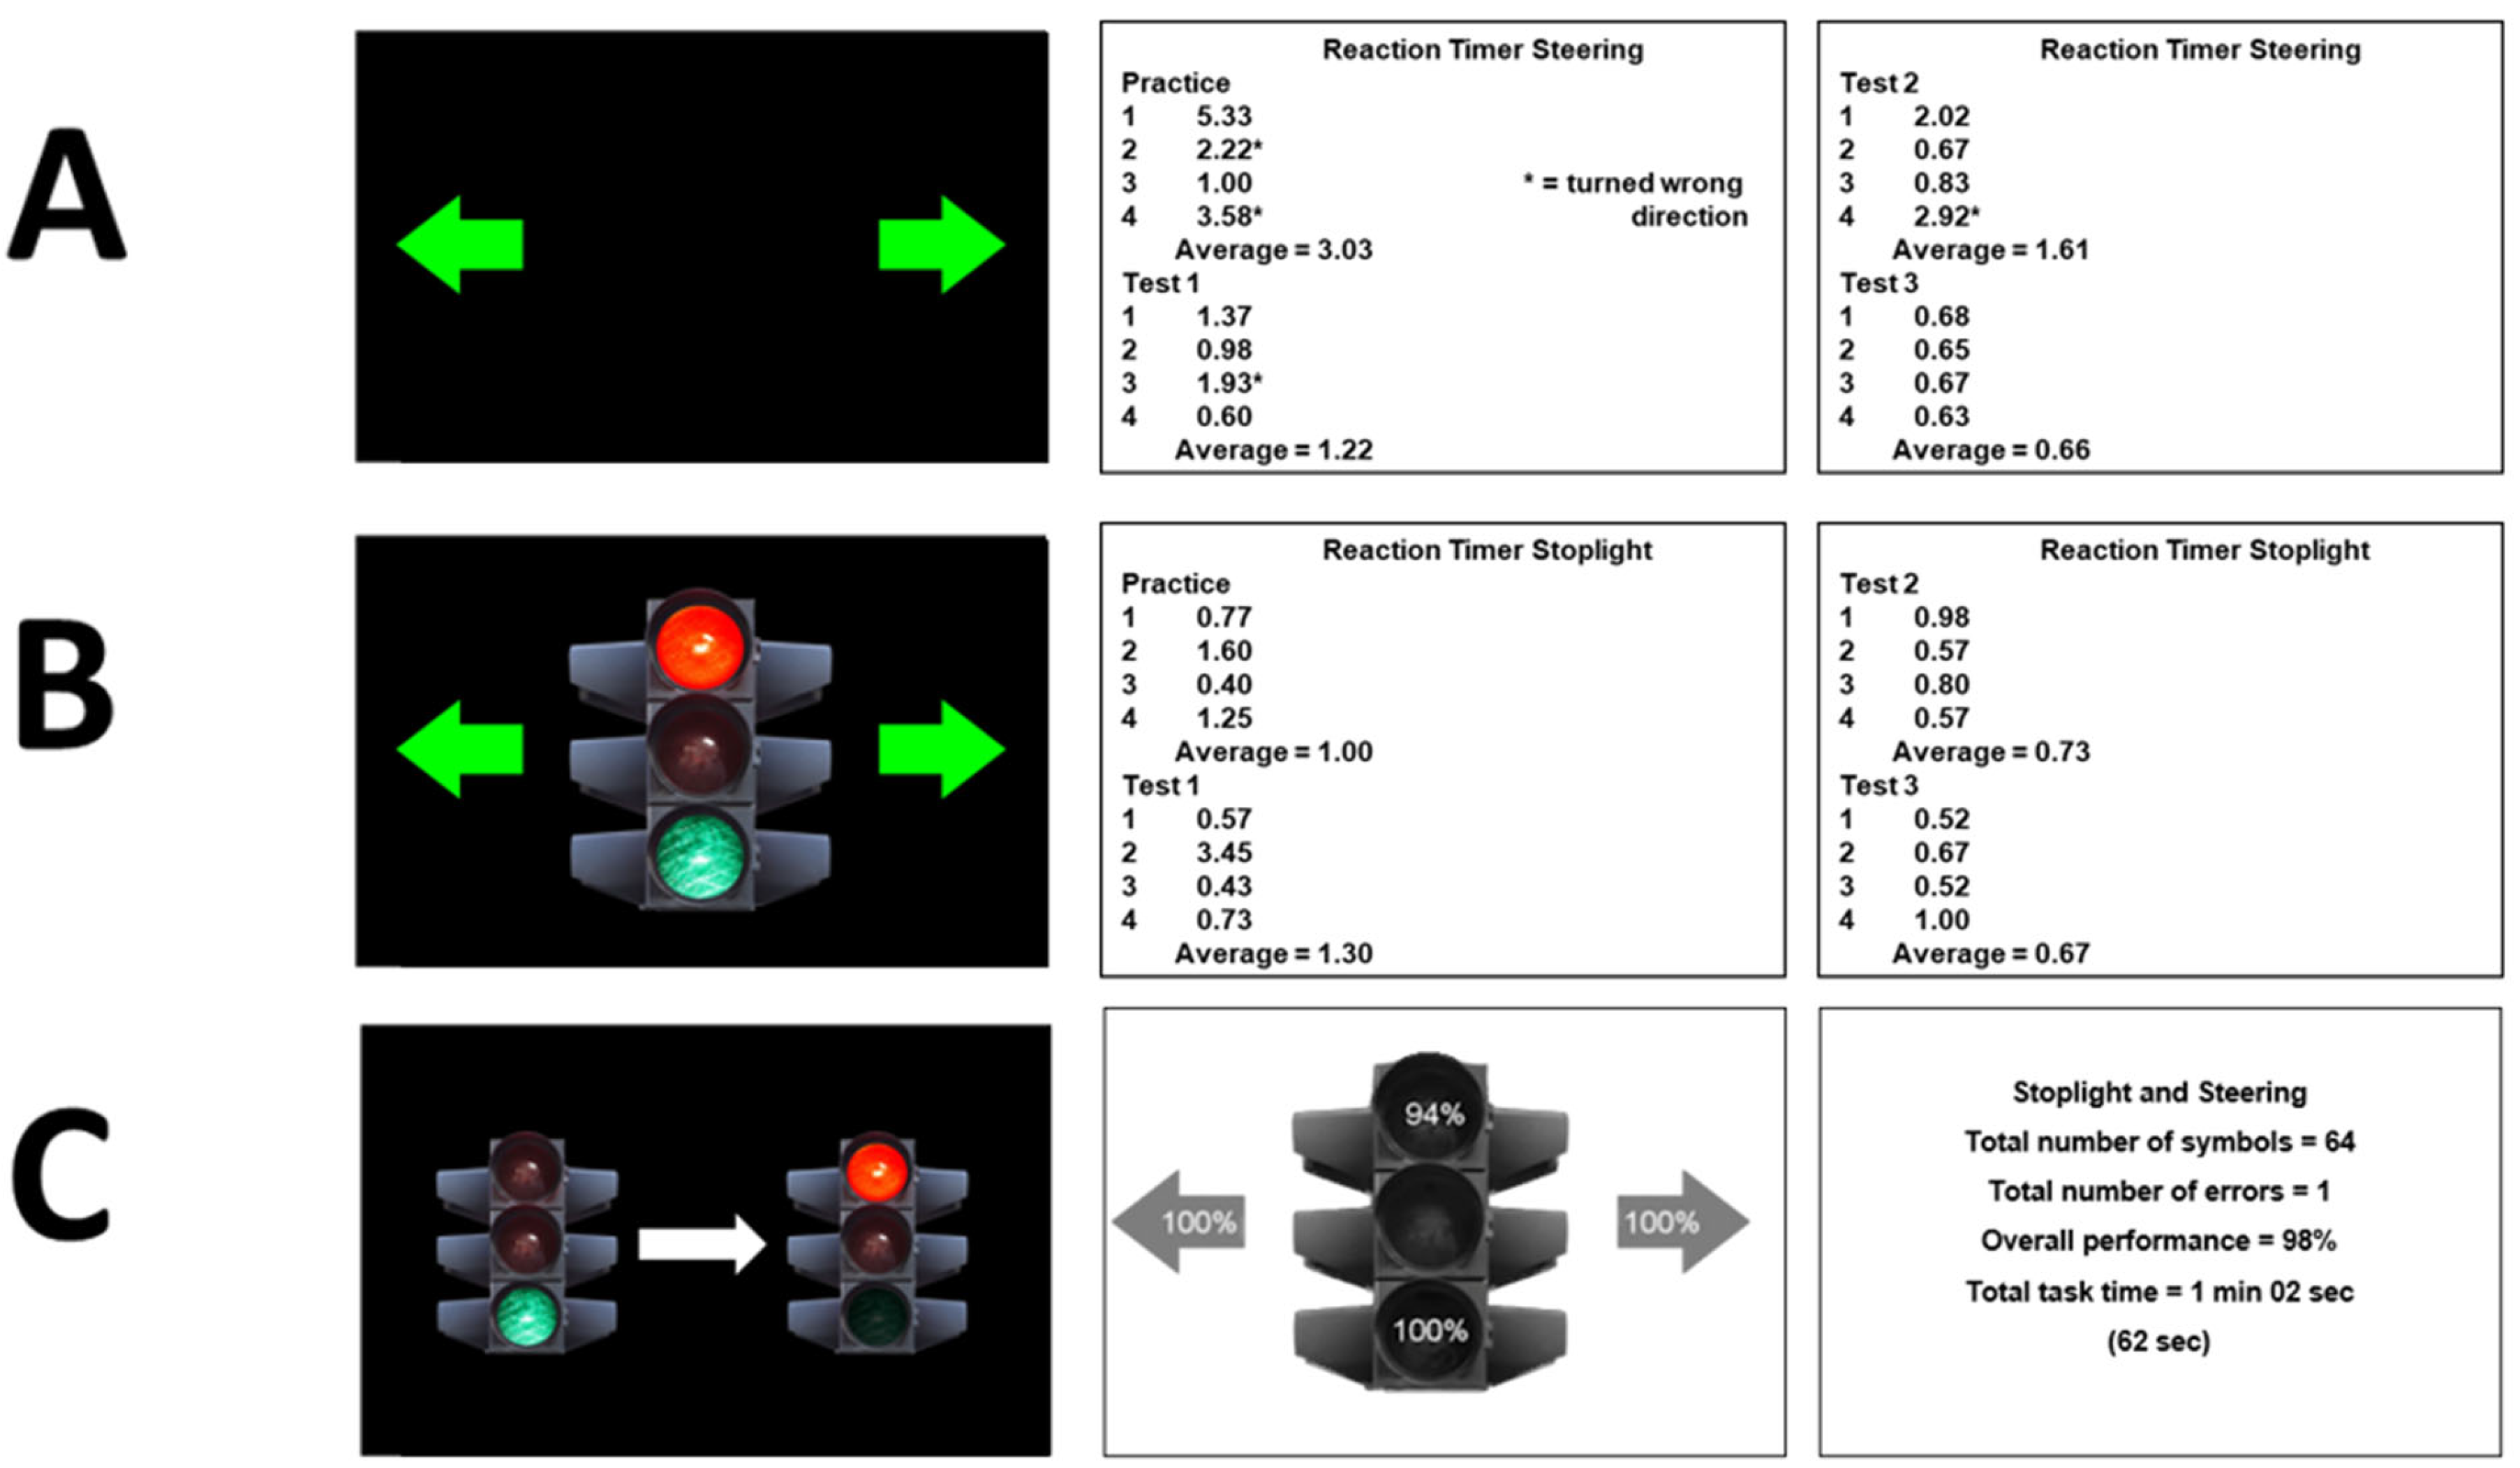
2.2.3. Reaction Timer Steering©: Task Design

During the Reaction Timer Steering interactive exercise, an arrow facing to the left or right appears in the middle of the center screen. The participant is instructed to turn the steering wheel in the direction of the arrow as quickly as possible. The participant starts and ends each event with the steering wheel centered, at the 12:00 o’clock or “home” position, and then turns the wheel to at least the 10:00 or 2:00 direction of the arrow. Then, the participant returns the steering wheel to the center position before the next arrow appears. After each turn, the steering reaction time is displayed on the screen. The participant completes a practice with four trials and then completes three tests with four trials each for a total of 16 trials. The averages are displayed after each group of four trials (Practice, Test 1, Test 2, and Test 3).
The results displayed at the end of the exercise show the individual steering reaction times as well as the average reaction time for each test, see Figure 3A. The simulator’s left screen shows the reaction times for Practice and Test 1. The right screen shows the reaction times for Test 2 and Test 3. If a participant turns the wheel in the wrong direction prior to turning the correct direction, an asterisk (*) follows the reaction time.

2.2.4. Reaction Timer Stoplight©: Task Design

During this interactive exercise, a traffic light is displayed in the middle of the screen. Participants are instructed to use the gas and brake pedals to respond to the traffic lights. First, the participant presses the gas pedal until reaching a specified zone where the light turns green and stays green as long as the gas pedal pressure remains within the specified zone. The scenario was designed with this specified zone to force all users to use the same starting position. This makes the task consistent between all individuals. The specified zone has a pedal depression range for the green light to illuminate between 5% and 30%. Then, as soon as the traffic light turns red, the participant is instructed to press the brake pedal as quickly as possible. After each brake pedal press, the brake reaction time is displayed on the simulator’s screen. The participant completes a practice with four different brake presses and then completes three tests with four trials each. The average of the four trials is displayed after each test.
The results displayed at the end of the Reaction Timer Stoplight exercise show the individual brake reaction times as well as the average reaction time for the Practice and each test, see Figure 3B. The simulator’s left screen shows the reaction times for Practice and Test 1. The right screen shows the reaction times for Test 2 and Test 3.

2.2.5. Stoplight and Steering©: Task Design

During the Stoplight and Steering interactive exercise, participants are instructed to use the steering wheel and pedals to respond to symbols, which are static images of a traffic light or arrows, and are specifically as follows: press the gas when the traffic light is green, press the brake when the traffic light is red, turn the wheel to the left when the left arrow appears, or turn the wheel to the right when the right arrow appears. The four symbols appeared in a random order. If a participant got a symbol wrong, they were instructed to continue to the next symbol and not to correct their error because the exercise was designed to move to the next symbol regardless of whether the prior input was correct or incorrect. The available options are 16, 32, 64, or 128 total symbols. There is a tutorial option, which shows 4 symbols and takes the participant through the process of how to respond to each symbol; a demo option, which shows 8 symbols for practice; and a task-only option, where the task is presented without a tutorial or demo. In this study, the tutorial and demo with 16 symbols were completed first as practice (no data were collected) and then the task-only options with 64 symbols.
The results are displayed at the end of the scenario; see Figure 3C. The simulator’s center screen shows the name of the interactive exercise (Stoplight and Steering), the total number of symbols (64), the total number of errors (1), the overall performance (98% correct), and the total task time (1 min 2 s). The left screen shows a picture of the stoplight with the percent correct for each pedal and steering response.

2.3. Procedure

This study was approved by the university’s Institutional Review Board. The data collection for the teen participants was conducted at a local high school, while the data collection with the seniors took place at a local senior center or at the university. All participants received a USD 25 gift card in exchange for their participation. The interactive exercises were part of a broader study; however, only the results from these exercises are included in this paper. All participants completed the study in one session. After providing or confirming consent and completing the background survey, participants were “fit” to the simulator before beginning the simulator protocol. Once a participant was “fit” to the simulator and completed the calibration process, the participants proceeded to the interactive exercises.

2.4. Data Analysis

All statistical analyses were conducted using R, a programming language for statistical computing [42]. Analyses were performed separately for each of the interactive exercises. For the Reaction Timer Steering and Reaction Timer Stoplight interactive exercises, reaction times on the Practice, Test 1, Test 2, and Test 3 were recorded by the simulator. In this study, the practice trial was excluded from analysis since the practice should not be included as part of an assessment.

2.4.1. Assessing Trial-To-Trial Reliability and Clustering Effect

For the Reaction Timer Steering and Reaction Timer Stoplight interactive exercises, the reliability of these repeated measures was estimated. Reliability can be defined as the relative consistency of a measure [43]. There were two reasons for assessing the reliability of the repeated measurements: to evaluate the consistency of performance from trial to trial and to account for the clustering effect due to the participant. To estimate reliability among trials, or trial-to-trial reliability, a two-way mixed effect intraclass correlation coefficient (ICC) was computed for each of the three tests [44]. Note that a participant’s score on one trial tends to be correlated with their scores on their other trials. However, scores from the same participant will tend to be more correlated with one another (i.e., dependent) than scores from two different participants, resulting in a clustering effect due to a given participant. An example would be a participant who performs very well on one trial will likely perform well across all trials. This may not necessarily be true for a different participant. As an index of the magnitude of this clustering effect, a one-way random effects model (ICC(1)) was computed [45]. Because there was evidence that observations (i.e., reaction time) across trials were correlated within participants, this suggests a clustering of scores due to a participant and justified the use of multilevel modeling.

2.4.2. Analytic Method

Multilevel modeling (MLM) is a generalization of ordinary least squares regression [45,46]. MLM is advantageous because it incorporates the nonindependence of scores within a participant. Although a univariate analysis of variance (ANOVA) or a multivariate ANOVA could be utilized to analyze repeated measures data [47], neither approach fully accounts for the nonindependence of scores. Moreover, both approaches require complete data across all repeated measures for each participant. Thus, if a measurement of the dependent variable is missing from one participant on a single trial, all of the data from this participant would be excluded from the analysis. In contrast, with MLM, complete data across all repeated measurements are not required. Overall, MLM provides a modern approach for analyzing repeated measures data.
For clarity, imagine predicting performance (on the y-axis) as a function of a trial number (on the x-axis), with a single line for all teens and a single line for all seniors. With MLM, a separate line is estimated for each participant. Thus, for some participants, the line may be steep, while for others, the line may be shallow (i.e., flat). Similarly, some participants may have a performance score (e.g., reaction time) that is much higher in general on the first trial (e.g., older adults) than other participants (e.g., teens). In MLM, these patterns can be accounted for by including random effects. For these analyses, the participant was a random effect, thus allowing each participant to have their own unique intercept. That is, because intercepts were permitted to be different from one participant to the next, each participant could have a line that starts off high or low. The fixed effects were trial and age group, where the age group was a dummy variable with seniors as the reference group. Because the data for the Reaction Timer Steering exercise were positively skewed, a logarithmic transformation of this dependent variable (reaction time) was used. For the Reaction Timer Stoplight, a power function was used, where a logarithmic transformation was applied to the continuous predictor (trial) and the continuous dependent variable (reaction time). Fox [48] provides a review of these commonly used data transformations. To facilitate interpretation, the multilevel modeling results were transformed back to their original units. The multilevel models were conducted using the nlme package in R [46].
For the Stoplight and Steering interactive exercise, there were five measured variables (see Table 1). Because the total number of errors measured was the same construct as the percent of overall performance, the percent of overall performance was excluded from the analyses. An independent samples t-test was conducted separately for the four following measured variables: total number of errors, total task time (seconds), average reaction time (seconds), and standard deviation of reaction time (seconds) to examine the performance differences between the senior and teen drivers (see Table 1).

3. Results

3.1. Trial-To-Trial Reliability and Clustering by Participant

Trial-to-trial reliability was calculated using a two-way mixed-effect ICC for all three tests on the Reaction Timer Steering and Reaction Timer Stoplight exercises. Two-way mixed-effect ICCs can be interpreted as a small effect (0.01), medium effect (0.10), or large effect (0.25) [43]. For the Reaction Timer Steering exercise, the estimated ICCs were 0.444, 0.553, and 0.381, respectively. For the Reaction Timer Stoplight exercise, the estimated ICCs were 0.763, 0.779, and 0.836, respectively. All ICCs across both Reaction Timer exercises indicate high average consistency from trial to trial.
The clustering of data by participant was assessed for Reaction Timer Steering and Reaction Timer Stoplight using a one-way random-effect ICC. This analysis was computed for each exercise. The ICCs for Reaction Timer Steering and Reaction Timer Stoplight were 0.34 and 0.62, respectively. These were statistically significant at the 0.001 level, suggesting a clustering effect by participants.

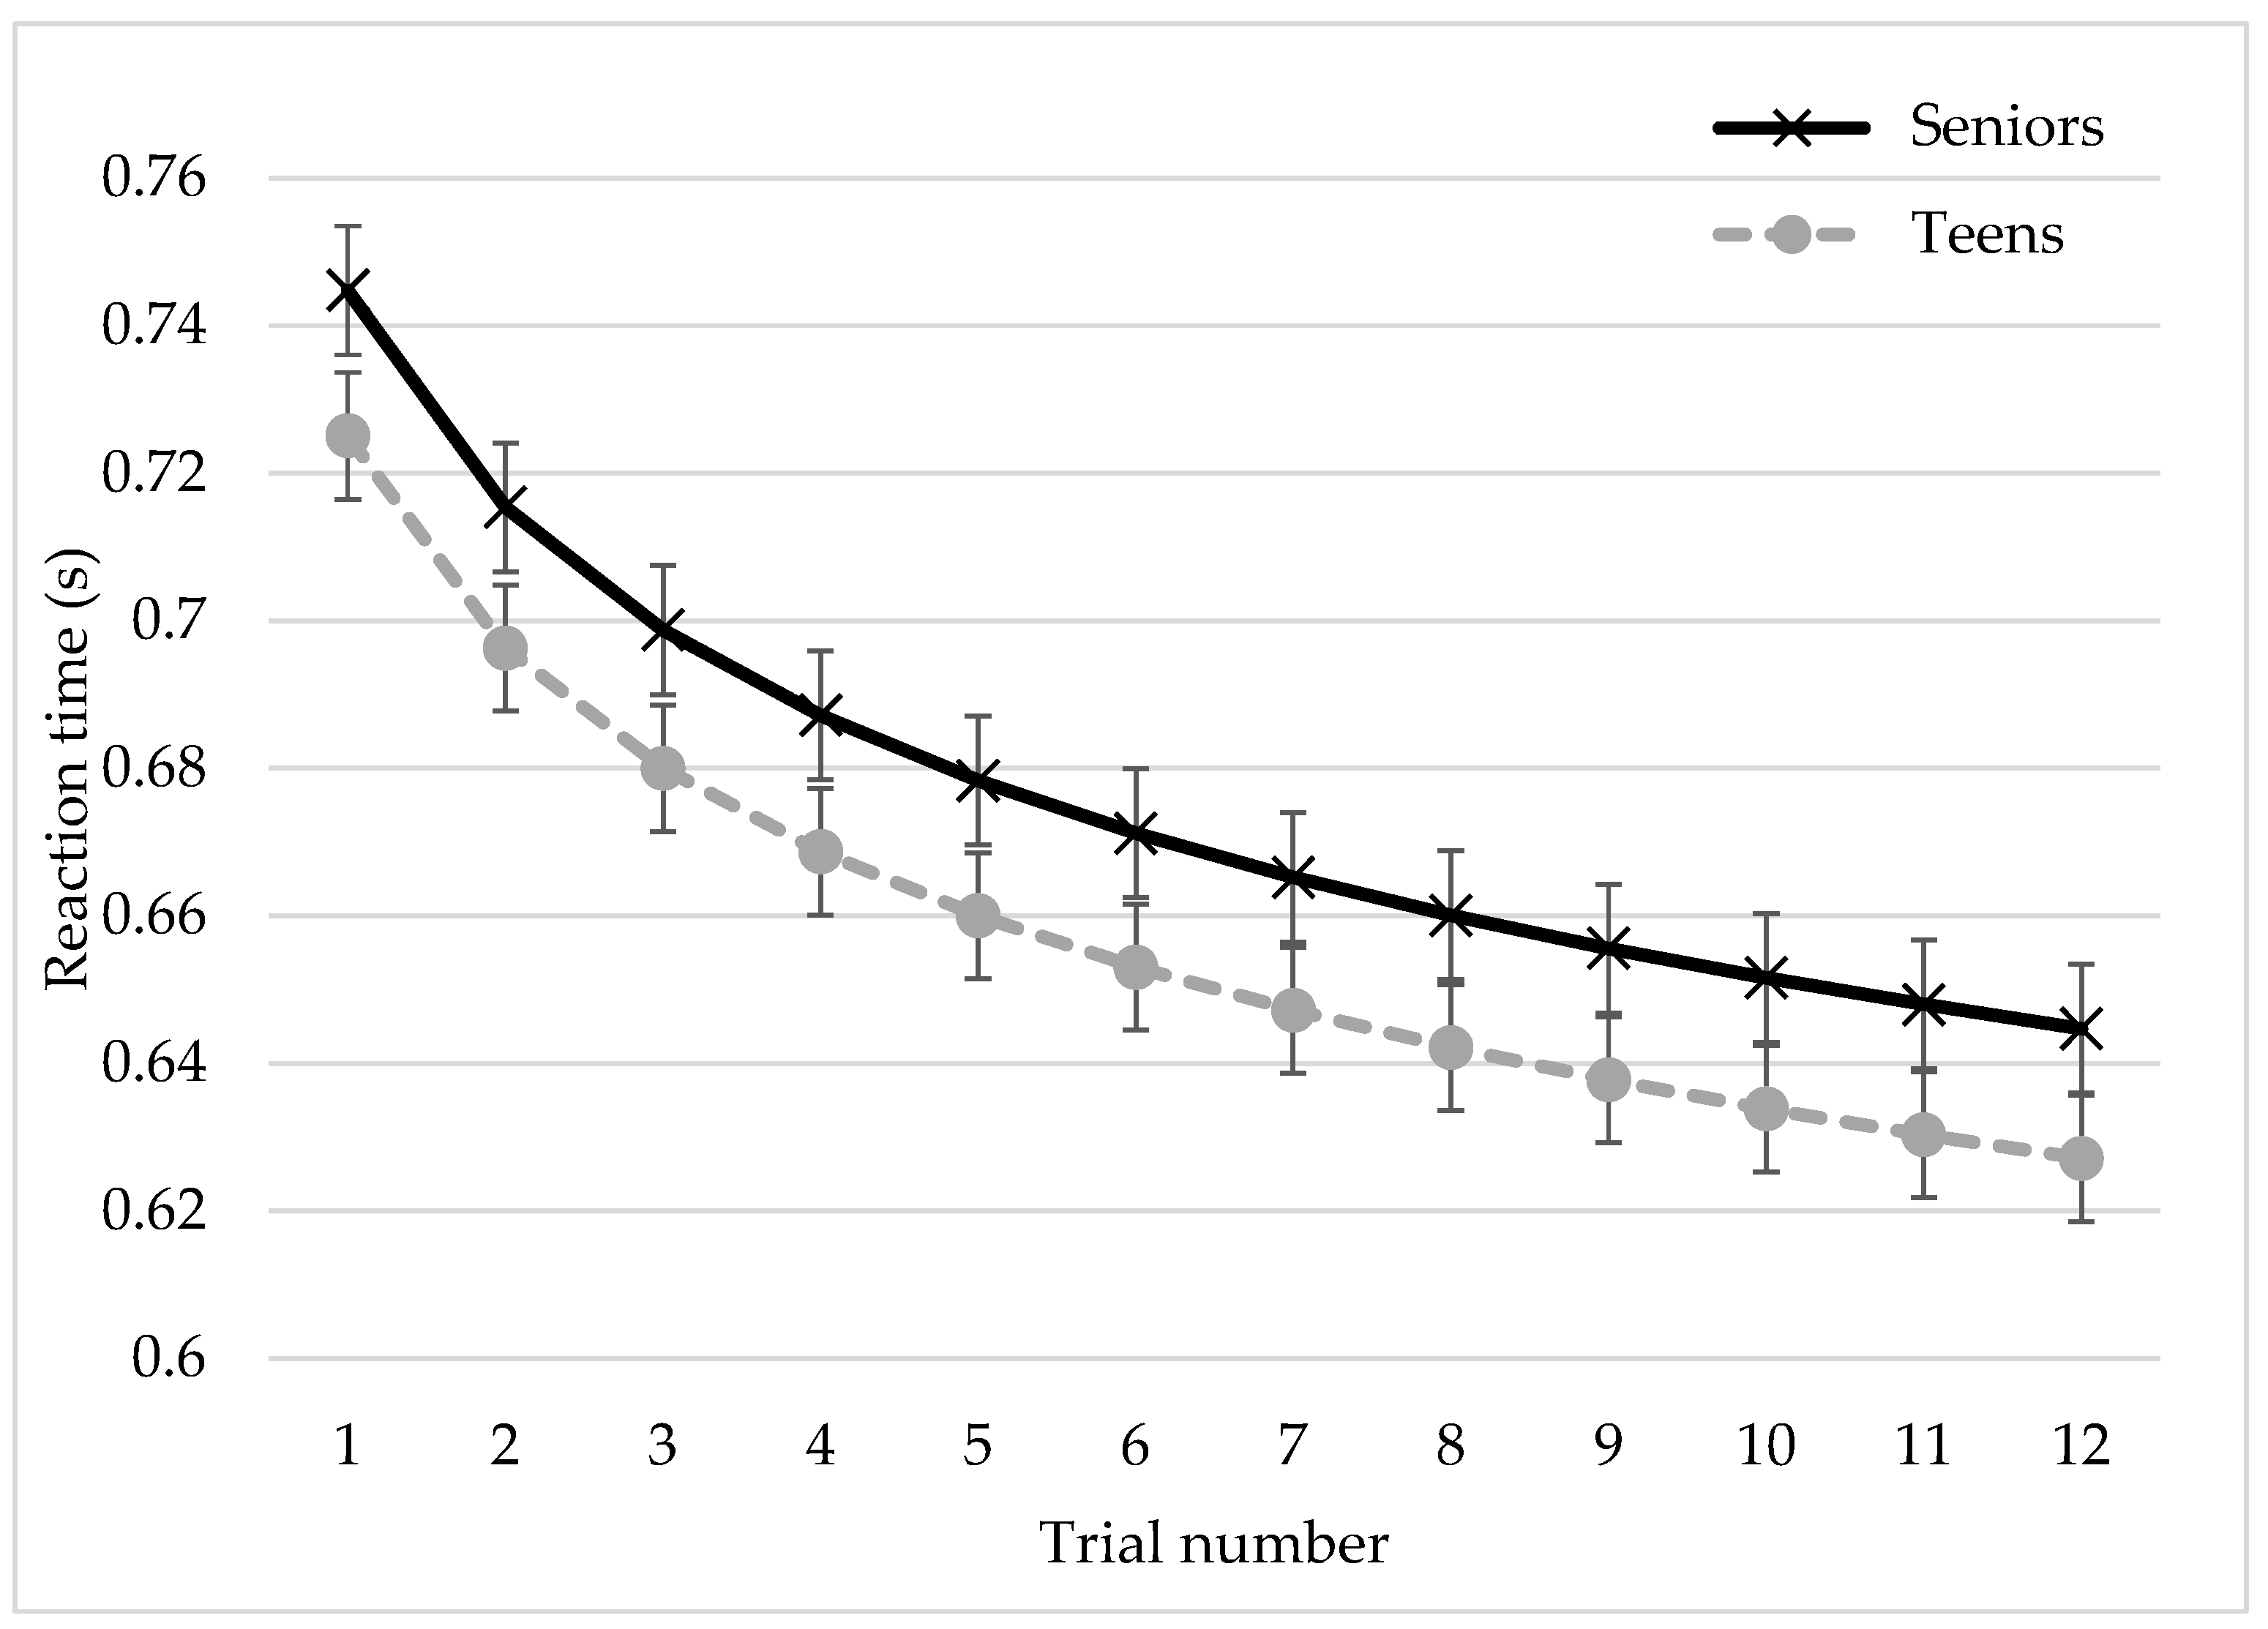
3.2. Reaction Timer Steering©

For Reaction Timer Steering, the age group and trial number were fixed effects in the MLM. Because the participant was a random effect, this allowed for intercepts to differ across participants. Table 2 provides a summary of the results. For Reaction Timer Steering, there were statistically significant main effects of the age group and trial number. The main effect of the age group suggests that reaction times were faster for teens compared to seniors. In addition, the reaction time was faster as the trial number increased. Notably, there was a statistically significant two-way interaction between the age group and trial number. Figure 4 depicts the nature of the interaction. Specifically, as the trial number increased, the reaction time for seniors improved at a faster rate compared to the teens.

3.3. Reaction Timer Stoplight©

In the MLM, the age group and trial number were fixed effects. The participant was a random effect, allowing for intercepts to vary by participant. The results revealed that the age group did not have an effect on the reaction time for the Reaction Timer Stoplight interactive exercise (see Table 2). However, there was a statistically significant main effect of the trial number, meaning that as the trial number increased, the reaction time was faster (see Figure 5).

3.4. Stoplight and Steering©

Using the age group as the independent variable and the four measured variables as dependent variables, two-sample independent t-tests were conducted. The results showed statistically significant mean differences on three variables—the total number of errors (t(49) = 2.439, p < 0.05), overall performance (t(49) = −2.365, p < 0.05), and standard deviation of the reaction time (t(49) = 3.010, p < 0.01). A summary of the results is provided in Table 3.

4. Discussion

Interactive exercises allow individuals to work on or assess the upper body (steering tasks) and lower body (pedal tasks) without a roadway scene. This allows for the quick and effective assessments of a person’s capabilities related to physical functioning. The purpose of this study was to examine the differences between older and teen drivers using three interactive exercises: Reaction Timer Steering©, Reaction Timer Stoplight©, and Stoplight and Steering©. The participants completed a practice trial followed by three subsequent trials for all three exercises. Each exercise records the reaction time, average reaction time, number of errors, task time, and overall performance. Overall, significant findings with practical implications were revealed for each task.
Our findings suggest that there are notable differences between senior and teen drivers for the Reaction Time Steering interactive exercise. Specifically, the reaction time was faster for teens compared to seniors. Additionally, the reaction time was faster and the reaction time improved at a quicker rate for the seniors compared to the teens as the trial numbers increased. That is, the reaction time for teens was much faster than that of the seniors; thus, there was little room for improvement for the teens because their performance was relatively stable. The reaction time has been shown to be a reliable measure of cognitive and motor ability [12]; therefore, this suggests that the steering interactive exercise could be used as a training or rehabilitation tool to address hand/eye coordination and motor planning. Given that aging individuals typically have decreased visual and motor functioning that impact their daily living, specifically driving [15], the steering exercise could serve as a basis to not only examine the state of one’s functional abilities but also to use the task as an intervening activity to strengthen these skills. This task has already proven to be beneficial for young, at-risk potential drivers who need to develop their steering skills [18].
In regard to the Reaction Timer Stoplight exercise, as the trial number increased, the reaction times were faster for both teens and seniors. Although there were no significant differences between both groups, there were some noteworthy explanations. First, the older participants in this study are all community-dwelling active adults who likely do not represent the entire aging population. It is valuable to show that age-related differences do not occur regardless of age but are likely to be associated with functional status. That is, it is important for the medical community and family members to consider the functional status of each aging driver rather than making sweeping age-related assumptions. It also suggests it may be valuable to consider evaluating clients’ upper-body functions to assess their capacity prior to evaluating lower-body functions. Practically speaking, it is easier to have individuals complete the Reaction Timer Steering exercise prior to the Reaction Timer Stoplight exercise because if an individual does not understand the task, it is easier to demonstrate by holding the wheel rather than demonstrating using the pedals. Given the correlation between lower-body strength and driving difficulties [49], these functions are still an equally critical area to examine.
Additionally, the Reaction Timer Stoplight exercise has the potential to identify motor and cognitive functions. Given that driving simulator exercises can affect on-road performance [20], it is plausible that this stoplight exercise is an effective mechanism for identifying abnormal pedaling movements. Namely, if the clinician or teacher notices a unique or unusual placement of the patient’s foot on the pedals (e.g., pedaling with their toes or heels), it could be helpful in identifying whether the foot placement impacts the reaction time.
For Stoplight and Steering, teens made 2.3 fewer errors out of the 64 symbols than the seniors and the seniors’ standard deviation of their reaction time had greater variability (0.06 s) than the teens. There are a few key takeaways from these results. Given that researchers have noted increased risks for young drivers [8], this provides empirical evidence that they may be less likely to commit errors in comparison to older drivers. Moreover, the seniors displayed greater variability in their results. This suggests that the results of the seniors were more widespread and, as such, may require additional interventions to determine precisely the elements that affect their reaction time. These findings are also incredibly useful, as 74% of older drivers have reported being interested in programs that are designed to improve driving strength and flexibility [49]. Given that this task measures accuracy rather than speed, this task also provides an applicable method for clinicians and instructors to help assess and develop a patient’s motor skills when driving and learning to drive.

5. Conclusions

This exploratory study explored performance differences between seniors (over the age of 60) and teenagers (ages 16 and 17) using a series of interactive exercises on a driving simulator. By focusing on fundamental steering and pedal response tasks, this research confirmed the value and need for simple, targeted assessment tools that can quickly evaluate critical cognitive, physical, and motor functions essential for skills related to safe driving. These findings provided valuable insights into the distinct challenges faced by these two at-risk groups, offering research-based guidance for interventions aimed at improving safety.
Robust statistical methods were employed to ensure the accuracy and reliability of the results. Multilevel modeling (MLM) was utilized to address the nonindependence of scores and variability across trials, while intraclass correlation coefficients (ICCs) confirmed trial-to-trial reliability. For the Stoplight and Steering exercise, independent samples t-tests revealed significant group differences in reaction time, errors, and variability.
The results highlighted significant differences in the reaction times, variability, and performance across the three interactive exercises. In the Reaction Timer Steering exercise, the teens exhibited faster reaction times than the seniors and the seniors demonstrated improvement across repeated trials. For the Reaction Timer Stoplight exercise, reaction times improved over trials for both groups, indicating the importance of practice in safe, repeatable environments. Both the Reaction Timer Steering and the Reaction Timer Stoplight exercises have the potential to serve as practical tools for evaluating and enhancing upper-body and lower-body strength and reaction capabilities independently. In the Stoplight and Steering exercise, teens committed fewer errors and showed less variability in reaction times compared to seniors. The increased variability among seniors suggests the need for skill enhancement and the potential of tailored interventions to address motor and cognitive skills, which are critical for maintaining safe driving.
These findings underscore the importance of having the ability to quickly and easily assess functional abilities. The results are also valuable in demonstrating to designers and engineers the robust skills many aging drivers maintain. If these tasks are used for screening purposes, these tools have the potential to be valuable for clinicians and educators, to not only provide individualized assessments but also to identify specific needs and strengths of the clients across the lifespan they interact with. Driving simulators can be powerful, reliable tools for both assessment and intervention, offering a safe and controlled environment to evaluate and improve key driving-related skills.

6. Limitations and Future Directions

The participants in this study were all healthy, community-dwelling individuals. It will be beneficial to examine clinical populations in the future. For example, it will be beneficial for surgeons to see how long it takes their patients who have recently experienced shoulder surgery to return to their pre-surgical baselines. Future research is needed to quantify healthy individuals’ baselines across their lifespan to serve as controls for clinical populations.
This study was exploratory in nature, aiming to assess the feasibility of using simple, interactive driving simulator exercises to differentiate reaction times and learning effects between teens and seniors. As an initial investigation, the findings provide valuable insights but should be interpreted with caution due to certain limitations. One key limitation is the smaller sample composition, particularly the recruitment of teens from local sports teams. While an effort was made to recruit an equal number of male and female teens, more females chose to participate in the study. Secondly, student athletes may have better-than-average motor coordination and reaction times, potentially limiting the generalizability of the results to the broader teen population. Future research should aim to recruit a more diverse and larger representative sample, including individuals with varying levels of physical activity and driving experience. Additionally, in the future, similar gender distributions will be beneficial.
Another important limitation is the absence of a middle-aged control group (e.g., individuals in their 30s or 40s) who generally have lower crash rates. Comparing teens and seniors to a control group with lower risk and more stable motor-cognitive function would provide additional insights into age-related changes in driving-related skills. Future studies can incorporate this missing reference group to strengthen the comparative analyses and further validate the effectiveness of simple simulator exercises as assessment tools.
Furthermore, while driving performance is influenced by cognitive and attentional abilities, this study specifically focused on motor response times in a structured setting to create a simple and easily implementable assessment tool. Future research could incorporate standardized cognitive tests, such as the Mini-Mental State Examination (MMSE) or the Trail Making Test (TMT), to examine how attention and executive function impact reaction times. However, it is crucial that future assessments maintain ease of implementation so that they remain accessible for clinical and educational applications.

Author Contributions

Conceptualization, J.O.B.; methodology, J.O.B., C.J., L.M., B.S., T.J. and R.G.; software, K.M. and P.J.R.; validation, J.O.B.; formal analysis, J.O.B.; investigation, J.O.B.; resources, J.O.B., C.J. and R.G.; data curation, R.G., E.B.R. and R.P.; writing—original draft preparation, J.O.B., R.G., E.B.R. and R.P.; writing—review and editing, C.J. and P.J.R.; visualization, J.O.B.; project administration, J.O.B. All authors have read and agreed to the published version of the manuscript.

Funding

The authors would like to thank the Fullerton Foundation for their support of this project. This work was also partially supported by Clemson University’s Virtual Prototyping of Autonomy Enabled Ground Systems (VIPR-GS) under Cooperative Agreement W56HZV-21-2-0001 with the US Army DEVCOM Ground Vehicle Systems Center (GVSC).

Institutional Review Board Statement

This study was conducted in accordance with the Declaration of Helsinki and approved by the Institutional Review Board (or Ethics Committee) of Clemson University (IRB2015-354 approved on 9 November 2015).

Informed Consent Statement

Informed consent was obtained from all subjects involved in this study.

Data Availability Statement

Due to ethical reasons, the raw data used to support the findings of this study are not available on open access. However, supplemental material such as data subsets are available on reasonable request from the authors.

Acknowledgments

We thank Franziska Blum and Ashlyn Baron for their contributions to the data collection. We thank Senior Action and Dorman High School for allowing us to conduct the data collection at their facility. We are forever grateful to Joseph Neczek and Susie Touchinsky for their contributions to ensuring that the results of our study are relevant to the fields of kinesiotherapy, occupational therapy, and driving rehabilitation.

Conflicts of Interest

Ken Melnrick is employed by DriveSafety, Inc. Johnell Brooks and Casey Jenkins have disclosed intellectual property to Clemson University related to this study. Clemson University has joint intellectual property rights with DriveSafety, Inc. on the driving scenarios and driving simulator used in this study. The remaining authors declare that this research was conducted in the absence of any commercial or financial relationships that could be construed as a potential conflict of interest.

References

  1. NHTSA. Traffic Safety Facts 2023 a Compilation of Motor Vehicle Crash Data (Report No. DOT HS 813 473); NHTSA: Washington, DC, USA, 2023. [Google Scholar]
  2. Alderman, E.M.; Johnston, B.D.; Breuner, C.; Grubb, L.K.; Powers, M.; Upadhya, K.; Wallace, S.; Hoffman, B.D.; Quinlan, K.; Agran, P.; et al. The Teen Driver. Pediatrics 2018, 142, e20182163. [Google Scholar] [CrossRef] [PubMed]
  3. Hashmi, S. Adolescence: An Age of Storm and Stress. Rev. Arts Humanit. 2013, 2, 19–33. [Google Scholar]
  4. Kesselring, S. Corporate Mobilities Regimes. Mobility, Power and the Socio-Geographical Structurations of Mobile Work. Mobilities 2015, 10, 571–591. [Google Scholar] [CrossRef]
  5. Hossain, M.M.; Zhou, H.; Sun, X. A Clustering Regression Approach to Explore the Heterogeneous Effects of Risk Factors Associated with Teen Driver Crash Severity. Transp. Res. Rec. J. Transp. Res. Board. 2023, 2677, 1–21. [Google Scholar] [CrossRef]
  6. O’Neal, E.E.; Wendt, L.; Hamann, C.; Reyes, M.; Yang, J.; Peek-Asa, C. Rates and Predictors of Teen Driver Crash Culpability. J. Saf. Res. 2023, 86, 185–190. [Google Scholar] [CrossRef]
  7. Shope, J.T. Influences on Youthful Driving Behavior and Their Potential for Guiding Interventions to Reduce Crashes. Inj. Prev. 2006, 12, i9–i14. [Google Scholar] [CrossRef]
  8. Teen Driving. Available online: https://www.nhtsa.gov/road-safety/teen-driving (accessed on 2 December 2023).
  9. Traffic Safety Facts 2019 Data: Older Population. Available online: https://crashstats.nhtsa.dot.gov/Api/Public/ViewPublication/813121 (accessed on 2 April 2022).
  10. Classen, S.; Mason, J.; Hwangbo, S.W.; Wersal, J.; Rogers, J.; Sisiopiku, V. Older Drivers’ Experience with Automated Vehicle Technology. J. Transp. Health 2021, 22, 101107. [Google Scholar] [CrossRef]
  11. Karthaus, M.; Falkenstein, M. Functional Changes and Driving Performance in Older Drivers: Assessment and Interventions. Geriatrics 2016, 1, 12. [Google Scholar] [CrossRef]
  12. Miller, S.M.; Taylor-Piliae, R.E.; Insel, K.C. The Association of Physical Activity, Cognitive Processes and Automobile Driving Ability in Older Adults: A Review of the Literature. Geriatr. Nurs. 2016, 37, 313–320. [Google Scholar] [CrossRef]
  13. Safe Driving for Older Adults. Available online: https://www.nia.nih.gov/health/safety/safe-driving-older-adults (accessed on 2 December 2022).
  14. Centers for Disease Control and Prevention, National Center for Injury Prevention and Control. Available online: https://www.cdc.gov/injury/wisqars (accessed on 20 April 2022).
  15. Pomidor, A. Clinician’s Guide to Assessing and Counseling Older Drivers; Report No. DOT HS 812 228; National Highway Traffic Safety Administration: Washington, DC, USA, 2016. [Google Scholar]
  16. Dickerson, A.; Schold Davis, E.; Carr, D.B. Driving Decisions: Distinguishing Evaluations, Providers and Outcomes. Geriatrics 2018, 3, 25. [Google Scholar] [CrossRef]
  17. Lyman, J.M.; McGwin, G.; Sims, R. V Factors Related to Driving Difficulty and Habits in Older Drivers. Accid. Anal. Prev. 2001, 33, 413–421. [Google Scholar] [CrossRef] [PubMed]
  18. Brooks, J.; Kellett, J.; Seeanner, J.; Jenkins, C.; Buchanan, C.; Kinsman, A.; Kelly, D.; Pierce, S. Training the Motor Aspects of Pre-Driving Skills of Young Adults with and Without Autism Spectrum Disorder. J. Autism Dev. Disord. 2016, 46, 2408–2426. [Google Scholar] [CrossRef] [PubMed]
  19. Mims, L.; Brooks, J.; Gangadharaiah, R.; Jenkins, C.; Isley, D.; Melnrick, K. Evaluation of a Novel Emergency Braking Task on a Driving Simulator with Haptic Anti-Lock Braking System Feedback. Safety 2022, 8, 57. [Google Scholar] [CrossRef]
  20. Mazer, B.; Gélinas, I.; Duquette, J.; Vanier, M.; Rainville, C.; Chilingaryan, G. A Randomized Clinical Trial to Determine Effectiveness of Driving Simulator Retraining on the Driving Performance of Clients with Neurological Impairment. Br. J. Occup. Ther. 2015, 78, 369–376. [Google Scholar] [CrossRef]
  21. Meuleners, L.; Fraser, M. A Validation Study of Driving Errors Using a Driving Simulator. Transp. Res. Part. F Traffic Psychol. Behav. 2015, 29, 14–21. [Google Scholar] [CrossRef]
  22. Bouwkamp, D. Desktop and Development Simulators. Available online: https://www.faac.com/realtime-technologies/products/rds-100-desktop-driving-simulator/ (accessed on 4 February 2025).
  23. Motion Rigs for All. Available online: https://dofreality.com/?srsltid=AfmBOory_3-xizxEGo8HBOL3PFAF9XQcfxTTIUrA7IiyoDI3XiPlhZC7#: (accessed on 4 February 2025).
  24. VRX Car Racing Simulators. Available online: https://www.sportsentertainmentspecialists.com/sports/car-racing-simulator#: (accessed on 4 February 2025).
  25. Riegler, A.; Riener, A.; Holzmann, C. A Systematic Review of Virtual Reality Applications for Automated Driving: 2009–2020. Front. Hum. Dyn. 2021, 3, 689856. [Google Scholar] [CrossRef]
  26. Silvera, G.; Biswas, A.; Admoni, H. DReye VR: Democratizing Virtual Reality Driving Simulation for Behavioural & Interaction Research. In Proceedings of the 2022 17th ACM/IEEE International Conference on Human-Robot Interaction (HRI), Sapporo, Japan, 7–10 March 2022; IEEE: Piscataway, NJ, USA, 2022; pp. 639–643. [Google Scholar]
  27. Driving Simulation Technology. Available online: https://stisimdrive.com/ (accessed on 4 February 2025).
  28. DriveSafety. Available online: https://drivesafety.com/research-driving-simulators/ (accessed on 28 November 2023).
  29. Virage Simulation Driving Simulators—Build to Last. Available online: https://viragesimulation.com/ (accessed on 4 February 2025).
  30. Brooks, J.O.; Goodenough, R.R.; Crisler, M.C.; Klein, N.D.; Alley, R.L.; Koon, B.L.; Logan, W.C.; Ogle, J.H.; Tyrrell, R.A.; Wills, R.F. Simulator Sickness during Driving Simulation Studies. Accid. Anal. Prev. 2010, 42, 788–796. [Google Scholar] [CrossRef]
  31. de Winkel, K.N.; Talsma, T.M.W.; Happee, R. A Meta-Analysis of Simulator Sickness as a Function of Simulator Fidelity. Exp. Brain Res. 2022, 240, 3089–3105. [Google Scholar] [CrossRef]
  32. Gangadharaiah, R.; Brooks, J.O.; Mims, L.; Rosopa, P.J.; Dempsey, M.; Cooper, R.; Isley, D. Exploring the Benefits of a Simulator-Based Emergency Braking Exercise with Novice Teen Drivers. Safety 2024, 10, 14. [Google Scholar] [CrossRef]
  33. Turkington, P.M. Relationship between Obstructive Sleep Apnoea, Driving Simulator Performance, and Risk of Road Traffic Accidents. Thorax 2001, 56, 800–805. [Google Scholar] [CrossRef]
  34. Ekelman, B.; Stav, W.; Baker, P.; O’Dell-Rossi, P.; Mitchell, S. Community Mobility. In Functional Performance in Older Adults, 3rd ed.; F.A. Davis: Philadelphia, PA, USA, 2009; pp. 332–385. [Google Scholar]
  35. Dickerson, A.E.; Molnar, L.J.; Bédard, M.; Eby, D.W.; Berg-Weger, M.; Choi, M.; Grigg, J.; Horowitz, A.; Meuser, T.; Myers, A.; et al. Transportation and Aging: An Updated Research Agenda to Advance Safe Mobility among Older Adults Transitioning from Driving to Non-Driving. Gerontologist 2019, 59, 215–221. [Google Scholar] [CrossRef] [PubMed]
  36. Krasniuk, S.; Classen, S.; Morrow, S.A. Driving Errors That Predict Simulated Rear-End Collisions in Drivers with Multiple Sclerosis. Traffic Inj. Prev. 2021, 22, 212–217. [Google Scholar] [CrossRef] [PubMed]
  37. Golisz, K. Occupational Therapy Interventions to Improve Driving Performance in Older Adults: A Systematic Review. Am. J. Occup. Ther. 2014, 68, 662–669. [Google Scholar] [CrossRef] [PubMed]
  38. Ball, K.K.; Beard, B.L.; Roenker, D.L.; Miller, R.L.; Griggs, D.S. Age and Visual Search: Expanding the Useful Field of View. J. Opt. Soc. Am. A 1988, 5, 2210–2219. [Google Scholar] [CrossRef] [PubMed]
  39. Gaspar, J.G.; Ward, N.; Neider, M.B.; Crowell, J.; Carbonari, R.; Kaczmarski, H.; Ringer, R.V.; Johnson, A.P.; Kramer, A.F.; Loschky, L.C. Measuring the Useful Field of View During Simulated Driving with Gaze-Contingent Displays. Hum. Factors J. Hum. Factors Ergon. Soc. 2016, 58, 630–641. [Google Scholar] [CrossRef]
  40. Alonso, F.; Faus, M.; Riera, J.V.; Fernandez-Marin, M.; Useche, S.A. Effectiveness of Driving Simulators for Drivers’ Training: A Systematic Review. Appl. Sci. 2023, 13, 5266. [Google Scholar] [CrossRef]
  41. Brooks, J.O.; Gangadharaiah, R.; Rosopa, E.B.; Pool, R.; Jenkins, C.; Rosopa, P.J.; Mims, L.; Schwambach, B.; Melnrick, K. Using the Functional Object Detection—Advanced Driving Simulator Scenario to Examine Task Combinations and Age-Based Performance Differences: A Case Study. Appl. Sci. 2024, 14, 11892. [Google Scholar] [CrossRef]
  42. R Core Team. R: A Language and Environment for Statistical Computing. Available online: https://www.r-project.org/ (accessed on 11 February 2022).
  43. LeBreton, J.M.; Senter, J.L. Answers to 20 Questions About Interrater Reliability and Interrater Agreement. Organ. Res. Methods 2008, 11, 815–852. [Google Scholar] [CrossRef]
  44. McGraw, K.O.; Wong, S.P. Forming Inferences about Some Intraclass Correlation Coefficients. Psychol. Methods 1996, 1, 30. [Google Scholar] [CrossRef]
  45. Snijders, T.A.B.; Bosker, R.J. Multilevel Analysis: An Introduction to Basic and Advanced Multilevel Modeling; Sage: Thousand Oaks, CA, USA, 2011; ISBN 144625433X. [Google Scholar]
  46. Pinheiro, J.; Bates, D. Mixed-Effects Models in S and S-PLUS; Springer: New York, NY, USA, 2000; ISBN 0-387-98957-9. [Google Scholar]
  47. Rosopa, P.J.; King, B.M. Analysis of Variance: Univariate and Multivariate Approaches. In International Encyclopedia of Education; Tierney, R., Rizvi, F., Ercikan, K., Smith, G., Eds.; Elsevier: Amsterdam, The Netherlands, 2023; pp. 529–535. [Google Scholar]
  48. Fox, J. Applied Regression Analysis and Generalized Linear Models, 3rd ed.; Sage: Thousand Oaks, CA, USA, 2016. [Google Scholar]
  49. Tuokko, H.A.; Rhodes, R.E.; Dean, R. Health Conditions, Health Symptoms and Driving Difficulties in Older Adults. Age Ageing 2007, 36, 389–394. [Google Scholar] [CrossRef]
Figure 1. Flow of the study.
Safety 11 00021 g001
Figure 2. DriveSafety CDS-200 simulator.
Safety 11 00021 g002
Figure 3. (A) Reaction Timer Steering©: Participants responded to the arrow by turning the steering wheel in the direction of the arrow as quickly as possible; (B) Reaction Timer Stoplight©: Participants depressed the gas pedal until the green light was illuminated, then responded to the red light by pressing the brake pedal as quickly as possible; (C) Stoplight and Steering©: Participants responded to the illuminated symbol, either the red light, green light, left arrow or right arrow.
Safety 11 00021 g003
Figure 4. Two-way interaction between the age group and trial number for Reaction Timer Steering©.
Safety 11 00021 g004
Figure 5. The main effect of the trial number on the reaction time for Reaction Timer Stoplight©.
Safety 11 00021 g005
Table 1. Dependent variables for each interactive exercise.
Interactive ExerciseDependent Variables
Reaction Timer Steering
-
Reaction time (seconds) for all 16 trials;
-
Average reaction time (seconds) for Practice, Test 1, Test 2, and Test 3, each with 4 trials.
Reaction Timer Stoplight
-
Reaction time (seconds) for all 16 trials;
-
Average reaction time (seconds) for Practice, Test 1, Test 2, and Test 3, each with 4 trials.
Stoplight and Steering
-
Total number of errors;
-
Overall performance (percent) 1;
-
Total task time (seconds);
-
Average reaction time (seconds);
-
Standard deviation of reaction time (seconds).
1 For the Stoplight and Steering exercise, the total number of errors and the overall performance variables measure the same construct. Overall performance is considered solely because participants often ask about their percentage of correct responses. In this paper, only the results for the total number of errors will be reported to minimize redundancy.
Table 2. Multilevel model using age group and trial number as predictors of reaction times on the Reaction Timer Steering and Reaction Timer Stoplight interactive exercises.
BSEtp
Reaction Timer Steering
     Age group−0.2260.051−4.399<0.001 ***
     Trial number−0.0130.002−5.278<0.001 ***
     Age group × Trial number0.0100.0042.2710.024 *
Reaction Timer Stoplight
     Age group−0.0270.063−0.4360.664
     Trial number−0.0580.011−5.369< 0.001 ***
Note: Abbreviations: B, slope; SE, standard error; t, estimated t-statistic. * p < 0.05, *** p < 0.001.
Table 3. Summary of dependent variables using descriptive plots and t-test statistical analysis. The error bars indicate the standard error of the mean.
Dependent Variablest-Test Results and Summary
Total number of errorsSafety 11 00021 i001
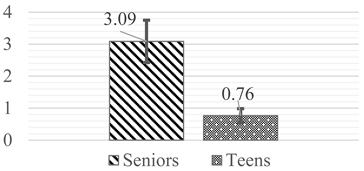
There is a significant difference (t(49) = 2.439, p = 0.018) in the total number of errors made between the seniors and the teens. On average, the teens made 2.33 fewer errors than the seniors.
Total task time (s)Safety 11 00021 i002
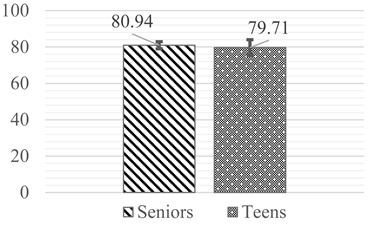
There is no significant difference between the teens and seniors in the total task duration.
Average reaction time (s)Safety 11 00021 i003There is no significant difference between the average reaction time for teens and seniors.
Standard deviation (SD) of
reaction time (s)
Safety 11 00021 i004There is a significant difference (t(49) = 3.010, p = 0.004) in the standard deviation of the reaction time between the seniors and teens. The seniors’ standard deviation of their reaction time had 0.06 more variability than the teens.
Disclaimer/Publisher’s Note: The statements, opinions and data contained in all publications are solely those of the individual author(s) and contributor(s) and not of MDPI and/or the editor(s). MDPI and/or the editor(s) disclaim responsibility for any injury to people or property resulting from any ideas, methods, instructions or products referred to in the content.

