Abstract
Research was conducted involving a series of lateral impact tests on a horizontal sled facility by scientists at the Air Force Research Laboratory (AFRL). The purpose of the research was to conduct an assessment of the biodynamic response of an anthropomorphic test device (ATD) to support the development of AFRL neck injury criteria. Impacts were completed using a 50th male Hybrid III aerospace ATD due to this ATD being used by the USAF to qualify and evaluate ejection systems. A test matrix was developed to assess ATD response as a function of various seat configurations which were an approximation of the seat configurations used by the Medical College of Wisconsin (MCW) for previously conducted lateral impact tests of PMHS subjects (post-mortem human subjects). The specially fabricated seat configurations were a rigid seat fixture with a 5-point harness and a padded rigid seat with a 3-point harness. The input acceleration pulses were trapezoidal in shape and varied in peak magnitude from 8.5 to 17 G. The rigid and padded seat configurations both generated fairly linear ATD responses across the input acceleration range. The ATD’s response with the padded seat and the 3-point restraint was greater than the ATD’s response with the rigid seat and the 5-point restraint with the upper neck. The My torque showed the greatest increase from the rigid seat configuration to the padded seat configuration. This highlights the importance of a proper restraint and the importance of controlling the motion of the torso since it could reduce the loads and torques of the unrestrained head and neck, resulting in a lower probability of injury. The lateral impact program with the ATD provided critical impact data to fill data gaps that support the development of the ATD-to-human transfer functions for AFRL’s Multi-Axial Neck Injury Criteria (MANIC) for lateral impact or MANICy calculation. The program also highlighted gaps in human and PMHS head response data in identical lateral impact configurations that would not only improve the current MANICy transfer function but would allow the investigation of the efficacy of using the 6F-MANICy to replace the current MANICy.
1. Introduction
In the early design of escape systems and other pilot safety-related technology, emphasis was placed on reducing the acceleration imparted to the spine of the pilot during the catapult phase of ejection in order to reduce the probability of vertebral fracture. This was accomplished through the development of injury criteria known as the Dynamic Response Index or DRI [1,2]. The risk of spinal injury calculated using the DRI is based on describing the biodynamic response of the human torso in terms of the displacement of the mass of a simple lumped-parameter mass-spring-damper mechanical system. The system can be represented by a second order differential equation, which can be used to calculate the magnitude of deflection in the human spinal column. The maximum value of the deflection relates the tolerance of the human spine to an impact acceleration pulse. Typically, the DRI was restricted to a maximum value of 18, which equated to a probability of spinal injury of 5% or less. With the continual push for helmet-mounted technologies since the late 1980s, some of which can add up to 50% more mass to the pilot’s head, it became necessary to develop some form of a neck injury criterion to limit the risk of neck injury during all phases of ejection (catapult, windblast, and seat/man separation).
In 1993, AFRL developed an Interim Neck Injury Criteria which limited the total head supported weight and the resultant head/helmet center of gravity relative to the head’s anatomical axis origin. This was developed using a combination of data from literature reviews and data collected during an extensive series of vertical impacts at AFRL with instrumented human subjects and a special helmet that was designed to allow varying weight and center-of-gravity configurations. The AFRL biodynamics research conducted in the 1990s and early 2000s focused on studies performed with human subjects in accelerative environments, which repeatedly demonstrated significant increases in neck loads when the subjects were wearing a helmet-mounted display (HMD) when compared to no HMD [3,4,5,6]. Research on heavy helmet systems with an off-axis center of gravity (CG) produced increased neck loading which, in an ejection environment, could lead to injuries that could range from low severity strains and muscle tears to high-severity cervical spine fractures and ligament ruptures [3,7,8].
In addition to the laboratory testing, dynamic loading of the cervical spine observed by AFRL in ATD necks during simulated pilot ejections, parachute deployment, and other scenarios conducted in the late 1990s, indicated very large values of tensile load as referenced to current criteria in the literature. These tests indicated tensile loading rates from 5000 to 10,000 lb per second, with peak loads in excess of 300 lb for the ADAM (Hybrid III) neck. Despite the potential for serious and even fatal injuries due to dynamic tensile loading of the cervical spine, there has been limited research on the failure limits of the human neck under these conditions. As a result, in 2000, AFRL developed preliminary tensile neck injury criteria that related a measured tensile neck load to the probability of a serious injury using a logistic curve [9]. The AFRL curve was based on human volunteer impact test data and Post Mortem Human Subject (PMHS) data properly scaled for age, body size, and tissue type (PMHS vs. live human subject). Moreover, at that time, the currently accepted neck injury risk criteria were the Mertz Criteria for automotive ATDs used by the Society of Automotive Engineers (SAE), and the Nij Neck Injury Risk Criteria developed by the National Highway Transportation and Safety Administration (NHTSA) [10,11]. These criteria have limitations. The Mertz criteria were based on a load duration function related to a single probability of injury or a “pass/fail criteria.” The Nij criterion combined only axial neck loading and flexion and extension measurements and was developed primarily as a risk factor for automotive airbag deployments. As a result of these limitations, AFRL initiated a multi-faceted program in 2001 to provide criteria to design safe and comfortable crew protection systems for the head and neck. The program addressed multi-axial neck loading in terms of tensile loads, compressive loads, shear loads, and neck torques associated with head yaw, pitch, and roll. A primary goal was to develop a series of probability of risk curves to address these different loading modes using non-failure human impact response data and PMHS test data from impacts conducted on specimens until their failure (ligamentous rupture or bony failure).
In order to make sense of the multi-axial response of the neck in a dynamic environment, AFRL initiated a proposed injury risk indicator similar to the Nij used by the NHTSA but involved all the modes of response, and not just the axial loading and torques resulting from pitching motion of the head. The new AFRL neck injury risk indicator was called the Neck Multi-axial Dynamic Response Criteria or NMDRC and would combine all the modes of neck loading recorded or calculated relative to the head/neck junction (occipital condyles).
The numerator terms in Equation (1) are defined as follows: Fx = observed x direction shear loading, Fy = observed y direction shear loading, Fz = observed axial loading (+Fz = tension, −Fz = compression), Mx = observed moment about the anatomical x-axis (lateral flexion), My = observed moment about the anatomical y-axis (sagittal plane anterior/posterior bending, +My = flexion, −My = extension), and Mz = observed moment about the anatomical z-axis (neck twisting or chin-to-shoulder rotation). The corresponding denominator terms are the critical values for each term. The critical response values below each measured force and torque are taken from the probability risk curves for individual loading methods that were being developed using non-failure and PMHS failure data. Acceptable values of the NMDRC indicator would be determined through calculation of values using non-injury multi-axial neck loads resulting from human volunteer impact tests and from injurious multi-axial neck loads resulting from whole PMHS or PMHS head-neck-torso segment impact tests. Calculation of the failure and non-failure NMDRC indicator values would result in a probability of injury function relating probability of injury to the NMDRC indicator similarly to the DRI value for the lower spine.
More recently, the new Joint Strike Fighter (JSF) F-35 aircraft is employing a Martin-Baker Mk-US16E ejection seat which is required to accommodate the full range of aircrew (103–245 lb). However, preliminary rocket sled qualification tests of this seat have shown that the neck forces and head rotations as measured in instrumented ATDs may be unacceptably high for small human occupants. As a result, AFRL and AFIT initiated a collaboration in 2013 to re-energize the development of new criteria with a primary goal to develop an acceptable method to improve aviation-specific neck injury criteria for aircraft ejection, as well as applicable metrics for the criteria. The initial efforts by AFRL and AFIT [12,13,14,15] laid the groundwork for the new USAF neck injury criteria identified as AFRL Multi-Axial Neck Injury Criteria or MANIC, which became the new terminology for the NMDRC. The current MANIC neck injury risk function was developed using a standard probability of injury or risk curve process [16]. The risk curve is a plot of an injury metric (fracture load for example, or in this case, calculated MANIC value) versus the probability of injury. Injury metric data is composed of human and PMHS data where the PMHS data points typically represent failure points or 100% probability of injury, and live human subject data represent non-injury points or 0% probability of injury.
The USAF uses instrumented ATDs to collect injury metrics during escape system and component qualification testing. Neck loads and torques are collected during rocket sled testing of ejection seats with instrumented ATDs and used to calculate various injury metrics such as MANIC in order to understand what the risk of injury to a pilot would be. The MANIC neck injury risk curve is composed of human subject data (live and PMHS) and instrumented ATDS are used to collect the data to evaluate the lumbar, head, and neck injury risks associated with a specific escape system. AFRL researchers determined that the development of transfer functions to relate calculated manikin injury risk to predicted human injury risk for neck loading was required for accurate injury prediction for pilots. Transfer functions would provide a way to address non-fidelic responses between human pilots and ATDs resulting from the loading conditions during ejection. In addition, transfer functions would allow the determination of the probability of injury to a pilot in the escape system using the risk curves based on human response data when an instrumented ATD is used in escape system qualification testing.
In collaboration with AFIT, existing human, PMHS, and ATD response data were identified and examined to ensure a sufficient quantity of matched test conditions between the three existed over varying accelerative loading amplitudes and directions. During this effort, several gaps in the data available for constructing MANIC were identified. One of the gaps identified was for additional ATD lateral impact data (Gy) for the lateral impact portion of the criteria termed MANICy. Specifically, ATD response data were needed at lateral loading conditions that were a match to Human and PMHS lateral loading conditions previously conducted by AFRL and/or collaborators. Once all the lateral (Gy) test conditions were identified, where only PMHS and human data existed and no ATD data existed, AFRL researchers worked to develop a lateral impact program with velocity, impact level, seat, harness, and ATD configurations that closely matched that of the previous human and PMHS lateral impact test configurations. This was completed to ensure that neck loads and torques measured during the ATD impact tests would be from similar test conditions.
A total of 18 impact tests were conducted for the lateral impact program and the analysis of the data, as it pertains to this article, focused on head accelerations and neck loads and moments recorded during the impact. This data was used in conjunction with previously collected human and Post Mortem Human Subject (PMHS) lateral impact data to establish a preliminary ATD-to-human transfer function for MANICy. This transfer function was generated to account for specific load and moment difference between human and ATD neck responses during specific lateral impact loading.
2. Materials and Methods
2.1. Test Facility and Equipment
2.1.1. Horizontal Impulse Accelerator (HIA)
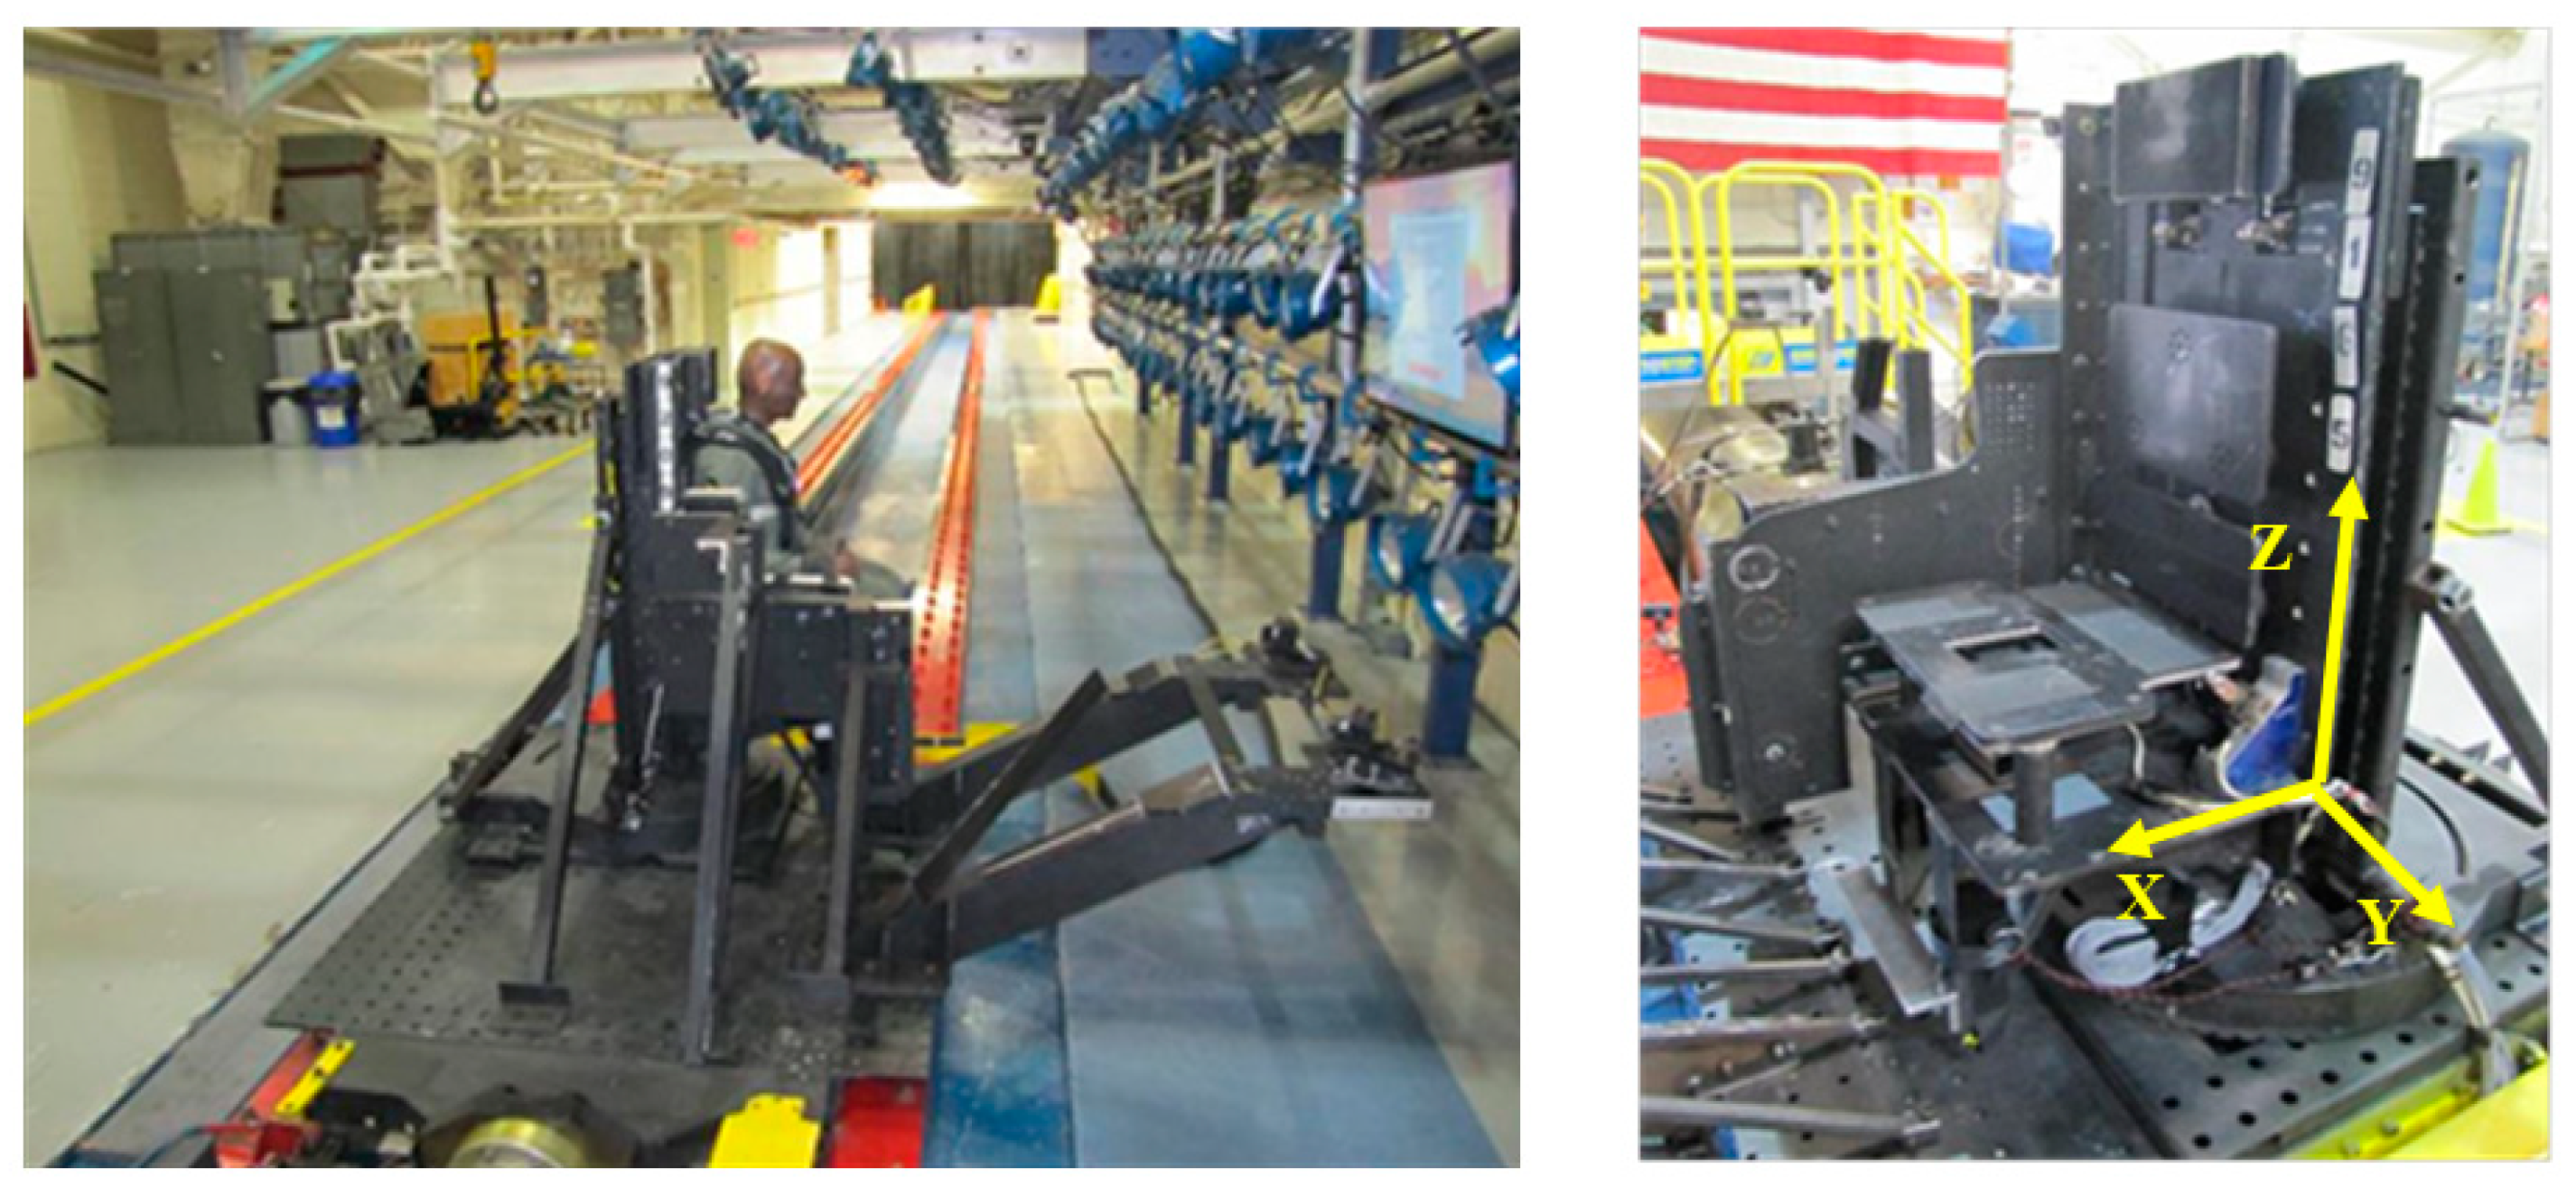
A Horizontal Impulse Accelerator or HIA [17,18] was used to conduct the lateral impact tests to evaluate ATD acceleration response and ATD neck and spine loading during the various acceleration exposures. The ATD was restrained in a rigid 90-90-90 seat with lateral support plates that were developed for high-energy impact testing. The HIA, shown in Figure 1, consists of a thrust piston, a test sled, and track rails. The 4 × 8 ft sled is positioned on 160 ft of twin-rail track and the sled was accelerated from a stationary position by the thrust piston housed in a pneumatic actuator. The HIA actuator operates on the principle of differential gas pressures acting on both surfaces of the thrust piston in the actuator (24-inch diameter cylinder). The impact acceleration occurs at the beginning of the experiment as stored high-pressure air is allowed to impinge on the back-side surface of the thrust piston inside the actuator. The thrust piston is held in place inside the actuator by a lock-yoke. At t = 0 sec following a count-down, the lock-yoke is released, causing the high-pressure air to move the thrust piston and accelerate the sled down the track. As the sled breaks contact with the thrust piston, the sled coasts to a stop due to friction between the sled and the track or is stopped with a pneumatic brake system mounted beneath the sled. The acceleration pulse imparted to the sled depends on the pressure differential within the actuator (set pressure and load pressure), the volumes of the pressure chambers within the actuator (set length and load length), and the shape of the metering pin.
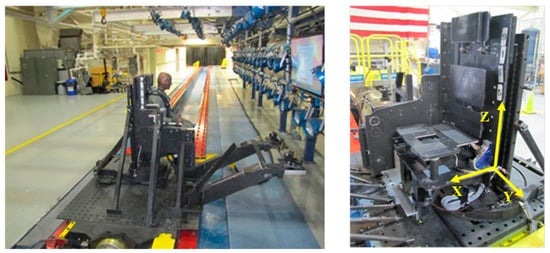
Figure 1.
Air Force Research Laboratory (AFRL) horizontal sled facility and lateral impact seat fixture. The horizontal sled is on the left with a view down the track showing the seat configured for a lateral impact with the 50th ATD, and also showing the three rigid bars supporting the seat’s side-support plate. The 90-90 rigid seat is on the right showing the head-rest and seat-back plates, seat-pan plate, foot-support bar, side-support plate, and the coordinate system used for the electronic sensor data presented in this article.
2.1.2. HIA Facility Set-Up
A specially designed test fixture to hold the rigid test seat was mounted to the HIA multi-axial test buck mounted to the top of the HIA sled. The test buck allows any seat to be positioned at multiple angles in both yaw (0° to 180°) and pitch (0° to 90°) relative to the thrust piston at the front of the sled. The test buck pitch was set at 0° such that the seat was in a pure vertical or upright orientation, and the test buck yaw was set at 90° relative to the thrust piston such that the test seat was lateral to the thrust piston at the front of the sled, and facing the light rack and the sled-mounted cameras. The facility coordinate system for the test configuration for this program was defined with respect to the plane of the seatback of the seat fixture mounted on the test buck; therefore, the coordinate system moved with respect to the test buck as the seat is positioned in yaw or pitch. Positive Z-axis was vertical upward along the plane of the seat back away from the head of the ATD. Positive X-axis was forward away from the chest of the ATD. Positive Y-axis was to the left away from Z-axis and X-axis plane. The facility coordinate system is shown in Figure 1.
The test program used a specially designed 90-90 rigid seat fixture (angle between seat back plane and seat pan plane is 90°, and angle between seat pan plane and lower leg/foot support is 90°). The seat back was composed of three rigid plates (including the headrest plate) that could be adjusted up or down in the vertical plane. Each seat back plate also provided an adjustable position in the horizontal plane using a stackable puck system. The seat pan was a single plate with a center access to allow for termination of a center crotch strap while using a 5-point restraint configuration. The seat pan provided adjustable positioning in the vertical plane using a stackable puck system or rigid structures of variable length. The lower leg support provided a single foot support bar that could be positioned up or down in the vertical plane. The rigid seat fixture is shown in Figure 1. A rigid plate was positioned on the right side of the seat fixture (towards the HIA piston) to provide lateral support for the ATD during impact. The back side of the rigid plate was supported by three separate beam structures attached to the top of the HIA sled to prevent translational motion of the rigid lateral plate and the rigid seat structure during the lateral impacts. This set-up is also shown in Figure 1.
2.1.3. Seat Fixture Configurations
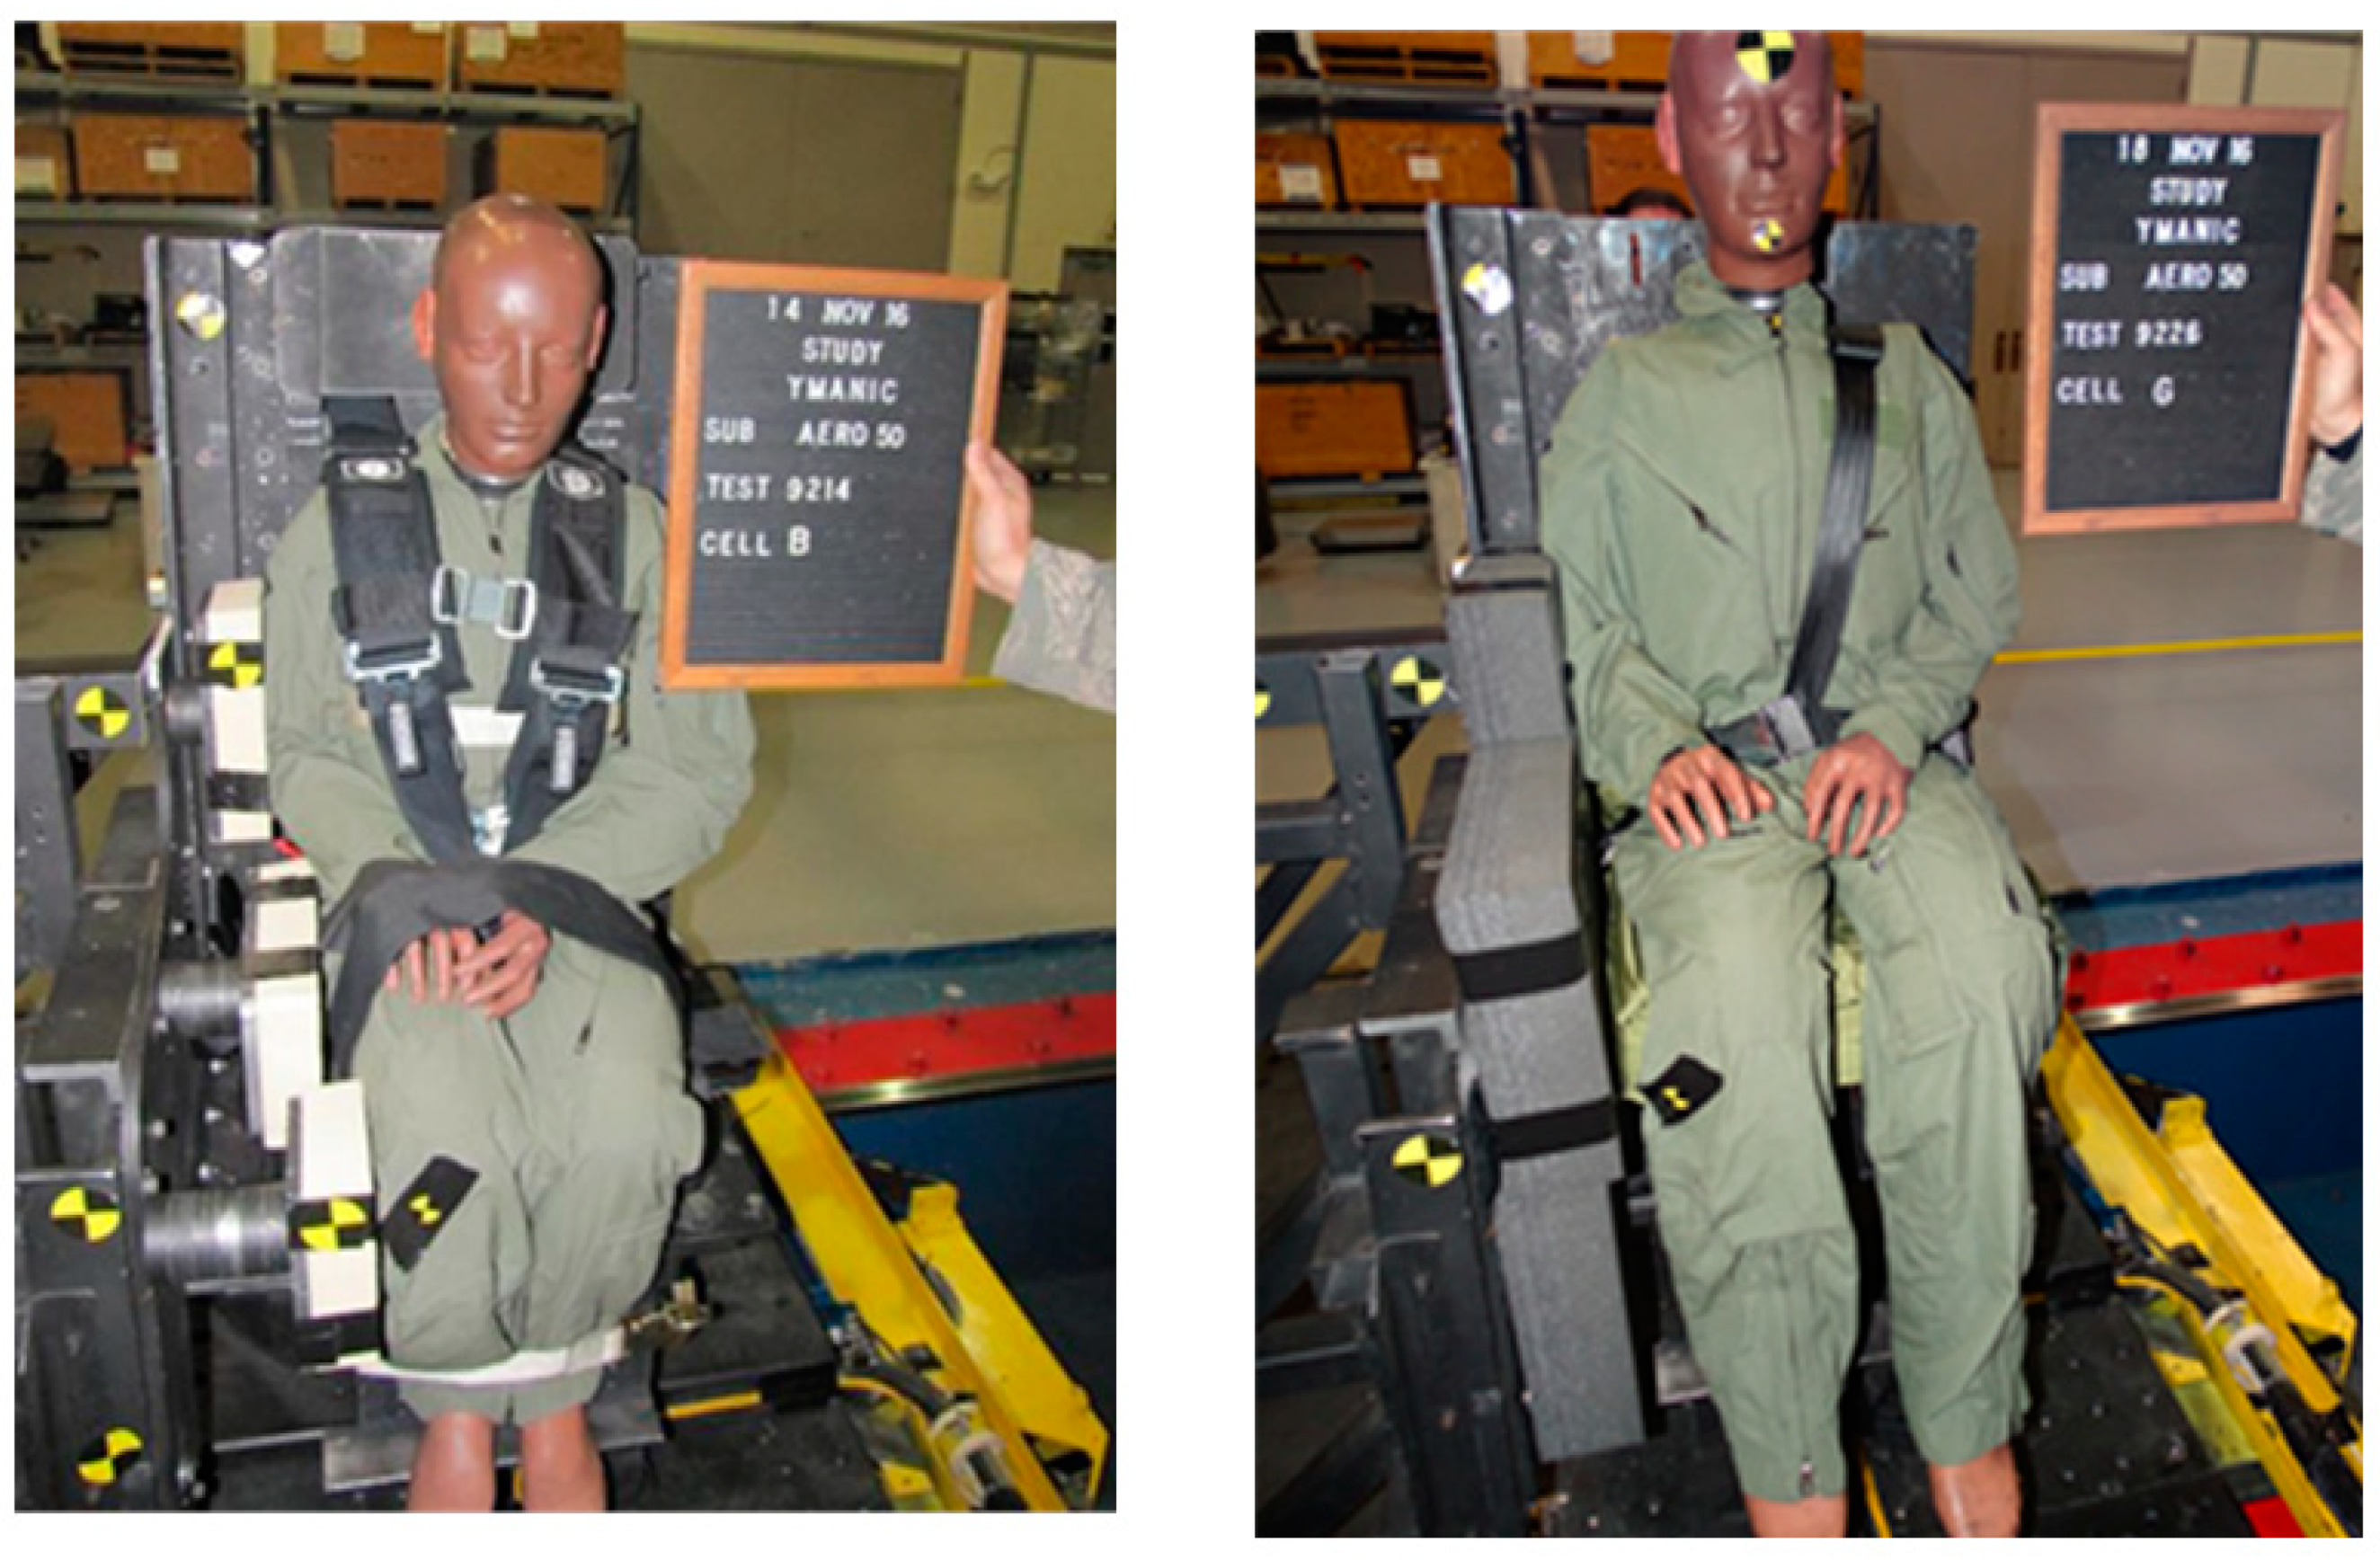
The test seat fixture was set-up in two different configurations for this test program based on previous seat configurations used at Medical College of Wisconsin (MCW) [19]. The first configuration was defined as the “Rigid Seat” configuration and consisted of the seat back, seat pan, rigid lateral plate, and very high-density felt placed on the plate. The high-density felt was 2.0 inch thick, 32S1 felt from Bacon Felt Company in Rochester, NH (32 lb density was defined by Bacon Felt as the density for a 3 × 3 sq ft. sample at 1.0 inch thickness) and were positioned on supplemental lateral plates at the following locations: knee, upper leg, hip, and upper arm. The four supplemental lateral plates were attached to the primary rigid lateral plate and were adjusted in the Y-axis to allow the felt to contact the ATD at the defined points when the ATD was restrained in the seat fixture. The rigid white felt was used to prevent damage to the ATD during the high-energy impacts and is shown in Figure 2 (note: unable to see hip location). The second seat configuration was defined as the “Padded Seat” configuration and consisted of the seat back with a 2.5 inch thick pad, the seat pan with a 5 inch thick seat cushion, and the rigid lateral plate with a very low density foam pad cut to fit the approximate shape of the lateral side plate. The very low-density foam pad was approximately 4 inch thick and its purpose was to provide as much contact area as possible on the ATD from ankle up to the shoulder area, similarly to the corresponding MCW seat. The cushions and gray foam padding are also shown in Figure 2.
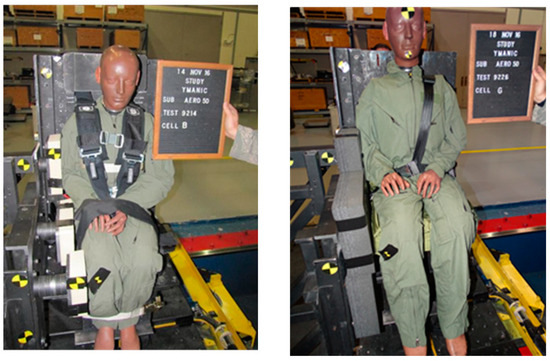
Figure 2.
Padding and restraint systems used with the impact seat. The “rigid seat” configuration is on the left, showing the high-density felt on the side-impact plate, and the ATD in a 5-point restraint. The “padded seat” configuration is on the right showing the soft foam on the side-impact plate, and the ATD sitting on the 5-inch-thick seat cushion and with a 3-point restraint.
The test ATD was restrained using a different restraint configuration based on the seat configuration. The “Rigid Seat” configuration used a 5-point restraint harness manufactured by Pro Armor (Corona, CA, USA) with each 3-inch webbing strap having its own adjustor, and with each strap terminating at rigidly mounted load cells on the seat structure. In addition to the restraint, the ATD’s upper torso and lower legs were also restrained by cargo straps and the arms were restrained to the upper legs using an industrial Velcro strap. The “Padded Seat” configuration used a 3-point restraint harness which consisted of standard automotive 2 inch webbing straps with the shoulder strap positioned over the shoulder of the ATD that was opposite or away from the point of impact on the sled (ATD’s left shoulder for this study). The 3-point restraint also had each strap terminating at rigidly mounted load cells on the seat structure. The “Padded Seat” configuration did not use additional cargo or Velcro straps. The “Rigid Seat” and the “Padded Seat” restraint configurations are also shown in Figure 2.
For all the tests, the seat pan was adjusted such that the shoulder straps were parallel to the horizontal (or close to parallel) and the ATD’s head was approximately centered in the headrest. After, all the restraint straps were adjusted to remove excess slack, the facility technician tightened the lap belts and shoulder belts securely with pre-tension levels of 20 ± 5 lb measured by the restraint load cells attached to the seat fixture at the termination points for the right and left lap belts and right and left shoulder belts.
2.1.4. ATD and Flight Equipment
All the tests were conducted with an instrumented 50th Hybrid III aerospace ATD. The ATD was dressed in a standard USAF flight suit and did not wear flight boots. The instrumented ATD had an approximate test weight of 161 lb. A few tests were also conducted with the ATD wearing an HGU-55/P flight helmet with an MBU-20/P oxygen mask, which increased the weight to 164 lb.
2.2. Instrumentation and Data Collection
Transducers were chosen to provide the optimum resolution over the expected test acceleration ranges. Full-scale data ranges were selected to provide the expected full-scale range plus 50% to assure the capture of peak signals. All transducer bridges were balanced for optimum output prior to the start of the program. The appropriate accelerometers were adjusted with software for the effect of gravity by adding the component of a 1 G vector in-line with the force of gravity along the accelerometer axis (z-axis or combined z-axis/x-axis depending on seat back angle). The linear accelerometers were wired to provide a positive output voltage when the acceleration experienced by the sensor was applied in the +x, +y and +z directions. The ATD coordinate system used was the standard AFRL impact facility system with positive z-axis acceleration up. The critical parameters were measured as follows: neck tension load was measured as positive, neck compression load was measured as negative, flexion (head rotation forward) was measured as positive, extension (head rotation rearward) was measured as negative, and lateral flexion to the right (ear to shoulder) was measured as positive.
2.2.1. Facility Instrumentation
The HIA sled was instrumented with a tri-axial linear accelerometer package mounted on the bottom of the sled deck. The tri-axial accelerometer package consisted of three Measurement Specialties (MEAS SPEC) EGCS-S425-250 accelerometers. A tri-axial accelerometer package was also mounted on the seat pan close to the seat reference point and consisted of three Entran Model EGV3-F-250 accelerometers. The restraint configuration was instrumented with five specially designed three-axis load cells (Michigan Scientific [Charlevoix, MI, USA]; Model TR3D-B-3K) mounted at the termination points of the shoulder straps and the lap belts and at the termination point of the crotch strap.
2.2.2. ATD Instrumentation
The ATD was instrumented with tri-axial accelerometer packages located in the head, chest, and pelvis, a tri-axial angular rate sensor in the head, a single axis angular accelerometer in the chest. The ATD’s upper neck, lower neck, and lumbar spine/pelvis junction were all instrumented with a single Denton 6-axis load cell (3 orthogonal linear forces, 3 orthogonal moments). The critical accelerations for this effort were the head z-axis acceleration, head x-axis acceleration, and the head angular rates (Rx, Ry, and Rz). The critical bending moment for this effort was the bending moment that measured lateral flexion of the head on the neck (Mx) and the bending moment that measured flexion and extension of the head on the neck (My).
2.2.3. Data Acquisition
This research program used two Test Data Analysis System (TDAS) G5 Data Acquisition Systems (DAS) manufactured by Diversified Technical Systems, Inc. (Seal Beach, CA, USA) to collect all the sled, seat fixture and ATD data for each test. Each TDAS G5 was a 32 channel DAS and was mounted on-board the HIA at the back of the sled. Transducer signals were amplified, filtered, digitized and recorded in on-board solid-state memory. The data acquisition system was controlled through an Ethernet interface that was run through a whip-cable that interfaced the TDAS on the sled to the HIA facility control room. A desktop Personal Computer (PC) in the control room was used to configure the TDAS G5 before testing and retrieved the data after each test. For this program, the TDAS units collected data at a 1 K sample rate and filtered at 120 Hz.
Two Phantom Miro-3 high-speed digital cameras (Vision Research, Inc., Wayne, NJ, USA) were used to collect video of each test. Two cameras were mounted on-board the HIA sled in a test fixture relative to the frontal plane of the ATD (in-line with, and at an oblique angle relative to the x-axis of the ATD) to record the ATD motion (camera locations are visible in Figure 1). The Phantom Micro line is a compact, light-weight, rugged family of cameras targeted at industrial applications ranging from biometric research to automotive crash testing. The images for this study were collected at 500 fps. The video files were downloaded and converted to either a MP4 or AVI format and stored in the Collaborative Biomechanics Data Bank (CBDN) located on a specialized server at WPAFB.
2.3. Experimental Design
2.3.1. Test Matrix
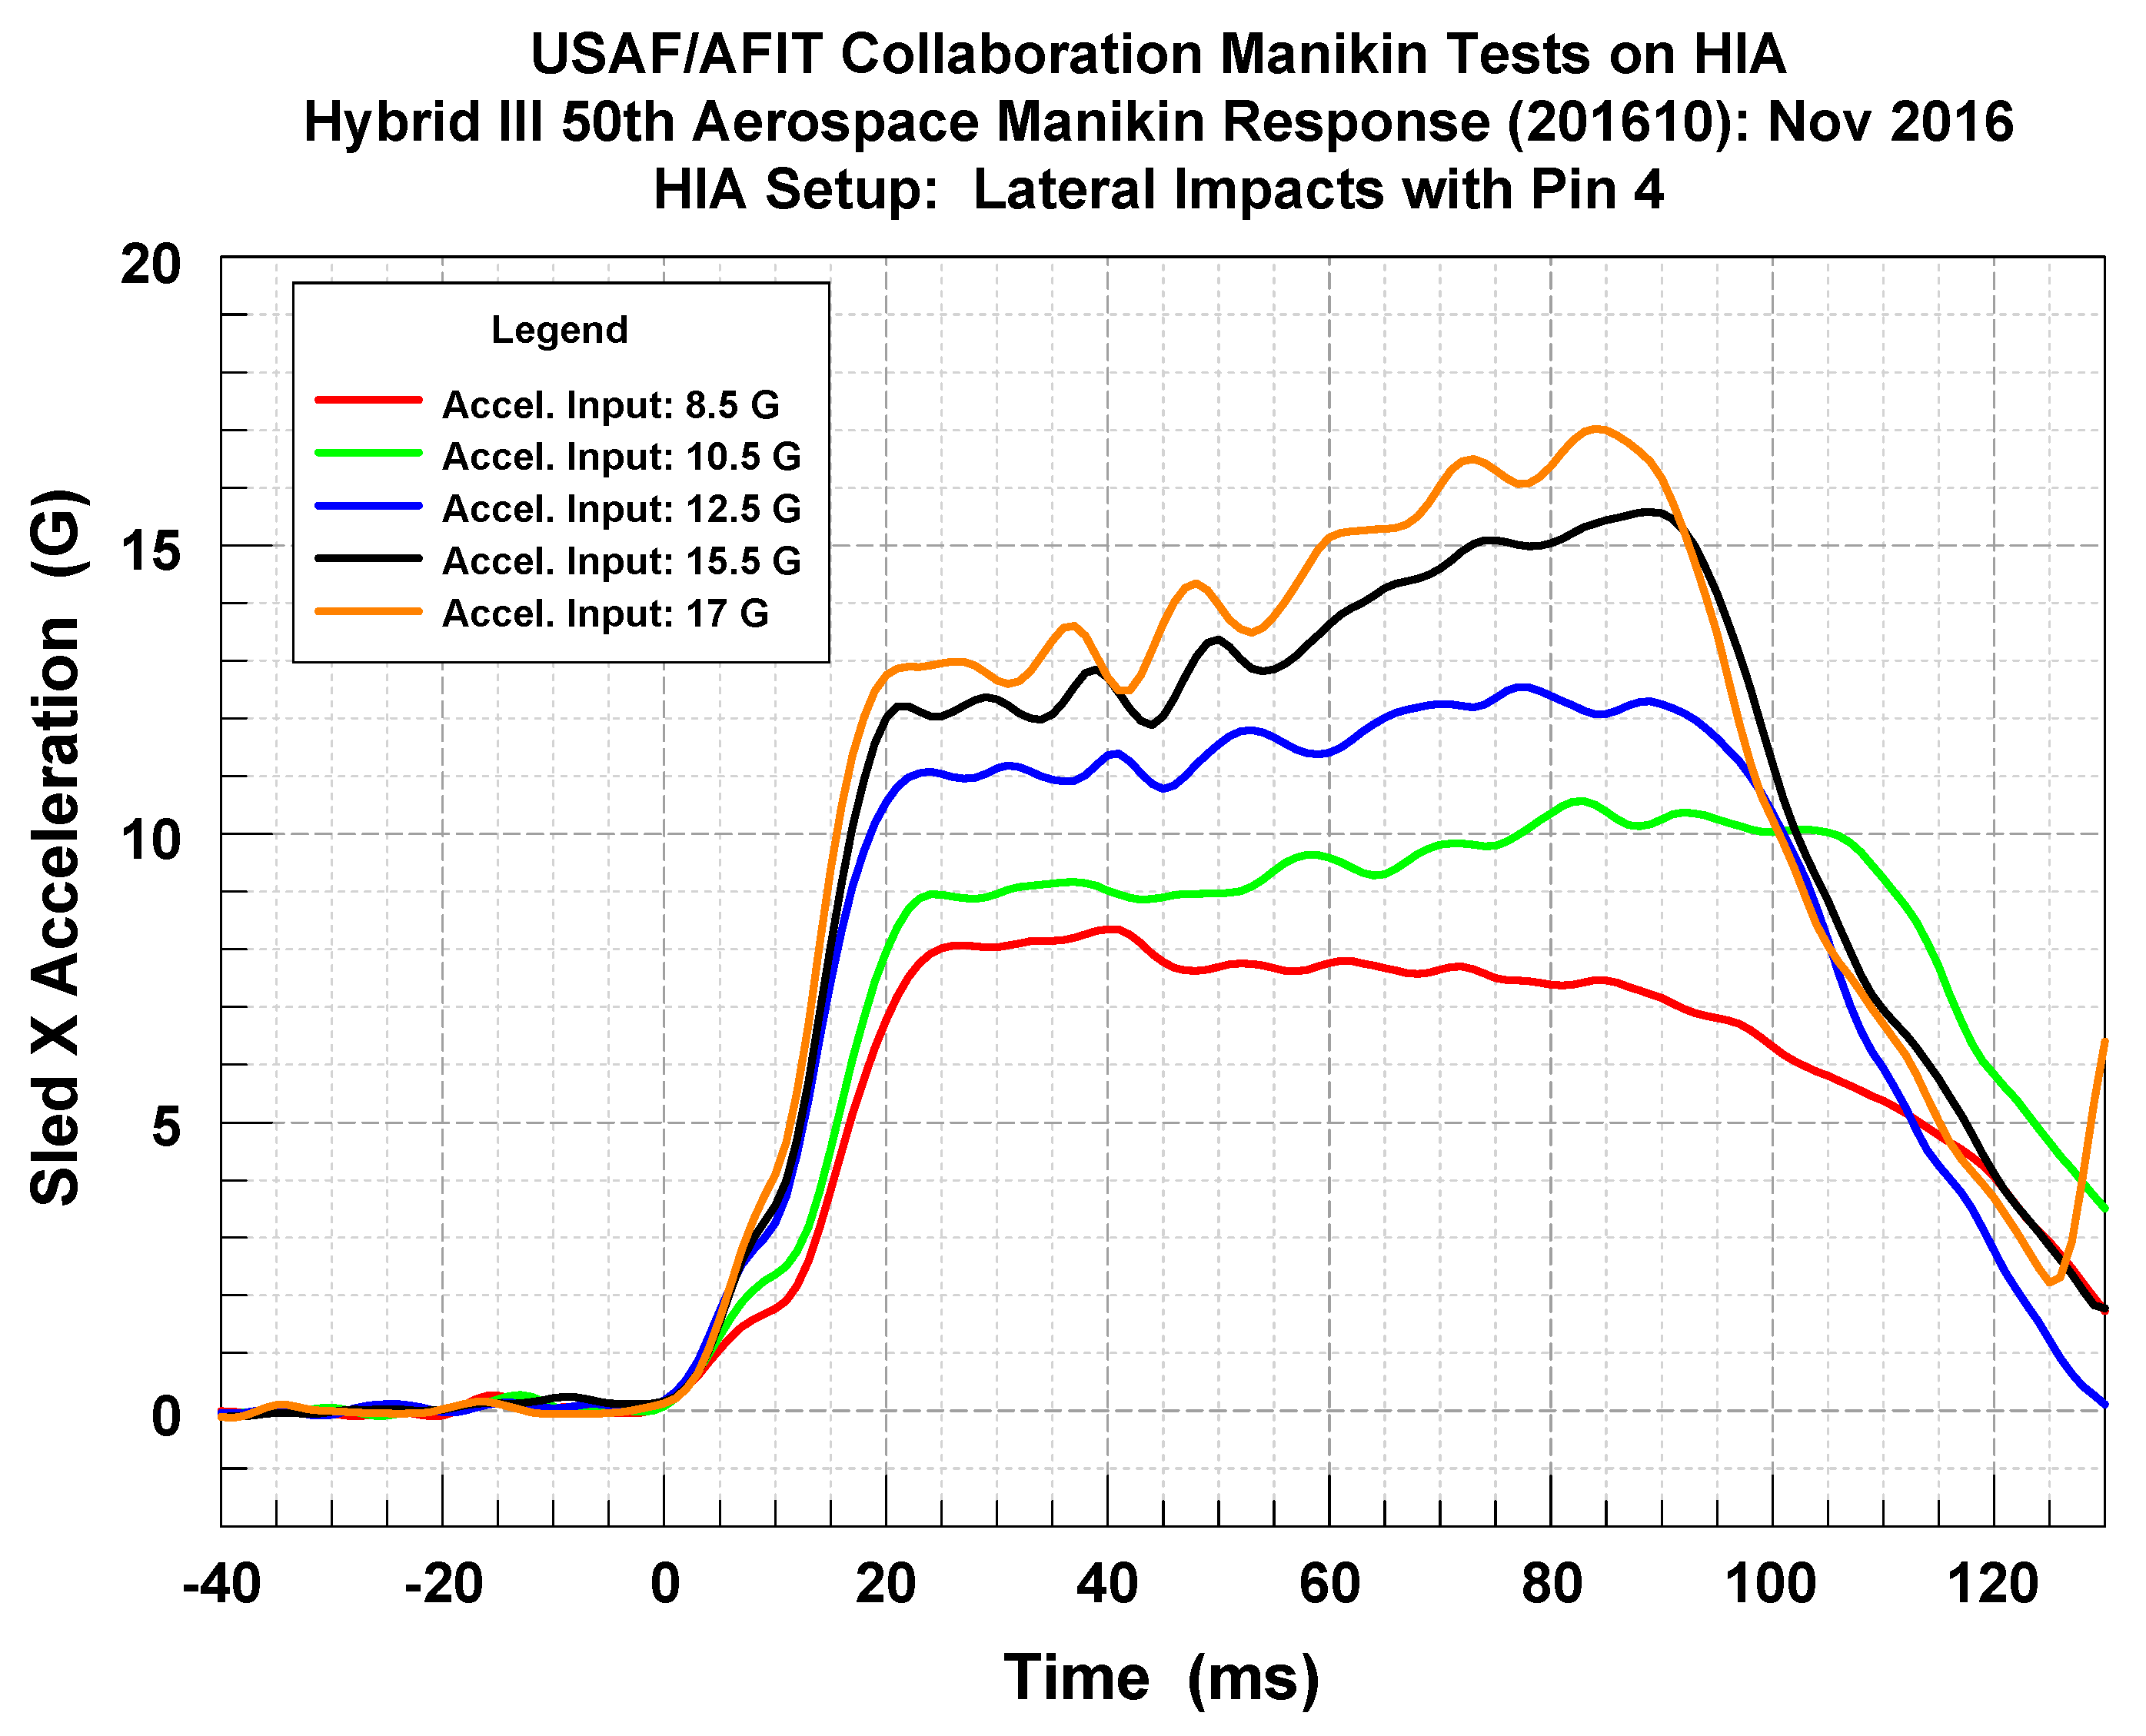
A specially designed test matrix was developed addressing the program requirement to conduct an assessment of lateral impact response of the 50th Hybrid III Aerospace ATD. The test matrix was developed to approximate the two test configurations that were used by the MCW during lateral impact tests of both an EuroSID-2 lateral impact ATD and PMHS subjects [19], and where the PMHS subjects developed injuries. The test matrix is shown in Table 1 highlighting the pulse configurations generated by the MCW test facility. An additional test cell was included to provide response data from the ATD with a standard USAF helmet and mask to support the development of both injury and computational models. The MCW tests had peak G levels that ranged from 8.5 to 17 G, velocity changes that ranged from 8.7 to 18 m/s (28.5 to 59.0 ft/s), and pulse durations that averaged around 100 ms. The AFRL input acceleration pulses were developed to produce similar peak G levels and velocity changes as the MCW pulses and were also able to produce trapezoidal or rectangular pulses that were a close match to the MCW pulses. The sled pulses using HIA Pin 4 are shown in Figure 3 for each impact level.

Table 1.
Horizontal Impulse Accelerator (HIA) test matrix for the lateral impact study.
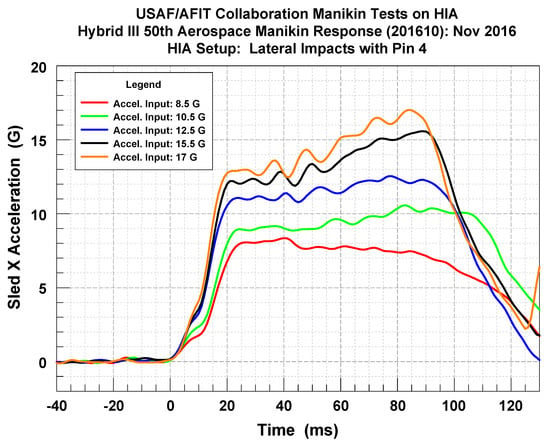
Figure 3.
HIA sled pulses used for ATD impacts. The graph presents time history examples of the acceleration profiles used for each impact level with 8.5 G profile at the bottom progressively increasing to the 17 G profile at the top.
2.3.2. Biodynamic Assessment
An assessment of the ATD during the lateral impacts consisted of the basic biodynamic response of the head and the neck through analysis of the head linear accelerations and rotational velocities, and through analysis of the neck axial and shear loads and rotational torques.
The requirement for additional data to support the development of the ATD-to-human transfer function for lateral impacts was addressed by using the ATD neck load data to calculate MANICy values at the impact conditions shown in Table 1. The combined cervical force and neck moments measured by the ATD’s upper neck load cell were used to calculate MANICy, as shown in Equation (2); however, the current MANICy criteria only uses five factors and not the six factors, as initially defined by the NMDRC, due to limited data for the Mx torque term, therefore, this term was not included in the MANICy calculation. For this effort, MANICy was calculated throughout the time history of the impact test and for each impact test per the test matrix. The peak AFRL MANICy limit for risk of injury in aerospace applications is 0.47 [12,13] for an Abbreviated Injury Scale (AIS) 2 injury at a probability level less than or equal to 5% (limit is 0.53 for AIS 3).
The numerator terms in Equation (2) are defined as follows: Fx = observed x direction shear loading, Fy = observed y direction shear loading, Fz = observed axial loading (+Fz = tension, −Fz = compression), My = observed moment about the anatomical y axis (sagittal plane anterior/posterior bending, +My = flexion, −My = extension), and Mz = observed moment about the anatomical z axis (neck twisting or chin-to-shoulder rotation). The corresponding denominator terms are the critical values for each term. The critical intercept values for MANICy calculation at C0–C1 are based on the use of the male Hybrid III type ATD neck [13].
3. Results and Discussion
Eighteen impact tests were completed in support of this effort to characterize the biodynamic response of the 50th Hybrid III aerospace ATD to acceleration pulses in a lateral impact configuration. Data assessment will focus on effects of impact level and seat configuration on the biodynamic response of the ATD’s head/neck. ATD data was not normalized prior to data assessment.
3.1. HIA Repeatability
Two tests per test cell were conducted at a minimum to provide a limited intra-examiner repeatability assessment. Even though there were two seat fixture configurations, it was determined, based on previous experience with the AFRL sled, that the minor weight difference between them would have little effect on the sled pulse; therefore, the repeatability data includes the data from both seat configurations. The peak acceleration level and velocity change summaries indicated that the HIA facility and impact environment were well controlled during the duration of the program with acceleration variations less than 2.0%, and velocity change variations less than 4.0%. The velocity changes achieved by the HIA were very close to the velocity changes achieved by the MCW facility, and this is shown in Table 2.

Table 2.
Impact acceleration and velocity change comparison for AFRL and MCW Sleds.
The rise time data demonstrated the most variability, which is due to the shape of the pulse and the intrinsic noise on the signal due to the design of the HIA system (thrust pin shape and surface, internal wall friction, fluid friction and dynamics, etc.) beyond control. It should be noted that the 8.5 G impacts had the time-to-peak value towards the beginning of the pulses, and the 10.5 G through 17 G impacts had the time-to-peak values towards the end of the pulses, even though all the pulses were rectangular/trapezoidal in shape (refer back to Figure 3).
3.2. Rigid Seat Configuration: Select Data Analysis
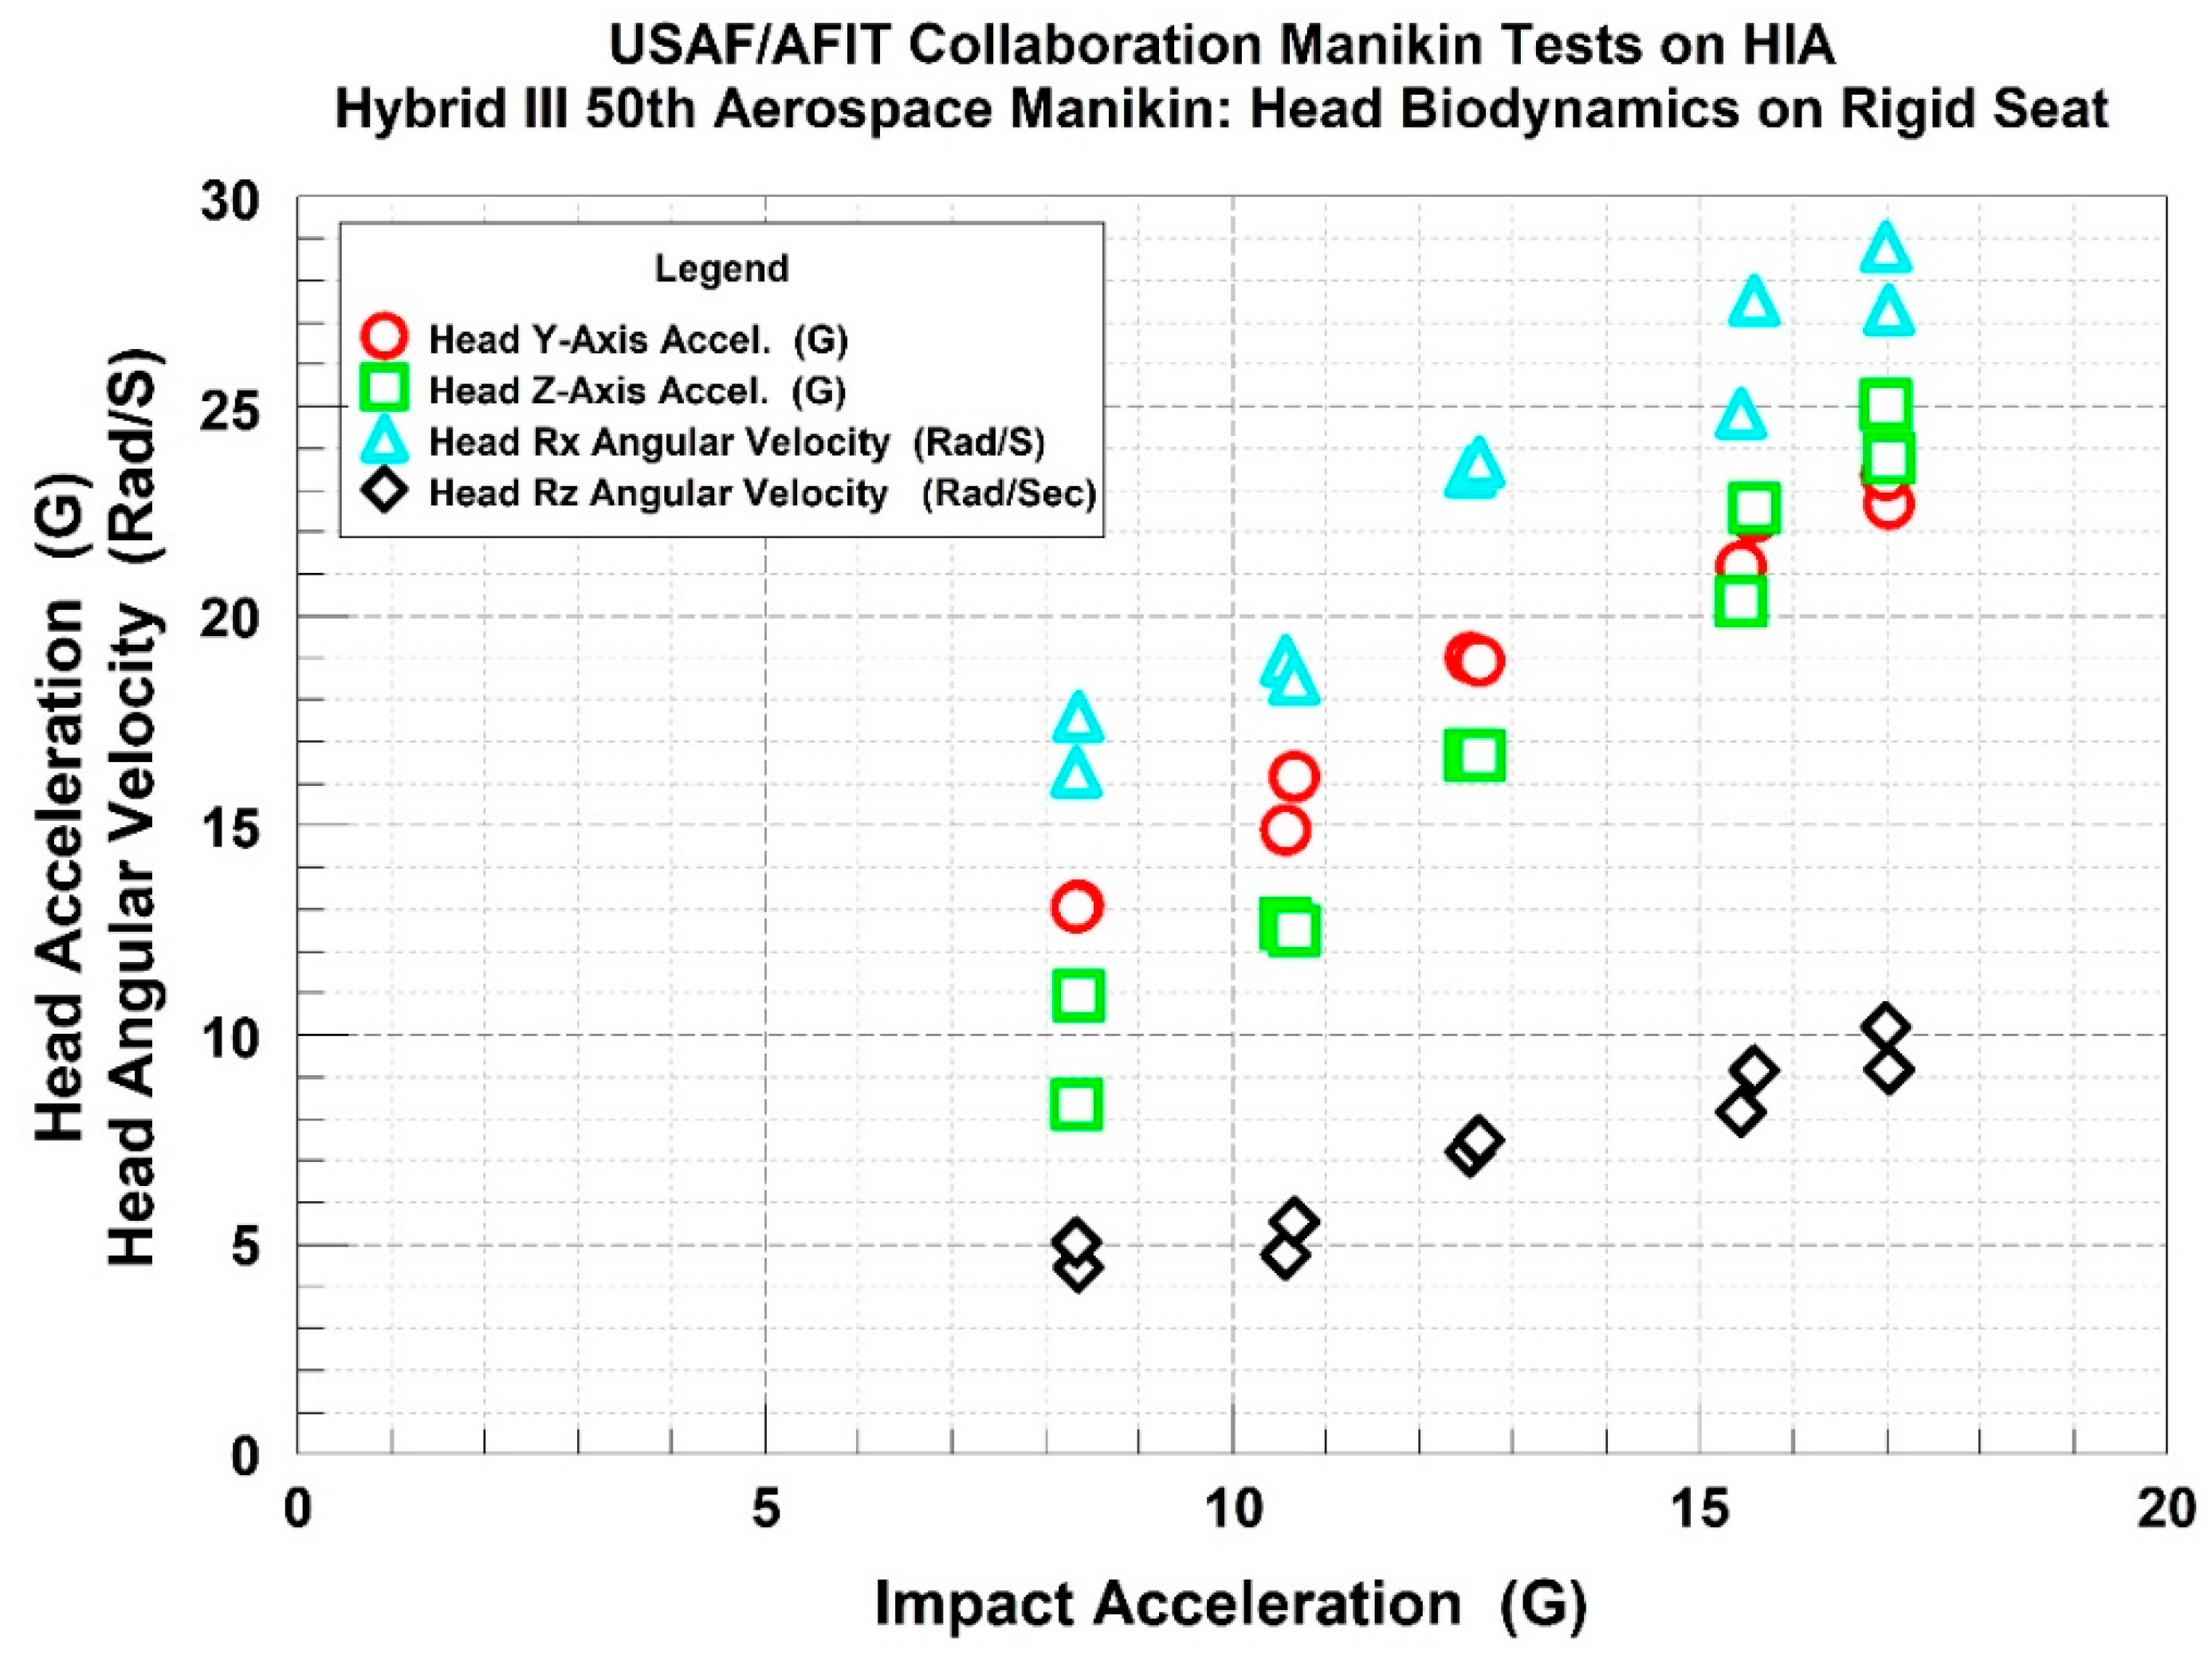
The data analysis focused on the impact response of the ATD head’s linear accelerations, rotational velocities, shear loads, and axial torques. The ATD loads and torques were modified by the software program ANALYZETEST Version 1.1.5 (Aircrew Biodynamics and Protection Team, Air Force Research Laboratory, Wright Patterson AFB OH, USA), which accounts for the offset of the head/neck load cell from the pivot point on the neck. ANALYZETEST also computed neck injury risk values. Plots of the selected data sets are shown in Figure 4 and Figure 5.
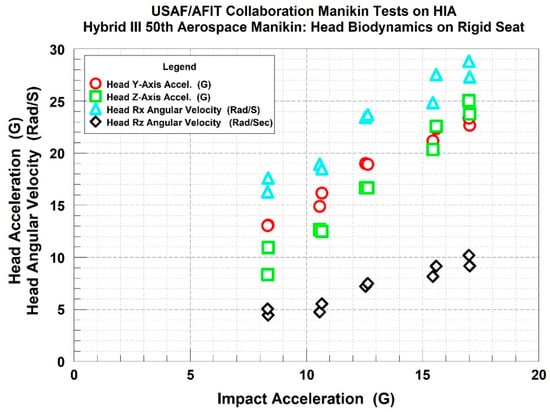
Figure 4.
ATD head responses in the rigid seat. The plot shows the trend for the head z-axis (axial) and head y-axis (lateral) linear accelerations, and the head rotational velocities around the x-axis and the z-axis, to increase linearly as a function of the impact acceleration. The linear accelerations were very similar (circles and squares), but the rotational velocity around x-axis (triangles) was much greater than the velocity around the z-axis (diamonds).
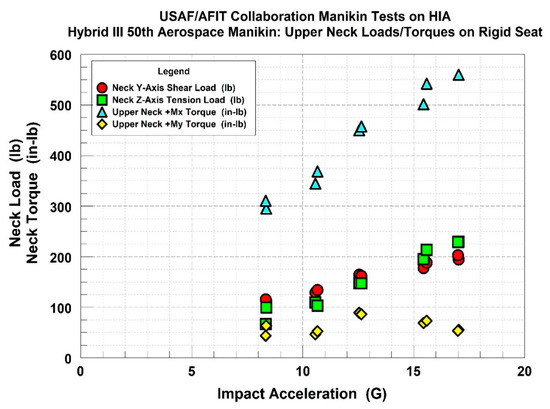
Figure 5.
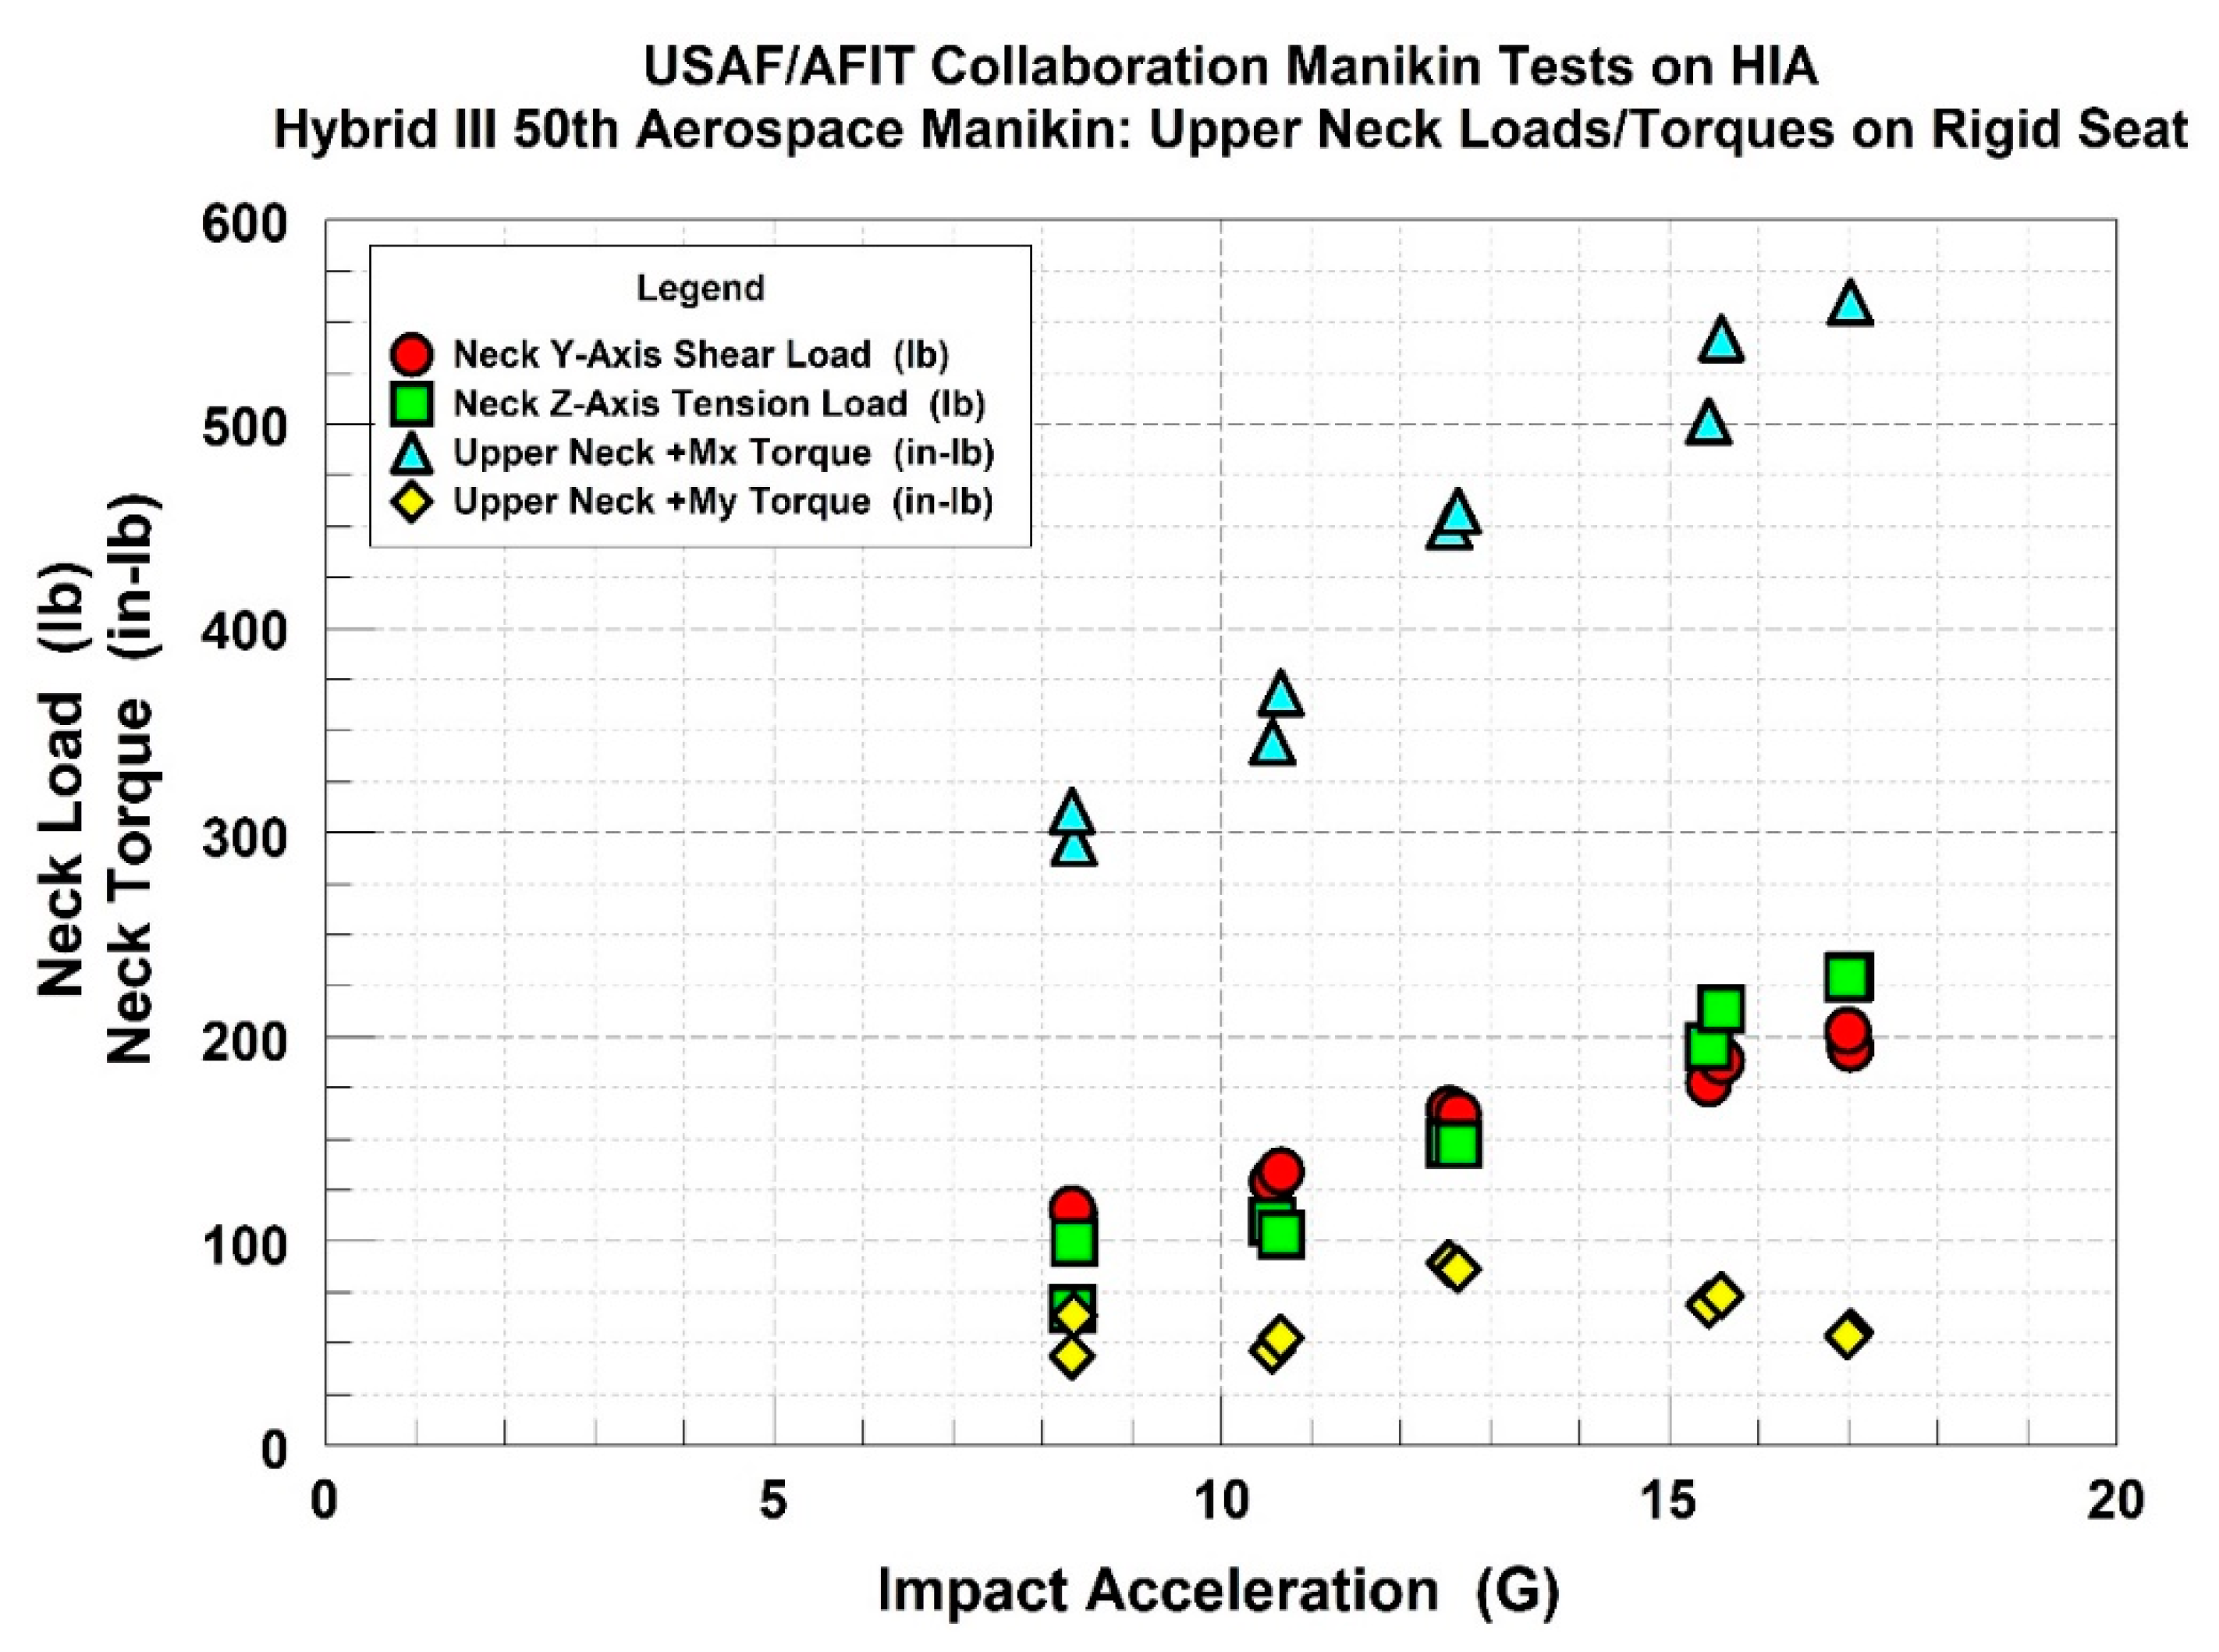
Responses in the rigid seat. The plot shows the trend for the neck axial tension and lateral shear loading, and the torque around the x-axis and the y-axis, to increase linearly as a function of the impact acceleration. The tension and shear loads (squares and circles) were similar, but the x-axis torque or lateral flexion (diamonds) was greater than the y-axis torque or forward flexion (triangles).
The effect of the peak G level on the ATD head’s biodynamic acceleration response indicated an expected step-wise increase in accelerations and rotational velocities as the impact level increased from 8.5 to 17 G. The variation in the data sets was small and averaged less than 10% for the majority of the data sets analyzed. The primary linear acceleration response appears to transition from a lateral response in the y-axis to an axial response in the z-axis as the input acceleration increased, and occurred at input accelerations greater than 15 G. This transition was most likely due to the ATDs head rotating into the direction of the impact. The rotation of the ATD head around the x-axis (lateral flexion or lateral bending) was primary compared to the other axes, as indicated by the greater head Rx angular velocity values compared to the head Ry and Rz. The head Rz angular velocity did double its response as the input acceleration increased (approximately 5 rad/s up to 10 rad/s), but the head Ry velocity response did not change relative to the its initial response at 8.5 G, and never exceeded 5 rad/s. All the ATD biodynamic response variables that were analyzed indicated a general linear increase out to the 17 G input acceleration, and each variable was fit with a linear model. The Correlation Value or “r” and the Coefficient of Determination (COD) or “R2” were calculated for all the regression models. All Correlation values were in the range from 0.96 to 0.99, and all COD values were in the range from 0.85 to 0.93.
The effect of the peak G level on the ATD upper neck loads and torques indicated an expected step-wise increase as the impact level increased from 8.5 to 17 G. The variation in the data was small and similar to the accelerations and rotational velocities, averaging less than 10% for the majority of the data sets that were analyzed. Similarly to the head acceleration response, the primary linear force response appeared to transition from a lateral shear force (y-axis) to an axial tension force (z-axis) as the input acceleration increased, and occurred at the input accelerations greater than 15 G. The Mx torque was primary compared to the My and Mz torques. It should be noted that the head biodynamic response data indicated a greater increase in the head Rx angular velocity relative to the Ry and the Rz velocity, and the torque data indicated a greater increase in Mx torque relative to the My (and Mz) torque. All the ATD load and torque variables that were analyzed indicated a general linear increase out to the 17 G input acceleration except for the My torque, which changed very little out to 17 G. The parameters were fit with a linear regression model and all correlation values were in the range from 0.98 to 0.99, and all Coefficient of Determination values were in the range from 0.88 to 0.97 excluding the My torque variable.
3.3. Padded Seat Configuration: Select Data Analysis
Data analysis for the padded seat configuration focused on impact response of the ATD head’s linear accelerations, rotational velocities, shear loads, and axial torques. Plots of these selected data sets are shown in Figure 6 and Figure 7.
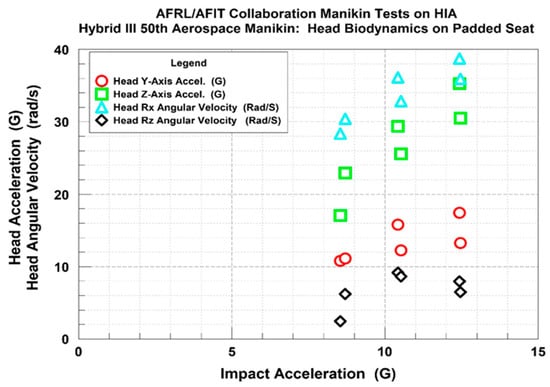
Figure 6.
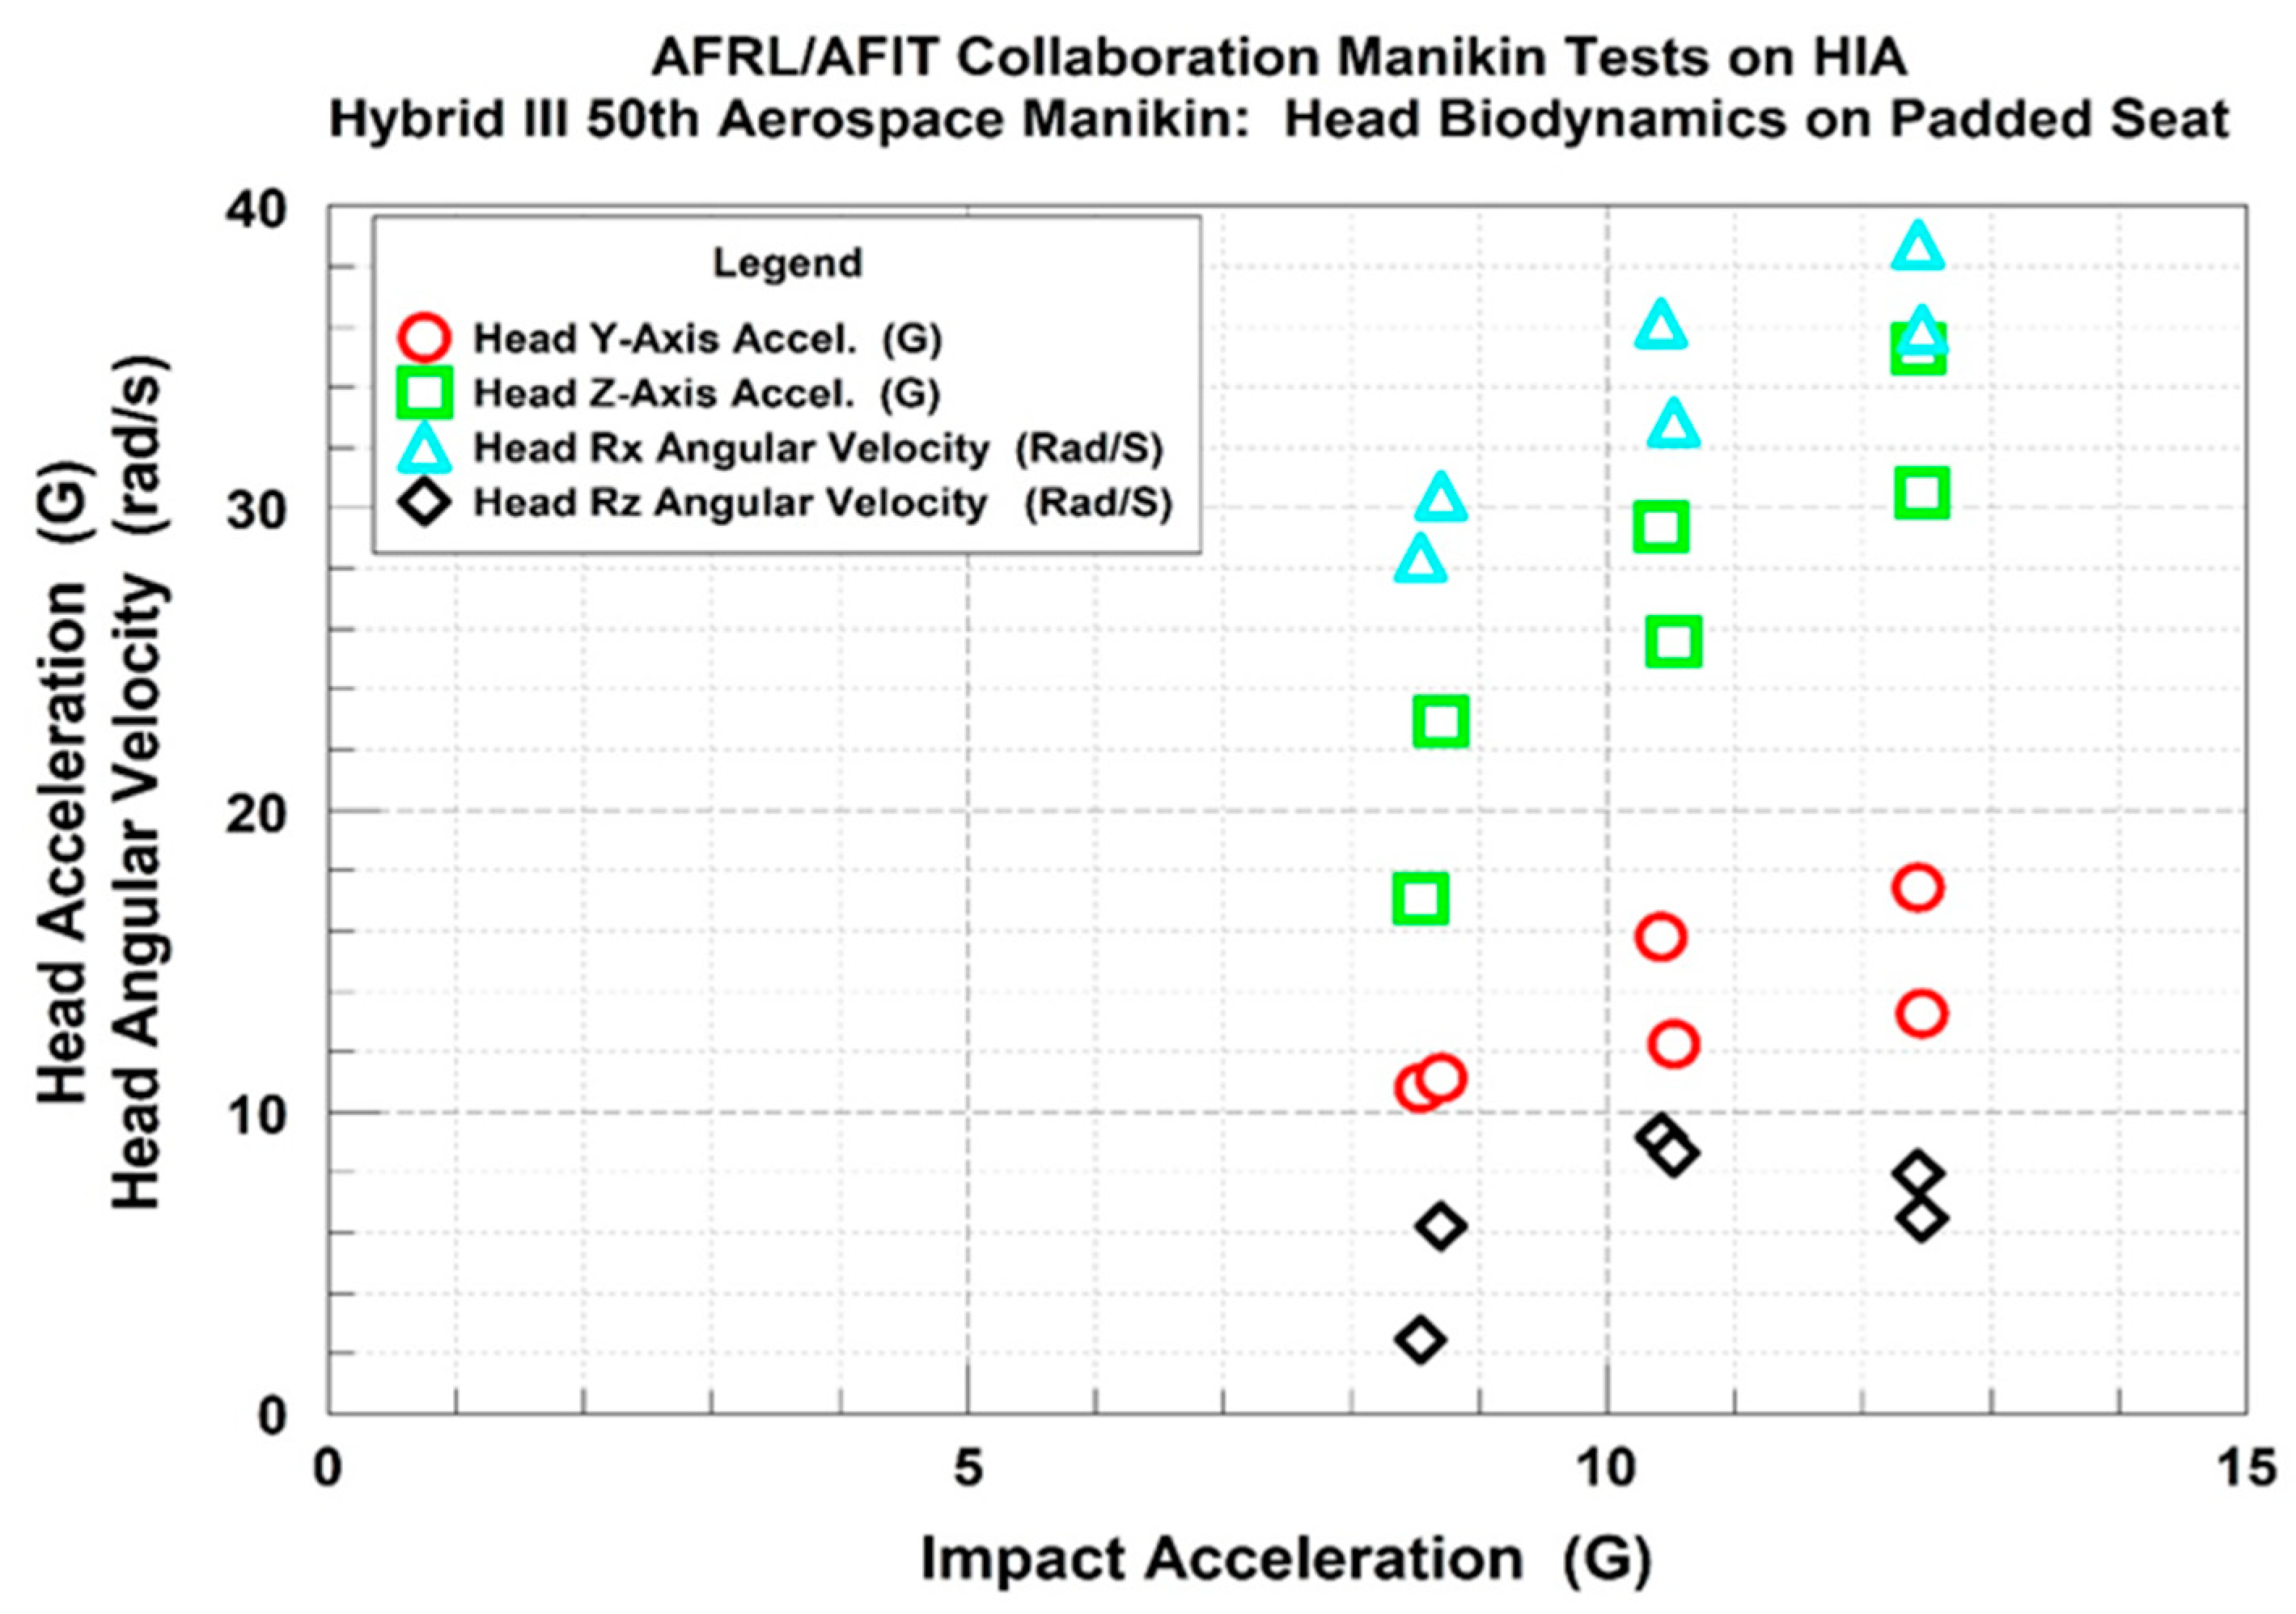
ATD head responses in the padded seat. The plot shows the trend for the head z-axis (axial) and head y-axis (lateral) linear accelerations, and the head rotational velocities around the x-axis and the z-axis, to increase linearly as a function of the impact acceleration. The axial acceleration (squares) was noticeably greater than the lateral acceleration (circles), and the rotational velocity around x-axis (triangles) was much greater than the velocity around the z-axis (diamonds).
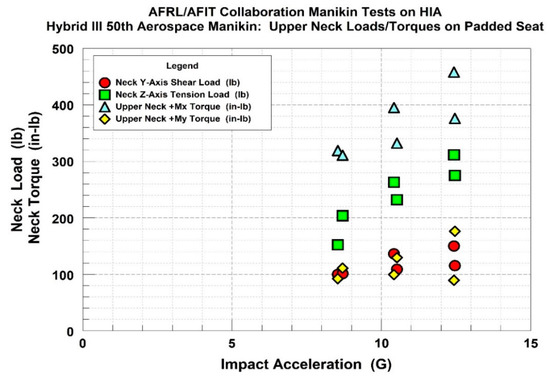
Figure 7.
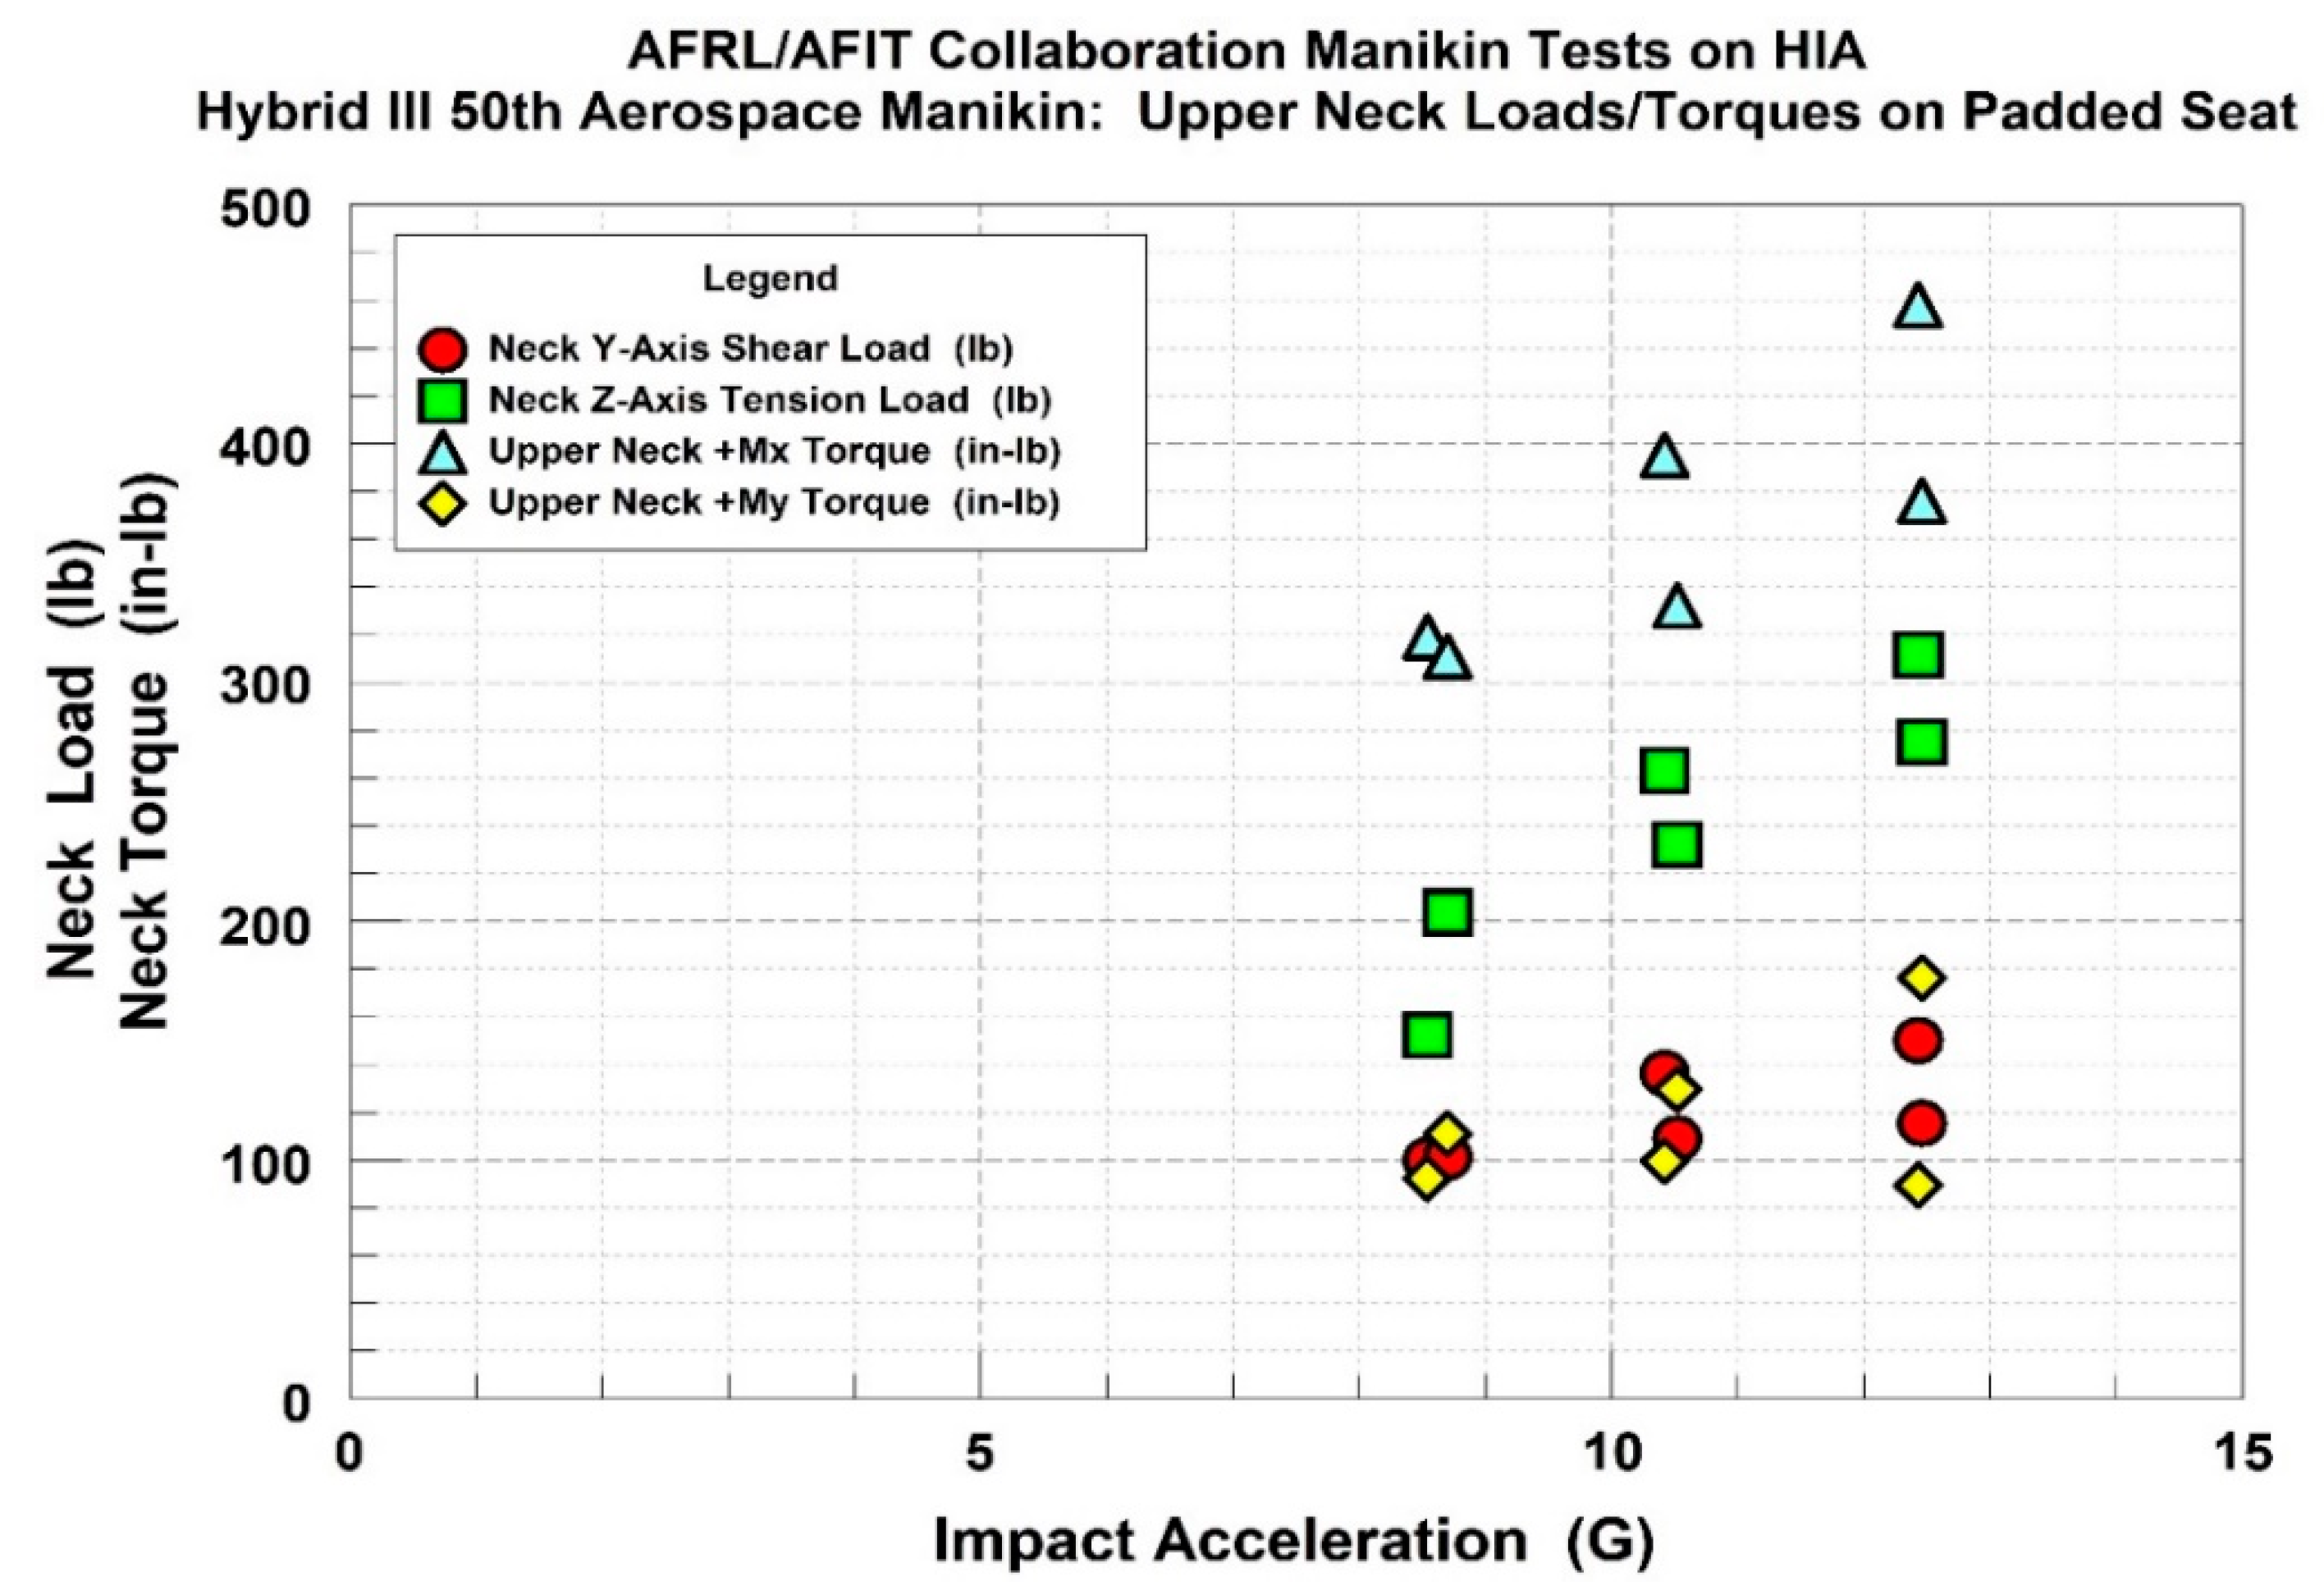
ATD neck responses in the padded seat. The plot shows the trend for the neck z-axis tension (axial) and neck y-axis shear (lateral) loading, and the torque around the x-axis and the y-axis, to increase linearly as a function of the impact acceleration. The tension load (squares) was much greater than the shear loads (circles), and the x-axis torque or lateral flexion (triangles) was much greater than the y-axis torque or forward flexion (diamonds).
The effect of the peak G level on the ATD head’s biodynamic response with the padded seat configuration indicated an expected step-wise increase in accelerations and rotational velocities as the impact level increased from 8.5 to 12.5 G. The variation in the data was larger than what was shown with the rigid seat data and ranged from less than 5% to approximately 20% for the majority of the data sets that were analyzed. The primary linear acceleration response was in the z-axis for all the acceleration inputs when compared to the y-axis lateral acceleration. This indicates that the ATD’s head was rotating in the direction of impact much quicker than what was shown with the rigid seat configuration. The rotation of the ATD head around the x-axis was primary compared to the other axes as indicated by the greater head Rx angular velocity values compared to the head Ry and Rz, which is what was shown with the rigid seat. The head Rz angular velocity did double its response as the input acceleration increased (approximately 4 rad/s upto 8 rad/s), but the head Ry velocity response did not change relative to the its initial response at 8.5 G, and never exceeded 5 rad/s. All the ATD biodynamic response variables that were analyzed indicated a general linear increase out to the 12.5 G input acceleration; therefore, the variables were fit with a linear model. All Correlation values (r) were in the range from 0.53 to 0.91 (three values exceeded 0.7), and all COD values (r2) were in the range from 0.28 to 0.71 (three values exceeded 0.5). This data indicates the padded seat configuration with the 3-point harness generated head responses that did not follow a linear model as well as the data from the rigid seat with the 5-point harness.
The effect of the peak G level on the ATD upper neck loads and torques indicated an expected step-wise increase as the impact level increased from 8.5 to 12.5 G. The variation in the data was larger than shown with the rigid seat and ranged from 5% to approximately 10% for the majority of the data sets that were analyzed. The neck torque data sets had the highest variation in data with variations that ranged from approximately 20% to as high as 50%. Similarly to the head acceleration response, the primary linear force response was the axial load in the z-axis when compared to the lateral shear force in the y-axis. This again indicates that the ATD’s head was rotating in the direction of impact much quicker than what was shown with the rigid seat configuration. The torque generated around the x-axis was primary compared to the other axes, as indicated by the greater Mx torque values compared to the My and Mz torques. In addition, the measured Mx and My torques with the padded seat configuration were much more random, and both were greater than the Mx and My torque measured with the rigid seat. The upper neck Z-axis load, the upper neck Y-axis shear load, and the upper neck Mx torque variables that were analyzed indicated a trend to increase linearly out to the 12.5 G input acceleration; however, the upper neck My torque did not indicate a tread to increase as a function of the input acceleration. The indicated variables that followed a linear trend were all fit with linear models that produced Correlation values that were in the range from 0.44 to 0.91 (three values exceeded 0.69) and they also produced COD values that were in the range from greater than 0.18 to 0.79 (two values exceeded 0.5). Similarly to the head biodynamics data, this data indicates the padded seat with the 3-point harness generated neck load and torque responses that did not follow a linear model as well as the data from the rigid seat with the 5-point harness.
3.4. Seat Configuration Comparison
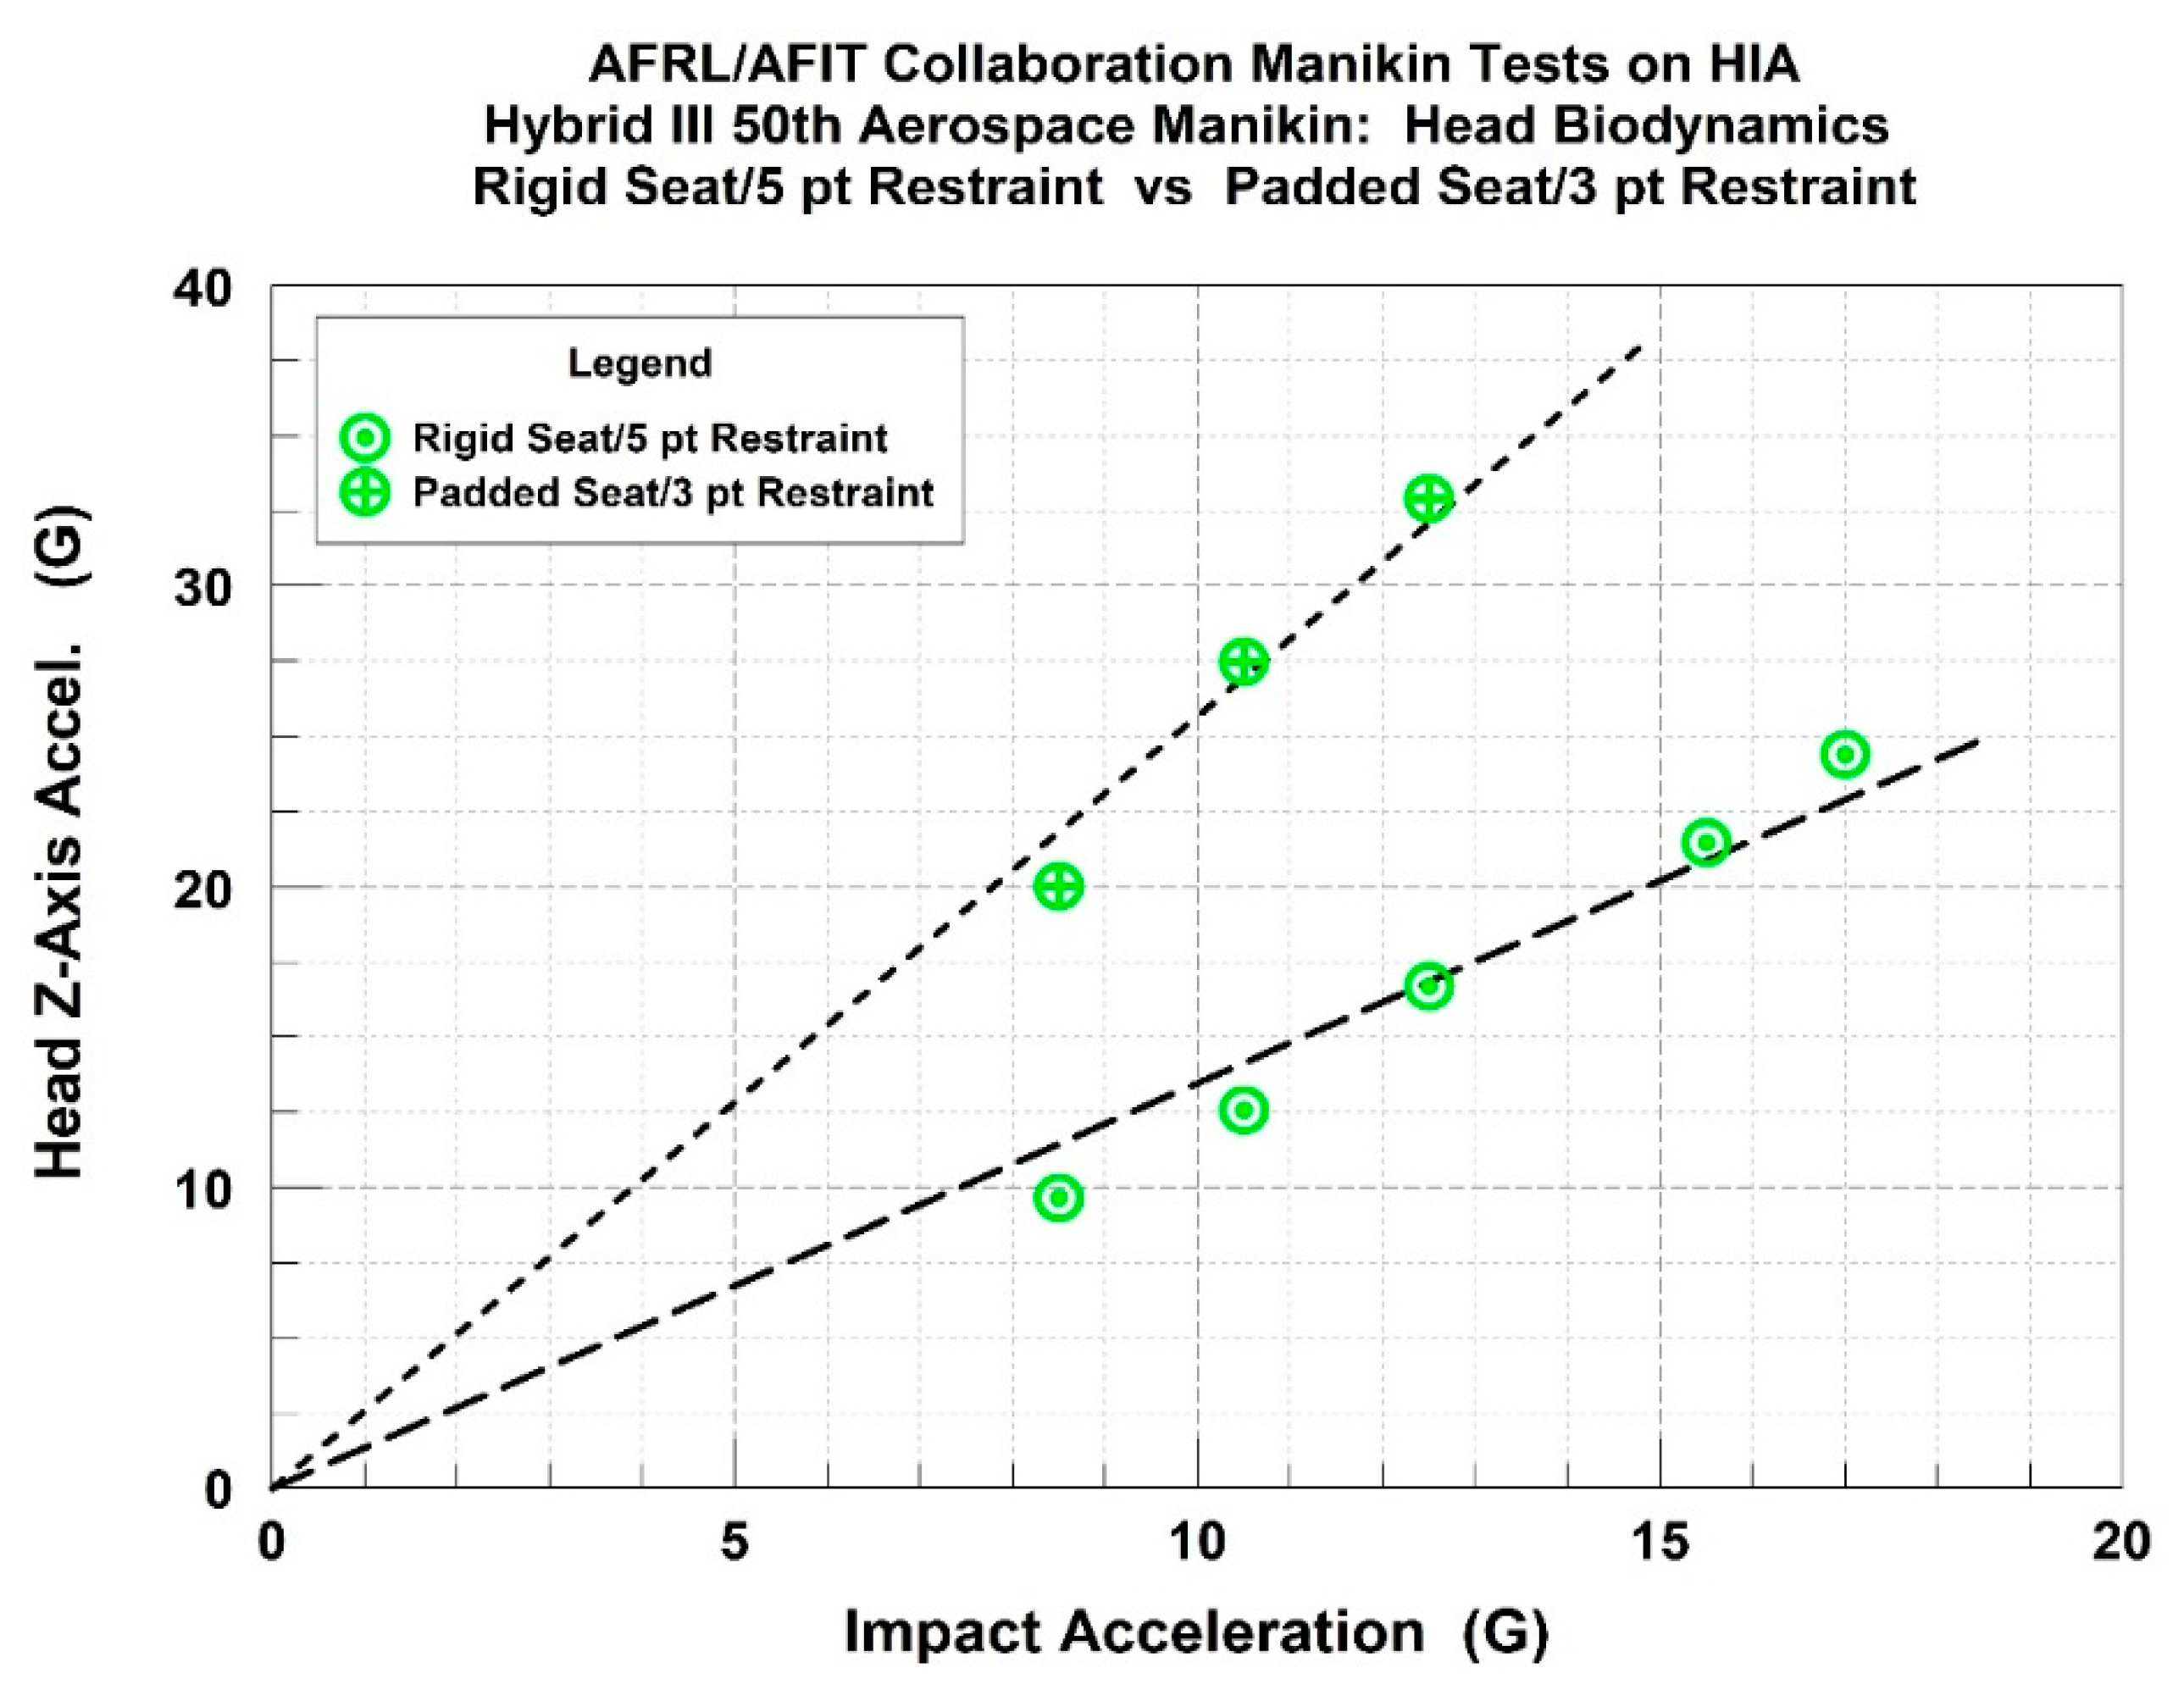
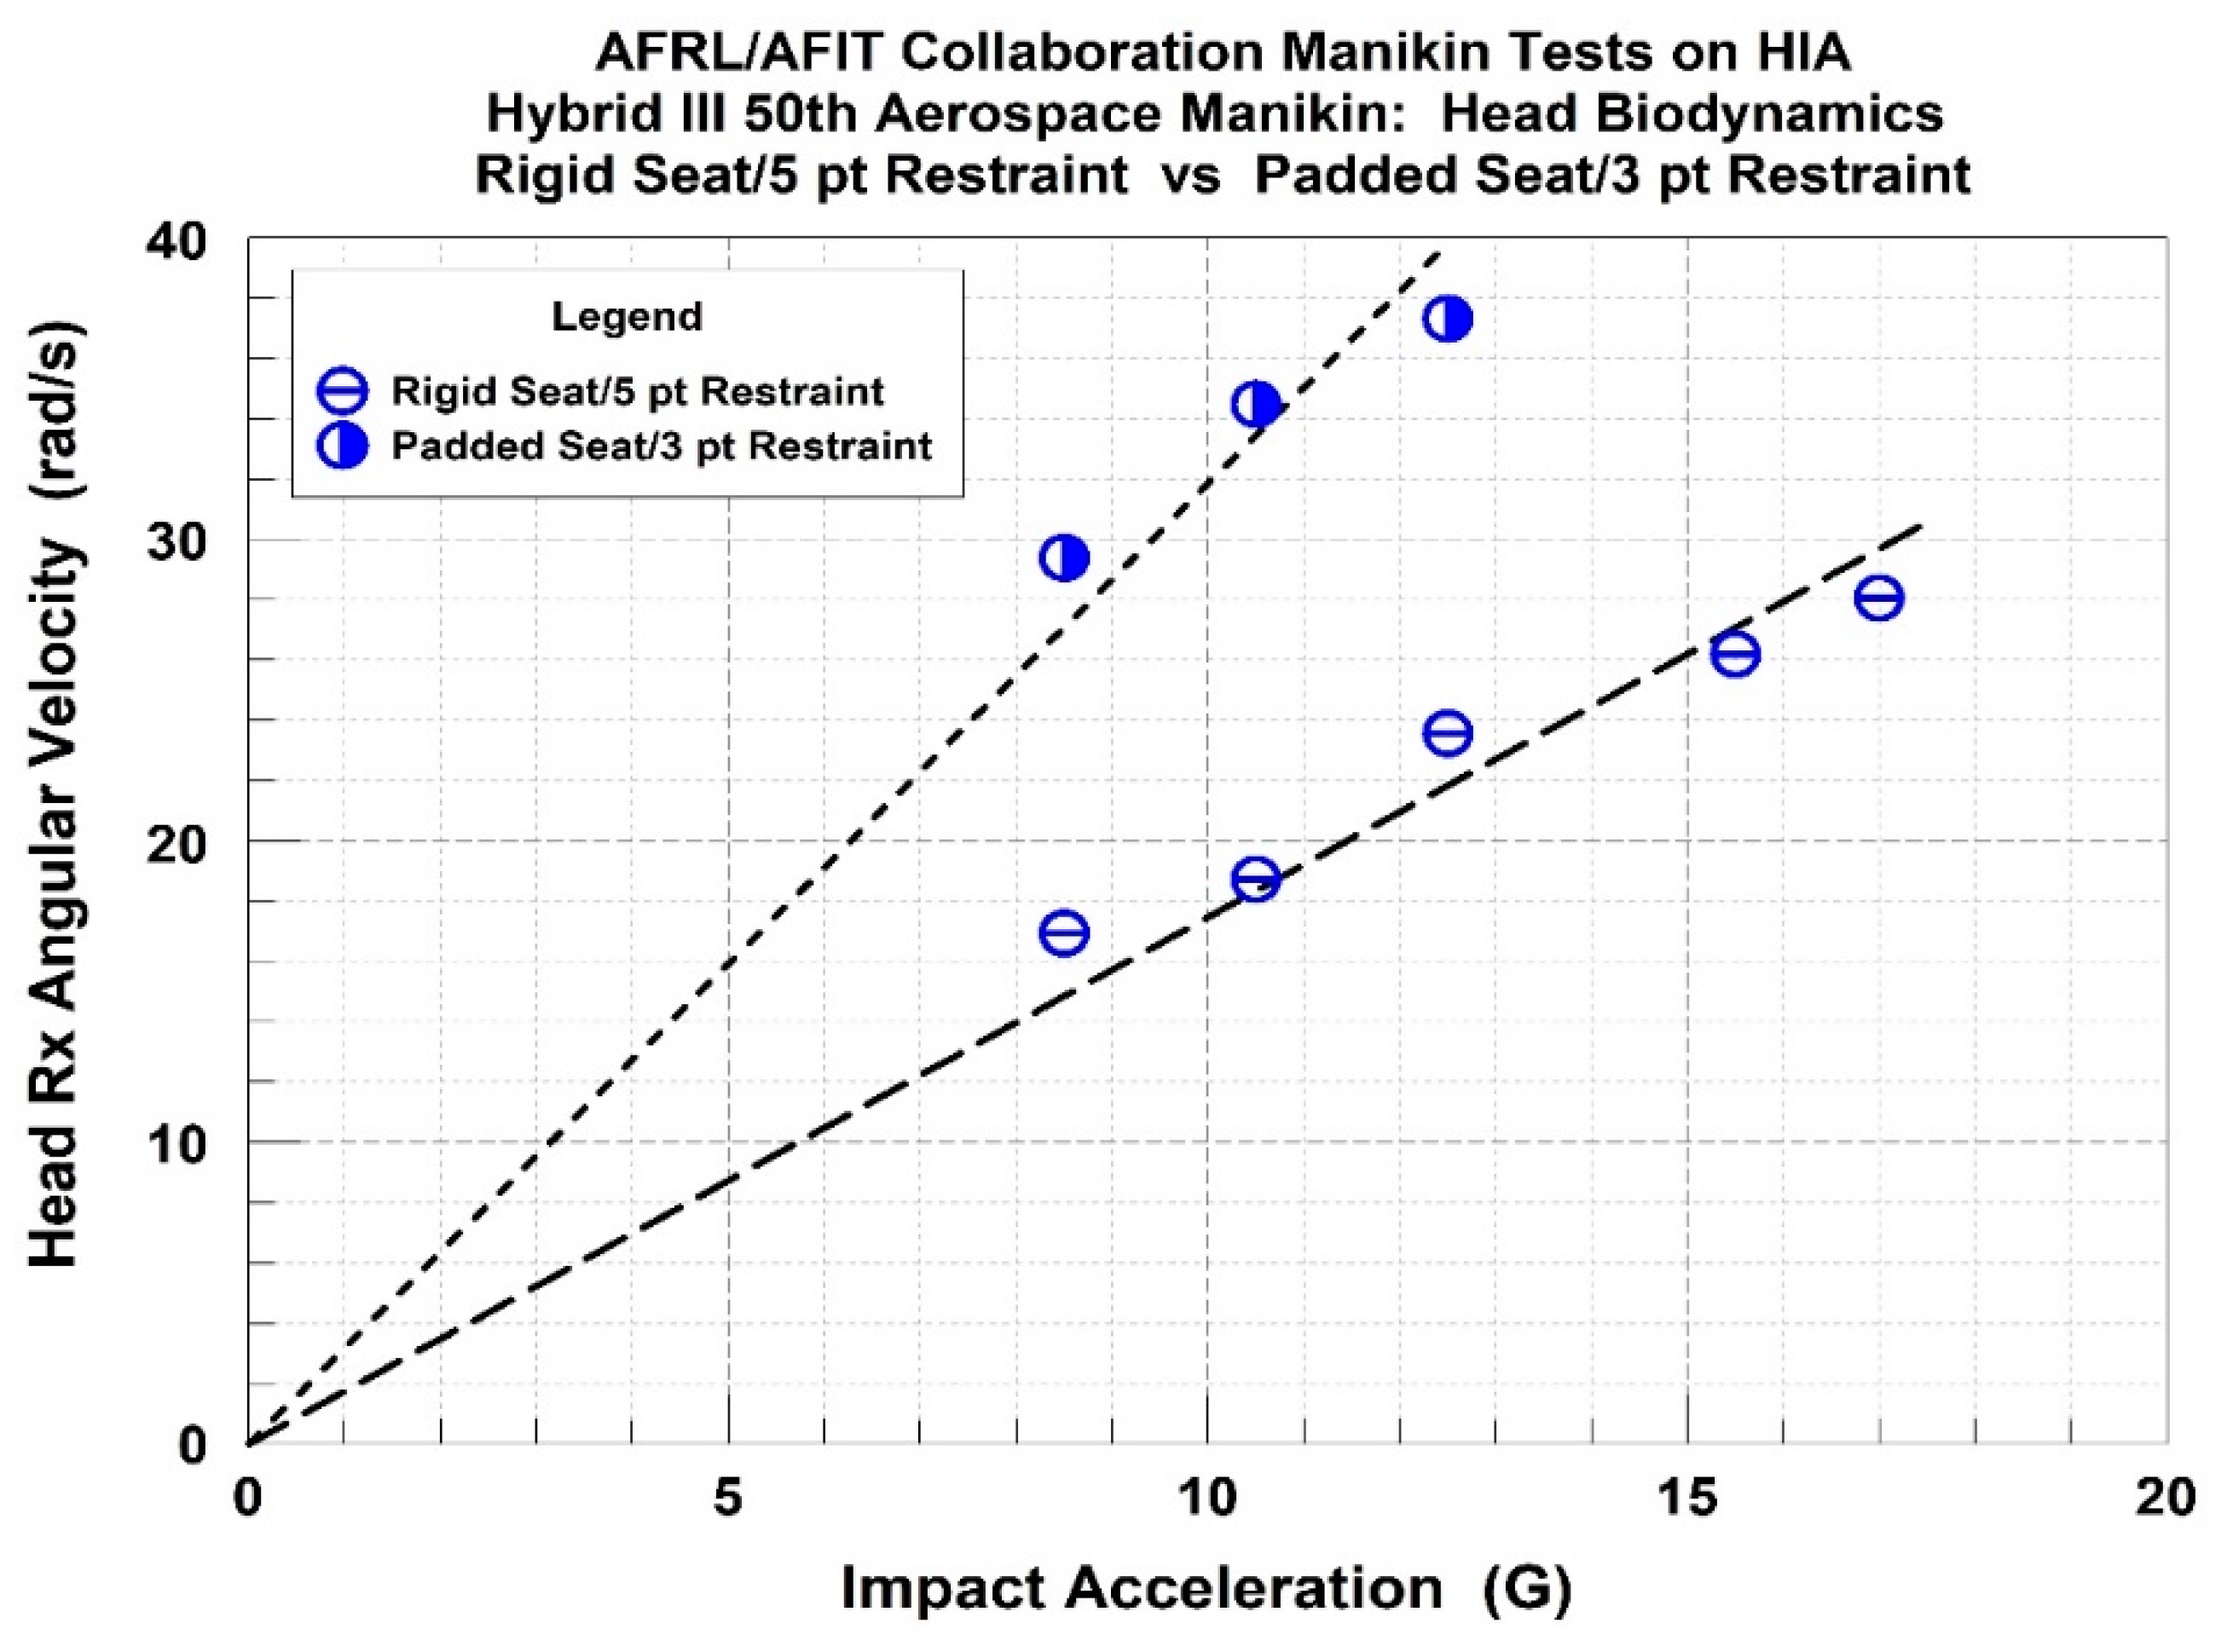
A comparison was made for select head biodynamic parameters and neck force and torque parameters based on the three input accelerations that overlapped the two different seat configurations that were assessed during this program. These overlapping acceleration levels were 8.5, 10.5, and 12.5 G. The head biodynamic parameters that were selected for comparison were head z-axis acceleration and head Rx angular velocity, and the neck force and torque parameters that were selected for comparison were neck Z-axis tension force and upper neck Mx torque. The mean response values for the parameters and the parameter’s linear models were compared. The mean values and linear models are shown in Figure 8 and Figure 9 for the head z-axis acceleration and the head Rx angular velocity.
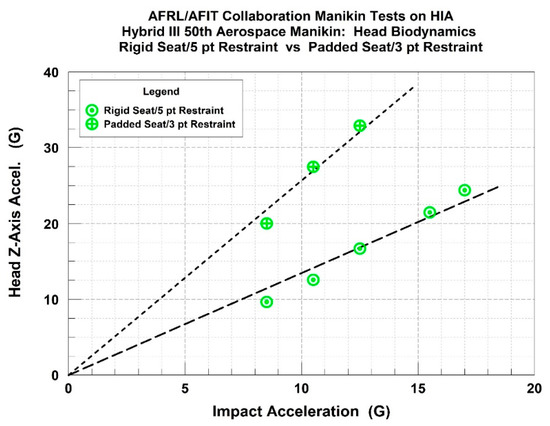
Figure 8.
Comparison of head z-axis acceleration with different seats. The plot shows a comparison of the head z-axis acceleration from impacts with the rigid seat configuration compared to the head z-axis acceleration from impacts with padded seat configuration. The head accelerations with the padded seat are shown to be greater than with the rigid seat at all comparable impact accelerations.
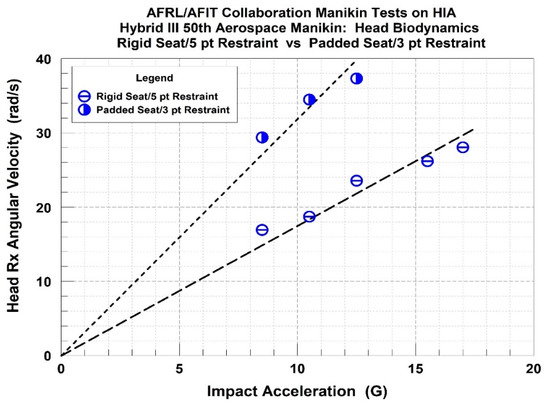
Figure 9.
Comparison of head Rx angular velocity with different seats. The plot shows a comparison of the head angular velocity around the x-axis from impacts with the rigid seat configuration compared to the head angular velocity around the x-axis from impacts with padded seat configuration. The head velocities with the padded seat are shown to be greater than with the rigid seat at all comparable impact accelerations.
The comparison of all the data sets consistently demonstrated that the ATD’s head response with the padded seat and the 3-point restraint was greater than the ATD’s head response with the rigid seat and the 5-point restraint based on the analysis of these four response parameters. However, the upper neck Mx torque showed almost no difference between the rigid seat and the padded seat configuration, even though there was a difference shown by the head Rx angular velocity (Figure 9). Additional analysis of the ATD responses was expanded to include the upper neck My torque, which demonstrated that the padded seat configuration generated a greater My torque than the rigid seat by a factor of around 2. It should also be noted that the padded seat configuration generated greater chest acceleration than the rigid seat by a factor of around 2. It is theorized that this could have been due to the padded seat configuration using a 3-point restraint versus the 5-point used by the rigid seat, as well as the seat padding itself generating dynamic overshoot of the torso due to energy rebound, or some combination of both.
3.5. Neck Injury Criteria and Transfer Function Development
The calculation of an estimated neck injury risk was conducted using the neck loads and moments measured in the ATD during each test. The analysis of potential neck injury due to these imparted loads and torques was calculated using the MANICy injury assessment tool for both seat configurations. Each seat configuration was used due to the clearly defined PMHS injuries of the corresponding MCW testing and also to demonstrate the need for a transfer function between the manikin and human risk calculation. A summary of the results is shown below in Table 3. In addition to the risk values, a summary of the AIS clinical neck injury is provided for each corresponding PMHS test that was conducted (two per impact level) during the MCW test series.

Table 3.
Neck injury risk for seat configurations.
The rigid seat configuration indicates that the MANICy values increased as a function of the impact level, as expected. The effect of wearing a helmet increased the neck injury probability by 15% to 20% at the 8.5 G input, but the risk values at 8.5 G did not exceeded the AFRL MANICy limit of 0.47 for AIS 2 injury or greater. The MANICy values at impact levels from 12.5 to 17 G also did not exceed the limit of 0.47. The padded seat configuration showed similar results at 8.5, 10.5, and 12.5 G impact accelerations and did not predict an exceedance of the AFRL MANICy limit. It was expected for the 12.5 G impact with the padded seat to produce a greater MANICy value than what was calculated with the rigid seat, but they were basically equivalent. This was most likely due to the increased variability of the ATD data with the padded seat.
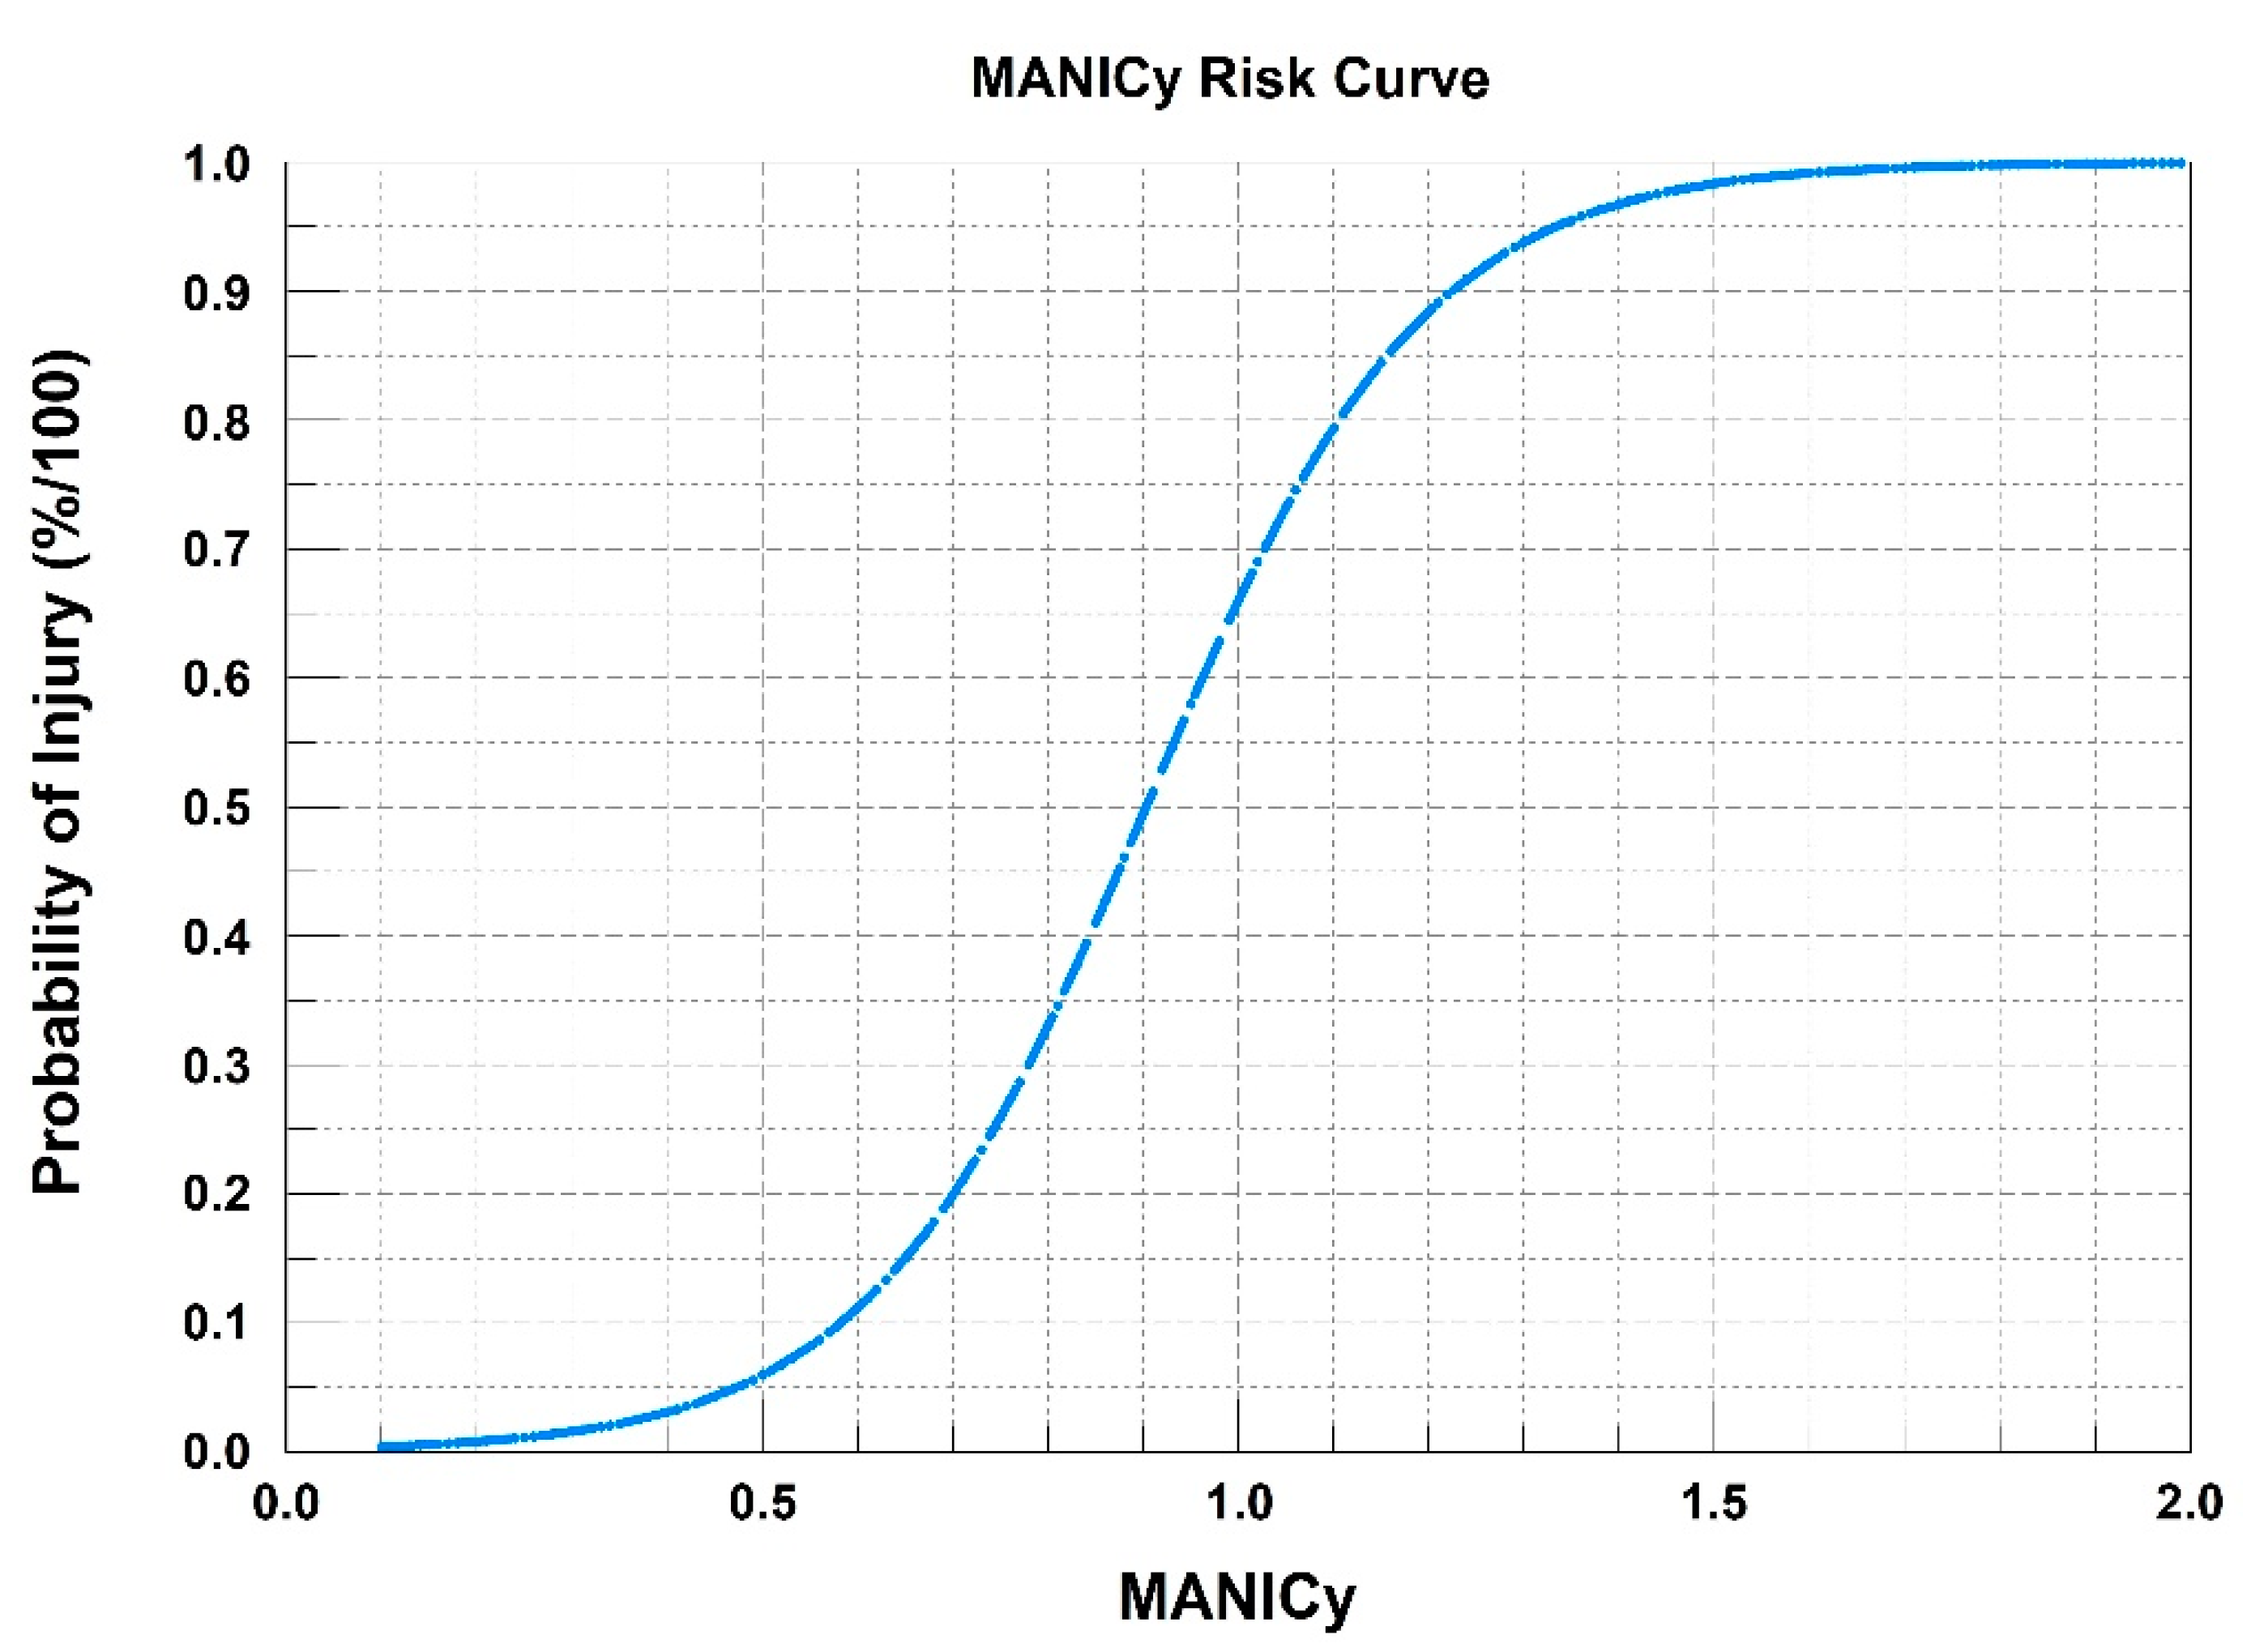
The data in Table 3 shows the requirement for a transfer function to relate the calculated MANICy values using an instrumented ATD to what would be expected if a human was exposed to the same impact acceleration. The MANICy risk function [13] used data sets composed of non-injury MANICy values calculated from human subject impacts on the AFRL HIA and injury MANICy values calculated from PMHS lateral impact tests by MCW. These same PMHS tests are also referenced above in Table 3, but the PMHS (in tests with similar set-up) produced MANICy values that were much greater than the corresponding ATD MANICy values which ranged from 0.21 to 0.34. Proper MANICy values are critical to estimation of risk per the probability of injury plot developed by Parr, and are shown in Figure 10.
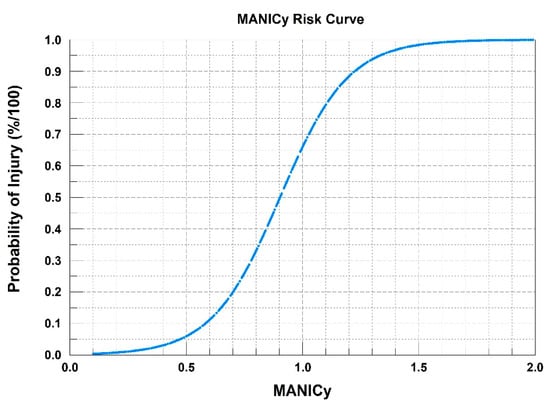
Figure 10.
MANICy risk curve. The curve indicates the Probability of Neck Injury (AIS 2 or Greater) to a person based on a calculated MANICy value using the neck loads resulting from a lateral impact.
The approach to developing a transfer function to relate calculated ATD MANICy values to calculated human/PMHS values was as follows:
- (1)
- Obtain regression model(s) of MANICy as a function of impact acceleration for currently available human data sets and ATD data sets
- (2)
- Plot each regression model on same graph as a function of impact acceleration and observe
- (3)
- If there is a difference between plots, use the regression models and generate data points for human model and ATD model over a range of impact acceleration values
- (4)
- Plot this new data set (ATD MANICy model data point and Human MANICy model data point at a given impact acceleration) with ATD model data as the x-axis, and human model data set as the y-axis
- (5)
- Calculate a regression model of the resulting data plot
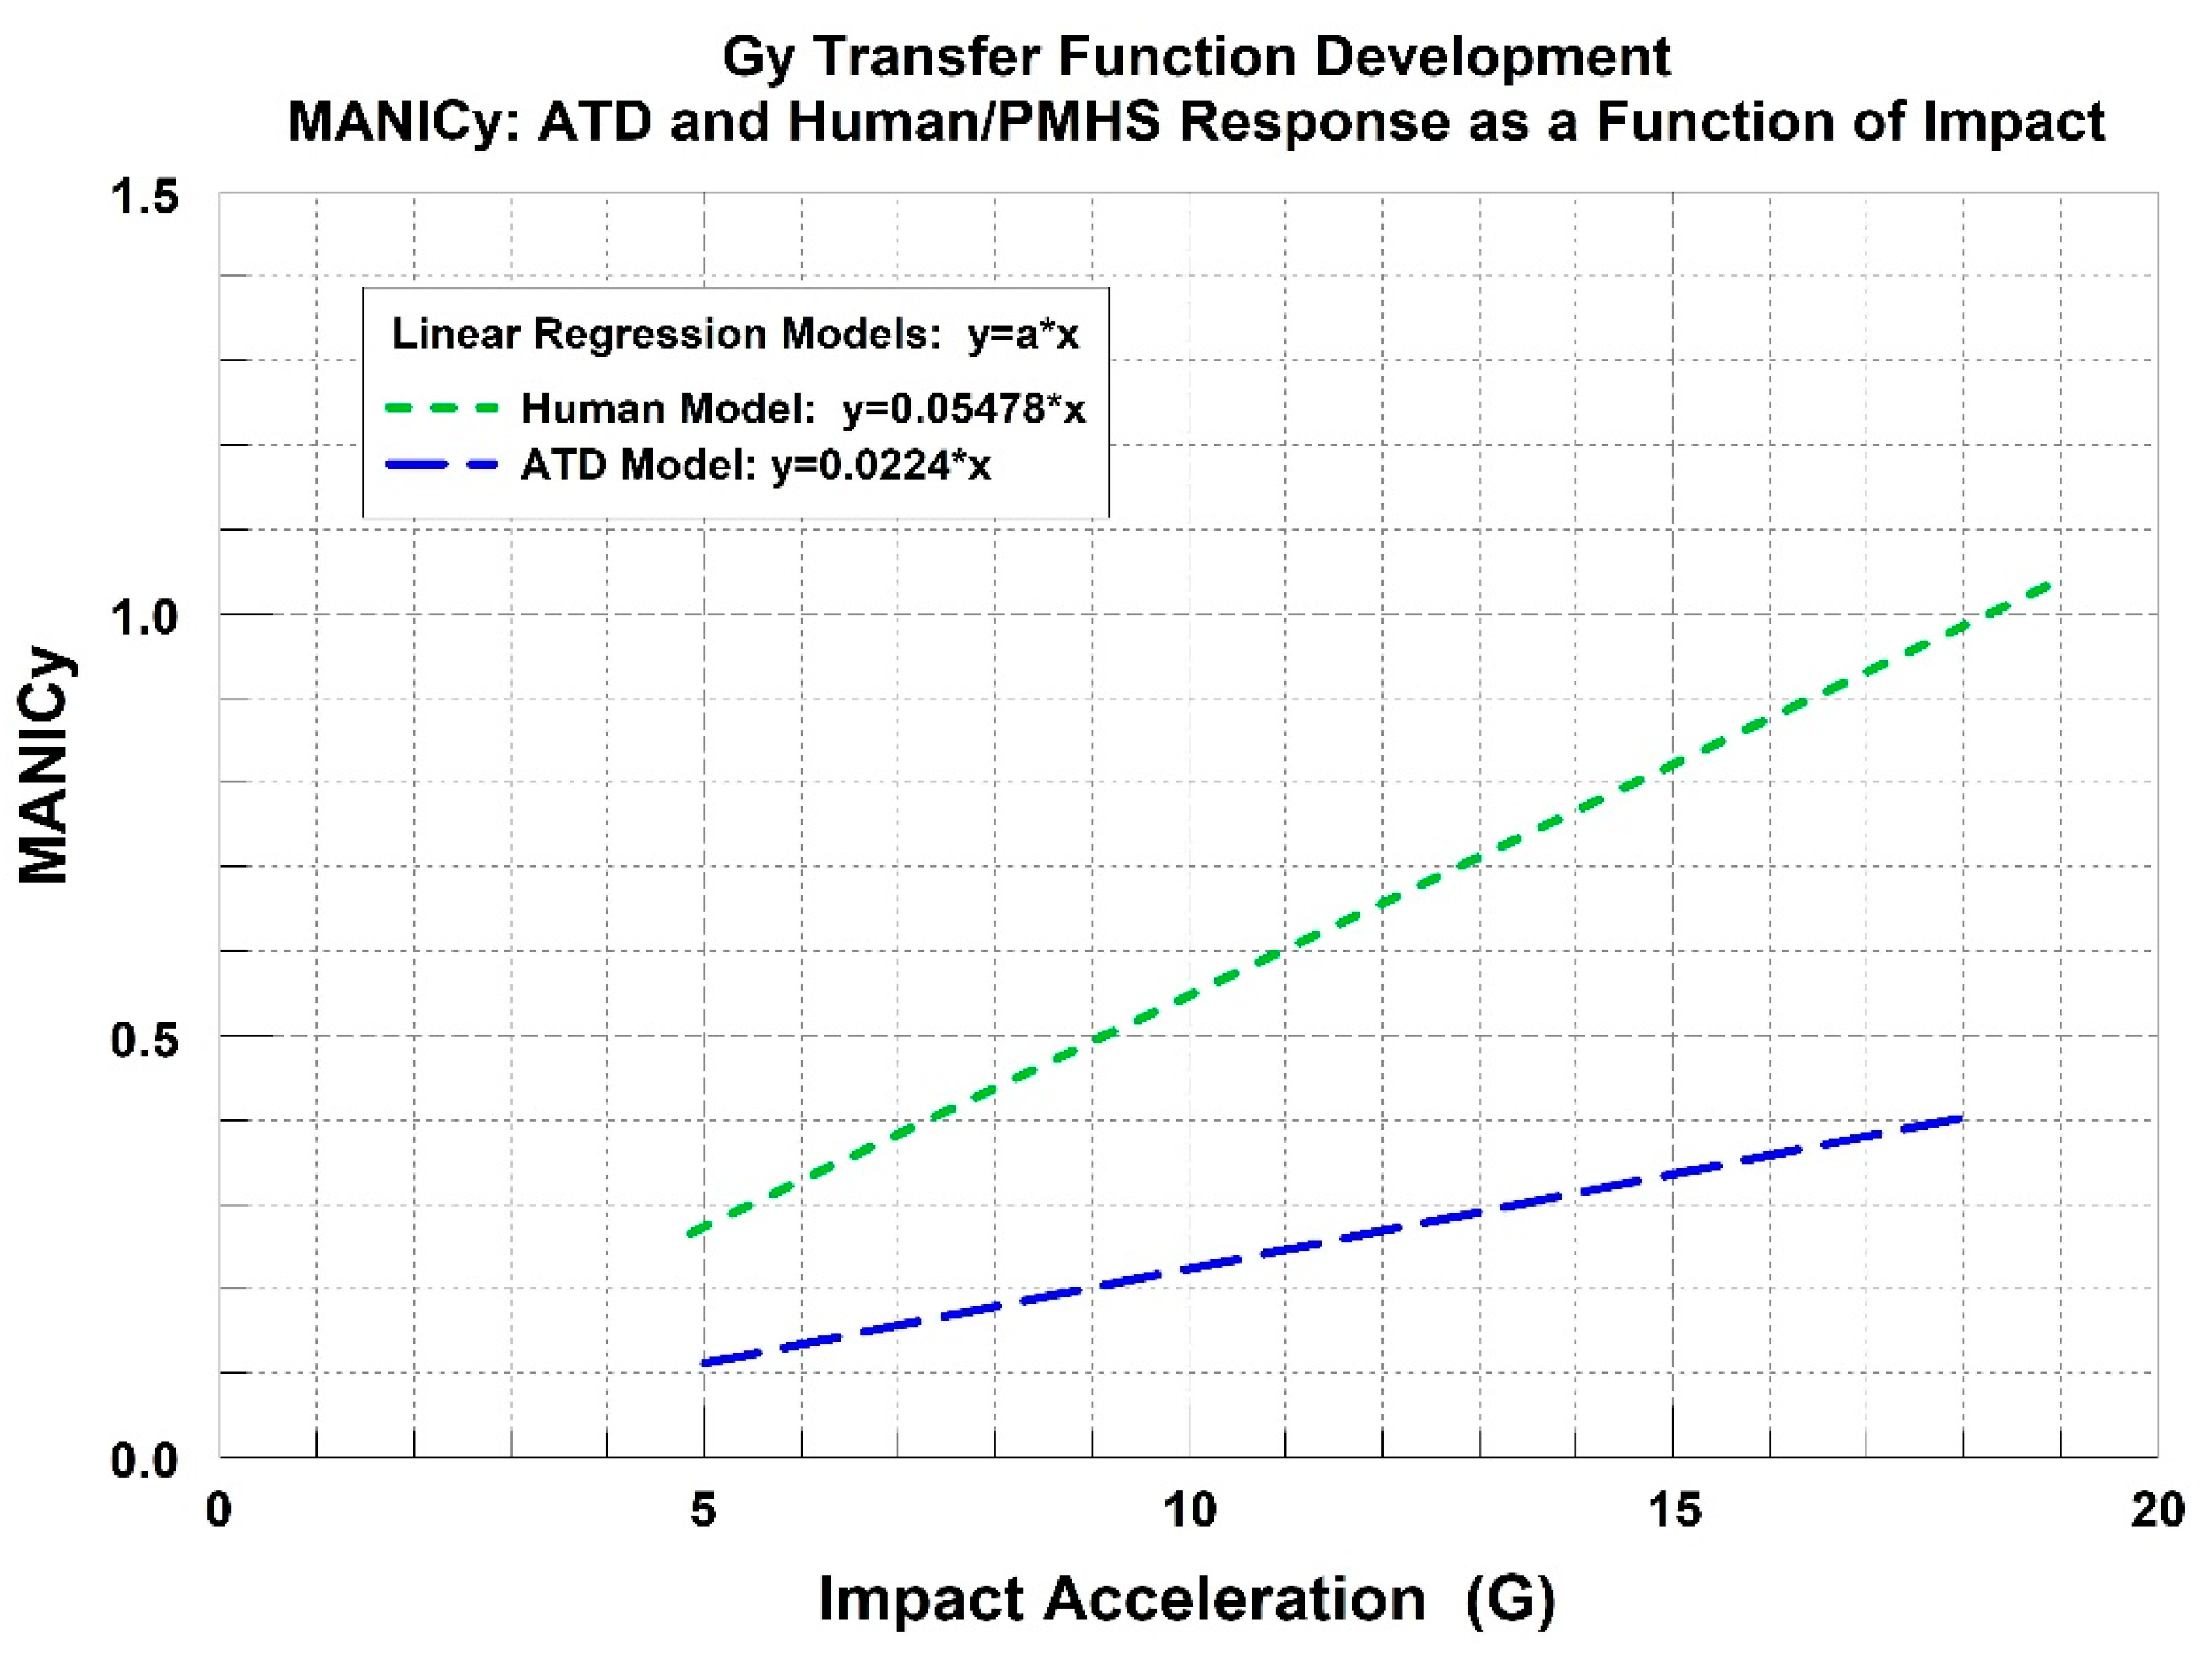
The first item under the transfer function approach, the issue of similar test conditions for the data sets, was addressed by using the available human and PMHS tests that collected sufficient head response data to calculate a MANICy value. The limitations to the current data sets are that the volunteer human subjects used a full torso harness (4-point restraint) without a side support, and the PMHS subjects used either a 3-point or a 5-point restraint with a side support. However, it should be noted that the full torso harness used with the human subjects provided a degree of additional support to the upper torso during the lateral impact, which was also the intent of the side support plates used with the PMHS tests. The regression models for the human and the manikin data sets are shown in Figure 11, which addresses Item 2 under the approach. The data from Table 3 indicated that the ATD did not show much variability in the MANICy response as a function of the seat and although not shown in this article, the human and PMHS data demonstrated a large variation in the MANICy response. The lack of variability in the ATD MANICy is most likely due to the lack of the Mx torque term, which indicates that additional research should be pursued to investigate the six-factor MANICy.
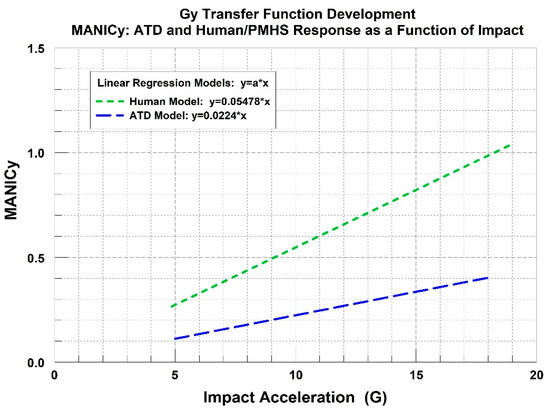
Figure 11.
Regression models for ATD MANICy and human/PMHS MANICy. A top linear regression model was created using calculated values of MANICy from AFRL sled tests with human subjects and MCW sled tests with PMHS subjects at impacts from 5 G through 19 G. A bottom linear regression model was created using calculated values of MANICy from AFRL sled tests with ATDs documented in this article.
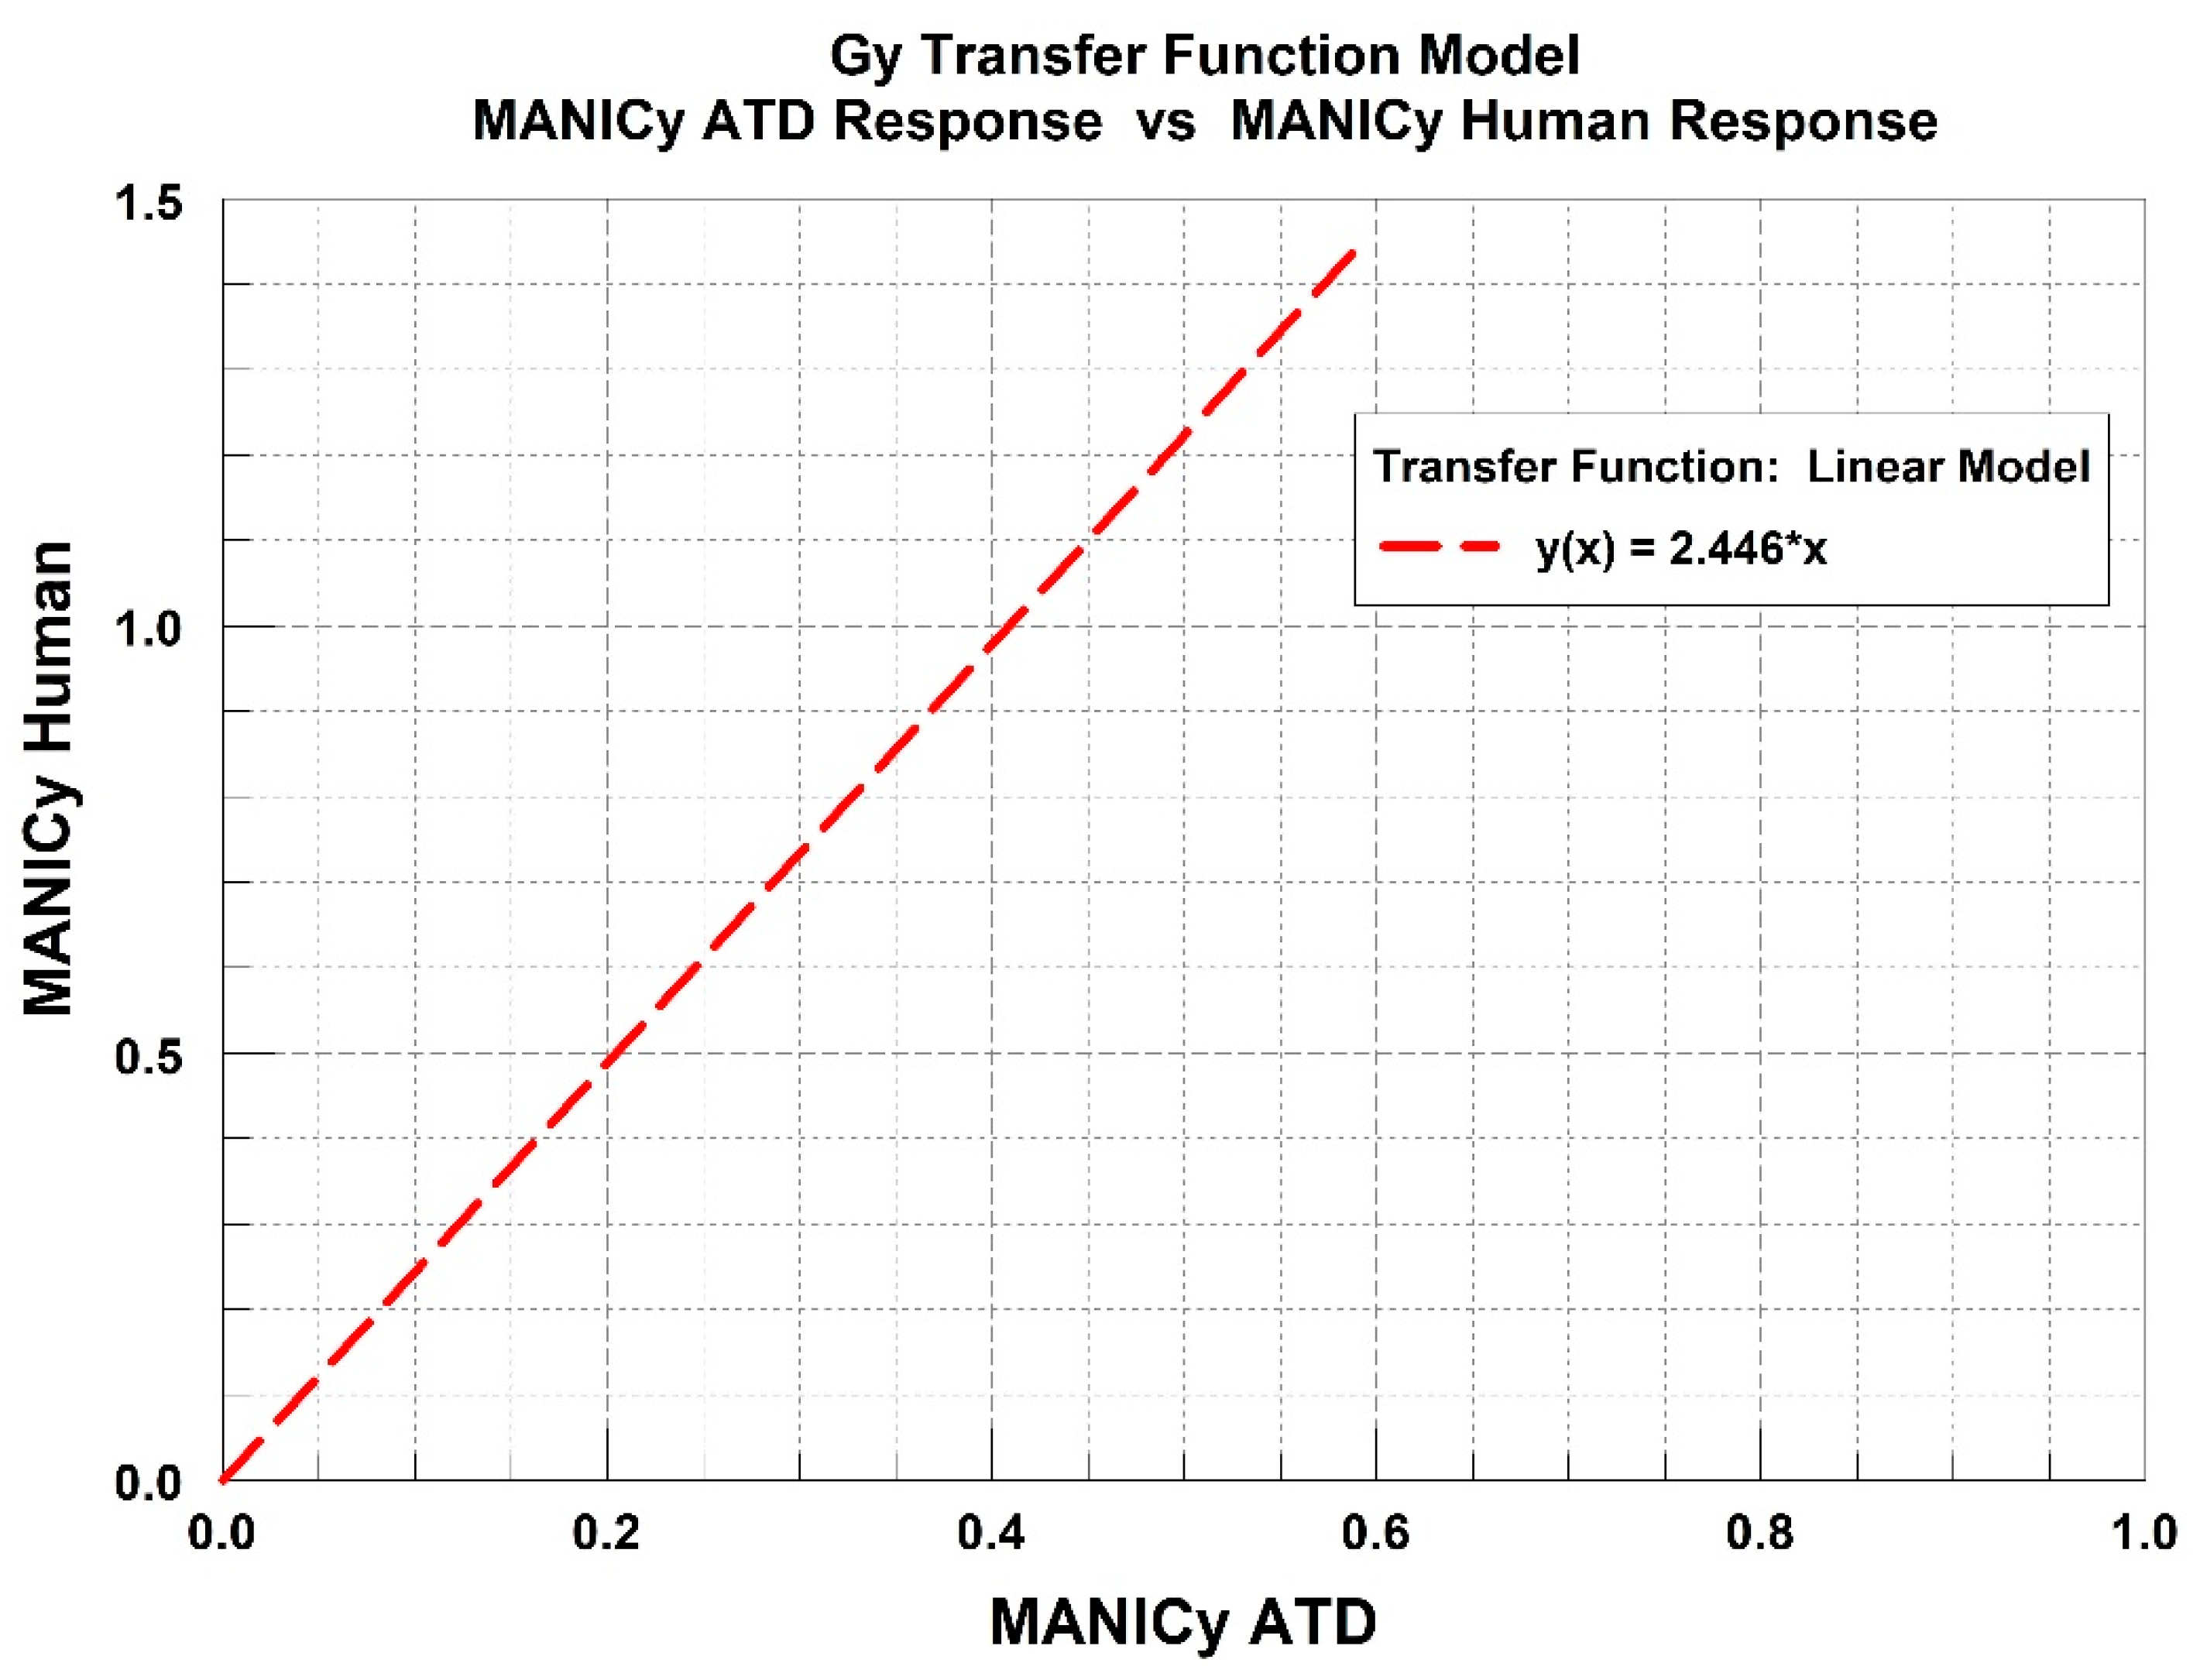
Data points from each model were found as a function of the acceleration level from 5 G to 17 G in one-G increments. The resulting data sets were plotted against one another in order to calculate an estimated human MANICy as a function of the calculated ATD MANICy from a lateral impact. The regression model is shown in Figure 12, which address Items 4 and 5 in the approach.
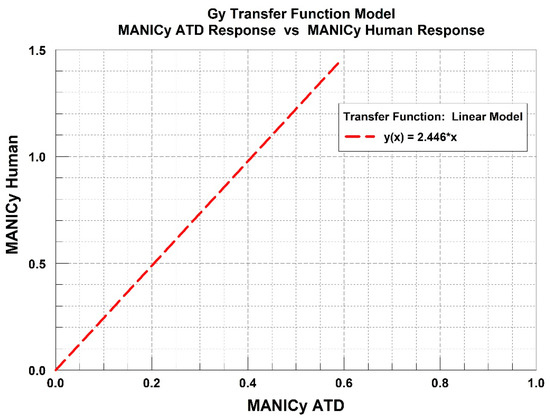
Figure 12.
Transfer function relating ATD MANICy to the human MANICy. Transfer function is a linear regression model created with ATD MANICy and Human MANICy data generated from the ATD and Human linear regression models (Figure 11) as a function of selected impact acceleration values For example, at around 10 G, the ATD MANICy is 0.2, and the Human MANICy is 0.5, and the data are plotted against each other.
The current data sets and regression models indicate that an estimated Human MANICy was obtained by applying a correction factor of 2.446 to the calculated ATD MANICy. This correction factor increased the current ATD MANICy values, which are all below 5% risk, to values that estimate a 20% probability of injury or greater for those test configurations which had an AIS 2 or greater injury for the corresponding PMHS testing (with the exception of one test). The increase in the MANICy value is what would be desired taking into account the variability of the PMHS data sets. It is also interesting to note that the estimated ATD MANICy at 5 G is approximately 0.1, and the predicted human/PMHS MANICy value would be 0.25, which is close to calculated human MANICy values which ranged from 0.18 to 0.26 in lateral human impact tests.
4. Summary and Conclusions
Research was conducted involving a series of impact tests on a horizontal sled in a lateral impact orientation as part of a collaboration between AFIT and the 711th Human Performance Wing under AFRL. The purpose of the tests was to conduct an assessment of the biodynamic response of a 50th male Hybrid III aerospace ATD addressing previously documented gaps in lateral ATD response data at impact configurations with existing human and PMHS lateral impact response data. Test data was analyzed to compare the ATD response as a function of the seat configurations and the impact acceleration level and was also analyzed to support the development of AFRL neck injury criteria. The lateral impact response of the ATD provided critical impact data to support the development of preliminary transfer function for AFRL’s Multi-Axial Neck Injury Criteria (MANIC) for lateral impact or MANICy calculation. The preliminary transfer function relates the calculated MANICy value for ATDs to a predicted MANICy value for humans. The lateral seat configurations consisted of either a seat with rigid side panels with a 5-point restraint harness, or a seat with padded side panels with a 3-point restraint harness.
The greater number of impact tests were conducted with the rigid seat configuration, and the data indicated the following:
- The assessed parameters generated fairly linear responses from the 8.5 to the 17 G input acceleration range.
- The responses had generally small standard deviations, and the head Rx angular velocity and the neck Mx torque were the dominant acceleration/velocity and force responses respectively.
- Data indicate that as the acceleration input increased beyond 10.5 G, the primary linear acceleration and force responses shift from the y-axis to the z-axis.
- The risk of neck injury based on MANICy exceeded the AFRL 5% risk limit at all the acceleration inputs based on the correction factor applied to the ATD MANICy value.
- The inclusion of a helmet increased the neck loads and torques which subsequently increased the probability of neck injury by 16% based on the ATD MANICy.
There were only three input accelerations (8.5, 10.5, 12.5 G) for the tests conducted with the padded seat configuration and the data indicates the following:
- The assessed head acceleration, head rotational velocity, and neck load and torque generated fairly linear responses over the assessed input acceleration range, which was similar to the rigid seat configuration; however, the responses had larger standard deviations than what was observed with the rigid seat.
- The head Rx angular velocity was still a dominant response parameter, and with the padded seat, the neck Mx torque was still the dominant torque over the head My and Mz torques.
- The z-axis accelerations and forces were greater than the y-axis shear forces at all the input accelerations, which was not observed with the rigid seat configuration.
- The risk of neck injury based on MANICy exceed the AFRL 5% risk limit at all the tested accelerations based on the correction factor applied to the ATD MANICy value, which was similar to the rigid seat.
A comparison of the ATD’s impact response with the rigid seat configuration versus the padded seat configuration was completed using four response parameters and the data indicated the following:
- The ATD’s response with the padded seat and the 3-point restraint generated greater head motion than the ATD’s response with the rigid seat and the 5-point restraint.
- This highlights the importance of integrating a proper restraint into a seat configuration to control both the motion of the torso and the head.
The successful completion of this recent lateral testing of an ATD provided critical impact data to fill data gaps and continue the development of the MANICy neck injury criteria. Initial calculations of the ATD MANICy and the associated injury risk compared to that shown for human MANICy values highlighte the requirement for a transfer function. The transfer function between an ATD MANICy and a human MANICy would allow the calculation of an injury risk using a probability of injury function based on human and PMHS data sets. The data from this study indicate that the Mx torque was a dominate torque response from the ATD during the lateral impacts. The current MANICy calculation is a five-factor MANICy calculation and does not include Mx torque because it could not be properly calculated for the human subjects due to limited head angular accelerations that were collected during the test program; therefore, the current probability of injury calculation is based on the five-factor MANICy.
Since the Mx torque was the dominant response for the ATD data sets in both seat and restraint configurations, this highlights the need for additional human lateral impact research to collect sufficient head angular rate and acceleration terms to allow the calculation of Mx, My, and Mz torques. These additional data sets would then allow further investigation into including the Mx torque in the MANICy calculations and allow the development of a six-factor MANICy or MANICy-6F injury criteria. A comparison would then need to be completed to determine whether the current MANICy calculation or a new MANICy_6F calculation provide a better estimation of the probability of injury during lateral impact. The additional data will also be used to support the continuing development of the critical ATD-to-human transfer functions for the MANIC neck injury calculations, which will provide the best estimate of neck injury for the assessment of escape systems and helmet configurations. The data will also be used to support the continuing development of computational models of ATD biodynamic response both in-house and through collaboration with external organizations.
In addition to the analysis of the recorded ATD acceleration and neck load for the development of the MANIC injury criteria, future research could also focus on evaluating high speed video data from the respective tests described within this manuscript and comparing the variation in head and neck displacement between ATD and PMHS/Human Subject responses. Understanding the displacement information from the video can provide additional validation in observed differences in motion about certain linear and rotational directions, in addition to overall variances in body motion between test subjects, PMHS, and ATD under similar loading conditions and/or within different seat structures (i.e., rigid vs. padded seats).
Author Contributions
Research conceptualization, C.P. (Chris Perry) and J.B.; Methodology, C.P. (Chris Perry) and J.B.; Investigation, C.P. (Chris Perry) and J.B.; Software and Data Processing, C.P. (Casey Pirnstill); Formal analysis, C.P. (Chris Perry), J.B., and C.P. (Casey Pirnstill); Writing—original draft preparation, C.P. (Chris Perry); Writing—review and editing, J.B., C.P. (Casey Pirnstill) and J.M.; Project Administration, J.B. and J.M.
Funding
This research was completed using internal Air Force Research Laboratory funds.
Conflicts of Interest
The authors declare no conflict of interest.
References
- Stech, E.L.; Payne, P.R. Dynamic Models of the Human Body, Aerospace Medical Research Laboratory Report No. AMRL-TR-66-157; Wright-Patterson Air Force Base: Dayton, OH, USA, 1969. [Google Scholar]
- Brinkley, J.W.; Shaffer, J.T. Dynamic Simulation Techniques for the Design of Escape Systems: Current Applications and Future Air Force Requirements; Aerospace Medical Research Laboratory Symposium on Biodynamic Models and Their Applications, Report No. AMRL-TR-71-29; Wright-Patterson Air Force Base: Dayton, OH, USA, 1970. [Google Scholar]
- Buhrman, J.R.; Perry, C.E. Human and Manikin Head/Neck Response to +Gz Acceleration When Encumbered by Helmets of Various Weights. Aviat. Space Environ. Med. 1994, 65, 1086–1090. [Google Scholar] [PubMed]
- Perry, C.; Buhrman, J. Effect of Helmet Intertial Properties on Head and Neck Response During +Gz Impact Accelerations. J. Gravit. Physiol. 1995, 2, 88–92. [Google Scholar]
- Perry, C.; Buhrman, J. Effect of Helmet Inertial Properties on the Biodynamics of the Head and Neck During +Gz Impact Accelerations. Safe J. 1996, 26, 34–41. [Google Scholar]
- Perry, C. The Effect of Helmet Inertial Properties on Male and Female Head Response During +Gz Impact Accelerations. Safe J. 1998, 28, 32–38. [Google Scholar]
- Perry, C.; Buhrman, J.; Doczy, E.; Mosher, S. The Effects of Variable Helmet Weight on Head Response and Neck Loading During Lateral +Gy Impact. In Proceedings of the 41st Annual SAFE Symposium, Jacksonville, FL, USA, 22–24 September 2003. [Google Scholar]
- Doczy, E.; Mosher, S.; Buhrman, J. The Effects of Variable Helmet Weight and Subject Bracing on Neck Loading During Frontal -Gx Impact. In Proceedings of the 42nd Annual SAFE Symposium, Salt Lake City, UT, USA, 27–29 September 2004. [Google Scholar]
- Carter, L.A.; Pellettiere, J.A.; Perry, C.E.; Wilson, D. Tensile Neck Injury Criterion Development. In Proceedings of the SAFE Association 38th Annual Symposium Proceedings, Reno, NV, USA, 9–11 October 2000. [Google Scholar]
- Eppinger, R.; Sun, E.; Bandak, F.; Haffner, M.; Khaewpong, N. Development of Improved Injury Criteria for the Assessment of Advanced Automotive Restraint Systems—II; NHTSA: Washington, DC, USA, 1999.
- Eppinger, R.; Sun, E.; Kuppa, S.; Saul, R. Supplement: Development of Improved Injury Criteria for the Assessment of Advanced Automotive Restraint Systems—II; NHTSA: Washington, DC, USA, 2000.
- Parr, J.C.; Miller, M.E.; Pellettiere, J.A.; Erich, R.A. Neck Injury Criteria Formulation and Injury Risk Curves for the Ejection Environment: A Pilot Study. Aviat. Space Environ. Med. 2013, 84, 1240–1248. [Google Scholar] [CrossRef] [PubMed]
- Parr, J.C. A Method to Develop Neck Injury Criteria to Aid Design and Test of Escape Systems Incorporting Helmet Mounted Displays; AFIT/DS/ENV/1401; USAF Air Force Institute of Technology Dissertation, Wright-Patterson AFB: Dayton, OH, USA, 2014. [Google Scholar]
- Parr, J.C.; Miller, M.E.; Kabban, C.M.; Pellettiere, J.A.; Perry, C.E. Development of an Updated Tensile Neck Injury Criteria. Aviat. Space Environ. Med. 2014, 85, 1026–1032. [Google Scholar] [CrossRef] [PubMed]
- Zinck, C.; Parr, J.; Miller, M.; Perry, C.E. Comparison of Human and ATD Neck Response to Frontal Impact (-Gx) Acceleration. In Proceedings of the 2016 Industrial and Systems Engineering Research Conference, Disneyland Resort Hotel, Anaheim, CA, USA, 21–24 May 2016. [Google Scholar]
- Pellettiere, J.A. Injury Criteria Development Methodology. In Proceedings of the 50th Annual SAFE Symposium, Reno, NV, USA, 22–24 October 2012. [Google Scholar]
- Shaffer, J.T. The Impulse Accelerator: An Impact Sled Facility for Human Research and Safety Systems Testing; USAF Technical Report: AMRL-TR-76-08; Biodynamics and Bionics Division, Aerospace Medical Research Laboratory, Aerospace Medical Division, Air Force Systems Command; Wright-Patterson AFB: Dayton, OH, USA, 1976. [Google Scholar]
- Strzelecki, J.P. Characterization of Horizontal Impulse Accelerator Pin Profiles; USAF Technical Report: AFRL-HE-WP-SR-2006-0057; Wright-Patterson AFB: Dayton, OH, USA, 2006. [Google Scholar]
- Philippens, M.; Forbes, P.; Wismans, J.; DeWesse, R.; Moorcroft, D. Neck Injury Criteria for Side-Facing Aircraft Seats; Department of Transportationa and Federal Aviation Administration Technical Report: DOT/FAA/AR-09/41; United States Department of Transportation, Federal Aviation Administration, Air Traffic Organization NextGen & Operations Planning, Office of Research and Technology Development: Washington, DC, USA, 2011.
© 2019 by the authors. Licensee MDPI, Basel, Switzerland. This article is an open access article distributed under the terms and conditions of the Creative Commons Attribution (CC BY) license (http://creativecommons.org/licenses/by/4.0/).

