
Biomimetic Orthopedic Footwear Advanced Insole Materials to Be Used in Medical Casts for Weight-Bearing Monitoring


Abstract
:1. Introduction
- Moderately deformable materials have the best durability and shock attenuation properties [4,5,6]. Additionally, Poron® and Plastazote® (both moderately deformable materials according to Campbell’s methodology) were found to significantly reduce peak pressure in biomechanical studies by Tong et al. (2010) [7] and Birke et al. (1999) [8].
- In the majority of research studies [3,9,10,11,12,13], PU open cell foams and PU elastomers are claimed as superior in pressure attenuation in comparison to closed cell foams, latex, felt and leather. Slobodinyuk et al. (2023) developed an efficient method for synthesizing amino-terminated oligotetramethylene oxides. The resulting products can be used as hardeners for oligomers with terminal epoxy groups synthesized from cyclic and cycloaliphatic diisocyanates [14]. These elastomers showed excellent shape memory, demonstrated by significantly high shape fixity and shape recovery ratios. Furthermore, it has a self-healing ability, which was demonstrated using the coating based on the developed polymers [14].
- Low-density materials tend to be less durable and have worse weight-bearing properties. Rome et al. (1991) determined that the mean density, 0.333 g/cm3 and hardness Shore A 32–35 is sufficient to prevent the material from quickly deforming, while on the other hand, not being too stiff [9]. Birke et al. (1999) suggested Poron® materials of hardness Shore A 15–25 for the fabrication of orthotics for patients with diabetes [8]. Healy et al. (2012) reported PU foam Shore A 35 and 55, with the latter being best at significantly decreasing plantar pressure [11]. However, the review did not analyze factors that contribute to shock-absorbing performance. Certainly, it is challenging to find the link between mechanical characteristics and in-shoe performance because some parameters are impossible to simulate. However, specific standards currently exist in the footwear industry, for instance, Shoe and Allied Trades Research Association (SATRA), UK, has established a list of value ranges that correspond to a quality shock absorber. As it follows, parameter values for Poron® materials are close to the optimal values developed by SATRA Technology Center [15]. Therefore, targeted characteristics that should be tailored for the quality performance of insole devices resemble properties of commercially available Poron®.
2. Materials and Methods
2.1. Materials
2.2. Preparation of PUFs
2.2.1. Synthesis of Pre-Polymer
2.2.2. Synthesis of PUF
2.3. Design of Experiments
2.4. Characterization
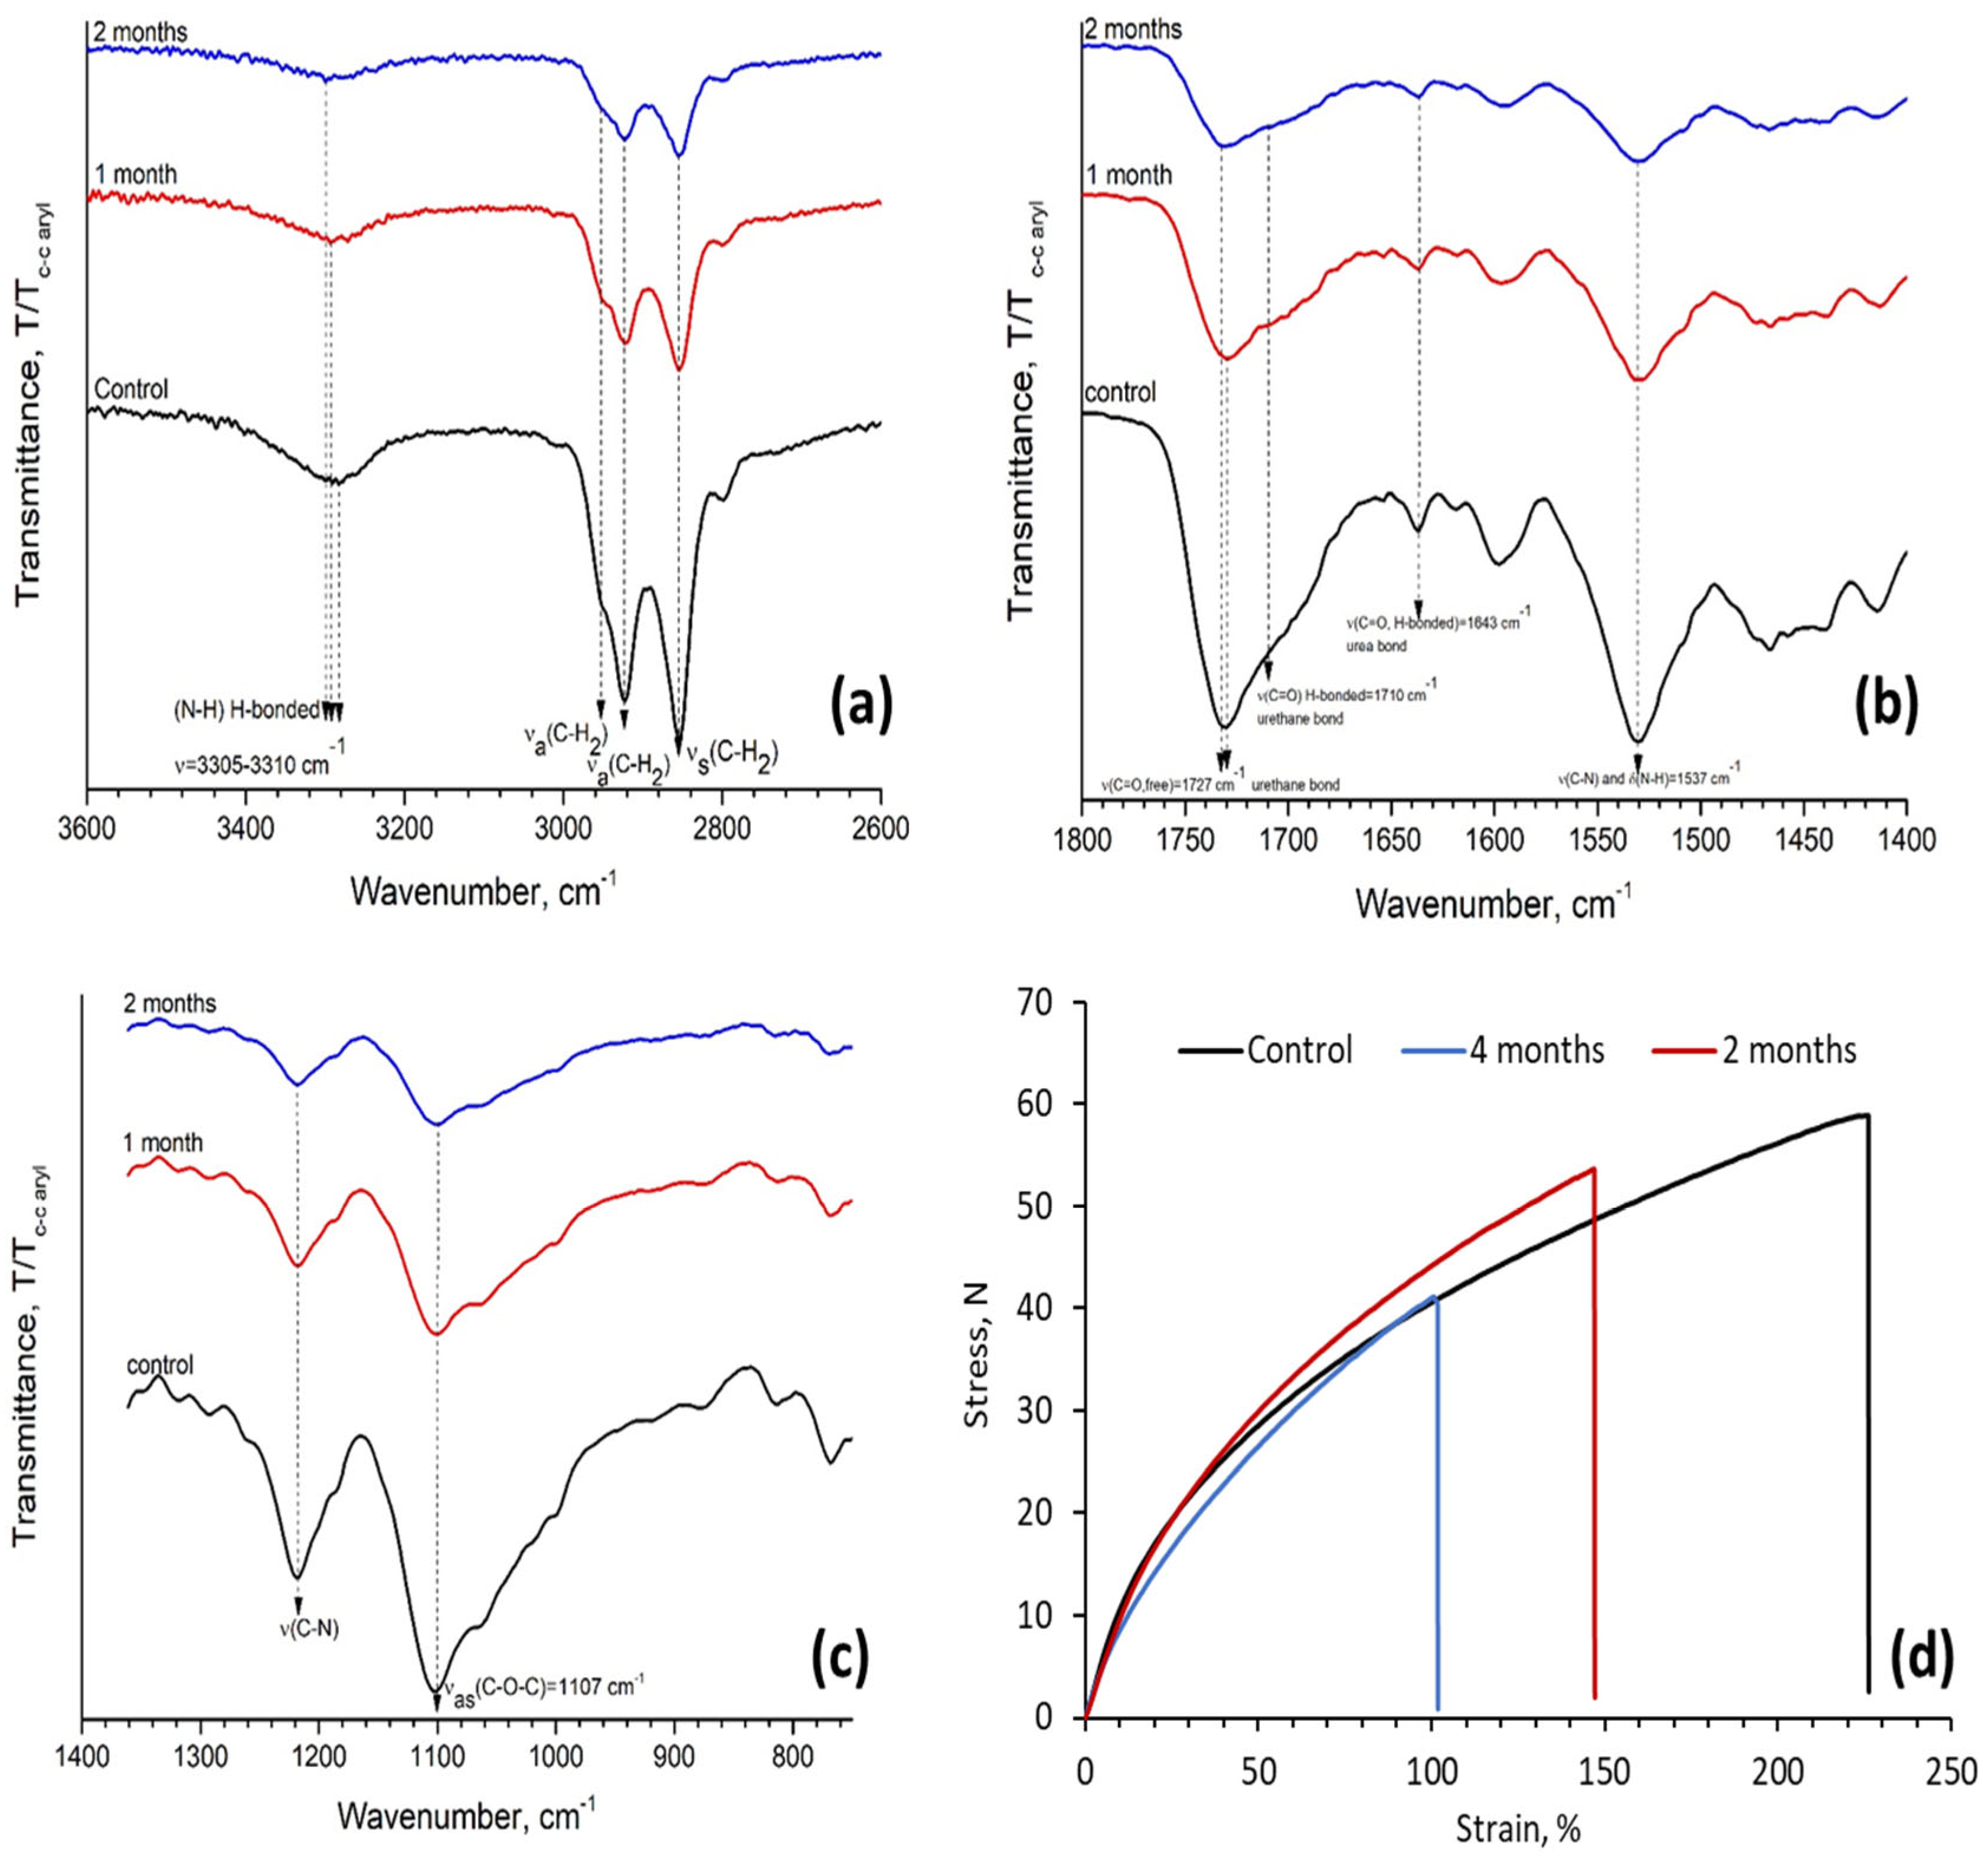
2.4.1. Fourier-Transform Infrared Spectroscopy
2.4.2. Mechanical Testing
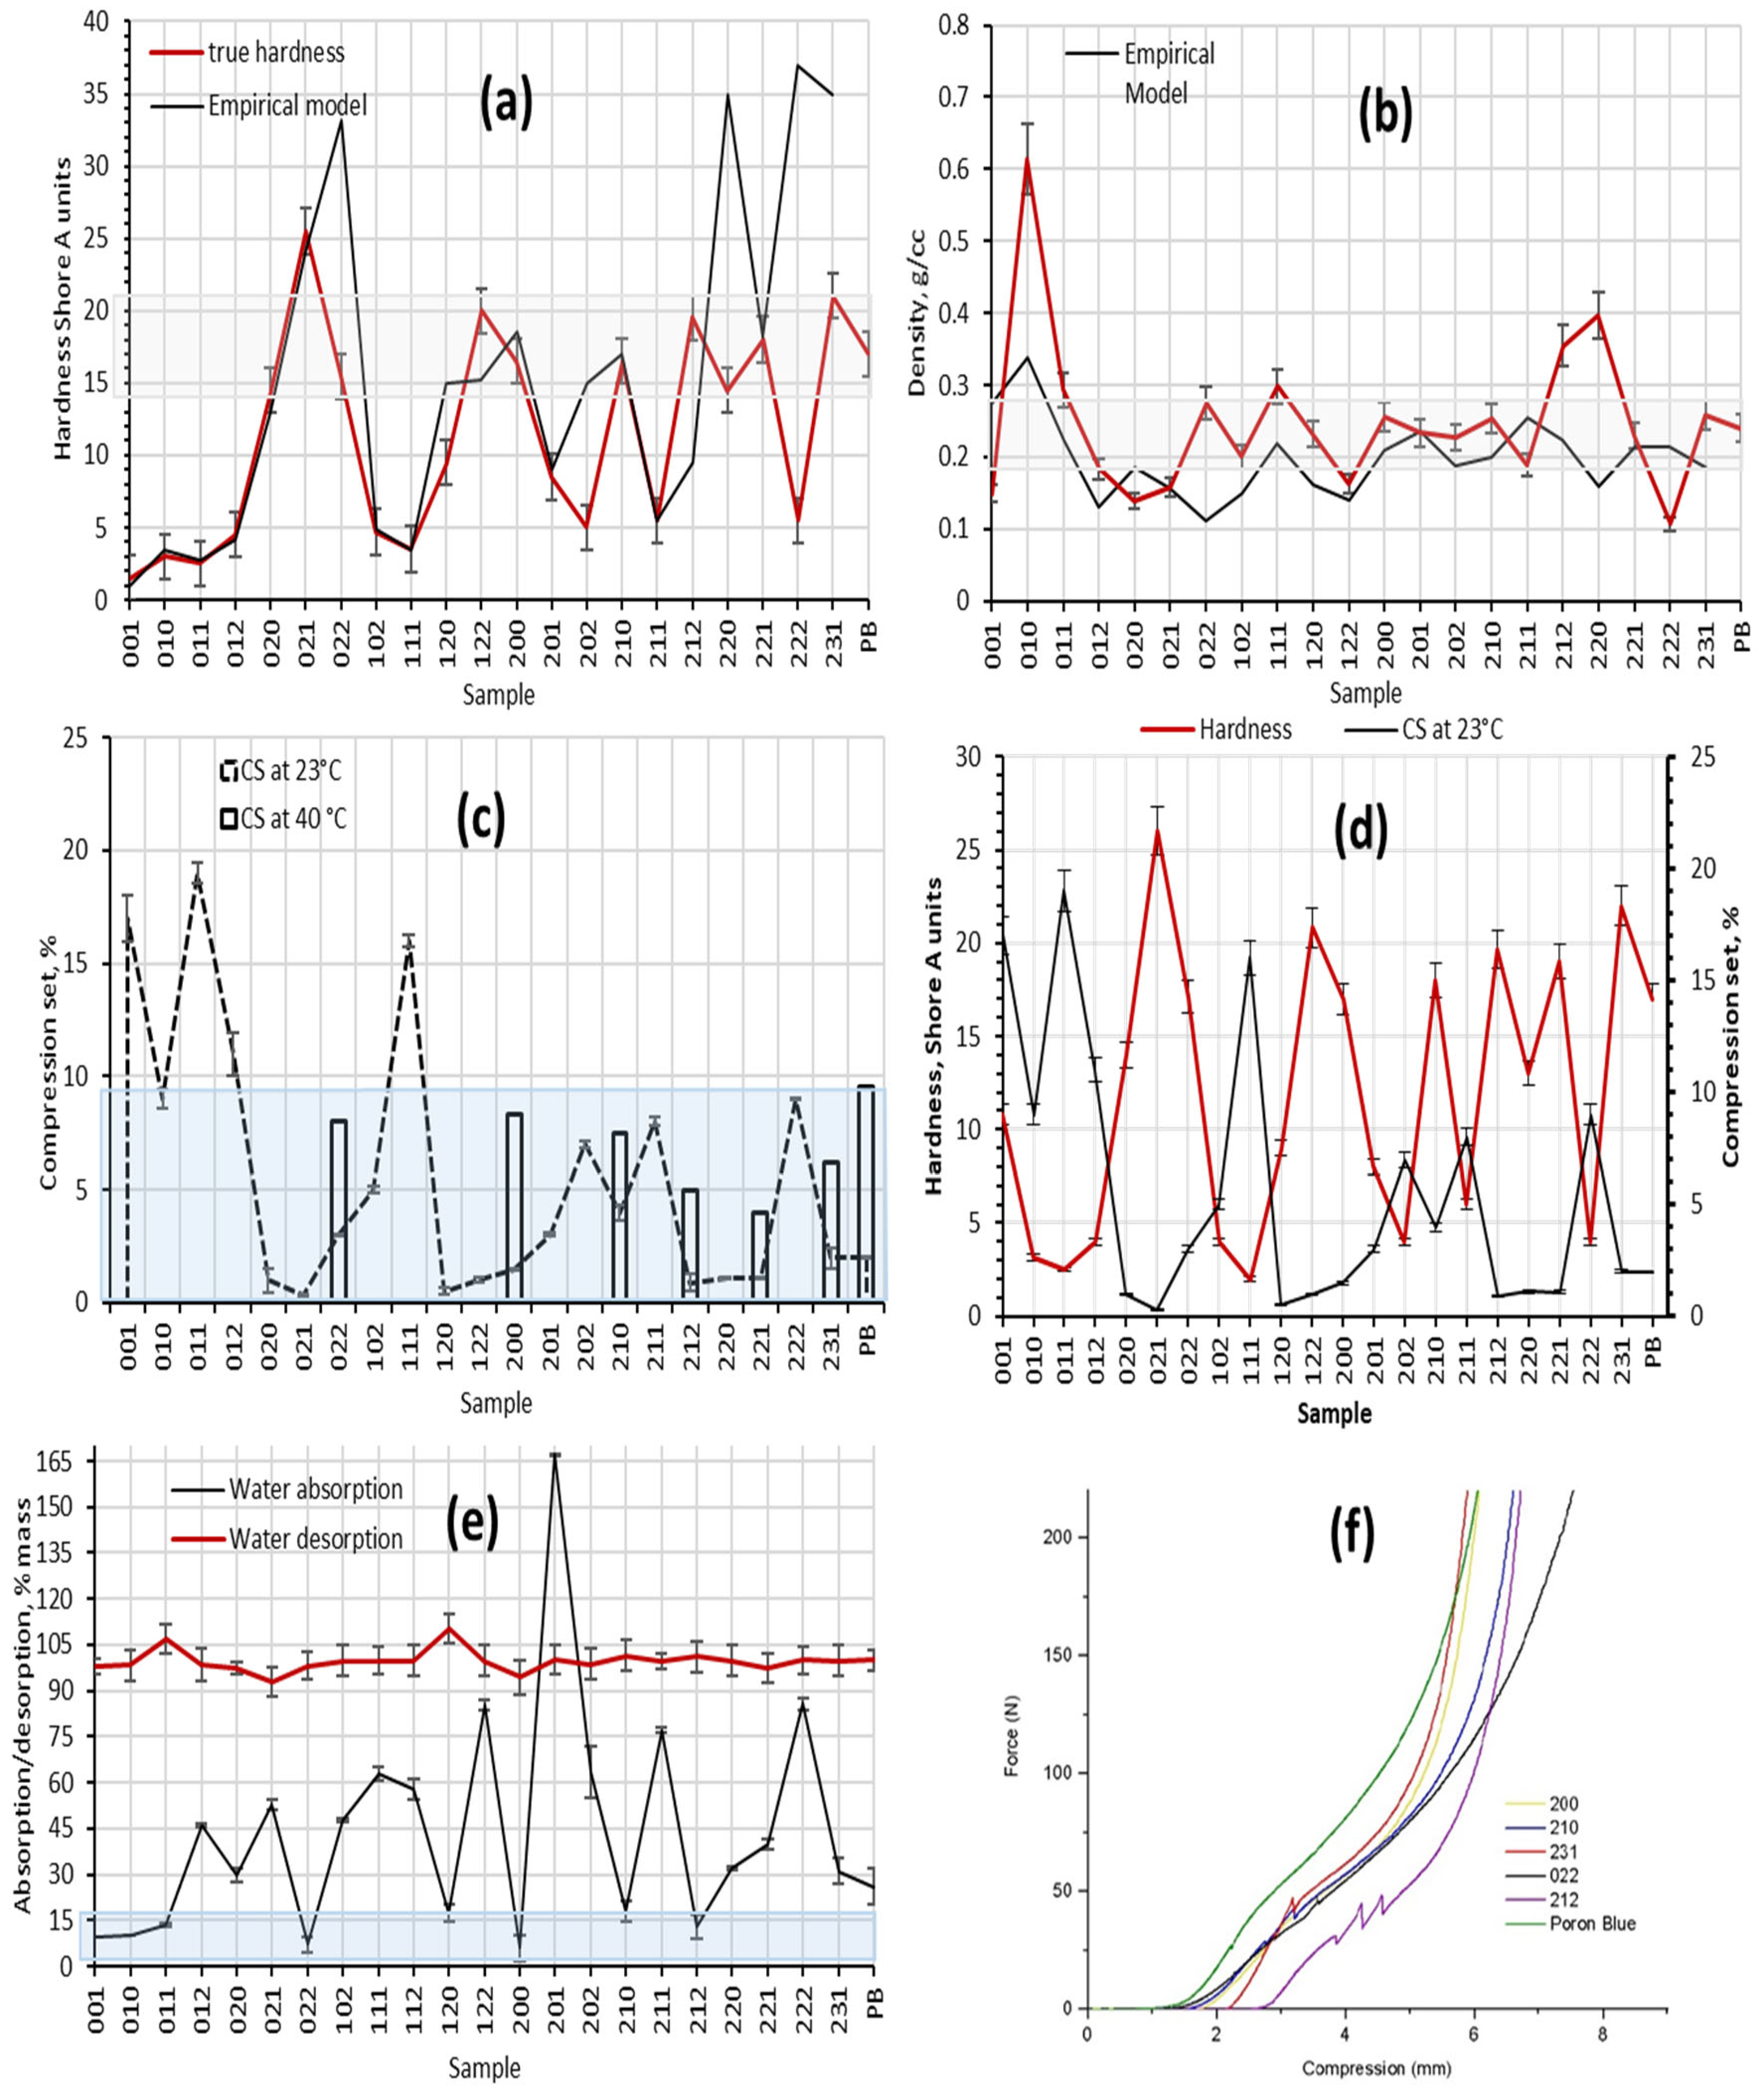
Hardness
Density of Insoles
Compression Set
Water Absorption and Desorption Properties of Insole Materials
Tensile Properties of Insole Materials
Cushioning Properties of Insole Materials
2.4.3. Differential Scanning Calorimetry
2.4.4. Biodegradation Test using Soil Burial Method
2.4.5. Optical Microscopy Characterization
2.4.6. Scanning Electron Microscopy Characterization
3. Results and Discussion
3.1. Polymerization Reaction Conditions
3.2. Design of Experiments
3.3. Mechanical and Physical Testing
3.4. Cushioning Properties
3.5. DSC Analysis
3.6. Anaerobic Soil Biodegradation
4. Conclusions
Author Contributions
Funding
Institutional Review Board Statement
Informed Consent Statement
Data Availability Statement
Acknowledgments
Conflicts of Interest
References
- North, K.; Maass, S.D.; Hitchcock, R.W. An Insole Sensor for Recording Weight Bearing Behavior during Tibial Fracture Rehabilitation. In Proceedings of the 2010 Annual International Conference of the IEEE Engineering in Medicine and Biology Society, EMBC’10, Buenos Aires, Argentina, 31 August–4 September 2010; pp. 1856–1859. [Google Scholar]
- Sensitronics. FSR 101 Force Sensing Resistor Theory and Applications. Available online: https://www.sensitronics.com/pdf/Sensitronics_FSR_101.pdf (accessed on 28 March 2023).
- Shariatmadari, M.R.; English, R.; Rothwell, G. Effects of temperature on the material characteristics of midsole and insole footwear foams subject to quasi-static compressive and shear force loading. Mater. Des. 2012, 37, 543–559. [Google Scholar] [CrossRef]
- Campbell, G.J.; McLure, M.; Newell, E.N. Compressive behavior after simulated service conditions of some foamed materials intended as orthotic shoe insoles. J. Rehabil. Res. Dev. 1984, 21, 57–65. [Google Scholar] [PubMed]
- Leber, C.; Evanski, P.M. A comparison of shoe insole materials in plantar pressure relief. Prosthet. Orthot. Int. 1986, 10, 135–138. [Google Scholar] [CrossRef] [PubMed] [Green Version]
- Campbell, G.; Newell, E.; McLure, M. Compression testing of foamed plastics and rubbers for use as orthotic shoe insoles. Prosthet. Orthot. Int. 1982, 6, 48–52. [Google Scholar] [CrossRef] [Green Version]
- Tong, J.W.; Ng, E.Y. Preliminary Investigation on the Reduction of Plantar Loading Pressure with Different Insole Materials (SRP—Slow Recovery Poron®, P—Poron®, PPF—Poron®+Plastazote, Firm and PPS—Poron®+Plastazote, Soft). Foot 2010, 20, 1–6. [Google Scholar] [CrossRef]
- Birke, J.A.; Foto, J.G.; Pfiefer, L.A. Effect of Orthosis Material Hardness on Walking pressure in High-Risk Diabetes Patients. J. Prosthet. Orthot. 1999, 11, 43–46. [Google Scholar] [CrossRef]
- Rome, K. A Study of the Properties of Materials Used in Podiatry. J. Am. Podiatr. Med. Assoc. 1991, 81, 73–83. [Google Scholar] [CrossRef]
- Faulí, A.C.; Andrés, C.L.; Rosas, N.P.; Fernández, M.J.; Parreño, E.M.; Barceló, C.O. Physical Evaluation of Insole Materials Used to Treat the Diabetic Foot. J. Am. Podiatr. Med. Assoc. 2008, 98, 229–238. [Google Scholar] [CrossRef]
- Healy, A.; Dunning, D.N.; Chockalingam, N. Effect of insole material on lower limb kinematics and plantar pressures during treadmill walking. Prosthet. Orthot. Int. 2012, 36, 53–62. [Google Scholar] [CrossRef]
- Paton, J.; Jones, R.B.; Stenhouse, E.; Bruce, G. The Physical Characteristics of Materials Used in the Manufacture of Orthoses for Patients with Diabetes. Foot Ankle Int. 2007, 28, 1057–1063. [Google Scholar] [CrossRef]
- Pratt, D.J.; Rees, P.H.; Rodgers, C. Technical Note: Assessment of Some Shock Absorbing Insoles. Prosthet. Orthot. Int. 1986, 10, 43–45. [Google Scholar] [CrossRef] [PubMed] [Green Version]
- Slobodinyuk, D.; Slobodinyuk, A.; Strelnikov, V.; Kiselkov, D. Simple and Efficient Synthesis of Oligoetherdiamines: Hardeners of Epoxyurethane Oligomers for Obtaining Coatings with Shape Memory Effect. Polymers 2023, 15, 2450. [Google Scholar] [CrossRef] [PubMed]
- Equipment Used for Comfort Testing. SATRA Bulletin. Available online: https://www.satra.com/bulletin/article.php?id=1407 (accessed on 5 April 2023).
- Ugarte, L.; Saralegi, A.; Fernández, R.; Martín, L.; Corcuera, M.A.; Eceiza, A. Eceiza. Flexible Polyurethane Foams Based on 100% Renewably Sourced Polyols. Ind. Crops Prod. 2015, 62, 545–551. [Google Scholar] [CrossRef] [Green Version]
- Ionescu, M. Synthesis of High Molecular Weight Polyether Polyols with Double Metal Cyanide Catalysts (DMC Catalysts). Chem. Technol. Polyols Polyurethanes 2005, 1, 167–184. [Google Scholar] [CrossRef] [Green Version]
- Prociak, A.; Malewska, E.; Kurańska, M.; Bąk, S.; Budny, P. Flexible polyurethane foams synthesized with palm oil-based bio-polyols obtained with the use of different oxirane ring opener. Ind. Crops Prod. 2018, 115, 69–77. [Google Scholar] [CrossRef]
- Cangemi, J.M.; dos Santos, A.M.; Neto, S.C.; Chierice, G.O. Biodegradation of polyurethane derived from castor oil. Polímeros 2008, 18, 201–206. [Google Scholar] [CrossRef]
- Ogunfeyitimi, O.; Okewale, A.; Igbokwe, P. The Use of Castor Oil as a Reactive Monomer in Synthesis of Flexible Polyurethane Foam. Int. J. Multidiscip. Sci. Eng. 2012, 3, 10–14. [Google Scholar]
- Gnanasundaram, S.; Kannan, S.; Ranganathan, M.; Das, B.N.; Mandal, A.B. Preparation and Characterization of Footwear Soling Materials Based on Biodegradable Polyurethane. Polym. Technol. Eng. 2015, 54, 1585–1595. [Google Scholar] [CrossRef]
- Li, H.; Mahmood, N.; Ma, Z.; Zhu, M.; Wang, J.; Zheng, J.; Yuan, Z.; Wei, Q.; Xu, C. Preparation and characterization of bio-polyol and bio-based flexible polyurethane foams from fast pyrolysis of wheat straw. Ind. Crops Prod. 2017, 103, 64–72. [Google Scholar] [CrossRef]
- Hepburn, C. Polyurethane Elastomers, 2nd ed.; Edition, S., Ed.; Elsevier Applied Science: London, UK, 2012. [Google Scholar]
- Gama, N.V.; Soares, B.; Freire, C.S.; Silva, R.; Neto, C.P.; Barros-Timmons, A.; Ferreira, A. Bio-based polyurethane foams toward applications beyond thermal insulation. Mater. Des. 2015, 76, 77–85. [Google Scholar] [CrossRef]
- Szycher, M. Szycher’s Handbook of Polyurethanes, 2nd ed.; Taylor and Francis Group: Roca Raton, FL, USA, 2013. [Google Scholar]
- Wang, C.; Zheng, Y.; Xie, Y.; Qiao, K.; Sun, Y.; Yue, L. Synthesis of bio-castor oil polyurethane flexible foams and the influence of biotic component on their performance. J. Polym. Res. 2015, 22, 1–9. [Google Scholar] [CrossRef]


| Role | Chemicals | Structure | M a [g/mol] | Physical State at Tambient | b [°C] | Density [g/cm3] | Fn c |
|---|---|---|---|---|---|---|---|
| Isocyanate | TDI | 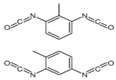 | 174.2 | Clear liquid | 20–22 | 1.225 | 2 |
| Macrodiol | PO3G |  | 1043 | Waxy solid | 21.5 | 1.161 | 2 |
| Crosslinker/ Chain extender | CO | 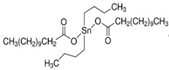 | 900 | Viscous liquid | −18 | 9.61 | 2.7 |
| Gelling catalyst | DBTDL | 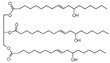 | 632 | Clear liquid | 10 | 1.066 | - |
| Blowing catalyst | DABCO-33LV |  | 112.76 | Clear liquid | - | 1.2 | 2 |
| Surfactant | NIAX L-580 | 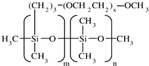 | - | Viscous liquid | <0 | 1.030 | - |
| Run Order | Point Type | Blocks | Factors | Response Variable #1 | Response Variable #2 | ||
|---|---|---|---|---|---|---|---|
| P | I | W | Density | Hardness | |||
| 1 | 2 | 1 | −1 | −1 | 0 | 0.2522 | 1.5 |
| 2 | 2 | 1 | −1 | 0 | 1 | 0.1834 | 2.5 |
| 3 | 2 | 1 | −1 | 0 | −1 | 0.6148 | 3.5 |
| 4 | 2 | 1 | 0 | −1 | 1 | 0.1890 | 4.0 |
| 5 | 2 | 1 | 1 | −1 | 0 | 0.2339 | 6.0 |
| 6 | 2 | 1 | −1 | 1 | 0 | 0.1585 | 19.5 |
| 7 | 2 | 1 | 0 | −1 | −1 | 0.7665 | 3.0 |
| 8 | 2 | 1 | 0 | 1 | −1 | 0.2319 | 9.0 |
| 9 | 2 | 1 | 1 | 0 | −1 | 0.2542 | 18.5 |
| 10 | 0 | 1 | 0 | 0 | 0 | 0.2579 | 2.5 |
| 11 | 2 | 1 | 1 | 1 | 0 | 0.2303 | 19.0 |
| 12 | 2 | 1 | 0 | 1 | 1 | 0.1629 | 16.5 |
| 13 | 0 | 1 | 0 | 0 | 0 | 0.2751 | 2.0 |
| 14 | 0 | 1 | 0 | 0 | 0 | 0.2574 | 2.9 |
| 15 | 2 | 1 | 1 | 0 | 1 | 0.394494 | 8.5 |
| Regime | Cream Time [s] | Rise Time [s] | Gel Time [min] | Tack-Free Time [min] |
|---|---|---|---|---|
| A | 296 ± 26 | 618 ± 29 | 42 ± 2 | 596 ± 8 |
| B | 43 ± 6 | 182 ± 12 | 6.33 ± 1 | 53.3 ± 6 |
| C | 13 ± 3 | 26 ± 2 | 19.3 ± 3 | 153 ± 14 |
| D | 10 ± 2 | 9 ± 1 | 1.5 ± 0.5 | 18 ± 5 |
| Source | DF | Adj. SS | Adj. MS | F-Value | p-Value |
|---|---|---|---|---|---|
| Model | 9 | 0.488857 | 0.054317 | 7.31 | 0.021 |
| Linear | 3 | 0.331741 | 0.110580 | 14.89 | 0.006 |
| P | 1 | 0.131139 | 0.131139 | 17.66 | 0.008 |
| I | 1 | 0.200569 | 0.200569 | 27.00 | 0.003 |
| W | 1 | 0.000034 | 0.000034 | 0.00 | 0.949 |
| Square | 3 | 0.114418 | 0.038139 | 5.13 | 0.055 |
| P × P | 1 | 0.034681 | 0.034681 | 4.67 | 0.083 |
| I × I | 1 | 0.057868 | 0.057868 | 7.79 | 0.038 |
| W × W | 1 | 0.039061 | 0.039061 | 5.26 | 0.070 |
| 2-Way Interaction | 3 | 0.042698 | 0.014233 | 1.92 | 0.245 |
| P × I | 1 | 0.042273 | 0.042273 | 5.69 | 0.063 |
| P × W | 1 | 0.000401 | 0.000401 | 0.05 | 0.825 |
| I × W | 1 | 0.000024 | 0.000024 | 0.00 | 0.957 |
| Error | 5 | 0.037138 | 0.007428 | ||
| Lack-of-Fit | 3 | 0.029807 | 0.009936 | 2.71 | 0.281 |
| Pure Error | 2 | 0.007331 | 0.003665 | ||
| Total | 14 | 0.525995 |
| Source | DF | Adj. SS | Adj. MS | F-Value | p-Value |
|---|---|---|---|---|---|
| Model | 9 | 27.4443 | 3.0494 | 4.74 | 0.051 |
| Linear | 3 | 14.0312 | 4.6771 | 7.27 | 0.028 |
| P | 1 | 0.6424 | 0.6424 | 1.00 | 0.364 |
| I | 1 | 4.9058 | 4.9058 | 7.63 | 0.040 |
| W | 1 | 8.4830 | 8.4830 | 13.19 | 0.015 |
| Square | 3 | 4.1268 | 1.3756 | 2.14 | 0.214 |
| P × P | 1 | 0.4586 | 0.4586 | 0.71 | 0.437 |
| I × I | 1 | 1.0050 | 1.0050 | 1.56 | 0.267 |
| W × W | 1 | 2.4482 | 2.4482 | 3.81 | 0.109 |
| 2-Way Interaction | 3 | 9.2863 | 3.0954 | 4.81 | 0.062 |
| P × I | 1 | 1.2950 | 1.2950 | 2.01 | 0.215 |
| P × W | 1 | 6.8237 | 6.8237 | 10.61 | 0.023 |
| I × W | 1 | 1.1677 | 1.1677 | 1.82 | 0.236 |
| Error | 5 | 3.2163 | 0.6433 | ||
| Lack-of-Fit | 3 | 1.8264 | 0.6088 | 0.88 | 0.572 |
| Pure Error | 2 | 1.3899 | 0.6949 | ||
| Total | 14 | 30.6607 |
| Sample | Tensile Strength [MPa] | Tensile Strain [%] | Modulus of Elasticit [MPa] |
|---|---|---|---|
| 022 | 0.09 ± 0.004 | 58.5 ± 7.05 | 0.11 ± 0.014 |
| 200 | 0.59 ± 0.032 | 226 ± 14.53 | 0.82 ± 0.015 |
| 210 | 0.36 ± 0.067 | 430 ± 8.97 | 0.28 ± 0.031 |
| 212 | 0.36 ± 0.120 | 444 ± 3.50 | 0.41 ± 0.050 |
| 231 | 0.58 ± 0.040 | 161.5 ± 5.93 | 0.99 ± 0.009 |
| PB | 1.83 ± 0.560 | 54 ± 3.00 | 3.7 ± 0.580 |
| Sample Thickness [mm] | Cushioning Energy [N·mm] | Cushioning Factor | Minimal Insole Thickness [mm] | ||
|---|---|---|---|---|---|
| Running | Walking | Running | Walking | ||
| 200 (7 mm) | 277 ± 13.89 | 177 ± 8.85 | 5.4 ± 0.27 | 4.4 ± 0.22 | 3.50 |
| 210 (7 mm) | 336.9 ± 16.84 | 210.9 ± 10.54 | 4.4 ± 0.22 | 3.7 ± 0.23 | 2.20 |
| 022 (7.5 mm) | 466 ± 23.33 | 229.3 ± 11.46 | 3.7 ± 0.18 | 3.9 ± 0.25 | 2.50 |
| 212 (7 mm) | 243.7 ± 12.81 | 152.8 ± 7.64 | 6.2 ± 0.31 | 5.1 ± 0.26 | 3.50 |
| 231 (6.5 mm) | 264 ± 13.20 | 373.8 ± 18.68 | 4.9 ± 0.24 | 4.0 ± 0.20 | 3.25 |
| PB (6.5 mm) | 373 ±18.69 | 373.8 ± 18.68 | 3.7 ± 0.24 | 3.7 ± 0.85 | 2.10 |
| Targeted Value | Min. 100 | Min. 70 | 4–8 | 4–8 | - |
| Sample | Tensile Strength [MPa] | Tensile Strain [%] | Modulus of Elasticity [MPa] |
|---|---|---|---|
| Control | 0.51 ± 0.004 | 210 ± 7.05 | 0.82 ± 0.140 |
| 2 months | 0.41 ± 0.032 | 140 ± 14.53 | 0.69 ± 0.015 |
| 4 months | 0.31 ± 0.067 | 93 ± 8.97 | 0.75 ± 0.031 |
Disclaimer/Publisher’s Note: The statements, opinions and data contained in all publications are solely those of the individual author(s) and contributor(s) and not of MDPI and/or the editor(s). MDPI and/or the editor(s) disclaim responsibility for any injury to people or property resulting from any ideas, methods, instructions or products referred to in the content. |
© 2023 by the authors. Licensee MDPI, Basel, Switzerland. This article is an open access article distributed under the terms and conditions of the Creative Commons Attribution (CC BY) license (https://creativecommons.org/licenses/by/4.0/).
Share and Cite
Rubtsova, S.; Dahman, Y. Biomimetic Orthopedic Footwear Advanced Insole Materials to Be Used in Medical Casts for Weight-Bearing Monitoring. Biomimetics 2023, 8, 334. https://doi.org/10.3390/biomimetics8040334
Rubtsova S, Dahman Y. Biomimetic Orthopedic Footwear Advanced Insole Materials to Be Used in Medical Casts for Weight-Bearing Monitoring. Biomimetics. 2023; 8(4):334. https://doi.org/10.3390/biomimetics8040334
Chicago/Turabian StyleRubtsova, Sofya, and Yaser Dahman. 2023. "Biomimetic Orthopedic Footwear Advanced Insole Materials to Be Used in Medical Casts for Weight-Bearing Monitoring" Biomimetics 8, no. 4: 334. https://doi.org/10.3390/biomimetics8040334