Abstract
Background: Histogram indices (HIs) and texture features (TFs) are considered to play an important role in future oncologic PET-imaging and it is unknown how these indices are affected by changes of tracer doses. A randomized undersampling of PET list mode data enables a simulation of tracer dose reduction. We performed a phantom study to compare HIs/TFs of simulated and measured tracer dose reductions and evaluated changes of HIs/TFs in the liver of patients with PETs from simulated reduced tracer doses. Overall, 42 HIs/TFs were evaluated in a NEMA phantom at measured and simulated doses (stepwise reduction of [18 F] from 100% to 25% of the measured dose). [18 F]-FDG-PET datasets of 15 patients were simulated from 3.0 down to 0.5 MBq/kgBW in intervals of 0.25 MBq/kgBW. HIs/TFs were calculated from two VOIs placed in physiological tissue of the right and left liver lobe and linear correlations and coefficients of variation analysis were performed. Results: All 42 TFs did not differ significantly in measured and simulated doses (p > 0.05). Also, 40 TFs showed the same behaviour over dose reduction regarding differences in the same group (measured or simulated), and for 26 TFs a linear behaviour over dose reduction for measured and simulated doses could be validated. Out of these, 13 TFs could be identified, which showed a linear change in TF value in both the NEMA phantom and patient data and therefore should maintain the same informative value when transferred in a dose reduction setting. Out of this Homogeneity 2, Entropy and Zone size non-uniformity are of special interest because they have been described as preferentially considerable for tumour heterogeneity characterization. Conclusions: We could show that there was no significant difference of measured and simulated HIs/TFs in the phantom study and most TFs reveal a linear behaviour over dose reduction, when tested in homogeneous tissue. This indicates that texture analysis in PET might be robust to dose modulations.
1. Background
[18 F]-labelled fluorodeoxyglucose ([18 F]-FDG)-positron emission tomography (PET) enables tomographic information about glucose metabolism in vivo. It is therefore considered to be a valuable tool, especially in staging and monitoring oncologic diseases. As invasive biopsies cannot be obtained from all tumours in advanced oncologic diseases and, moreover, might represent only small parts of heterogeneous tumours at a certain point of time [1], reliable quantitative PET imaging parameters beyond tumour size or tracer uptake values are desirable [2]. Histogram indices (HI) and textural features (TFs), respectively, represent first and higher-order statistics from the image [3]. So, these features represent information beyond visual representation that is contained inside medical images. Using this additional information could lead to improved diagnostic, prognostic and predictive models for medical research and daily patient care, which was widely evaluated in the last decade [4]. In [18 F]-FDG-PET, a voxel wise analysis of tumours or metastases is thought to represent the spatial distribution of metabolically active areas. Recently published studies suggest that the information gained might correlate to histopathology, metastatic status and therapy outcome [5,6,7,8]. On the other hand, it could be shown that individual TFs are influenced significantly by segmentation techniques, reconstruction parameters and different quantization techniques or highly correlate with each other, raising the question about their individual robustness [9,10,11].
Besides detector sensitivity and reconstruction parameters, also the amount of injected activity can influence the image quality in PET [12], and for oncologic [18 F]-FDG-PET examinations, heterogeneous dose recommendations exist, e.g., in the respective European and American societies [13,14]. A randomized undersampling of list-mode data enables a retrospective intra-individual simulation of tracer dose reductions [15,16,17]. Volume of metabolic active parts in a tumour is usually defined by an, e.g., 40% threshold of its highest standardized uptake value [18]. Previously studies could show that reduction of tracer doses can influence the metabolic tumour volume, which is of great importance for the calculation of TFs [11].
The aim of this study was to evaluate the influence of tracer dose reductions on HIs and TFs in [18 F]-FDG-PET in a standardized NEMA phantom (phantom according to standard of the National Electrical Manufacturers Association) as well as in the liver tissue of patients. The liver was chosen as a target organ due to its homogenic texture and sufficient size, allowing us to analyse both small and large volumes of interest (VOIs) with comparable texture and to avoid any further source of heterogeneity and influence on the textural features, so changes in these features represent only a function of changes in tracer doses.
2. Material and Methods
For feature extraction, an in-house developed feature extraction toolbox [19] was used that extends upon pyradiomics [20] for feature visualization and analysis. In order to validate the feature extraction tool, the tool was first used to verify the features calculated in the phantom and then used for calculating features from healthy liver tissue in the patient dataset.
We simplified the feature extraction task by targeting only TFs. The basic idea of TFs is to quantify intra-homogeneity in a defined VOI and inter-diversity between VOIs (of same or different images). The TFs can be grouped into 1st order (HI) capturing global features, 2nd order (e.g., grey-level co-occurrence) capturing local changes and higher orders (e.g., grey-level run-length) capturing regional discriminators. A complete list of the used TFs is given in Table 1. Images are all converted to SUV and after evaluating different bin sizes in a first step, due to the best specificity for final examination, a fixed quantification bin size of 1E-4 SUV was used for all extractions.

Table 1.
Extracted texture features.
2.1. PET Acquisition
PET list-mode data of patients and phantoms were acquired. All examinations were performed in a fully integrated PET/MR scanner (Biograph mMR, Siemens Healthineers, Erlangen, Germany). PET data were stored in list-mode and the dose reductions were simulated by a retrospective randomized undersampling as carried out by Gatidis et al. [15]. PET image reconstruction parameters were as follows: 3D ordered-subset expectation maximization (3D-OSEM), 2 iterations, 21 subsets and a 4 mm Gaussian filter. Image reconstruction parameters were the same in all simulated and measured doses to prevent influences from reconstruction [9,21].
2.2. Phantom Study
To eliminate influences of individual patient characteristics and to compare the effect of simulated and measured dose reductions on HIs and TFs, we performed a phantom study using a standardized phantom according to the National Electric Manufacturers Association. The phantom body was filled with a background activity of 5.3 kBq/mL [18 F]-fluoridine solution in water. One sphere of 22 mm diameter was filled with an activity 4 times higher than the background activity. The 22 mm diameter was chosen as a representative lesion size in metastatic patients. Five consecutive PET measurements with an acquisition time of 20 min each were performed in intervals of 55 min (~0.5 half-life times of [18 F]), and the first measurement was performed directly after calibration and set as 100%. Following 20 min measurements can be considered equivalent to dose reductions to 71%, 50%, 35%, and 25%. Besides the real measurements, we also applied the randomized undersampling of list-mode data [15,16,17] to evaluate the accuracy between real measurements and numerical simulations, as well as to investigate the stability and generalizability of the proposed features. Attenuation correction for the PET data from the phantom scan was performed using an CT-based attenuation map of the phantom. A VOI with a diameter of 22 mm was placed in the sphere and copied to all measured and simulated PET images to evaluate TFs, details are shown in Table 2.
Table 2.
Acquisition parameters.
2.3. Patient Study
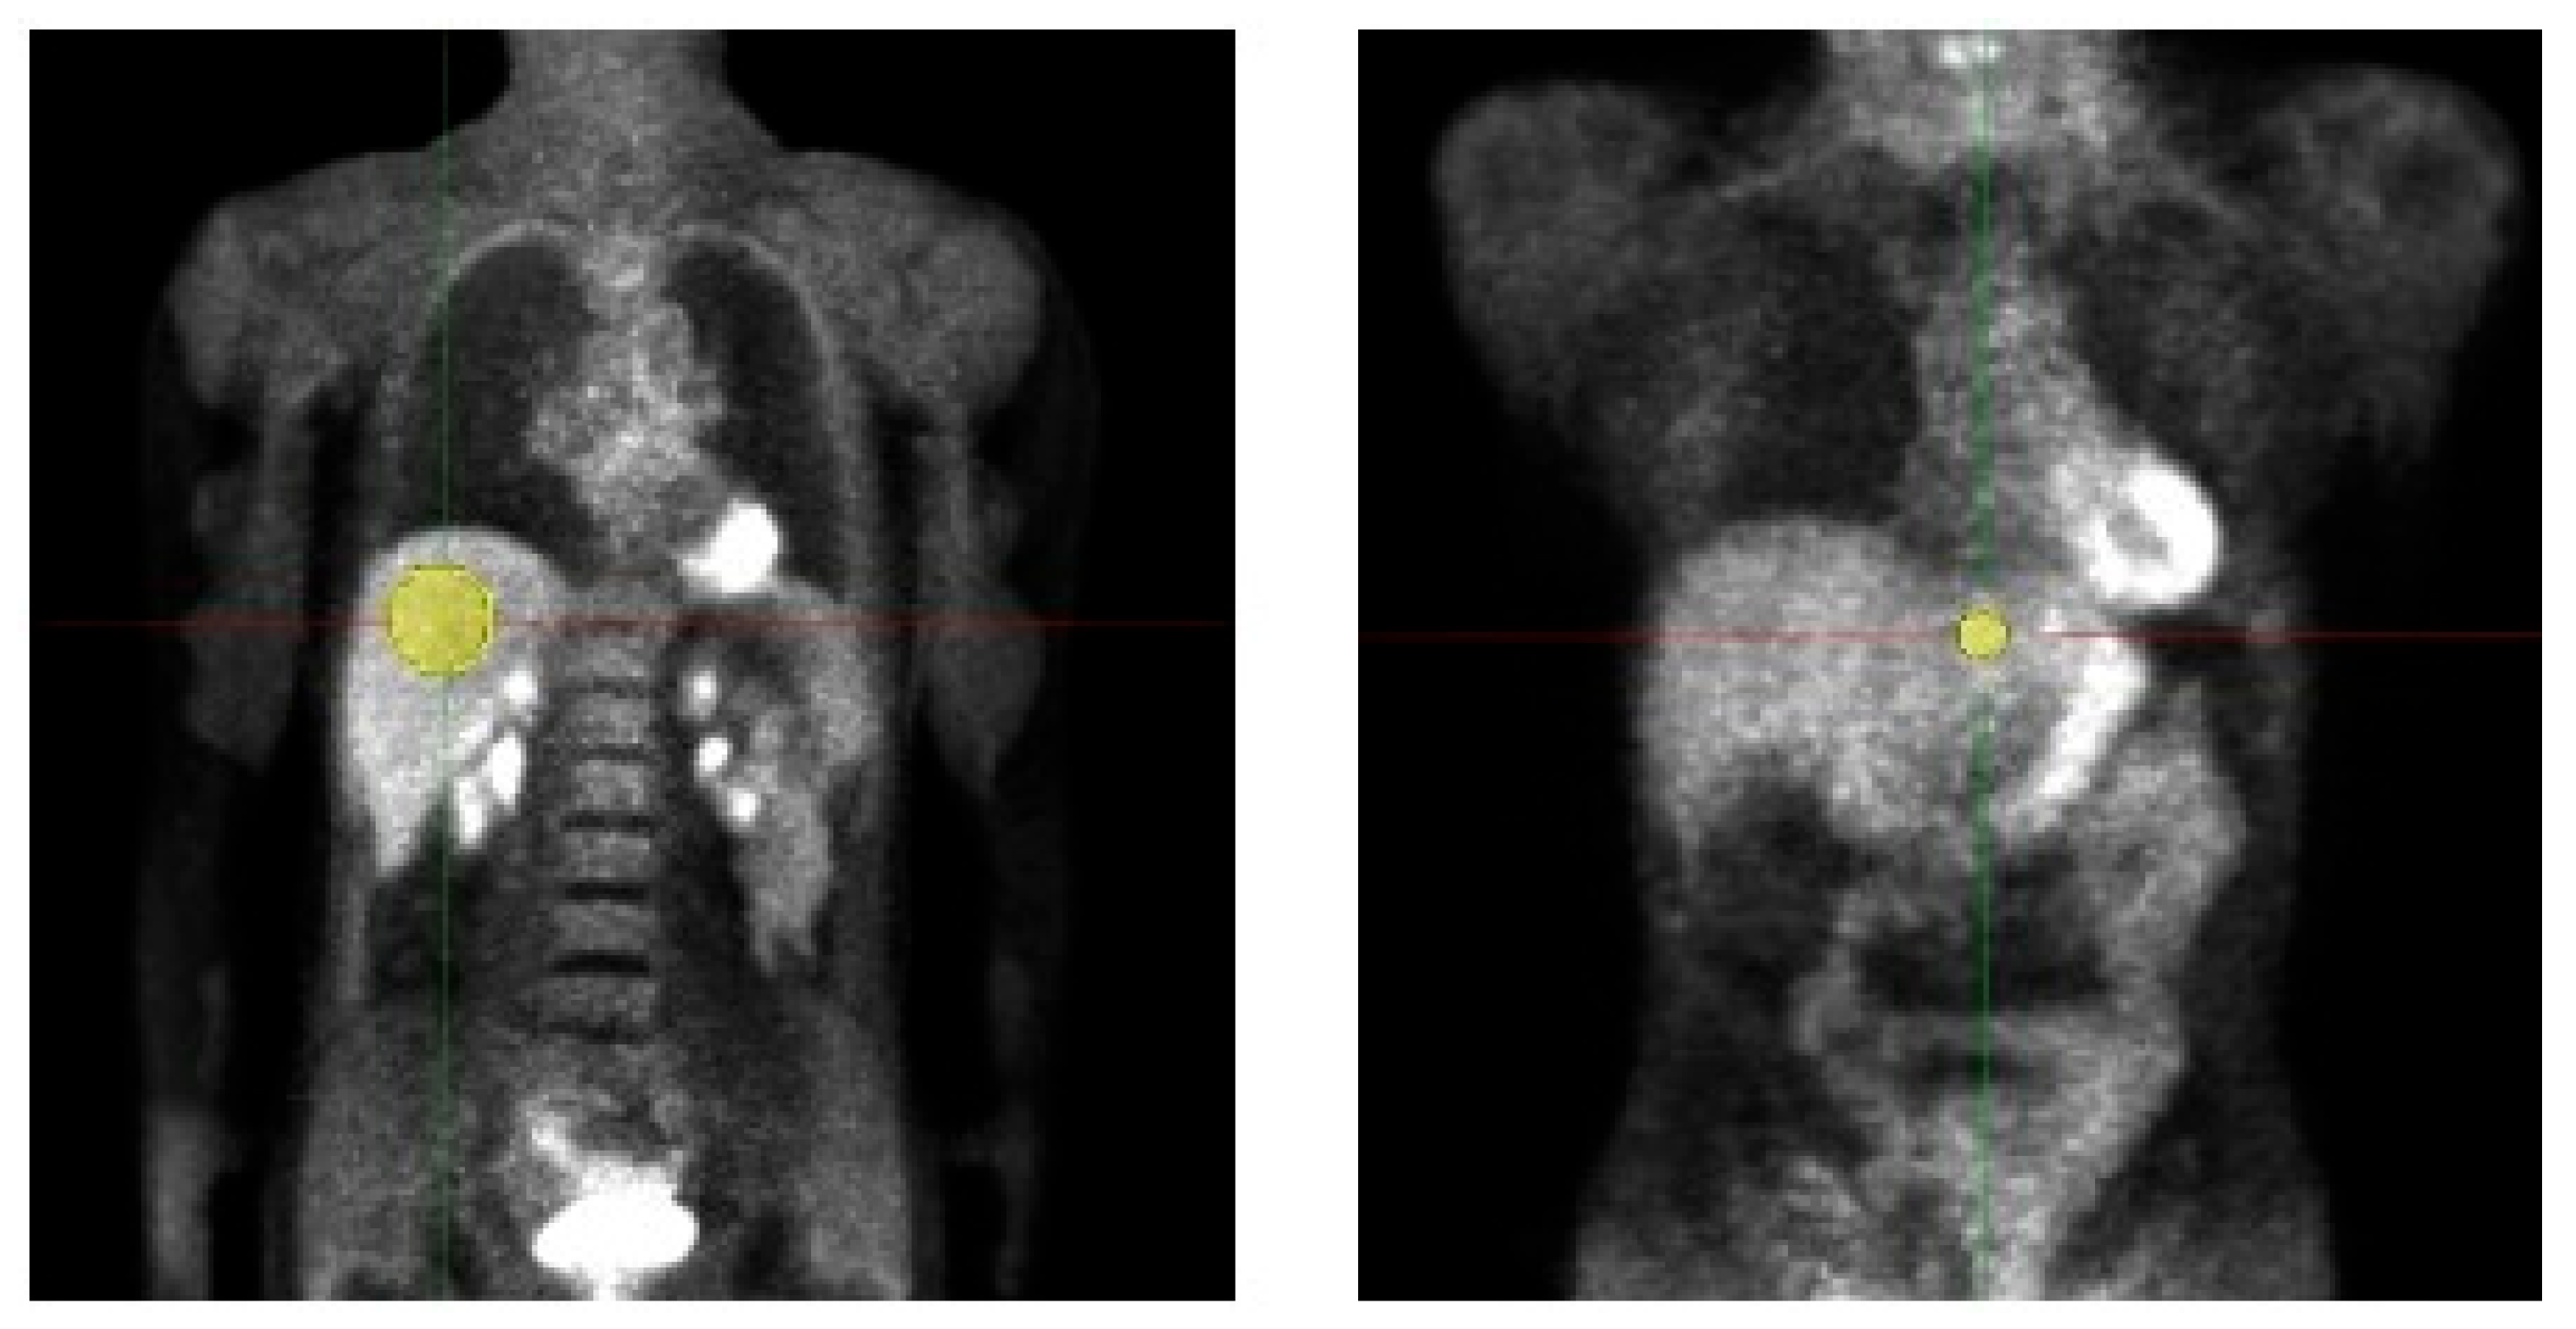
We retrospectively evaluated the data of 19 adult patients (5 male/14 female, age 50.9 ± 11.7, Body weight (BW) 68.9 ± 11.9 kg) examined with a whole-body [18 F]-FDG-PET/MRI. Data acquisition was performed in the context of a prospective study (Ethic Committee: Ethik-Kommission an der Medizinischen Fakultät der Eberhard-Karl-Universität und am Universitätsklinikum Tübingen, Approval Code: 721/2012BO1, Approval Date: 14 March 2013) and all patients gave written informed consent concerning further clinical examination and scientific evaluation of their data. Before tracer injection, patients fasted for at least 6 h. The injected activity was at least 3 MBq/kgBW (as, e.g., also used in [10]) and the acquisition time per bed was 4 min. For attenuation correction, the vendor-provided Dixon-based segmentation method was used [22]. PETs were simulated with doses from 3 MBq/kgBW, which is the current diagnostic reference dose value for [18 F]-FDG-PET [23], down to 0.5 MBq/kgBW in intervals of 0.25 MBq/kgBW. Volumes of interest (VOIs) were placed in healthy liver tissue of the left and right liver lobe and copied to all datasets of a patient for the analysis of HIs and TFs, details are shown in Figure 1 and Table 2. Median VOI volume of VOI 1 (right liver lobe) was 106.8 ± 26.7 mL, respectively 3.5 ± 0.9 mL for VOI 2 (left liver lobe).

Figure 1.
Volumes of interest (VOI) placement in patient study. Two VOIs were placed in healthy liver tissue of the left and right liver lobe and copied to all datasets of a patient for the analysis of HIs and TFs. VOI volume right liver lobe 106.8 ± 26.7 mL; left liver lobe 3.5 ± 0.9 mL.
2.4. Statistical Analysis
Statistical analysis was performed using MATLAB (The MathWorks, Natick, MA, USA). For all tests, a p-value < 0.05 was considered as statistically significant. Correlation coefficient is grouped according to Cohen [24]: zero: abs(rho) < 0.1; weak: abs(rho) ≥ 0.1; medium: abs(rho) ≥ 0.3; strong: abs(rho) ≥ 0.5. All TFs possess a metric scale with a known zero point. Therefore, all statistical tests are based on ratio scales. In a first step, a Kolmogorov–Smirnov test was performed to evaluate the features for normal distribution.
2.4.1. Phantom Study
Two dependent variables (measured and simulated doses) were compared, so if normally distributed, a paired sample t-test was performed to compare TFs from measured and simulated doses (H0 hypothesis: measured doses ≠ simulated doses). If normal distribution was not given, a Wilcoxon signed-rank test was performed.
Percentage dose deviations of reduced tracer doses (25–71%) for measured and simulated doses compared to the 100% dose value were calculated.
To test for a linear correlation between dose decay and changes in TFs, a Bravais–Pearson test (H0 hypothesis: not linearly correlated) was performed. If Bravais–Pearson test did not show a linear correlation Spearman test (H0 hypothesis: non-depended samples) was used to test on monotonic relationship. If no linear/monotonic correlation for original values could be shown additionally linear correlation for logarithmical values was tested.
2.4.2. Patient Study
To test for the influence of dose modulation on TFs, linear mixed-effect models (LME) were used because requirements for a linear (regression) model were not fulfilled. To secure homoscedasticity and normal distribution of the models, residual analysis (plot of residuals vs. fitted values; normal probability plot of residuals) was performed and visually analysed. If homoscedasticity and normal distribution were not given, logarithmical TF values were tested. For each dose reduction step, a coefficient of variation (COV) of TF value change was calculated for each TF separately for VOI 1 and VOI 2 as
For evaluating the general variability of a single TF, these COVs were summarized for each TF over all dose reduction steps and both VOIs.
3. Results
3.1. Phantom Study
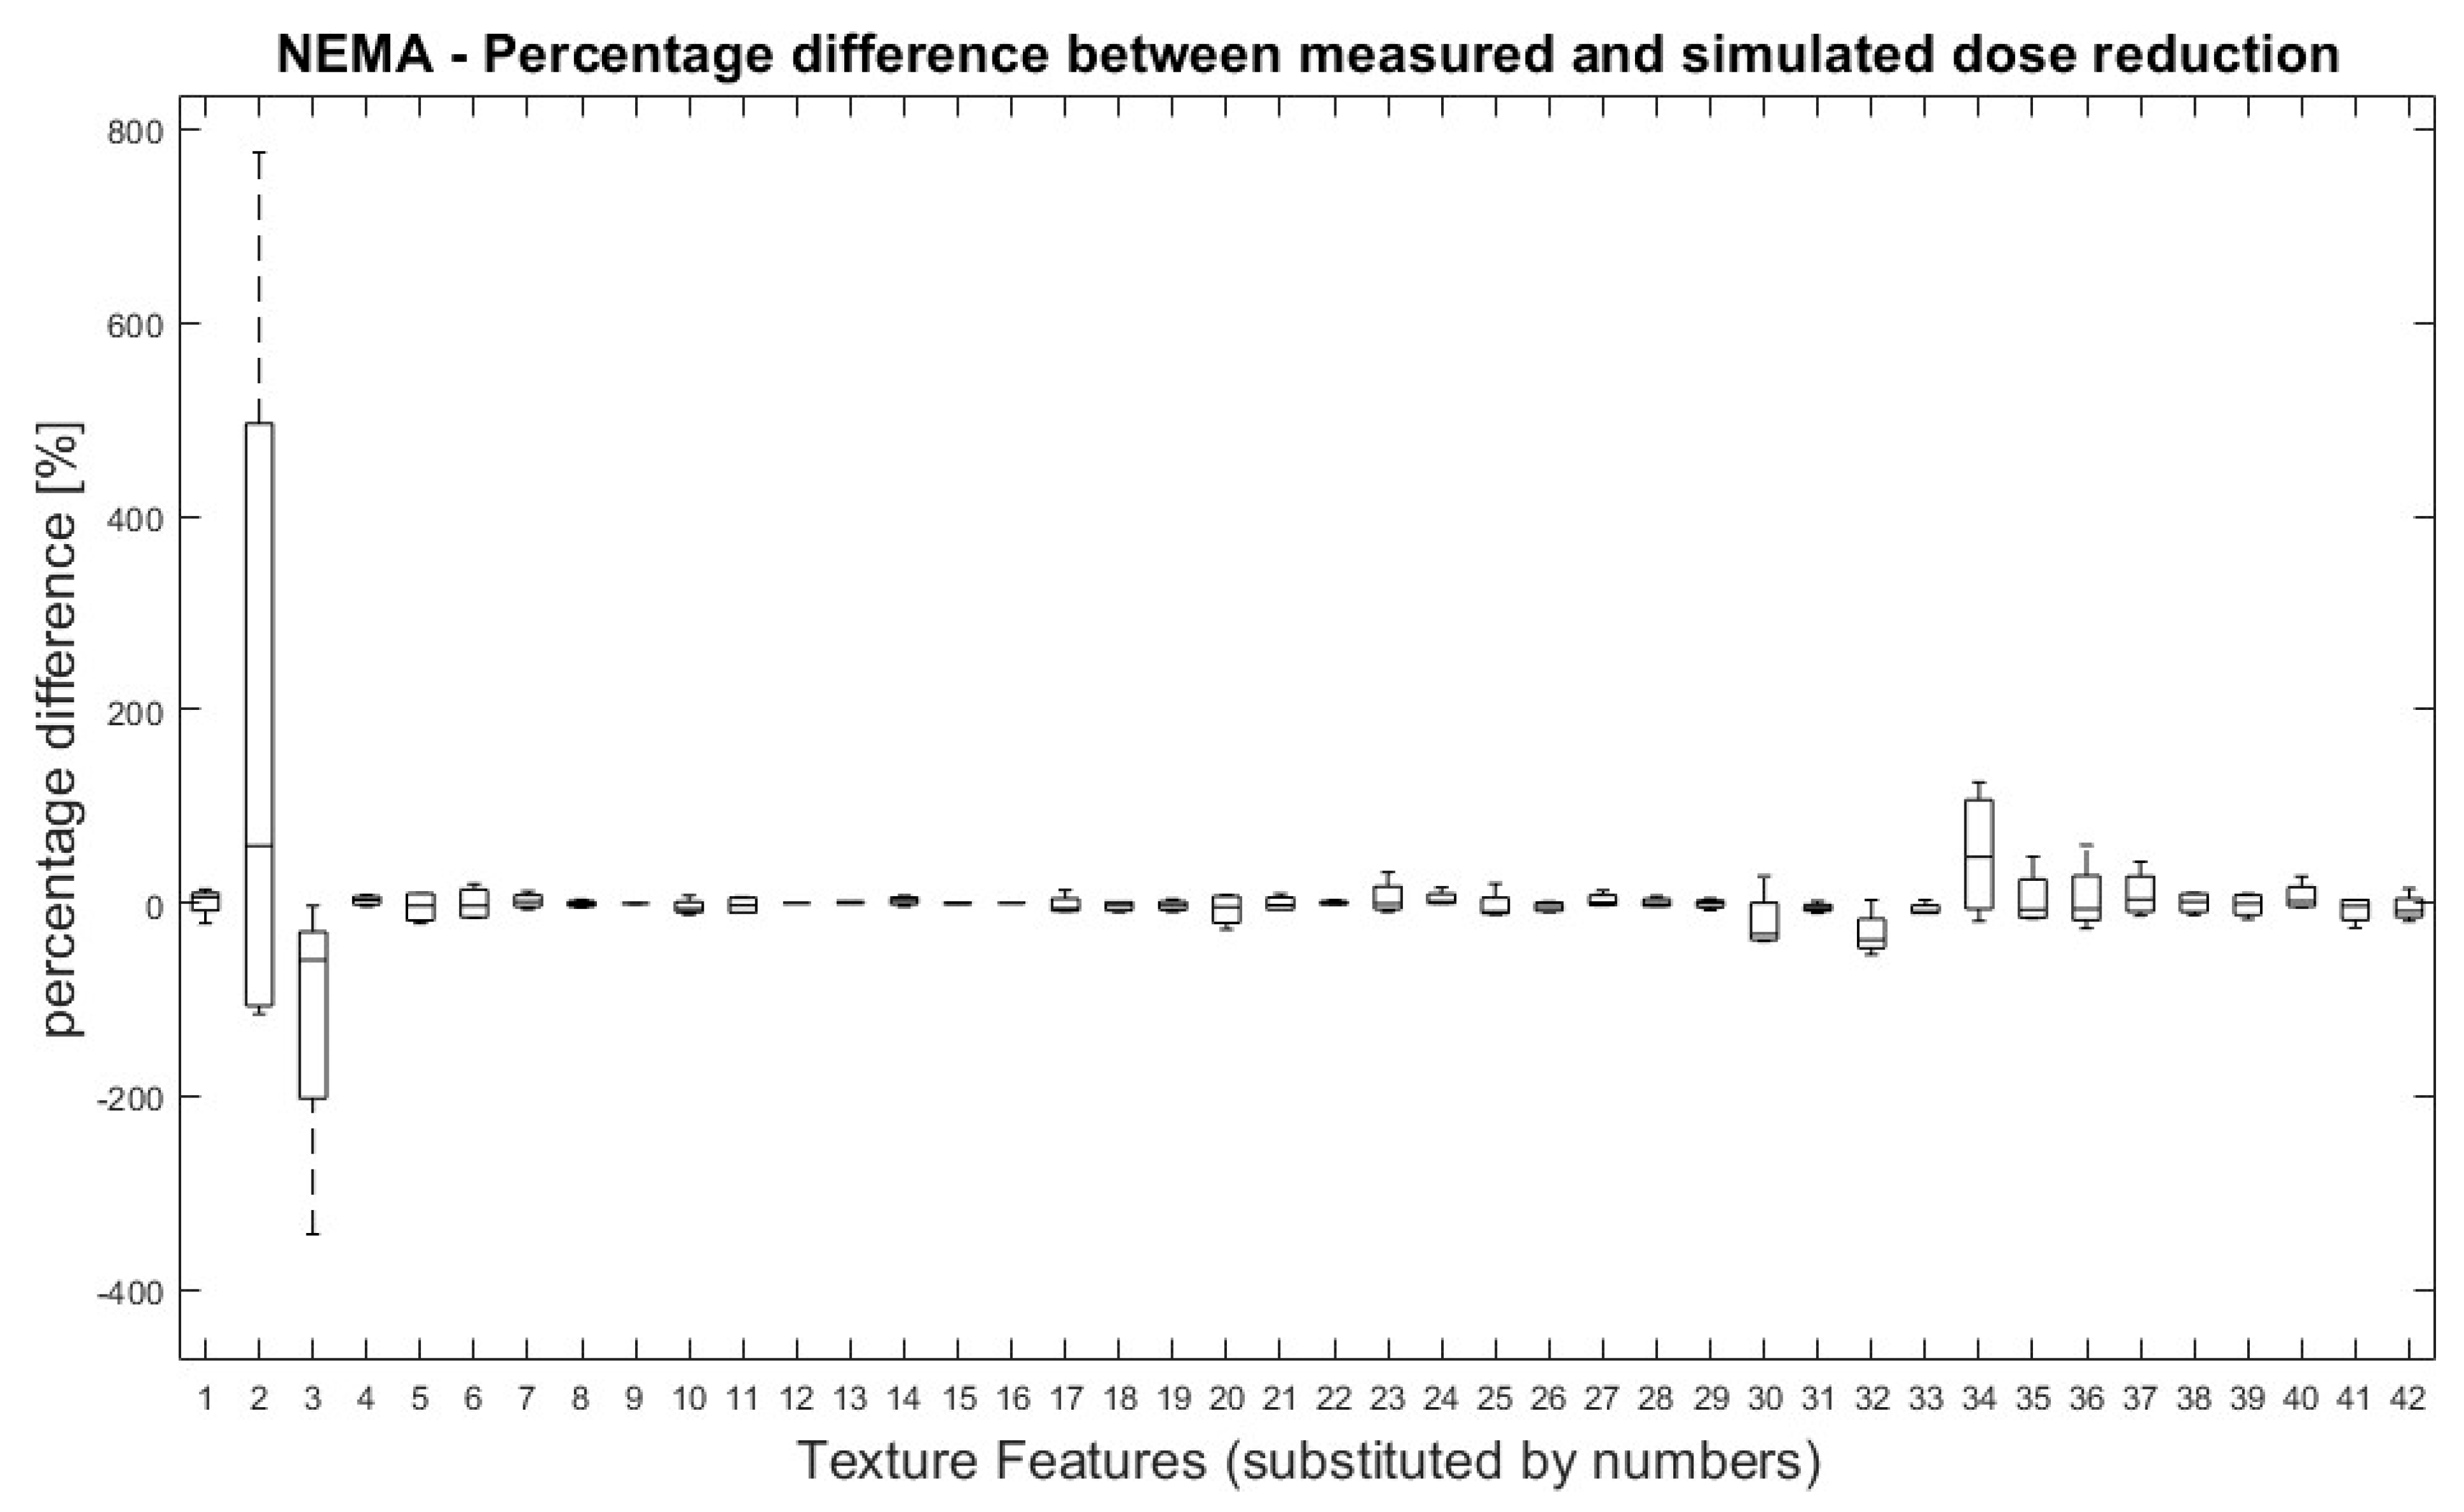
All TFs were normally distributed except for ‘Variance’ (first order), GLRLM LRHGE, GLZSM HGZE and GLZSM SZHGE. Overall, no significant differences were found between TF values derived from measured and simulated doses. Figure 2 shows the percentage difference between measured and simulated doses for all pairs of measurement (100% dose-reduced dose) and for all TFs.
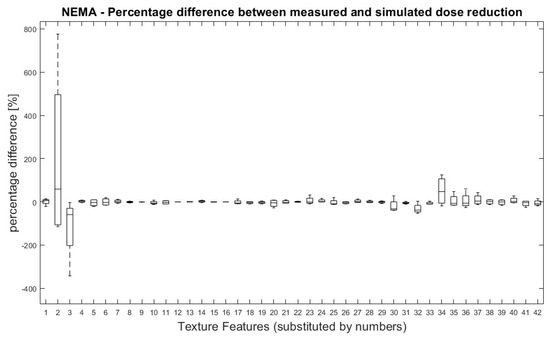
Figure 2.
NEMA phantom: Percentage differences between measured and simulated doses (100%, 71%, 50%, 35% and 25%) for all dose pairs and texture features. Percentage differences between four measurements of measured and simulated doses for all TF. Measured dose values were used as references for percentage calculation. Allocation of TF and numbers can be performed by Table 1.
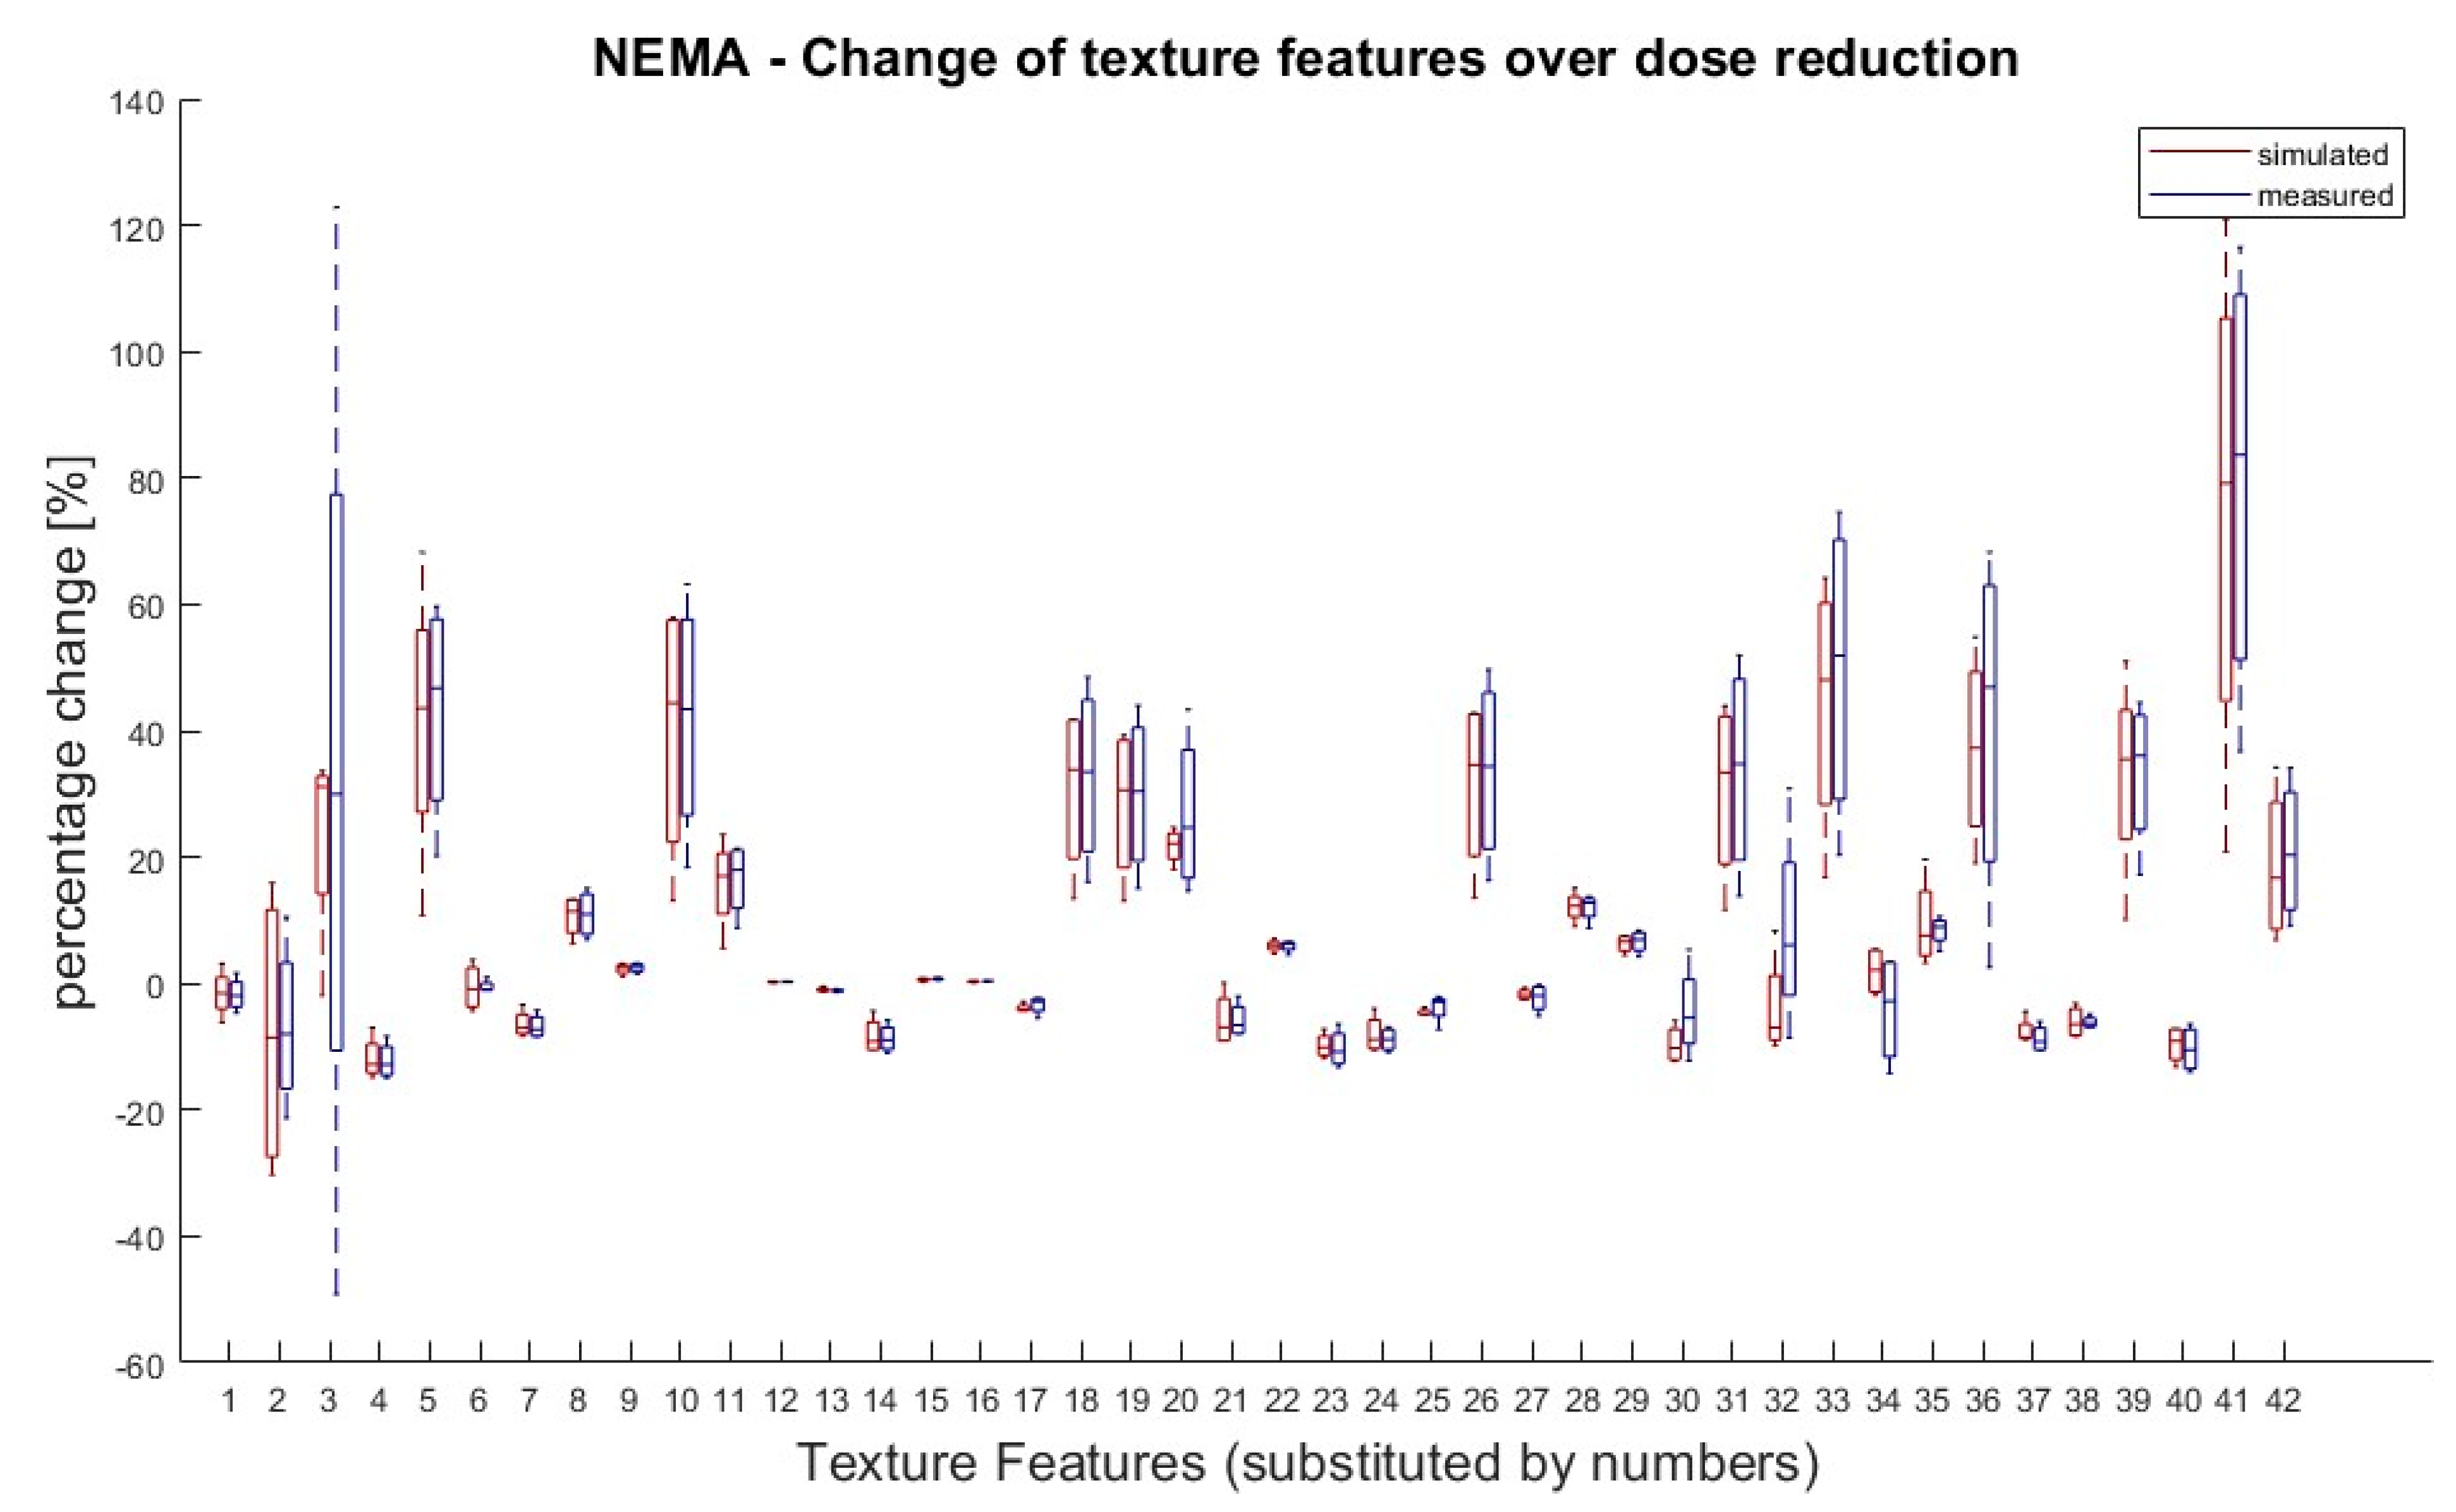
It was also tested if there was a significant difference in TF values between doses within the same group (measured or simulated). According to van Helden et al. [11], a difference between the groups of 25% for a single value compared to the starting value (100% activity) was rated as significant. Eight TFs (Skewness, Kurtosis, GLCM Contrast, GLZSM LZLGE, GLZSM LZHGE, GLZSM GLV, NGTDM Strength and GLZSM LZLGE) showed significant differences in their dose correlation between measured and simulated doses. Except of these eight, all the other TFs showed the same behaviour for the measured and simulated doses. The results are shown in Figure 3.
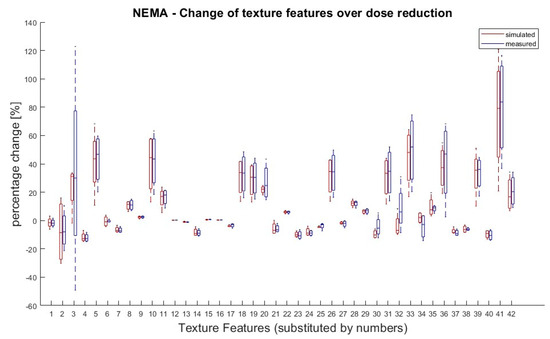
Figure 3.
NEMA phantom: Percentage changes of texture features in simulated and measured doses for dose reductions (71%, 50%, 35% and 25%) in relation to 100% dose. TF value of reduced tracer doses (25–71%) for measured and simulated doses were compared to the 100% dose value. A 100% dose value was used as reference for percentage calculation. Values greater than ± 25% are considered as significant deviation. Eight TFs (Skewness, Kurtosis, GLCM Contrast, GLZSM LZLGE, GLZSM LZHGE, GLZSM GLV, NGTDM Strength and GLZSM LZLGE) showed significant changes over dose reduction between measured and simulated doses. Allocation of TF and numbers can be performed by Table 1.
In the next step it was evaluated if values of TFs reveal a linear correlation to dose reduction. This was the case in 26 out of 42 TFs. Twenty-six of them showed a linear behaviour in the original values and an additional two in the logarithmic TF values. The effect size according to Cohen was strong for all linear features. The results are shown in the first column (NEMA phantom) of Table 3. Further detailed analysis for the obtained Pearson’s p-values on the linearity tests can be examined in the Supplementary Figures S1 and S2.
Table 3.
Linearity analysis.
3.2. Patient Study
Using the LME revealed that 13 TFs (ten original values, three logarithmical values) that were shown to correlate linearly with the amount of dose reduction in the phantom study were also linear in the patient data. The results of the LME and phantom study are summarized in Table 3. Further detailed analysis can be found in Supplementary Tables S1 and S2.
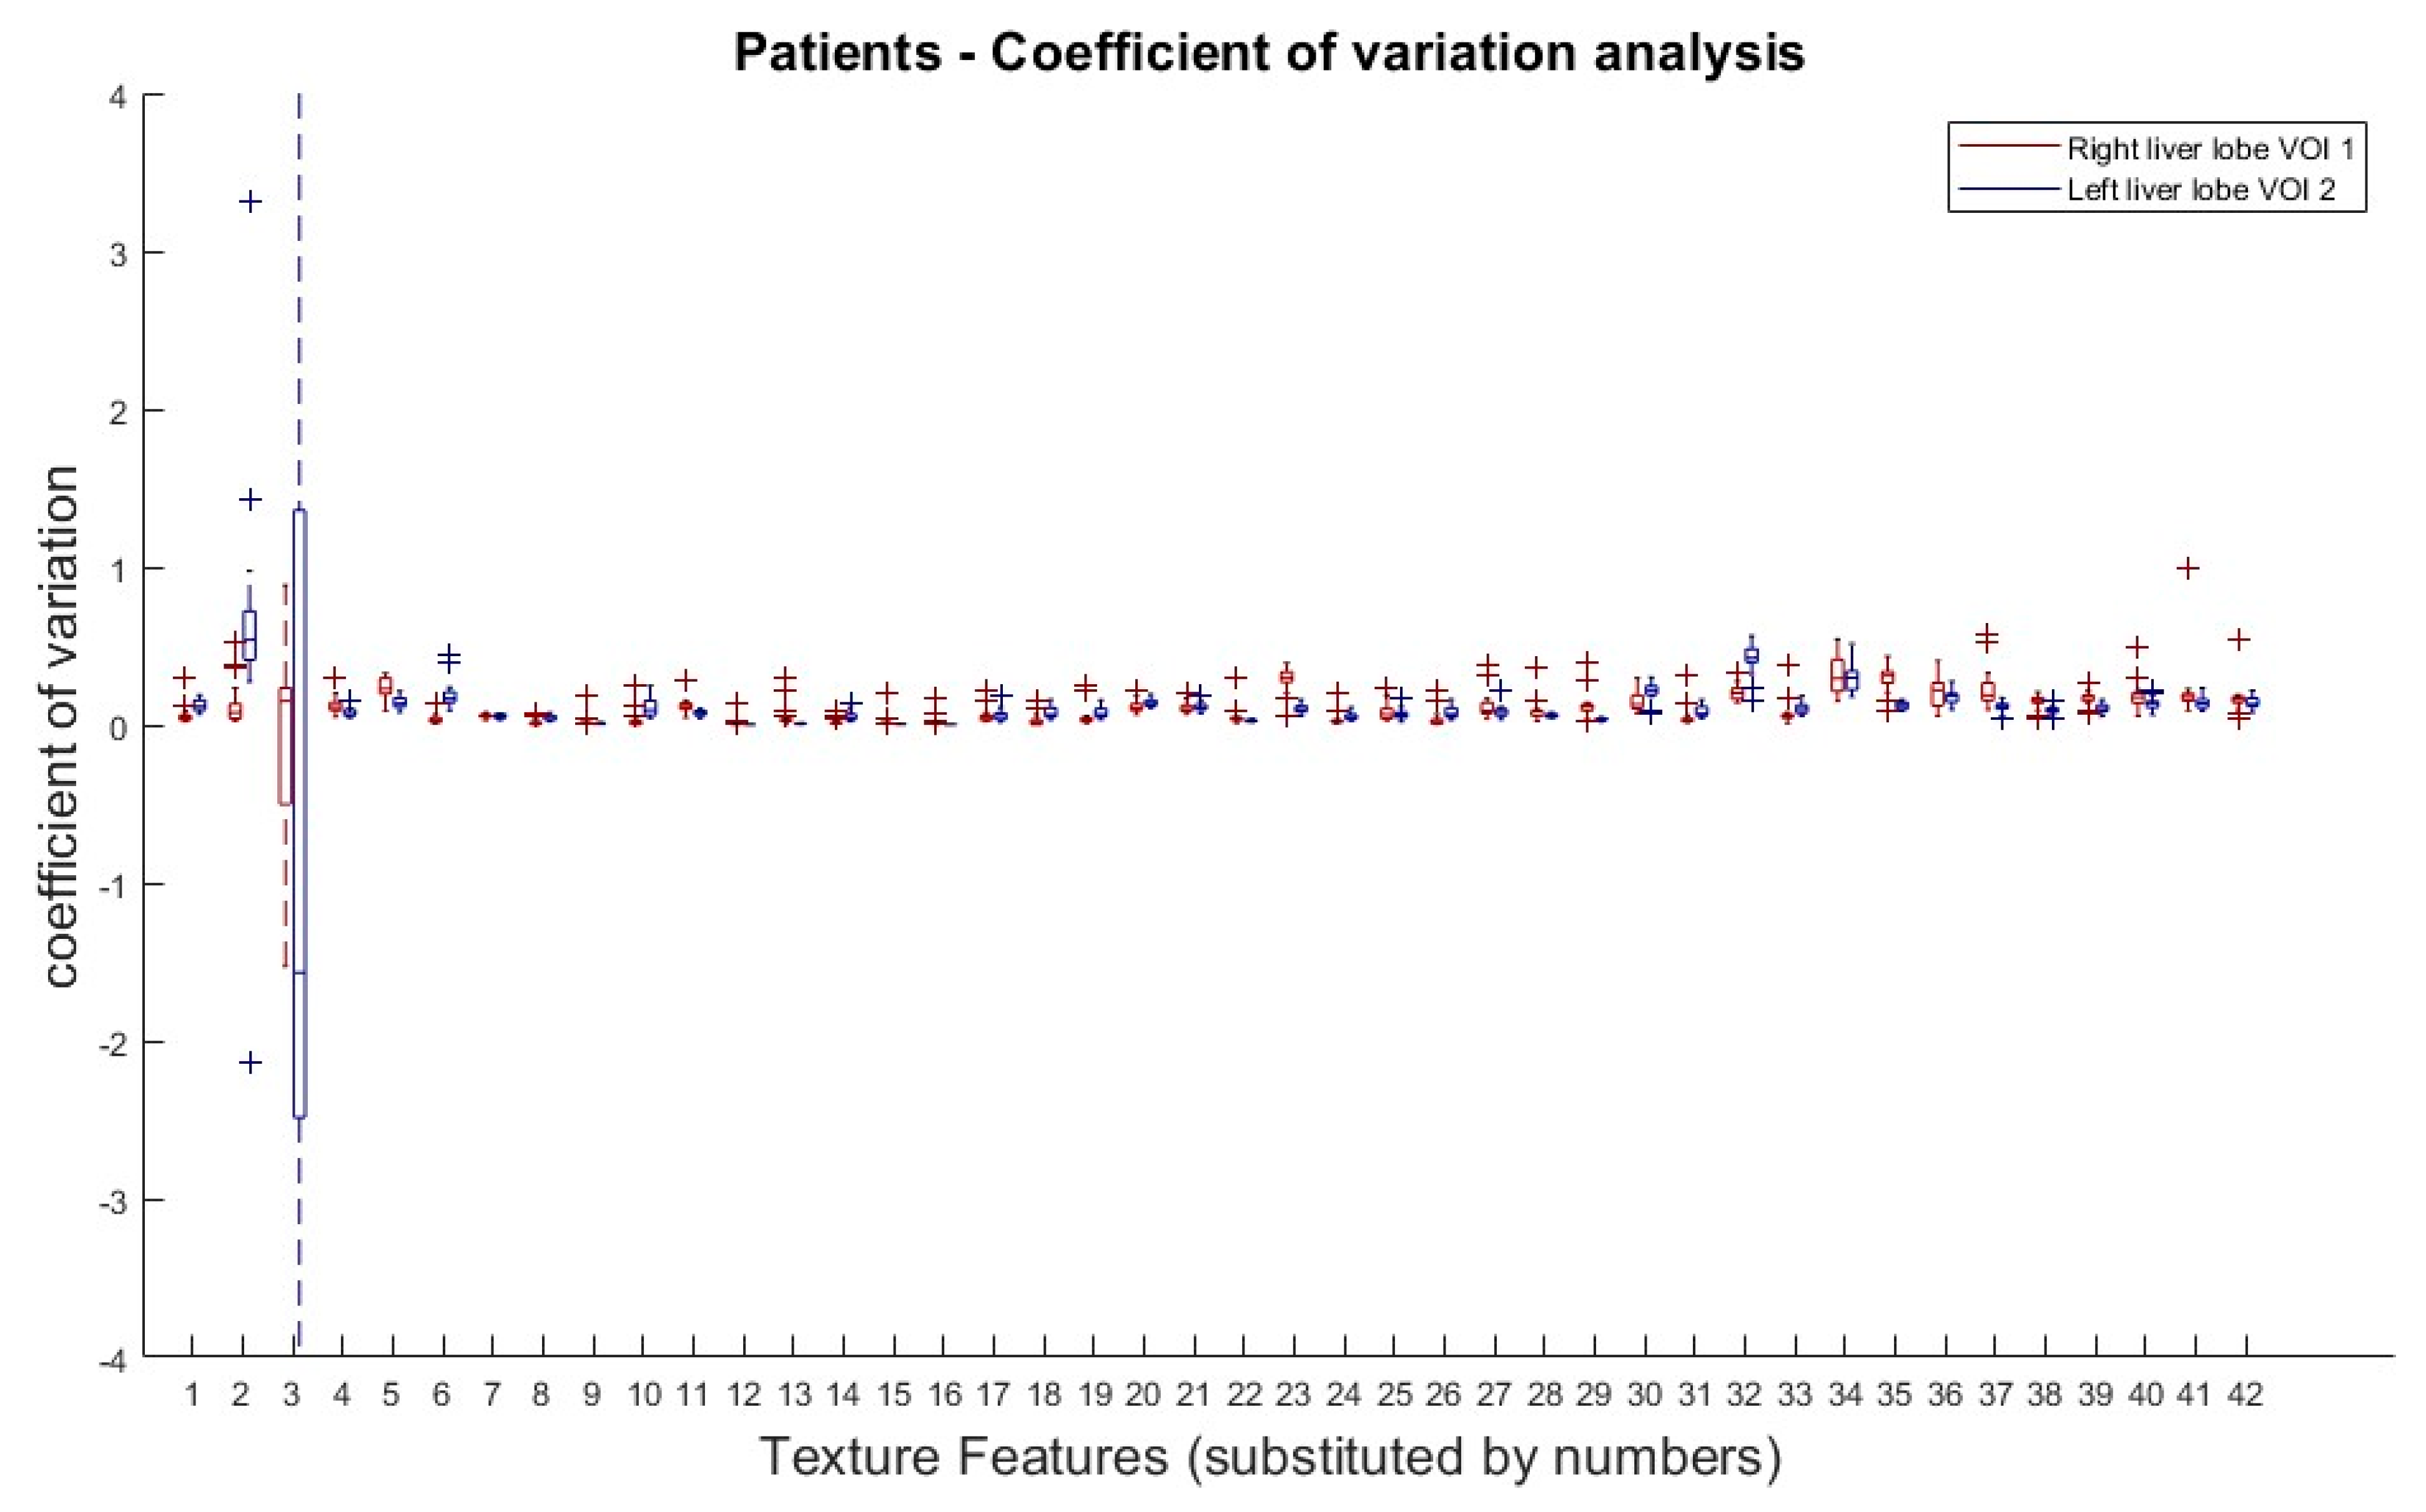
The results from the COV analysis are demonstrated in Figure 4. Obviously, there is no clear COV trend of any TF subgroup along the doses, with the exception of the first order TFs (Skewness and Kurtosis).
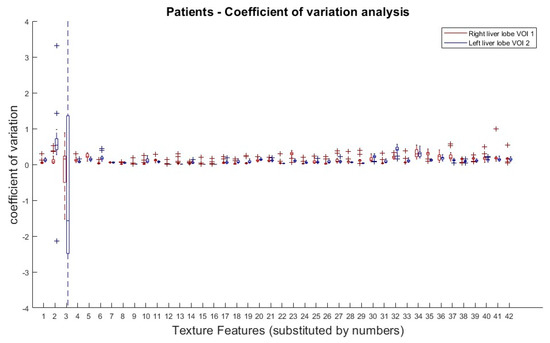
Figure 4.
Patients: Coefficient of variation analysis over all dose reductions (simulated) in right (VOI 1) and left (VOI 2) liver lobe. Coefficients of variation (COV) of all dose reduction steps plotted for each TF and both VOIs. Allocation of TF and numbers can be performed by Table 1.
4. Discussion
The study intended to capture quantifiable changes in PET images in order to determine the optimal trade-off between sufficient and robust image quality and minimal required radioactivity. We hypothesized that a breakdown in image quality for too low counts, i.e., amplified noise (scatter and random incidents), might be reflected in textural changes of specified volumes of interest (VOI). We therefore focused on homogeneous tissue to exclude the potential bias caused by heterogeneity.
Using a NEMA phantom, it could be demonstrated that there are no significant differences between measured and simulated dose reduction using an undersampling algorithm as used in a previous study [15]. Most of the TF (34 of 42) showed the same behaviour in relation to dose reduction for measured and simulated data. Nevertheless, it has to be considered that in eight of these cases (GLCM Correlation, GLCM Entropy, GLRLM SRE, GLRLM LRE, GLRLM RLN, GLRLM RP, GLRLM LGRE and GLRLM LRLGE) differences could not have been detected due to the specific calculation of the TFs.
Test of linearity in relation to dose reduction showed different findings for six TF; however, p-values of measured and simulated data only differed slightly (<0.06) in four of the findings and should not be taken into account due to the small sample size. Only two TF showed a remarkable difference:
- GLZSM LGZE (p-value-Δ = 0.21);
- GLZSM ZSV (p-value-Δ = 0.117).
Overall, simulated dose reduction showed good accordance with measured data. It can hence be assumed that using the same undersampling algorithm for patient data should yield transferable findings to a real low dose PET examination.
For the patient data sets we could show that there is no evidence that there are certain TF metrics which are affected more or less by dose reduction. So, every TF has to be evaluated separately regarding its variation concerning (simulated) dose reduction.
Regarding the results of the NEMA phantom study and the patient datasets 13 TFs could be identified which showed a linear behaviour in both NEMA phantom and patient data and therefore could be considered as robust against tracer dose reduction, at least in homogenic tissue. They are shown in Table 4 and are sorted by summed COV. Because there are no guidelines for evaluating COVs of TF there is no clear cut-off, but only a trend for which TF are preferable in further studies. As mentioned, our phantom setup as well as the healthy liver both representing relatively homogenous tissue, therefore findings may not be seamlessly transferable to all kinds of tumour tissue. But as Gao et al. demonstrated in their study, TF analysis is feasible in dose reduction [18 F]-FDG-PET] and also in presumably inhomogeneous tumour tissue (primary lung cancer) [25].
Table 4.
Texture features with linear behaviour over dose reduction in NEMA phantom and patient study.
There are several dozen studies investigating the clinical value of TF in a non-dose reduction setup [28,29]. Regarding these findings special interest should be taken on the following three TFs:
- Homogeneity 2 (GLCM);
- Entropy (GLCM);
- Zone size non-uniformity (GLZSM).
We concur here with the findings of Tixier et al., who had proven a good physiological reproducibility and therefore classified them as parameters that should be preferably considered for tumour heterogeneity characterization [26]. Also, “Texture Strength” might be an interesting parameter due to Blanc-Durand et al. They generated a whole-liver radiomics scoring system based on [18 F]-FDG-PET for progression-free survival (PFS) and overall survival (OS) in patients undergoing trans-arterial radioembolization and therefore used “Texture Strength” as a sole parameter to predict OS and combined with three other parameters (Variance, GLCM Contrast, GLRLM SRLGE), which did not show a linear behaviour undergoing dose reduction, to predict PFS [27].
In this study, we could only address a small part of the potential interesting evaluations and so many aspects of this issue are not investigated yet. For example, we used a fixed bin size and did not evaluated the impact of bin size and lesion volume in a dose reduction setting, which had been shown to effect feature variations in non-dose reduction PET [30]. Also, we performed measurements with just one homogenies phantom and in homogenic liver tissue and did not include further phantoms, especially phantoms with textural phantom design or heterogenic (e.g., tumour) tissue to this study like it was performed by Gao et al. [25]. So, we have to acknowledge that our findings, which are only tested in healthy liver tissue, may vary for (heterogenic) tumour regions. These points, especially if the findings are transferable in tumour tissue, along with more basic tasks like test–retest reproducibility [26] or differences between different phantom types have to be evaluated further.
Due to the low number of studies that have investigated dose reduction in PET, generally all of the findings in this work could only be interpreted as first and provisional conclusions that have yet to be confirmed in further evaluations.
5. Conclusions
In this study, we showed that many TFs reveal a robust behaviour in homogenic tissue when undergoing dose reduction. We demonstrated that simulated dose reduction using a list-mode-based undersampling algorithm provides the same results as measured data in a phantom model when testing with 42 TFs.
Using simulated dose reduction in clinical indicated whole body [18 F]-FDG-PET, we also demonstrated that most of the tested TFs show a robust and linear behaviour over dose reduction in healthy liver tissue.
Therefore, TF analysis could also be used for low-dose PET, but this has to be further evaluated in future larger scale studies.
Supplementary Materials
The following supporting information can be downloaded at: https://www.mdpi.com/article/10.3390/tomography9050143/s1, Figure S1: NEMA phantom: Linearity test on linear and logarithmic value scale for dose groups in simulated dose reductions of 71%, 50%, 35% and 25%. For every TF linearity behaviour over dose reduction was tested for measured and simulated NEMA phantom data. Pearson’s p-values for linear and logarithmic scale for simulated dose reduction are plotted. Figure S2: NEMA phantom: Linearity test on linear and logarithmic value scale for dose groups in measured dose reductions of 71%, 50%, 35% and 25%. For every TF linearity behaviour over dose reduction was tested for measured and simulated NEMA phantom data. Pearson’s p-values for linear and logarithmic scale for measured dose reduction are plotted. Tables S1 and S2: Patients: Linearity analysis for risht and left liver VOI: For every TF linearity behaviour over dose reduction was tested for patient data. Table S1 shows the results for the right liver VOI (volume 106.8 ± 26.7 mL), results for the left liver VOI (3.5 ± 0.9 mL) are displayed in Table S2. The results are also summarized in Table 3. Out of the 28 TFs which showed a linear behaviour in both measured and simulated NEMA phantom measurements 14 also showed linear behaviour in both liver VOIs. The estimated gradient was calculated for a step size of 0.25 MBq/kgBW.
Author Contributions
J.V. analysed and interpreted the NEMA and patient data and was the leading author of the manuscript. F.S. and T.K. were involved in data acquisition (NEMA and patient data) as well as in data analysis and statistical evaluation and were major contributors in writing the manuscript. A.E. was involved in data acquisition and analysis of the patient data. K.N. and C.l.F. participated in designing the study and were major contributors in writing the manuscript. H.S. participated in designing the study as well as statistical analyses. All authors have read and agreed to the published version of the manuscript.
Funding
This work was funded by the Cluster of Excellence iFIT (EXC 2180) “Image Guided and Functionally Instructed Tumor Therapies” and supported by the Cluster of Excellence “Machine Learning: New Perspectives for Science” (EXC 2064), University of Tuebingen, Germany.
Institutional Review Board Statement
All patients gave written informed consent concerning the examination and scientific evaluation of their data. Data acquisition was performed in the context of a prospective study (Ethic Committee: Ethik-Kommission an der Medizinischen Fakultät der Eberhard-Karl-Universität und am Universitätsklinikum Tübingen, Approval Code: 721/2012BO1, Approval Date: 14 March 2013).
Informed Consent Statement
Informed consent was obtained from all subjects involved in the study.
Data Availability Statement
All relevant data are within the paper and its Supporting Information files.
Acknowledgments
Matthias Weinhold was involved with data analysis in context with his study work supervised by T.K.
Conflicts of Interest
The authors declare no conflict of interest.
Abbreviations
| [18 F] | Fluorine 18 |
| BW | body weight |
| COV | coefficient of variation |
| CT | computer tomography |
| FDG | fluorodeoxyglucose |
| HI | histogram indices |
| MR(I) | magnetic resonance (imaging) |
| NEMA | National Electrical Manufacturers Association |
| OS | overall survival |
| OSEM | ordered subset expectation maximization |
| PET | positron emission tomography |
| PFS | progression free survival |
| TF | texture feature |
| VOI | volume of interest |
References
- Gerlinger, M.; Rowan, A.J.; Horswell, S.; Larkin, J.; Endesfelder, D.; Gronroos, E.; Martinez, P.; Matthews, N.; Stewart, A.; Tarpey, P.; et al. Intratumor heterogeneity and branched evolution revealed by multiregion sequencing. N. Engl. J. Med. 2012, 366, 883–892. [Google Scholar] [CrossRef] [PubMed]
- Gillies, R.J.; Kinahan, P.E.; Hricak, H. Radiomics: Images Are More than Pictures, They Are Data. Radiology 2016, 278, 563–577. [Google Scholar] [CrossRef]
- Lubner, M.G.; Smith, A.D.; Sandrasegaran, K.; Sahani, D.V.; Pickhardt, P.J. CT Texture Analysis: Definitions, Applications, Biologic Correlates, and Challenges. Radiographics 2017, 37, 1483–1503. [Google Scholar] [CrossRef] [PubMed]
- Guiot, J.; Vaidyanathan, A.; Deprez, L.; Zerka, F.; Danthine, D.; Frix, A.-N.; Lambin, P.; Bottari, F.; Tsoutzidis, N.; Miraglio, B.; et al. A review in radiomics: Making personalized medicine a reality via routine imaging. Med. Res. Rev. 2022, 42, 426–440. [Google Scholar] [CrossRef] [PubMed]
- Lin, H.-C.; Chan, S.-C.; Cheng, N.-M.; Liao, C.-T.; Hsu, C.-L.; Wang, H.-M.; Lin, C.-Y.; Chang, J.T.-C.; Ng, S.-H.; Yang, L.-Y.; et al. Pretreatment (18)F-FDG PET/CT texture parameters provide complementary information to Epstein-Barr virus DNA titers in patients with metastatic nasopharyngeal carcinoma. Oral Oncol. 2020, 104, 104628. [Google Scholar] [CrossRef]
- Gao, J.; Huang, X.; Meng, H.; Zhang, M.; Zhang, X.; Lin, X.; Li, B. Performance of Multiparametric Functional Imaging and Texture Analysis in Predicting Synchronous Metastatic Disease in Pancreatic Ductal Adenocarcinoma Patients by Hybrid PET/MR: Initial Experience. Front. Oncol. 2020, 10, 198. [Google Scholar] [CrossRef] [PubMed]
- Tixier, F.; Le Rest, C.C.; Hatt, M.; Albarghach, N.; Pradier, O.; Metges, J.-P.; Corcos, L.; Visvikis, D. Intratumor Heterogeneity Characterized by Textural Features on Baseline 18F-FDG PET Images Predicts Response to Concomitant Radiochemotherapy in Esophageal Cancer. J. Nucl. Med. 2011, 52, 369–378. [Google Scholar] [CrossRef]
- Ou, X.; Wang, J.; Zhou, R.; Zhu, S.; Pang, F.; Zhou, Y.; Tian, R.; Ma, X. Ability of (18)F-FDG PET/CT Radiomic Features to Distinguish Breast Carcinoma from Breast Lymphoma. Contrast Media Mol. Imaging 2019, 2019, 4507694. [Google Scholar] [CrossRef]
- Yan, J.; Chu-Shern, J.L.; Loi, H.Y.; Khor, L.K.; Sinha, A.K.; Quek, S.T.; Tham, I.W.K.; Townsend, D. Impact of Image Reconstruction Settings on Texture Features in 18F-FDG PET. J. Nucl. Med. 2015, 56, 1667–1673. [Google Scholar] [CrossRef]
- Orlhac, F.; Soussan, M.; Maisonobe, J.A.; Garcia, C.A.; Vanderlinden, B.; Buvat, I. Tumor texture analysis in 18F-FDG PET: Relationships between texture parameters, histogram indices, standardized uptake values, metabolic volumes, and total lesion glycolysis. J. Nucl. Med. 2014, 55, 414–422. [Google Scholar] [CrossRef]
- van Velden, F.H.; Kramer, G.M.; Frings, V.; Nissen, I.A.; Mulder, E.R.; de Langen, A.J.; Hoekstra, O.S.; Smit, E.F. Repeatability of Radiomic Features in Non-Small-Cell Lung Cancer [(18)F]FDG-PET/CT Studies: Impact of Reconstruction and Delineation. Mol. Imaging Biol. 2016, 18, 788–795. [Google Scholar] [CrossRef]
- Seith, F.; Schmidt, H.; Kunz, J.; Kustner, T.; Gatidis, S.; Nikolaou, K.; la Fougère, C.; Schwenzer, N. Simulation of Tracer Dose Reduction in (18)F-FDG PET/MRI: Effects on Oncologic Reading, Image Quality, and Artifacts. J. Nucl. Med. 2017, 58, 1699–1705. [Google Scholar] [CrossRef] [PubMed]
- Boellaard, R.; Delgado-Bolton, R.; Oyen, W.J.; Giammarile, F.; Tatsch, K.; Eschner, W.; Verzijlbergen, F.J.; Barrington, S.F.; Pike, L.C.; Weber, W.A.; et al. FDG PET/CT: EANM procedure guidelines for tumour imaging: Version 2.0. Eur. J. Nucl. Med. Mol. Imaging 2015, 42, 328–354. [Google Scholar] [CrossRef] [PubMed]
- American College of Radiology. ACR–SPR Practice Parameter for Performing FDG-PET/CT in Oncology: American College of Radiology. Available online: https://www.acr.org/~/media/ACR/Documents/PGTS/guidelines/FDG_PET_CT.pdf (accessed on 12 October 2021).
- Gatidis, S.; Wurslin, C.; Seith, F.; Schafer, J.F.; la Fougere, C.; Nikolaou, K.; Schwenzer, N.F. Towards tracer dose reduction in PET studies: Simulation of dose reduction by retrospective randomized undersampling of list-mode data. Hell. J. Nucl. Med. 2016, 19, 15–18. [Google Scholar] [PubMed]
- Yan, J.; Schaefferkoette, J.; Conti, M.; Townsend, D. A method to assess image quality for Low-dose PET: Analysis of SNR, CNR, bias and image noise. Cancer Imaging 2016, 16, 26. [Google Scholar] [CrossRef]
- Schaefferkoetter, J.D.; Yan, J.; Soderlund, T.A.; Townsend, D.W.; Conti, M.; Tam, J.K.; Soo, R.A.; Tham, I. Quantitative Accuracy and Lesion Detectability of Low-Dose FDG-PET for Lung Cancer Screening. J. Nucl. Med. 2017, 58, 399–405. [Google Scholar] [CrossRef] [PubMed]
- Tibdewal, A.; Patil, M.; Misra, S.; Purandare, N.; Rangarajan, V.; Mummudi, N.; Karimundackal, G.; Jiwnani, S.; Agarwal, J. Optimal Standardized Uptake Value Threshold for Auto contouring of Gross Tumor Volume using Positron Emission Tomography/Computed Tomography in Patients with Operable Nonsmall-Cell Lung Cancer: Comparison with Pathological Tumor Size. Indian J. Nucl. Med. 2021, 36, 7–13. [Google Scholar]
- Liebgott, A.; Kustner, T.; Strohmeier, H.; Hepp, T.; Mangold, P.; Martirosian, P.; Bamberg, F.; Nikolaou, K.; Yang, B. ImFEATbox: A toolbox for extraction and analysis of medical image features. Int. J. Comput. Assist. Radiol. Surg. 2018, 13, 1881–1893. [Google Scholar] [CrossRef]
- van Griethuysen, J.J.M.; Fedorov, A.; Parmar, C.; Hosny, A.; Aucoin, N.; Narayan, V.; Beets-Tan, R.G.H.; Fillion-Robin, J.-C.; Pieper, S.; Aerts, H.J.W.L. Computational Radiomics System to Decode the Radiographic Phenotype. Cancer Res. 2017, 77, e104–e107. [Google Scholar] [CrossRef]
- Shiri, I.; Rahmim, A.; Ghaffarian, P.; Geramifar, P.; Abdollahi, H.; Bitarafan-Rajabi, A. The impact of image reconstruction settings on 18F-FDG PET radiomic features: Multi-scanner phantom and patient studies. Eur. Radiol. 2017, 27, 4498–4509. [Google Scholar] [CrossRef]
- Martinez-Moller, A.; Souvatzoglou, M.; Delso, G.; Bundschuh, R.A.; Chefd’hotel, C.; Ziegler, S.I.; Navab, N.; Schwaiger, M.; Nekolla, S.G. Tissue classification as a potential approach for attenuation correction in whole-body PET/MRI: Evaluation with PET/CT data. J. Nucl. Med. 2009, 50, 520–526. [Google Scholar] [CrossRef] [PubMed]
- Bundesamt für Strahlenschutz. Bekanntmachung der Aktualisierten Diagnostischen Referenzwerte für Nuklearmedizinische Untersuchungen; Vom 15. Juni 2021; Bundesamt für Strahlenschutz: Salzgitter, Germany, 2021.
- Cohen, J. Statistical Power Analysis for the Behavioral Sciences; L. Erlbaum Associates: Hilsdale, MI, USA, 1988. [Google Scholar]
- Gao, X.; Tham, I.W.K.; Yan, J. Quantitative accuracy of radiomic features of low-dose (18)F-FDG PET imaging. Transl. Cancer Res. 2020, 9, 4646–4655. [Google Scholar] [CrossRef] [PubMed]
- Tixier, F.; Hatt, M.; Le Rest, C.C.; Le Pogam, A.; Corcos, L.; Visvikis, D. Reproducibility of tumor uptake heterogeneity characterization through textural feature analysis in 18F-FDG PET. J. Nucl. Med. 2012, 53, 693–700. [Google Scholar] [CrossRef]
- Blanc-Durand, P.; Van Der Gucht, A.; Jreige, M.; Nicod-Lalonde, M.; Silva-Monteiro, M.; Prior, J.O.; Denys, A.; Depeursinge, A.; Schaefer, N. Signature of survival: A (18)F-FDG PET based whole-liver radiomic analysis predicts survival after (90)Y-TARE for hepatocellular carcinoma. Oncotarget 2018, 9, 4549–4558. [Google Scholar] [CrossRef] [PubMed]
- Hatt, M.; Tixier, F.; Pierce, L.; Kinahan, P.E.; Le Rest, C.C.; Visvikis, D. Characterization of PET/CT images using texture analysis: The past, the present… any future? Eur. J. Nucl. Med. Mol. Imaging 2017, 44, 151–165. [Google Scholar] [CrossRef] [PubMed]
- Deleu, A.L.; Sathekge, M.J.; Maes, A.; De Spiegeleer, B.; Sathekge, M.; Van de Wiele, C. Characterization of FDG PET Images Using Texture Analysis in Tumors of the Gastro-Intestinal Tract: A Review. Biomedicines 2020, 8, 304. [Google Scholar] [CrossRef] [PubMed]
- Papp, L.; Rausch, I.; Grahovac, M.; Hacker, M.; Beyer, T. Optimized Feature Extraction for Radiomics Analysis of (18)F-FDG PET Imaging. J. Nucl. Med. 2019, 60, 864–872. [Google Scholar] [CrossRef]
Disclaimer/Publisher’s Note: The statements, opinions and data contained in all publications are solely those of the individual author(s) and contributor(s) and not of MDPI and/or the editor(s). MDPI and/or the editor(s) disclaim responsibility for any injury to people or property resulting from any ideas, methods, instructions or products referred to in the content. |
© 2023 by the authors. Licensee MDPI, Basel, Switzerland. This article is an open access article distributed under the terms and conditions of the Creative Commons Attribution (CC BY) license (https://creativecommons.org/licenses/by/4.0/).