Optically Stimulated Luminescence Sensitivity of Quartz for Provenance Analysis

 , , , and
Abstract
1. Introduction
2. Materials and Methods
3. Results
4. Discussion
Author Contributions
Funding
Acknowledgments
Conflicts of Interest
References
- Meunier, P.; Hovius, N.; Haines, J. Regional patterns of earthquake-triggered landslides and their relation to ground motion. Geophys. Res. Lett. 2007, 34, L20408. [Google Scholar] [CrossRef]
- Chen, H.; Dadson, S.; Chi, Y.-G. Recent rainfall-induced landslides and debris flow in northern Taiwan. Geomorphology 2006, 77, 112–125. [Google Scholar] [CrossRef]
- Stuut, J.-B.; Zabel, M.; Ratmeyer, V.; Helmke, P.; Schefuß, E. Provenance of present-day eolian dust collected off NW Africa. J. Geoph. Res. 2005, 110, D04202. [Google Scholar] [CrossRef]
- Goodbred, S.L., Jr. Response of the Ganges dispersal system to climate change: A source-to-sink view since the last interstade. Sed. Geol. 2003, 162, 83–104. [Google Scholar] [CrossRef]
- Yang, S.Y.; Jung, H.S.; Lim, D.I.; Li, C.X. A review on the provenance discrimination of sediments in the Yellow Sea. Earth Sci. Rev. 2003, 63, 93–120. [Google Scholar] [CrossRef]
- Martin, S.J.; Funch, R.R.; Hanson, P.R.; Yoo, E.-H. A vast 4000-year-old spatial pattern of termite mounds. Curr. Biol. 2018, 28, R1292–R1293. [Google Scholar] [CrossRef]
- Allan James, L. Legacy sediment: Definitions and processes of episodically produced anthropogenic sediment. Anthropocene 2013, 2, 16–26. [Google Scholar] [CrossRef]
- Bond, G.; Broecker, W.; Johnsen, S.; McManus, J.; Labeyrie, L.; Jouzel, J.; Bonani, G. Correlations between climate records from North Atlantic sediments and Greeland ice. Nature 1993, 365, 143–147. [Google Scholar] [CrossRef]
- Concheri, G.; Bertoldi, D.; Polone, E.; Otto, S.; Larcher, R.; Squartini, A. Chemical elemental distribution and soil DNA fingerprints provide the critical evidence in murder case investigation. PLoS ONE 2011. [Google Scholar] [CrossRef]
- Dickinson, W.R. Interpreting provenance relations from detrital modes of sandstones. In Provenance of Arenites; Zuffa, G.G., Ed.; Reidel Publishing: Dordrecht, The Netherlands, 1985; pp. 333–361. [Google Scholar]
- Morton, A. Geochemical studies of detrital heavy minerals and their application to provenance research. In Developments in Sedimentary Provenance Studies; Morton, A.C., Todd, S.P., Haughton, P.D.W., Eds.; Geological Society London, Special Publications: London, UK, 1991; Volume 57, pp. 31–45. [Google Scholar]
- Gray, H.J.; Jain, M.; Sawakuchi, A.O.; Mahan, S.A.; Tucker, G.E. Luminescence as a sediment tracer and provenance tool. Rev. Geophys. 2019. [Google Scholar] [CrossRef]
- Sawakuchi, A.O.; Blair, M.W.; De Witt, R.; Faleiros, F.M.; Hyppolito, T.; Guedes, C.C.F. Thermal history versus sedimentary history: OSL sensitivity of quartz grains extracted from rocks and sediments. Quat. Geochronol. 2011, 6, 261–272. [Google Scholar] [CrossRef]
- Mineli, T.D.; Sawakuchi, A.O.; Guralnik, B.; Lambert, R.; Jain, M.; Pupim, F.N.; del Río, I.; Guedes, C.C.F.; Nogueira, L. Variation of luminescence sensitivity, characteristic dose and trap parameters of quartz. Radiat. Meas. 2020. under review. [Google Scholar]
- Bøtter-Jensen, L.; Thomsen, K.J.; Jain, M. Review of optically stimulated luminescence (OSL) instrumental developments for retrospective dosimetry. Radiat. Meas. 2010, 45, 253–257. [Google Scholar] [CrossRef]
- Richter, D.; Richter, A.; Dornich, K. Lexsyg—A new system for luminescence research. Geochronometria 2013, 40, 220–228. [Google Scholar] [CrossRef]
- Kook, M.; Lapp, T.; Murray, A.S.; Thomsen, K.J.; Jain, M. A luminescence imaging system for the routine measurement of single-grain OSL dose distributions. Radiat. Meas. 2015, 81, 171–177. [Google Scholar] [CrossRef]
- Guralnik, B.; Ankjærgaard, C.; Jain, M.; Murray, A.S.; Müller, A.; Wällea, M.; Lowick, S.E.; Preusser, F.; Rhodes, E.J.; Wu, T.-S.; et al. OSL-thermochronometry using bedrock quartz: A note of caution. Quat. Geochronol. 2015, 25, 37–48. [Google Scholar] [CrossRef]
- Bøtter-Jensen, L.; Agersnap Larsen, N.; Mejdahl, V.; Poolton, N.R.J.; Morris, M.F.; McKeever, S.W.S. Luminescence sensitivity changes in quartz as a result of annealing. Rad. Meas. 1995, 24, 535–541. [Google Scholar] [CrossRef]
- Moska, P.; Murray, A.S. Stability of the quartz fast-component in insensitive samples. Radiat. Meas. 2006, 41, 878–885. [Google Scholar] [CrossRef]
- Tsukamoto, S.; Nagashima, K.; Murray, A.S.; Tada, R. Variations in OSL components from quartz from Japan sea sediments and the possibility of reconstructing provenance. Quat. Int. 2011, 234, 182–189. [Google Scholar] [CrossRef]
- Pietsch, T.J.; Olley, J.M.; Nanson, G.C. Fluvial transport as a natural luminescence sensitiser of quartz. Quat. Geochronol. 2008, 3, 365–376. [Google Scholar] [CrossRef]
- Sawakuchi, A.O.; Jain, M.; Mineli, T.D.; Nogueira, L.; Bertassoli, D.J., Jr.; Häggi, C.; Sawakuchi, H.O.; Pupim, F.N.; Grohmann, C.H.; Chiessi, C.M.; et al. Luminescence of quartz and feldspar fingerprints provenance and correlates with the source area denudation in the Amazon River basin. Earth Planet. Sci. Lett. 2018, 492, 152–162. [Google Scholar] [CrossRef]
- Lü, T.; Sun, J.; Li, S.-H.; Gong, Z.; Xu, L. Vertical variations of luminescence sensitivity of quartz grains from loess/paleosol of Luochuan section in the central Chinese Loess Plateau since the last interglacial. Quat. Geochronol. 2014, 22, 107–115. [Google Scholar] [CrossRef]
- Murray, A.S.; Wintle, A.G. The single aliquot regenerative dose protocol: Potential for improvements in reliability. Radiat. Meas. 2003, 37, 377–381. [Google Scholar] [CrossRef]
- Jain, M.; Murray, A.S.; Bøtter-Jensen, L. Characterization of blue-light stimulated luminescence components in different quartz samples: Implications for dose measurement. Radiat. Meas. 2003, 37, 441–449. [Google Scholar] [CrossRef]
- Zular, A.; Sawakuchi, A.O.; Guedes, C.C.; Giannini, P.C.F. Attaining provenance proxies from OSL and TL sensitivities: Coupling with grain size and heavy minerals data from southern Brazilian coastal sediments. Radiat. Meas. 2015, 81, 39–45. [Google Scholar] [CrossRef]
- Mendes, V.R.; Sawakuchi, A.O.; Chiessi, C.M.; Giannini, P.C.F.; Rehfeld, K.; Mulitza, S. Thermoluminescence and optically stimulated luminescence measured in marine sediments indicate precipitation changes over northeastern Brazil. Paleoceanography 2019, 34, 1476–1486. [Google Scholar] [CrossRef]
- Mulitza, S.; Chiessi, C.M.; Cruz, A.P.S.; Frederichs, T.W.; Gomes, J.G.; Gurgel, M.H.C.; Haberkern, J.; Huang, E.; Jovane, L.; Kuhnert, H.; et al. Response of Amazon Sedimentation to Deforestation, Land Use and Climate Variability—Cruise No. MSM20/3—Recife, Brazil–Bridgetown, Barbados, 19 February–11 March 2012. MARIA S. MERIAN-Berichte, MSM20/3; DFG Senatskommission für Ozeanographie: Bonn, Germany, 2012; p. 86. [Google Scholar] [CrossRef]
- Hansen, V.; Murray, A.S.; Buylaert, J.P.; Yeo, E.Y.; Thomsen, K. A new irradiated quartz for beta source calibration. Radiat. Meas. 2015, 81, 123–127. [Google Scholar] [CrossRef]
- Duller, G.A.T. The Analyst software package for luminescence data: Overview and recent improvements. Anc. TL 2015, 33, 35–42. [Google Scholar]
- Timar, A.; Vandenberghe, D.; Panaiotu, E.C.; Panaiotu, C.G.; Necula, C.; Cosma, C.; van den Haute, P. Optical dating of Romanian loess using fine-grained quartz. Quat. Geochronol. 2010, 5, 143–148. [Google Scholar] [CrossRef]
- Stríkis, N.M.; Cruz, F.W.; Cheng, H.; Karmann, I.; Edwards, R.L.; Vuille, M.; Wang, X.; de Paula, M.S.; Novello, V.F.; Auler, A.S. Abrupt variations in South American monsoon rainfall during the Holocene based on a speleothem record from central-eastern Brazil. Geology 2011, 39, 1075–1078. [Google Scholar] [CrossRef]
- Mulitza, S.; Chiessi, C.M.; Schefuß, E.; Lippold, J.; Wichmann, D.; Antz, B.; Mackensen, A.; Paul, A.; Prange, M.; Rehfeld, K.; et al. Synchronous and proportional deglacial changes in Atlantic meridional overturning and northeast Brazilian precipitation. Paleoceanography 2017, 32, 622–633. [Google Scholar] [CrossRef]
- Wintle, A.G.; Murray, A.S. A review of quartz optically stimulated luminescence characteristics and their relevance in single-aliquot regeneration dating protocols. Radiat. Meas. 2006, 41, 369–391. [Google Scholar] [CrossRef]
- Blair, M.W.; Yukihara, E.G.; McKeever, S.W.S. A system to irradiate and measure luminescence at low temperatures. Radiat. Prot. Dosim. 2006, 119, 454–457. [Google Scholar] [CrossRef] [PubMed]
- Wallinga, J.; Murray, A.S.; Bøtter-Jensen, L. Measurement of the dose in quartz in the presence of feldspar contamination. Radiat. Prot. Dosim. 2002, 101, 367–370. [Google Scholar] [CrossRef] [PubMed]
- Garzanti, E.; Andò, S. Heavy mineral concentration in modern sands: Implications for provenance interpretation. Develop. Sedim. 2007, 58, 517–545. [Google Scholar] [CrossRef]
- Ryan, J.G.; Shervais, J.W.; Li, Y.; Reagan, M.K.; Li, H.Y.; Heaton, D.; Godard, M.; Kirchenbaur, M.; Whattam, S.A.; Pearce, J.A.; et al. Application of a handheld X-ray fluorescence spectrometer for real-time, high density quantitative analysis of drilled igneous rocks and sediments during IODP Expedition 352. Chem. Geol. 2017, 451, 55–66. [Google Scholar] [CrossRef]
- Molfino, B.; McIntyre, A. Precessional forcing of nutricline dynamics in the equatorial Atlantic. Science 1990, 249, 766–769. [Google Scholar] [CrossRef]
- Duplessy, J.C.; Labeyrie, L.; Juillet-Leclerc, A.; Maitre, F.; Duprat, J.; Sarnthein, M. Surface salinity reconstruction of the North Atlantic Ocean during the last glacial maximum. Oceanol. Acta 1992, 14, 311–324. [Google Scholar]
- Nürnberg, D.; Bijma, J.; Hemleben, C. Assessing the reliability of magnesium in foraminiferal calcite as a proxy for water mass temperatures. Geochim. Cosmochim. Acta 1996, 60, 803–814. [Google Scholar] [CrossRef]
- Mulitza, S.; Dürkoop, A.; Hale, W.; Wefer, G.; Stefan Niebler, H. Planktonic foraminifera as recorders of past surface-water stratification. Geology 1997, 25, 335–338. [Google Scholar] [CrossRef]
- Govin, A.; Holzwarth, U.; Heslop, D.; Ford Keeling, L.; Zabel, M.; Mulitza, S.; Collins, J.A.; Chiessi, C.M. Distribution of major elements in Atlantic surface sediments (36 N–49 S): Imprint of terrigenous input and continental weathering. Geochem. Geophy. Geosy. 2012, 13. [Google Scholar] [CrossRef]


| Code | Grain Size | * OSL Sensitivity | Source Material | Geological Setting |
|---|---|---|---|---|
| IP22B | 180–250 µm | Low | Hydrothermal vein | Paraná Basin (Brazil) |
| BS223 | 180–250 µm | Low | Blue schist | Andes (Chile) |
| L0674 | 180–250 µm | Low | Alluvial sand | Atacama (Chile) |
| L0017 | 180–250 µm | Medium | Fluvial sand | Central Amazon |
| L0698 | 63–180 µm | Medium | Fluvial sand | Western Amazon |
| L0001 | 180–250 µm | High | Coastal sand | Santa Catarina coast |
| L0229 | 180–250 µm | High | Fluvial sand | Pantanal Wetland |
| L0231 | 180–250 µm | High | Fluvial sand | Pantanal Wetland |
| L0688 | 180–250 µm | High | Fluvial sand | Paraná River basin |
| ** Cal. Qz | 180–250 µm | Very high | Eolian sand | Jutland, Denmark |
| Step | Treatment | Observed |
|---|---|---|
| 1 | Illumination with blue LED at 125 °C for 100 s | |
| 2 | Give dose, 50 Gy | |
| 3 | (1) Preheat at 190 °C for 10 s, (2) 50, 100, 150, 200, 300, or 400 °C for 10 s | |
| 4 | Infrared LED stimulation at 60 °C for 300 s | |
| 5 | Blue LED stimulation at 125 °C for 100 s | BOSLF |
| Step | Treatment | Observed |
|---|---|---|
| 1 | Illumination with blue LED at 20 °C for 500 s | |
| 2 | Give dose, 50 Gy | |
| 3 | Pause for 0 s or 16 h | |
| 4 | Blue LED stimulation at 20 °C for 100 s | BOSL20°C |
| 5 | Blue LED stimulation at 125 °C for 100 s | BOSL125°C |
| Step | Treatment | Observed |
|---|---|---|
| 1 | Illumination with blue LED at 125 °C for 100 s | |
| 2 | Give dose, 10 Gy | |
| 3 | Blue LED stimulation at 20 °C for 100 s | BOSL20°C |
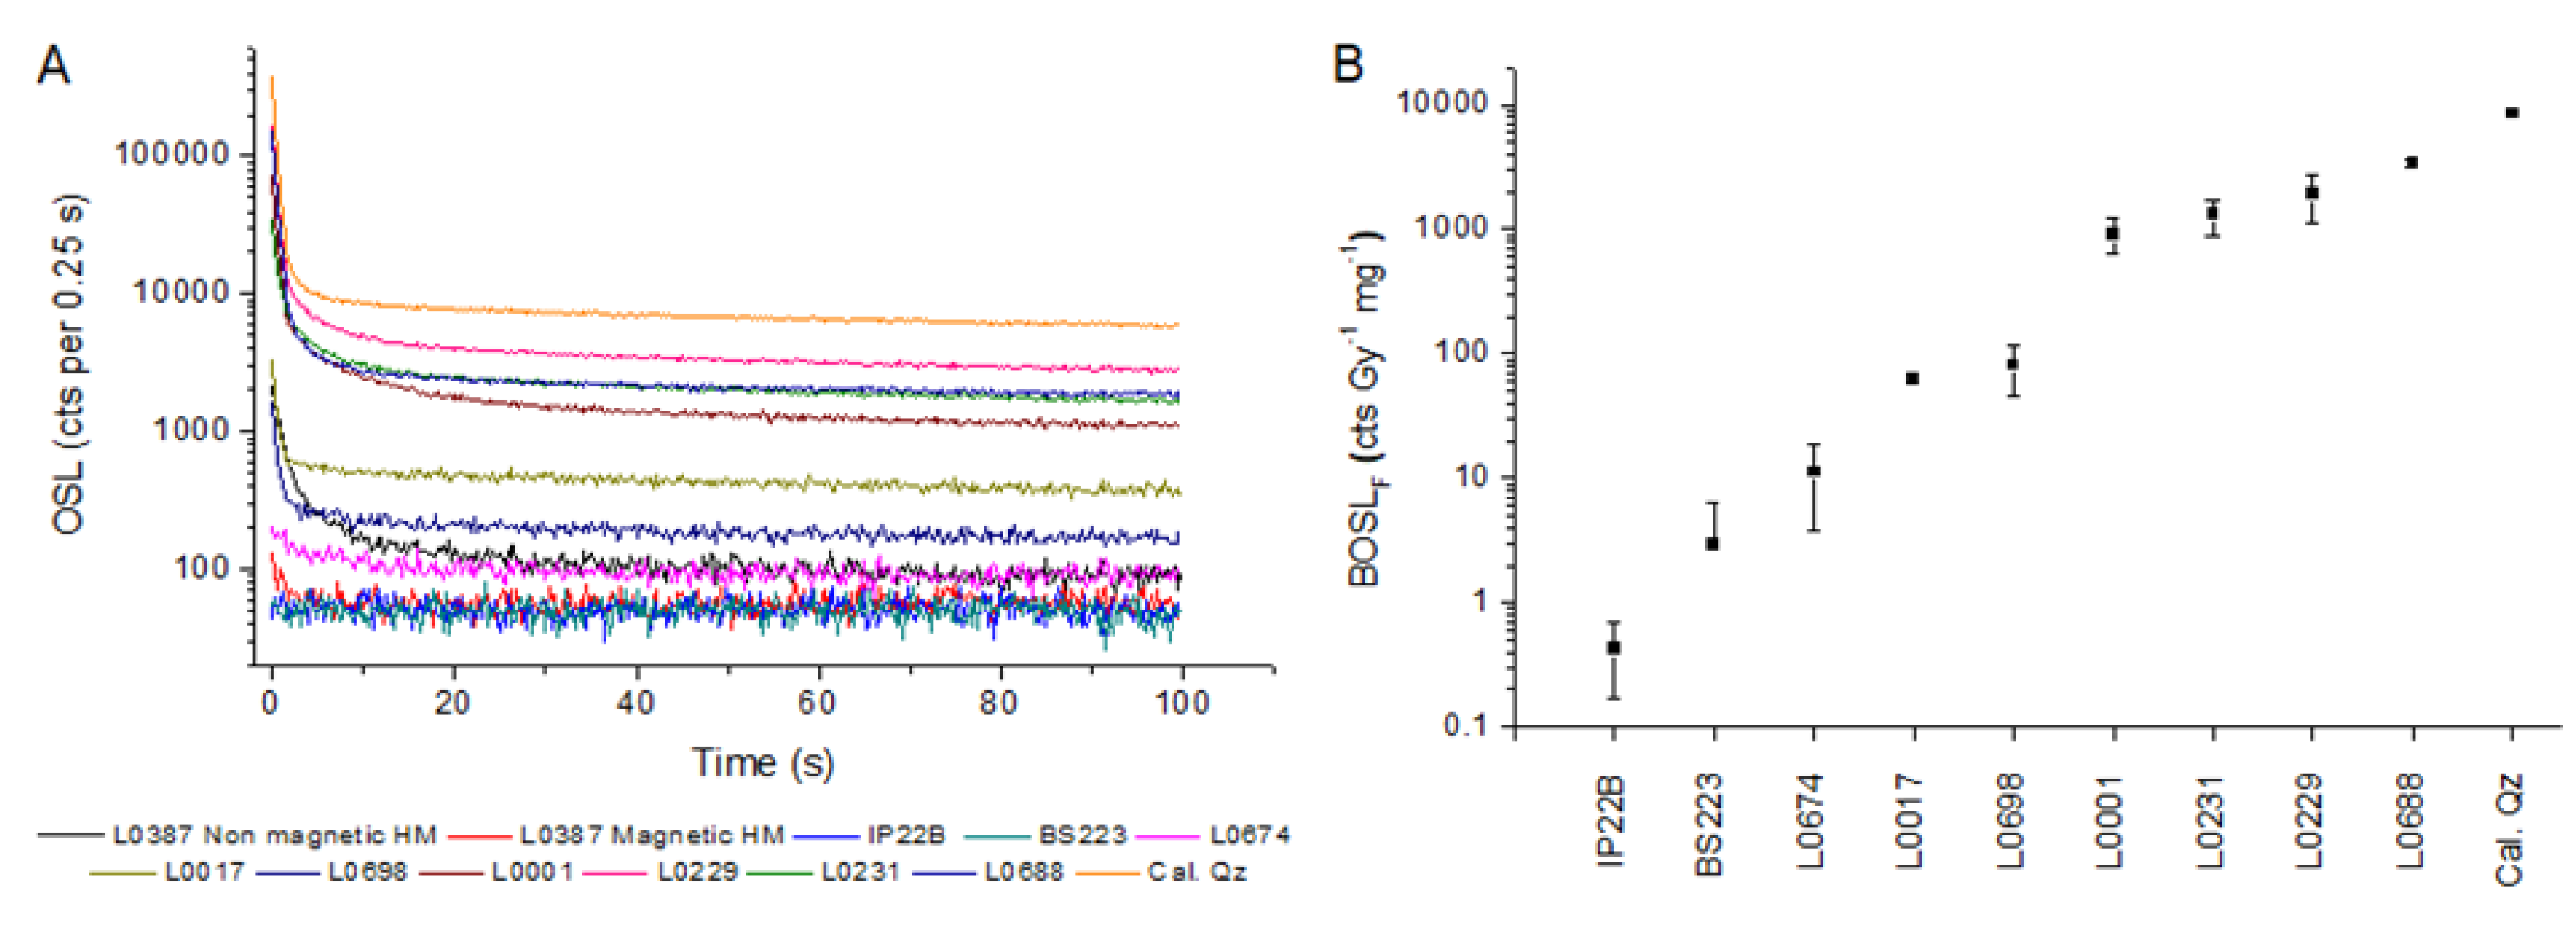
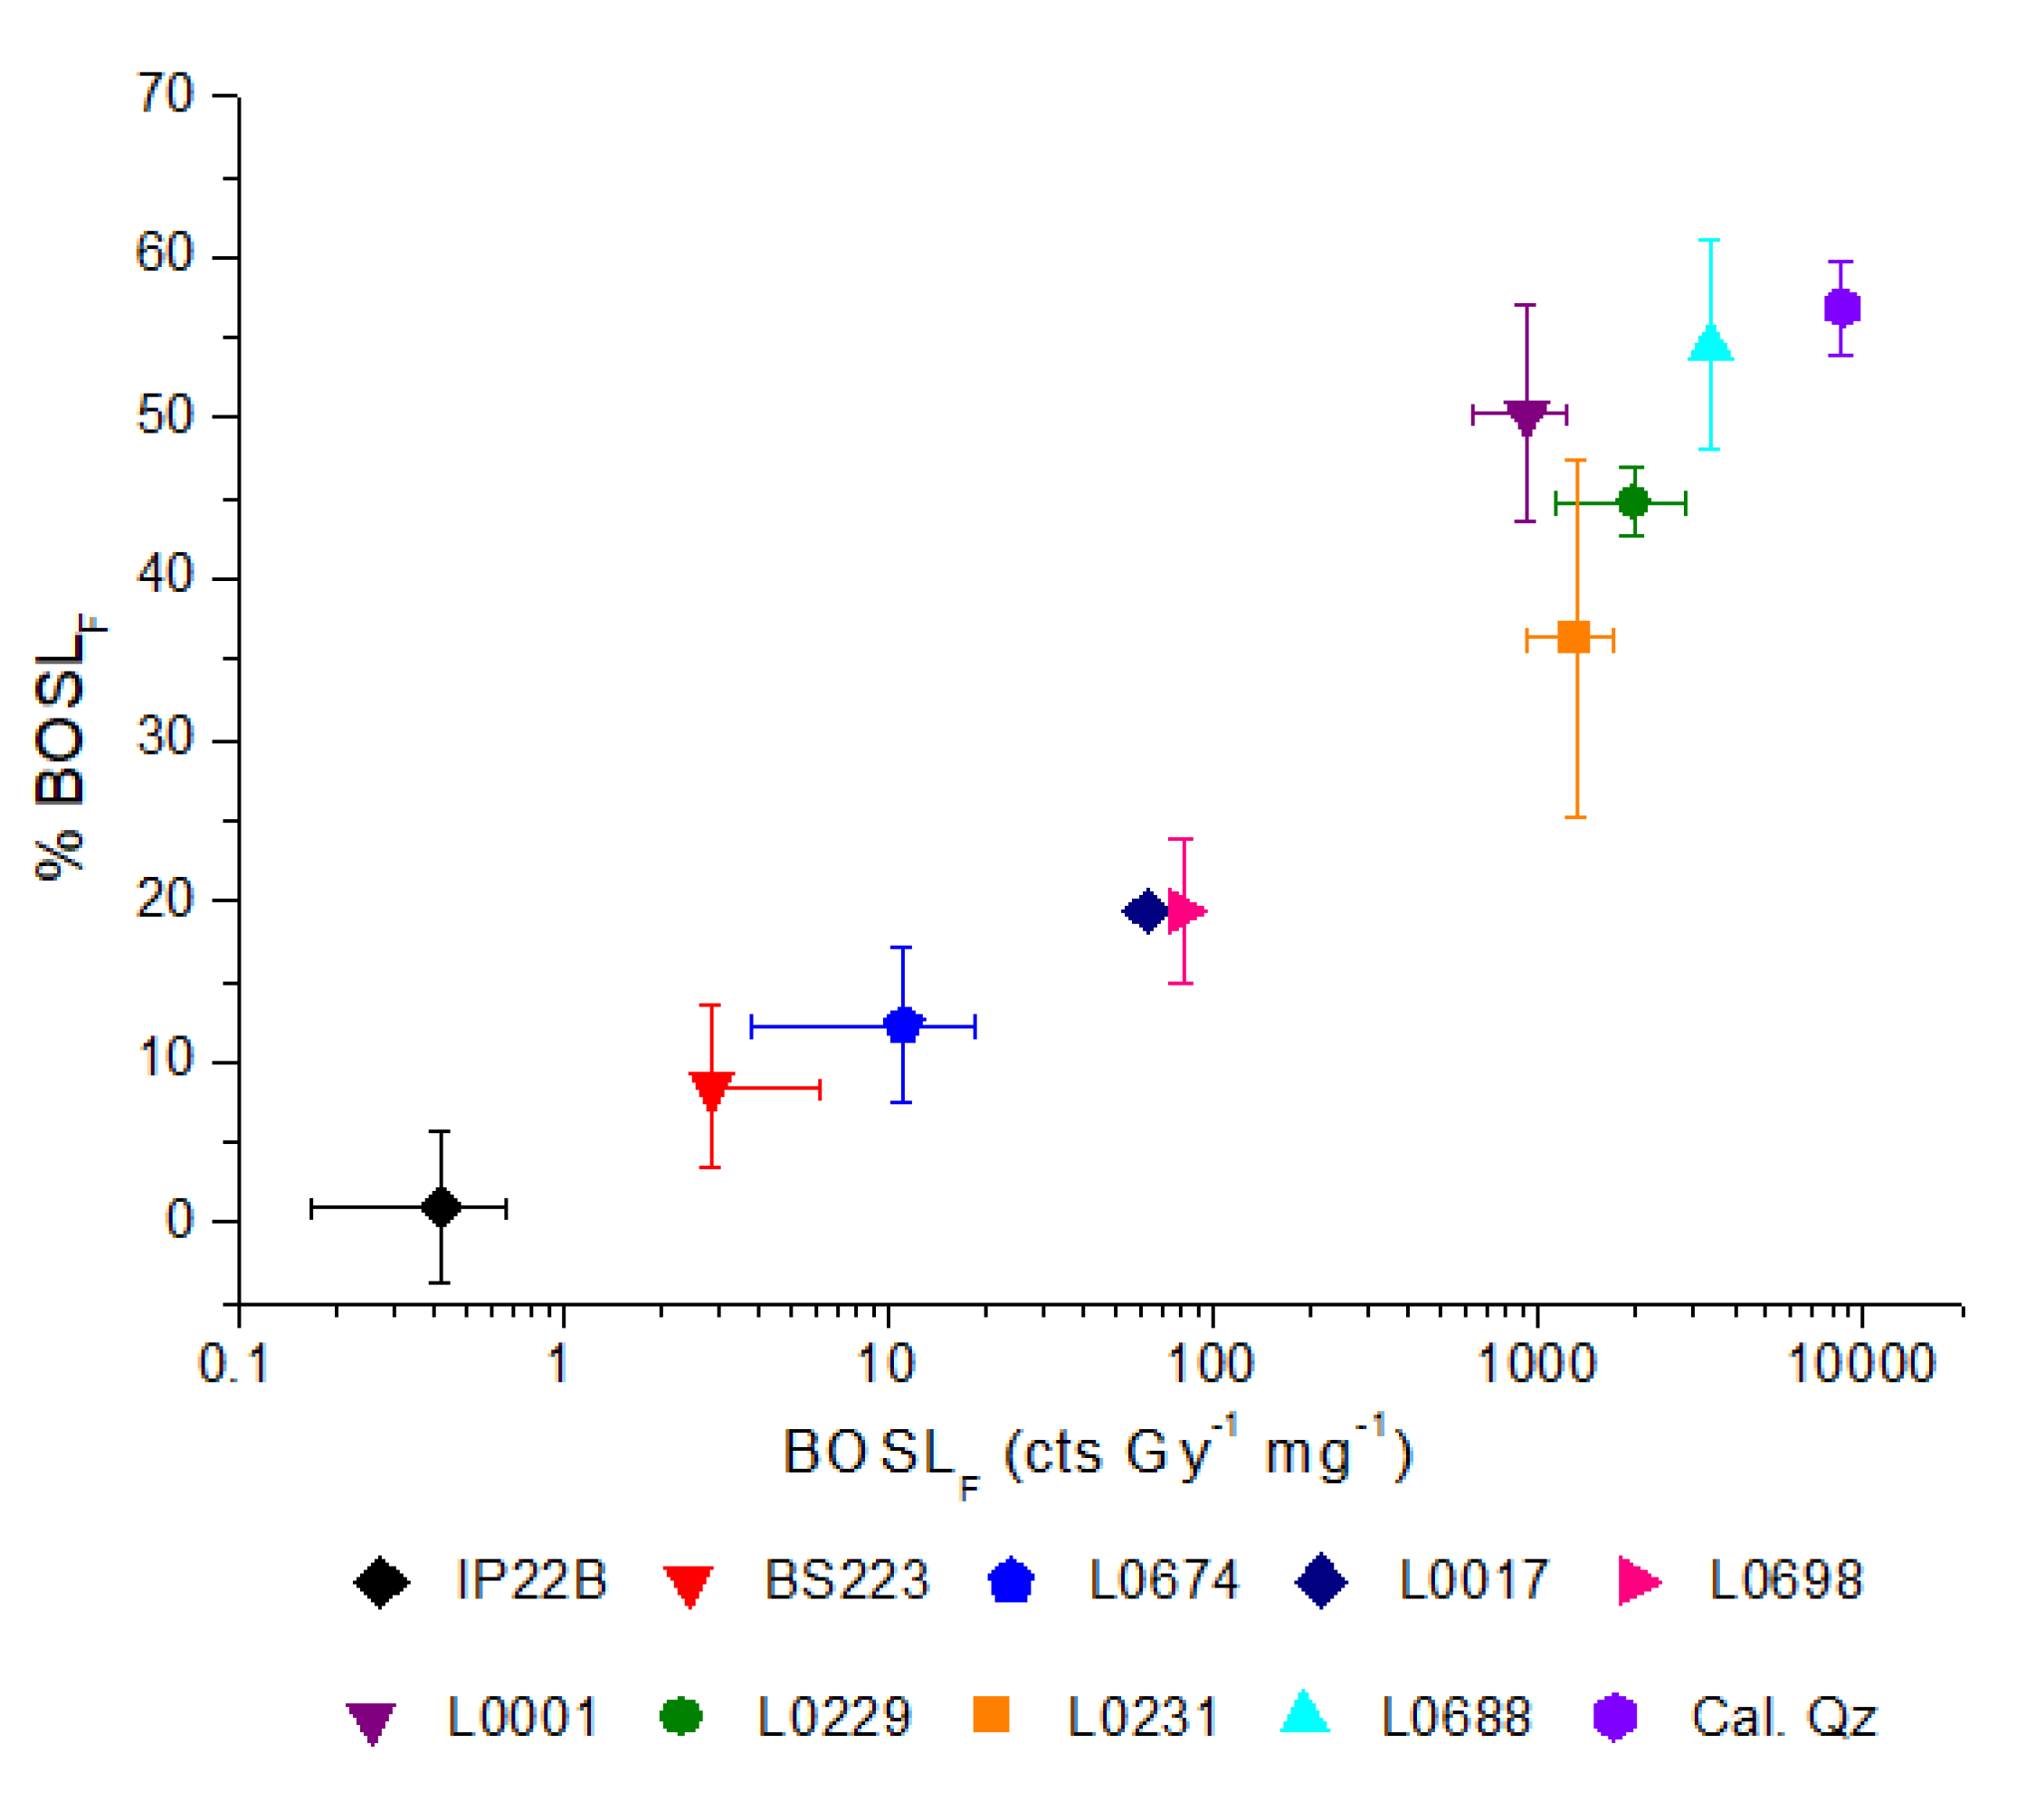
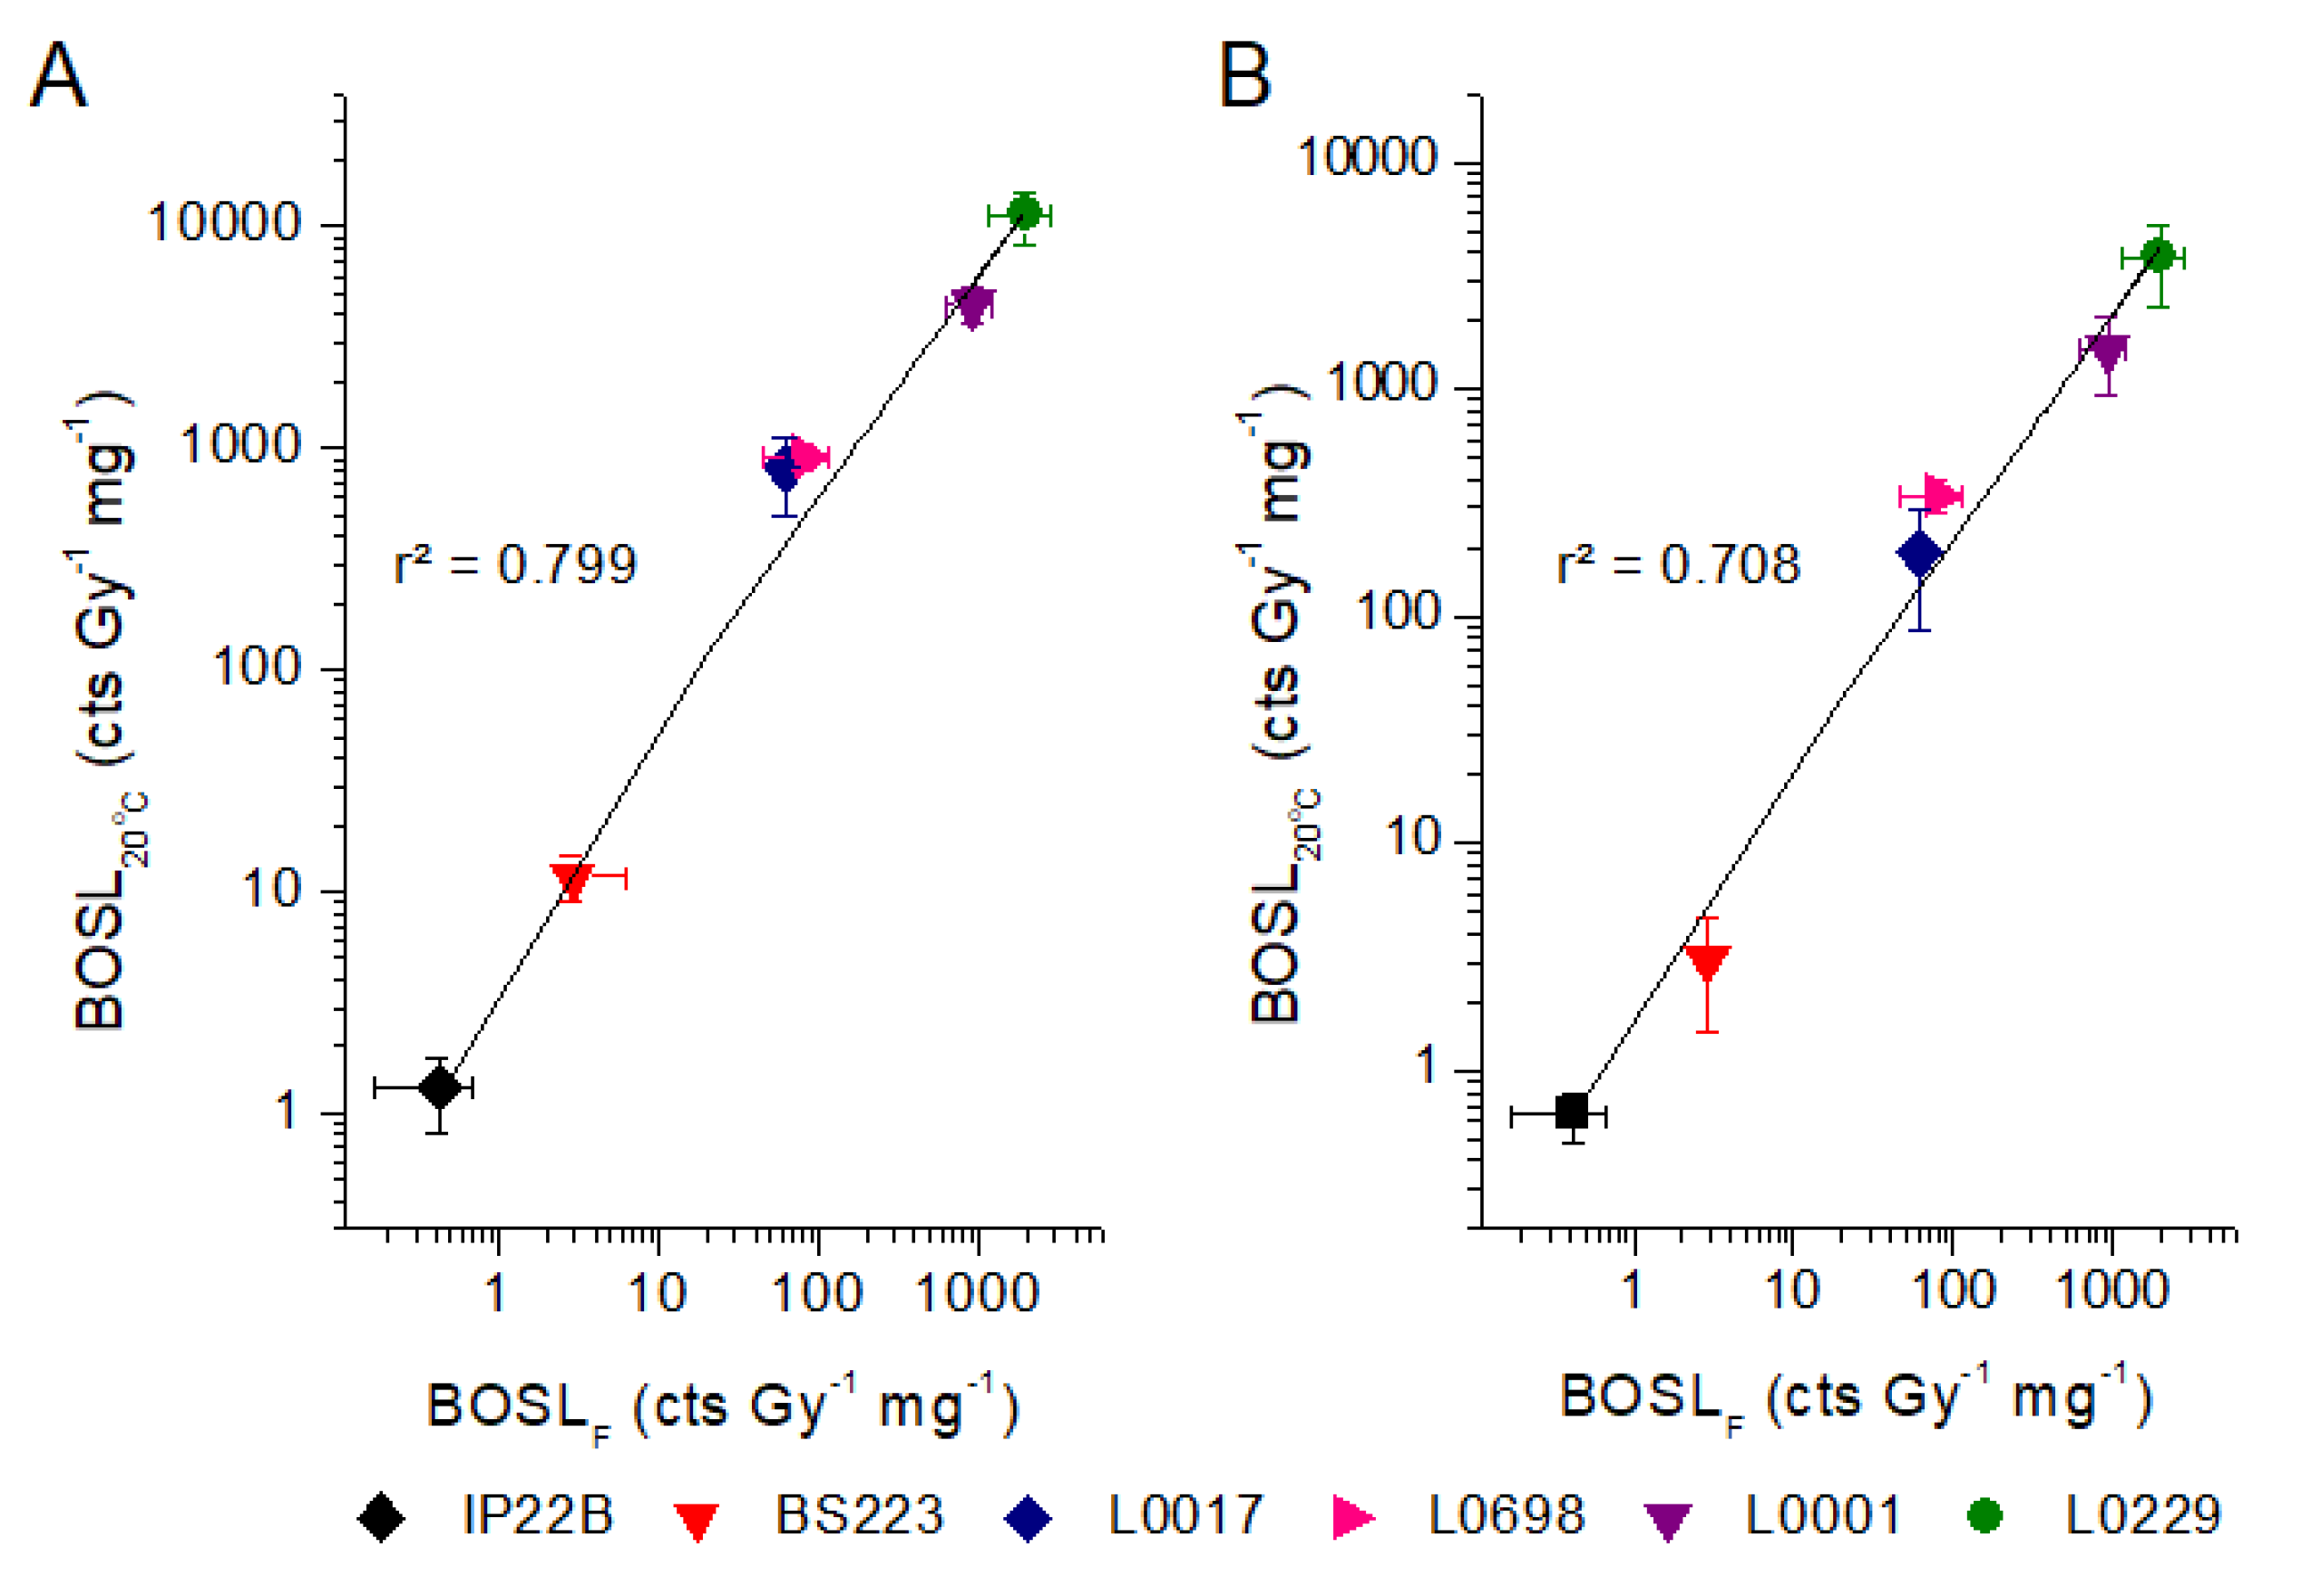
| Sample | %BOSLF | BOSLF | BOSL125°C/0 s | BOSL125°C/16 h | BOSL20°C/0 s | BOSL20°C/16 h |
|---|---|---|---|---|---|---|
| (cts Gy−1 mg−1) | (cts Gy−1 mg−1) | (cts Gy−1 mg−1) | (cts Gy−1 mg−1) | (cts Gy−1 mg−1) | ||
| IP22B | <1.00 ± 4.70 | 0.42 ± 0.25 | <0.10 ± 0.17 | <0.10 ± 0.15 | 1.31 ± 0.49 | 0.64 ± 0.16 |
| BS223 | 8.43 ± 5.03 | 2.89 ± 3.34 | 1.47 ± 0.52 | 0.87 ± 0.32 | 11.74 ± 2.77 | 3.11 ± 1.65 |
| L0674 | 12.33 ± 4.83 | 11.20 ± 7.36 | - | - | - | - |
| L0017 | 19.36 ± 0.17 | 62.60 ± 4.98 | 55.68 ± 11.95 | 46.29 ± 8.60 | 814.58 ± 317.15 | 189.21 ± 101.99 |
| L0698 | 19.40 ± 4.46 | 80.41 ± 35.04 | 52.61 ± 5.84 | 51.81 ± 3.52 | 917.67 ± 113.41 | 341.72 ± 58.18 |
| L0001 | 50.28 ± 6.74 | 925.57 ± 295.55 | 94.91 ± 21.50 | 118.38 ± 25.81 | 4501.14 ± 807.25 | 1468.82 ± 566.53 |
| L0229 | 44.78 ± 2.16 | 1963.84 ± 835.53 | 230.30 ± 43.89 | 254.61 ± 44.12 | 11,376.18 ± 3089.01 | 3794.16 ± 1489.61 |
| L0231 | 36.31 ± 11.03 | 1311.64 ± 401.13 | - | - | - | - |
| L0688 | 54.52 ± 6.48 | 3370.86 ± 205.27 | - | - | - | - |
| CalQz | 56.08 ± 2.94 | 8565.00 ± 497.76 | - | - | - | - |
| L0387NM | 25.75 ± 6.28 | 20.80 ± 6.00 | - | - | - | - |
| L0393M | 57.79 ± 49.30 | 1.19 ± 0.65 | - | - | - | - |
| L0393NM | 33.31 ± 25.88 | 94.77 ± 103.03 | - | - | - | - |
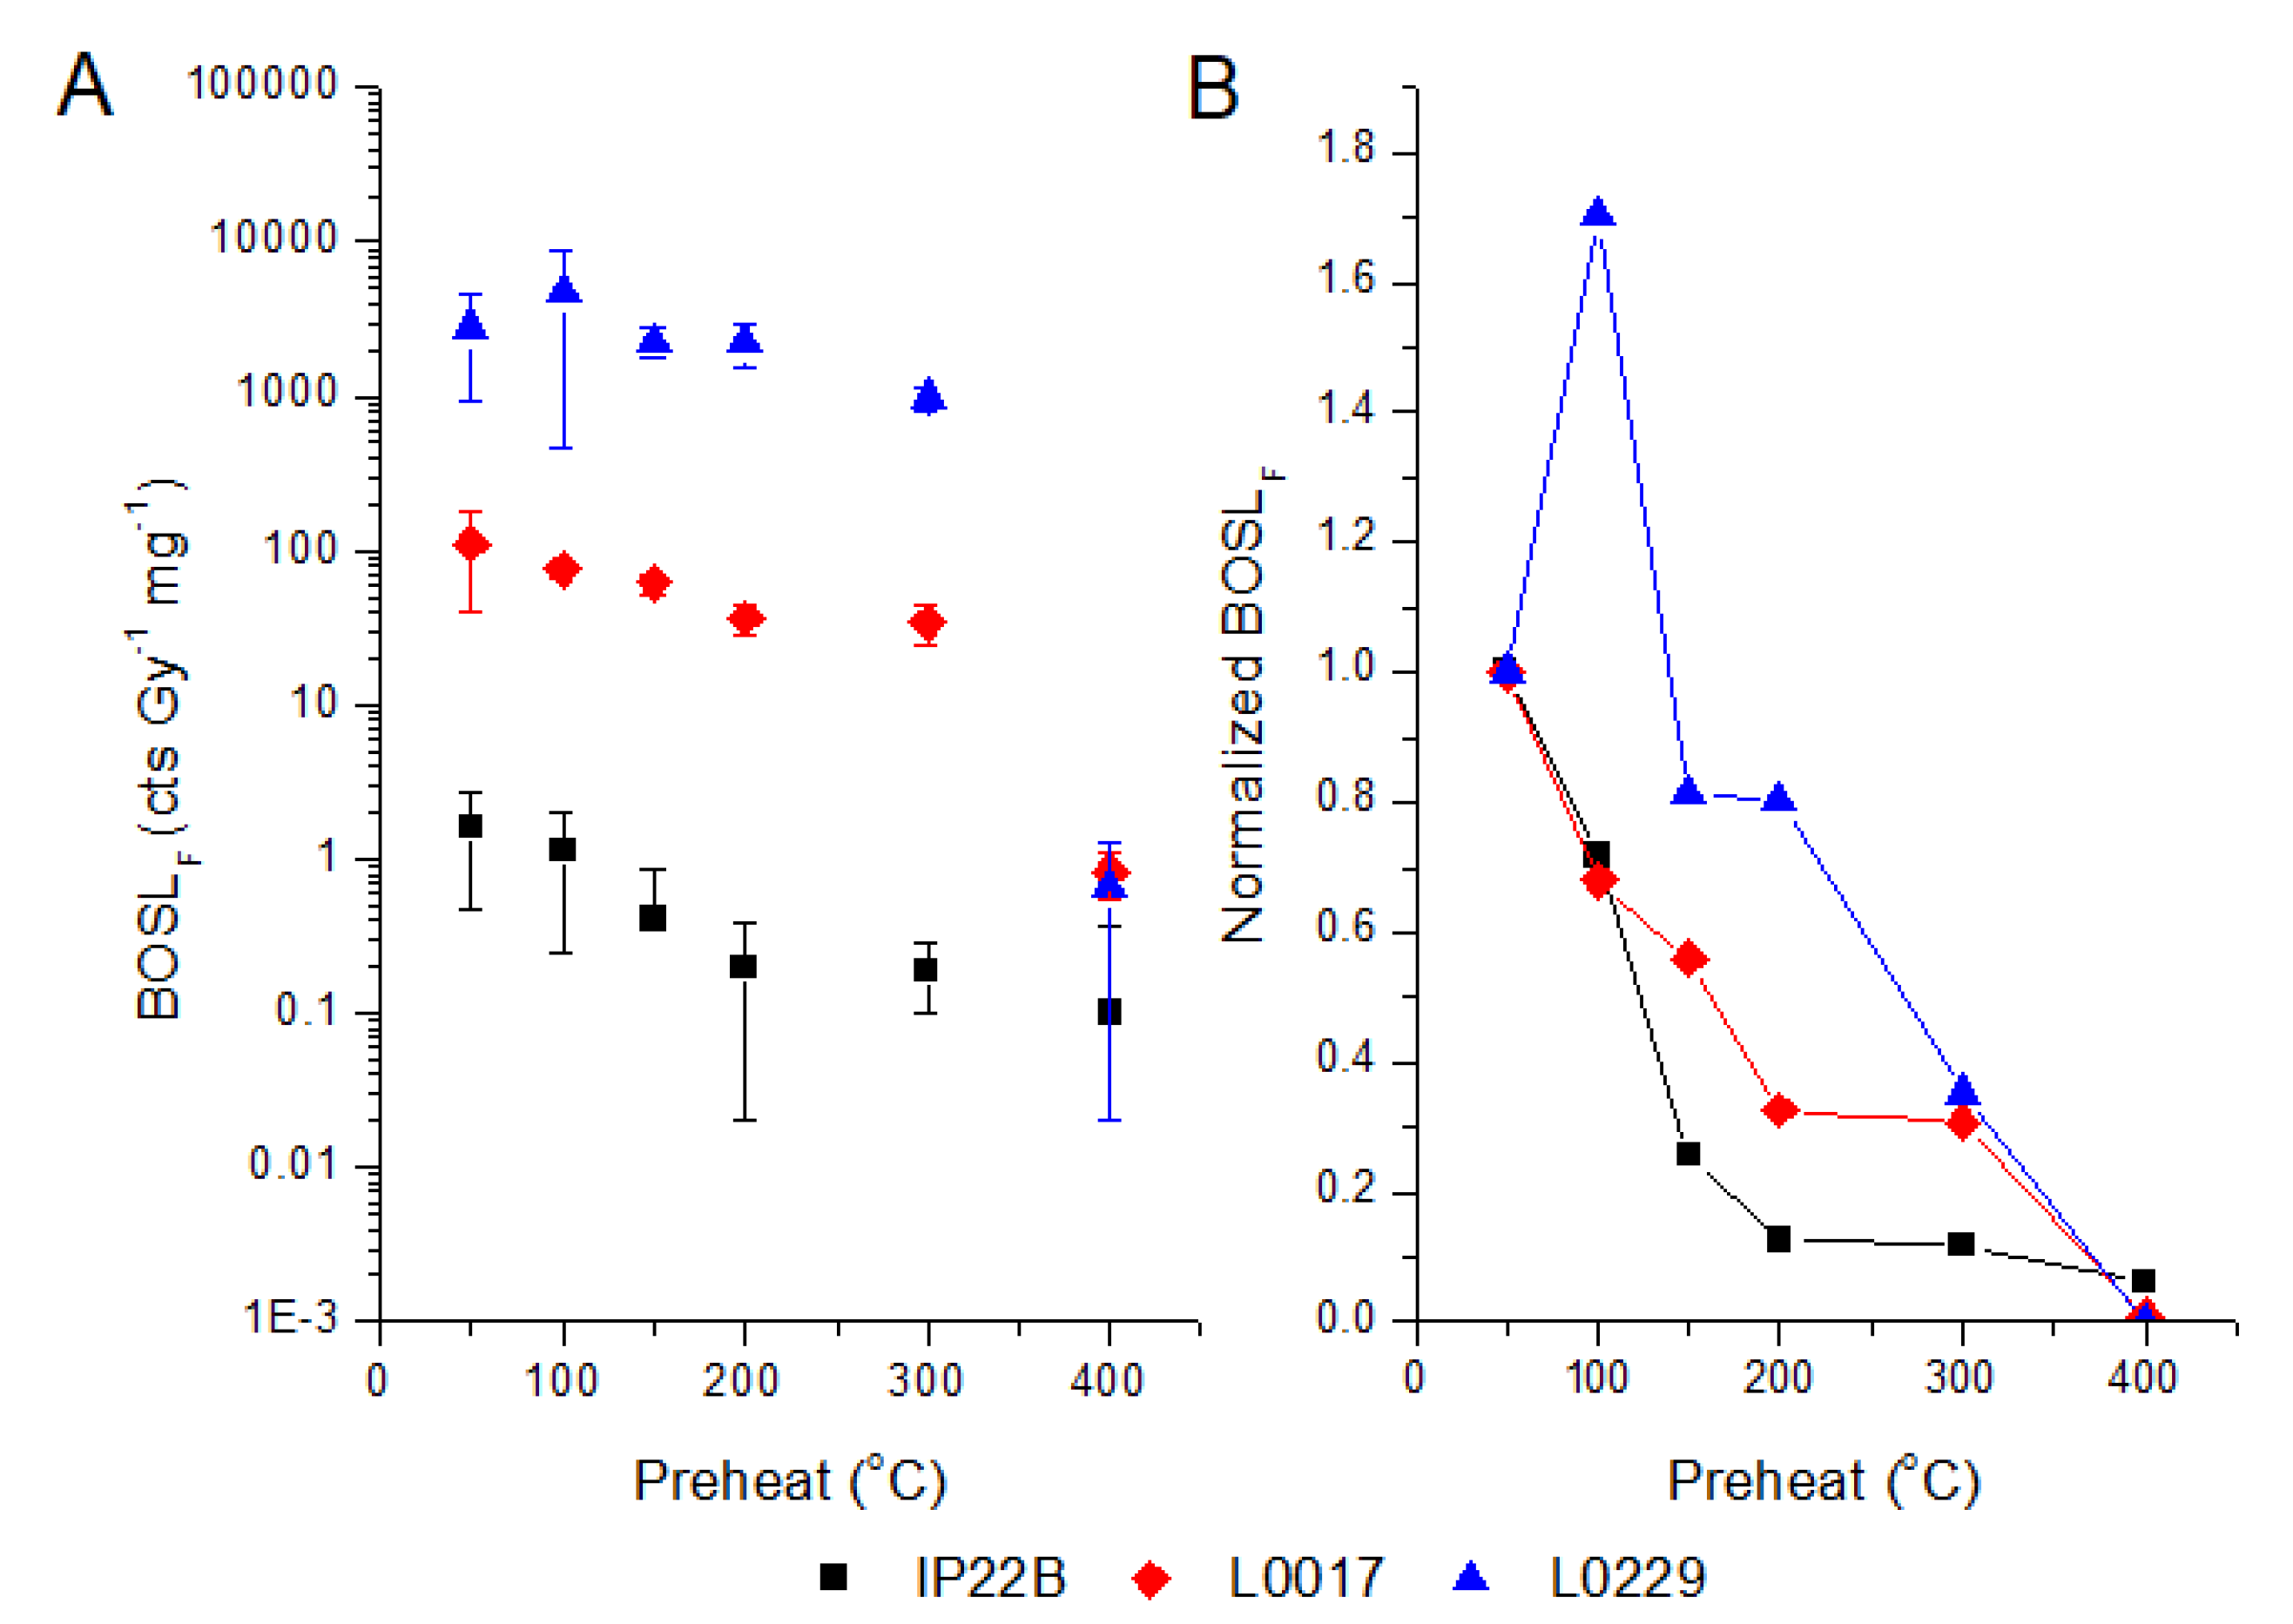
| Preheat | BOSLF Sensitivity (cts Gy−1 mg−1) | ||
|---|---|---|---|
| IP22B | L0017 | L0229 | |
| 50 °C | 1.60 ± 1.12 | 111.24 ± 71.03 | 2773.75 ± 1858.26 |
| 100 °C | 1.15 ± 0.90 | 75.58 ± 10.31 | 4723.34 ± 4264.40 |
| 150 °C | 0.41 ± 0.45 | 62.11 ± 9.11 | 2252.60 ± 512.44 |
| 200 °C | 0.20 ± 0.18 | 36.30 ± 7.98 | 2227.47 ± 694.52 |
| 300 °C | 0.19 ± 0.09 | 34.09 ± 9.75 | 981.85 ± 161.90 |
| 400 °C | <0.10 ± 0.27 | 0.84 ± 028 | 0.66 ± 064 |
| Sample Depth (cm) | %BOSL20°C | BOSL20°C (Normalized) | %BOSLF | BOSLF (Normalized) |
|---|---|---|---|---|
| 96 | 14 ± 2 | −1.01 | 9 ± 1 | −1.78 |
| 150 | 22 ± 9 | −0.66 | 12 ± 1 | −1.34 |
| 260 | 53 ± 5 | 0.75 | 27 ± 2 | 0.99 |
| 280 | 39 ± 5 | 0.13 | 22 ± 1 | 0.31 |
| 310 | 54 ± 7 | 0.79 | 27 ± 1 | 1.04 |
| 400 | 10 ± 2 | −1.20 | 13 ± 2 | −1.11 |
| 430 | 40 ± 5 | 0.16 | 25 ± 3 | 0.72 |
| 460 | 65 ± 2 | 1.31 | 31 ± 8 | 1.68 |
| 490 | 4 ± 1 | −1.48 | 19 ± 2 | −0.17 |
| 550 | 71 ± 1 | 1.58 | 26 ± 1 | 0.83 |
| 610 | 35 ± 5 | −0.08 | 18 ± 2 | −0.40 |
| 630 | 63 ± 3 | 1.20 | 20 ± 1 | −0.05 |
| 700 | 18 ± 3 | −0.85 | 13 ± 1 | −1.05 |
| 720 | 58 ± 9 | 0.97 | 24 ± 2 | 0.60 |
| 750 | 17 ± 4 | −0.88 | 15 ± 2 | −0.82 |
| 790 | 20 ± 1 | −0.75 | 24 ± 2 | 0.54 |
© 2020 by the authors. Licensee MDPI, Basel, Switzerland. This article is an open access article distributed under the terms and conditions of the Creative Commons Attribution (CC BY) license (http://creativecommons.org/licenses/by/4.0/).
Share and Cite
Sawakuchi, A.O.; Rodrigues, F.C.G.; Mineli, T.D.; Mendes, V.R.; Melo, D.B.; Chiessi, C.M.; Giannini, P.C.F. Optically Stimulated Luminescence Sensitivity of Quartz for Provenance Analysis. Methods Protoc. 2020, 3, 6. https://doi.org/10.3390/mps3010006
Sawakuchi AO, Rodrigues FCG, Mineli TD, Mendes VR, Melo DB, Chiessi CM, Giannini PCF. Optically Stimulated Luminescence Sensitivity of Quartz for Provenance Analysis. Methods and Protocols. 2020; 3(1):6. https://doi.org/10.3390/mps3010006
Chicago/Turabian StyleSawakuchi, André Oliveira, Fernanda Costa Gonçalves Rodrigues, Thays Desiree Mineli, Vinícius Ribau Mendes, Dayane Batista Melo, Cristiano Mazur Chiessi, and Paulo César Fonseca Giannini. 2020. "Optically Stimulated Luminescence Sensitivity of Quartz for Provenance Analysis" Methods and Protocols 3, no. 1: 6. https://doi.org/10.3390/mps3010006
APA StyleSawakuchi, A. O., Rodrigues, F. C. G., Mineli, T. D., Mendes, V. R., Melo, D. B., Chiessi, C. M., & Giannini, P. C. F. (2020). Optically Stimulated Luminescence Sensitivity of Quartz for Provenance Analysis. Methods and Protocols, 3(1), 6. https://doi.org/10.3390/mps3010006